Using a Vegetation Model and Stakeholder Input to Assess the Climate Change Vulnerability of Tribally Important Ecosystem Services


1
The Nature Conservancy, Washington Field Office, 74 Wall St., Seattle, WA 98126, USA
2
U.S.D.A. Forest Service, Pacific Northwest Research Station, Corvallis, OR 97331, USA
*
Author to whom correspondence should be addressed.
Forests 2020, 11(6), 618; https://0-doi-org.brum.beds.ac.uk/10.3390/f11060618
Submission received: 24 April 2020
/
Revised: 18 May 2020
/
Accepted: 21 May 2020
/
Published: 1 June 2020
(This article belongs to the Special Issue Assessing, Valuing and Mapping Ecosystem Services)
Abstract
:We demonstrate a generalizable approach for assessing climate change effects on tribally important ecosystem goods and services. Indigenous peoples may be highly vulnerable to the impacts of climate change because they rely on ecosystem goods and services, such as traditional foods, hunting, timber production, nontimber forest resources, and cultural resources. However, there are few assessments that have examined the potential impact of climate change on these goods and services and even less that examine ecological, socio-economic, and cultural resources in the Pacific Northwest, USA. Our approach uses four basic steps: (1) identify 78 tribally important ecosystem services (species and resources), (2) relate those ecosystem services with biologically relevant vegetation projections from a dynamic global vegetation model, (3) identify appropriate timeframes and future climate scenarios, and (4) assess future changes for vegetation types and ecosystem services. We then highlight how model uncertainty can be explored to better inform resilience building and adaptation planning. We found that more than half of the species and resources analyzed may be vulnerable to climate change due to loss of potential habitat, including aridland species and grazing quality. We further highlight our findings for tribally important species, huckleberries (genus Vaccinium) and bitterbrush (Purshia tridentate (Pursh) DC.), and show how this information can be applied to help inform resource management and adaptation planning. We have demonstrated a generalizable approach that identified tribally important ecosystem services and related them with biologically relevant vegetation projections from a Dynamic Global Vegetation Model. Although our assessment is focused in the Pacific Northwest, our approach can be applied in other regions for which model data is available. We recognize that there is some inherent uncertainty associated with using model output for future scenario planning; however, if that uncertainty is addressed and applied as demonstrated by our approach, it then can be explored to help inform resource management and adaptation planning.
1. Introduction
Warming temperatures, changes in precipitation, and increasing carbon dioxide concentrations are already affecting a wide range of natural resources and species [1,2,3,4]. Compounding these effects, climate change will very likely continue to influence the frequency, intensity, size, and locations of disturbances such as wildfire and insect and disease outbreaks [5]. These changes have the potential to transform entire ecosystems (e.g., [6]). For instance, historical area burned across the western US has increased over the last century and is strongly linked with changes in climate [7]. At the species level, changes in the timing of life-cycle events, such as migration, breeding, and hatching [2,8,9] and species distributions have moved in response to climate change [8,10,11]. Climate change has also caused plants to flower earlier in the year [12,13,14,15], a pattern that will likely continue and may decouple critical phenological interactions. Such changes challenge the ability of people to access and use natural resources and species.
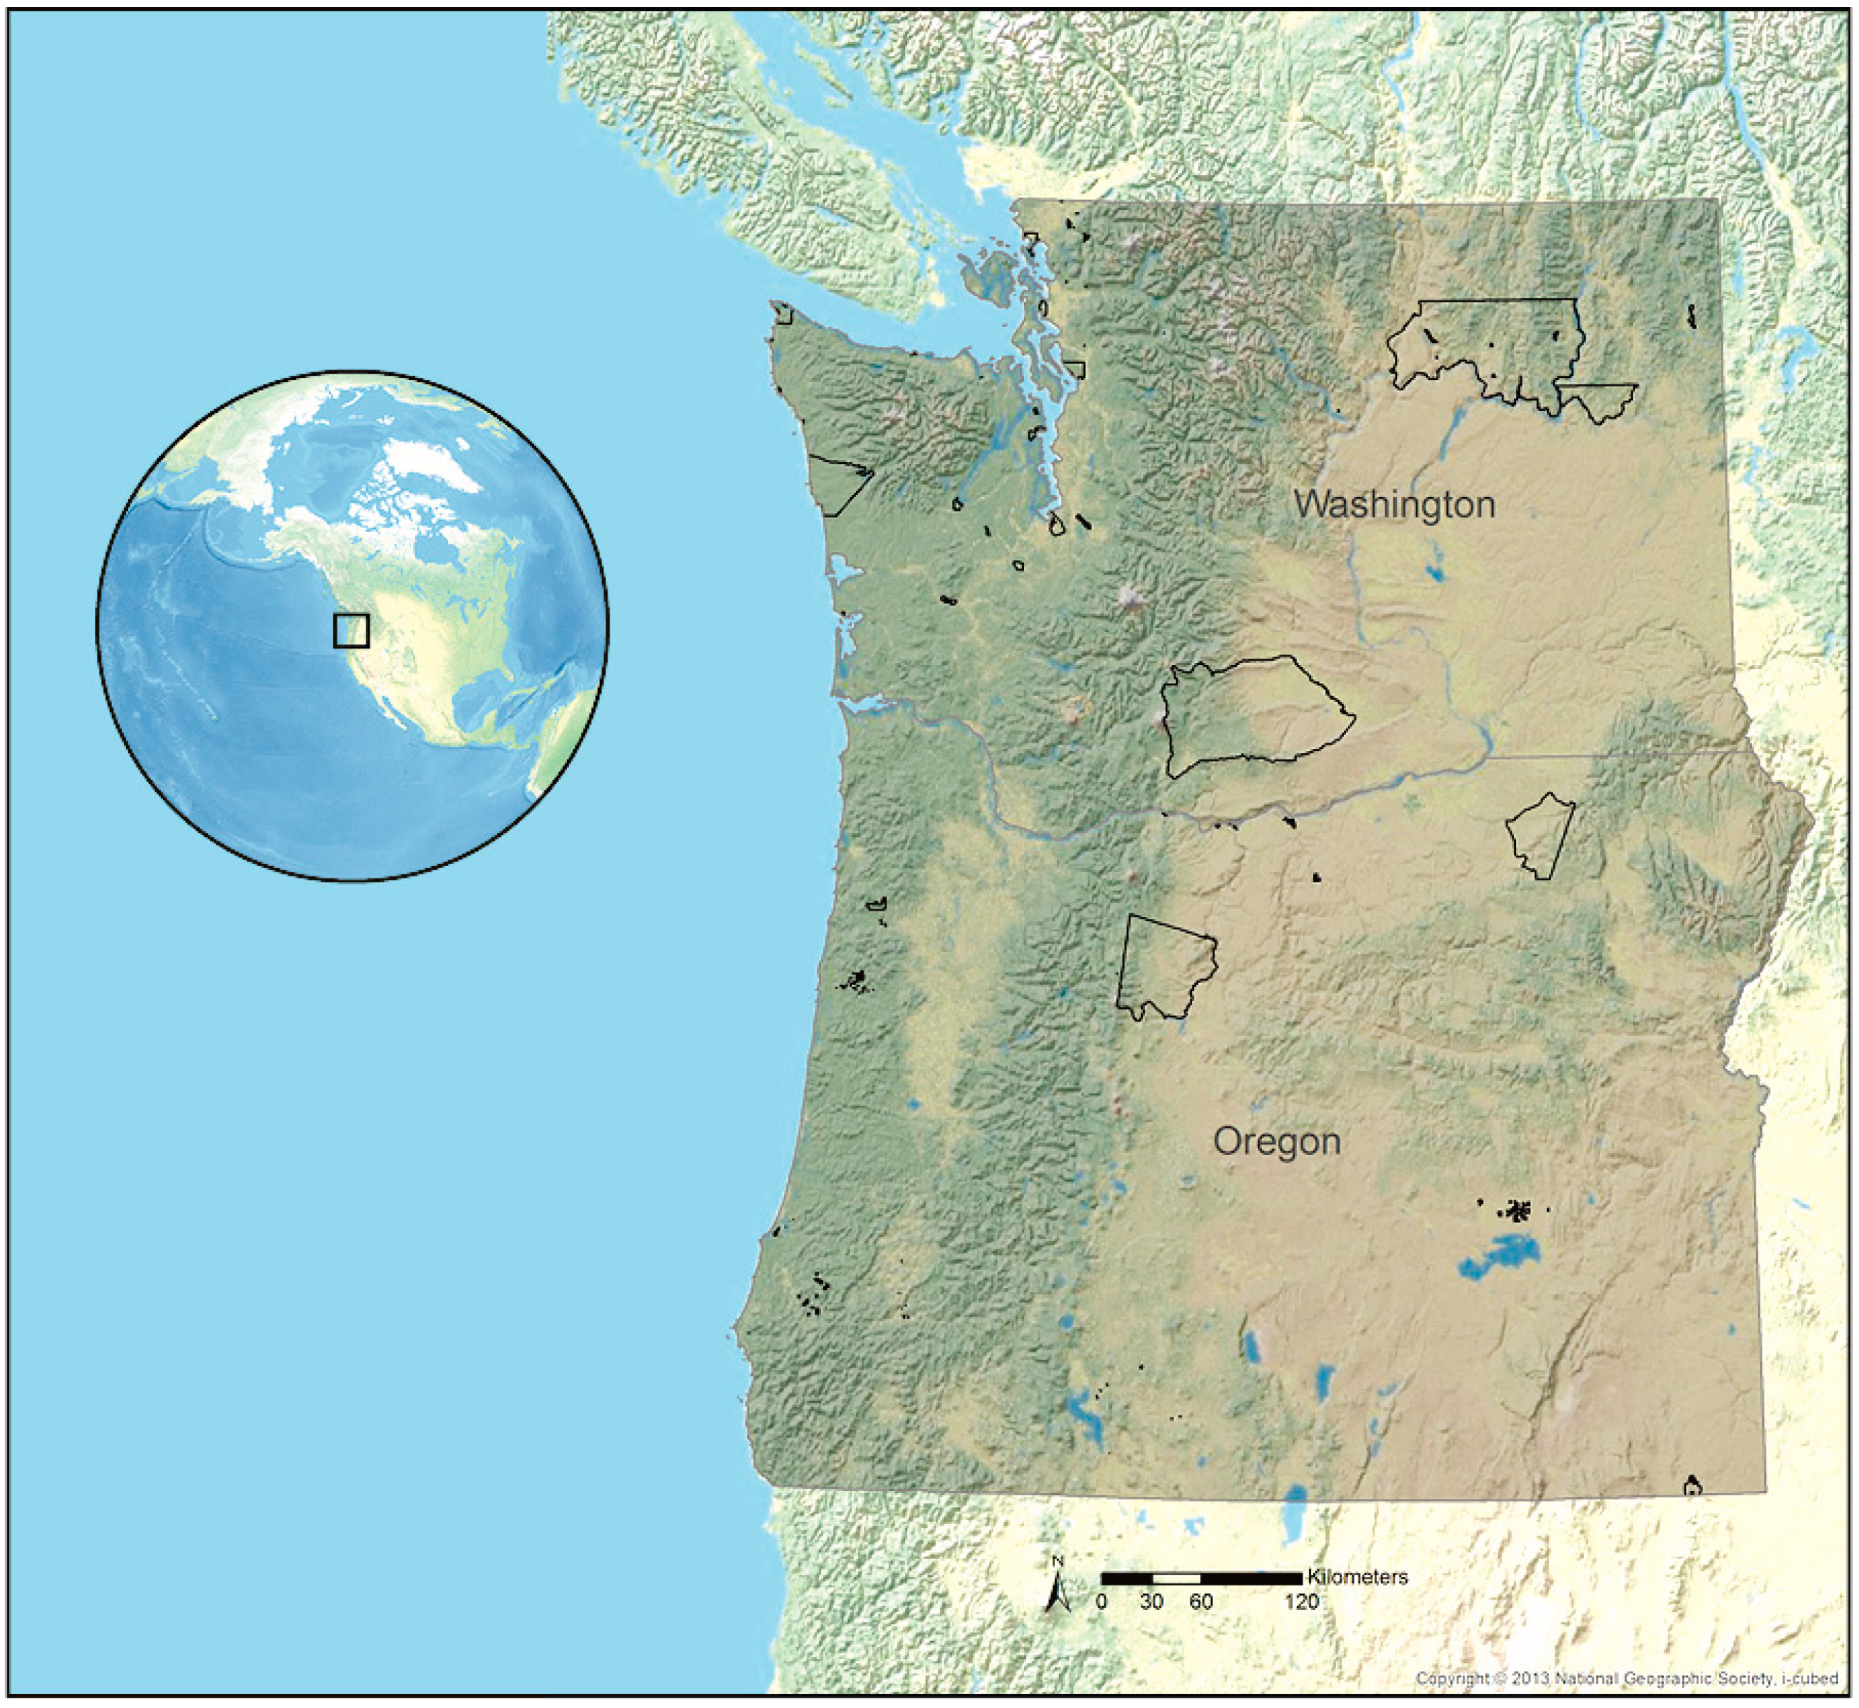
Native Americans, also known as the indigenous peoples of the United States (U.S.), may be highly vulnerable to climate change because they disproportionately depend on place-based natural resources and ecosystem services for a variety of reasons, including food, water, medicine, spiritual needs, and cultural identity [16,17,18]. In the U.S. states of Oregon and Washington, there are 39 federally recognized tribes [19] and their reservations cover over 16,600 km2. The two largest reservations in terms of area are the Confederated Tribes of the Colville Reservation in Washington and the Warm Springs Reservation in Oregon, which cover roughly 5500 km2 and 2300 km2, respectively. As comparison, the largest national park in the Pacific Northwest is Olympic National Park in Washington and covers approximately 3734 km2.
Tribal land ownership is irregularly distributed across the Pacific Northwest and some recognized tribes do not have reservations. Moreover, many Native Americans use lands beyond reservation boundaries that are within treaty rights and ceded areas. Therefore, vast natural areas within the region are used to hunt, gather, and for cultural and spiritual needs. Because of the diversity of the tribes in the Pacific Northwest and their locations, tribes have different perspectives as to which natural resources they value and why. Nevertheless, climate change challenges tribal members access and supply of natural, socio-economical, and culturally important ecosystem goods and services [18,20].
Ecosystem services can be characterized by the four following categories: (1) provisioning or providing food and water, (2) regulating or controlling climate and diseases, (3) supporting nutrient cycles and crop pollination, and (4) cultural or providing spiritual and recreational benefits [21]. However, examples of ecosystem services that are important to tribes (hereafter referred to as tribally important ecosystem services) are diverse and vary by individual, generation, tribe, and geographic location. Therefore, we define tribally important ecosystem services as the species and resources that supply services and are a function of habitat characteristics and our unique decision-making context within this study [22]. Consequently, our categories of ecosystem services differ somewhat from internationally recognized standards [21]. For instance, many Pacific Northwest tribes value understory forest plant species for food and medicine, such as huckleberries (genus Vaccinium) and bitterbrush (Purshia tridentate (Pursh) DC.), both of which may be vulnerable to future warming temperatures and shifting precipitation patterns [23,24]. Another example of tribally important ecosystem services is found in the woodlands dominated by Garry oak (Quercus garryana Douglas ex Hook.) throughout the lowland valleys that span from Oregon to British Columbia, Canada. These oak woodlands are valued for many reasons, but particularly for their acorns—a food resource, their bark—a medicine, and for the woodland habitat for hunting [25]. However, these woodlands are threatened by a combination of land-use conversion and climate change, the latter leading to conifer encroachment and forest expansion, a trend that will likely be exacerbated with additional future warming [26].
Climate change threatens many ecosystem goods and services and a subsequent decline in traditional food and water resources increases the risk of food insecurity and cultural significance [20]. There have been a number of climate change assessments within the Pacific Northwest [27,28,29,30]; however, few have focused solely on tribally important species and resources at a regional scale. Furthermore, many species and resources important to tribes do not have adequate data to assess their future climate vulnerability, thereby making resource management and decision-making difficult. There have been a number of individual tribes that have assessed the vulnerability of key species of concern [23,24,31,32]. However, these assessments have focused on relatively small spatial scales (e.g., a single reservation or ceded lands), and there has been no consistent and generalizable approach across the region.
Here, we demonstrate a generalizable approach for assessing climate change vulnerability of tribal resources and species in the Pacific Northwest, drawing on publicly available data [33]. Our approach uses four basic steps: (1) identify tribally important ecosystem services, (2) relate those ecosystem services with biologically relevant vegetation projections from a Dynamic Global Vegetation Model (DGVM), (3) identify appropriate timeframes and future climate scenarios, and (4) assess future changes for vegetation types and ecosystem services. We then highlight how uncertainty can be explored to inform resilience building and adaptation planning. Applying this approach, we consulted with stakeholders [34], who helped identify important resources and species and provided valuable feedback on our approach and results. To further demonstrate how our assessment process is applied to individual resources, we examine two tribally important plant species—huckleberry and bitterbrush—in detail. Our intent is that the assessment approach described below would stimulate discussion and refinement of assessment methods that inform resource management and adaptation planning.
2. Materials and Methods
2.1. Stakeholder Consultation and Ecosystem Services
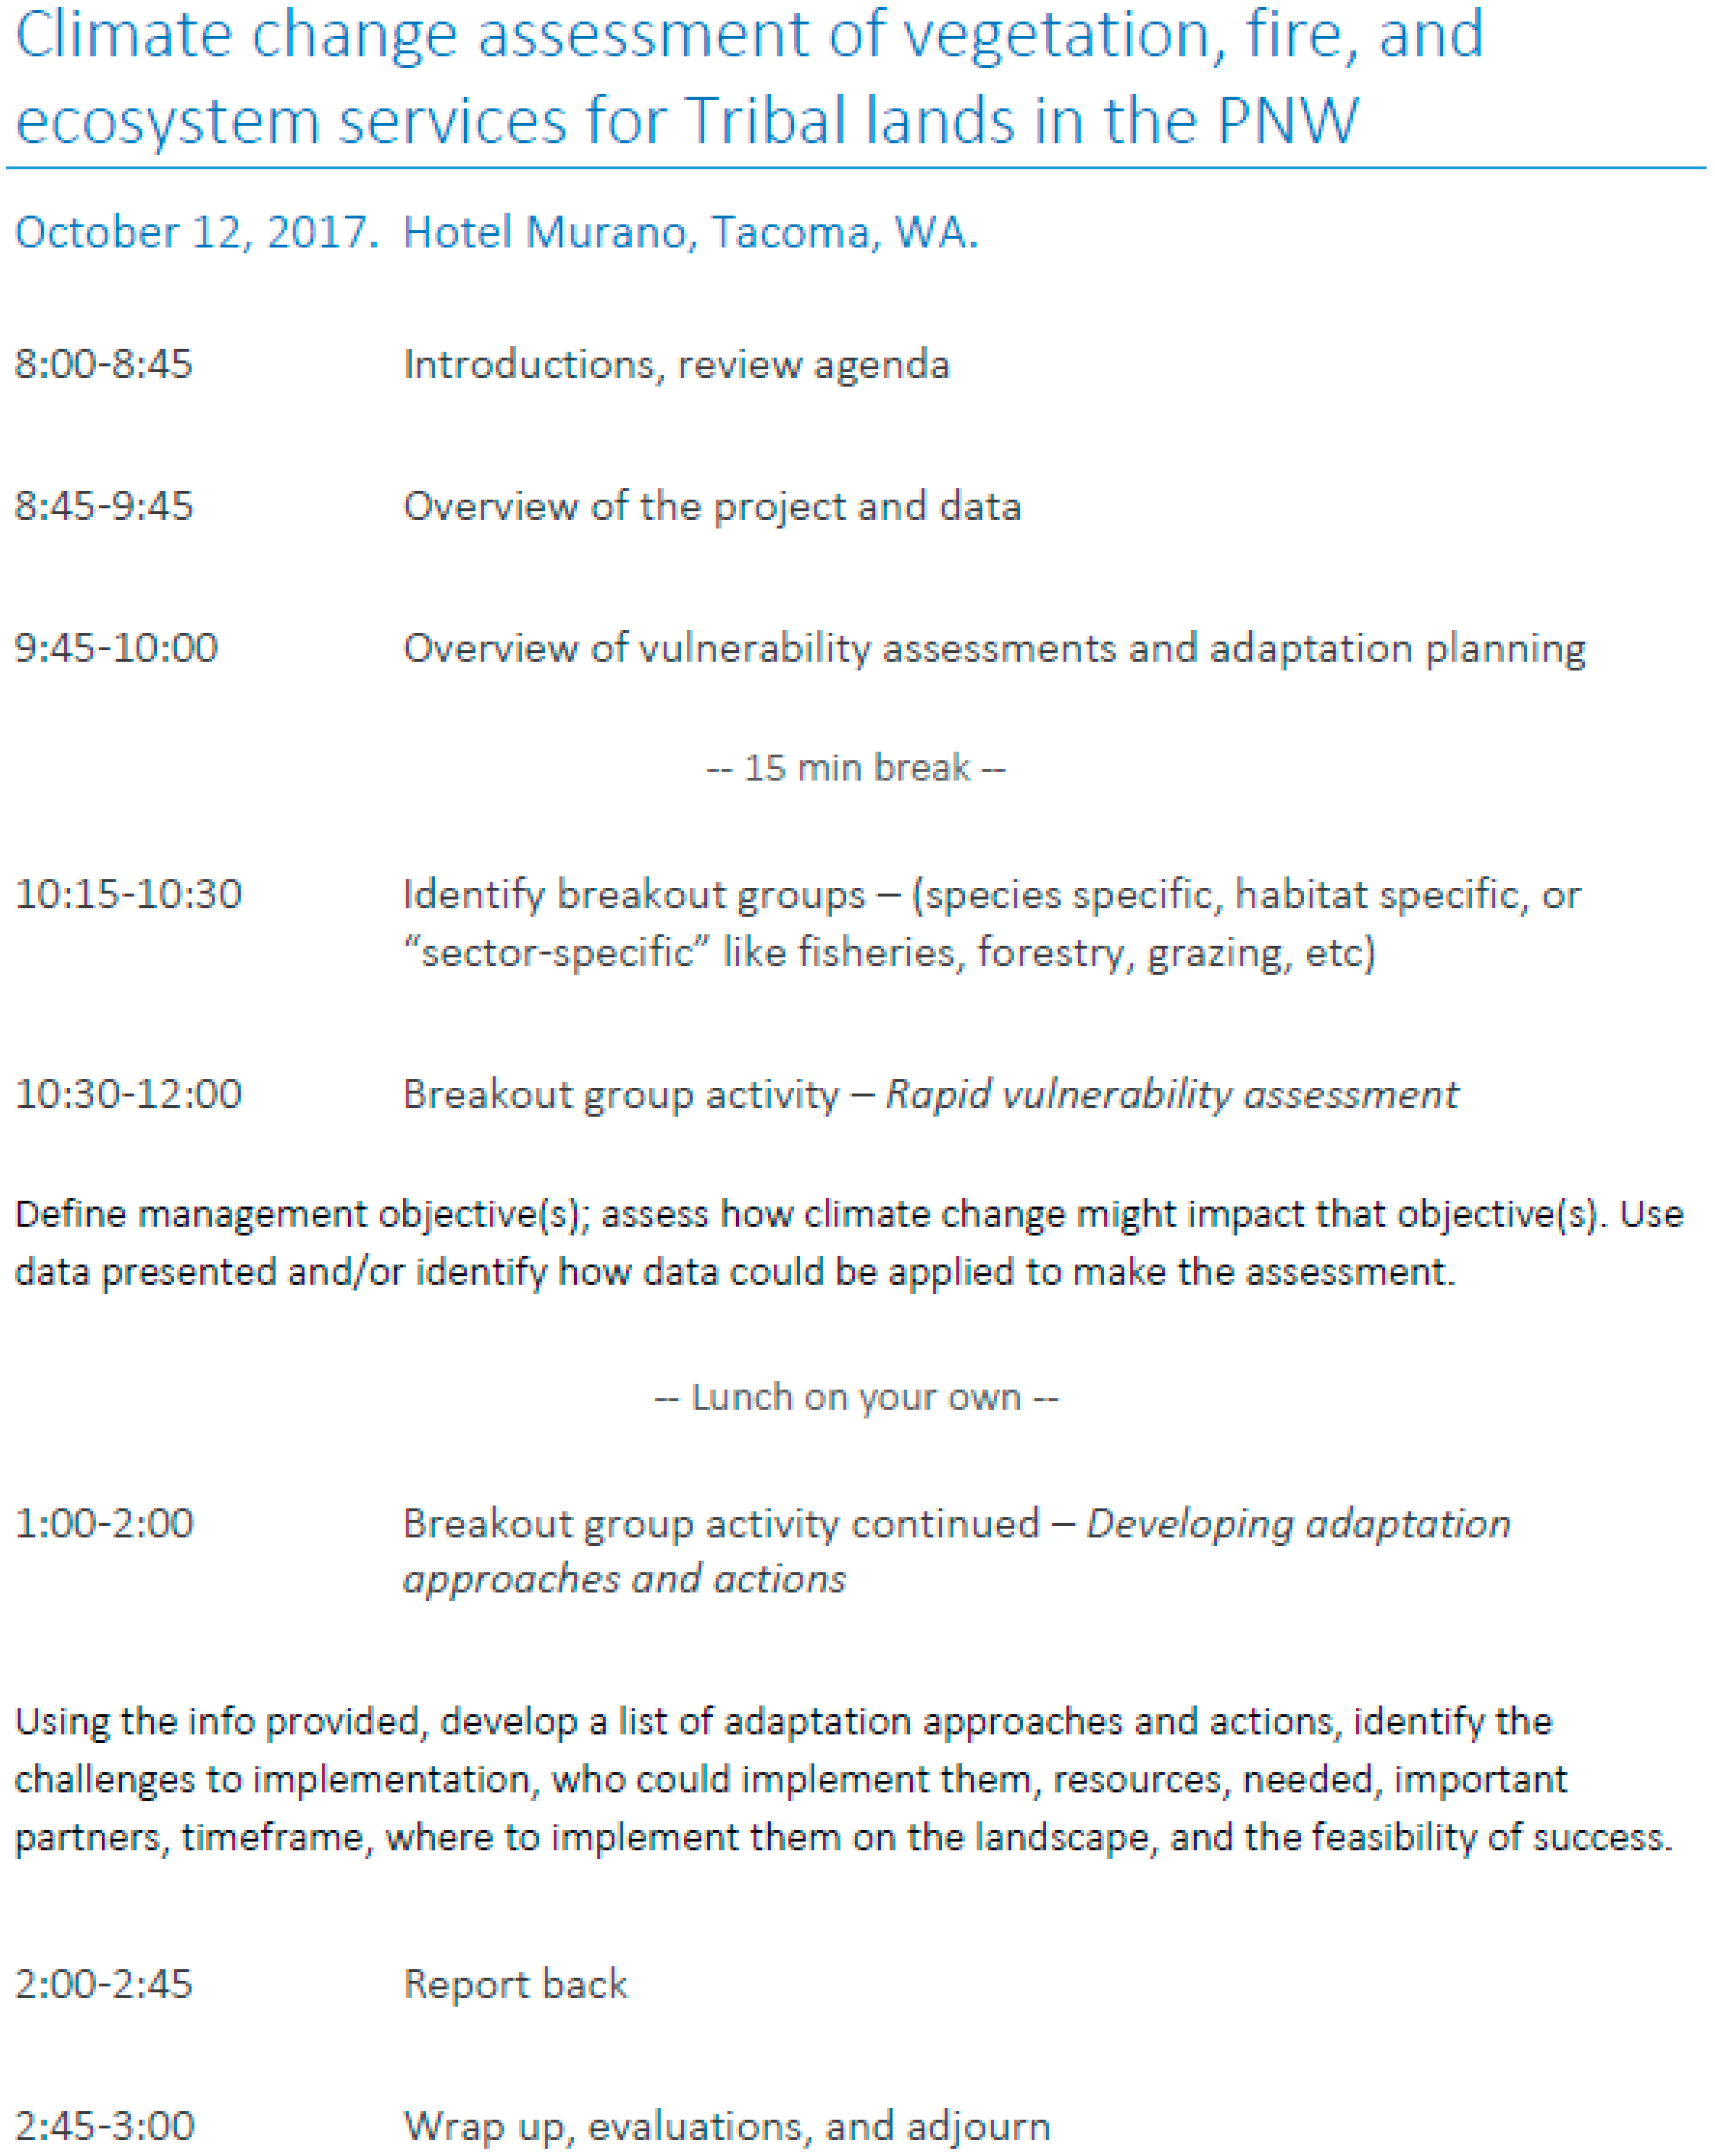
We consulted with 24 tribal stakeholders, including tribal and federal land managers, tribal members, and representatives of tribal organizations, in the Pacific Northwest. Through our process of consultation—in-person meetings, telephone calls, and electronic communications—our stakeholders identified that our analysis should not just focus on tribal reservations, but instead should examine all lands across Oregon and Washington (Figure 1). Their reasoning was two-fold: (1) reservations cover only a very small amount of land that Native Americans actually use, and (2) many Native Americans recognize the larger landscape as being integral to their natural, cultural, and spiritual needs. We identified stakeholders through an iterative workshop process on 12 October 2017, wherein we presented our overall project approach, elucidated ideas and feedback, and identified common interests (see Appendix A). Stakeholder interests and feedback were diverse, partly a reflection of the variety of organizations and tribes that participated. Stakeholders who expressed interest in the project, data, and/or approach were identified and further engaged.
We consulted with our tribal stakeholders and identified 78 resources and species that are valued for providing ecosystem goods or services, or are a good or service themselves, including traditional foods (also referred to as first foods), medicinal plants, and spiritual and cultural purposes (see Appendix A, Table A1). Our stakeholders selected ecosystem-based resources and species that are well known and relatively well-described and that could be related to particular vegetation types. Through an iterative process, our stakeholders divided the 78 resources and species into six groups and categorized their benefits. There were 13 species of plants that fall under the category, “first foods and medicinal plants”, 12 tree species within the category “timber production & culturally significant trees”, and 3 plant species within the “aridland plants” category. For animals, there were 25 species within the “mammals and amphibian” category and 23 species within the “birds” category. We also included a group referred to as “grazing quality”, representing grasslands, which provide important food resources for a number of ungulate species. Many of the identified species and resources have been previously recognized as being important to regional tribes [25,35], and our consultation process verified that they are currently relevant for tribes in the Pacific Northwest.
We also consulted with our stakeholders to determine that midcentury (2035–2064) and end of the century (2079–2099) were appropriate timeframes for consideration given our use of a simulation model and long-term vegetation change. Future climate and carbon dioxide projections encompass a broad range of possible future conditions due to different emission scenarios and differences among the general circulation models (GCMs) used to simulate future climates [36,37]. The downscaled climate dataset that we used, NEX-DCP30, originally includes over 30 GCMs and in response to initial discussions with some of our stakeholders, we selected a subset of four GCMs (detailed below). These four GCMs represent the future range of annual mean temperature and precipitation climate space represented by the full ensemble of GCMs. The selected GCMs serve as potential scenarios for exploring the range of vegetation responses for adaptation planning purposes. We then assessed how future changes may affect vegetation types and ecosystem services and demonstrate our assessment approach by examining two key, but very different plant species: huckleberries and bitterbrush.
2.2. Climate Change Projections
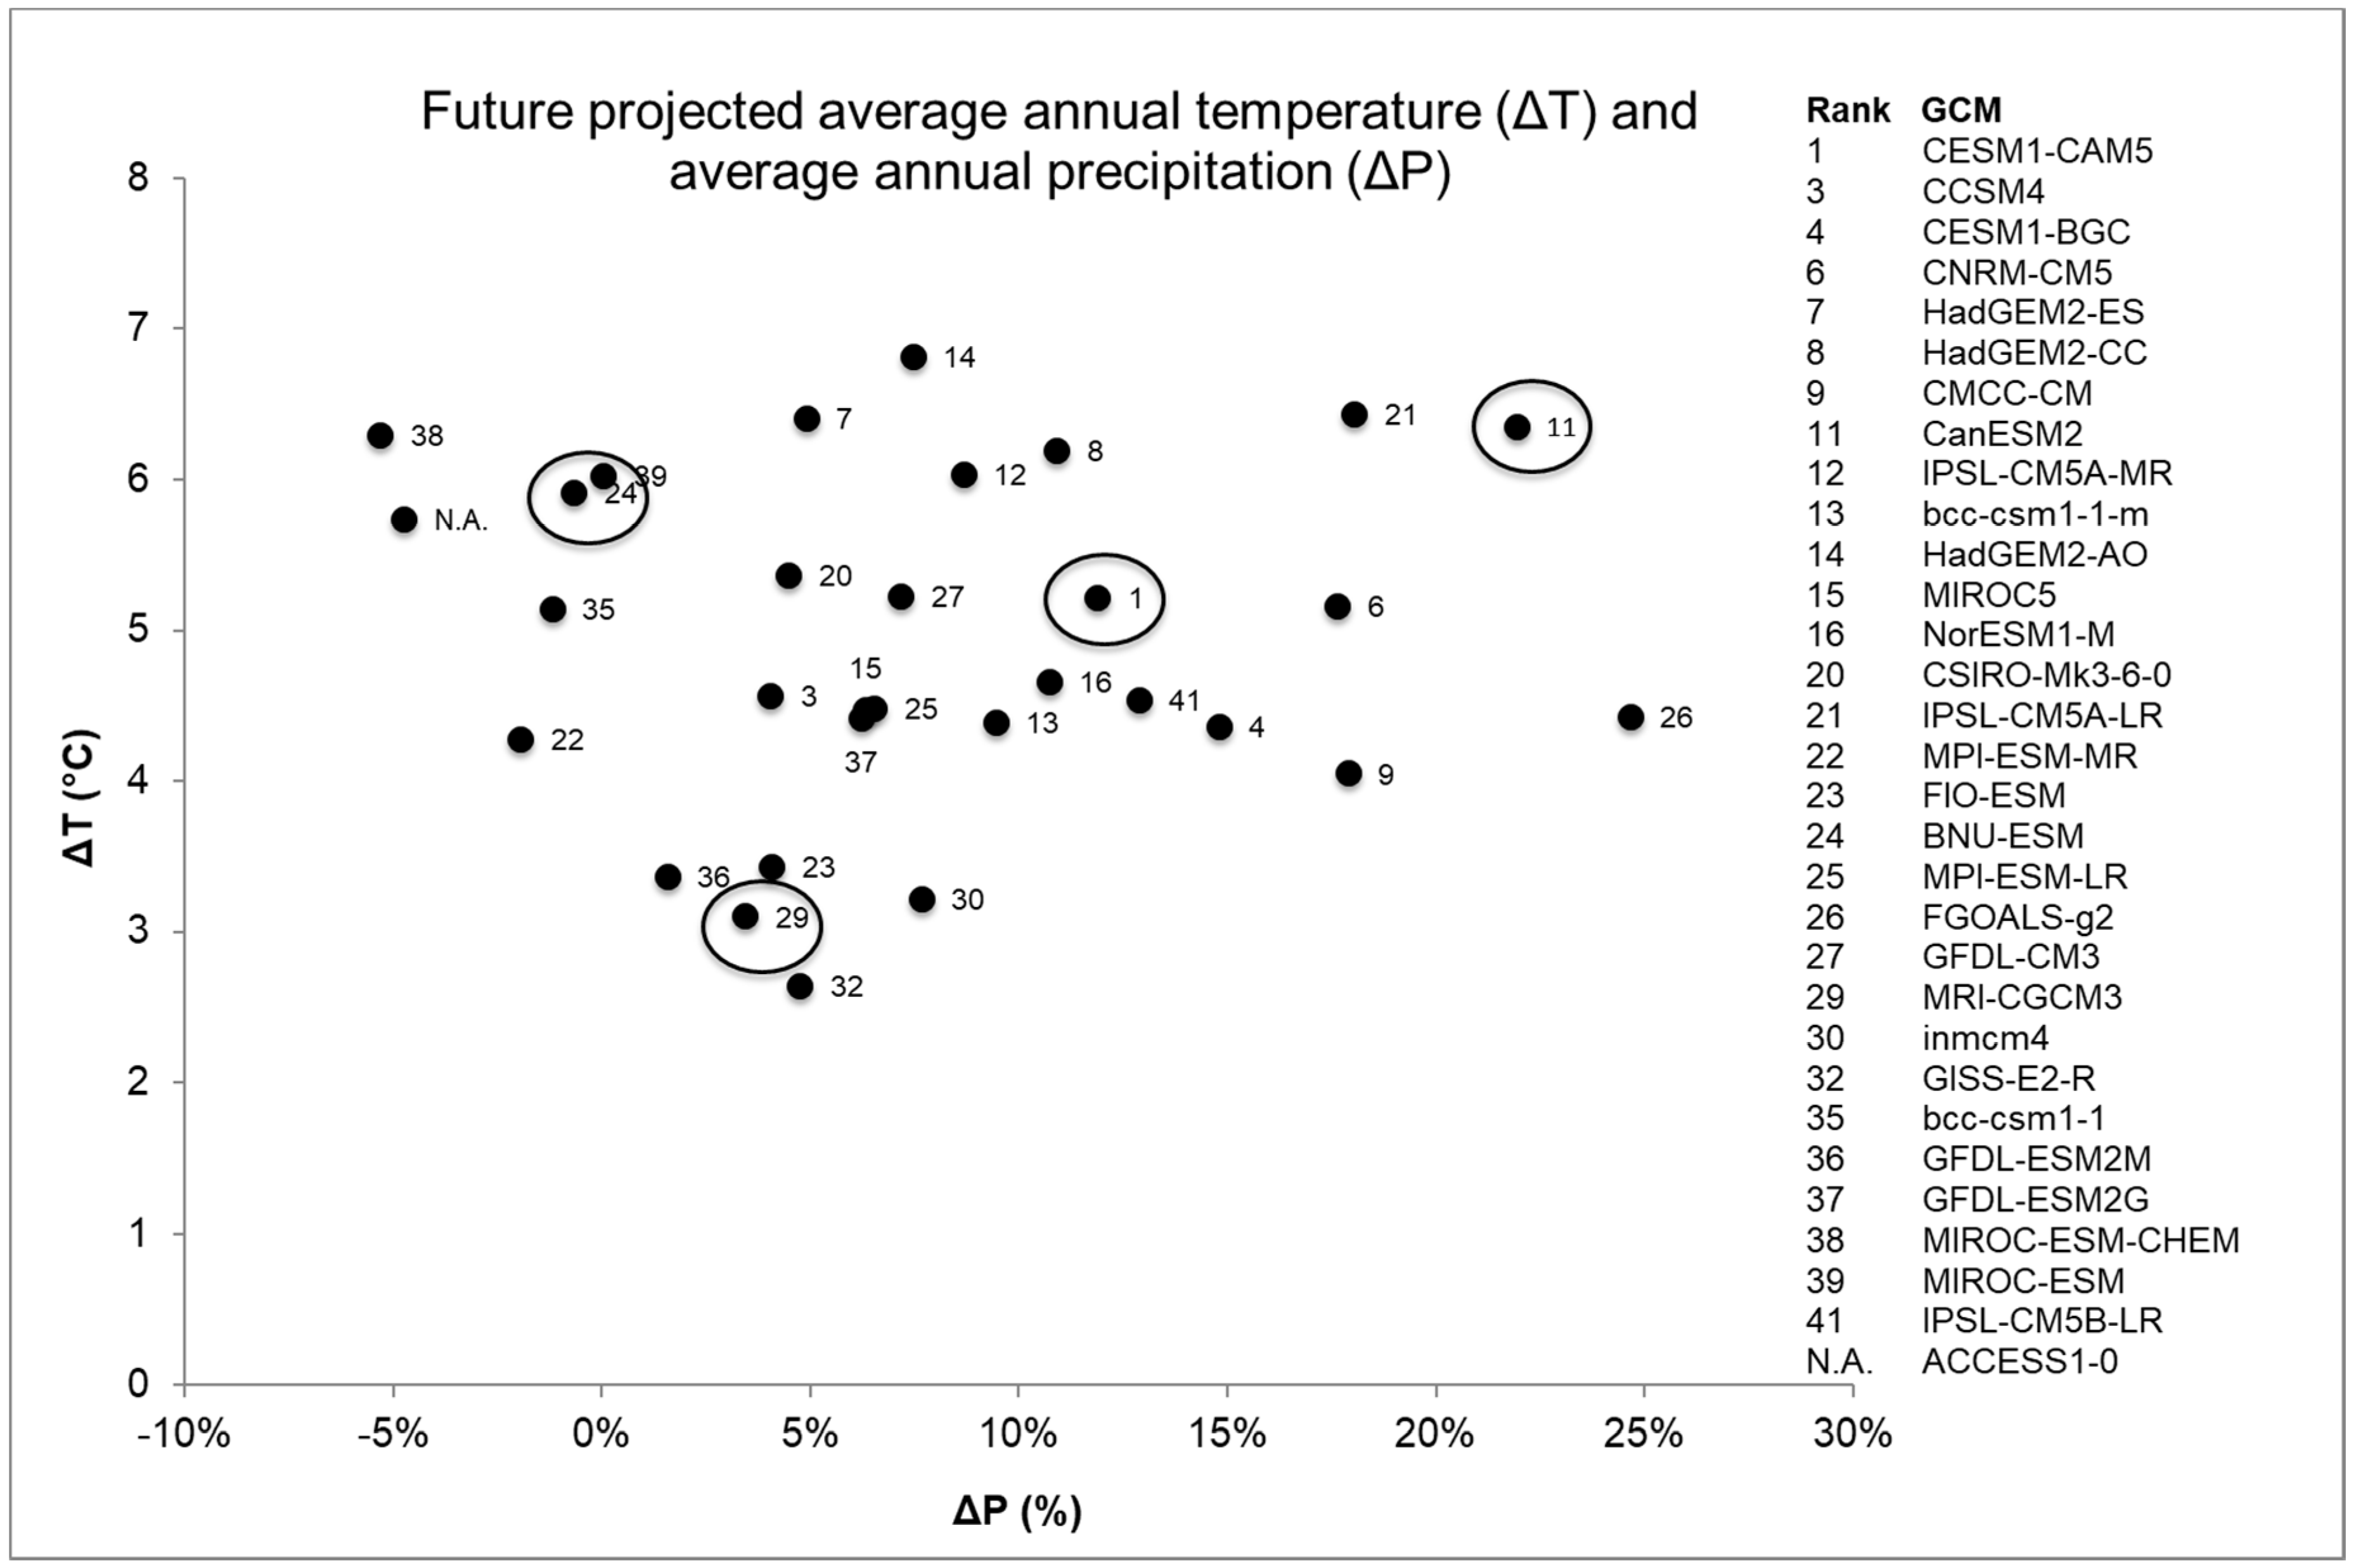
We synthesized existing vegetation and fire regime data from MC2, a regionally calibrated DGVM [38,39]. The MC2 model was driven with NASA NEX-DCP30 data, which is comprised of downscaled climate projections [40] from Coupled Model Intercomparison Project Phase 5 (CMIP5, [41]). The NEX-DCP30 dataset used the PRISM gridded climate dataset [42] as the reference dataset in the downscaling process. We identified four appropriate GCMs under the Representative Concentration Pathway (RCP) 8.5 (Figure 2). We selected RCP 8.5 to represent a high warming baseline scenario, representing a future with no globally coordinated greenhouse gas mitigation [43]. In consultation with our stakeholders, we selected four GCMs to capture the range of variability among the GCMs in their projected changes in annual average temperature and precipitation [44], while avoiding the worst-performing GCMs for the region [36]. Individual organisms and populations may respond to seasonal features of climates simulated by GCMs. However, this region has a strong Mediterranean climate pattern, with cool and wet winters and hot and dry summers. The seasonal patterns of temperature and precipitation are strongly sinusoidal. Therefore, annual average temperature and precipitation succinctly captures the general, relative differences among the GCMs. The relative positions of GCMs would be similar whether based on annual climate metrics or seasonal metrics. CanESM2 was used to represent a “hot-wet” scenario, BNU-ESM was used to represent a “hot” (but not “wet”) scenario, and MRI-CGCM3 was used to represent a “warm” scenario because it simulated a relatively small amount of warming compared to the other better performing GCMs (Figure 2). CESM1-CAM5 was selected because it was closest to the mean of the ensemble of GCMs. These climate projections were selected to allow us to exploration a range of possible futures, rather than to predict the future. The RCPs are scenarios only and are not associated with any probability.
2.3. Vegetation Projections
DGVMs simulate the underlying mechanisms of plant responses to climate, including vegetation biogeography, ecosystem processes, and interactions with wildfire, a regionally important disturbance factor. We used the DGVM MAPSS-CENTURY 2 (MC2) to simulate 12 vegetation types, representing potential natural vegetation across the study area from 1895 to 2100 (Table 1) [38]. Vegetation type, carbon fluxes and stocks, and fire occurrence and effects are emergent properties of this process model. MC2 runs on a monthly time-step and captures the interactions between climate and broad vegetation types, disturbance, and ecosystem carbon balance. More specifically, MC2 simulates the response of plant functional types to climate change, including plant physiology, biogeography, water relations, and interactions with fire. We used a 30 arc-second (approximately 800-m grid), monthly time step version of PRISM climate data. We calibrated MC2 for the U.S. Pacific Northwest (Figure 1) for the historical period 1895–2009. Only a single dominant tree or shrub vegetation type may occupy a cell, with grass in the understory. MC2 simulates per area carbon stocks, but not plant density. Each MC2 simulation was driven by a single GCM and the annual output was aggregated for three periods: the recent historical time period (1970–1999), midcentury (2035–2064), and end of the century (2070–2099). MC2 is also currently being used to inform climate change vulnerability assessments conducted by the U.S. Forest Service, Pacific Northwest Region [28,45].
2.4. Vegetation and Ecosystem Service Guide and Application
To assess the climate change impacts on ecosystem services, we worked with our stakeholders to determine which of the MC2 vegetation types were suitable for each ecosystem service (see Table A1 and Table S1). We refer to these associations as our “vegetation and ecosystem service guide”. Our determination of which vegetation types were suitable was based on habitat associations, forest cover types, literature reviews, and expert opinion [48,49]. After the vegetation and ecosystem service guide was reviewed by our tribal stakeholders, we then calculated the percent of the study area that each of the MC2 vegetation types covered for the historical time period and the eight future projections (simulation output driven by four GCMs for two time periods). We averaged the percent area for the four future simulations for each time frame. In addition, for each simulation driven by a single GCM, we calculated the difference in percent area between historical and the future average.
After thorough discussions with our stakeholders, we chose to apply projections from the mean GCM (CESM1-CAM5) to examine how vegetation types might change in the future. We converted the difference between the historical and the future average to a relative directional change, that is to say, vegetation types that were projected to shrink in the future were converted to “−1” and vegetation types that were projected to expand in the future were converted to “+1”. Although we recognize that this method ignores the magnitude of change of vegetation types, it was perferred by our stakeholders because it is easy to intepret and is not influenced by dramatic changes in percent area. We also converted the species’ associations with vegetation types to binary code so that we could assess how the future changes in vegetation types might impact a species’ habitat. For instance, if a species was associated with a particular vegetation type, then we recorded a “1”, but if it did not have an association, we recorded a “0”. This allowed us to assess the relative change projected for one or more future vegetation types for which a species was associated with. For example, species that are associated with subalpine forests and subalpine woodlands would have a value (presence) for each habitat, in this example totalling two (1 + 1). Subalpine forest and subalpine woodland vegetation types are both projected to shrink by the end of the century (−1) and thus the relative change in potential habitat would be negative two (2 × (−1)).
To further illustrate how projected future changes might impact ecosystem services using model output from MC2, we present two specific applications for huckleberry and bitterbrush. We chose to focus on huckleberries because they are important for food, medicinal purposes, and are culturally significant for many tribes in the Pacific Northwest [25,50]. However, wildfire suppression and increased conifer tree encroachment have led to a more closed canopy structure on many huckleberry sites, resulting in declining berry production and habitat [51,52]. At high elevations, tree encroachment of subalpine meadows is driven in part by snowpack depth and duration [53]. Warming temperatures and snowpack declines will likely facilitate increased encroachment in the future, a trend that has already been detected in the Pacific Northwest [54].
Bitterbrush is a slow-growing shrub that is native to the dry interior western U.S., and is valued as an important medicinal and cultural resource by Native Americans [55]. Bitterbrush is also important as a food resource for wildlife and livestock, as habitat for the Greater sage-grouse (Centrocercus urophasianus), and is used in restoration and erosion control in highly disturbed areas [56]. Although bitterbrush can be deep rooted and is adapted to a wide range of drought and cold conditions, it is sensitive to overgrazing, invasive cheatgrass (Bromus tectorum L.), and increased fire [57]. Compounding these threats, climate change is projected to result in wetter winters, which could increase cheatgrass growth and spread [58,59], thereby increasing the likelihood of fire [60] and negatively impacting bitterbrush.
We spatially mapped the historical and future habitats for the vegetation types associated with huckleberries and bitterbrush using our vegetation and ecosystem service guide, for the mid and end of the century. Using our vegetation and ecosystem service guide, we identified that huckleberries are generally associated with cool, moist forest types [50]; therefore, we determined that subalpine forests, moist coniferous forests, and coniferous forest vegetation types represent potential habitat for huckleberries across the study area (see Appendix A, Table A1). By comparison, bitterbrush is found on arid mountainsides and slopes throughout the intermountain west from southeastern British Columbia to southern California and generally occurs as part of temperate mixed shrub and woodland communities above 700 m elevation [56,61]. These communities correspond closely with shrub steppe and coniferous woodlands and as such we used MC2 coniferous woodland and shrub steppe vegetetation types and removed areas below 700 m to represent potential habitat for bitterbrush. This elevation limit is a reflection of bitterbrush’s precipitation thresholds [56]; therefore, we decided to exclude areas below 700 m in both historical and future simulations.
To assess the changes in potential habitat for huckleberry and bitterbrush, we compared the simulation output for the historical distribution of vegetation types identified with the two species with future projections. We idenified locations that were projected to be stable, to expand, and to contract by mid and end of the century under CESM1-CAM5, the GCM nearest the ensemble mean. We considered a portion of each species’ potential habitat to be stable if those vegetation types were simulated to be present both historically and in the future. Expansion was defined as areas that were simulated to become newly suitable in the future, and areas of contraction were defined as places that were historically suitable but that were simulated to become unsuitable in the future. To explore uncertainities among the GCMs, we also examined alternative future simulations for both species (Appendix C).
3. Results
3.1. Simulated Future Vegetation
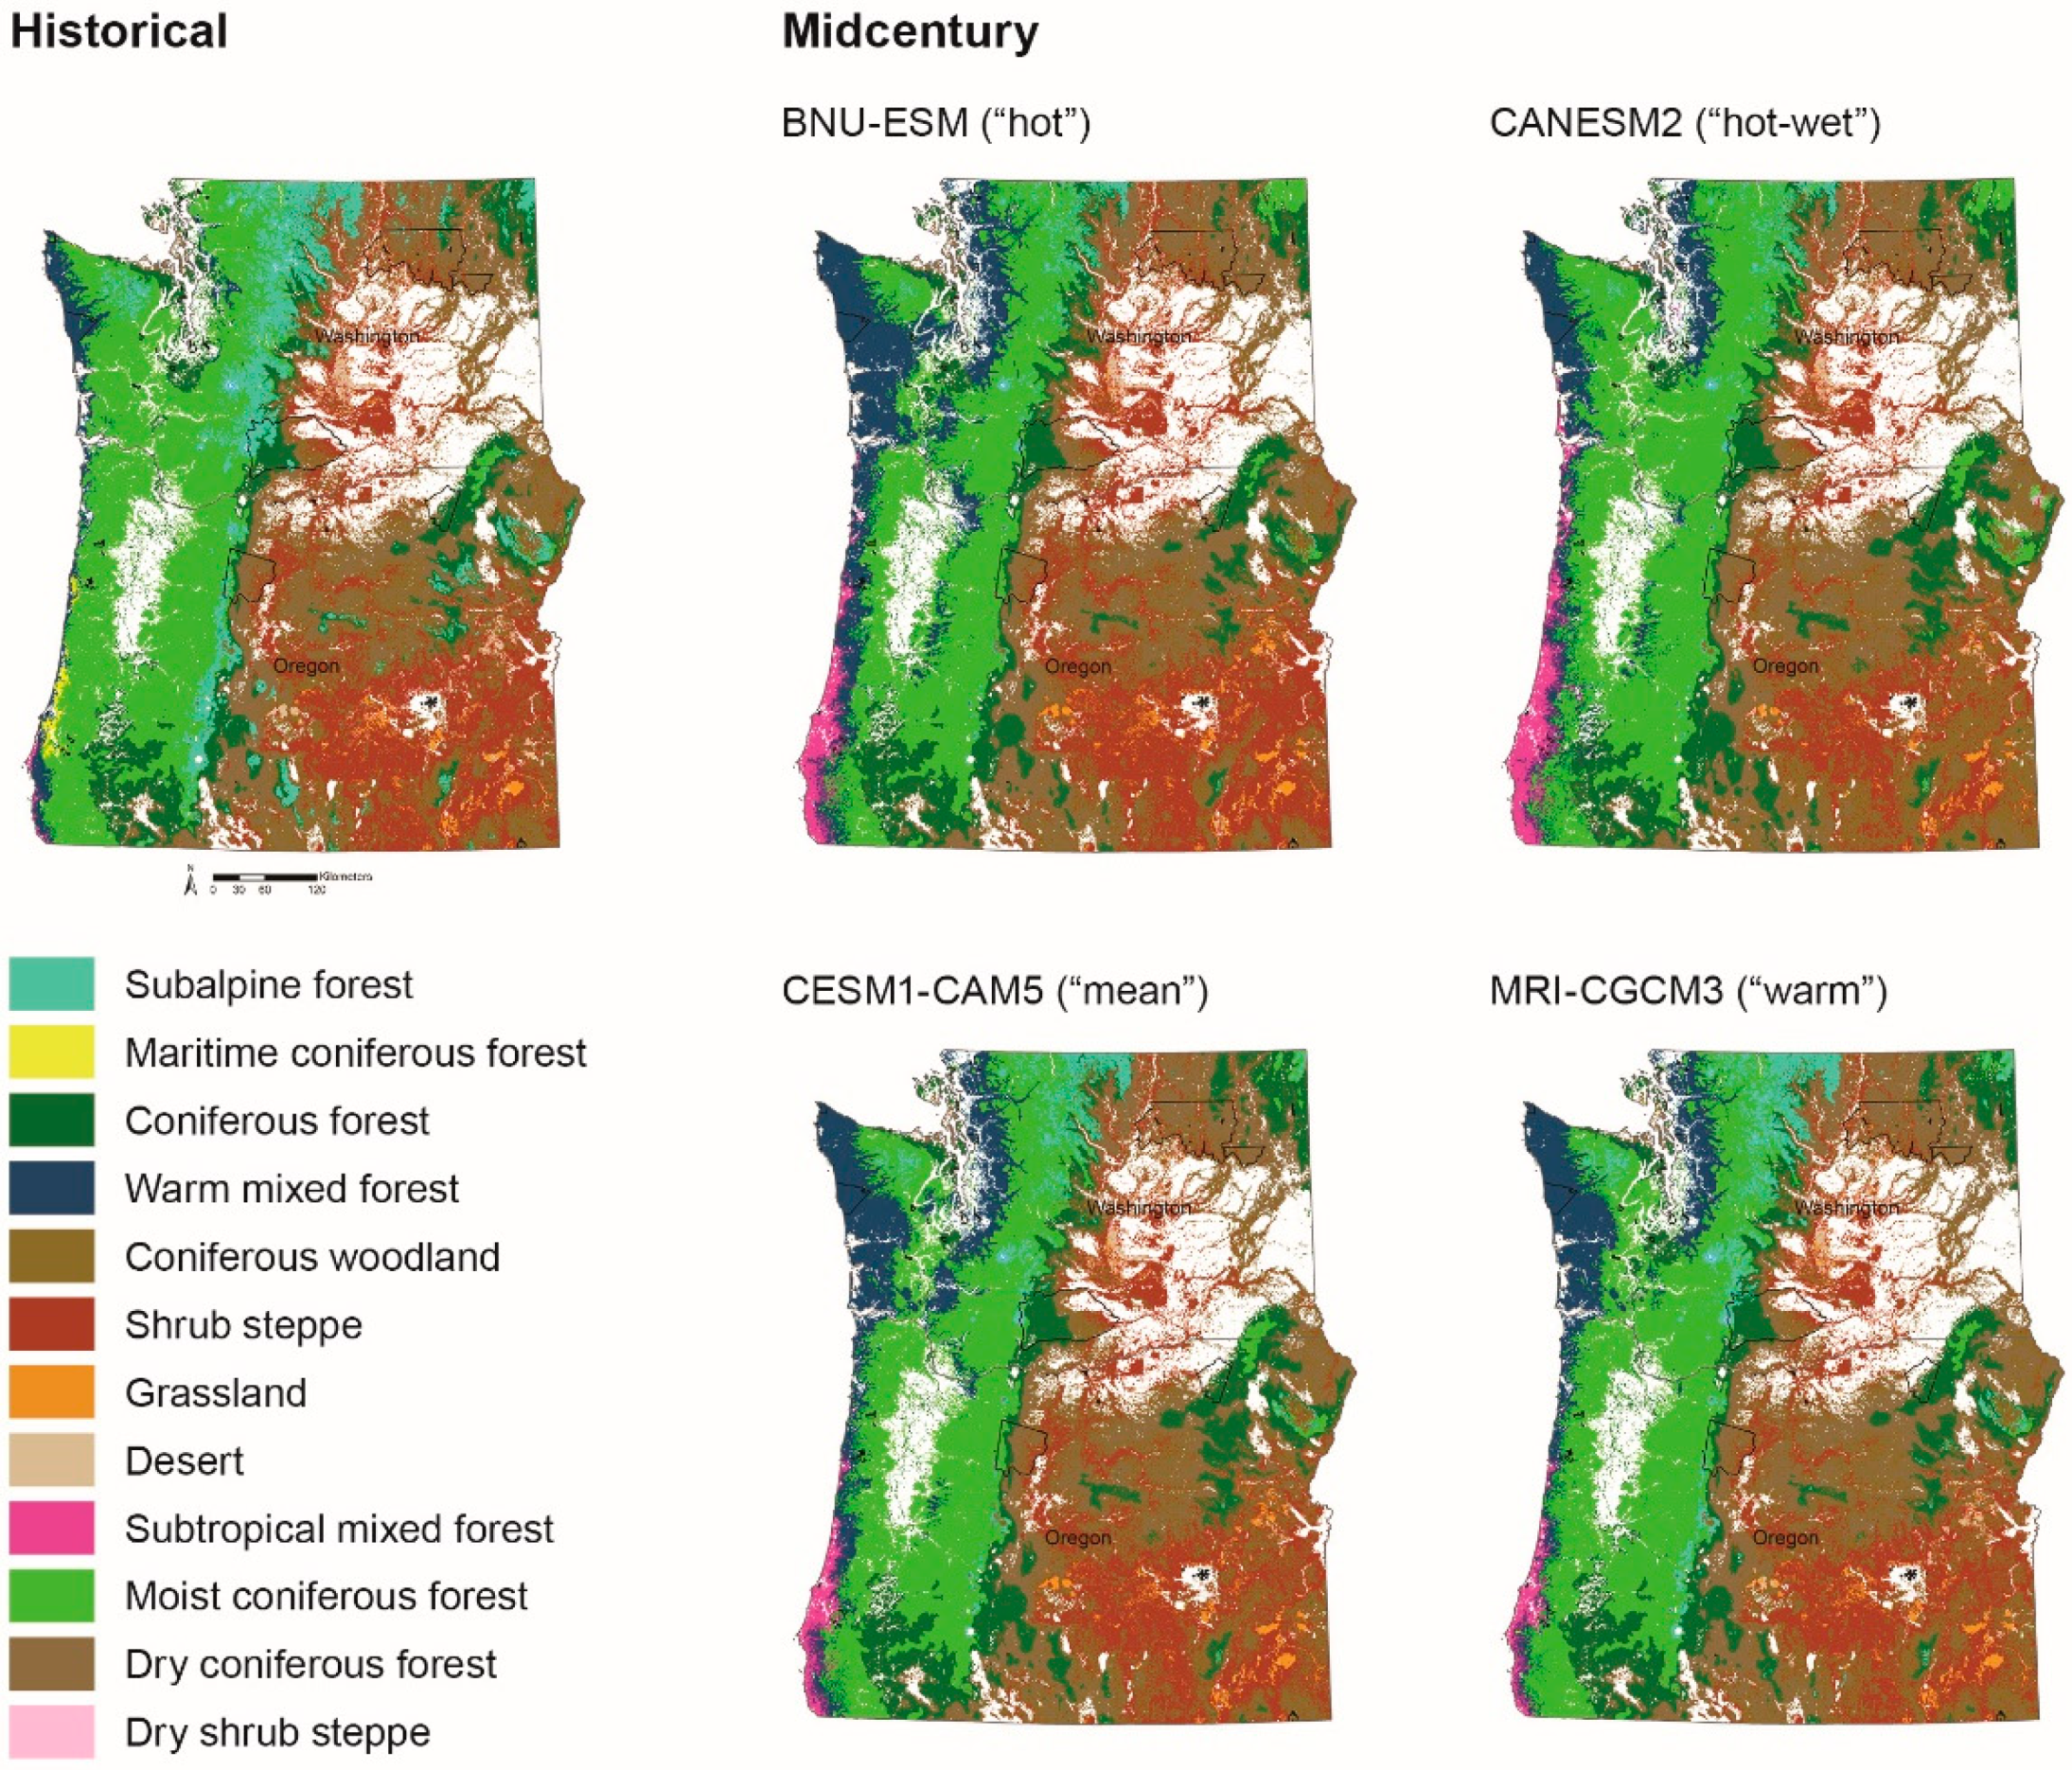
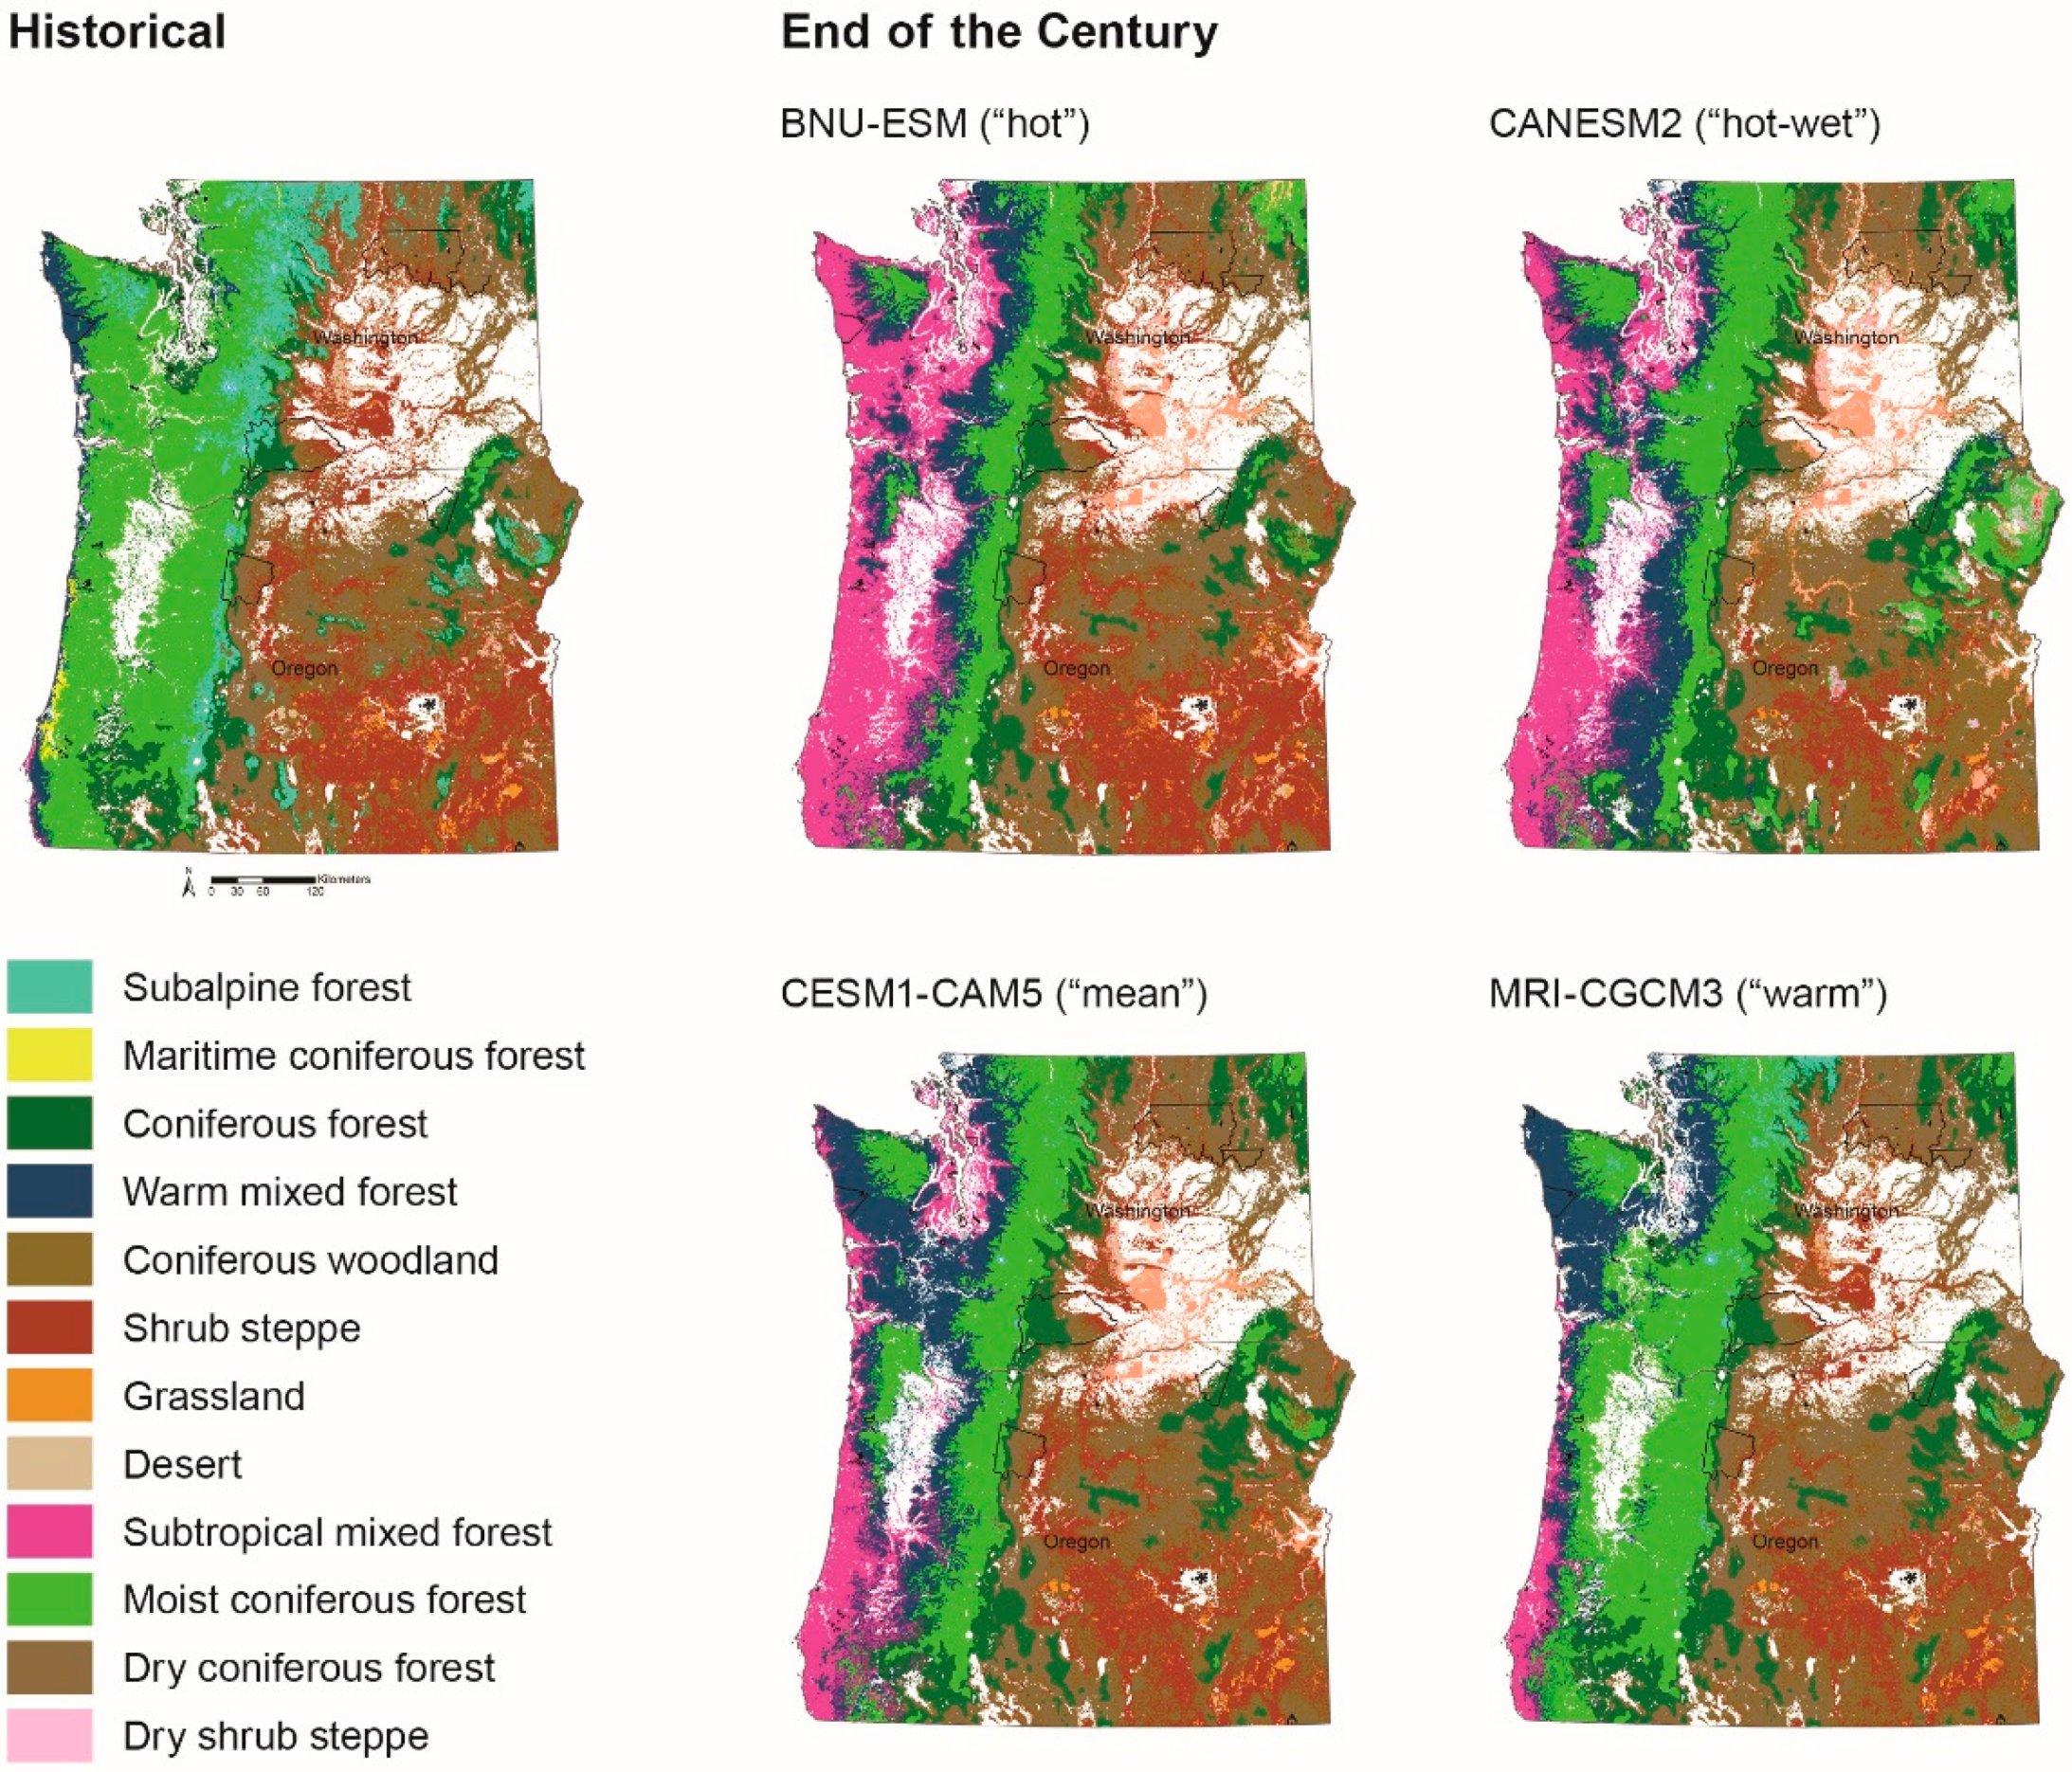
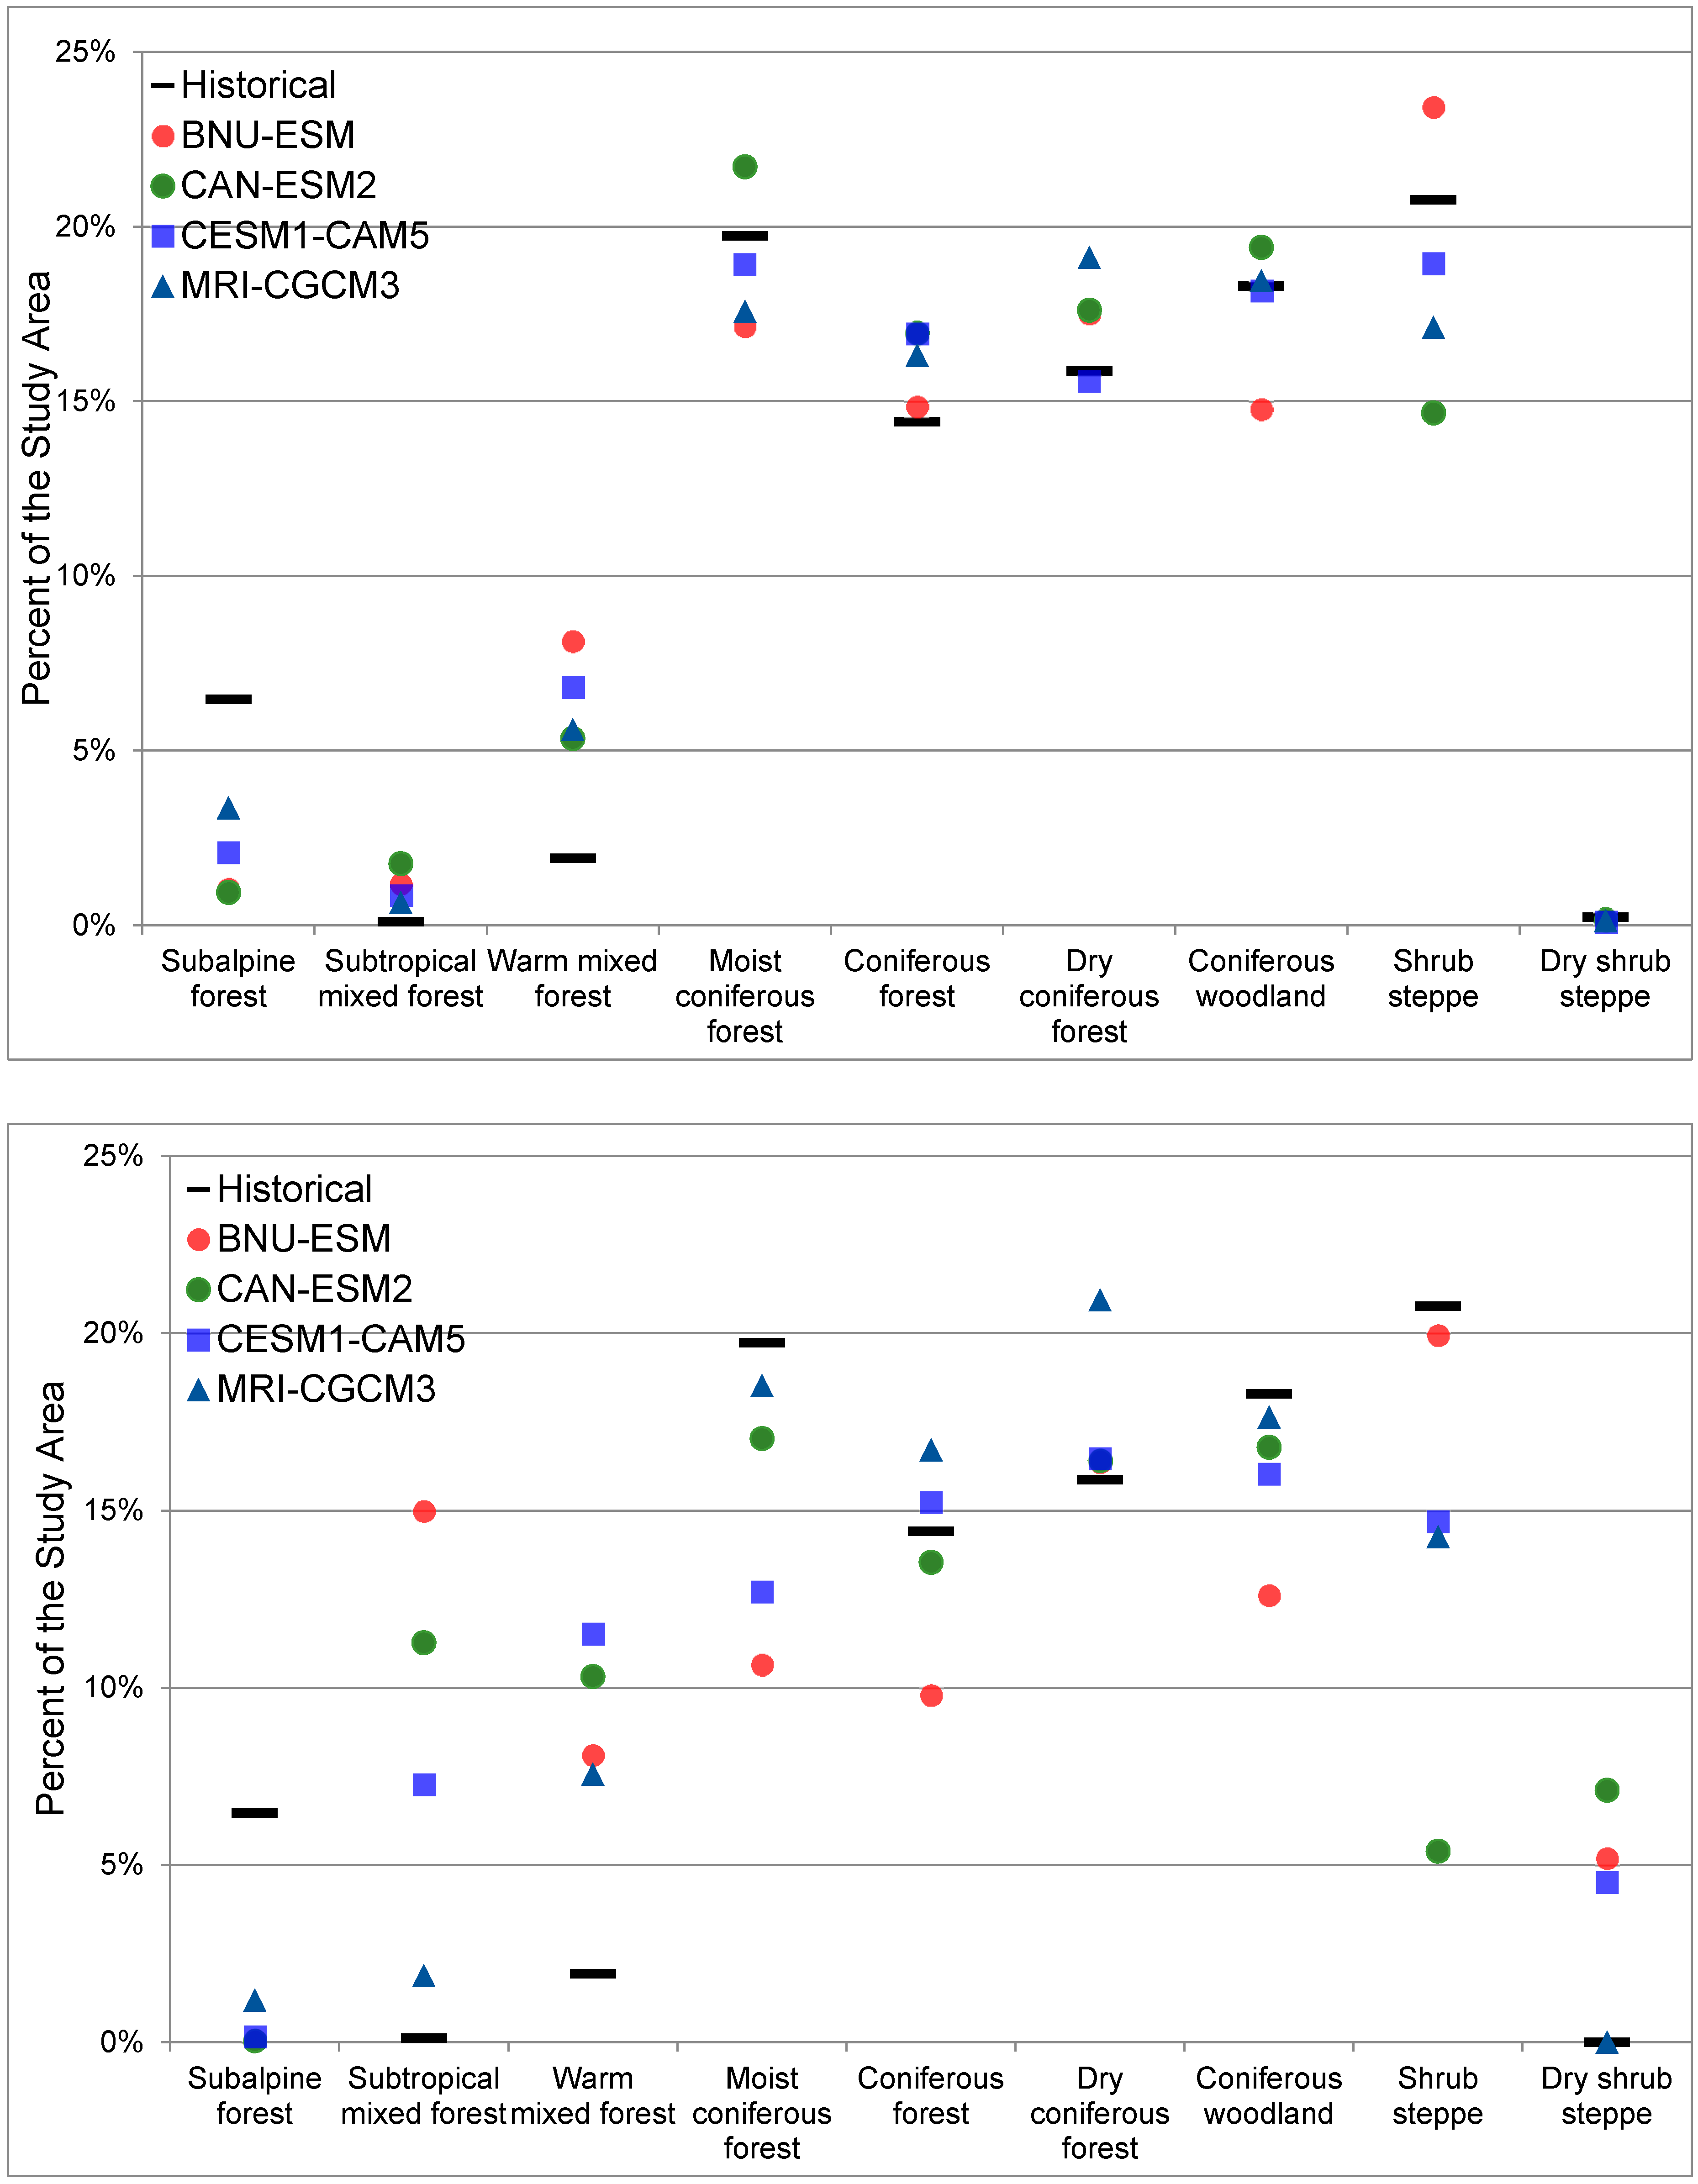
Potential vegetation types across the study area are projected to change substantially by midcentury and the end of the century (Figure 3 and Figure 4); however, individual projections driven by each of the four GCMs differ. Nevertheless, the overall trend is for warmer-adapted vegetation types to expand and displace cooler vegetation types. Model output based on the “hot-wet” GCM—CanESM—projects that the most pronounced changes in vegetation types occur with forests displacing substantial areas of woodlands and shrublands within the dry interior portion of the study area (Figure 3 and Figure 5). Across all GCMs, some of the largest changes are projected along coastal areas, at high elevations, and within the dry Columbia Plateau for both time frames. Vegetation types projected to change the most include subalpine forests, subtropical mixed forests, warm mixed forests, woodlands, and shrub steppe. Although the direction of change (increase versus decrease extent) varies by vegetation type and GCM, subalpine forests, moist coniferous forests, and shrub steppe are projected to shrink in distribution, whereas subtropical mixed forests, warm mixed forests, dry coniferous forests, and dry shrub steppe are all projected to expand (Figure 5).
3.2. Future Changes in Ecosystem Services
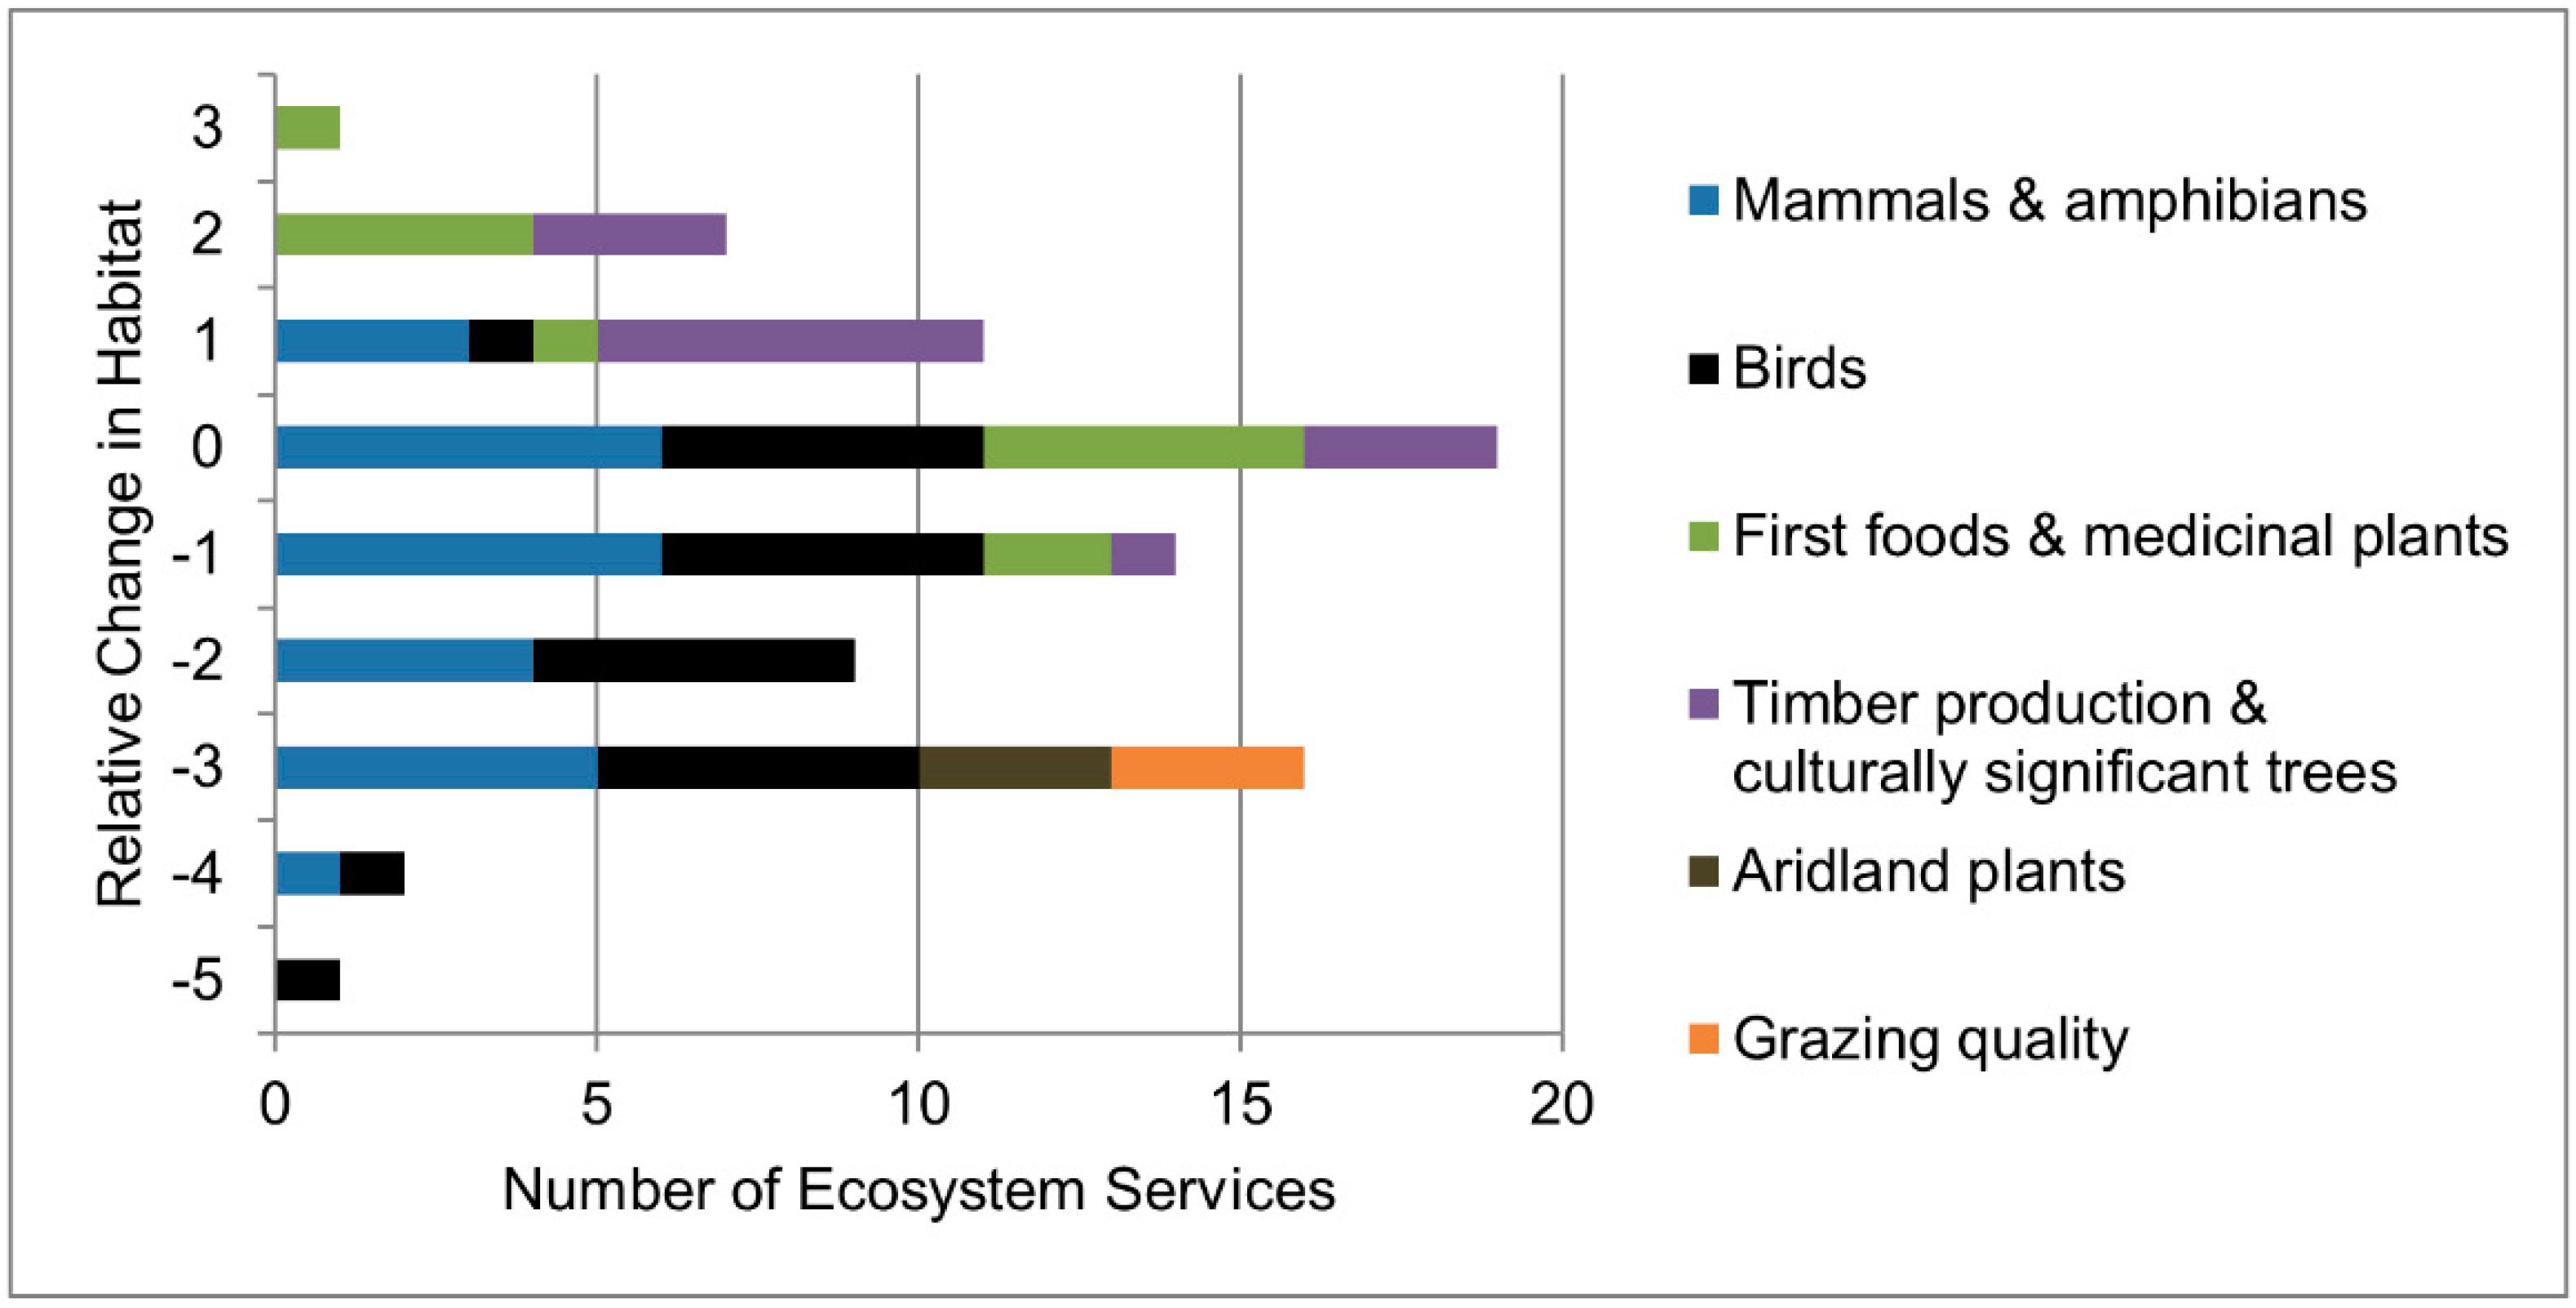
Of the 78 species and resources analyzed, slightly more than half (40) may be vulnerable to climate change due to loss of habitat under the CESM1-CAM5 GCM. Within these 40 potentially vulnerable species and resources, over one third (14) were determined to have relatively large losses of potential habitat (Figure 6, Appendix B, Table A2), and consisted largely of mammals and birds that are associated with subalpine forests and shrub steppe habitats. By contrast, species and resources that were associated with more southern types of forests were found to be less vulnerable, experiencing either less change in habitat or a potential expansion of habitat. More specifically, nearly a quarter (19) of the total 78 species and resources examined are projected to potentially gain habitat. Another quarter (19) had no overall projected change in their habitat suitability. In general, “First Foods and Medicinal Plants” are projected to increase in potential habitat (Figure 6), with the exception of huckleberries and grass. “Timber Production and Culturally Significant Trees” are also projected to increase in potential habitat overall, with the exception of one tree species—Pacific silver fir (Abies amabilis). “Mammals and Amphibians” are projected to either decline or experience no change in their potential habitat and “Birds”, “Aridland Plants”, and “Grazing Quality” are all projected to decline in potential habitat (Figure 6).
3.3. Huckleberry and Bitterbrush
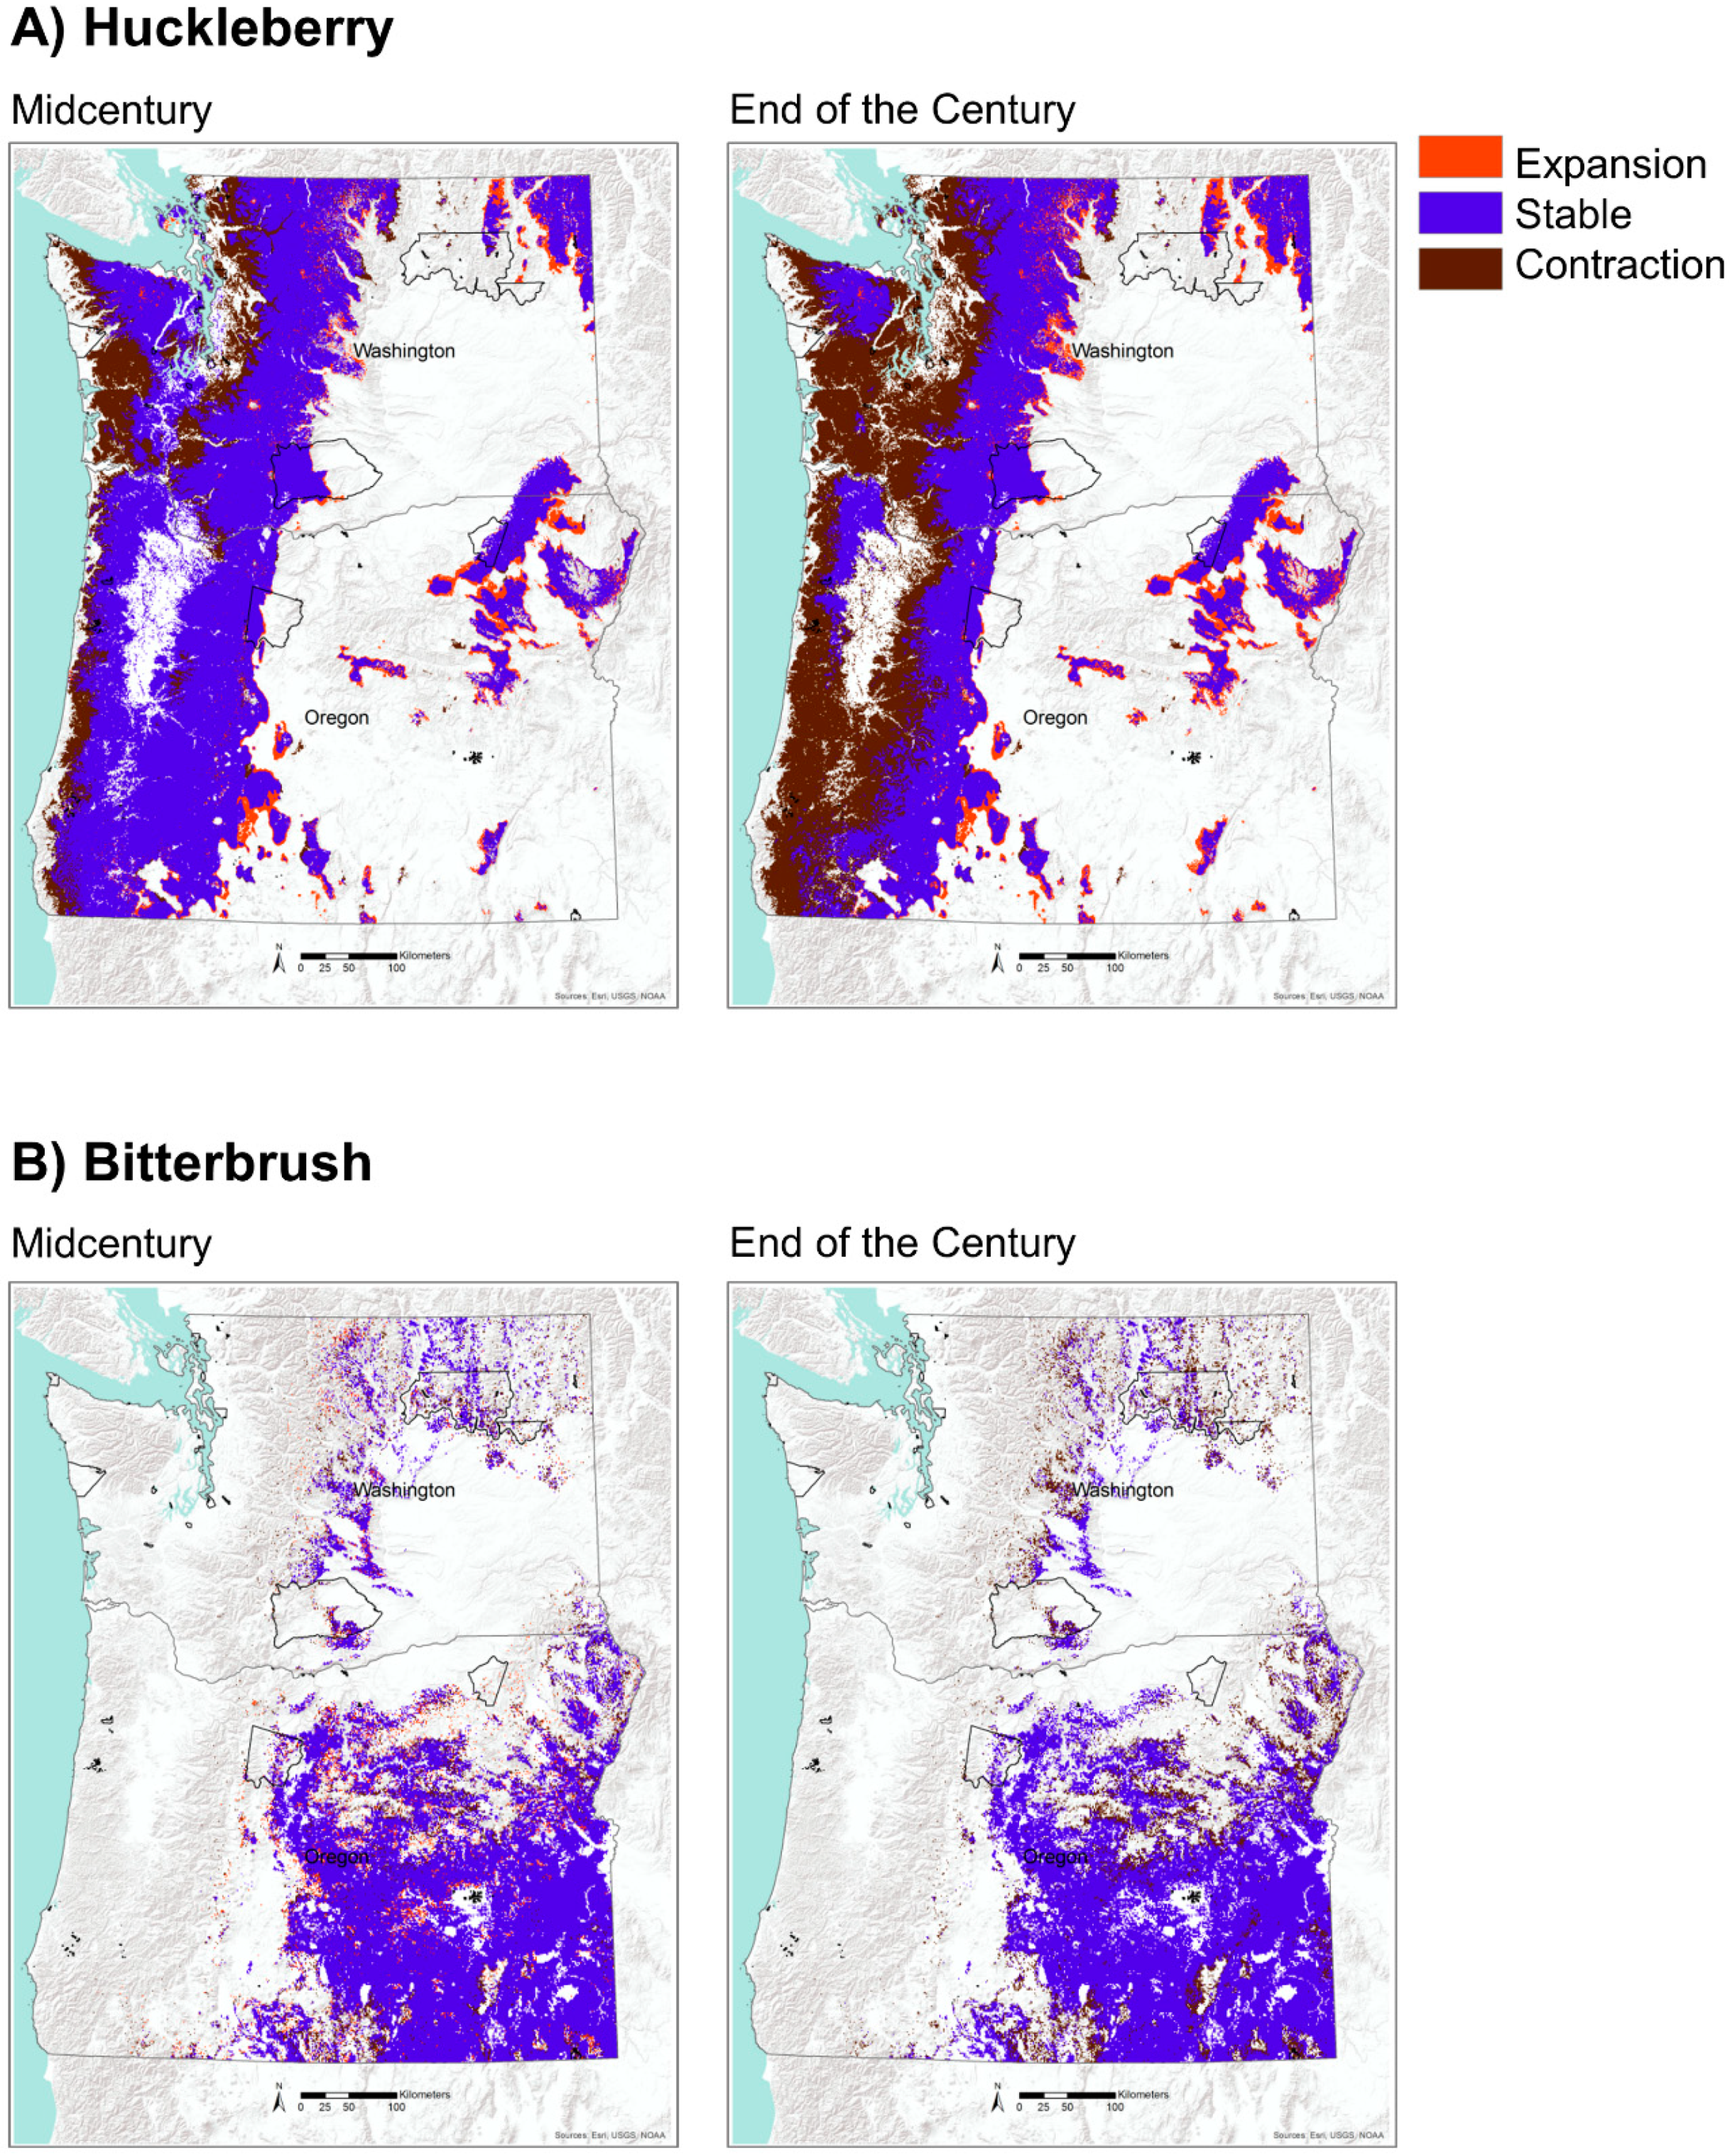
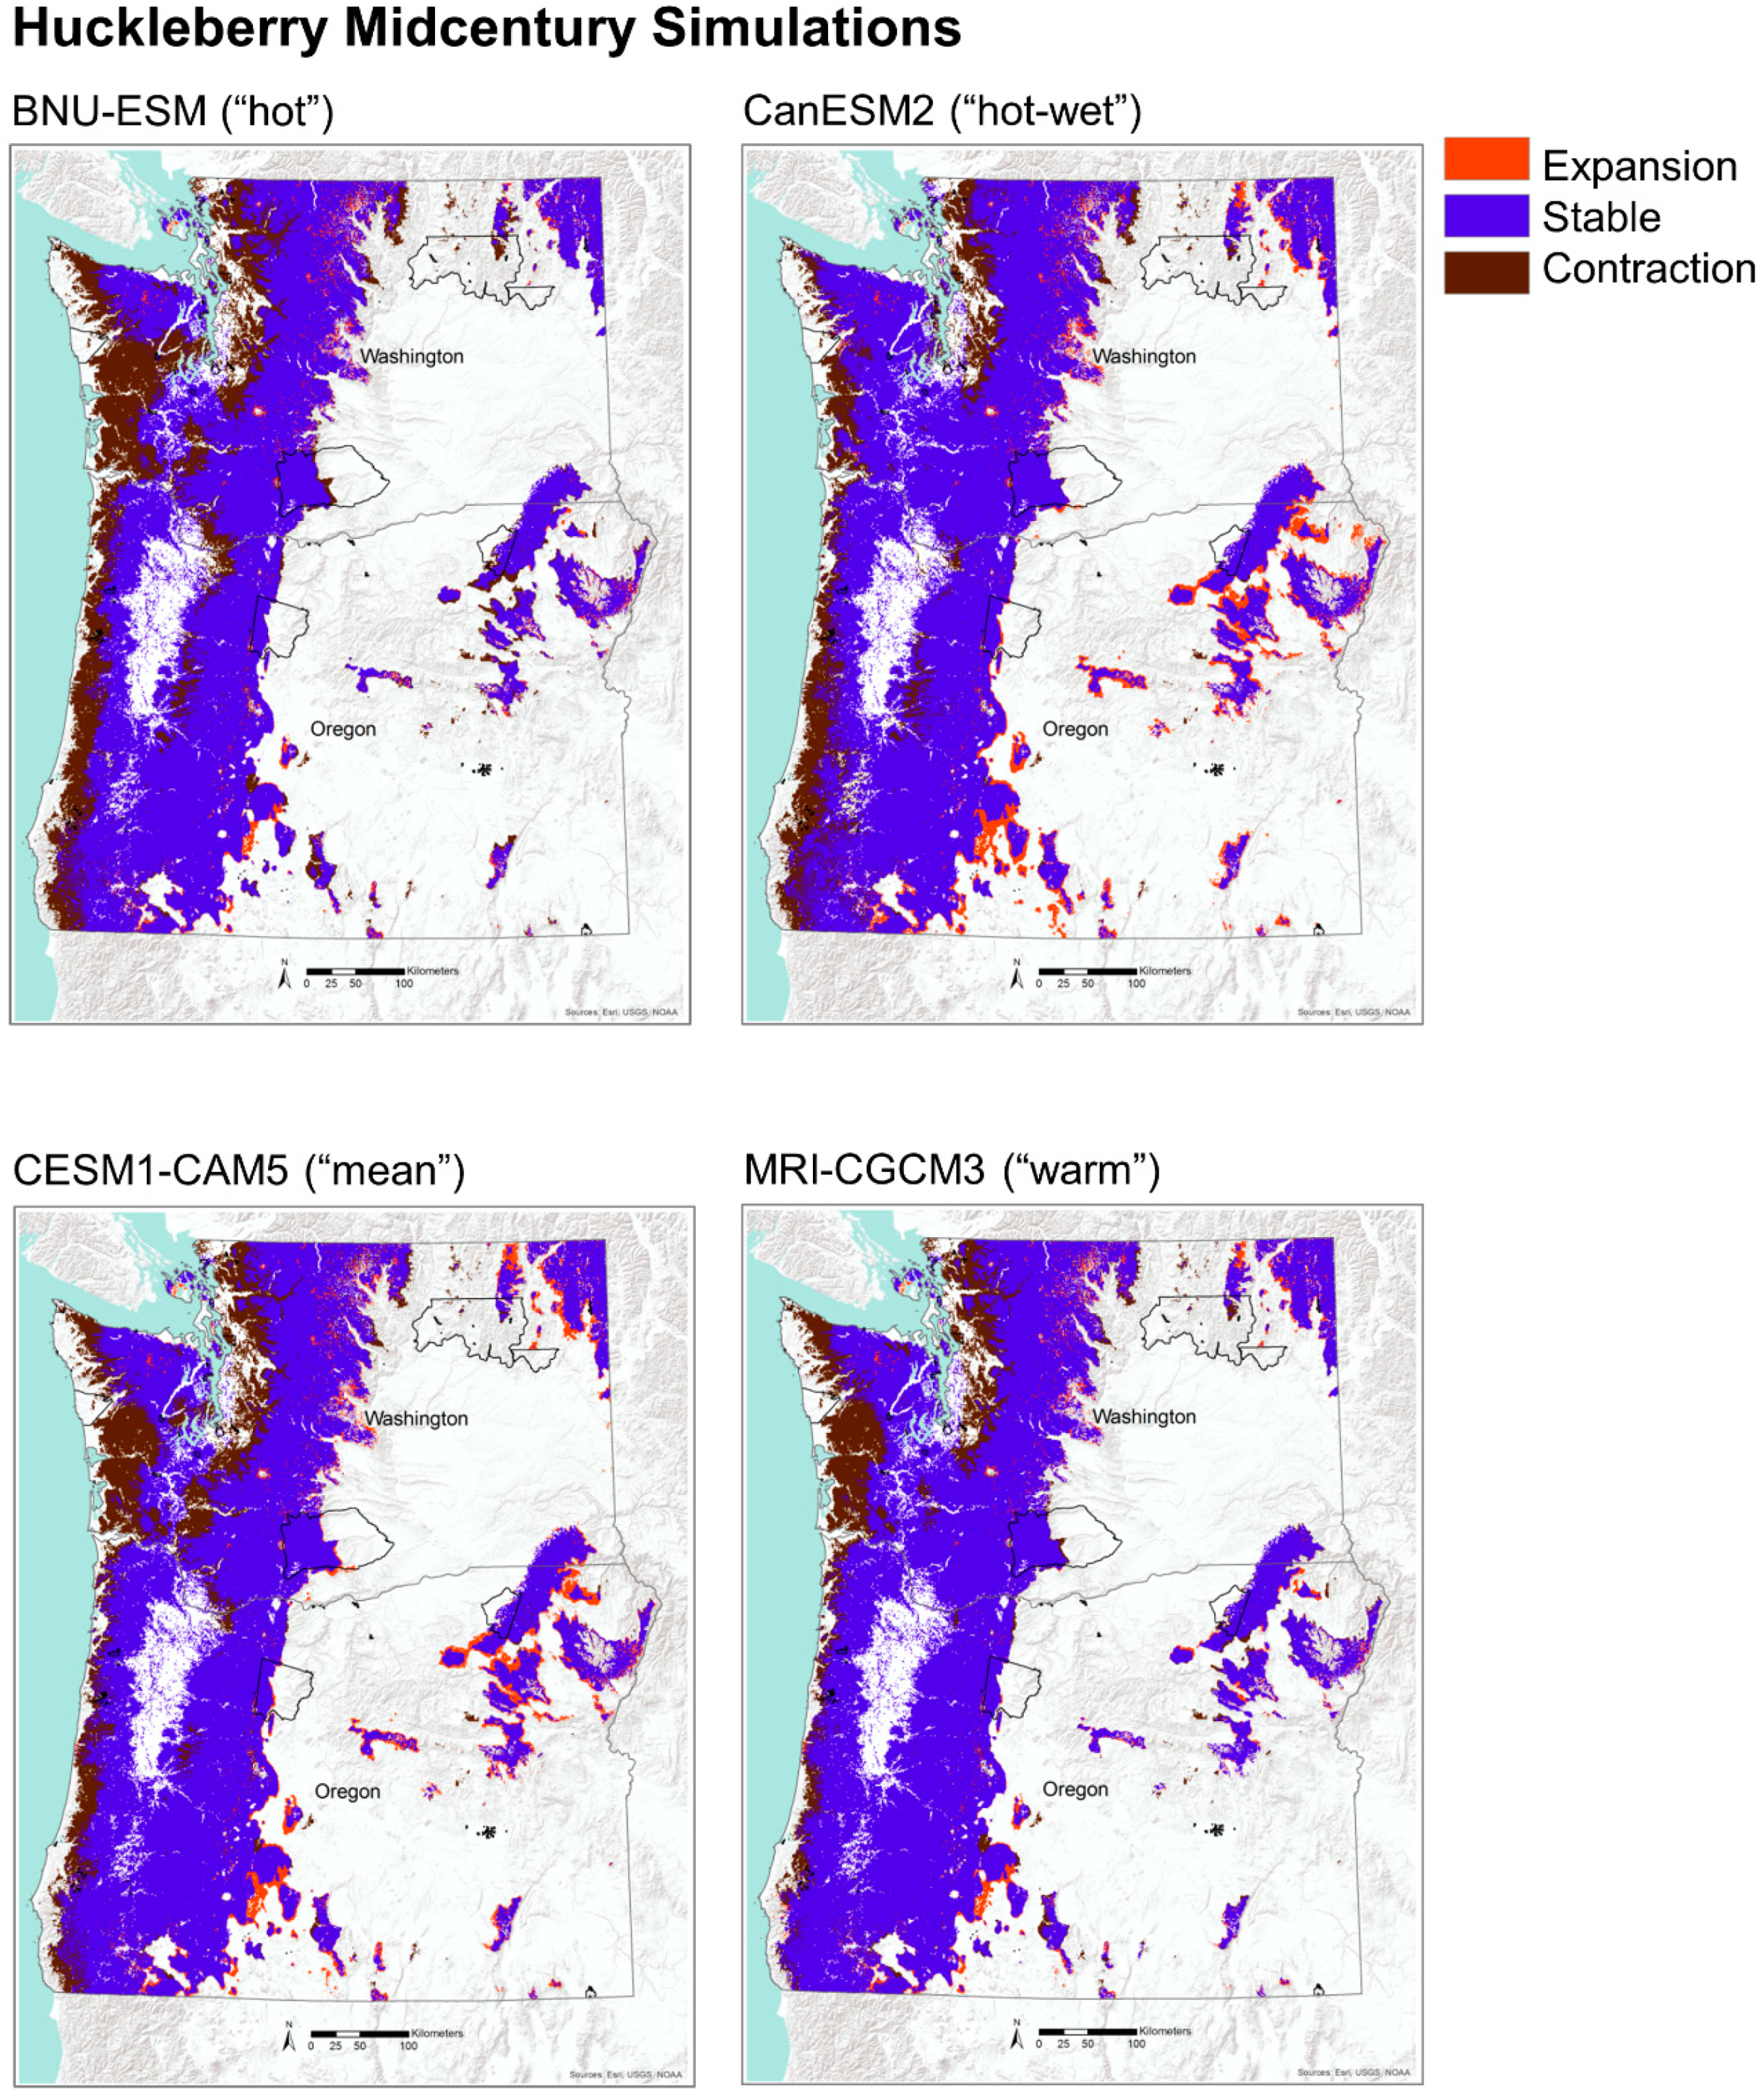
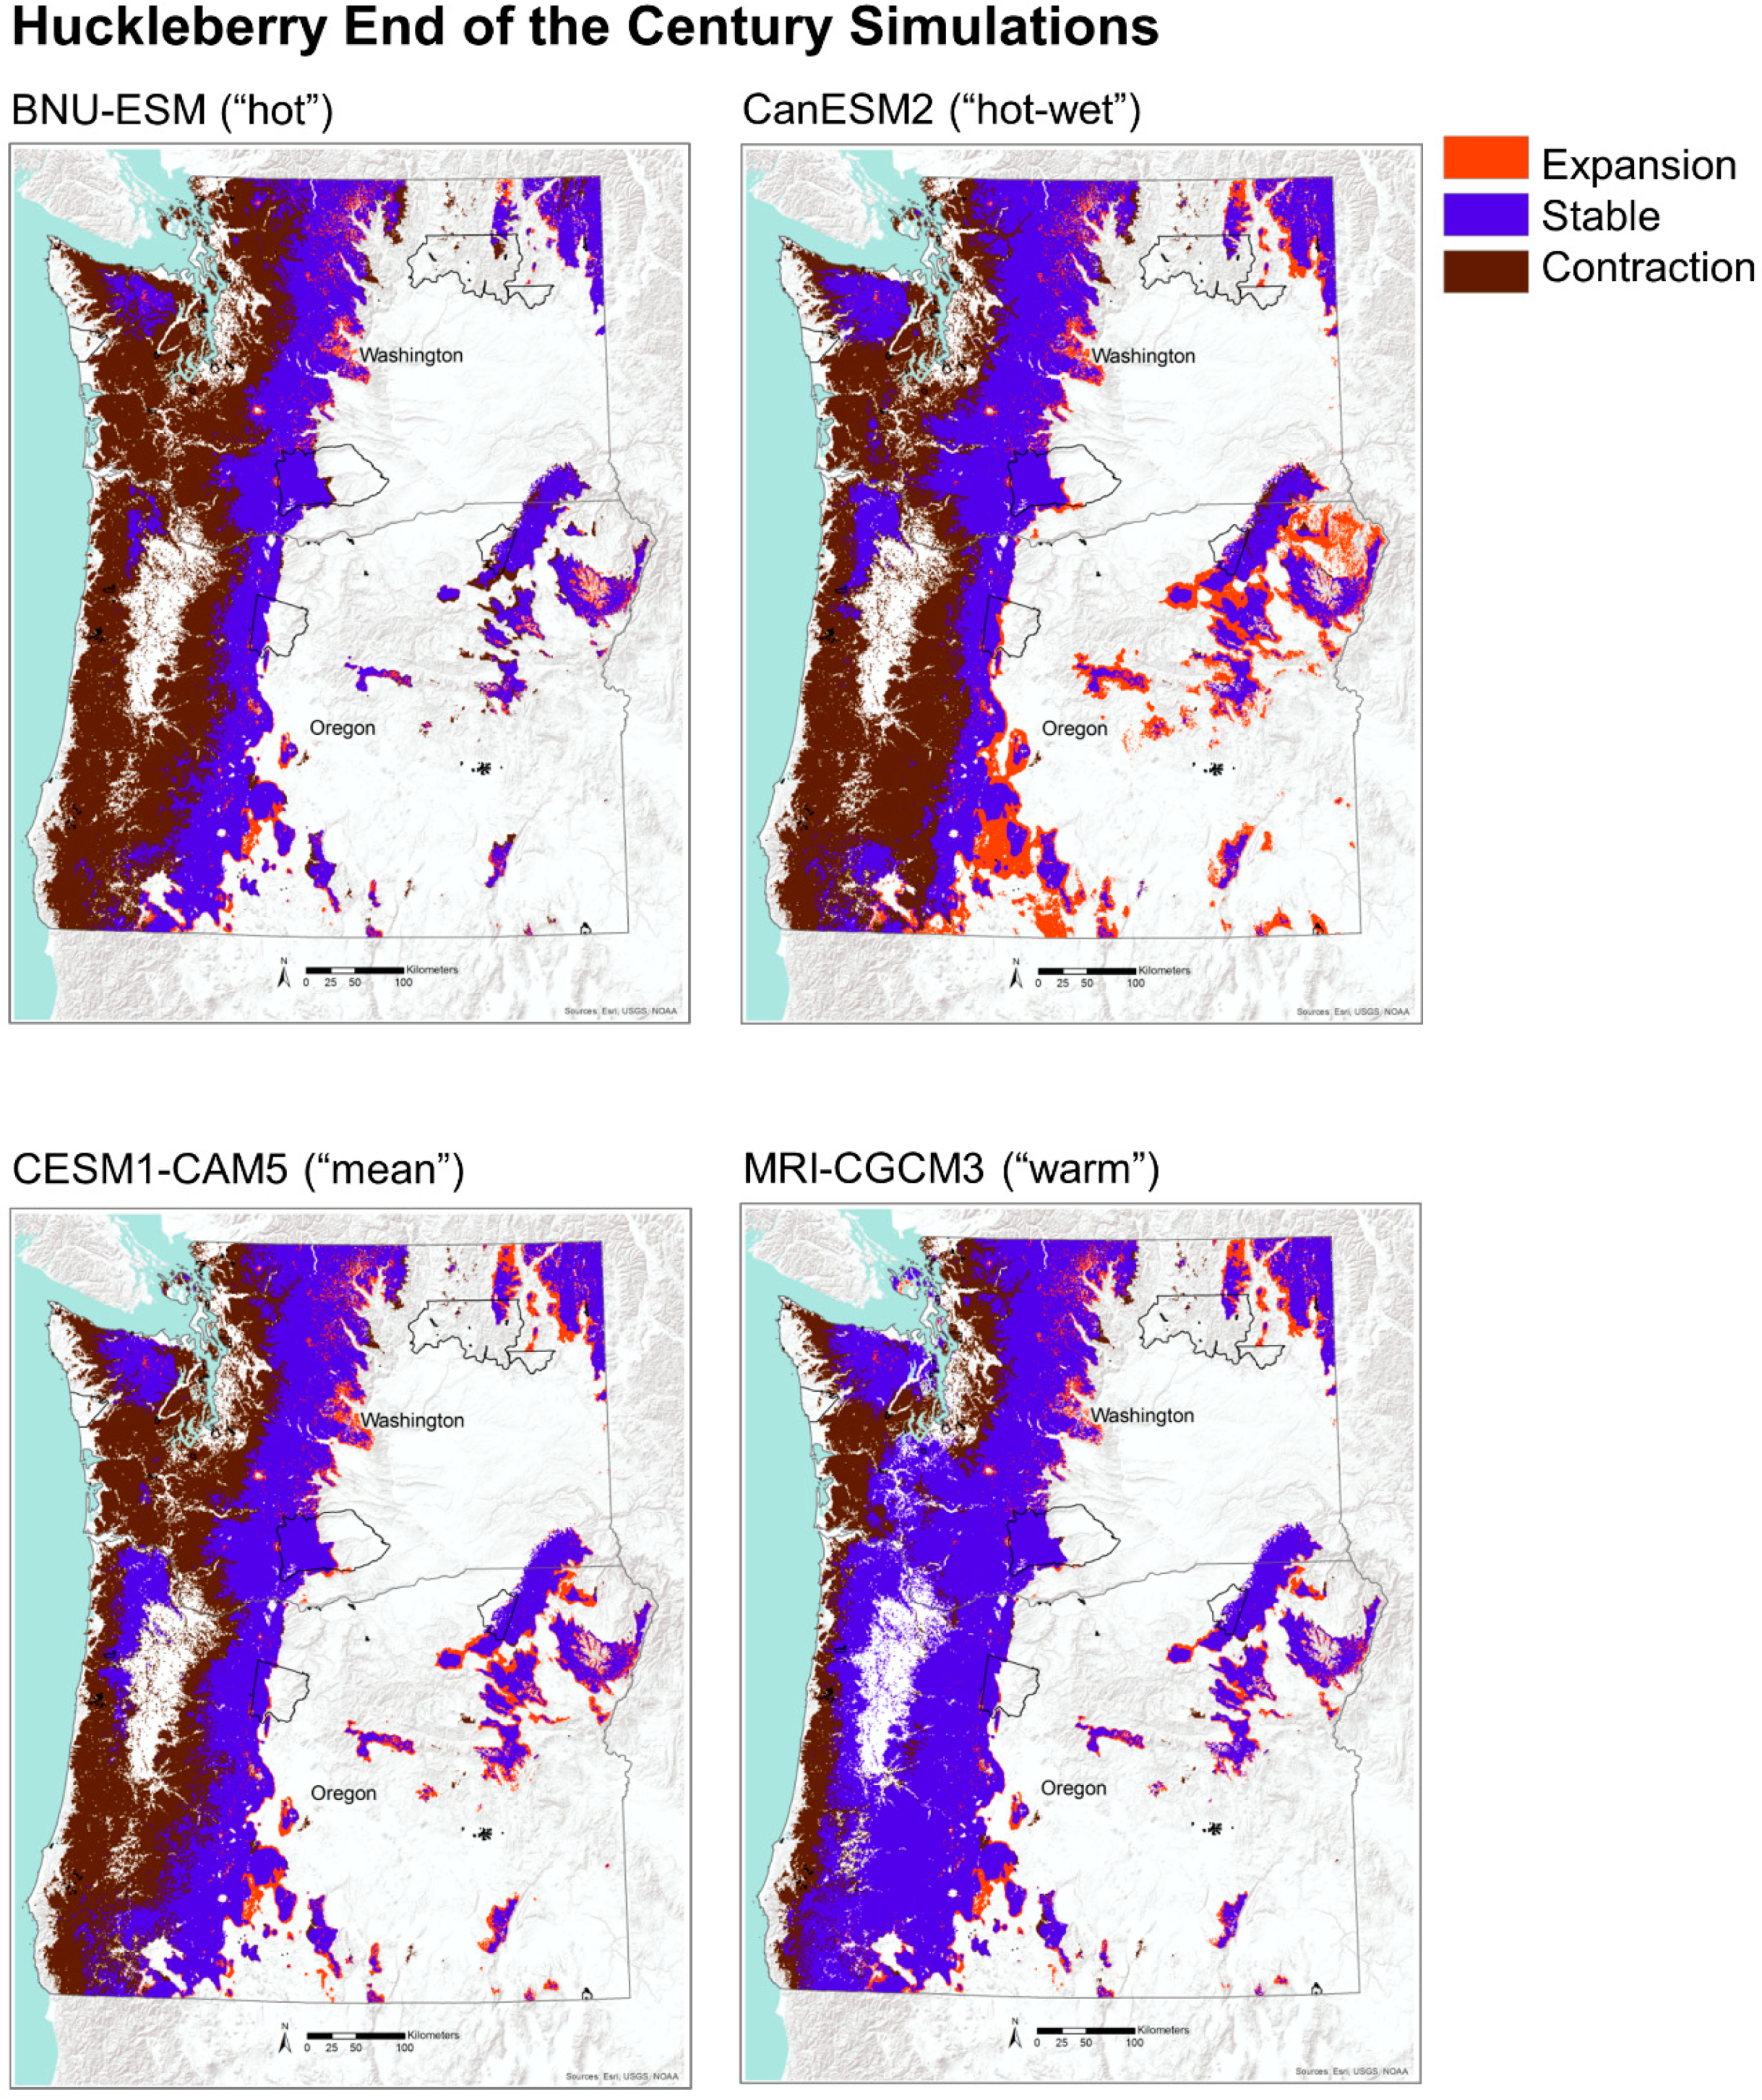
Future projections of potential habitat (i.e., MC2 vegetation types) for huckleberry show significant contraction by midcentury with a loss of 15% of its historical habitat, mostly along the coastal areas. This trend is even more pronounced by the end of the century, with a widespread (41%) loss of potential habitat (Table 2, Figure 7). Nearly all of this contraction is concentrated on the west side of the Cascade Range and is largely driven by displacement of moist coniferous forests by warm mixed forests and subtropical mixed forests (Figure 3 and Figure 4). There is a small amount of expansion of potential habitat for huckleberry of 8% by the midcentury and 10% by the end of the century (Table 2, Figure 7). Most of these newly suitable habitats are projected to occur on the eastside of the Cascade Range and are located in areas that are historically dominated by coniferous woodlands. These woodlands are projected to transition into coniferous forests by mid and end of the century under the four GCMs (Figure 3 and Figure 4). Areas that are simulated to remain stable for potential habitat are concentrated mostly in the mountain ranges, including the Coast Range and Blue Mountains in Oregon, Olympic Mountains in Washington, and the Cascade Range in both Oregon and Washington.
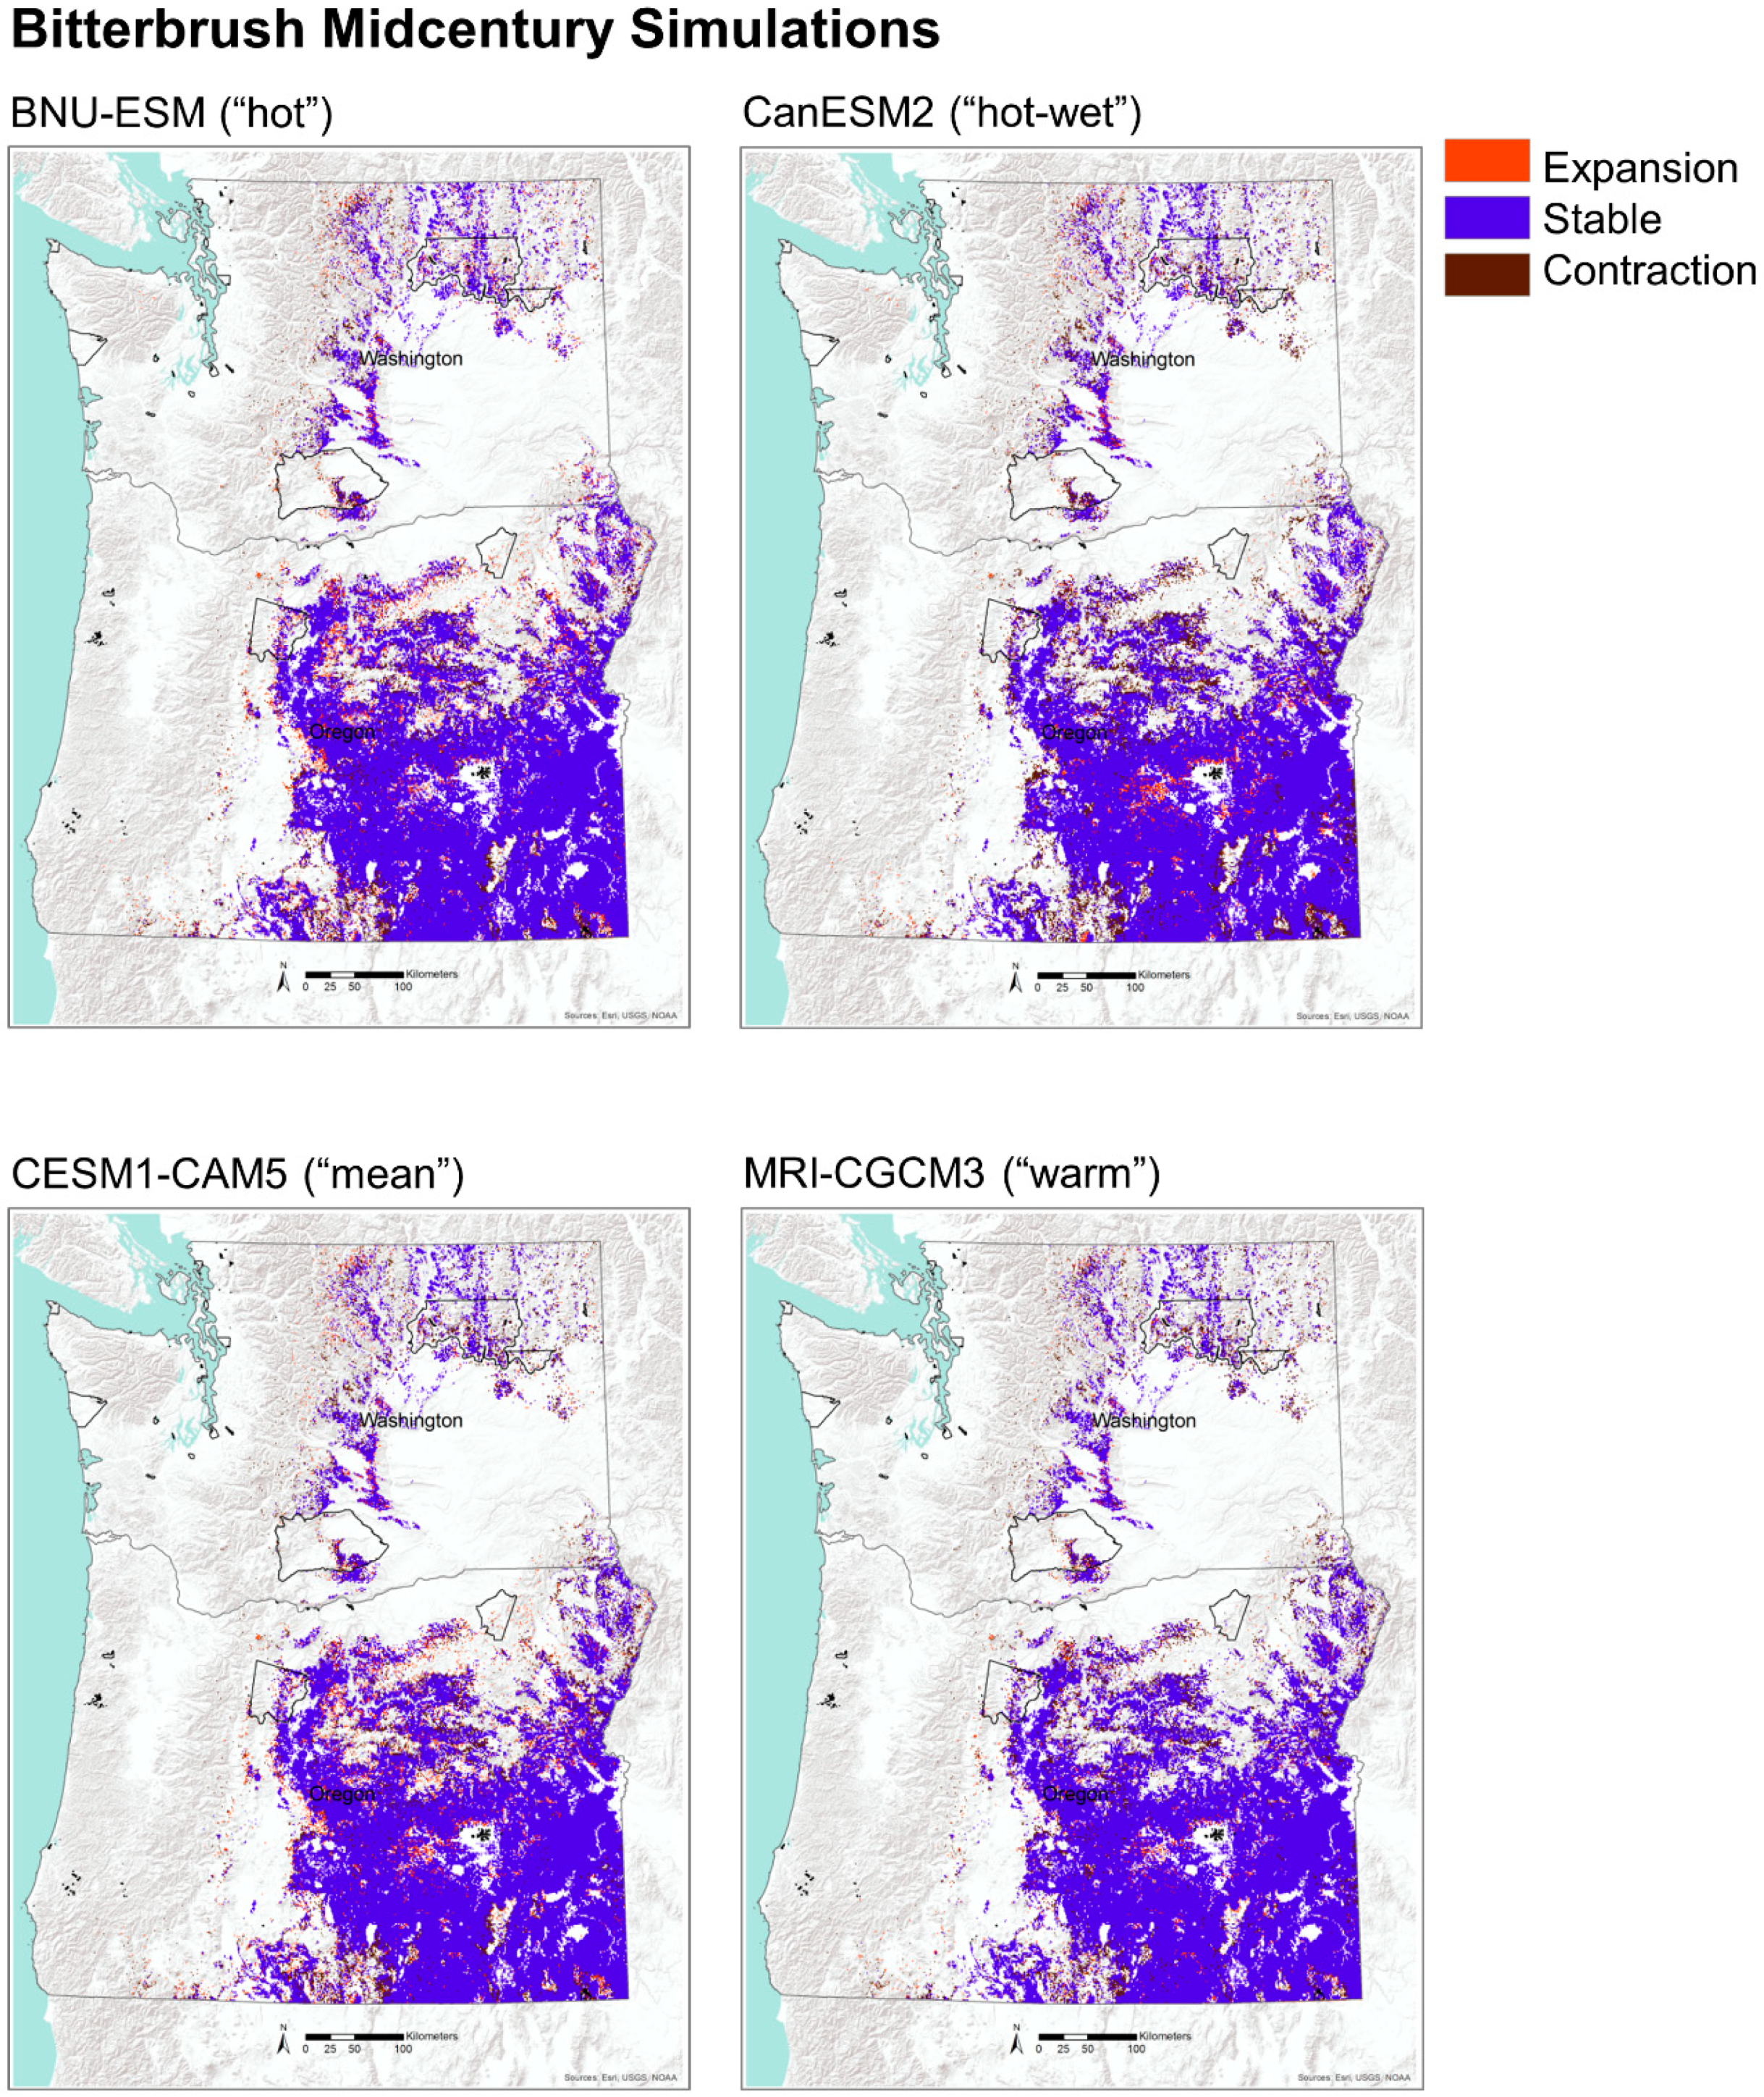
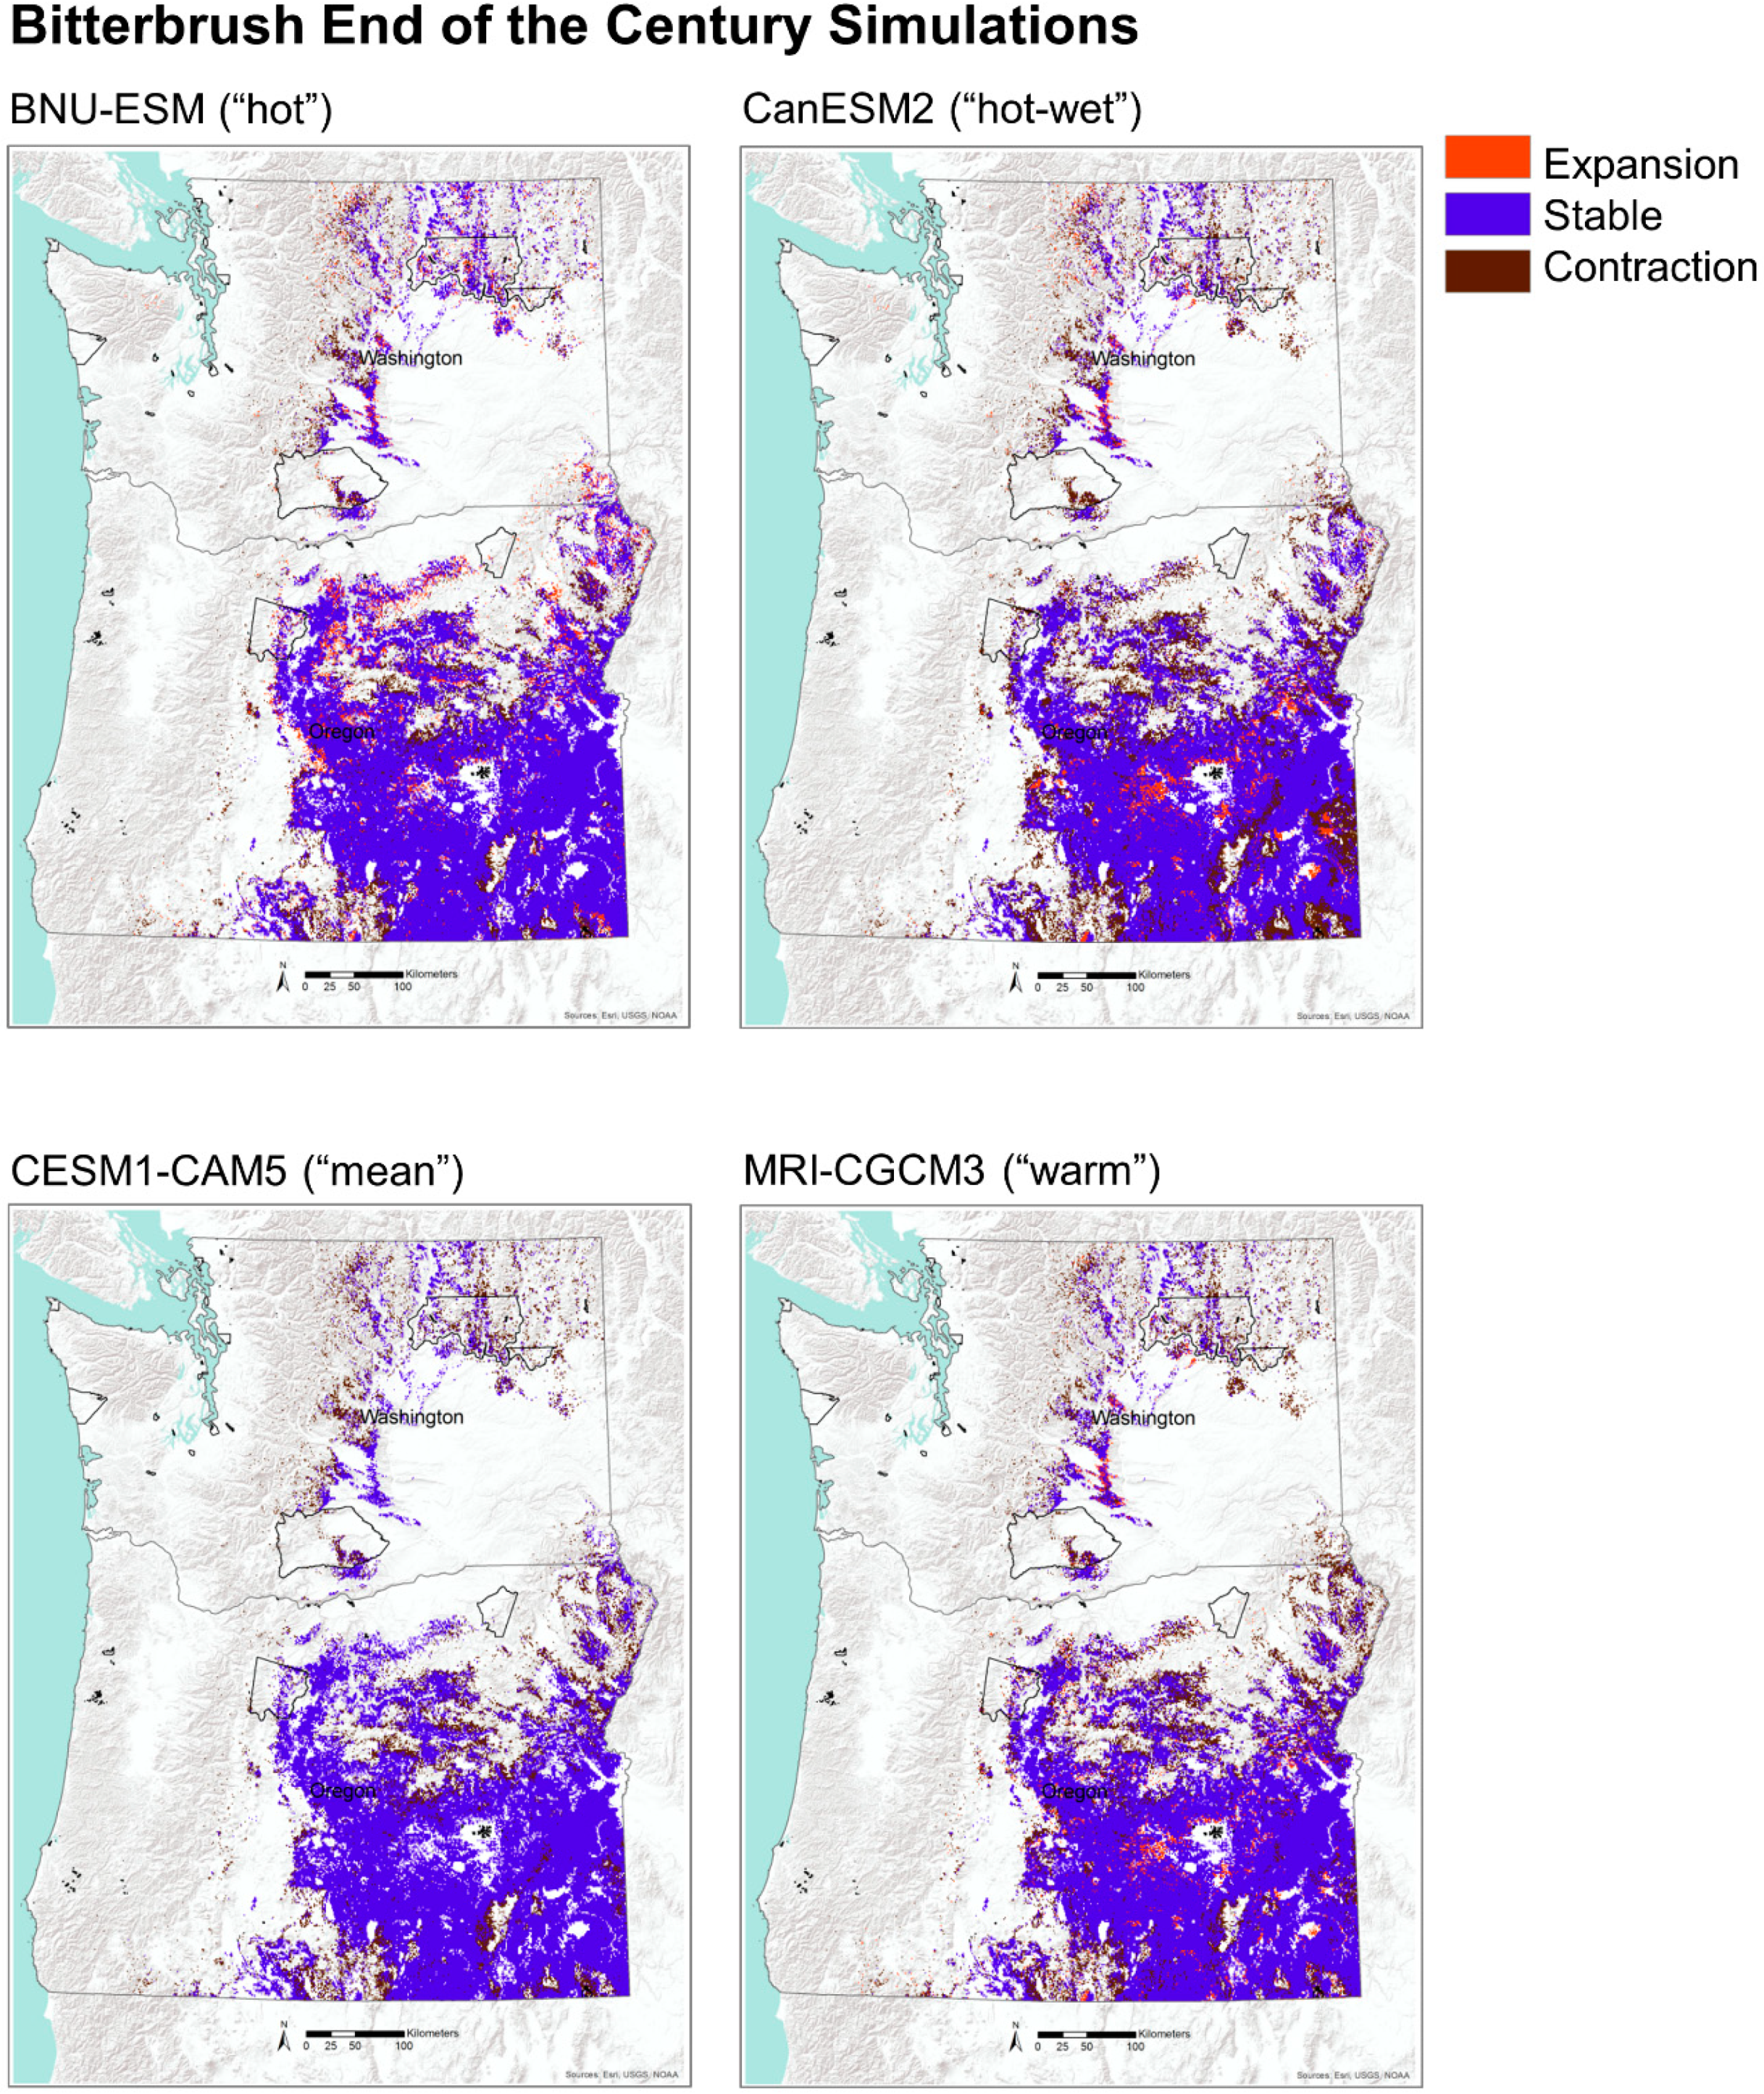
Potential habitat for bitterbrush consists of coniferous woodlands and shrub steppe, two vegetation types that are projected to decline 12% by midcentury and 20% by the end of the century (Table 2, Figure 7). As identified above, coniferous woodlands are projected to be displaced by coniferous forests throughout much of their historical extent in Washington and Oregon. Locations that may experience the most pronounced changes are areas surrounding the Columbia Basin in Washington and Oregon and in southern Oregon (Figure 3 and Figure 4). Interestingly, potential habitat for bitterbrush is projected to increase by 6% by midcentury but then disappear by the end of the century, illustrating the dynamic nature of plant productivity and fire effects within woodlands and shrublands. Areas that are projected to remain as suitable habitat for bitterbrush are located mostly in arid southwestern Oregon and on the eastern portion of the Columbia Basin.
4. Discussion
Our results demonstrate a generalizable approach of applying DGVM data to assess climate change vulnerability of tribally important species that provide important ecosystem services. This assessment is focused in the Pacific Northwest; however, it could be applied in other areas if model data is available. Our approach of identifying important species and resources, relating those to vegetation model projections, identifying appropriate timelines and climate scenarios, and assessing future changes could be applied by others, with alternative data or models, and in different areas. As might be expected, we found that the individual ecosystem services identified by our stakeholders may be impacted quite differently from one another, reflecting the widely recognized perception that there will be “winners” and “losers” associated with climate change [62]. Species that are associated with more southern and/or dry vegetation types, such as dry coniferous forests, subtropical forests, warm mixed forests, and dry shrub steppe, were projected to expand their potential habitats. While some of these vegetation types might be vulnerable at the trailing edge of their distributions, they may have new potential habitat to offset these losses, allowing expansion along the leading edge [63]. These potential “winner” vegetation types may include a number of culturally important trees such as ponderosa pine (Pinus ponderosa Douglas ex C.Lawson) and California black oak (Quercus kelloggii Newberry), and understory plants including horsetail (Equisetum arvense L.), Oregon grape (Mahonia aquifolium (Pursh) Nutt.), and pipsissewa (Chimaphila umbellate (L.) Barton). Recent trends in global land cover, particularly along the western coast of North America, also support the expansion of some temperate forest types in recent decades [64]. An increase in the overall potential habitat for forest types may lead to enhanced timber production in some parts of the region, a pattern supported by recent modeling efforts [33]. However, while some vegetation types may expand in the future, they will be located in different areas, and these areas might be outside tribal reservations, or be higher in elevation or have limited public access. Our assessment did not include these types of potential impacts related to future migration patterns. We also recognize that projections from alternative GCMs may result in different species-specific interpretations.
Our results also indicate there may be important “losers” for tribally important species that provide important ecosystem services. For instance, we found that species that are associated with high elevation and cool, moist forest types were projected to decline in potential habitat. High elevation and subalpine vegetation types have short growing seasons and receive much of their precipitation in the form of snow. Our results show that warming temperature and declining snowpack within these vegetation types will negatively impact some species. This finding is widely supported by other studies drawing on empirically derived data, including common garden warming experiments. One such study demonstrated that the establishment or new seedling growth of some high-elevation species, such as Engelmann spruce (Picea engelmannii Parry ex Engelm.), was adversely affected by warming [65]. Others have also documented a decrease in the establishment of high-elevation fir and spruce across their distribution coinciding with recent warming and declining snowpack [66]. A poignant example of a declining high elevation species is whitebark pine (Pinus albicaulis Engelm.), which plays an important role in maintaining biodiversity and ecosystem functions at high elevations [67,68]. The compounding effects of white pine blister rust (Cronartium ribicola J.C.Fisch.), mountain pine beetles (Dendroctonus ponderosae), fire exclusion, and climate change have contributed to range-wide decline of whitebark pine [68]. There are many tribally important species associated with subalpine forests, including important first foods. Our results show that subalpine forests are projected to shrink by an average of 94% across the study area by the end of the century. The dramatic loss of this vegetation type is largely due to warming temperatures and the subsequent displacement by lower elevation temperate forest types that are able to outcompete subalpine forests for nutrients and water, a pattern that has occurred in the past during low snowpack years [53,54].
In general, driving mechanisms for many of the potential changes in vegetation and ecosystems services that we present vary by vegetation type and GCM climate projection. However, much of these changes can be attributed to a novel lengthening of the growing season due to warming temperatures coupled with increased precipitation in spring and fall [28,69]. MC2’s vegetation productivity algorithm also accounts for the carbon fertilization effect from increasing carbon dioxide concentrations in the future, which can lead to increased plant growth when temperatures are not beyond the photosynthetic optimum and when soil water availability is adequate [70,71,72]. These factors largely explain the simulation output showing southern and lower elevation vegetation types displacing northern and higher elevation types, and the expansion of warm and mixed forest types in the western part of the region, a trend supported by other studies [28,69,73,74]. By contrast, the projected decline of the temperate shrub steppe vegetation type is largely the result of declining summer soil moisture and a displacement by dry shrub steppe [75].
Using our examples for huckleberry and bitterbrush, we demonstrate how data from a DGVM could be used to inform potential changes to specific ecosystem services and to prioritize appropriate adaptation options. Our DGVM informed projections of vegetation change indicate that huckleberry habitat at midelevation in the Cascade Range may remain potentially suitable in the future, a trend supported by other studies [76]. However, we did not distinguish individual huckleberry species and recognize that high-elevation species, such as Cascade bilberry (Vaccinium deliciosum Piper), may be significantly impacted because of the projected displacement of subalpine habitats. In addition, our results do not provide information about berry production, a key factor in relation to Native American use [77]. Nevertheless, our findings have strong implications for both huckleberries and bitterbrush management by identifying and protecting habitat that is projected to remain potentially suitable under multiple future climate scenarios, a well-accepted adaptation strategy [78]. These stable locations may be prime areas to ensure adequate resource protection by limiting heavy recreational uses and impacts [79]. For example, managers could increase the regulation of huckleberry harvesting in some areas, a tactic that has been recently implemented in parts of British Columbia, Canada [80]. Our results can also be used to prioritize monitoring of areas that are projected to contract in the future. For instance, monitoring using remote-sensed data has been used to track the health and productivity of other species [81]. If huckleberry and bitterbrush do disappear from these locations, identifying the drivers of that disappearance would be informative to future modeling and restoration efforts [82]. Lastly, areas that are projected to expand in potential habitat may offer opportunities for experimental planting or restoration strategies [78,81]. Many of these areas were identified east of the Cascade Range, and are located in transition zones or ecotones between forests and woodlands.
Adaptation strategies should consider management objectives, organizational capacity, and spatial and temporal scales [83], but can also specifically focus on increasing the resistance and resilience of ecosystems and individual species, such as huckleberry [84]. For example, under consultation with local tribes, resource managers (both tribal and nontribal) may increase habitat protection in high-value areas or apply forest management activities, such as selective thinning or prescribed burning, to promote desired species composition and forest structure [78,84,85]. These actions are warranted in response to our study results, which find that moist coniferous forests found west of the Cascade Range may be displaced by warm mixed (deciduous and evergreen) and subtropical mixed (California deciduous and evergreen) forests, a trend also identified by others [73,74]. This trend is also generally consistent with the paleoecological evidence, which shows that as the climate warmed during the early Holocene, Douglas-fir (Pseudotsuga menziesii (Mirbel) Franco), red alder (Alnus rubra Bong.) and oak species replaced spruce and pine at lower elevations in the Coast Range and Western Cascades [86,87,88,89,90]. On drier sites, an increase in the frequency of fire during warmer periods has also been shown to favor species such as Douglas-fir and lodgepole pine (Pinus contorta Douglas) [86,91]. The frequency and severity of these disturbances and their resulting effects could have substantial impacts on huckleberry habitat and productivity [92].
Studies exploring the impacts of future climate change must confront enormous uncertainties. The largest source of uncertainty are the climate change scenarios themselves, as the socioeconomic path and mitigation policies to be taken by societies around the globe are unknown. The representative concentration pathways (RCPs) are not associated with any probabilities. After many discussions with our stakeholders, we chose to use RCP8.5 in this study because it represents a future with high population growth, high energy demand, and the absence of climate change mitigation policies [93], and serves as a high warming reference scenario. Moreover, GCMs themselves engender further uncertainties, as each GCM has its biases and errors. GCM-based uncertainty is demonstrated by the large degree of variability in the direction of change by some of the individual MC2 vegetation types, such as shrub steppe, coniferous woodlands and moist coniferous forest (see Figure 5). An additional source of uncertainty is the downscaling method used to obtain fine-scale climate grids from the coarser GCM outputs. As such, the projected changes in potential natural vegetation types are a result of multiple factors, including greenhouse gas concentrations and climate model biases. In light of these uncertainties, the strategic selection of the four GCMs we used provides a framework for exploring a possible range of climate change impacts, rather than an intent to predict a probable outcome.
Our approach of using DGVM model output to assess climate change impacts on ecosystem services is illustrated by using one vegetation model—MC2. Although we demonstrate an early attempt of linking DGVM model output with many tribally important ecosystem services, there are other models available (e.g., LPJ-GUESS [74]). As with other vegetation models, MC2 does not simulate all possible ecological processes. In particular, MC2 does not simulate dispersal processes, genetic adaptation, or phenotypic plasticity, leaving many opportunities for improvements. MC2 does incorporate fire disturbances, but does not consider other important disturbance processes, such as insect and disease outbreaks, which may interact with fire and exacerbate forest mortality [94]. MC2 does not incorporate anthropogenic disturbances, which may result in different patterns of vegetation than potential natural vegetation simulations. MC2 may also underestimate drought effects, as it does not specifically simulate plant hydraulics and the adverse effects of drought effects on them. Subsequently, MC2 may overestimate forest expansion into shrublands and shrub steppe under some climate scenarios. There are also important uncertainties associated with linking DGVM vegetation types with individual species. For instance, it is unlikely that the entire extent of a vegetation type would be suitable for a given species. Future projections may, therefore, over or underestimate actual potential habitat. Future research could apply additional information, such as soils data and known temperature thresholds, and could be used to constrain the distribution of species [95].
5. Conclusions
Climate change is already affecting a wide range of tribally important ecosystem goods and services, including food, water, medicine, spiritual needs, and cultural identity. In this study, we have demonstrated a generalizable approach that identified 78 tribally important ecosystem services and have related them with biologically relevant vegetation projections from a DGVM. Although we focused our assessment in the Pacific Northwest, our approach can be applied in other regions for which model data is available. We recognize that there is some inherent uncertainty associated with using model output for future scenario planning; however, if that uncertainty is addressed and applied as demonstrated by our approach, it can then be explored to help inform resource management and adaptation planning.
Supplementary Materials
The following are available online at https://0-www-mdpi-com.brum.beds.ac.uk/1999-4907/11/6/618/s1, Table S1: Vegetation and ecosystem service guide with MC2 vegetation types and related ecosystem resources and species.
Author Contributions
Conceptualization, M.J.C., J.B.K. and B.K.K.; Data curation, M.J.C. and J.B.K.; Formal analysis, M.J.C.; Funding acquisition, M.J.C., J.B.K. and B.K.K.; Investigation, M.J.C.; Methodology, M.J.C., J.B.K. and B.K.K.; Project administration, M.J.C.; Resources, M.J.C., J.B.K. and B.K.K.; Software, M.J.C.; Supervision, M.J.C., J.B.K. and B.K.K.; Validation, M.J.C. and J.B.K.; Visualization, M.J.C.; Writing–original draft, M.J.C.; Writing–review & editing, M.J.C., J.B.K. and B.K.K. All authors have read and agreed to the published version of the manuscript.
Funding
This work was partially funded by grants from the U.S.D.A. Forest Service Climate Hub and The Pacific Northwest Research Stations Research for Underserved Communities Fund [grant number AG04T0C160044].
Acknowledgments
We are thankful for the help and advice of the following individuals: Janean Creighton, Carrie Berger, Kathy Lynn, Eliza Ghitis, Robert Compton, Stacy Schumacher, Scott Hauser, David Redhorse, Anna Schmidt, Meagan Flier, Bill Fish, Jonathan Treasurer, Samantha Chisholm Hatfield, Seth Book, Josh Meidav, Preston Hardison, Robert Jones, Holly Prendeville, Jason Kesling, Amanda Schachtschneider, Mike Chang, and Amelia Marchand. We are truly grateful to Carole Guizzetti for help with the map figures. And thank you to Jorge Tomasevic for assistance with an early draft of this manuscript. John B. Kim is supported in part by the USDA Forest Service Western Wildland Environmental Threat Assessment Center.
Conflicts of Interest
The authors declare no conflict of interest. The funders had no role in the design of the study; in the collection, analyses, or interpretation of data; in the writing of the manuscript, or in the decision to publish the results.
Appendix A
Figure A1.
Stakeholder Workshop Agenda, 12 October 2017, Tacoma, WA.


Table A1.
Tribally important ecosystem. services and species.
| Ecosystem Service | Common Name | Scientific Name |
|---|---|---|
| First Foods & Medicinal Plants | ||
| Huckleberries | Vaccinium spp. | |
| Horsetail | Equisetum arvense L. | |
| Ferns | Polypodiophyta | |
| Salal | Gaultheria shallon Pursh | |
| Grass | Poaceae | |
| Kinnikinnick | Arctostaphylos uva-ursi (L.) Spreng. | |
| Oregon grape | Mahonia aquifolium (Pursh) Nutt. | |
| Foxglove | Digitalis purpurea L. | |
| Pipsissewa | Chimaphila umbellate (L.) Barton | |
| Stinging nettle | Urtica dioica L. | |
| Camas | Camassia quamash (Pursh) Greene | |
| Yarrow | Achillea millefolium L. | |
| Devil’s club | Oplopanax horridus (Sm.) Miq. | |
| Timber production & culturally significant trees | ||
| Western redcedar | Thuja plicata Donn ex D.Don | |
| Sitka spruce | Picea sitchensis (Bong.) Carr. | |
| Garry oak | Quercus garryana Douglas ex Hook. | |
| Douglas-fir | Pseudotsuga menziesii (Mirbel) Franco | |
| Ponderosa pine | Pinus ponderosa Douglas ex C.Lawson | |
| Lodgepole pine | Pinus contorta Douglas | |
| Western white pine | Pinus monticola Douglas ex D. Don | |
| Pacific madrone | Arbutus menziesii Pursh | |
| Pacific silver fir | Abies amabilis Douglas ex J.Forbes | |
| Western hemlock | Tsuga heterophylla (Raf.) Sarg. | |
| Pacific yew | Taxus brevifolia Nutt. | |
| Port Orford cedar | Chamaecyparis lawsoniana (A. Murray) Parl. | |
| Aridland plants | ||
| Big sagebrush | Artemisia tridentate Nutt. | |
| Western juniper | Juniperus occidentalis Hook. | |
| Antelope bitterbrush | Purshia tridentate (Pursh) DC. | |
| Mammals | ||
| Beaver | Castor canadensis | |
| Yellow-bellied marmot | Marmota flaviventris | |
| American marten | Martes americana | |
| Canada lynx | Lynx canadensis | |
| Black bear | Ursus americanus | |
| Mountain goat | Oreamnos americanus | |
| Black-tailed deer | Odocoileus hemionus columbianus | |
| Mule deer | Odocoileus hemionus | |
| Elk | Cervus canadensis | |
| White-tailed deer | Odocoileus virginianus | |
| Western spotted skunk | Spilogale gracilis | |
| Long-tailed weasel | Mustela frenata | |
| Black-tailed jackrabbit | Lepus californicus | |
| Mountain lion | Puma concolor | |
| Bobcat | Lynx rufus | |
| Fisher | Pekania pennati | |
| Northern pocket gopher | Thomomys talpoides | |
| Northern flying squirrel | Glaucomys sabrinus | |
| Muskrat | Ondatra zibethicus | |
| Northern river otter | Lontra canadensis | |
| Merriam’s ground squirrel | Urocitellus canus | |
| Hoary bat | Lasiurus cinereus | |
| Silver-haired bat | Lasionycteris noctivagans | |
| Desert woodrat | Neotoma lepida | |
| Amphibian | ||
| Columbia spotted frog | Rana luteiventris | |
| Birds | ||
| Canada goose | Branta canadensis | |
| Bald eagle | Haliaeetus leucocephalus | |
| American pipit | Anthus rubescens | |
| Cassin’s finch | Haemorhous cassinii | |
| Gray-crowned rosy-finch | Leucosticte tephrocotis | |
| Marbled murrelet | Brachyramphus marmoratus | |
| Northern goshawk | Accipiter gentilis | |
| Rufous hummingbird | Selasphorus rufus | |
| Great gray owl | Strix nebulosa | |
| Brown creeper | Certhia americana | |
| Lewis’ woodpecker | Melanerpes lewis | |
| Northern pygmy owl | Glaucidium californicum | |
| Steller’s jay | Cyanocitta stelleri | |
| Osprey | Pandion haliaetus | |
| Mountain chickadee | Poecile gambeli | |
| White-faced ibis | Plegadis chihi | |
| Northern flicker | Colaptes auratus | |
| Gray jay | Perisoreus canadensis | |
| Golden eagle | Aquila chrysaetos | |
| Brewer’s sparrow | Spizella breweri | |
| Greater sage grouse | Centrocercus urophasianus | |
| Pileated woodpecker | Dryocopus pileatus | |
| American three-toed woodpecker | Picoides dorsalis | |
| Grazing quality | N/A | N/A |
Appendix B
Table A2.
Tribally important ecosystem services and their relative change in habitat as related to MC2 vegetation types for the end of the century (2070–2099) for the mean GCM (CESM1-CAM5).
Table A2.
Tribally important ecosystem services and their relative change in habitat as related to MC2 vegetation types for the end of the century (2070–2099) for the mean GCM (CESM1-CAM5).
| Ecosystem Services | Relative Change in Habitat |
|---|---|
| First Foods & Medicinal Plants | |
| Huckleberries | −1 |
| Grass | −1 |
| Salal | 0 |
| Kinnikinnick | 0 |
| Foxglove | 0 |
| Stinging nettle | 0 |
| Devil’s club | 0 |
| Yarrow | 1 |
| Horsetail | 2 |
| Oregon grape | 2 |
| Pipsissewa | 2 |
| Camas | 2 |
| Ferns | 3 |
| Timber production & culturally significant trees | |
| Pacific silver fir | −1 |
| Ponderosa pine | 0 |
| Lodgepole pine | 0 |
| Port Orford Cedar | 0 |
| Western redcedar | 1 |
| Sitka spruce | 1 |
| Garry oak | 1 |
| Douglas-fir | 1 |
| Western hemlock | 1 |
| Pacific yew | 1 |
| Timber productivity | 2 |
| Western white pine | 2 |
| Pacific madrone | 2 |
| Aridland plants | |
| Sagebrush | −1 |
| Juniper | −1 |
| Antelope bitterbrush | −1 |
| Mammals & amphibians | |
| Northern pocket gopher | −4 |
| Black bear | −3 |
| Long-tailed weasel | −3 |
| Black-tailed jackrabbit | −3 |
| Merriam’s ground squirrel | −3 |
| Desert woodrat | −3 |
| Mountain goat | −2 |
| Western spotted skunk | −2 |
| Bobcat | −2 |
| Muskrat | −2 |
| Yellow-bellied marmot | −1 |
| Canada lynx | −1 |
| Elk | −1 |
| White-tailed deer | −1 |
| Northern river otter | −1 |
| Silver-haired bat | −1 |
| Beaver | 0 |
| American marten | 0 |
| Black-tailed deer | 0 |
| Mule deer | 0 |
| Mountain lion | 0 |
| Hoary bat | 0 |
| Columbia spotted frog | 1 |
| Fisher | 1 |
| Northern flying squirrel | 1 |
| Birds | |
| Golden eagle | −5 |
| Gray-crowned rosy-finch | −4 |
| American pipit | −3 |
| Northern goshawk | −3 |
| Steller’s jay | −3 |
| Osprey | −3 |
| Brewer’s sparrow | −3 |
| Cassin’s finch | −2 |
| Marbled murrelet | −2 |
| Mountain chickadee | −2 |
| Northern flicker | −2 |
| Greater sage grouse | −2 |
| Canada goose | −1 |
| Rufous hummingbird | −1 |
| Northern pygmy owl | −1 |
| White-faced ibis | −1 |
| Gray jay | −1 |
| Bald eagle | 0 |
| Great gray owl | 0 |
| Brown creeper | 0 |
| Lewis’ woodpecker | 0 |
| Pileated woodpecker | 0 |
| American three-toed woodpecker | 1 |
| Grazing quality | −3 |
Appendix C
Figure A2.
Projected potential suitable habitat for huckleberry and bitterbrush based on four GCM simulations for mid and end of century under RCP 8.5. Tribal reservations are delineated with black polygons.
Figure A2.
Projected potential suitable habitat for huckleberry and bitterbrush based on four GCM simulations for mid and end of century under RCP 8.5. Tribal reservations are delineated with black polygons.


References
- Parmesan, C. Ecological and Evolutionary Responses to Recent Climate Change. Annu. Rev. Ecol. Evol. Syst. 2006, 37, 637–669. [Google Scholar] [CrossRef] [Green Version]
- Parmesan, C.; Yohe, G. A globally coherent fingerprint of climate change impacts across natural systems. Nature 2003, 421, 37–42. [Google Scholar] [CrossRef] [PubMed]
- Romero-Lankao, P.; Smith, J.B.; Davidson, D.J.; Diffenbaugh, N.S.; Kinney, P.L.; Kirshen, P.; Kovacs, P.; Villers Ruiz, L. North America. In Climate Change 2014 Impacts, Adaptation, and Vulnerability. Part B: Regional Aspects. Contribution of Working Group II to the Fifth Assessment Report of the Intergovernmental Panel on Climate Change; Barros, V.C., Field, C.B., Dokken, D.J., Mastrandrea, M.D., Mach, K.J., Bilir, T.E., Chatterjee, M., Ebi, K.L., Estrada, Y.O., Genova, R.C., et al., Eds.; Cambridge University Press: Cambridge, UK; New York, NY, USA, 2014; pp. 1439–1498. [Google Scholar]
- Scheffers, B.R.; Meester, L.D.; Bridge, T.C.L.; Hoffmann, A.A.; Pandolfi, J.M.; Corlett, R.T.; Butchart, S.H.M.; Pearce-Kelly, P.; Kovacs, K.M.; Dudgeon, D.; et al. The broad footprint of climate change from genes to biomes to people. Science 2016, 354. [Google Scholar] [CrossRef] [PubMed]
- Seidl, R.; Spies, T.A.; Peterson, D.L.; Stephens, S.L.; Hicke, J.A. REVIEW: Searching for resilience: Addressing the impacts of changing disturbance regimes on forest ecosystem services. J. Appl. Ecol. 2016, 53, 120–129. [Google Scholar] [CrossRef] [Green Version]
- Westerling, A.L.; Turner, M.G.; Smithwick, E.A.H.; Romme, W.H.; Ryan, M.G. Continued warming could transform Greater Yellowstone fire regimes by mid-21st century. Proc. Natl. Acad. Sci. USA 2011, 108, 13165–13170. [Google Scholar] [CrossRef] [Green Version]
- Littell, J.S.; McKenzie, D.; Peterson, D.L.; Westerling, A.L. Climate and wildfire area burned in western US ecoprovinces, 1916–2003. Ecol. Appl. 2009, 19, 1003–1021. [Google Scholar] [CrossRef]
- Chen, I.C.; Hill, J.K.; Ohlemuller, R.; Roy, D.B.; Thomas, C.D. Rapid Range Shifts of Species Associated with High Levels of Climate Warming. Science 2011, 333, 1024–1026. [Google Scholar] [CrossRef]
- Kelly, A.E.; Goulden, M.L. Rapid shifts in plant distribution with recent climate change. Proc. Natl. Acad. Sci. USA 2008, 105, 11823–11826. [Google Scholar] [CrossRef] [Green Version]
- Beckage, B.; Osborne, B.; Gavin, D.G.; Pucko, C.; Siccama, T.; Perkins, T. A rapid upward shift of a forest ecotone during 40 years of warming in the Green Mountains of Vermont. Proc. Natl. Acad. Sci. USA 2008, 105, 4197–4202. [Google Scholar] [CrossRef] [Green Version]
- Iverson, L.; McKenzie, D. Tree-species range shifts in a changing climate: Detecting, modeling, assisting. Landsc. Ecol. 2013, 28, 879–889. [Google Scholar] [CrossRef]
- Abu-Asab, M.S.; Peterson, P.M.; Shetler, S.G.; Orli, S.S. Earlier plant flowering in spring as a response to global warming in the Washington, DC, area. Biodivers. Conserv. 2001, 10, 597–612. [Google Scholar] [CrossRef]
- Buitenwerf, R.; Rose, L.; Higgins, S.I. Three decades of multi-dimensional change in global leaf phenology. Nat. Clim. Chang. 2015, 5, 364–368. [Google Scholar] [CrossRef]
- Cayan, D.R.; Kammerdiener, S.A.; Dettinger, M.D.; Caprio, J.M.; Peterson, D.H. Changes in the onset of spring in the western United States. Bull. Am. Meteorol. Soc. 2001, 82, 399–415. [Google Scholar] [CrossRef] [Green Version]
- Primack, D.; Imbres, C.; Primack, R.B.; Miller-Rushing, A.J.; Del Tredici, P. Herbarium specimens demonstrate earlier flowering times in response to warming in Boston. Am. J. Bot. 2004, 91, 1260–1264. [Google Scholar] [CrossRef] [PubMed]
- Cordalis, D.; Suagee, D.B. The effects of climate change on American Indian and Alaska native tribes. Nat. Resour. Environ. 2008, 22, 45–49. [Google Scholar]
- Lynn, K.; Daigle, J.; Hoffman, J.; Lake, F.; Michelle, N.; Ranco, D.; Viles, C.; Voggesser, G.; Williams, P. The impacts of climate change on tribal traditional foods. Clim. Chang. 2013, 120, 545–556. [Google Scholar] [CrossRef]
- Lynn, K.; MacKendrick, K.; Donoghue, E.M. Social Vulnerability and Climate Change: Synthesis of Literature; US Department of Agriculture, Forest Service, Pacific Northwest Research Station: Portland, OR, USA, 2011; p. 70. [Google Scholar]
- USDI BIA. Indian Entities Recognized and Eligible to Receive Services from the United States Bureau of Indian Affairs. Fed. Regist. 2018, 83, 4235–4236. [Google Scholar]
- Bennett, T.B.; Maynard, N.G.; Cochran, P.; Gough, R.; Lynn, K.; Maldonado, J.; Voggesser, G.; Wotkyns, S.; Cozzetto, K.C. 12: Indigenous peoples, lands, and resources. In Climate Change Impacts in the United States: The Third National Climate Assessment; Melillo, J.M., Richmond, T.C., Yohe, G.W., Eds.; US Global Change Research Program: Washington, DC, USA, 2014; pp. 297–317. [Google Scholar]
- Millennium Ecosystem Assessment. Ecosystems and Human Well-Being: Synthesis; Island Press: Washington, DC, USA, 2005; Volume 5. [Google Scholar]
- Fisher, B.; Turner, R.K.; Morling, P. Defining and classifying ecosystem services for decision making. Ecol. Econ. 2009, 68, 643–653. [Google Scholar] [CrossRef] [Green Version]
- Dalton, M.; Chisholm Hatfield, S.; Mote, P.; Sharp, D.; Serafin, K.; Ruggiero, P.; Cohn, N.; Conlin, M.; Reeves, G.; Benda, L.; et al. Climate Change Vulnerability Assessment for the Treaty of Olympia Tribes. A Report to the Quinault Indian Nation, Hoh Tribe, and Quileute Tribe Prepared; The Oregon Climate Change Research Institute, Oregon State University: Corvallis, OR, USA, 2016; p. 231. [Google Scholar]
- Petersen, S.; Bell, J.; Hauser, S.; Morgan, H.; Krosby, M.; Rudd, D.; Sharp, D.; Dello, K.; Whitley Binder, L. Upper Snake River Climate Change Vulnerability Assessment; Upper Snake River Tribes Foundation and Member Tribes: Boise, ID, USA, 2017. [Google Scholar]
- Gunther, E. Ethnobotany of Western Washington: The Knowledge and Use of Indigenous Plants by Native Americans; University of Washington Press: Seattle, WA, USA, 1973; Volume 10. [Google Scholar]
- Bachelet, D.; Johnson, B.R.; Bridgham, S.D.; Dunn, P.V.; Anderson, H.E.; Rogers, B.M. Climate Change Impacts on Western Pacific Northwest Prairies and Savannas. Northwest Sci. 2011, 85, 411–429. [Google Scholar] [CrossRef]
- Devine, W.; Aubry, C.; Miller, J.; Potter, K.; Bower, A. Climate Change and Forest Trees in the Pacific Northwest: Guide to Vulnerability Assessment Methodology; U.S. Department of Agriculture, Forest Service, Pacific Northwest Region: Olympia, WA, USA, 2012; pp. 1–49. [Google Scholar]
- Halofsky, J.E.; Peterson, D.L.; Ho, J.J. Climate Change Vulnerability and Adaptation in South-Central Oregon; Gen. Tech. Rep. PNW-GTR-974; US Department of Agriculture, Forest Service, Pacific Northwest Research Station: Portland, OR, USA, 2019; p. 473. [Google Scholar]
- Raymond, C.L.; Peterson, D.L.; Rochefort, R.M. Climate Change Vulnerability and Adaptation in the North Cascades Region, Washington; Gen. Tech. Rep. PNW-GTR-892; US Department of Agriculture, Forest Service, Pacific Northwest Research Station: Portland, OR, USA, 2014; p. 279. [Google Scholar]
- WDFW. Washington’s State Wildlife Action Plan: 2015 Update; Washington Department of Fish and Wildlife: Olympia, WA, USA, 2015. [Google Scholar]
- Krosby, M.; Morgan, H.; Case, M.; Whitely Binder, L. Stillaguamish Tribe Natural Resources Climate Change Vulnerability Assessment; Climate Impacts Groups, University of Washington: Seattle, WA, USA, 2016. [Google Scholar]
- Krosby, M.; Morgan, H. Colville Tribes Natural Resources Climate Change Vulnerability Assessment; Climate Impacts Group, University of Washington: Seattle, WA, USA, 2018. [Google Scholar]
- Case, M.J.; Kerns, B.K.; Kim, J.B.; Eglitis, A.; Simpson, M.L.; Beck, J.; Grenier, K.; Riegel, G. Impacts and Variability of Climate Change on Vegetation; Gen. Tech. Rep. PNW-GTR-974; US Department of Agriculture, Forest Service, Pacific Northwest Research Station: Portland, OR, USA, 2019; p. 476.
- Beier, P.; Hansen, L.J.; Helbrecht, L.; Behar, D. A how-to guide for coproduction of actionable science. Conserv. Lett. 2017, 10, 288–296. [Google Scholar] [CrossRef]
- French, D.H. Ethnobotany of the pacific Northwest Indian. Econ. Bot. 1965, 19, 378–382. [Google Scholar] [CrossRef]
- Rupp, D.E.; Abatzoglou, J.T.; Hegewisch, K.C.; Mote, P.W. Evaluation of CMIP5 20th century climate simulations for the Pacific Northwest USA. J. Geophys. Res. Atmos. 2013, 118, 10–884. [Google Scholar] [CrossRef]
- Van Vuuren, D.P.; Edmonds, J.; Kainuma, M.; Riahi, K.; Thomson, A.; Hibbard, K.; Hurtt, G.C.; Kram, T.; Krey, V.; Lamarque, J.-F. The representative concentration pathways: An overview. Clim. Chang. 2011, 109, 5. [Google Scholar] [CrossRef]
- Bachelet, D.; Lenihan, J.M.; Daly, C.; Neilson, R.P.; Ojima, D.S.; Parton, W.J. MC1: A Dynamic Vegetation Model for Estimating the Distribution of Vegetation and Associated Carbon, Nutrients, and Water—Technical Documentation. Version 1.0; Gen. Tech. Rep. PNW-GTR-508; US Department of Agriculture, Forest Service, Pacific Northwest Research Station: Portland, OR, USA, 2001; p. 95.
- Conklin, D.R.; Lenihan, J.M.; Bachelet, D.; Neilson, R.P.; Kim, J.B. MCFire Model Technical Description; Gen. Tech. Rep. PNW-GTR-926; US Department of Agriculture, Forest Service, Pacific Northwest Research Station: Portland, OR, USA, 2016; p. 75.
- Thrasher, B.; Xiong, J.; Wang, W.; Melton, F.; Michaelis, A.; Nemani, R. Downscaled climate projections suitable for resource management. Eos Trans. Am. Geophys. Union 2013, 94, 321–323. [Google Scholar] [CrossRef]
- Taylor, K.E.; Stouffer, R.J.; Meehl, G.A. An Overview of CMIP5 and the Experiment Design. Bull. Am. Meteorol. Soc. 2012, 93, 485–498. [Google Scholar] [CrossRef] [Green Version]
- Daly, C.; Taylor, G.H.; Gibson, W.P.; Parzybok, T.W.; Johnson, G.L.; Pasteris, P.A. High-Quality Spatial Climate Data Sets for the United States and Beyond. Trans. Am. Soc. Agric. Eng. 2000, 43, 1957–1962. [Google Scholar] [CrossRef] [Green Version]
- IPCC. Climate Change 2013: The Physical Science Basis; Stocker, T.F., Qin, D., Plattner, G.-K., Tignor, M., Allen, S.K., Boschung, J., Nauels, A., Xia, Y., Bex, V., Midgley, P.M., Eds.; Cambridge University Press: Cambridge, UK, 2013. [Google Scholar]
- Vano, J.A.; Kim, J.B.; Rupp, D.E.; Mote, P.W. Selecting climate change scenarios using impact-relevant sensitivities. Geophys. Res. Lett. 2015, 42, 5516–5525. [Google Scholar] [CrossRef] [Green Version]
- Halofsky, J.E.; Peterson, D.L. Climate Change Vulnerability and Adaptation in the Blue Mountains; Gen. Tech. Rep. PNW-GTR-939; US Department of Agriculture, Forest Service, Pacific Northwest Research Station: Portland, OR, USA, 2017; p. 344.
- Kuchler, A.M. Potential natural vegetation of the conterminous United States. Am. Geogr. Soc. Spec. Publ. 1964, 36, 1–38. [Google Scholar] [CrossRef]
- Drapek, R.; Kim, J.B.; Neilson, R.P. The Dynamic General Vegetation Model MC1 over the United States and Canada at a 5-Arcminute Resolution: Model Inputs and Outputs; Gen. Tech. Rep. PNW-GTR-904; US Department of Agriculture, Forest Service, Pacific Northwest Research Station: Portland, OR, USA, 2015; p. 57.
- Johnson, D.H.; O’Neil, T.A. Wildlife-Habitat Relationships in Oregon and Washington; Oregon State University Press: Corvallis, OR, USA, 2001. [Google Scholar]
- Natureserve International Ecological Classification Standard: Terrestrial Ecological Classifications. NatureServe Central Databases: Arlington, VA, USA. Available online: http://explorer.natureserve.org/classeco.htm (accessed on 23 October 2017).
- Kerns, B.K.; Susan, J.A.; Bailey, J.D. Huckleberry Abundance, Stand Conditions, and Use in Western Oregon: Evaluating the Role of Forest Management. Econ. Bot. 2004, 58, 668–678. [Google Scholar] [CrossRef]
- Minore, D. The Wild Huckleberries of Oregon and Washington—A Dwindling Resource; Res. Pap. PNW-RP-143; US Department of Agriculture, Forest Service, Pacific Northwest Research Station: Portland, OR, USA, 1972; p. 25.
- Nelson, L.H. (Ed.) Distribution and Recreational Harvest of Mountain Huckleberry “swədaʔx̌” in the Mount Baker-Snoqualmie National Forest; The Tulalip Tribes: Tulalip, WA, USA, 2015. [Google Scholar]
- Franklin, J.F.; Moir, W.H.; Douglas, G.W.; Wiberg, C. Invasion of Subalpine Meadows by Trees in the Cascade Range, Washington and Oregon. Arct. Alp. Res. 1971, 3, 215–224. [Google Scholar] [CrossRef] [Green Version]
- Zald, H.; Spies, T.; Huso, M.; Gatziolis, D. Climatic, landform, microtopographic, and overstory canopy controls of tree invasion in a subalpine meadow landscape, Oregon Cascades, USA. Landsc. Ecol. 2012, 27, 1197–1212. [Google Scholar] [CrossRef] [Green Version]
- Turner, N.J.; Bouchard, R.; Kennedy, D.I. Ethnobotany of the Okanagan-Colville Indians of British Columbia and Washington; British Columbia Provincial Museum: Victoria, Canada, 1980. [Google Scholar]
- Dyer, D.; O’Beck, R.; Noller, G.L. Plant Guide: Antelope Bitterbrush Purshia Tridentate (Pursh) DC 2018. Available online: https://plants.usda.gov/plantguide/pdf/pg_putr2.pdf (accessed on 16 January 2018).
- Billings, W.D. Ecological impacts of cheatgrass and resultant fire on ecosystems in the western Great Basin. In Proceedings–Ecology and Management of Annual Rangelands’; Monsen, S.B., Kitchen, S.G., Eds.; US Department of Agriculture, Forest Service, Pacific Northwest Research Station: Portland, OR, USA, 1992; pp. 22–30. [Google Scholar]
- Balch, J.K.; Bradley, B.A.; D’Antonio, C.M.; Gómez-Dans, J. Introduced annual grass increases regional fire activity across the arid western USA (1980–2009). Glob. Chang. Biol. 2013, 19, 173–183. [Google Scholar] [CrossRef] [PubMed]
- Bradley, B.A.; Curtis, C.A.; Fusco, E.J.; Abatzoglou, J.T.; Balch, J.K.; Dadashi, S.; Tuanmu, M.-N. Cheatgrass (Bromus tectorum) distribution in the intermountain Western United States and its relationship to fire frequency, seasonality, and ignitions. Biol. Invasions 2018, 20, 1493–1506. [Google Scholar] [CrossRef] [Green Version]
- Davies, K.W.; Nafus, A.M. Exotic annual grass invasion alters fuel amounts, continuity and moisture content. Int. J. Wildland Fire 2013, 22, 353–358. [Google Scholar] [CrossRef]
- Vanden Heuvel, B.; Rosatti, T.J. Purshia Tridentata. Available online: http://ucjeps.berkeley.edu/eflora/eflora_display.php?tid=77219 (accessed on 18 April 2019).
- O’Brien, K.L.; Leichenko, R.M. Double exposure: Assessing the impacts of climate change within the context of economic globalization. Glob. Environ. Chang. 2000, 10, 221–232. [Google Scholar] [CrossRef]
- Alexander, J.M.; Diez, J.M.; Levine, J.M. Novel competitors shape species’ responses to climate change. Nature 2015, 525, 515. [Google Scholar] [CrossRef]
- Song, X.-P.; Hansen, M.C.; Stehman, S.V.; Potapov, P.V.; Tyukavina, A.; Vermote, E.F.; Townshend, J.R. Global land change from 1982 to 2016. Nature 2018, 560, 639. [Google Scholar] [CrossRef]
- Kueppers, L.M.; Conlisk, E.; Castanha, C.; Moyes, A.B.; Germino, M.J.; De Valpine, P.; Torn, M.S.; Mitton, J.B. Warming and provenance limit tree recruitment across and beyond the elevation range of subalpine forest. Glob. Chang. Biol. 2017, 23, 2383–2395. [Google Scholar] [CrossRef] [Green Version]
- Andrus, R.A.; Harvey, B.J.; Rodman, K.C.; Hart, S.J.; Veblen, T.T. Moisture availability limits subalpine tree establishment. Ecology 2018, 99, 567–575. [Google Scholar] [CrossRef]
- Keane, R.E.; Tomback, D.F.; Aubry, C.A.; Bower, A.D.; Campbell, E.M.; Cripps, C.L.; Jenkins, M.B.; Mahalovich, M.F.; Manning, M.; McKinney, S.T.; et al. A Range-Wide Restoration Strategy for Whitebark Pine (Pinus albicaulis); Gen. Tech. Rep. RMRS-GTR-279; US Department of Agriculture, Forest Service, Rocky Mountain Research Station: Fort Collins, CO, USA, 2012; p. 108. [CrossRef]
- Tomback, D.F.; Achuff, P.; Schoettle, A.W.; Schwandt, J.W.; Mastrogiuseppe, R.J. The magnificent high-elevation five-needle white pines: Ecological roles and future outlook. In Proceedings of the Future of High-Elevation, Five-Needle White Pines in Western North America: Proceedings of the High Five Symposium. 28–30 June 2010; Proceedings RMRS-P-63, Keane Robert, E., Tomback Diana, F., Murray Michael, P., Smith Cyndi, M., Missoula, M.T., Eds.; US Department of Agriculture, Forest Service, Rocky Mountain Research Station: Fort Collins, CO, USA, 2011; pp. 2–28. [Google Scholar]
- Kim, J.B.; Kerns, B.K.; Drapek, R.J.; Pitts, G.S.; Halofsky, J.E. Simulating vegetation response to climate change in the Blue Mountains with MC2 dynamic global vegetation model. Clim. Serv. 2018, 10, 20–32. [Google Scholar] [CrossRef]
- Leakey, A.D.B.; Ainsworth, E.A.; Bernacchi, C.J.; Rogers, A.; Long, S.P.; Ort, D.R. Elevated CO2 effects on plant carbon, nitrogen, and water relations: Six important lessons from FACE. J. Exp. Bot. 2009, 60, 2859–2876. [Google Scholar] [CrossRef] [PubMed]
- Long, S.P.; Ainsworth, E.A.; Rogers, A.; Ort, D.R. Rising atmospheric carbon dioxide: Plants FACE the future. Annu. Rev. Plant Biol. 2004, 55, 591–628. [Google Scholar] [CrossRef] [PubMed]
- Saxe, H.; Cannell, M.G.R.; Johnsen, Ø.; Ryan, M.G.; Vourlitis, G. Tree and forest functioning in response to global warming. New Phytol. 2001, 149, 369–399. [Google Scholar] [CrossRef]
- Rogers, B.M.; Neilson, R.P.; Drapek, R.; Lenihan, J.M.; Wells, J.R.; Bachelet, D.; Law, B.E. Impacts of climate change on fire regimes and carbon stocks of the U.S. Pacific Northwest. J. Geophys. Res. 2011, 116, G03037. [Google Scholar] [CrossRef] [Green Version]
- Shafer, S.L.; Bartlein, P.J.; Gray, E.M.; Pelltier, R.T. Projected Future Vegetation Changes for the Northwest United States and Southwest Canada at a Fine Spatial Resolution Using a Dynamic Global Vegetation Model. PLoS ONE 2015, 10, e0138759. [Google Scholar] [CrossRef] [PubMed]
- Peterman, W.; Bachelet, D.; Ferschweiler, K.; Sheehan, T. Soil depth affects simulated carbon and water in the MC2 dynamic global vegetation model. Ecol. Model. 2014, 294, 84–93. [Google Scholar] [CrossRef]
- Prevéy, J.S.; Parker, L.E.; Harrington, C.A.; Lamb, C.T.; Proctor, M.F. Climate change shifts in habitat suitability and phenology of huckleberry (Vaccinium membranaceum). Agric. For. Meteorol. 2020, 280, 107803. [Google Scholar] [CrossRef]
- Trusler, S.; Johnson, L.M. “Berry patch” as a kind of place—The ethnoecology of black huckleberry in northwestern Canada. Hum. Ecol. 2008, 36, 553–568. [Google Scholar] [CrossRef]
- Spittlehouse, D.L.; Stewart, R.B. Adaptation to climate change in forest management. J. Ecosyst. Manag. 2003, 4, 1–11. [Google Scholar]
- Dupont, L.; Van Eetvelde, V. Assessing the potential impacts of climate change on traditional landscapes and their heritage values on the local level: Case studies in the Dender basin in Flanders, Belgium. Land Use Policy 2013, 35, 179–191. [Google Scholar] [CrossRef] [Green Version]
- Ministry of the Environment, British Columbia Areas Closed to Commercial-Scale Huckleberry Harvesting. Available online: http://www.env.gov.bc.ca/kootenay/eco/access.htm (accessed on 22 April 2019).
- Gray, L.K.; Gylander, T.; Mbogga, M.S.; Chen, P.; Hamann, A. Assisted migration to address climate change: Recommendations for aspen reforestation in western Canada. Ecol. Appl. 2011, 21, 1591–1603. [Google Scholar] [CrossRef]
- Keane, R.E.; Parsons, R.A. Restoring whitebark pine forests of the northern Rocky Mountains, USA. Ecol. Restor. 2010, 28, 56–70. [Google Scholar] [CrossRef]
- Peterson, D.L.; Halofsky, J.E.; Johnson, M.C. Managing and Adapting to Changing Fire Regimes in a Warmer Climate. In The Landscape Ecology of Fire; McKenzie, D., Miller, C., Falk, A.D., Eds.; Springer Netherlands: Dordrecht, The Netherlands, 2011; pp. 249–267. ISBN 978-94-007-0301-8. [Google Scholar]
- Millar, C.I.; Stephenson, N.L.; Stephens, S.L. Climate change and forests of the future: Managing in the face of uncertainty. Ecol. Appl. 2007, 17, 2145–2151. [Google Scholar] [CrossRef] [PubMed]
- Stephens, S.L.; McIver, J.D.; Boerner, R.E.J.; Fettig, C.J.; Fontaine, J.B.; Hartsough, B.R.; Kennedy, P.L.; Schwilk, D.W. The Effects of Forest Fuel-Reduction Treatments in the United States. BioScience 2012, 62, 549–560. [Google Scholar] [CrossRef] [Green Version]
- Cwynar, L.C. Fire and the Forest History of the North Cascade Range. Ecology 1987, 68, 791–802. [Google Scholar] [CrossRef]
- Grigg, L.D.; Whitlock, C. Late-Glacial Vegetation and Climate Change in Western Oregon. Quat. Res. 1998, 49, 287–298. [Google Scholar] [CrossRef]
- Long, C.J.; Whitlock, C.; Bartlein, P.J.; Millspaugh, S.H. A 9000-year fire history from the Oregon Coast Range, based on a high-resolution charcoal study. Can. J. For. Res. 1998, 28, 774–787. [Google Scholar] [CrossRef]
- Sea, D.S.; Whitlock, C. Postglacial Vegetation and Climate of the Cascade Range, Central Oregon. Quat. Res. 1995, 43, 370–381. [Google Scholar] [CrossRef]
- Walsh, M.K.; Whitlock, C.; Bartlein, P.J. A 14,300-year-long record of fire–vegetation–climate linkages at Battle Ground Lake, southwestern Washington. Quat. Res. 2008, 70, 251–264. [Google Scholar] [CrossRef]
- Prichard, S.J.; Gedalof, Z.; Oswald, W.W.; Peterson, D.L. Holocene fire and vegetation dynamics in a montane forest, North Cascade Range, Washington, USA. Quat. Res. 2009, 72, 57–67. [Google Scholar] [CrossRef]
- Minore, D.; Smart, A.W.; Dubrasich, M.E. Huckleberry Ecology and Management Research in the Pacific Northwest; Gen. Tech. Rep. PNW-GTR-093; US Department of Agriculture, Forest Service, Pacific Northwest Forest and Range Experiment Station: Portland, OR, USA, 1979; 60p.
- Riahi, K.; Rao, S.; Krey, V.; Cho, C.; Chirkov, V.; Fischer, G.; Kindermann, G.; Nakicenovic, N.; Rafaj, P. RCP 8.5—A scenario of comparatively high greenhouse gas emissions. Clim. Chang. 2011, 109, 33. [Google Scholar] [CrossRef] [Green Version]
- Littell, J.; Oneil, E.; McKenzie, D.; Hicke, J.; Lutz, J.; Norheim, R.; Elsner, M. Forest ecosystems, disturbance, and climatic change in Washington State, USA. Clim. Chang. 2010, 102, 129–158. [Google Scholar] [CrossRef] [Green Version]
- Case, M.J.; Lawler, J.J. Integrating mechanistic and empirical model projections to assess climate impacts on tree species distributions in northwestern North America. Glob. Chang. Biol. 2017, 23, 2005–2015. [Google Scholar] [CrossRef] [PubMed]
Figure 1.
Study area showing the gray shaded extent of our analysis encompassing Oregon and Washington (U.S.) and tribal reservations delineated in black polygons.
Figure 1.
Study area showing the gray shaded extent of our analysis encompassing Oregon and Washington (U.S.) and tribal reservations delineated in black polygons.

Figure 2.
Projected change in average annual temperature (ΔT) and average annual precipitation (ΔP) from 31 global climate models (GCMs) between the 2070–2099 and the 1970–1999 periods for the Pacific Northwest (Oregon and Washington). ΔT and ΔP were calculated using the NASA NEX-DCP30 climate dataset [40]. GCMs are ranked according to model skill for simulating historical climate of the Pacific Northwest region [36]. The four GCMs used in this study are circled. ACCESS1-0 GCM was not evaluated [36].

Figure 3.
Historical (1970–1999) and midcentury (2035–2064) simulations of vegetation types across the study area for the BNU-ESM (“hot”), CanESM (“hot-wet”), CESM1-CAM5 (“mean”), and MRI-CGCM3 (“warm”) GCMs. Tribal reservations are delineated with black polygons.
Figure 3.
Historical (1970–1999) and midcentury (2035–2064) simulations of vegetation types across the study area for the BNU-ESM (“hot”), CanESM (“hot-wet”), CESM1-CAM5 (“mean”), and MRI-CGCM3 (“warm”) GCMs. Tribal reservations are delineated with black polygons.

Figure 4.
Historical (1970–1999) and end of the century (2070–2099) simulations of vegetation types across the study area for the BNU-ESM (“hot”), CanESM (“hot-wet”), CESM1-CAM5 (“mean”), and MRI-CGCM3 (“warm”) GCMs. Tribal reservations are delineated with black polygons.
Figure 4.
Historical (1970–1999) and end of the century (2070–2099) simulations of vegetation types across the study area for the BNU-ESM (“hot”), CanESM (“hot-wet”), CESM1-CAM5 (“mean”), and MRI-CGCM3 (“warm”) GCMs. Tribal reservations are delineated with black polygons.

Figure 5.
Percent of the study area that individual vegetation types cover for historical and four future projections for (top) midcentury (2035–2064) and (bottom) end of the century (2070–2099) under RCP 8.5.
Figure 5.
Percent of the study area that individual vegetation types cover for historical and four future projections for (top) midcentury (2035–2064) and (bottom) end of the century (2070–2099) under RCP 8.5.

Figure 6.
The number of ecosystem services and their relative change in potential habitat as calculated by converting the difference between the historical and the future average to a relative directional change for six categories of ecosystem services by the end of the century (2070–2099) under RCP 8.5. Negative numbers of relative change indicate a loss of potential habitat, whereas positive numbers indicate a increase of potential habitat.

Figure 7.
Projected potential habitat for (A) huckleberry (top row) and (B) bitterbrush (bottom row) based on the CESM1-CAM5 GCM for mid and end of the century under RCP 8.5. Tribal reservations are delineated with black polygons.
Figure 7.
Projected potential habitat for (A) huckleberry (top row) and (B) bitterbrush (bottom row) based on the CESM1-CAM5 GCM for mid and end of the century under RCP 8.5. Tribal reservations are delineated with black polygons.

Table 1.
MC2 vegetation types and associated potential natural vegetation [46], as identified in [47] and representative species.
| MC2 Vegetation Type | Potential Natural Vegetation | Representative Species |
|---|---|---|
| Subalpine forest | Fir/hemlock, Red fir, Western spruce fir, Great basin pine | Huckleberry, mountain goat, American marten |
| Maritime coniferous forest | Spruce/cedar/hemlock, Cedar/hemlock/Douglas-fir forest, Silver fir/Douglas fir, Mixed conifer, Redwood | Salal, devil’s club, Northern flying squirrel, Marbled murrelet |
| Moist coniferous forest | Cedar/hemlock/Douglas-fir, Silver fir/Douglas-fir | Oregon grape, Pacific yew, Black-tailed deer |
| Coniferous forest | Douglas-fir, Cedar/hemlock/pine, Grand fir/Douglas-fir | Pipsissewa, elk, fisher, bobcat, Northern goshawk |
| Dry coniferous forest | Western ponderosa, Douglas-fir, Ponderosa shrub | Lewis’ woodpecker, osprey, mule deer |
| Warm mixed forest | Oregon oak woods, Mixed Oregon oak woods and Cedar/hemlock/Douglas-fir | Long-tailed weasel, foxglove |
| Subtropical mixed forest | California mixed evergreen forest | Black oak, Rufous hummingbird |
| Coniferous woodland | Juniper steppe woodland | Juniper, mule deer, black-tailed jackrabbit |
| Shrub steppe | Great Basin sagebrush, Saltbrush/greasewood, Sagebrush steppe | Antelope bitterbrush, big sagebrush |
| Dry shrub steppe | Chaparral, Mesquite/live oak savanna, Montane chaparral | California chaparral, mesquite, live oak, osprey, red-tailed hawk, jack rabbit |
| Grassland | Fescue/wheatgrass, Wheatgrass/bluegrass | Western spotted skunk, mule deer, Northern pocket gopher |
| Desert | Desert (vegetation absent) | Western rattlesnake, red-tailed hawk, golden eagle |
Table 2.
Area (square kilometers) of potential expansion, contraction, and areas that may remain stable for huckleberry and bitterbrush habitat for the study area.
Table 2.
Area (square kilometers) of potential expansion, contraction, and areas that may remain stable for huckleberry and bitterbrush habitat for the study area.
| Huckleberry | Bitterbrush | |||
|---|---|---|---|---|
| 2050s | 2080s | 2050s | 2080s | |
| Historical potential habitat | 235,871 | 235,871 | 167,647 | 167,647 |
| Expansion | 19,122 | 24,164 | 10,230 | 0 |
| Contraction | 35,180 | 97,350 | 19,947 | 33,648 |
| Stable | 200,691 | 138,520 | 147,701 | 134,000 |
| Overall change in habitat | −51,238 | −170,537 | −29,663 | −67,295 |
© 2020 by the authors. Licensee MDPI, Basel, Switzerland. This article is an open access article distributed under the terms and conditions of the Creative Commons Attribution (CC BY) license (http://creativecommons.org/licenses/by/4.0/).
Share and Cite
MDPI and ACS Style
Case, M.J.; Kim, J.B.; Kerns, B.K. Using a Vegetation Model and Stakeholder Input to Assess the Climate Change Vulnerability of Tribally Important Ecosystem Services. Forests 2020, 11, 618. https://0-doi-org.brum.beds.ac.uk/10.3390/f11060618
AMA Style
Case MJ, Kim JB, Kerns BK. Using a Vegetation Model and Stakeholder Input to Assess the Climate Change Vulnerability of Tribally Important Ecosystem Services. Forests. 2020; 11(6):618. https://0-doi-org.brum.beds.ac.uk/10.3390/f11060618
Chicago/Turabian StyleCase, Michael J., John B. Kim, and Becky K. Kerns. 2020. "Using a Vegetation Model and Stakeholder Input to Assess the Climate Change Vulnerability of Tribally Important Ecosystem Services" Forests 11, no. 6: 618. https://0-doi-org.brum.beds.ac.uk/10.3390/f11060618
Note that from the first issue of 2016, this journal uses article numbers instead of page numbers. See further details here.