Estimation of Over- and Under-Bark Volume of Scots Pine Timber Produced by Harvesters


Faculty of Forestry and Wood Sciences, Czech University of Life Sciences Prague, Kamýcká 129, 16521 Prague 6-Suchdol, Czech Republic
*
Author to whom correspondence should be addressed.
Forests 2020, 11(6), 626; https://0-doi-org.brum.beds.ac.uk/10.3390/f11060626
Submission received: 24 April 2020
/
Revised: 22 May 2020
/
Accepted: 28 May 2020
/
Published: 2 June 2020
(This article belongs to the Special Issue Forestry Production Process Automation and Robotization)
Abstract
:Harvesters produce one third of timber in Czechia. The aim of this study was to analyze the over- and under-bark volume estimates of Scots pine (Pinus sylvestris L.) timber produced by a mid-performance harvester. The data were collected between March 2017 and June 2018. In total, 4661 stems cut into 29,834 logs were analyzed. For volume estimation, StanForD offers several price categories using various algorithms. Three of these price categories are relevant for Czech forestry—M3s, M3toDE, and M3miDE. The M3s price category is based on the estimation of partial volumes of 10 cm long sections, which are summed. Therefore, this price category represents the volume estimation closest to the true volume. By comparison, the M3toDE and M3miDE price categories use the same algorithm for volume estimation, which is based on the Huber formula using a midspan diameter rounded down to the nearest whole centimeter. The M3toDE price category underestimated the over-bark volume by 6.48% compared to the reference price category M3s. The mean log volume estimated through the M3s price category was significantly higher than the M3toDE volume both in individual grades and without grading. We found significant differences between under-bark volume estimates by the diameter band bark deduction method (DBM) and the parametric linear bark deduction method (PLM) used in harvester’s systems according to the Guidelines for Electronic Scaling of Timber for Harvesters in Czechia (GEH) for Scots pine butt logs with rough bark, and also for other logs with normal bark thickness. To obtain under-bark volume estimates of Scots pine timber that are comparable with the Guidelines for Timber Scaling in Czechia (GTS) using the parametric nonlinear bark deduction method (PNM), we recommend using the algorithm of the M3toDE price category, with double bark thickness determined by the diameter band bark deduction method.
1. Introduction
The use of harvester technology is closely linked to the cut-to-length (CTL) logging method [1]. This method represents a series of operations, during which standing trees are converted into timber assortments directly at the stump location [2]. Mechanized harvesting increases productivity and reduces production costs compared to motor-manual logging [3,4,5,6]. Therefore, the CTL method is currently almost exclusively used for harvesting in some European countries, such as Finland, Sweden, and Norway [7,8]. Due to its high productivity, greater expansion in Czechia and other Central and Eastern European countries can be expected, in connection to addressing the bark beetle crisis.
However, there are barriers to increasing the share of mechanized CTL harvesting. Ferrari et al. [9] mentions, in particular, the large capital expenses needed to purchase the machinery, followed by technical constraints such as terrain configuration or species composition in a given region. Additionally, a study conducted in the northeastern US showed that conventional whole-tree methods are more productive than the CTL logging method when harvesting small-diameter trees [10]. These obstacles reduce the potential share of timber processed by harvester technology in other European countries [11,12]. In Czechia, the share of timber produced by harvesters was 32% in 2018 [13] and, according to Dvořák et al. [14], may reach 50% in the future.
Harvesters can help substantially with streamlining the process of keeping production records, particularly those related to the volume of produced timber and its parameters. In practice, the volume of timber is estimated during or after harvest, and the accuracy of the estimates is vital, because the volume directly translates to the revenues of forestry enterprises. The sale of timber is the primary source of revenue in forestry. In addition to the effects of the accuracy of volume estimates on revenue, the estimates also serve as inputs into forest management records and are used in industrial statistics [15].
The correct determination of the volume of an object depends on its shape. In forest mensuration, the most widely used sectional methods for volume estimation based on tree stem geometry are the Smalian, Huber, and Newton formulas. Each of these methods calculates volume based on cross-sectional areas (circular), measured either at the log ends (Smalian), at its mid-point (Huber), or at both ends and mid-point (Newton) [16]. The Newton formula gives the most exact results for all classical geometries, such as paraboloid, cone, and neoloid [17]. However, Smalian and Huber formulas are preferred in the field, because they are easier to apply, especially with regard to manual measurement. When comparing the Huber and Smalian formulas, the first is more accurate [16]. It is difficult to decide which geometric shape best fits a stem, because the average tree stem tapers into a truncated neoloid at the lowest part, a truncated paraboloid at the central section, and a paraboloid or cone at the top [18,19]. Moreover, it is virtually impossible to know exactly where one geometry ends and another begins [20]. In practice, we cannot obtain a uniform stem shape in the forest. Historically, the Huber method has been preferred to Smalian method in Europe [21].
In order to harmonize the various methods and techniques of timber scaling and grading, guidelines for measuring and sorting timber have gradually been developed in most countries. Therefore, we can find different approaches to estimating the volume of timber, and to using these data to sell and record timber [22,23,24].
In Central Europe, raw timber is usually sold with the bark, though customers pay for the volume of merchantable timber, estimated under the bark. Values of timber volume in cubic meters under bark are then entered into the forest management records [25]. Finnish foresters typically employ a combined sawmill and harvester measurement system of timber procurement, where timber is first measured by the harvester and then at the sawmill. The sawmill measurement technology is considered to be more reliable and accurate. Therefore, this method is the point, to which the harvester data is referenced, resulting in errors of ±4% by the Finnish standards [26]. Use of harvester technology requires thorough familiarity with machine management, control, and information systems and their settings. Data from these systems can be used as valid production records, provided the machines are set up correctly and the measurement accuracy is regularly checked. Measurements are made over-bark (o.b.) and subsequently converted to under-bark (u.b.) data using various bark thickness deduction methods [27].
In Czechia, the under-bark volume of timber is typically estimated based on (i) the over-bark, midspan diameter (in two perpendicular measurements), rounded down to the nearest centimeter and (ii) the required length of a log or stem [28]. Since 2002, the Guidelines for Timber Scaling in Czechia (GTS) have been used in the production and trade of individual timber assortments [23], and fully govern a large number of contracts between suppliers and customers. According to the GTS [23], the under-bark volume of a log is estimated through the Huber formula [22]. If diameters are measured over bark, the parametric nonlinear bark deduction method (PNM) is used to deduct the double bark thickness. The parameters of the nonlinear models are based on the Czech Cubing Tables (CCT) specified in the ČSN 48 009 technical standard [29].
The GTS only briefly describe measurements with specialized machines, such as harvesters. Therefore, Natov and Dvořák [30] compiled the Guidelines for Electronic Scaling of Timber for Harvesters in Czechia (GEH). The GEH serve as a manual for working with the wood procurement, control, and information systems of harvesters. They describe the recommended settings of harvester systems that meet the requirements of the StanForD Classic standard [31] and ensure that valid Czech forest management regulations, as well as the GTS, are respected [30]. The intended purpose of the GEH was to identify the key differences between the methods of timber scaling used by harvester systems and harmonization of volume estimation practices used in electronic scaling.
The main sources of differences between the timber volume outputs from the harvester measurement systems are the algorithm used for volume estimation [15] and the method used for double bark thickness deduction [27]. The GEH describe the software settings that have a direct effect on the resulting volume of timber recorded by harvesters, such as selecting the tree species, bark deduction method, price category (which determines the algorithm for volume estimation), and length used for volume estimation. To estimate the timber volume, it is first necessary to select the price category. StanForD [32] offers 14 price categories that use seven different algorithms [15]. The differences between these algorithms in volume estimations of Norway spruce (Picea abies [L.] Karst) logs were discussed by Löwe et al. [15]. Three of these price categories are relevant to Czech forestry—M3s, M3toDE, and M3miDE. The first, the M3s price category, represents the volume estimation closest to the true volume [32] and, as such, can be used as a reference. The M3s price category is based on the estimate of partial volumes of 10-cm-long log sections, which are then summed (Newton method principle). The total volume of the log thus always represents the sum of all volumes of the log sections. The two other price categories, M3toDE and M3miDE, both use an algorithm for volume estimation based on the Huber formula [22] and the Handelsklassensortierung (sorting of merchantable timber, HKS) method [33]. The detailed description of log volumes estimated according various to price categories was described by Löwe et al. [15].
Löwe et al. [15] pointed out that if the M3toDE and M3miDE price category algorithms are used, timber production is significantly underestimated. Nevertheless, the GEH [30] promote using the M3toDE or M3miDE price categories, as they use the same principle of volume estimation as required by the GTS [23]. For volume estimation, the use of required length must be set in the harvester system. If it is necessary to express the under-bark volume of timber, the GEH offers two bark deduction methods that can be used in Czechia: (i) the diameter band bark deduction method (DBM) and (ii) the parametric linear bark deduction method (PLM). It is not possible to use the PNM according to the GTS, because polynomial functions are not supported by StanForD. The DBM allows setting the thickness (in millimeters) to be deducted from the midspan diameter as the double bark thickness with respect to the diameter interval, to which the log belongs. The values of double bark thickness are based on the CCT [29]. The parameters for PLM were modified from parameters issued by Skogforsk [32], because original parameters were created for the growth conditions of Swedish forestry. The parameters used for PLM according to the GEH were created based on the CCT [29]. Different parameters are used for various tree species. Moreover, the parameters for Scots pine (Pinus sylvestris L.) differ even for one stem, depending on whether stems include rough (butt log) bark or normal bark thickness.
This study deals with the determination of the over-bark volume differences of pine logs produced by harvesters and the subsequent differences of under-bark volume estimates resulting from using bark deduction methods recommended by the GEH [30] compared to the polynomial function reported by GTS [23]. The aims of this study are: (i) to confirm that the volume estimated using the M3toDE price category algorithm significantly underestimates the volume compared to the M3s price category algorithm, (ii) to analyze the differences between over-bark volumes estimated by M3s and M3toDE price categories for various assortment grades, (iii) to analyze the differences between over-bark volumes estimated by M3s and M3toDE price categories for various required length categories, (iv) to analyze the differences between M3toDE under-bark volumes obtained by three different bark deduction methods (DBM, PLM, PNM), using parameters for Scots pine stems with rough bark (butt logs), and (v) to analyze the differences between M3toDE under-bark volumes obtained by three different bark deduction methods (DBM, PLM, PNM), using parameters for Scots pine stems with normal bark thickness.
2. Materials and Methods
2.1. Data Collection
Data were obtained from a John Deere 1270E harvester equipped with a Waratah 480C harvester head. The harvester was a mid-performance machine, the most common harvester class in Czechia [34]. The TimberMatic control and information system (1.19, Deere & Company: Moline, IL, USA) saved data in the unified StanForD Classic standard [31]. The data were collected between March 2017 and June 2018. Mainly final and salvage fellings were carried out with the machine throughout Czechia. The harvester almost exclusively processed coniferous trees. Scots pine (Pinus sylvestris L.) represented almost 10% of all stems processed by the machine. We used the same data set as Löwe et al. [15], however in this study, we only used Scots pine data.
The control and information system of the harvester was pre-set to automatically save stem files (.stm), which contain metrics (such as length and diameter data) of each felled tree [35]. Each stem was cut into 1–14 logs. The stem files contained measured diameters for every 10 cm of log length, as well as the M3s volume estimate of each log.
To ensure accuracy of length and diameter measurements, a control measurement was carried out at the beginning of each work day by measuring 3–5 trees with a Haglöf Digitech Professional II digital caliper, equipped with a Digitech Tape and Skalman 6.11 software (Haglöf Sweden AB: Långsele, Sweden). If necessary, length and diameter gauges were automatically calibrated in the harvester head of the machine. A detailed procedure for control measurement and calibration was described by Löwe et al. [15].
2.2. Data Processing and Categorization of Assortments
Data stored in stem files were transferred to MS Excel file format. For the data conversion, we used the STeMa application, version 1.0 (author: Natov P., year 2016). The application can read and extract data from stem files in the StanForD Classic standard. The resulting database was cleared of extreme values. A total of 4661 stem files were analyzed, containing data on 29,834 produced logs. The converted variables were as follows:
- Tree species (TS)—distinguished the tree species (this study used only Scots pine logs).
- Assortment (AS)—contained information about the inclusion of the log into the assortment according to the required parameters of customers.
- Midspan diameter (MD)—expressed the log diameter (in mm over bark) measured in the middle of its required length.
- Top end diameter (TD)—expressed the log diameter (in mm over bark) measured at the end of the log required length and served as one of the quantitative parameters for classifying the log into assortments.
- Total length (TL)—contained the value of the real length of the log (in cm).
- Required length (RL)—contained the value of the minimum required length of the log (in cm) for the given assortment.
- Over-bark volume of a log according to the M3s price category (VM3s)—expressed the log volume (in m3 over bark) estimated by using the required length of the log.
We estimated the volume of each log using the algorithm of the M3toDE price category (VM3toDE). This volume was estimated based on the required length and the midspan diameter measured in millimeters and rounded down to the nearest whole centimeter using the HKS method [33]. The log volume was estimated according to Equation (1):
where VM3toDE is the log volume according to the M3toDE price category (m3 over bark), π = 3.14, MD is the midspan diameter (cm), RL is the required length (cm).
VM3toDE = π × (MD2/4/10000) × RL/100
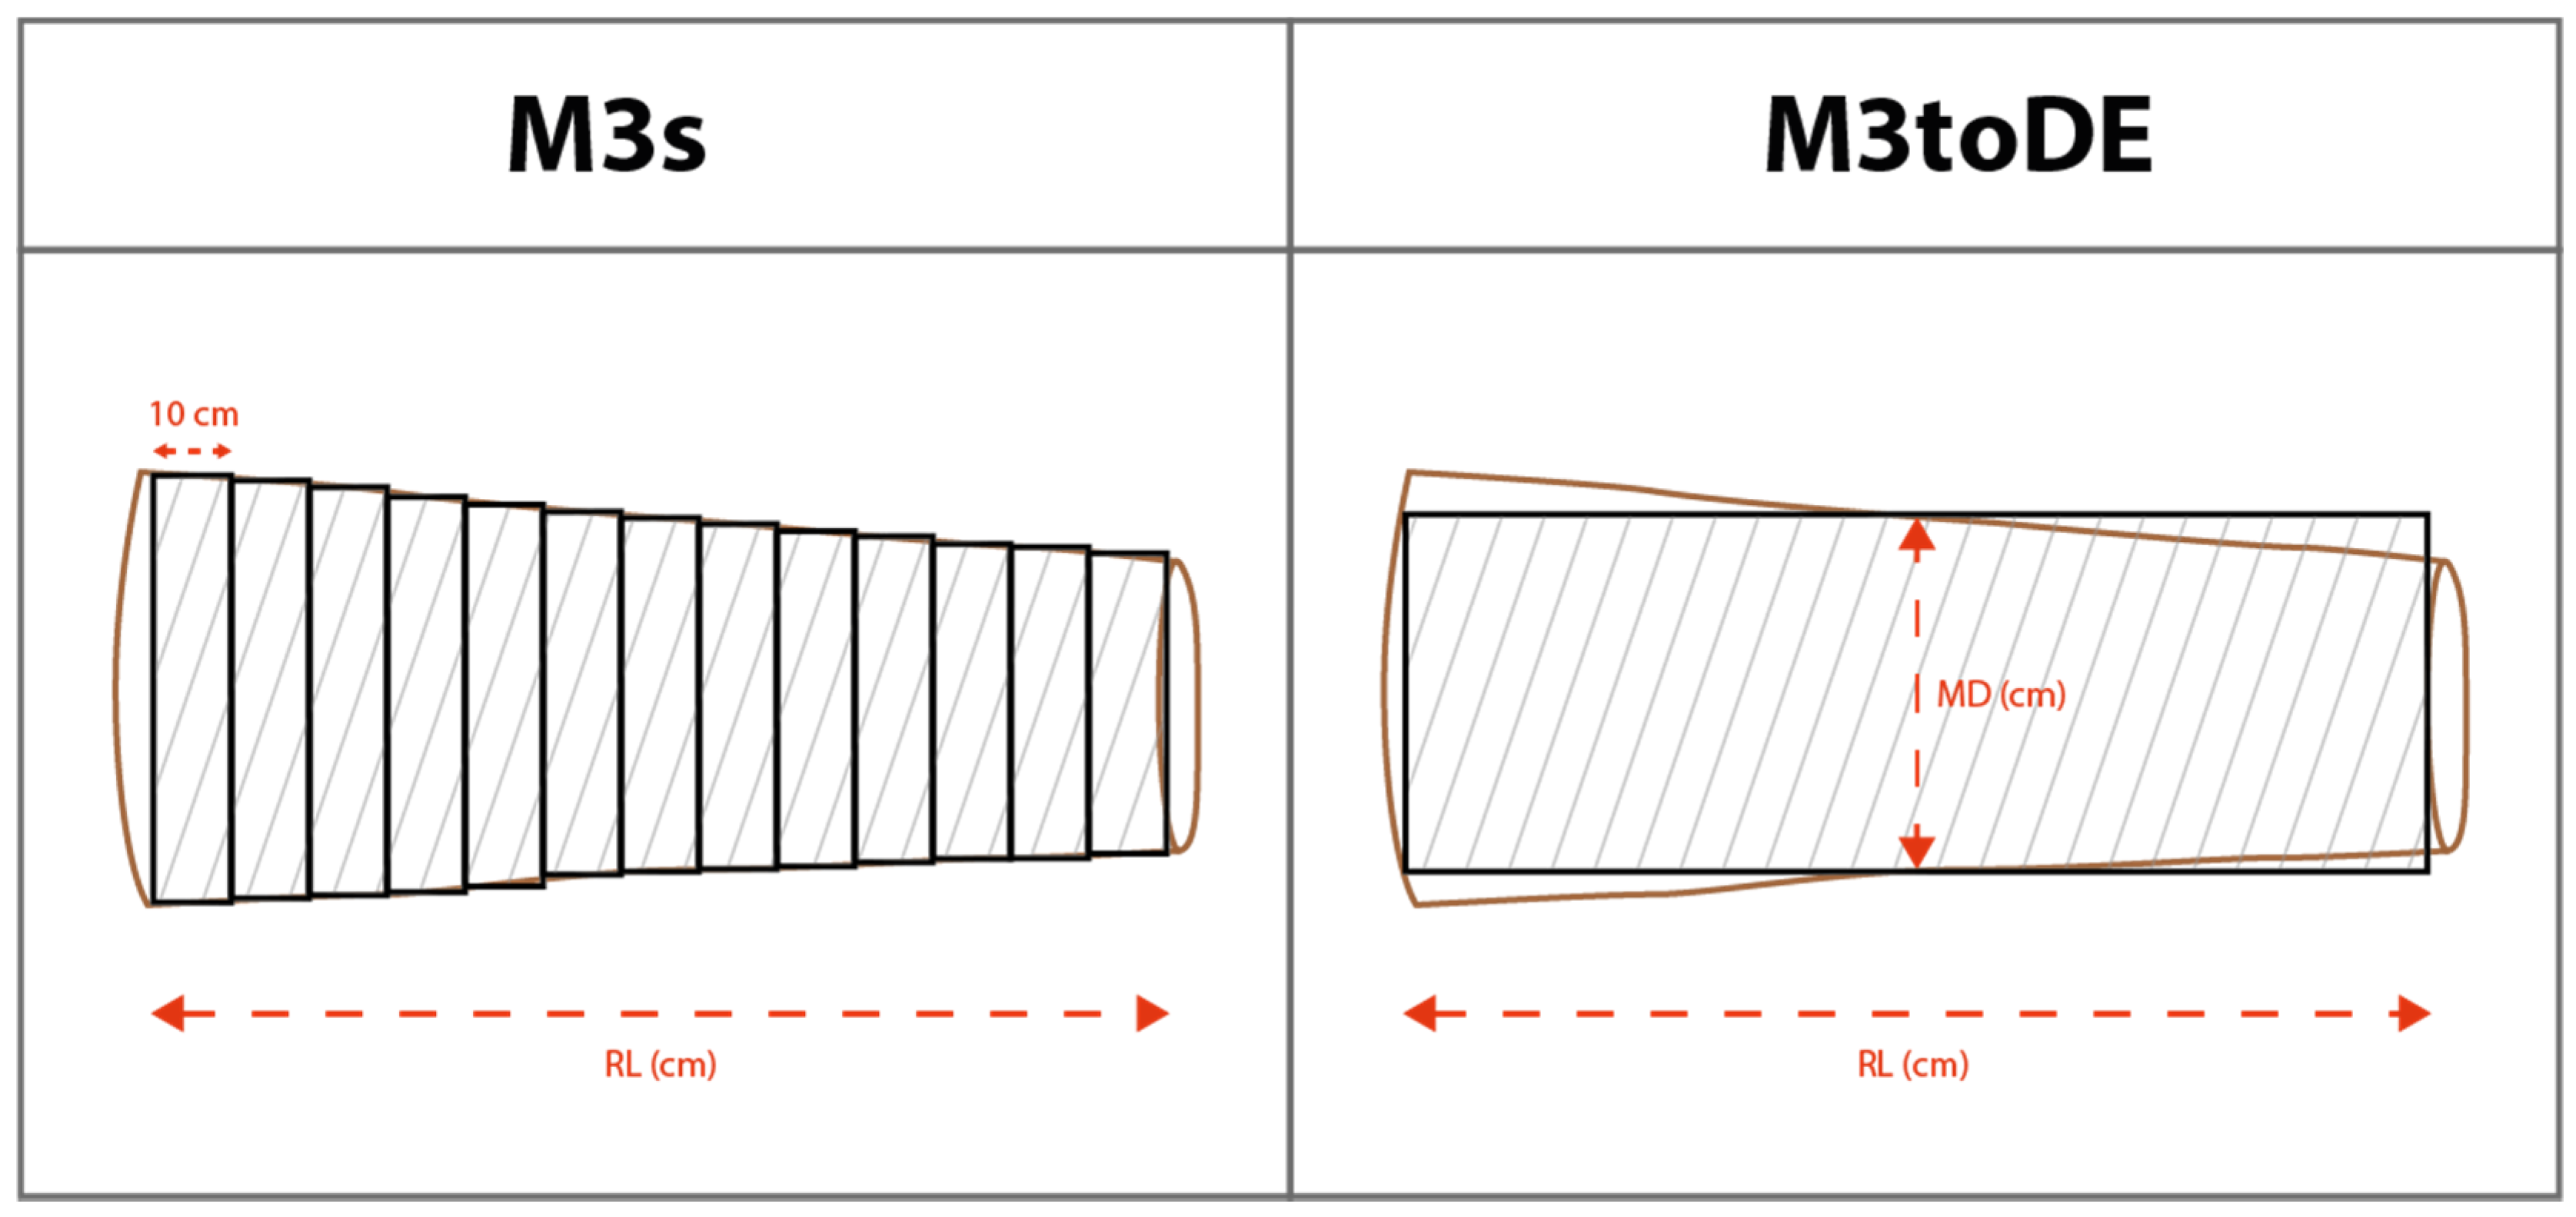
The principle of estimating volume according to the M3s and M3toDE price categories is graphically illustrated in Figure 1.
Each log produced by the harvester represented a certain assortment that met specific requirements of the customer (tree species, top end diameter, required length, grade). When the tree was cut, the harvester operator first determined the tree species and the quality of timber, then the machine software suggested a specific assortment to be produced based on pre-set quantitative parameters. The same grading method was also used by Löwe et al. [15]. Logs were also categorized according to their required length and midspan diameter. Table 1 shows the relative distribution of required lengths and midspan diameters of logs in the span of 100 mm over bark for diameters and 100 cm for length.
2.3. Bark Deduction Methods and Under-Bark Volume Estimates
To estimate the under-bark volume according to the M3toDE price category, two bark deduction methods (the DBM and the PLM) available in the control and information systems according to the GEH [30] were used. Then, the PNM according to the GTS [23] was used as a reference to enable comparison of the bark deduction method accuracy.
The double bark thickness values within the DBM were determined for 10 diameter bands published by Wojnar [23] and are shown in Table 2. The second method used for determining the bark deduction was PLM. The parameters of the linear model were fitted for Czech growth conditions [30] and were limited by the upper margin of the midspan diameter to 700 mm over bark, because most harvesters in the Czechia are equipped with harvester heads that can process logs up to that diameter [36]. Equation (2) was used to calculate the double bark thickness according to the PLM:
where DBTPLM is the double bark thickness according to the PLM (mm over bark), MD is the measured midspan diameter (mm), a = 0.00 and b = 0.0482 (for Scots pine logs with normal bark), or a = 12.24 and b = 0.0633 (for Scots pine butt logs with rough bark).
DBTPLM = a + MD × b
To compare, the double bark thickness was also determined by the PNM, as reported by Wojnar [23]. The parameters of the PNM are, similarly to the PLM, based on the CCT [29]. However, the PNM uses a quadratic equation, and therefore cannot be used in the harvester system. The Equation (3) was used to calculate the double bark thickness according to the PNM:
where DBTPNM is the double bark thickness according to the PNM (mm over bark), MD is the measured midspan diameter (mm), p0 = 0.24017, p1 = 0.001915 and p2 = 1.7866 (for Scots pine logs with normal bark), or p0 = 1.7015, p1 = 0.008762 and p2 = 1.4568 (for Scots pine butt logs with rough bark).
DBTPNM = p0 + p1 × MDp2
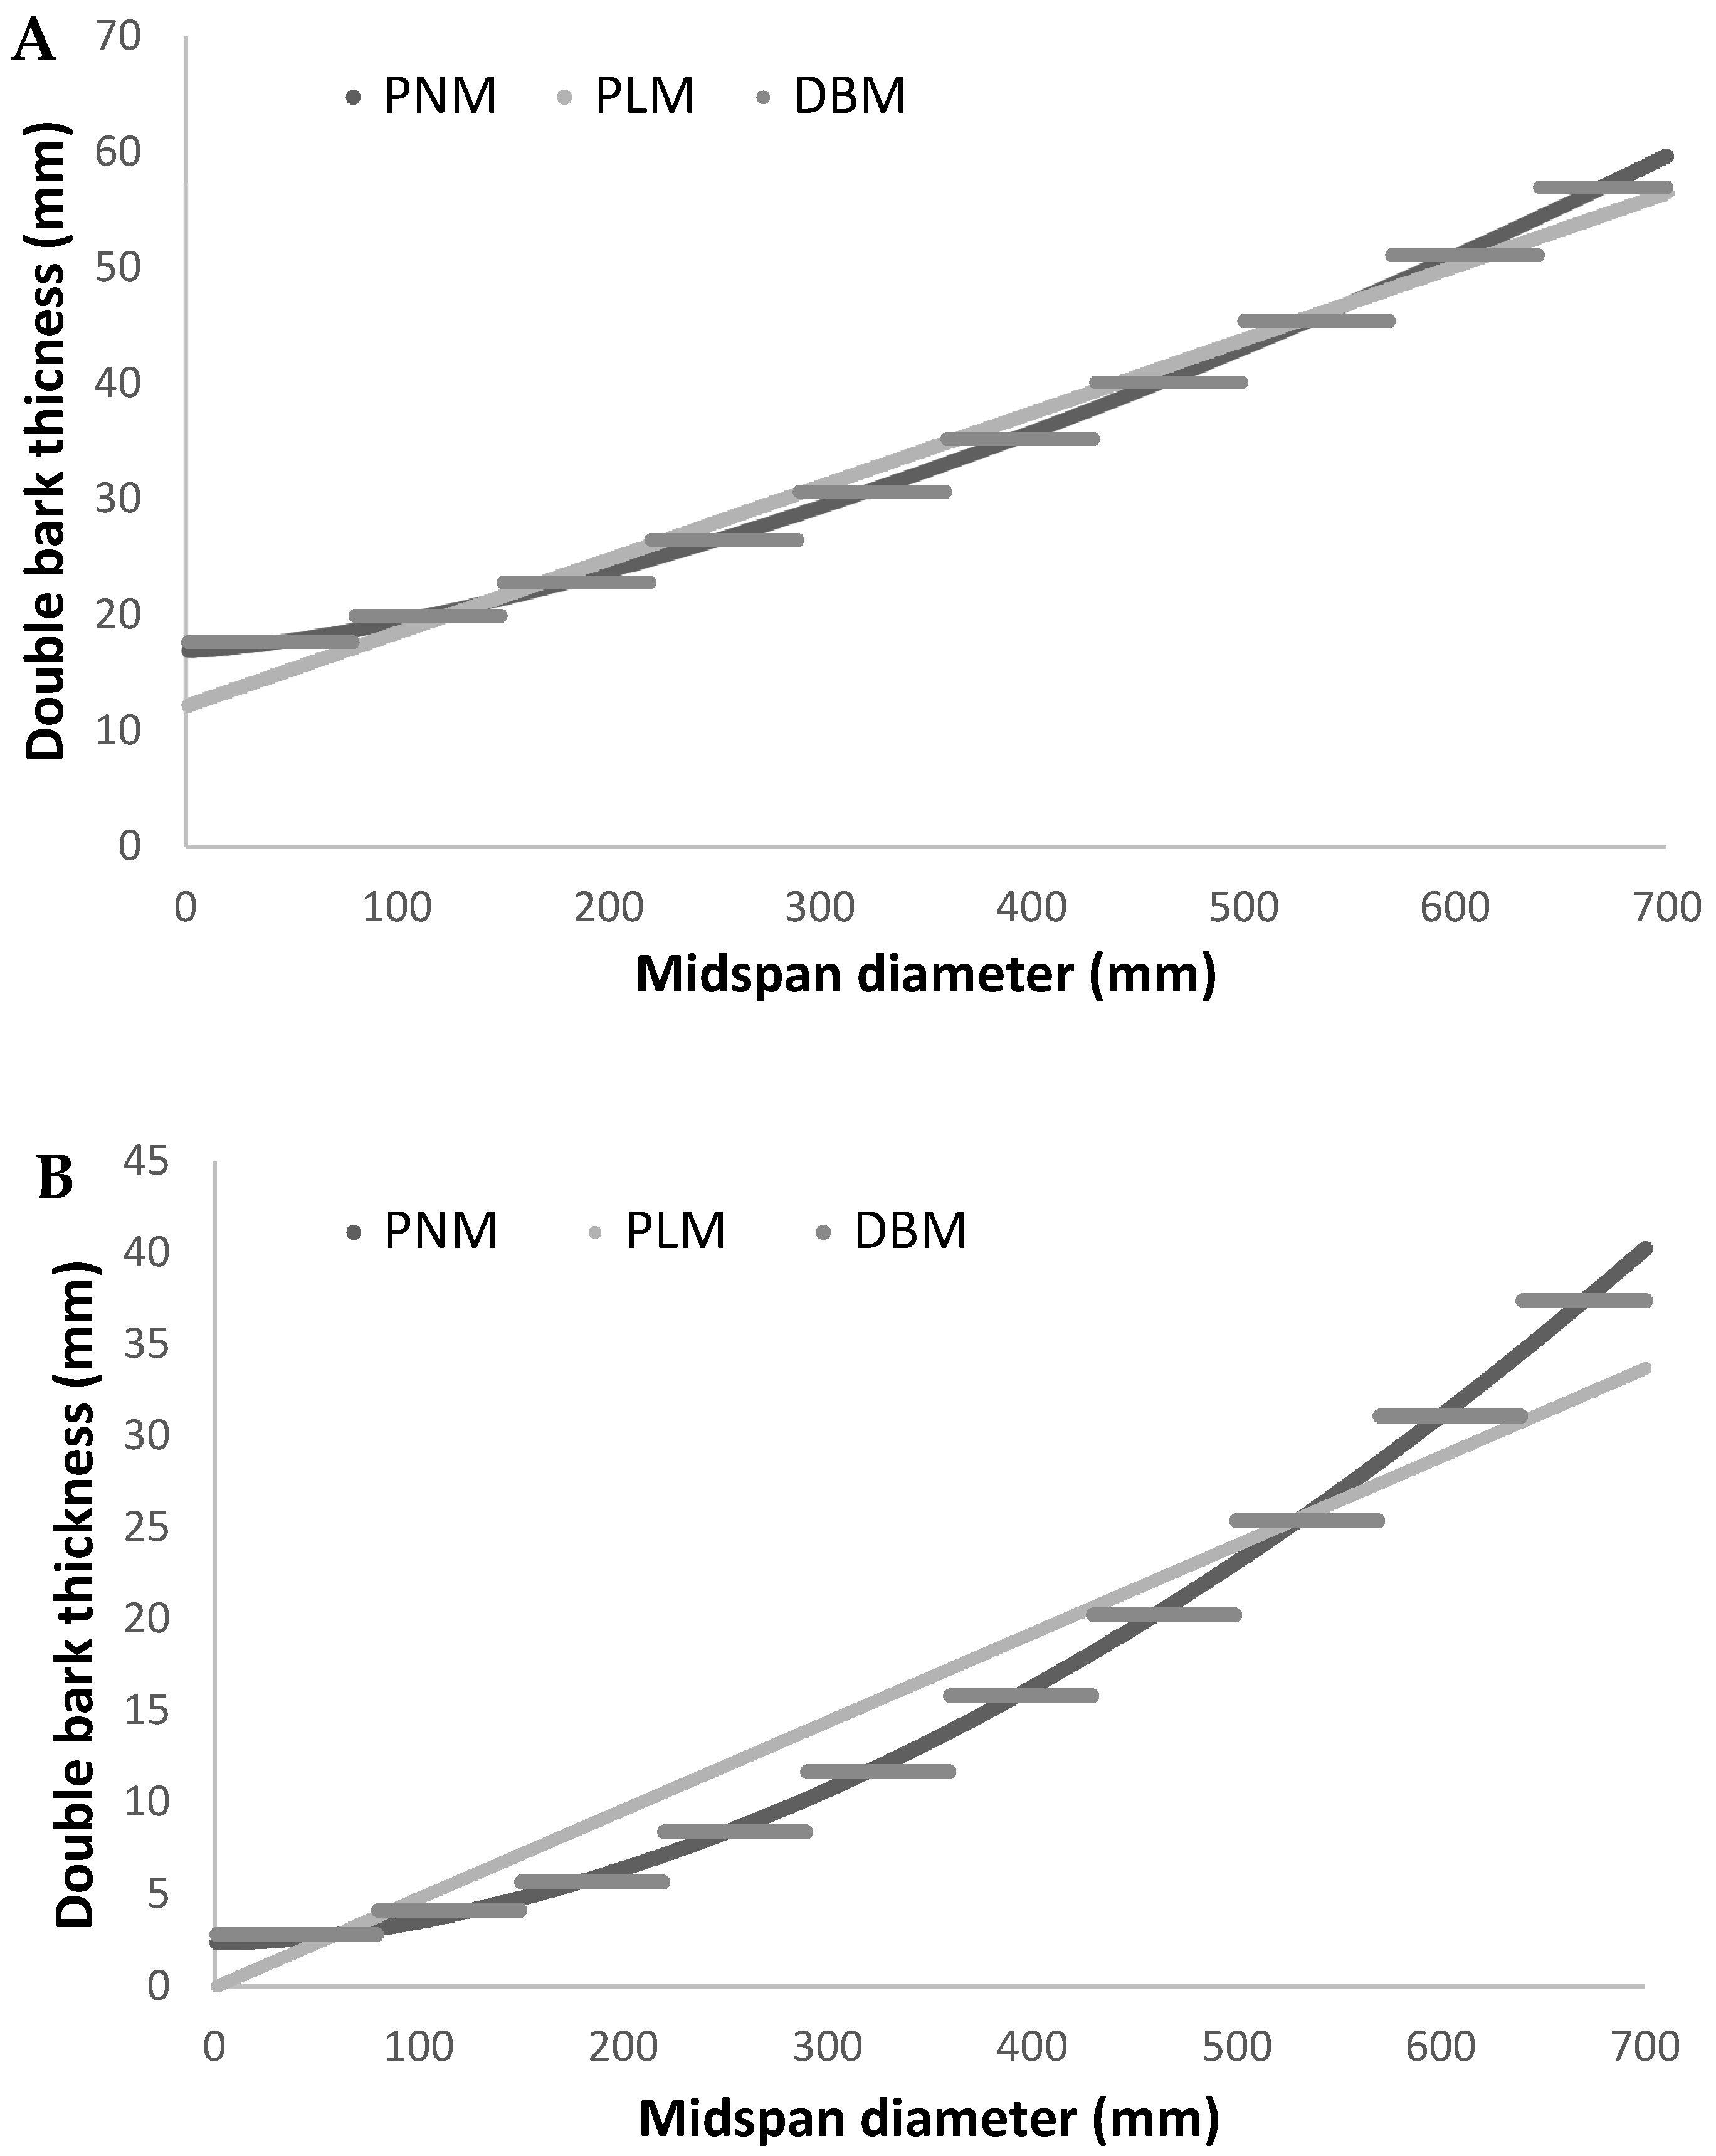
A graphical comparison of the double bark thickness curves of all three bark deduction methods is shown in Figure 2.
Subsequently, we estimated the under-bark volume (m3) for each log using these three bark deduction methods (DBM, PLM, PNM). To estimate the under-bark volumes, only the M3toDE price category was used throughout this study as recommended by Natov and Dvořák [30] for harvesters in Czechia. Therefore, Equation (1) was used again. However, in this case, the value of midspan diameter (MD; cm) used in Equation (1) was the value obtained by subtracting the double bark thickness (DBT, mm) from the measured midspan diameter (MD, mm over bark), rounded down to the nearest centimeter. By substituting the calculated under-bark midspan diameter (cm) into the formula, the under-bark volume (m3) was estimated. The under-bark volumes estimated according to these three different bark deduction methods were identified as VDBM, VPLM, and VPNM.
The log cut first from each stem was identified as the butt log. Butt logs were assumed to have rough bark, and therefore the under-bark volume estimates were simulated using parameters for Scots pine butt logs with rough bark. For the remaining logs (from the second to the last log), where rough bark was not expected, the under-bark volume estimates were simulated using parameters for Scots pine logs with normal bark thickness.
2.4. Data Analyses
Statistical analyses were performed in the statistical software R [37]. Descriptive statistics were used to obtain average and summary values of individual variables. Data normality was always tested using the Kolmogorov–Smirnov normality test. Paired Wilcoxon rank-sum tests were used to test the differences between over-bark volumes estimated according to the M3s and M3toDE price categories in individual assortment grades and required length categories. Friedman’s ANOVA was used to test the differences between the M3toDE under-bark volume estimates using the DBM, PLM and PNM bark deduction methods. The Neményi post-hoc test, followed by the Bonferroni method for p-value correction, was used for multiple comparisons. A significance level of α = 5% was chosen for all statistical tests.
3. Results
Overall, 4661 Scots pine stems were processed into 29,834 logs by the machine. The logs were measured by the machine and two different algorithms of the M3s and M3toDE price categories were used for over-bark volume estimation (Table 3). The total over-bark volume of all logs estimated by the M3s price category was higher than that estimated by the M3toDE price category. This was also true for the total over-bark volume of the logs in each assortment grade (Table 3).
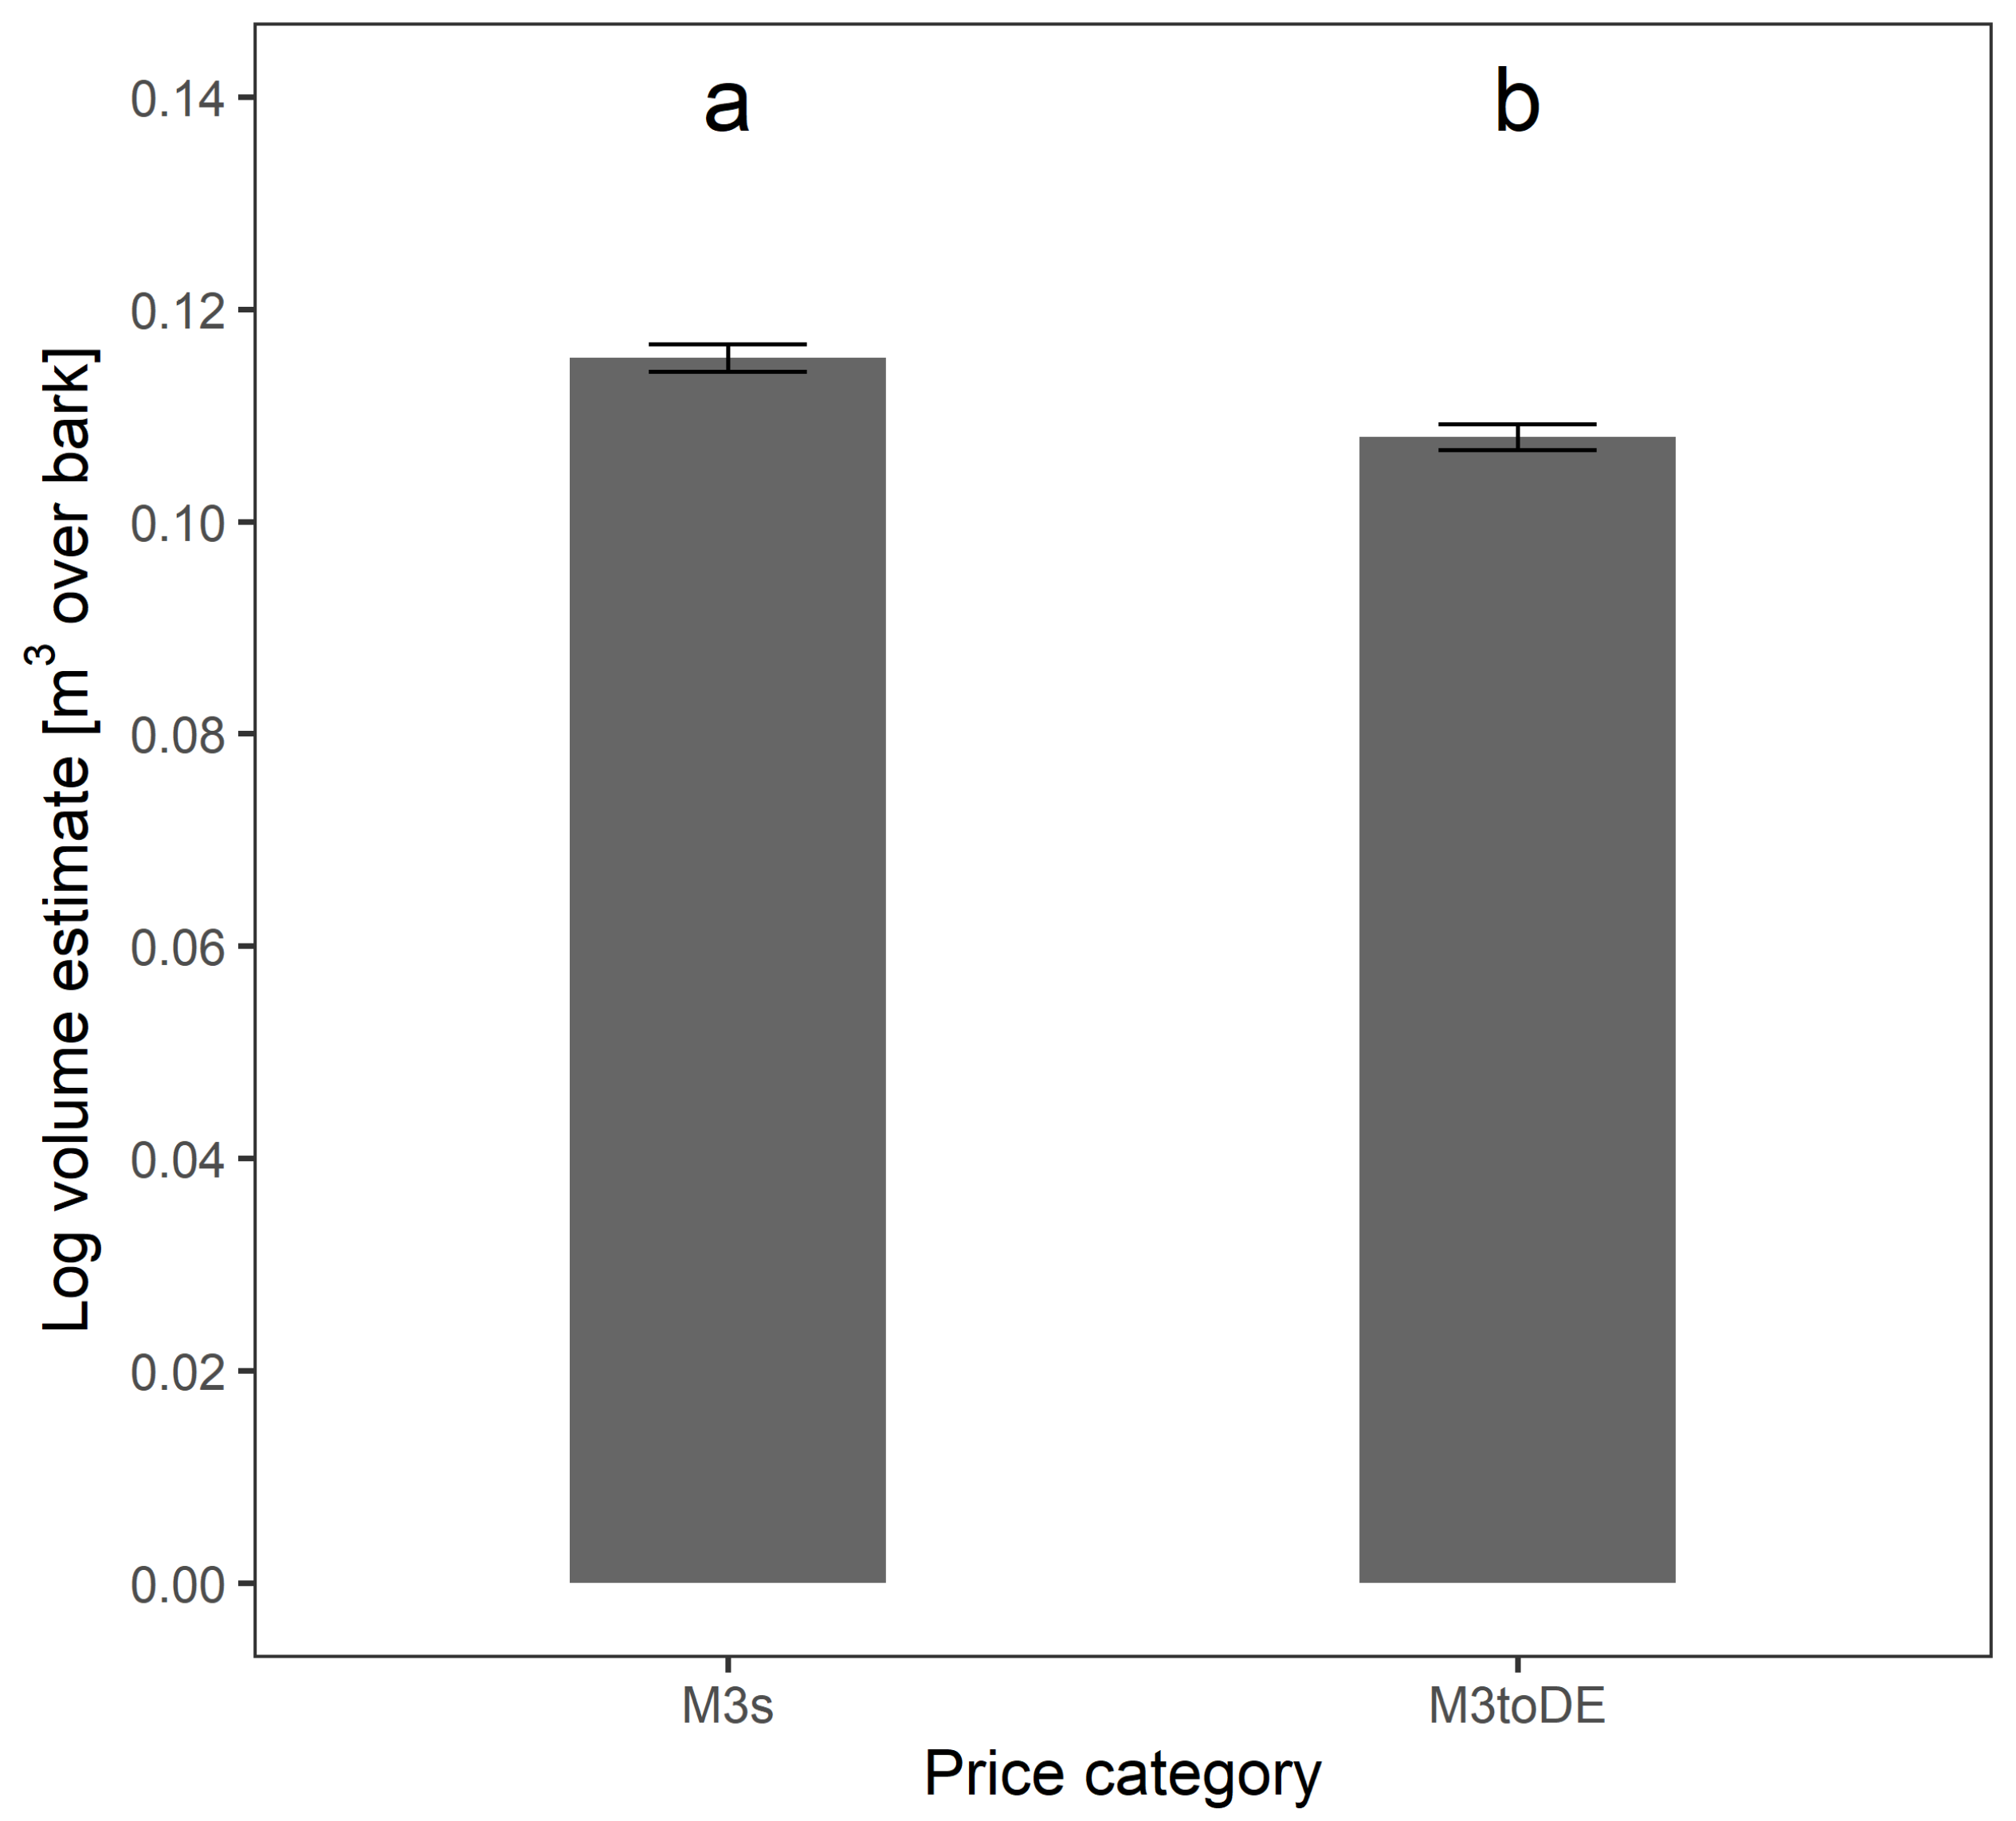
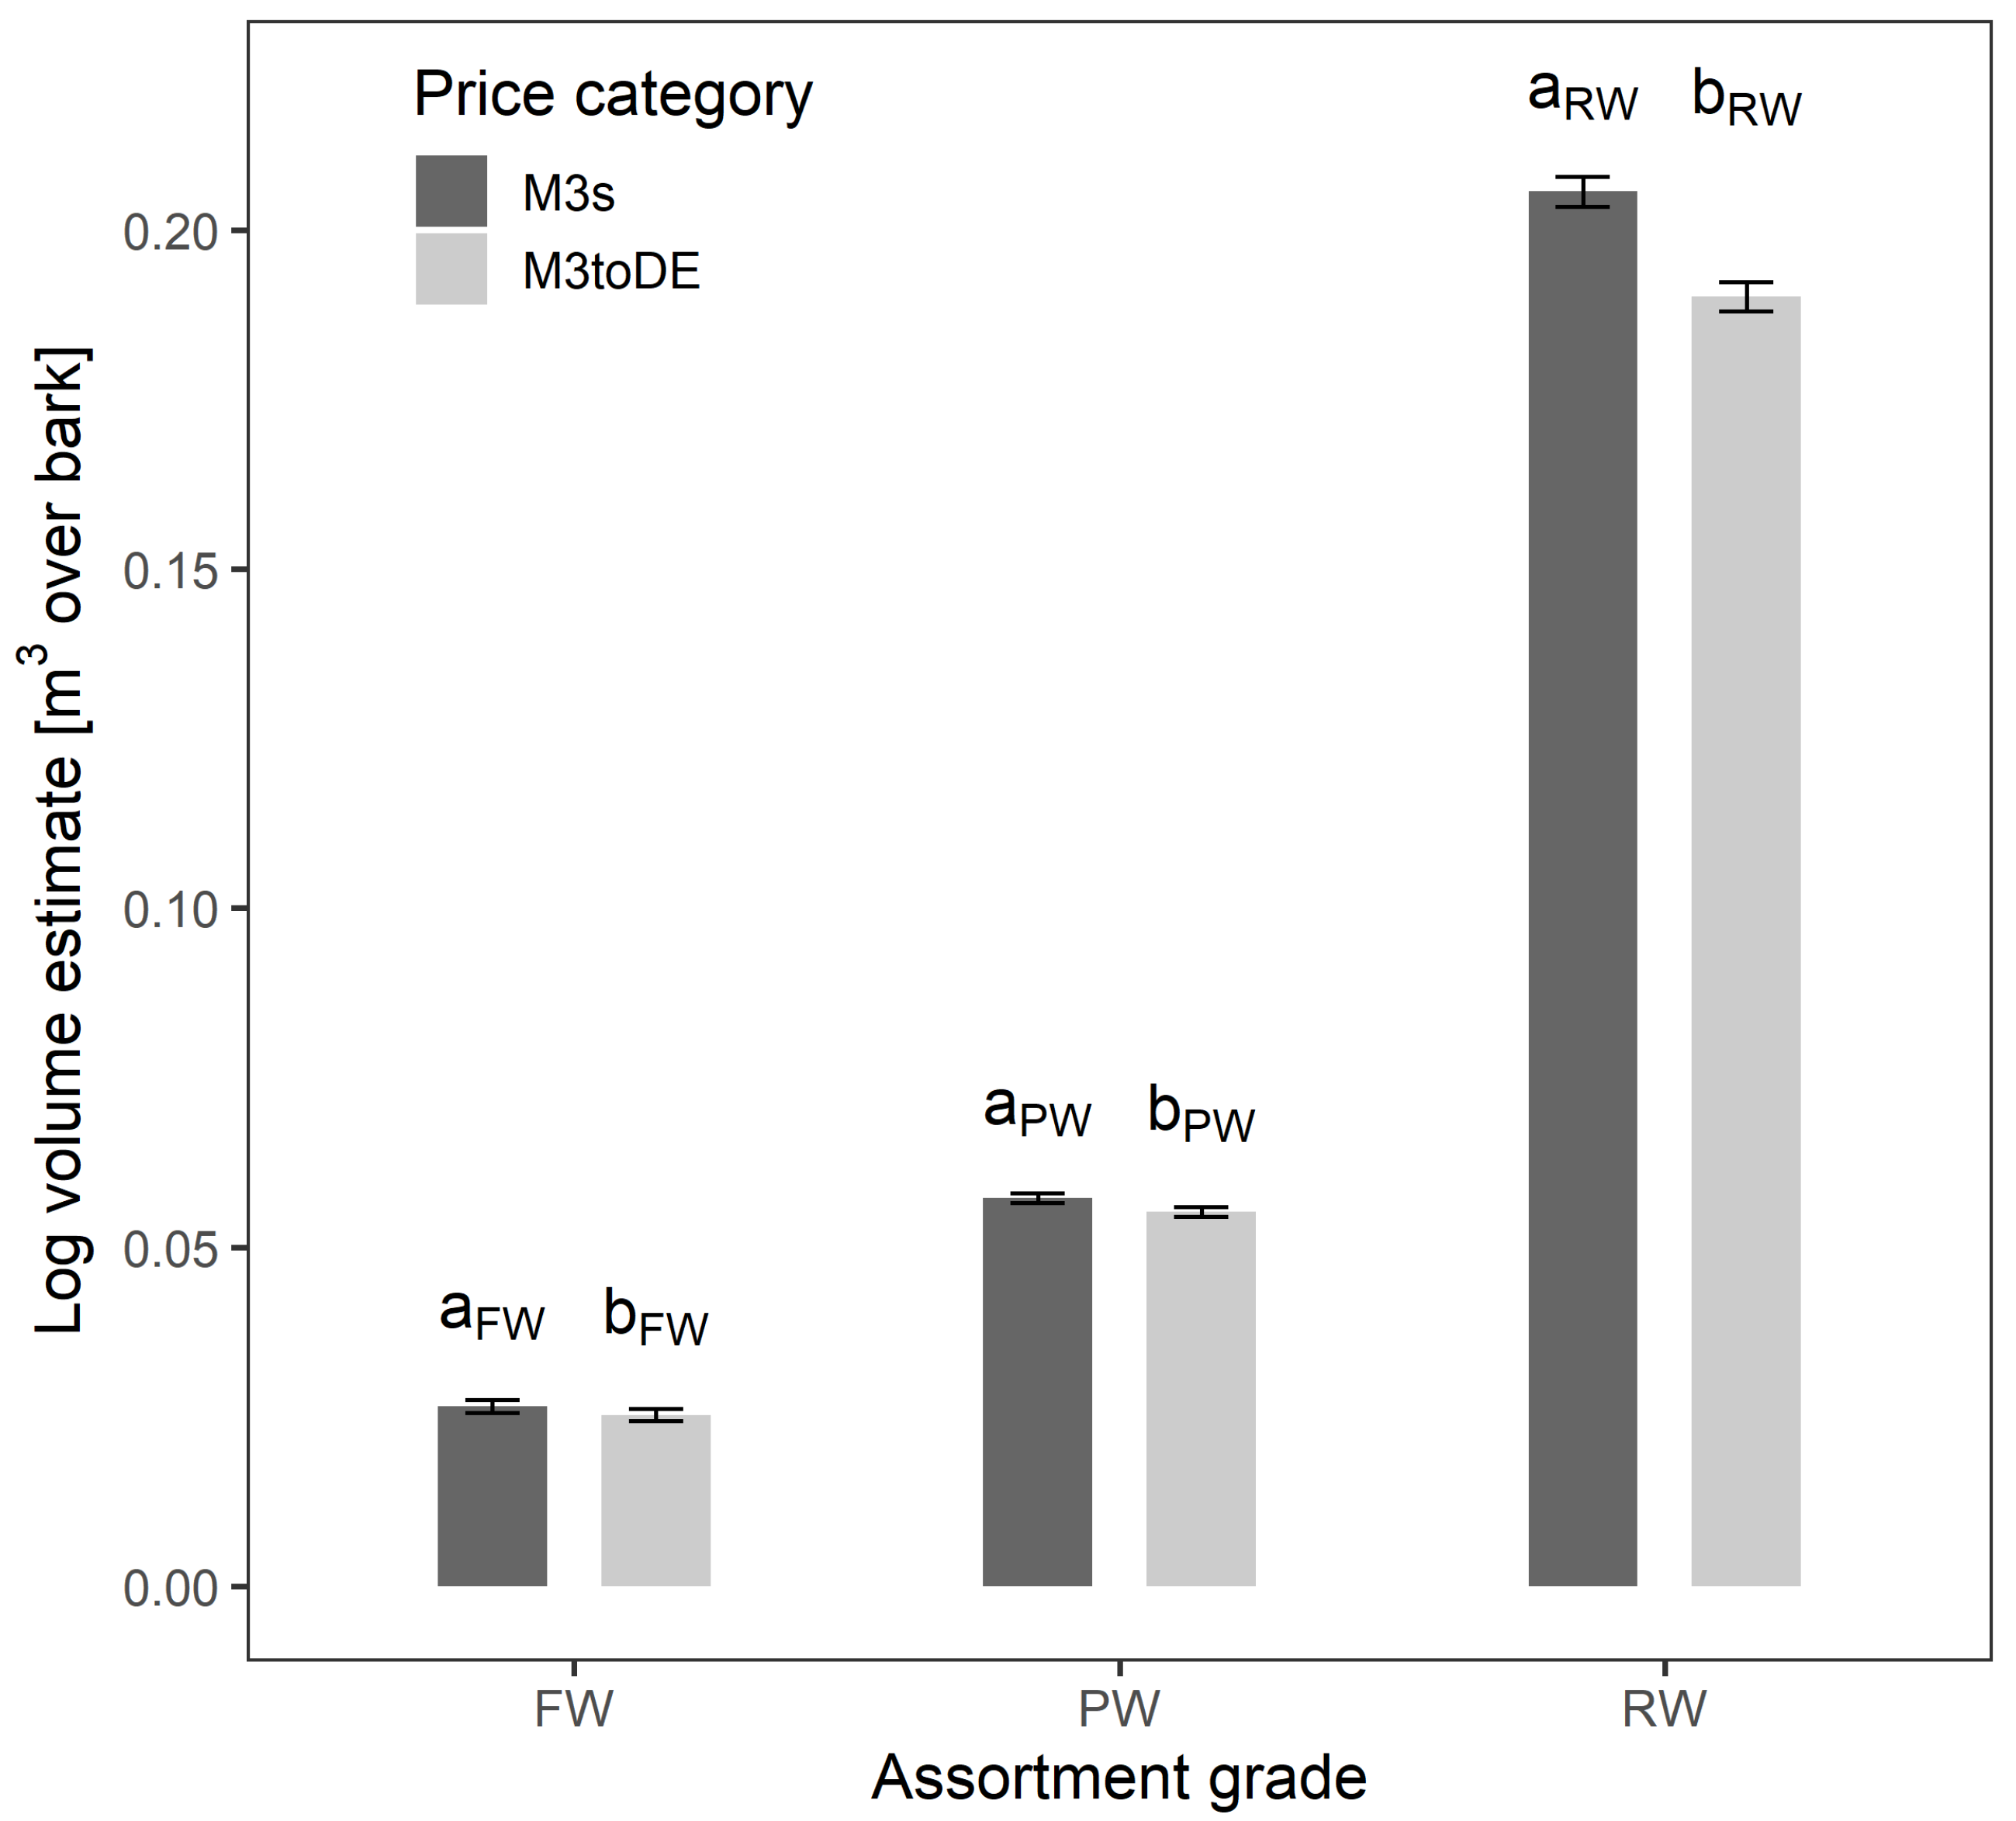
A significant difference was found between mean over-bark log volumes estimated according to the M3s and M3toDE price categories (V = 406,897,487, p < 0.001), as Figure 3 shows. Significant differences between mean over-bark log volumes were also found in individual assortment grades—in the roundwood (V = 75,194,338, p < 0.001), pulpwood (V = 86,078,798, p < 0.001) and firewood (V = 2,645,658, p < 0.001), as Figure 4 shows.
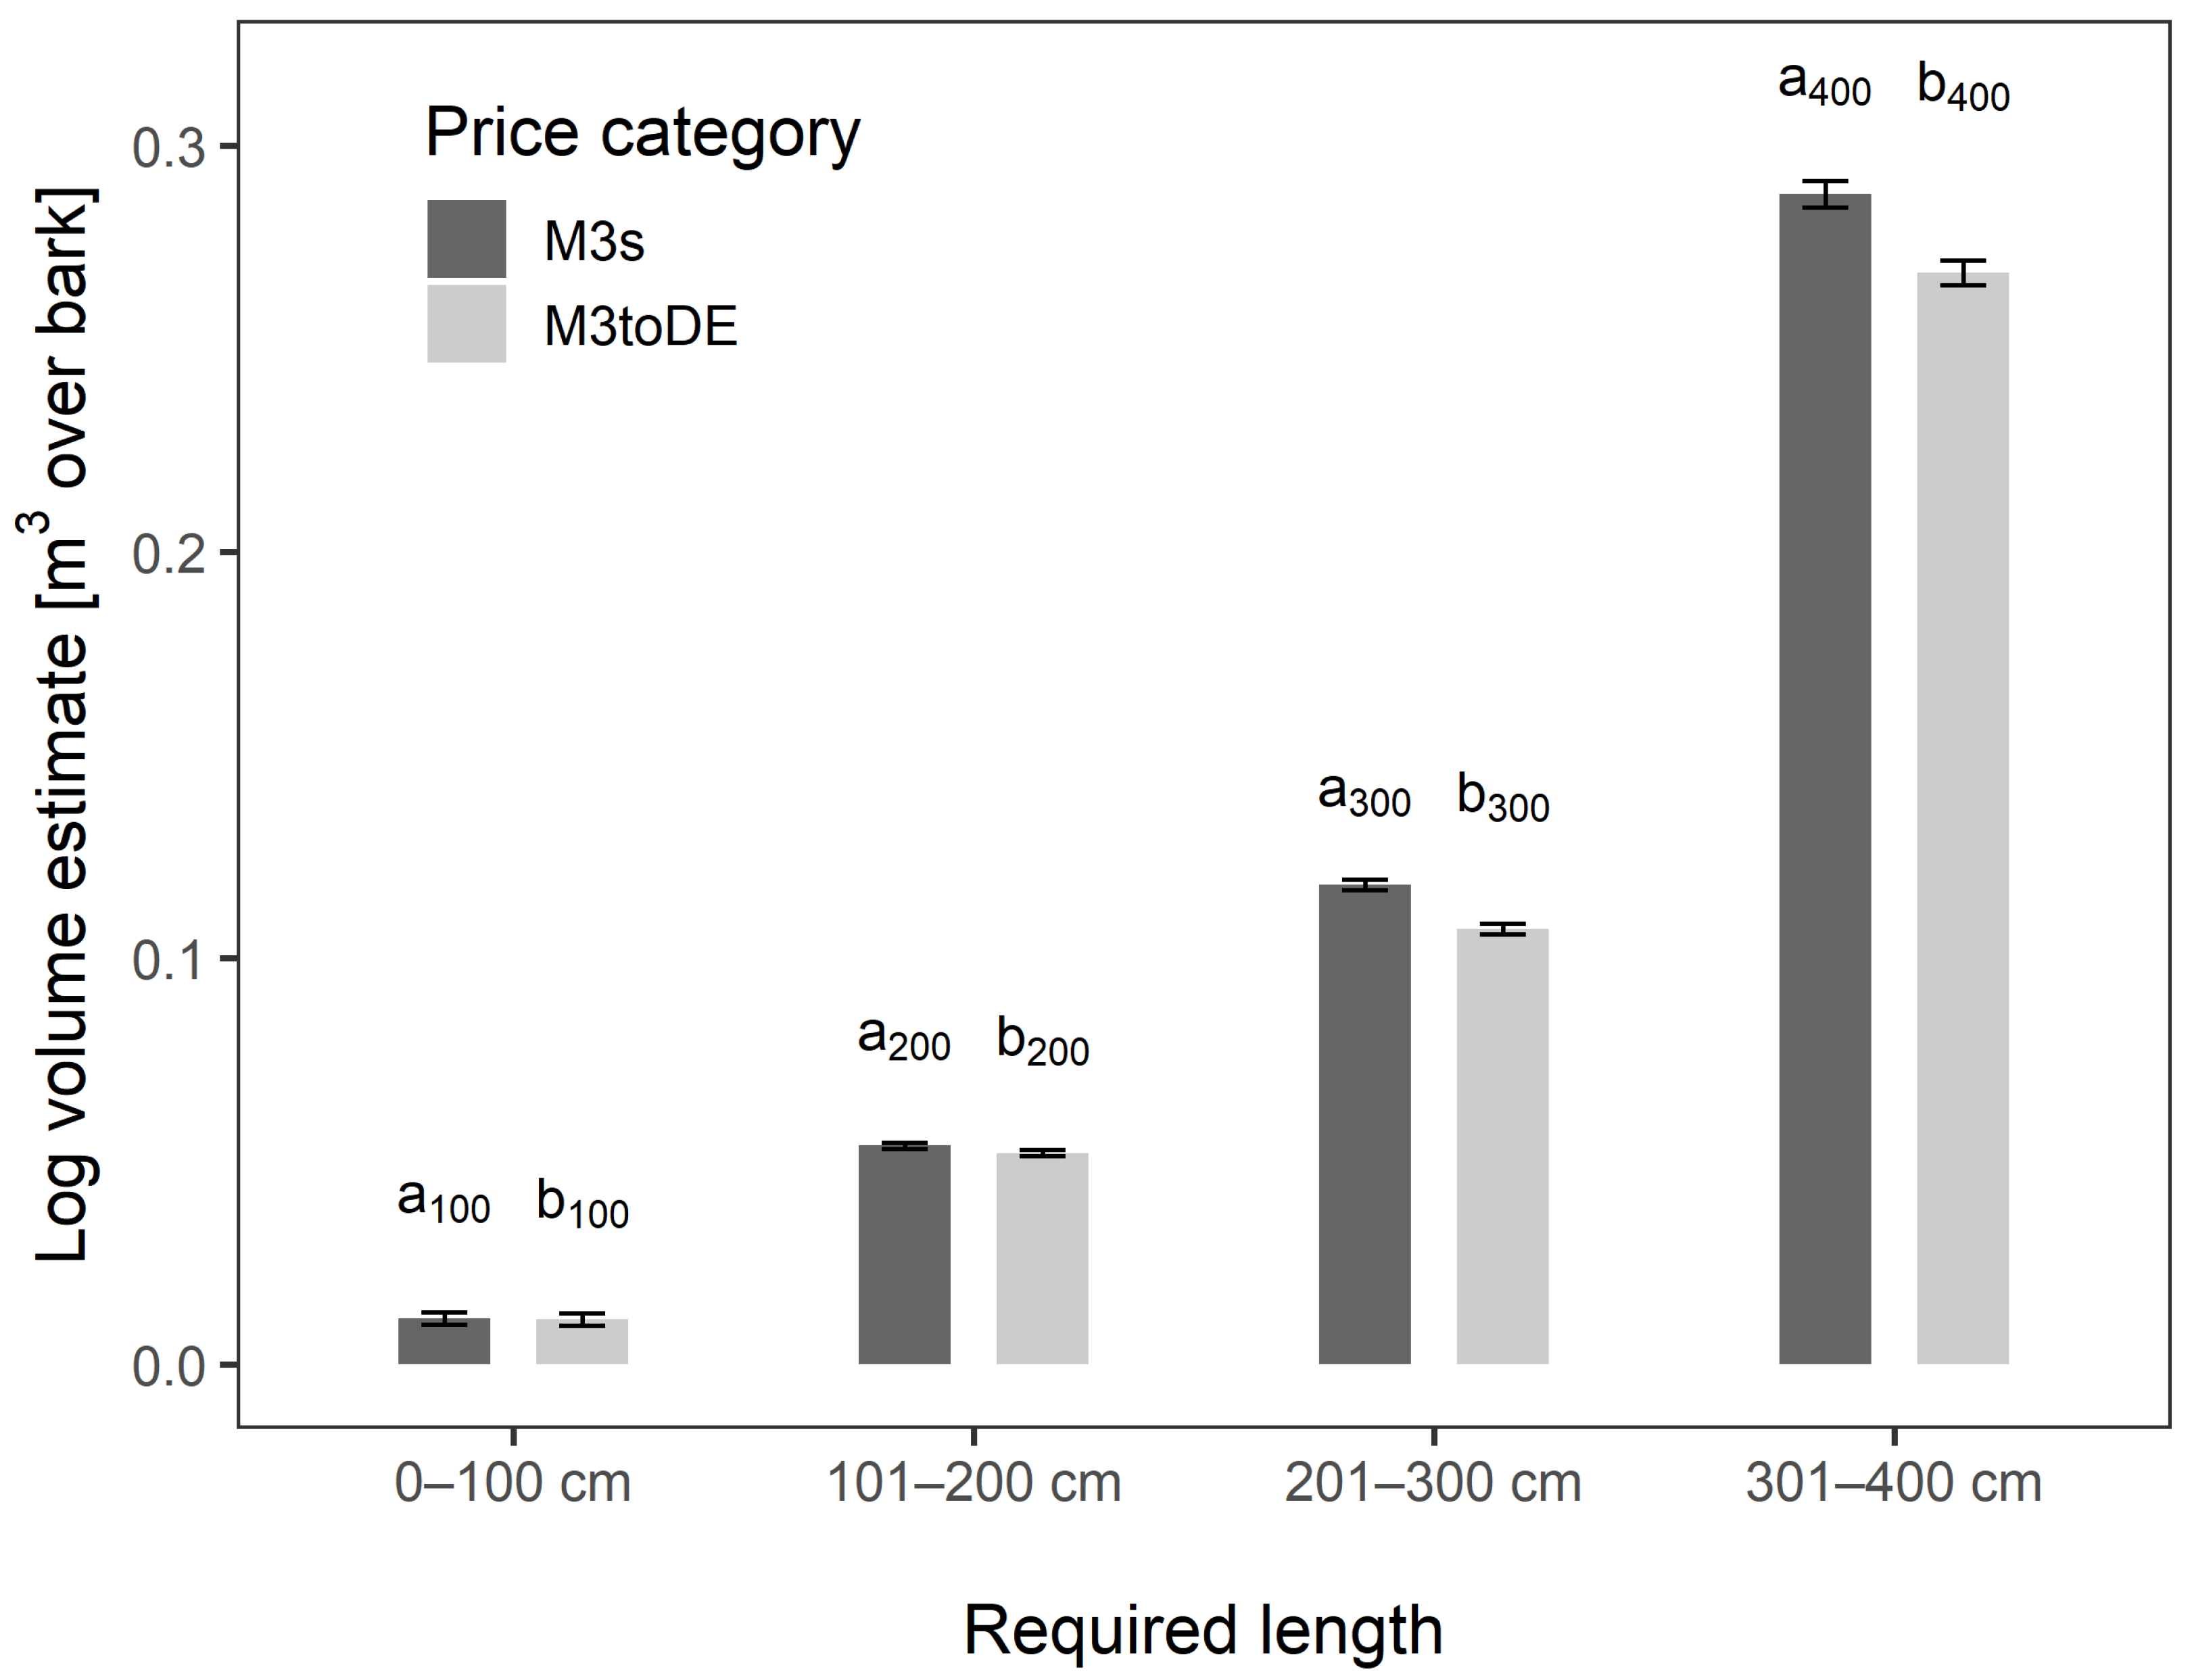
Significant differences between mean over-bark log volumes were also found in each required length category of logs—in the 0–100 cm (V = 36,568, p = 0.01), in the 101–200 cm (V = 102,461,502, p < 0.001), in the 201–300 cm (V = 25,761,921, p < 0.001), and in the 301–400 cm (V = 17,624,249, p < 0.001) categories, as Figure 5 shows.
After separating butt logs from other logs, double bark thickness was determined for each log in both groups according to the DBM, PLM, and PNM bark deduction methods. These values were then used individually to estimate under-bark volumes of the log according to the M3toDE price category (Table 4). The mean required length of butt logs was 292 cm and their mean midspan diameter was 267 mm. In contrast, the mean required length of other logs was 245 cm and their mean midspan diameter was 196 mm. In the butt log group, bark accounted for 175.58 m3 (18.91%) of the total volume when using the DBM. Linear modelling (the PLM) yielded a difference between over- and under-bark volume of 185.93 m3 (20.03%) and the PNM yielded a difference 177.32 m3 (19.10%). In the other log group, bark accounted for 165.30 m3 (7.21%) of the total volume when using the DBM. The PLM yielded a difference between over- and under-bark volume of 231.97 m3 (10.12%) and the PNM yielded a difference 167.32 m3 (7.30%).
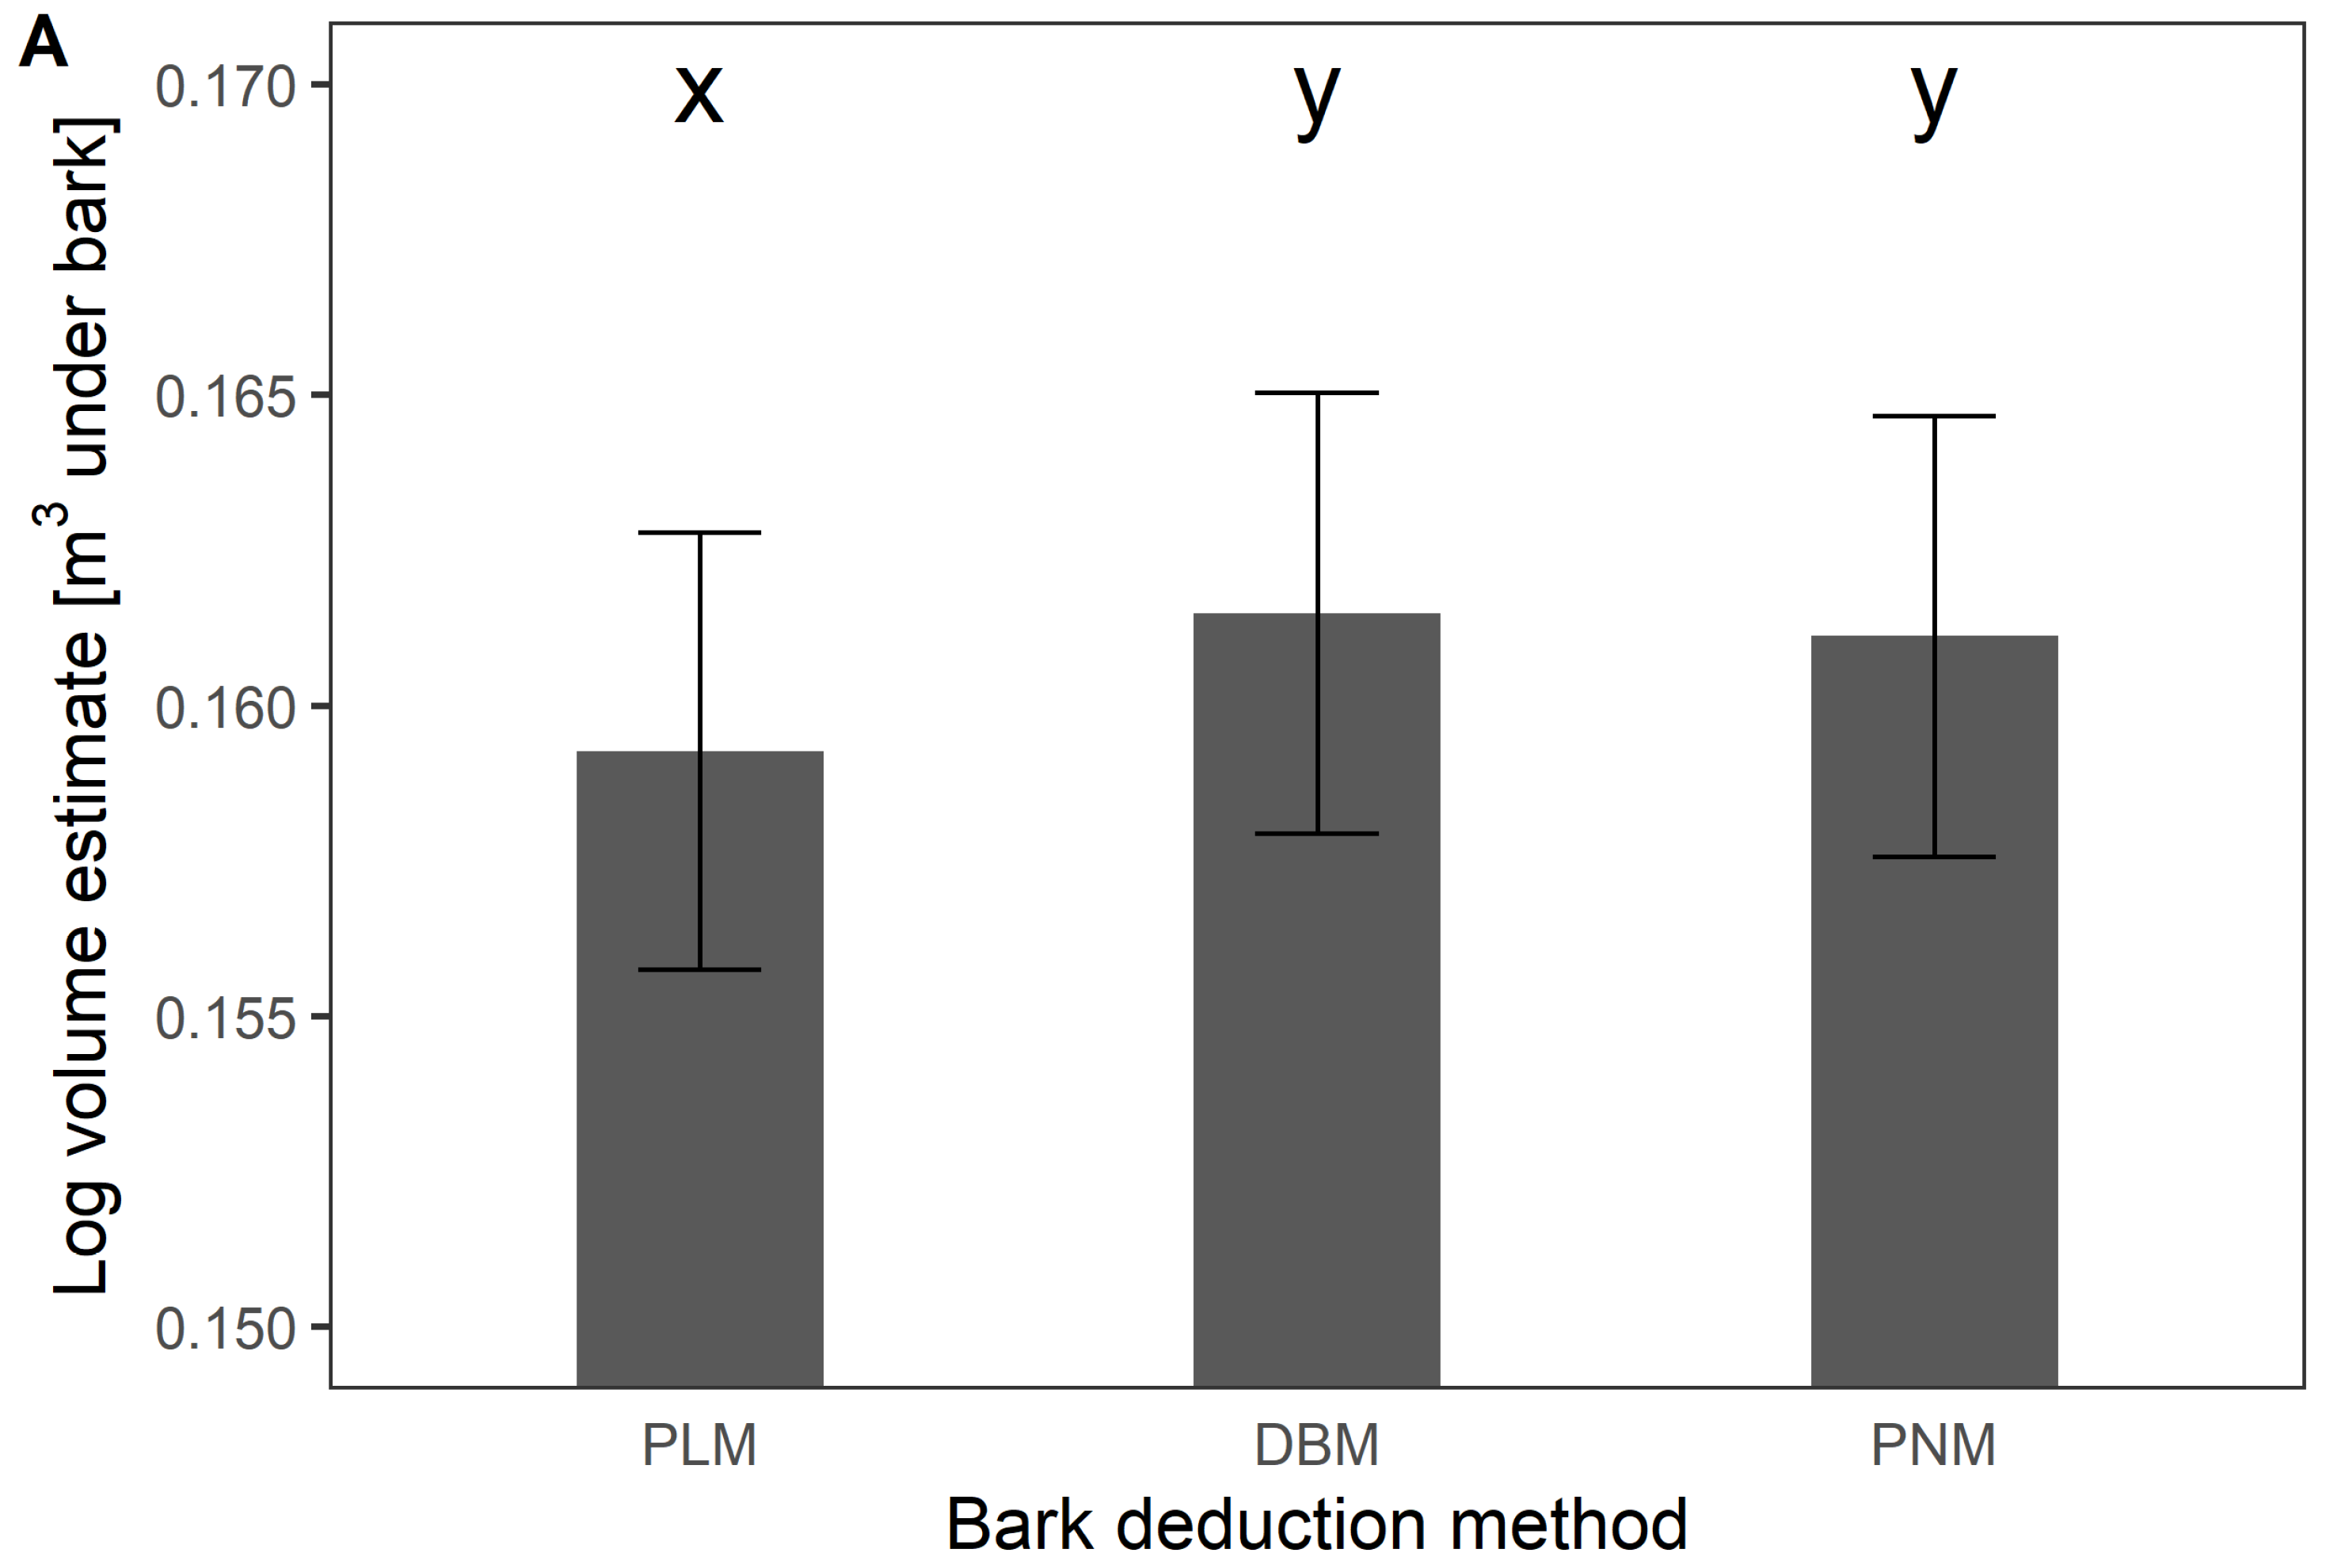
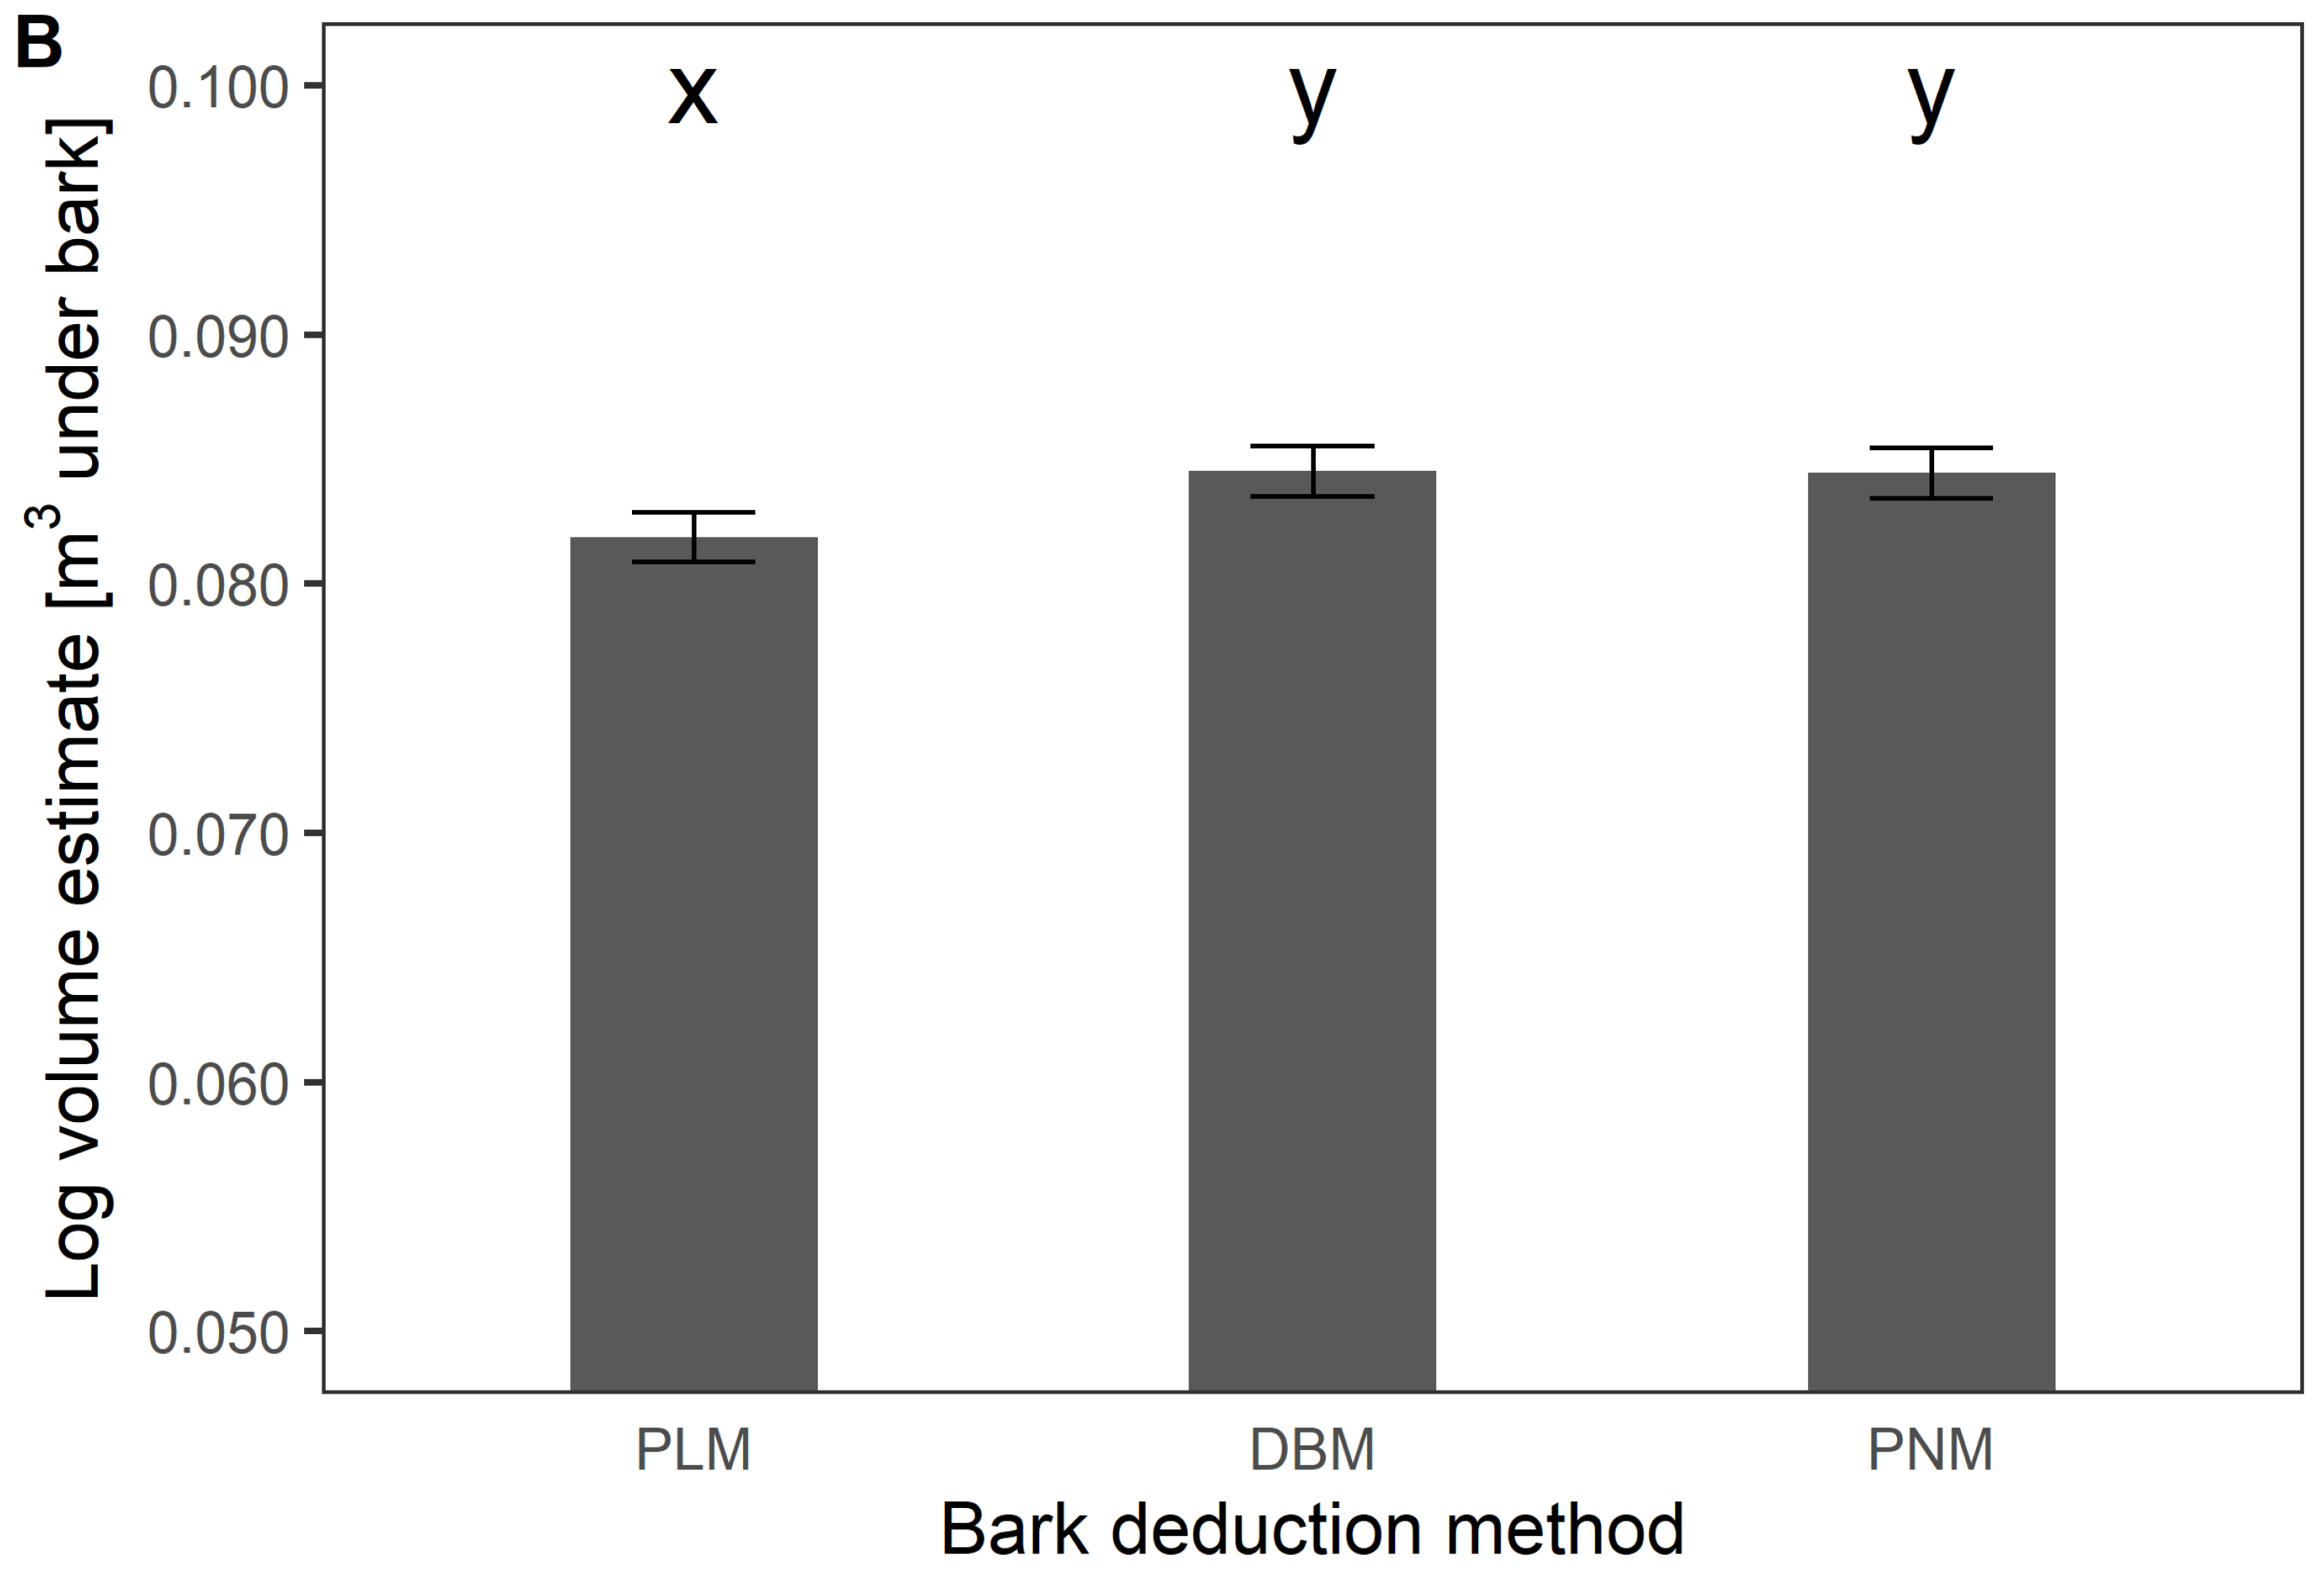
We found a significant difference between the under-bark volumes estimated through the selected bark deduction methods for butt logs (Friedman χ2 = 1076.7, df = 2, p < 0.001) and also for other logs (Friedman χ2 = 13,710, df = 2, p < 0.001). However, multiple comparisons revealed that the difference between under-bark volume estimates using the DBM and the PNM was not significant for butt logs (p = 0.099; Figure 6A), as well as for other logs (p > 0.99; Figure 6B).
4. Discussion
The total over-bark volume of all produced Scots pine logs estimated according to the M3s price category was 6.48% higher than the total volume estimated by the M3toDE price category. A significant difference was also found for the mean over-bark log volumes estimated through the two price categories, both for all logs and particular assortment grades. Löwe et al. [15] found similar results in a study of Norway spruce (Picea abies [L.] Karst) logs, where the results revealed that the difference between the total volumes of these two price categories was 5.67% and significant for the roundwood, pulpwood, and firewood grades. The relative differences found between the total volume estimated by the M3s and M3toDe price categories in this study and in the study conducted by Löwe et al. [15] could be caused by the tree species that was studied. The measured parameters of each tree species can be affected by thickness and structure of the bark, surface and tapering of the stem, branching density, etc. The midspan diameter and required length distributions of studied logs can also have some effect on the relative difference between total volumes. Our results revealed significant differences between mean over-bark volumes estimated by the M3s and M3toDe price categories, regardless of the log required length.
However, based on the specific historical development of forestry in Czechia, the volume of timber is typically estimated using the Huber formula [21] and from the log midspan diameter rounded down to the closest centimeter [28]. This is despite the fact that it has been proven that the determination of volume according to the Huber method underestimates the volume for geometric shapes, such as cone and neoloid, compared to the volume estimate by the Newton section method [16]. Therefore, unless the overall approach to volume estimate in Czechia changes, the M3toDE or M3miDE price categories (which use the same algorithm for volume estimation) need to be used in the control and information systems of harvesters to comply the national standards and ensure records compatibility.
To estimate under-bark volumes of Scots pine logs produced by harvesters comparable to the under-bark volume estimates according to Wojnar [23], the DBM should be used rather than the PLM bark deduction method proposed by Natov and Dvořák [30]. There was no significant difference between the mean under-bark volumes estimated by the DBM and the PNM; this result was found both for butt logs and other logs.
However, it is important to note that the compared existing double bark thickness estimation methods are based on dated material (the CCT were compiled in the 1970s). This is important, because, e.g., Stängle and Dormann [38] and Stängle et al. [39], found that bark generation by trees has decreased in Germany in a similar time frame. Therefore, perhaps the underlying data set should be evaluated for validity.
For butt logs, we found that the difference between over-bark and under-bark M3toDE volumes was the largest when using the PLM and smallest when using the DBM. Although there was a statistically significant difference between the PLM and the PNM, the relative difference between these methods was only 0.93% of the total over-bark volume. In comparison with other Scots pine logs with normal bark, the difference between over-bark and under-bark volumes was also the largest when using the PLM and smallest when using the DBM, while the relative difference between the PLM and the PNM was significantly higher and reached 2.82%. According to other studies, bark can account for 6% to 20% of the total log volume [40,41,42]. Liepiņš and Liepiņš [43] found that the average bark proportion in Scots pine stem varies from 5.5% to 34.5%. These variations can be explained mainly by the effect of tree age or its size. Bark thickness is also affected by the climatic zone, stem form, site quality, latitude of forest stands, and other aspects [44,45,46]. Several bark variations of Scots pine also exist [47].
When using the DBM and the PLM, different parameters are applied for butt logs with rough bark and other logs with “normal” bark thickness. In this study, these methods were applied to individual logs to demonstrate the differences in bark thickness. However, in practice, after cutting a tree, the harvester operator must decide whether to choose a bark deduction for rough bark or for normal bark thickness and, then, this type is used for all logs produced from the stem. The control and information system of harvesters does not allow the selection of parameters for bark deduction for each log.
To obtain reliable outputs from harvesters, regular control measurements of harvester measuring systems and, if necessary, calibration of the harvester, have to be performed [15]. If the settings of individual timber production parameters of the control and information systems are understood and regular control measurements of the accuracy of the measuring systems are performed, output estimates of timber production comparable to those based on other measurement methods, e.g., manual scaling or timber scanning, can be obtained [23].
5. Conclusions
In this study, we found that recording the over-bark volume of Scots pine logs through the M3toDE price category resulted in its significant underestimation, compared to the reference M3s price category. This would result in smaller revenues of foresters who use this price category to market their timber. On average, about one-fifth of the butt log volume consisted of bark, whereas bark accounted for less than 10% of the volume of other logs. The differences between the two studied double bark thickness deduction methods and the reference PNM showed that only linear modelling (the PLM) provided significantly different results, while differences between PNM and DBM were insignificant. Based on these results, we strongly recommend using the DBM if harvester outputs are to be compared with the GTS results that use the PNM.
Because setting PLM parameters is simpler and saves time compared to setting individual DBM values, the PLM can still be considered when using parameters for butt logs with rough bark. In this case, statistically significant differences between the PLM and the PNM were also found, however, the overall difference was smaller than 1%. On the other hand, this would complicate comparison with manual measurement records. For other logs, with normal bark thickness, we strongly recommend not using the PLM. In order to support these results, it would be appropriate to carry out a similar experiment on a larger dataset from different harvesters. It would also be useful to carry out other studies to verify the differences between bark deduction methods recommended by the GEH for other tree species in Czechia.
Author Contributions
Conceptualization, P.N.; Data Curation, M.S.; Formal Analysis, M.S., R.L. (Radim Löwe) and M.J.; Funding Acquisition, M.S. and R.L. (Radim Löwe); Investigation, M.S. and R.L. (Radim Löwe); Methodology, M.S., R.L. (Radim Löwe), M.J., and P.N.; Project Administration, M.S. and R.L. (Radim Löwe); Resources, M.S., R.L. (Radim Löwe), M.J., and R.L. (Rostislav Linda); Software, P.N.; Supervision, J.D.; Validation, J.D.; Writing—Original Draft, R.L. (Radim Löwe) and M.S.; Writing—Review & Editing, M.S., R.L. (Radim Löwe), M.J., P.N., and R.L. (Rostislav Linda). All authors have read and agreed to the published version of the manuscript.
Funding
This research was funded by the National Agency for Agricultural Research Czech Republic under the project no. QJ1520005: “Optimization of cut-to-length logging and grading of harvester-processed timber and proposed control procedures of timber volume measurements accuracy with the objective to enhance the production function of forests and maintain stand stability with respect to harmful agents” and by the Ministry of Education, Youth and Sports Czech Republic under the project MOBILITY 8J20PL062: “Analysis of the Impact of Harvester Technology on Forest Ecosystem depending on Work Performance”.
Acknowledgments
We would like to thank the private forest company that allowed us to collect data from its harvester.
Conflicts of Interest
The authors declare no conflict of interest.
References
- Pulkki, R. Cut-to-length, tree-length or full tree harvesting? Cent. Woodl. 1997, 1, 22–27. [Google Scholar]
- Malinen, J.; Kilpeläinen, H.; Wall, T.; Verkasalo, E. Variation in the value recovery when bucking to alternative timber assortments and log dimensions. For. Stud. 2006, 45, 89–100. [Google Scholar]
- Zinkevičius, R.; Steponavičius, D.; Vitunskas, D.; Činga, G. Comparison of harvester and motor-manual logging in intermediate cuttings of deciduous stands. Turk. J. Agric. For. 2012, 36, 591–600. [Google Scholar] [CrossRef]
- Spinelli, R.; Lombardini, C.; Magagnotti, N. The effect of mechanization level and harvesting system on the thinning cost of Mediterranean softwood plantations. Silva Fenn. 2014, 48, 1–15. [Google Scholar] [CrossRef] [Green Version]
- Mederski, P.S.; Bembenek, M.; Karaszewski, Z.; Lacka, A.; Szcepanska-Álvarez, A.; Rosinska, M. Estimating and modelling harvester productivity in pine stands of different ages, densities and thinning intensities. Croat. J. For. Eng. 2016, 37, 27–36. [Google Scholar]
- Soman, H.; Kizha, A.R.; Munoz, B.; Kenefic, L.; Kanoti, K. Production Economics: Comparing Hybrid Tree-Length with Whole-Tree Harvesting Method. Int. J. For. Res. 2020, 93, 389–400. [Google Scholar] [CrossRef]
- Gellerstedt, S.; Dahlin, B. Cut-to-length: The next decade. Int. J. For. Eng. 1999, 10, 17–25. [Google Scholar]
- Lundbäck, M.; Häggström, C.; Nordfjell, T. Worldwide Trends in the Methods and Systems for Harvesting, Extraction and Transportation of Roundwood. In Proceedings of the 6th International Forest Engineering Conference “Quenching our thirst for new Knowledge”, Rotorua, New Zealand, 16–19 April 2018; pp. 1–3. [Google Scholar]
- Ferrari, E.; Spinelli, R.; Cavallo, E.; Magagnotti, N. Attitudes towards mechanized cut-to-length technology among logging contractors in Northern Italy. Scand. J. 2012, 27, 800–806. [Google Scholar] [CrossRef]
- Louis, L.T.; Kizha, A.R. Calculating the cost of integrated harvesting of small-diameter trees dominated stand using various apportioning methods. In Proceedings of the 52nd International Symposium on Forestry Mechanization, “Exceeding the Vision: Forest Mechanization of the Future”, Sopron, Hungary, 6–9 October 2019; pp. 613–622. [Google Scholar]
- Moskalik, T.; Borz, S.A.; Dvořák, J.; Ferenčík, M.; Glushkov, S.; Muiste, P.; Lazdinš, A.; Styranivsky, O. Timber Harvesting Methods in Eastern European Countries: A Review. Croat. J. For. Eng. 2017, 38, 231–241. [Google Scholar]
- Dvořák, J.; Chytrý, M.; Natov, P.; Jankovský, M.; Beljan, K. Long-term Cost Analysis of Mid-performance Harvesters in Czech Conditions. Austrian J. For. Sci. 2019, 136, 351–372. [Google Scholar]
- MZe. Zpráva o Stavu Lesa a Lesního Hospodářství České Republiky v Roce 2018; Ministry of Agriculture: Prague, Czech Republic, 2019; 110p, ISBN 978-80-7434-530-2.
- Dvořák, J.; Bystrický, R.; Hošková, P.; Hrib, M.; Jarkovská, M.; Kováč, J.; Krilek, J.; Natov, P.; Natovová, L. The Use of Harvester Technology in Production Forests, 1st ed.; Lesnická Práce s.r.o.: Kostelec nad Černými lesy, Czech Republic, 2011; 156p, ISBN 978-80-7458-018-5. [Google Scholar]
- Löwe, R.; Sedmíková, M.; Natov, P.; Jankovský, M.; Hejcmanová, P.; Dvořák, J. Differences in Timber Volume Estimates Using Various Algorithms Available in the Control and Information Systems of Harvesters. Forests 2019, 10, 388. [Google Scholar] [CrossRef] [Green Version]
- León, G.C.; Uranga-Valencia, L.P. heoretical Evolution of Huber and Smalian Methods Applied to Tree Stem Classical Geometries. Bosque 2013, 34, 311–317. [Google Scholar] [CrossRef] [Green Version]
- Diéguez-Aranda, U.; Barrio-Anta, F.; Castedo-Dorado, F.; Ruíz-González, A.D.; Álvarez-Taboada, M.F.; Álvarez-González, J.G.; Rojo-Albareca, A. Dendrometría; Mundi-Prensa: Madrid, Spain, 2003; 327p. [Google Scholar]
- Avery, T.E.; Burkhart, H.E. Forest Measurements; Mc Graw Hill: New York, NY, USA, 2002; 456p. [Google Scholar]
- Van Laar, A.; Akça, A. Forest Mensuration; Springer: Dordrecht, The Netherlands, 2007; 383p. [Google Scholar]
- West, P.W. Tree and Forest Measurement; Springer: Berlin, Germany, 2004; 167p. [Google Scholar]
- Graves, H.S. Forest Mensuration; John Wiley and Sons: New York, NY, USA, 1906; 458p. [Google Scholar]
- Husch, B.; Beers, T.W.; Kershaw, J.A., Jr. Forest Mensuration, 4th ed.; John Wiley and Sons: New York, NY, USA, 2003; 443p, ISBN 978-0-471-01850-6. [Google Scholar]
- Wojnar, T. Doporučená Pravidla pro Měření a Třídění Dříví v ČR 2008, 2nd ed.; Lesnická Práce s.r.o.: Kostelec nad Černými lesy, Czech Republic, 2007; 147p, ISBN 978-80-87154-01-4. [Google Scholar]
- Giedrowicz, A.; Staniszewski, P. Accuracy of selected methods of the determination of Scots pine logs volume. Sylwan 2017, 161, 892–897. [Google Scholar] [CrossRef]
- Polkowski, K.; Zarzyński, P.; Tomusiak, R. Accuracy of methods to determine under bark volume of logs according to the PN−D−95000:2002 standard—A case study of Scots pine (Pinus sylvestris L.) from the Płaska Forest District. Sylwan 2019, 163, 460–468. [Google Scholar] [CrossRef]
- Lindblad, J. Puutavaran Mittaus (Timber Measurement); Tapion Taskukirja, Research and Development Center Tapio: Tapio, Finland, 2008. [Google Scholar]
- Miklaševičs, Z. The analysis of coniferous logs top diameter measurement accuracy using harvester and 3D systems. Bull. Transilv. Univ. Braşov 2017, 10, 35–42. [Google Scholar]
- Jankovský, M.; Natov, P.; Dvořák, J.; Szala, L. Norway spruce bark thickness models based on log midspan diameter for use in mechanized forest harvesting in Czechia. Scand. J. 2019, 34, 617–626. [Google Scholar] [CrossRef]
- ČSN. Standard n. 48 0009: Tabulky Objemu Kulatiny bez Kůry Podle Středové Tloušťky Měřené v kůře (Tables of Roundwood Inside Bark Volume According to Midspan Diameter Measured over Bark); ČSN: Prague, Czech Republic, 1977; 592p. [Google Scholar]
- Natov, P.; Dvořák, J. Doporučená Pravidla pro Elektronický Příjem Dříví Harvestory v ČR 2018; Produkce BPP s.r.o.: Litomyšl, Czech Republic, 2018; 136p, ISBN 978-80-906874-7-9. [Google Scholar]
- Skogforsk the Forest Research Institute of Sweden. Project StanForD Classic Documents—Last Update 18 April 2012. Available online: https://www.skogforsk.se/english/projects/stanford/ (accessed on 12 December 2019).
- Skogforsk the Forest Research Institute of Sweden. Appendix- Standard for Forest Data and Communications: Definitions of Variables—General and Country Specific. 18 April 2012. Available online: https://www.skogforsk.se/cd_20190114161714/contentassets/b063db555a664ff8b515ce121f4a42d1/appendix1_eng_120418.pdf (accessed on 14 December 2019).
- BW-HKS, Gesetzliche Handelsklassensortierung für Rohholz (Forst-HKS) mit Ergänzungsbestimmungen für BadenWürttemberg; Ministerium für Ländlichen Raum, Ernährung, Landwirtschaft und Forsten: Stuttgart, Germany, 1983; 25p.
- Neruda, J.; Valenta, J. Factors of the efficiency of harvesters and forwarders in logging. In Proceedings of the Austro2003 Symposium. High Tech Forest Operations for Mountainous Terrain, Schlägl, Austria, 5–9 October 2003; pp. 1–11. [Google Scholar]
- Skogforsk the Forest Research Institute of Sweden. Standard for Forest Data and Communications. 27 March 2007. Available online: https://www.skogforsk.se/cd_20190114161714/contentassets/b063db555a664ff8b515ce121f4a42d1/stanford_maindoc_070327.pdf (accessed on 12 December 2019).
- MZe. Zpráva o Stavu Lesa a Lesního Hospodářství České Republiky v Roce 2013; Ministry of Agriculture: Prague, Czech Republic, 2014; 134p, ISBN 978-80-7434-153-3.
- R Core Team. R: A language and Environment for Statistical Computing; R Foundation for Statistical Computing: Vienna, Austria, 2019; Available online: https://www.R-project.org/ (accessed on 10 December 2019).
- Stängle, S.M.; Dormann, C.F. Modelling the variation of bark thickness within and between European silver fir (Abies alba Mill.) trees in southwest Germany. Forestry 2018, 91, 283–294. [Google Scholar] [CrossRef]
- Stängle, S.M.; Sauter, U.H.; Dormann, C.F. Comparison of models for estimating bark thickness of Picea abies in southwest Germany: The role of tree, stand, and environmental factors. Ann. For. Sci. 2017, 74, 1–10. [Google Scholar] [CrossRef] [Green Version]
- Heath, L.S.; Hansen, M.; Smith, J.E.; Miles, P.D.; Smith, B.W. Investigation into calculating tree biomass and carbon in the FIADB using a biomass expansion factor approach. In Forest Inventory and Analysis (FIA) Symposium 2008, Park City, UT. Proceedings RMRS-P-56CD; McWilliams, W., Moisen, G., Czaplewski, R., Eds.; US Forest Service Rocky Mountain Research Station: Fort Collins, CO, USA, 2009; 24p. [Google Scholar]
- Cellini, J.M.; Galarza, M.; Burns, S.L.; Martinez-Pastur, G.J.; Lencinas, M.V. Equations of bark thickness and volume profiles at different heights with easy-measurement variables. For. Syst. 2012, 21, 23–30. [Google Scholar] [CrossRef] [Green Version]
- Wehenkel, C.; Cruz-Cobos, F.; Carrillo, A.; Lujan-Soto, J.E. Estimating bark volumes for 16 native tree species on the Sierra Madre Occidental, Mexico. Scand. J. 2012, 27, 578–585. [Google Scholar] [CrossRef]
- Liepiņš, J.; Liepiņš, K. Evaluation of bark volume of four tree species in Latvia. In Proceedings of the Research for Rural Development–International Scientific Conference, Jelgava, Latvia, 13–15 May 2015; Volume 2, pp. 22–28. [Google Scholar]
- Wilhelmsson, L.; Arlinger, J.; Spångberg, K.; Lundqvist, S.O.; Grahn, T.; Hedenberg, Ö.; Olsson, L. Models for Predicting Wood Properties in Stems of Picea abies and Pinus sylvestris in Sweden. Scand. J. 2002, 17, 330–350. [Google Scholar] [CrossRef]
- Sonmez, T.; Keles, S.; Tilki, F. Effect of aspect, tree age and tree diameter on bark thickness of Picea orientalis. Scand. J. 2007, 22, 193–197. [Google Scholar] [CrossRef]
- Laasasenaho, J.; Melkas, T.; Aldén, S. Modelling bark thickness of Picea abies with taper curves. For. Ecol. Manag. 2005, 206, 35–47. [Google Scholar] [CrossRef]
- Jelonek, T.; Pazdrowski, W.; Arasimowicz-Jelonek, M.; Gzyl, J.; Tomczak, A.; Floryszak-Wieczorek, J. The relationship between the form of dead bark and lignin content in Scots pine (Pinus sylvestris L.). Turk. J. Agric. For. 2009, 33, 455–462. [Google Scholar] [CrossRef]
Figure 1.
The principle of estimating timber volume according to the M3s and M3toDE price categories. The volume estimated using the M3s price category is based on the estimation of partial volumes of 10 cm long sections, which are then summed. In contrast, the M3toDE price category estimates volume based on the midspan diameter (MD) of the log rounded down to the nearest whole centimeter. Both price categories express the volume of the log using its required length (RL).

Figure 2.
Comparison of double bark thickness curves using three various bark deduction methods (PNM, PLM, DBM) for Scots pine butt logs with rough bark (A) and for Scots pine logs with normal bark thickness (B).
Figure 2.
Comparison of double bark thickness curves using three various bark deduction methods (PNM, PLM, DBM) for Scots pine butt logs with rough bark (A) and for Scots pine logs with normal bark thickness (B).

Figure 3.
Differences between mean over-bark volumes estimated according to the M3s and M3toDE price categories, regardless of Scots pine log assortment grade. The different letters (a, b) indicate statistically significant differences revealed by the paired Wilcoxon rank-sum test (α = 5%), error bars indicate a 95% confidence interval.

Figure 4.
Differences between mean over-bark volumes estimated according to the M3s and M3toDE price categories in individual assortment grades of logs. The different letters (a, b) indicate statistically significant differences revealed by the paired Wilcoxon rank-sum test (α = 5%) for each grade separately. Assortment grades are distinguished by text indices (RW, PW, FW), the error bars indicate a 95% confidence interval.

Figure 5.
Differences between mean over-bark volumes estimated according to the M3s and M3toDE price categories in individual required length categories of logs. The different letters (a, b) indicate statistically significant differences revealed by the paired Wilcoxon rank-sum test (α = 5%) for each grade separately. Required length categories are distinguished by indices (100, 200, 300, 400), the error bars indicate a 95% confidence interval.

Figure 6.
Differences between mean under-bark volumes of (A) Scots pine butt logs with rough bark and (B) Scots pine logs with normal bark thickness, estimated according to the M3toDE price category using selected bark deduction methods: PLM—Parametric linear bark deduction method [30], DBM—Diameter band bark deduction method [30], PNM—Parametric nonlinear bark deduction method [23]. The different letters (x, y) indicate significant differences revealed by the Neményi post-hoc test with Bonferroni p-value correction (α = 5%), the error bars indicate a 95% confidence interval.


Table 1.
The relative distribution of required lengths and midspan diameters of logs.
| Midspan Diameter | All Logs | Assortment Grade | ||
|---|---|---|---|---|
| Roundwood | Pulpwood | Firewood | ||
| 0–100 mm o.b. | 6.5% | 0.0% | 6.7% | 33.5% |
| 101–200 mm o.b. | 42.6% | 15.4% | 62.5% | 56.8% |
| 201–300 mm o.b. | 37.7% | 59.6% | 25.0% | 8.4% |
| 301–400 mm o.b. | 11.9% | 22.5% | 5.2% | 1.3% |
| 401–500 mm o.b. | 1.2% | 2.3% | 0.5% | 0.0% |
| 501–600 mm o.b. | 0.1% | 0.2% | 0.1% | 0.0% |
| 601–700 mm o.b. | <0.1% | 0.0% | <0.1% | 0.0% |
| 100.0% | 100.0% | 100.0% | 100.0% | |
| Required Length | ||||
| 0–100 cm | 1.2% | 0.0% | 0.0% | 12.6% |
| 101–200 cm | 54.7% | 0.0% | 100.0% | 56.9% |
| 201–300 cm | 24.1% | 52.3% | 0.0% | 27.2% |
| 301–400 cm | 20.0% | 47.7% | 0.0% | 3.3% |
| 100.0% | 100.0% | 100.0% | 100.0% | |
Notes: o.b.—over bark.
Table 2.
The double bark thickness values of the diameter band bark deduction method (DBM) used for under-bark volume estimation of Scots pine timber in harvester systems according to the GEH [30]. The values for each diameter band vary depending on whether it is a butt log with rough bark or a log with normal bark thickness.
| Scots Pine (Pinus sylvestris) | ||
|---|---|---|
| Midspan Diameter (mm o.b.) | Double Bark Thickness (DBTDBM, mm) | |
| Butt Logs (Rough Bark) | Logs (Normal Bark) | |
| 0–79 | 17.71 | 2.86 |
| 80–149 | 20.00 | 4.14 |
| 150–219 | 22.86 | 5.71 |
| 220–289 | 26.57 | 8.43 |
| 290–359 | 30.71 | 11.71 |
| 360–429 | 35.29 | 15.86 |
| 430–499 | 40.14 | 20.29 |
| 500–569 | 45.43 | 25.43 |
| 570–639 | 51.14 | 31.14 |
| 640–700 | 57.00 | 37.43 |
Notes: o.b.—over bark, DBTDBM—double bark thickness according to the diameter band bark deduction method.
Table 3.
Measured Scots pine timber parameters and estimated over-bark volumes of logs according to the M3s and M3toDE price categories.
Table 3.
Measured Scots pine timber parameters and estimated over-bark volumes of logs according to the M3s and M3toDE price categories.
| Parameter of Logs | All Logs | Assortment Grade | ||
|---|---|---|---|---|
| Roundwood | Pulpwood | Firewood | ||
| n = 29,834 | n = 12,276 | n = 14,751 | n = 2807 | |
| Mean TL (cm) | 259 (SD = 85) | 344 (66) | 203 (2) | 180 (66) |
| Mean RL (cm) | 252 (81) | 332 (65) | 200 (0) | 180 (66) |
| Mean MD (mm o.b.) | 209 (78) | 261 (62) | 181 (64) | 128 (55) |
| Mean TD (mm o.b.) | 198 (77) | 250 (59) | 169 (64) | 118 (56) |
| Total VM3s (m3 o.b.) | 3444.18 | 2525.89 | 843.98 | 74.31 |
| Total VM3toDE (m3 o.b.) | 3220.94 | 2335.43 | 814.77 | 70.75 |
| RD (%) | −6.48 | −7.54 | −3.46 | −5.80 |
Notes: o.b.—over bark, SD—standard deviation, n—number of logs, TL—total length, RL—required length, MD—midspan diameter, TD—top end diameter, VM3s—log over-bark volume estimate according to the M3s price category [32], VM3toDE—log over-bark volume estimate according to the M3toDE price category [32], RD—relative difference between the total over-bark volume of logs estimated according to the M3s price category and the total over-bark volume estimated according to the M3toDE price category.
Table 4.
Measured Scots pine timber parameters and estimated under-bark volumes, using three different bark deduction methods (DBM, PLM, PNM), for butt logs with rough bark and other logs with normal bark thickness.
Table 4.
Measured Scots pine timber parameters and estimated under-bark volumes, using three different bark deduction methods (DBM, PLM, PNM), for butt logs with rough bark and other logs with normal bark thickness.
| Parameter of Logs | Scots Pine (Pinus sylvestris) | |
|---|---|---|
| Butt Logs (Rough Bark) | Logs (Normal Bark) | |
| n = 4661 | n = 25,173 | |
| Mean VM3toDE (m3 o.b.) | 0.199 | 0.091 |
| Total VM3toDE (m3 o.b.) | 928.266 | 2292.675 |
| Mean DBTDBM (mm) | 28.2 | 6.7 |
| Mean DBTPLM (mm) | 29.7 | 9.5 |
| Mean DBTPNM (mm) | 28.4 | 6.7 |
| Total VDBM (m3 u.b.) | 752.686 | 2127.379 |
| Total VPLM (m3 u.b.) | 742.334 | 2060.705 |
| Total VPNM (m3 u.b.) | 750.945 | 2125.359 |
Notes: o.b.—over bark, n—number of logs, VM3toDE—log over-bark volume estimate according to the M3toDE price category, DBTDBM—double bark thickness according to the diameter band bark deduction method, DBTPLM—double bark thickness according to the parametric linear bark deduction method, DBTPNM—double bark thickness according to the parametric nonlinear bark deduction method, VDBM—log under-bark volume estimate according to the M3toDE price category, using the diameter band bark deduction method, VPLM—log under-bark volume estimate according to the M3toDE price category, using the parametric linear bark deduction method, VPNM—log under-bark volume estimate according to the M3toDE price category, using the parametric nonlinear bark deduction method.
© 2020 by the authors. Licensee MDPI, Basel, Switzerland. This article is an open access article distributed under the terms and conditions of the Creative Commons Attribution (CC BY) license (http://creativecommons.org/licenses/by/4.0/).
Share and Cite
MDPI and ACS Style
Sedmíková, M.; Löwe, R.; Jankovský, M.; Natov, P.; Linda, R.; Dvořák, J. Estimation of Over- and Under-Bark Volume of Scots Pine Timber Produced by Harvesters. Forests 2020, 11, 626. https://0-doi-org.brum.beds.ac.uk/10.3390/f11060626
AMA Style
Sedmíková M, Löwe R, Jankovský M, Natov P, Linda R, Dvořák J. Estimation of Over- and Under-Bark Volume of Scots Pine Timber Produced by Harvesters. Forests. 2020; 11(6):626. https://0-doi-org.brum.beds.ac.uk/10.3390/f11060626
Chicago/Turabian StyleSedmíková, Monika, Radim Löwe, Martin Jankovský, Pavel Natov, Rostislav Linda, and Jiří Dvořák. 2020. "Estimation of Over- and Under-Bark Volume of Scots Pine Timber Produced by Harvesters" Forests 11, no. 6: 626. https://0-doi-org.brum.beds.ac.uk/10.3390/f11060626
Note that from the first issue of 2016, this journal uses article numbers instead of page numbers. See further details here.