Article

Health Assessment and Genetic Structure of Monumental Norway Spruce Trees during A Bark Beetle (Ips typographus L.) Outbreak in the Białowieża Forest District, Poland

by
Justyna Anna Nowakowska
1,*,
Tom Hsiang
2,
Paulina Patynek
3,
Krzysztof Stereńczak
4,
Ireneusz Olejarski
5 and
Tomasz Oszako
3,6
1
Institute of Biological Sciences, Faculty of Biology and Environmental Sciences, Cardinal Stefan Wyszynski University in Warsaw, Wóycickiego 1/3 Street, 01-938 Warsaw, Poland
2
Environmental Sciences, University of Guelph, Guelph, ON N1G 2W1, Canada
3
Institute of Forest Sciences, Białystok University of Technology, Piłsudskiego 1A, 17-200 Hajnówka, Poland
4
Department of Geomatematics, Forest Research Institute, Braci Leśnej 3, 05-090 Sękocin Stary, Poland
5
Department of Ecology, Forest Research Institute, Braci Leśnej 3, 05-090 Sękocin Stary, Poland
6
Department of Forest Protection, Forest Research Institute, Braci Leśnej 3, 05-090 Sękocin Stary, Poland
*
Author to whom correspondence should be addressed.
Submission received: 6 May 2020 / Revised: 2 June 2020 / Accepted: 3 June 2020 / Published: 6 June 2020
(This article belongs to the Section Forest Ecology and Management)

Abstract

:
A current ongoing unprecedented outbreak of Ips typographus (L.) (Coleoptera, Curculionidae, Scolytinae) in the Białowieża Primeval Forest (BPF) has nearly eliminated Norway spruce (Picea abies L. Karst) as a major forest tree species there, since over 1 million trees have died. In this part of Europe, Norway spruce has grown for hundreds of years, previously accounting for 30% of forest species composition. The aim of this study was to evaluate 47 “Monuments of Nature” of Norway spruce as follows: (i) their current health status in the managed forests of Białowieża Forest District; (ii) possible causes and changes in their health during the last bark beetle outbreak; and (iii) potential losses from the gene pool. Our findings from ground and remote sensing inventories showed that only 12 out of 47 (25%) monumental trees protected by law survived until 2017 in the study area. The rest (75%) of the investigated trees had died. An analysis of meteorological data from Białowieża suggested that the beginning of the I. typographus outbreak in 2012 was associated with diminishing precipitation during growing seasons prior to this time and subsequent increases in annual temperature, coupled with heavy storms in 2017 toppling weakened trees. A comparison of old-growth “Monuments of Nature” spruce in the region (n = 47, average age 225 years) to seven reference spruce stands (n = 281, average age 132 years) revealed a loss of unique genetic features based on frequencies of eleven nuclear microsatellite loci. Although all studied populations had similar genetic background (FST(without NA) = 0.003 and no STRUCTURE clustering), all monumental spruce trees shared the highest parameters such as the mean observed and expected number of alleles per locus (Na = 15.909 and Ne = 7.656, respectively), mean allelic richness (AR(11) = 8.895), mean private alleles (Apriv = 0.909), and mean Shannon diversity index (I = 1.979) in comparison to the younger stands. Our results demonstrate that the loss of the old spruce trees will entail the loss of genetic variability of the Norway spruce population within the exceptionally valuable Białowieża Primeval Forest.

1. Introduction

From a historical perspective, old trees have long been protected in the Białowieża Forest, which includes the UNESCO site (142,000 ha), and the Białowieża Forest National Park (308,000 ha), containing impressive 30–50 m tall, old-growth Norway spruce (Picea abies (L.) Karst.) trees. In the Białowieża Primeval Forest (BPF, 63,000 ha in Poland), the largest remnant of a primeval old-growth forest, 47 spruce trees were designated “Monuments of Nature” between 1986 to 1996, and protected by law in Poland [1]. In part of the Białowieża Forest National Park (and its reserves), spruce is a major component of the three forest districts operating in BPF, namely Browsk, Hajnówka and Białowieża Forest Districts (FD) [2]. The life span of P. abies trees can reach over 200 years, and can contain a valuable genetic resource. Living for hundreds of years, these trees successfully faced many stress factors such as insect and fungi threat, changing climatic conditions, and disastrous historical events like logging. Therefore, it is likely that the loss of individual veteran trees, designated as “Monuments of Nature” entail the loss of part of the forest gene pool.
The European spruce bark beetle (Ips typographus L.) is a smallest member of the Scolytinae family and is the most destructive pest of P. abies, killing millions of trees during outbreaks in Europe [3]. Outbreaks may be triggered by climate change, including waves of heat and prolonged droughts [4]. Insect pests reproduce rapidly under favorable conditions, producing several generations during warm growing seasons [5,6], such as those found in forests in Europe in 2018 and currently in 2020. In the Białowieża Forest District (BFD), spruce was a species represented by most trees over 80 years old, and hence they were at great risk of attack by this bark beetle. In the BFD, an outbreak of bark beetles has been observed since 2012. Up to 2019, around 1 million Norway spruce trees have died in the BDF and over 2.5 million trees in the BPF in an 8000 ha area [7]. Currently, the composition by spruce (~30%) has been declining due to its replacement with hornbeam (Carpinus betulus L.). Gaps in the canopy cover became filled by grasses, which further prevent the natural regeneration of spruce. Based on reports from local foresters, an outbreak of I. typographus started on a few old trees, including the oldest spruces. Small bark beetles like Polygraphus poligraphus (L.), Ips amitinus (Eichh.) or Ips duplicatus (Sahlb.), and Pityogenes chalcographus (L.) (Coleoptera, Curculionidae, Scolytinae) attacked upper parts of trees and weakened them, which facilitated the attack of I. typographus on lower parts of trunks with thicker bark. The bark beetles normally act as secondary pests, attacking fresh windfall and windthrow; however, during an outbreak in BFD they also attack fully healthy trees that do not have any signs of damage [8]. Among the pathogens associated with the I. typographus outbreak are the root and butt rot fungal species belonging to Armillaria and Heterobasidion, as well as Ceratocystis polonica (Siemaszko) Moreau [9,10].
To evaluate the health status of trees, ground surveys are often conducted to assess each tree individually. Vegetation indices, including the normalized difference vegetation index, are frequently used with multispectral satellite imageries, especially to monitor live and dead trees [11,12]. Recently, the use of radar and light detection and ranging (LiDAR) has increased for forest stand examination in order to undertake appropriate management strategies [13,14] and to save time over more laborious ground surveys.
The purpose of this study was to monitor the health of spruces in the BFD designated as Monuments of Nature from the air as well as from the ground. Furthermore, a population of older spruce trees was compared to seven populations of younger spruce trees for genetic parameters. We hypothesized that long-living, dominant trees which survived more than 200 years are characterized by a greater adaptation (plasticity) to changing environments due to their genetic variability and differentiation at the population level. The specific objective of this work was to assess whether older P. abies trees, designated “Monuments of Nature” in the BFD, show different patterns of genetic differentiation, especially in the number and frequency of alleles, compared to younger populations of P. abies growing in the surrounding area.

2. Material and Methods
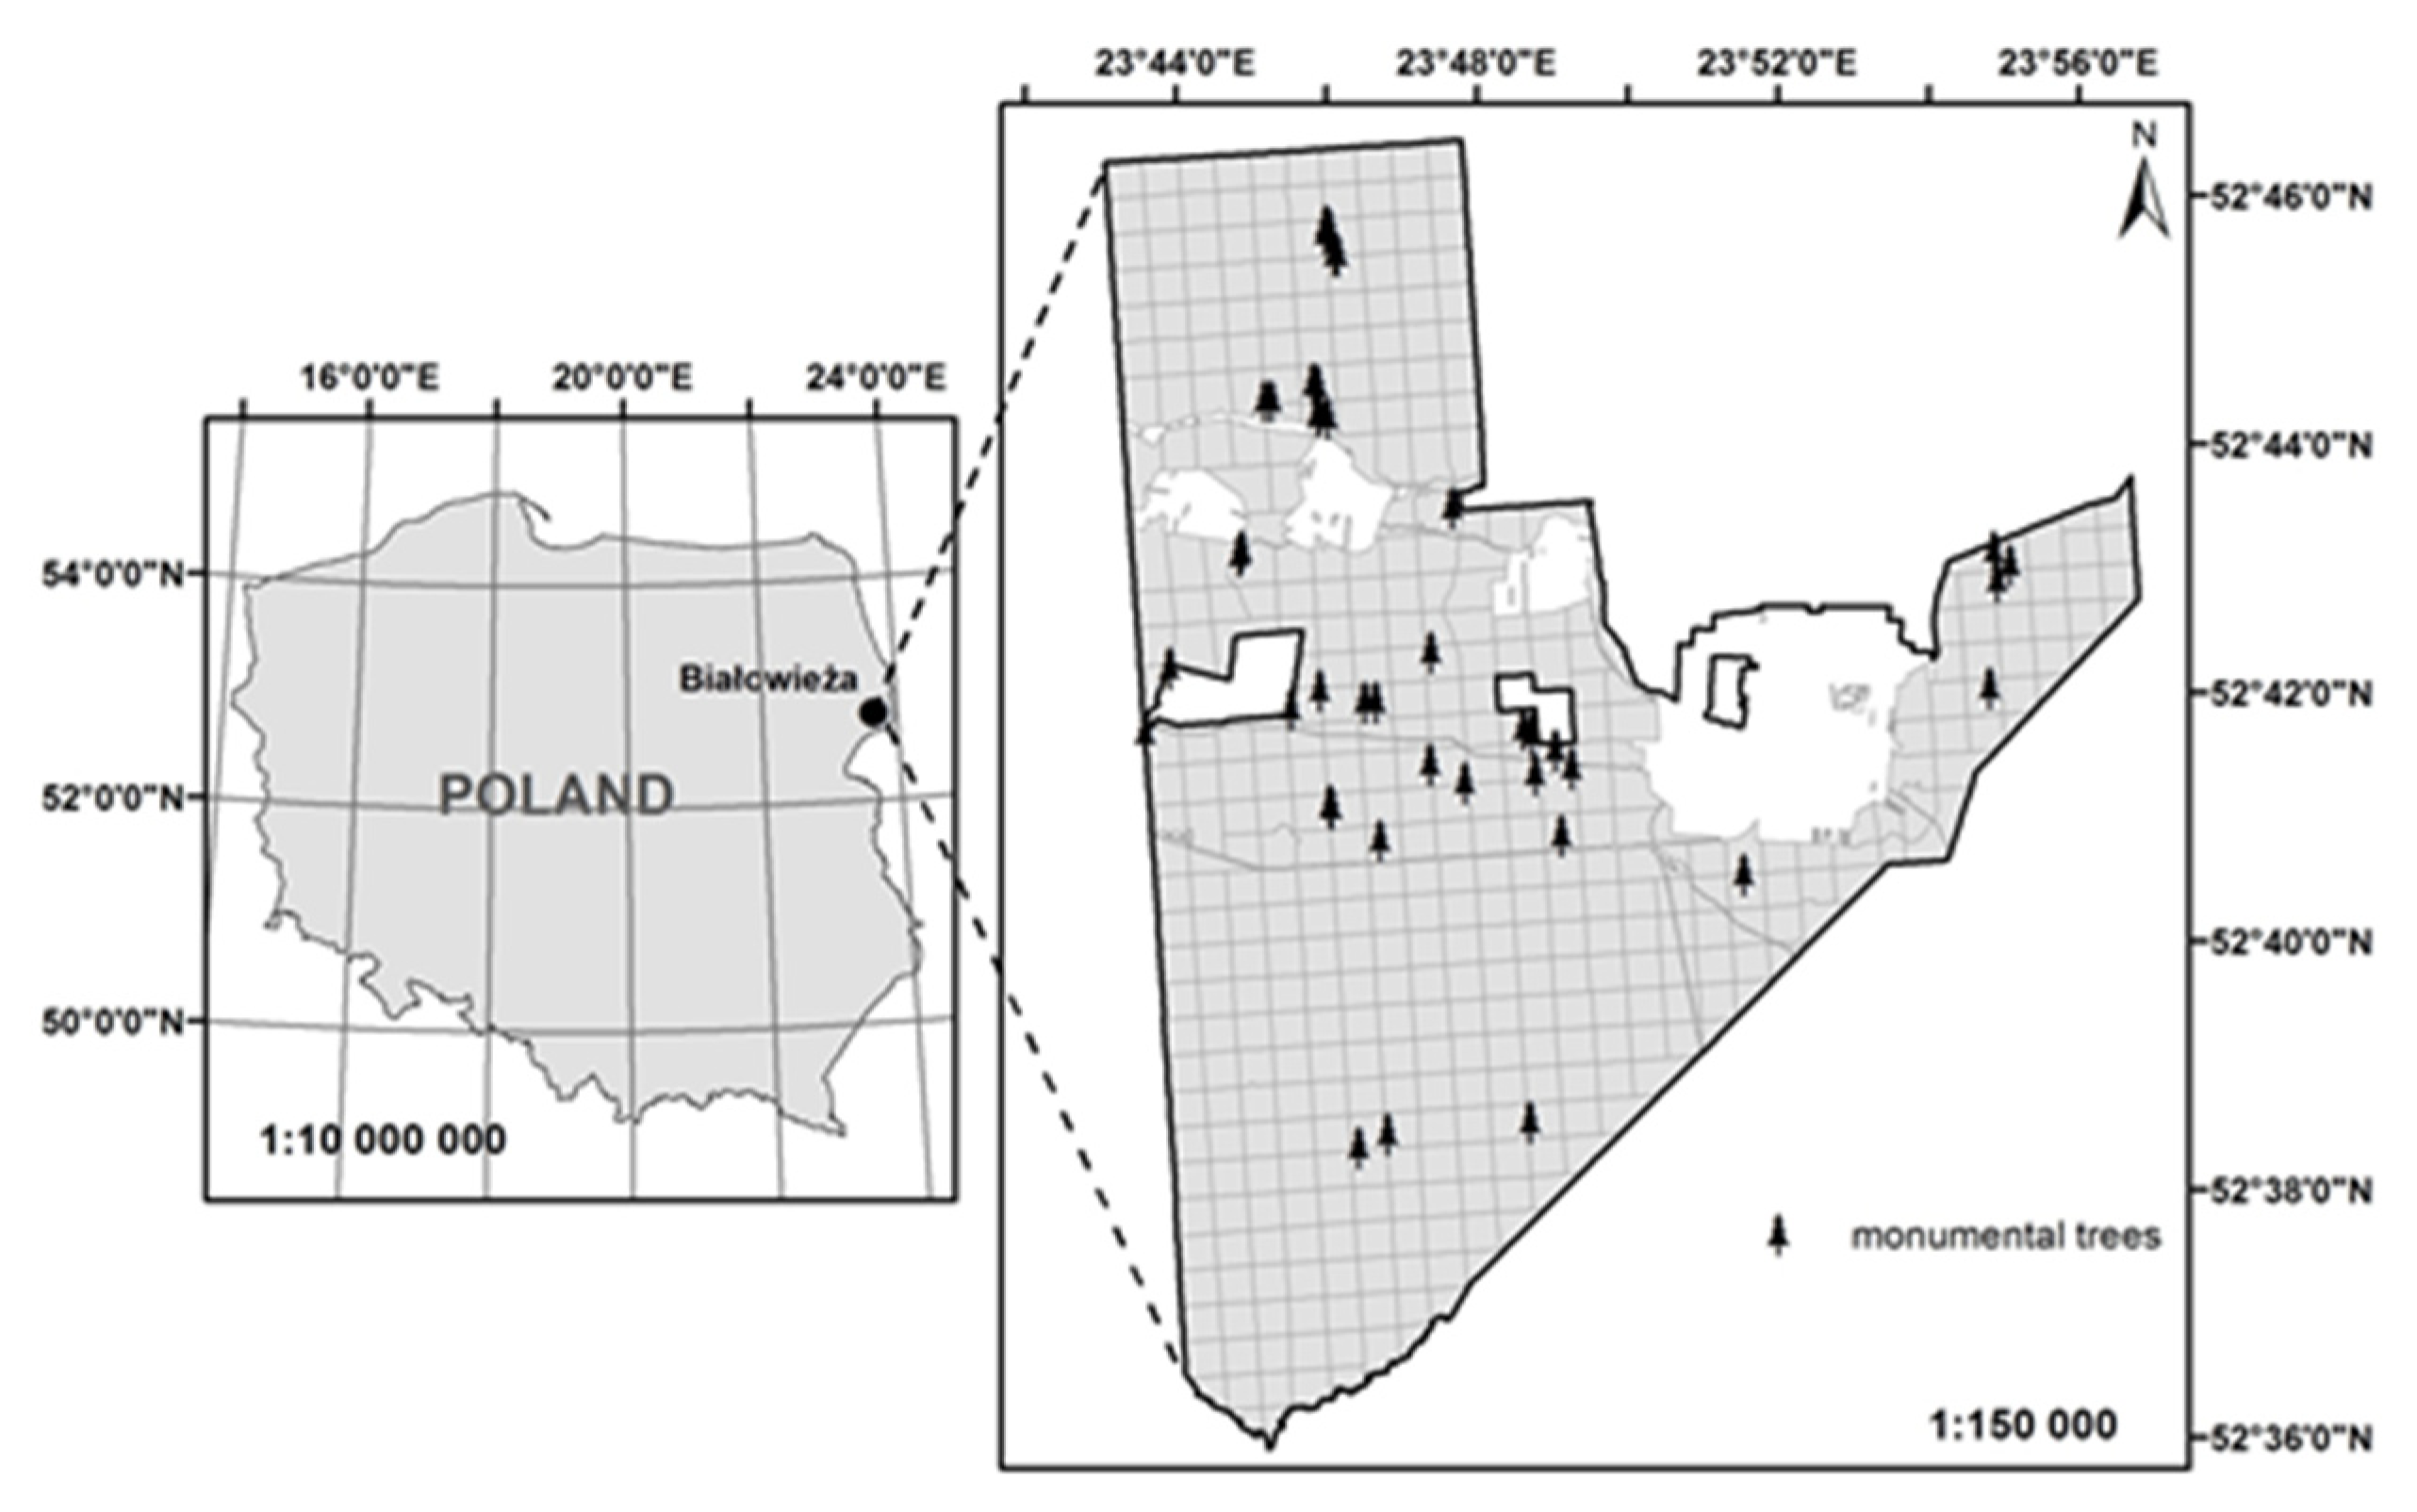
2.1. Study Area

The Białowieża Forest District (12,593 ha) is located within the Białowieża Primeval Forest (BPF) Promotional Complex, as established by the Governor of Podlasie province in 2005. Only activities resulting from the nature conservation plan or from many years of conservation tasks established by the Regional Directorate for Environmental Protection are allowed. Valuable fragments of the native forest occupy over 5500 ha and are protected due to their special value and to maintain ongoing ecological processes. The water protection areas (2191 ha), designated by the Minister of Environment on 10 June 2003, cover bog habitats where no forest management is carried out. The assignment of natural monument status was first bestowed from 1986 to 1996 and, finally, 47 P. abies “Monuments of Nature” were designated in the BFD.

2.2. Health State Assessment and Meteorological Data Analysis

A ground inventory of the health of 47 monumental trees in the BFD based on the data obtained from the Regional Directorate for Environmental Protection in Białystok (northeastern Poland, Figure 1 and Figure 2) was performed for the following items:
  • inventory data concerning location;
  • crown canopy density and defoliation of the upper part of the crown for health assessment [15];
  • multispectral airborne images of Norway spruce monumental trees obtained from Project LIFE+ ForBioSensing PL, ‘Comprehensive monitoring of stand dynamics in the Białowieża Forest’;
  • meteorological data from 2008–2016 obtained from the Institute of Meteorology and Water Management in Białowieża.
From 2014 to 2017, the health of each monumental spruce was assessed every year, and classified using a four-step scale i.e., very high, high, weak and dead (Table 1). Three different forms of site protection were taken into account, i.e., partial nature reserves, valuable fragments of native forest and water protection areas.
In order to compare ground observations with the aerial remote sensing images, 23 monumental trees were randomly selected, and an assessment of their crown health was conducted using images taken with a multispectral airborne camera in 2017 from heights 4200–4300 m above the ground. For a visual interpretation of the photographs, a green color represented dead trees (withered crowns), white corresponded to weakened trees, and bright red meant healthy living trees, while saturated red indicated the highest health status (Table 1).
Meteorological data were used to assess total precipitation and mean temperature for individual years from 2000 to 2016. These measures were used to determine the proportion of the precipitation and mean temperatures of the growing season (from the beginning of April to the end of October) in relation to the entire year [17]. The ratio of precipitation (Rprep) in the growing season to the annual precipitation was also calculated.

2.3. Plant Material and Nuclear Loci Genotyping

To characterize the genetic structure of monumental spruces vs. neighboring spruce populations, needles or trunk phloem tissue from the 47 monumental spruce trees (considered as Population 1) were collected in 2018 and kept frozen at −80 °C until processed. Tissues from the 281 other spruce trees were collected in 2018 and kept frozen at −80 °C until processed. The 281 spruce trees came from seven distinct stands (each considered a separate population) near Population 1 (Table 2). The term population was used according to Eriksson and Ekberg [18] and signified a collection of individuals of one species from a limited area which exhibit a similar degree of adaptation to that area. Populations 1–5 were located in the BFD, and Populations 7 and 8 in the BPF. The area represented by each population ranged from 4 ha to 30 ha. Within each area, from 23 to 50 spruces were sampled to make up the population (Table 2). The average age of the 47 monumental trees was 225 years in 2018 compared to the range of 132 to 188 years old for the 281 trees in the other seven populations (Table 2).
Plant tissues (100 mg of needles or phloem tissue of trunk sampled from each single tree) were ground in liquid nitrogen, and total genomic DNA was isolated with a commercially available kit NucleoSpin Plant II, Mini kit for DNA from plants (Macherey-Nagel®, Düren, Germany). The quality and quantity of the extracted total DNA was assessed using a Nanodrop™ ND-1000 spectrophotometer (ThermoScientific, Waltham, MA, USA). The extracted genomic DNA was used as a template for the amplification of eleven microsatellite polymorphic loci: SPAGC1, SpAGC2, SpAC1H8, SpAG2, SpAGG3, SpAGD1, EATC1B02, EATC2G05, EATC2B02, EATC1E3, and EATC1G2 [19,20].
For each locus, amplifications were carried out in 25 μL of the following PCR mixture: 2 mM of MgCl2; 0.15 μM of the forward primer; 0.15 μM of fluorescently labelled reverse primer; 200 μM of dNTP; 0.75 U of Taq DNA polymerase and 10 ng of genomic DNA. The amplification of loci starting with ‘SPA’ followed Pfeiffer et al. [19], while those starting with ‘EAT’ followed Yazdani et al. [20], all done in a PTC-200™ Programmable Thermal Controller (MJ Research, Inc., Hercules, CA, USA). Finally, PCR products were separated on 3% agarose gels stained with GelRed (Biotium, Fremont, CA, USA) and genotyped with the internal lane size standard LIZ600 on an ABI 3730XL sequencer (Thermo Fisher Scientific, Waltham, MA, USA). The exact allelic size was determined using Peak Scanner™ 2.0 software (Thermo Fisher Scientific Inc., Waltham, MA, USA).

2.4. Genetic Variation Based on Allelic Diversity

Basic genetic parameters characterizing within-population variation, i.e., observed (Na) and expected (Ne) number of alleles, mean number of private alleles (Apriv) per locus, observed (HO) and expected (HE) heterozygosity and Shannon’s diversity index (I) were obtained using GenAlEx 6.503 software [21]. Because sample size may affect calculations of FST values, the allelic richness (AR) was estimated for a standardized number of individuals per population using FSTAT 2.9.4 software [22]. This program was also used to compute gene diversity of Nei (Gd) [23], inbreeding coefficient of an individual relative to the total population (FIT), and heterozygote deficit within populations (FIS) [24]. The significance of the obtained FIS values was tested with 95%–99% thresholds in the overall Hardy–Weinberg (HW) test for randomized alleles within samples using 10,000 permutations per population.

2.5. Genetic Differentiation between Spruce Populations

The FST parameter measuring the genetic differentiation among populations was estimated in two ways, i.e., without and with null allele correction using FSTAT 2.9.4 and FreeNA software, respectively. The presence of null alleles was checked in FreeNA software [25] for 100,000 replicates, followed by a correction of the global Weir [26] FST value estimation according to the Expectation Maximization (EM) algorithm [27]. The level of differentiation among and within groups of individuals was estimated by an analysis of molecular variance (AMOVA) [28] based on pairwise distances using GenAlEx 6.502 software with 999 permutations (p = 0.01).

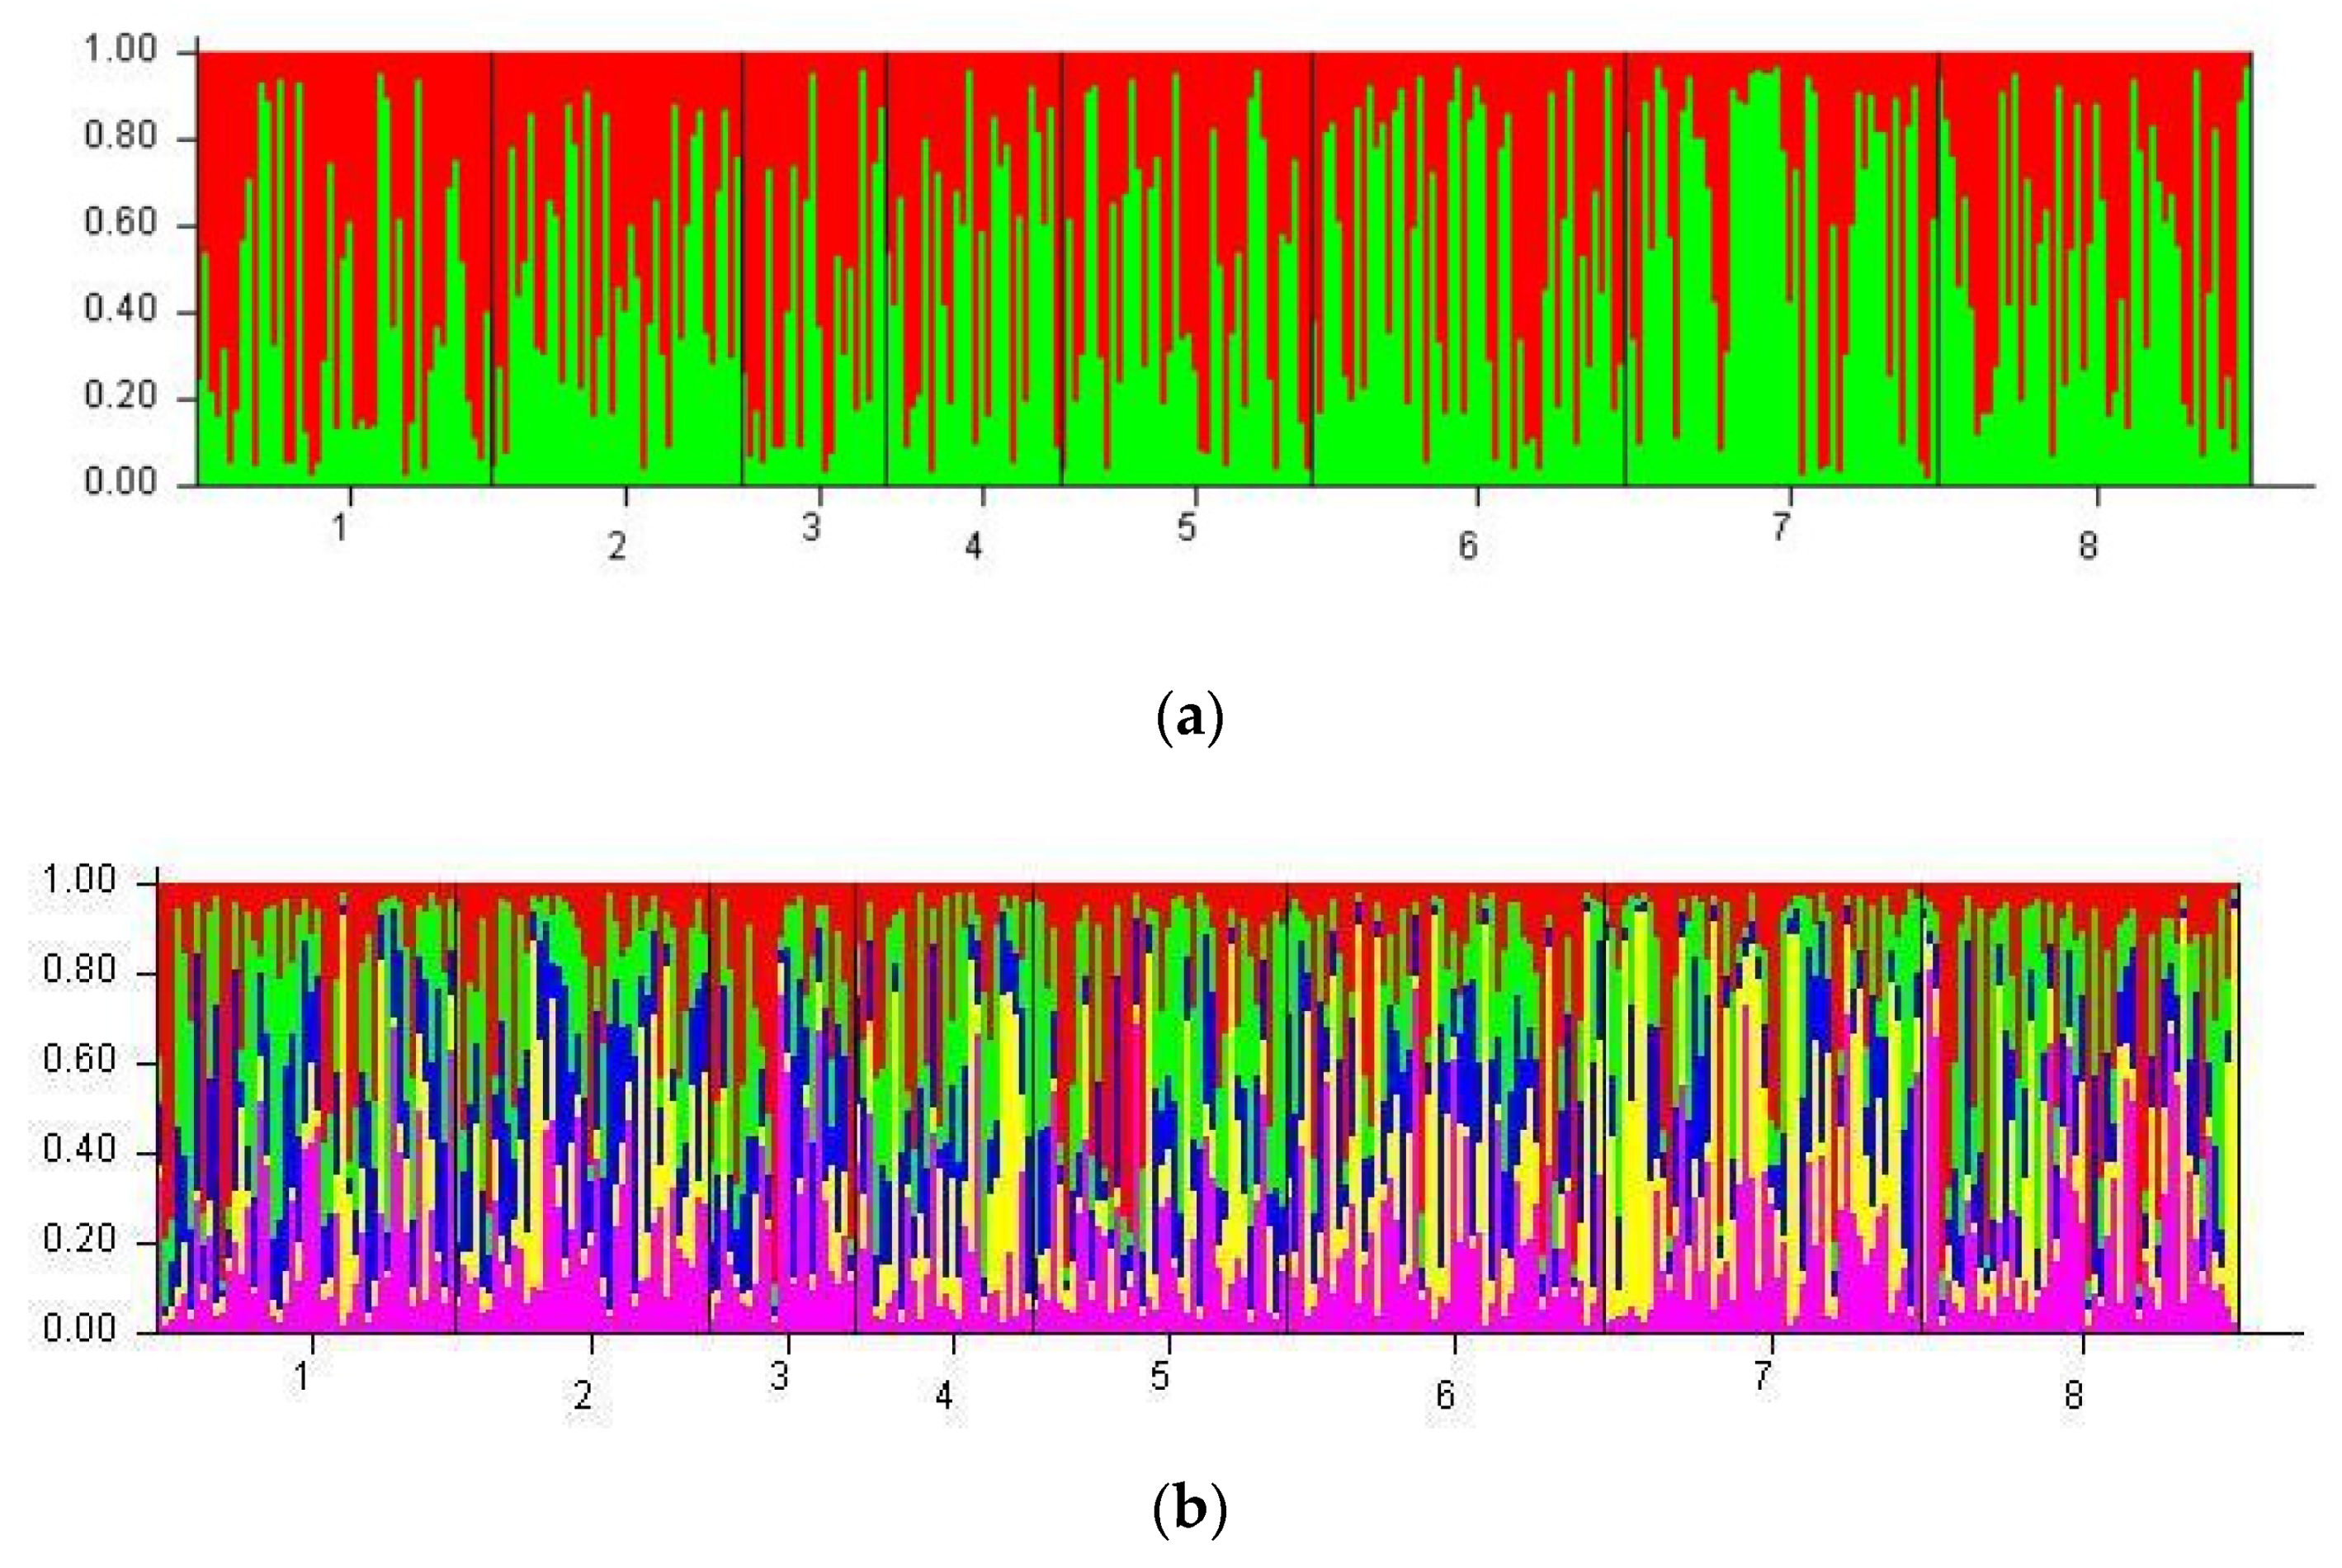
2.6. Spruce Populations Clustering

Putative clustering of individuals into populations was performed by the Bayes method based on Monte Carlo Markov Chains (MCMC) in structure software version 2.3.4 [29], testing different number of clusters K (1–8) under the assumptions of HW equilibrium [30] with 10,000 burn-in lengths, 10,000 MCMC iterations and 10 runs for each K. The probability distributions of the data LnPr (Data) and the ΔK values were examined in the Structure Harvester Web v. 0.6.94 application [31,32]. This program was also used for checking whether the repeated runs for the same K converged to the similar value for all pairs of runs. Additionally, the neighbor-joining method was applied to visualize the dendrogram of allele frequency divergence for different K partitions in PHYLIP 3.6. [33], following the assumptions of Saitou and Nei [34].
Finally, to determine the major patterns within a multivariate data set, a Principal Coordinate Analysis (PCoA) was conducted on the basis of the corrected pairwise distances FST(ENA) matrix using GenAlEx ver. 6.503 software.

3. Results

3.1. Spruce Health Status Based on Ground and Remote Sensing Inventory

A ground inventory was performed for the whole BFD annually between 2014 and 2017. By 2014, 12 (26%) of the original 47 monumental trees were dead and, by 2017, this increased to 35 trees, meaning that 74% of all monumental trees had perished from 2011 to 2017 (Table 3).
A strong relationship was found between health assessment by ground observations and remote sensing multispectral analyses of aerial photographs (Table S1). Among 23 photographed monumental trees in 2017, only one tree did not exhibit any symptoms of damage (scale 1), three were considered healthy, showing some decline (scale 2), four trees showed signs of weakening (scale 3) and 15 were considered dead (scale 4). These results from August 2017 reflect the decline process, perhaps resulting from the drought in the years preceding the 2012 insect outbreak combined with insect attack damage.
In BFD, an inventory of health status of the 47 monumental spruce trees growing under different forms of protection was performed on site in 2014 and 2017 (Table 4). In 2014, 2 years after the onset of the insect outbreak, out of the original 47 monumental spruces 19 were healthy in the area of Partial Nature Reserves, and 12 in Valuable Fragments of the Native Forest. By 2017, most of the trees were dead, with 18 dead in the Partial Nature Reserve, and 15 dead in the Valuable Fragments of Native Forests. Between 2014 and 2017, no noticeable changes in the health status of trees were observed in the Water Protection Area (Table 4).

3.2. Analysis of Meteorological Data

Annual precipitation between 2000 and 2016 had its lowest value, 512 mm, in 2015 (Table 5). However, other low annual precipitation events also occurred before the outbreak (2000, 2003, 2006). Significantly, in a physiological sense, precipitation in the growing season during the outbreak (2012-2016) ranged from 358 mm to 674 mm, and during the preceding 12 years, from 304 mm to 704 mm. The ratio (Rprep) between growing season and annual precipitation varied, ranging from 57% to 81% between 2000 and 2016. During the same period, average annual temperature varied from 6.8 °C to 8.79 °C, and average temperature during the growing season varied from 12.54 °C to 13.87 °C. The averages were lower during years before the outbreak (2000–2011) than during the outbreak (2012–2016) (Table 5).

3.3. Genetic VAriation within Populations

An analysis of the 328 spruce trees with 11 polymorphic nSSR loci revealed a high mean number (Na = 13.648) of observed alleles per population (Table 6). Among them, the population of all monumental trees (n = 47, Population 1) shared the highest values of mean observed and expected alleles per locus (Na = 15.909, and Ne = 7.656). The mean estimated average null allele frequency (<9%) ranged from 0.02 (in locus EATC1E3) to 0.268 (in locus SpAGC2). General genetic characteristics of nSSR microsatellite loci are described in supplementary Table S2. The monumental trees harbored the highest allelic richness calculated for a minimum sample size of 11 individuals per population (AR(11) = 8.895) in comparison to the other populations (Table 6). The 47 monumental trees also shared the highest mean number of private alleles (Apriv = 0.909) and highest Shannon’s diversity index (I = 1.979) compared to the other populations.
In all studied populations, the mean observed heterozygosity (HO = 0.566) was lower than the mean expected one (HE = 0.710), suggesting a deviation from the Hardy–Weinberg equilibrium (Table 6). A large excess of homozygous alleles was observed in all populations (overall FIS = 0.217 ***), with significant departure from HWE for all populations observed (p < 0.001). The total mean inbreeding coefficient in investigated populations was moderate (FIT = 0.300 ± 0.063), and the level of gene diversity was quite high (Gd = 0.723).

3.4. Genetic Differentiation between Spruce Populations

The ENA correction method described by Chapuis and Estoup [25] provided an accurate estimation of the global value of Weir’s [26] FST parameter in the presence of null alleles FST(NA) = 0.004 in comparison to FST(without NA) = 0.003 (p < 0.01). A global AMOVA test revealed very little significant variation (probability 0.007) among all studied populations, accounting for 1% of the total variance, while most genetic variation (99%, p = 0.300) remained within populations (Table 7).

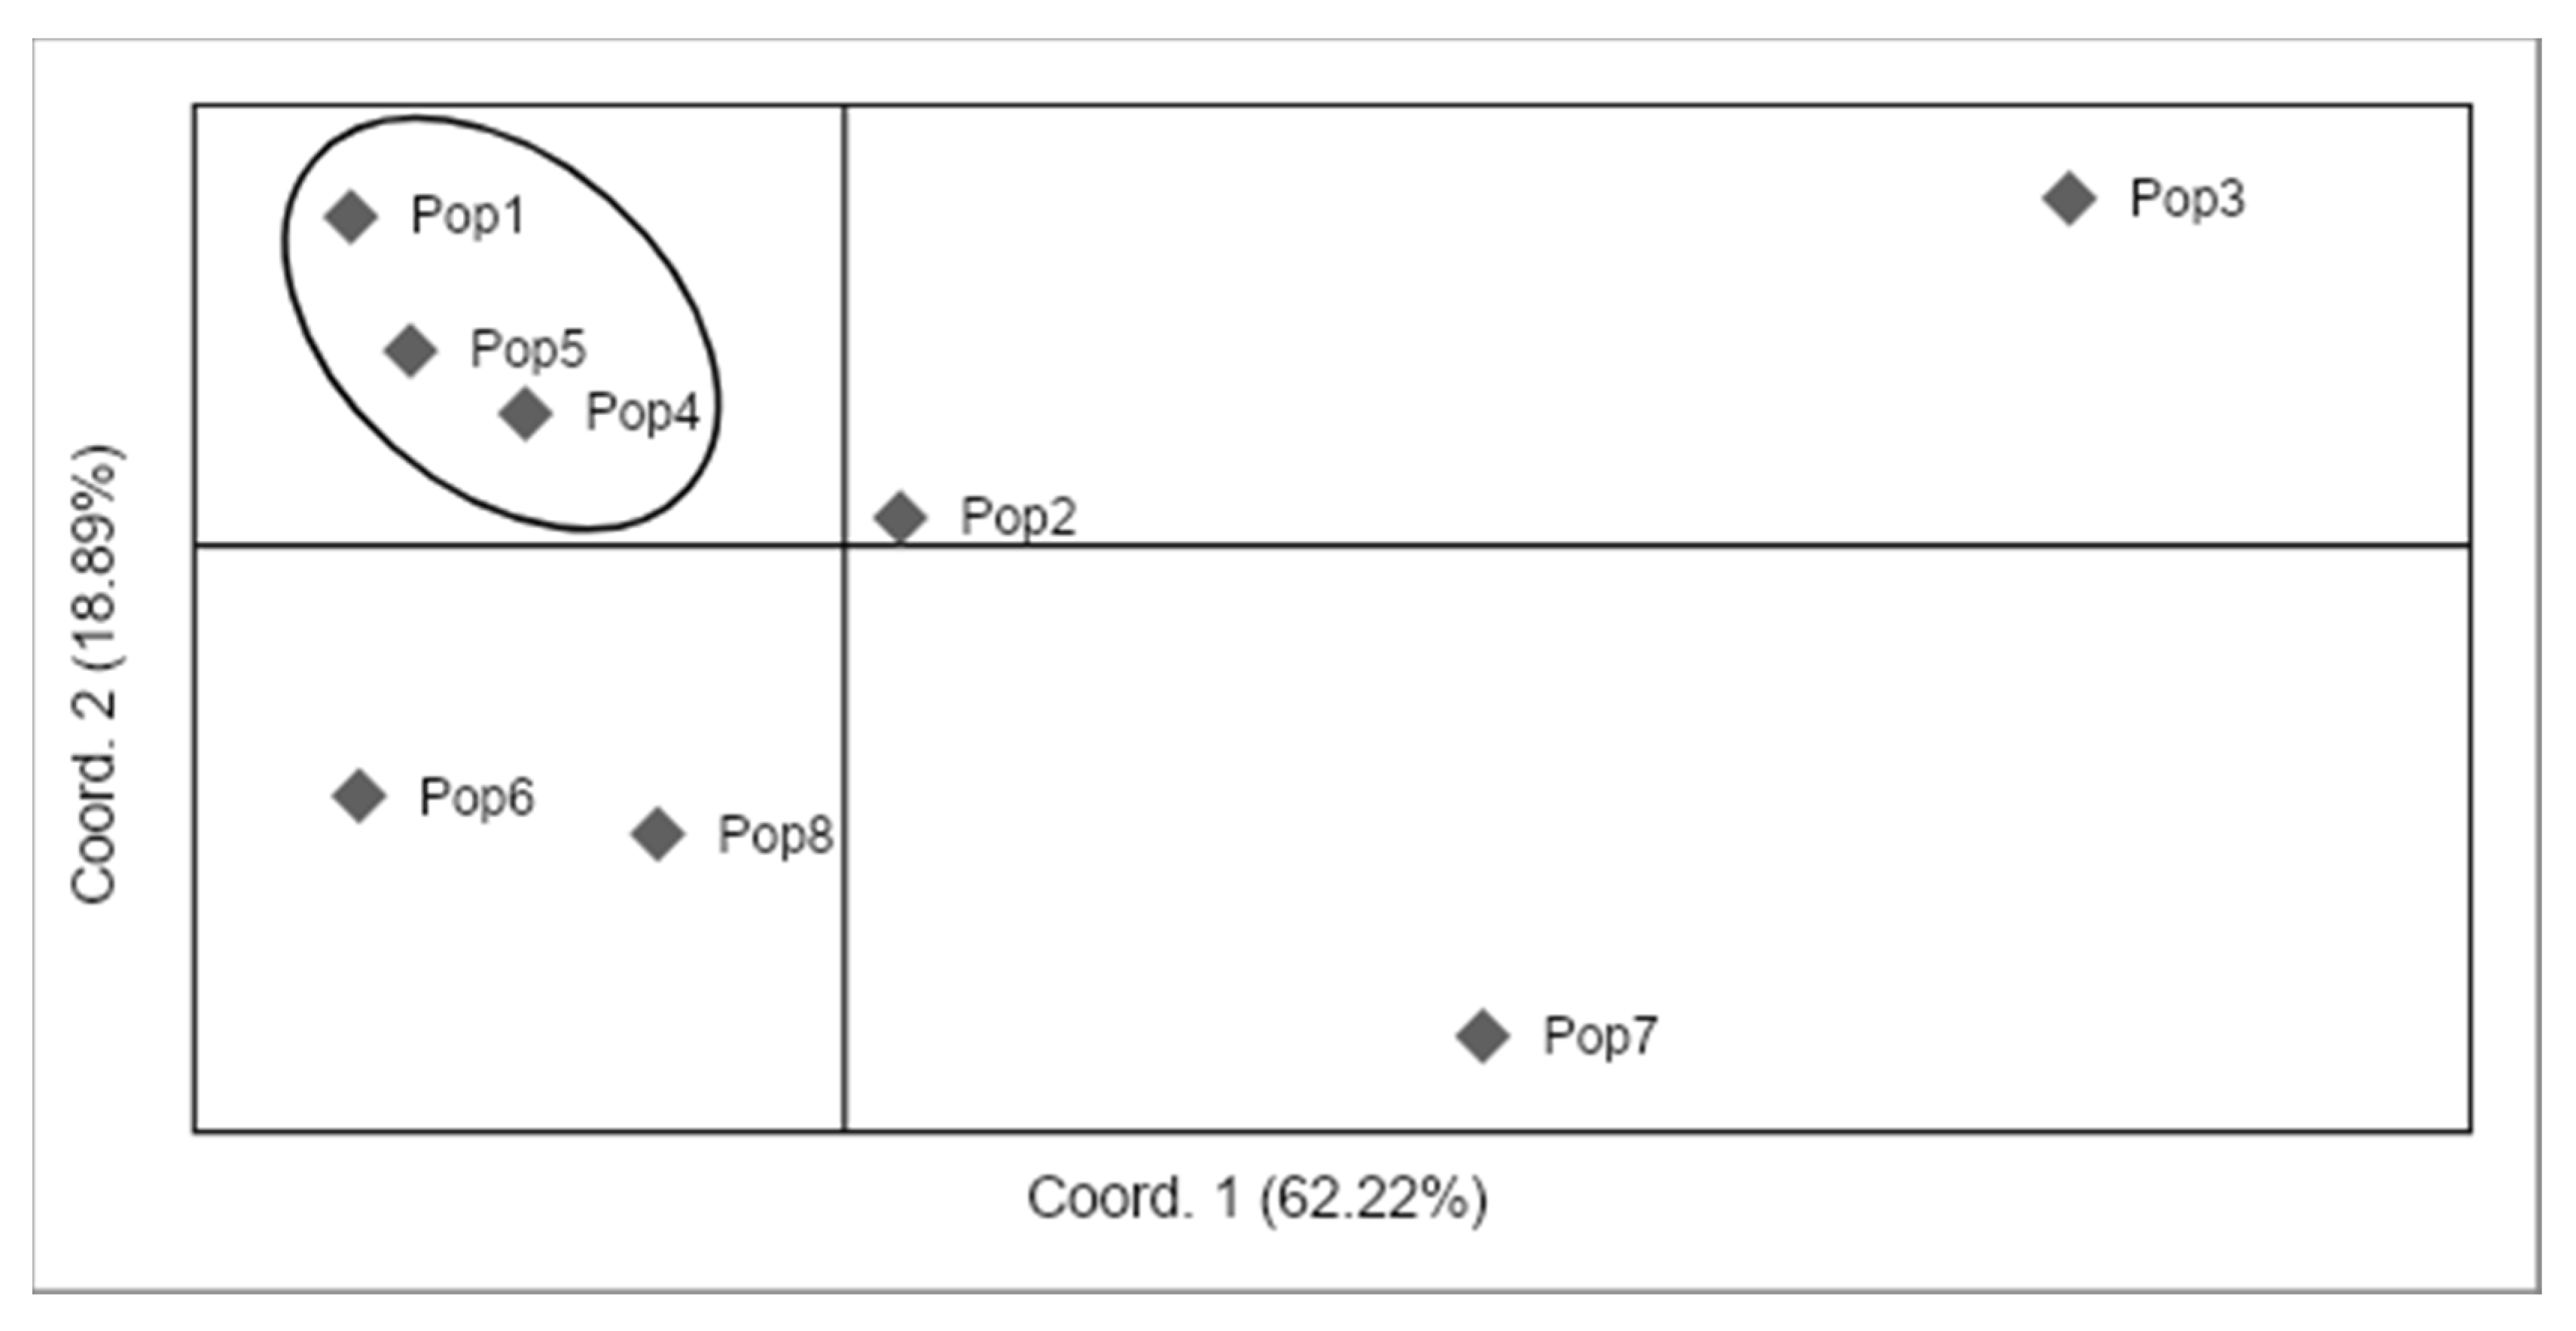
3.5. Population Clustering

The mean Ln likelihood for K varied from the lowest (−14,184.11) to highest (−13,921.81) values for K = 1 and 5, respectively (Table S3). The most likely number of clusters among tested K (1–8) was determined by the highest absolute LnK likelihood distribution and highest mean ΔK value for K = 5 (Figure S1a,c,d). A high value of ΔK was also obtained for K = 2 (Figure S1b), and hence partitions for both numbers of clusters (K = 2 and K = 5) are presented in Figure 3. Despite this, no particular assignment of trees to either one of K = 2 or K = 5 partitions was found. The genetic distances based on allele frequency matrix for K = 5 clusters (with the highest absolute value of LnK likelihood) pointed out the highest divergence between three distinct clusters, 1, 4 and 5, in comparison to clusters 2 and 3 (Figure S2). These results imply that the 47 monumental spruce trees did not share a distinct genetic pool based on all nSSR loci tested, and were part of the larger pool of all the populations.
The PCoA plot represented the distribution of genetic nSSR variation between the first two axes (62.22% and 18.89%, respectively) for different populations. The set of monumental trees (Population 1) was grouped in the same area of the graph with two other Populations (4 and 5) from BFD (Figure 4). Population 4 had high genetic diversity (0.730), and Population 5 had the same level of observed heterozygosity (0.564) as Population 1 (Table 6).

4. Discussion

4.1. Old Forest Trees Maintain Ecosystem Biodiversity

Multi-aged forest stands are crucial to maintain the biodiversity and sustainability of ecosystems. In BPF, we are facing the problem that monumental spruces are rapidly dying (ca. 20% left), including ‘Monuments of Nature’. Among different age classes, the monumental trees more than 200 years old are of a particular value for a Białowieża Primeval Forest ecosystem, especially since they possess private alleles not found in the other populations. Considerable research has been performed in old-growth forests mainly in the boreal and southern areas of Europe with a special focus on olive species, European beech (Fagus sylvatica L.), silver fir (Abies alba L.), common rowan (Sorbus aucuparia L.), and birch species (Betula pendula Roth, Betula pubescens Ehrh.) [18,35,36,37]. Little research has been devoted to old-growth Norway spruce populations in Eastern Europe [38,39]. In this region, monumental spruce trees are naturally found throughout the BFD, where they enrich the woodland biota, offering habitats for many rare and threatened animal and plant species [40]. We are concerned that the death of the cohort of old dying trees may limit or even cause the local extinction of other species related to or dependent on the ecological niche provided by the old trees.

4.2. Climatic Conditions and Insect Outbreaks

Norway spruce in Poland is at the eastern and northern limit of its natural distribution. With environmental and biotic stresses faced by a species at its geographic limits [41], Norway spruce in the BFD is likely more vulnerable to insect pests and diseases than its counterparts growing in more central populations. The most precious old-growth trees, nearing the end of their natural lifespan, are even more susceptible to many environmental factors such as changing climatic conditions, and pathogens or insect outbreak [42,43,44]. In the BPF, the largest remnant of the last primeval lowland forest in Europe, special attention has been paid to the impact of the recent bark beetle outbreak on P. abies stands [45,46,47]. Our research indicated that the recent insect outbreaks in the BPF have been facilitated by changing environmental conditions such as low precipitation, air temperature and drought. The optimal growth conditions for Norway spruce involve precipitation during growing seasons of 500–700 mm and mean annual air temperatures not exceeding 6 °C [48]. In 2011, the mean air temperature in Białowieża was 7.7 °C, which was higher than the rolling average, whereas precipitation during the growing season was considerably lower than the average at 503.4 mm. Norway spruce exposed to drought usually reacts with decreased needle tracheid dimensions, diminished needle cross-sectional area, and reduced needle xylem area [49,50]. Would these morphological changes still permit these trees to survive specific stressful environmental circumstances like combinations of unusually high temperatures and severe drought during the growing season, such as those that occurred in BFD in 2015? Weather extremes often increase the susceptibility of trees to secondary damage caused by pests and pathogens [42,43,51]. Perhaps the infested old spruce trees were not able to react effectively to the insect outbreak while contending with lower precipitation, and were not able to successfully defend themselves. These observations are compatible with previous studies showing that long and intense droughts cause the predisposition of trees to pathogens because of their insufficient defense potential [52,53]. In addition, the drought-induced stress of trees is not only associated with amplification damage caused by insect pests and pathogens, but such stresses cause disturbances in hydrocarbon metabolism of the trees, leading to carbon starvation and hydraulic failure [54]. As with past beetle outbreaks, the European spruce bark beetle outbreak should inevitably end. This may be due to adverse weather conditions or as a result of increased adaptation of the remaining species and the intrapopulation mechanisms between parasitoids, parasite and predators in the ecosystem. For the moment, the current outbreak, which has already lasted for 9 years, has not reached its end, and has progressed into neighboring forest districts. In unmanaged forest ecosystems, outbreaks usually last for only 3–4 years, or longer in exceptional circumstances, when there is an increase in the potential food base for bark beetles, e.g., in the form of weakened trees and windthrow. Major wind events took place on 27 August and 19 September 2017, when storm fronts passed over the BPF and felled 20,000 m3 of timber [10]. Many of the spruces were then blown over by the wind and supplied a food base for the European spruce bark beetle in subsequent years.

4.3. Health Status Evaluation of Spruces in BFD

At the beginning of the insect outbreak in 2011, only three spruce trees had been killed by insects according to local foresters in the BFD. Furthermore, a steady year-by-year decrease in the number of trees in the very healthy category has been observed anecdotally by local foresters. Since the start of the insect outbreak in 2012, more than 1,000,000 trees across BPF have already been affected by bark beetles (now over 2,500,000 trees), including monumental Norway spruce trees. According to the recent data from BFD (May, 2020), only three spruce trees out of the original 47 Monuments of Nature are remaining.
To evaluate the health status of trees, we used remote sensing to complement classical, but more laborious, ground surveys. For ground surveys, we used the external signs of the health condition of spruces, such as the crown defoliation or foliar coverage, which reflected the potential of a tree to cope with I. typographus outbreak. Generally, suitability of the remote sensing data for the determining mortality due to various factors (pests, fire, and wind) is based on the measurement of changes in the needle water content followed by accurate detection of needles turning red (red attack stage) and grey (grey attack stage) in the wake of an insect infestation [12,46,55]. Low and medium resolution multispectral data are also used for mapping dead trees and bark beetle progression [35,56,57,58]. The only constraint of the remote sensing technique lies in the limitation of the reliable imaging only to the visible top layer of a stand.
Our monumental trees were dominant in height in the stand, and they were clearly visible in the remote sensing data. To summarize, our findings showed that the ground inventories indicated a marginally improved (better) health status for monumental trees compared to airborne remote sensing. These differences were at least partly attributable to the one month delay between remote sensing images and the ground survey, which was performed earlier. It also shows how dynamic the situation was in the BPF concerning the health status of trees. Our studies revealed a strong correlation between temporally equivalent results from onsite and multispectral data because this would support the use of remote sensing over laborious ground inventory protocols. The use of remote sensing technology is particularly important when ground entry into sites is prohibited, such as for the BFD in 2017, due to safety considerations concerning large numbers of dead trees after the outbreak. In 2017, our ground and remote sensing inventories revealed very low ‘health’ levels in examined monumental trees because 74% had already died (35 specimens) and only 26% of them remained alive (12 specimens). This is in agreement with the statement of local foresters that since the beginning of the present outbreak of bark beetles in BFD, I. typographus has killed over 43% of all the spruces [10].

4.4. Natural Selection, Gene Flow and Possible Changes in Biodiversity

As already mentioned, the current situation in BPF is very dynamic, so it is difficult to predict how many more years the outbreak will last, and how long the remaining spruce trees, particularly older ones, will survive. Local foresters are worried about the disappearance of Norway spruce from the BPF. Species adapt to local conditions, and the survivors are the ones which possess the genetic traits that enabled them to remain and withstand changing local environments and occasional extreme events. In general, natural selection promotes the growth of individuals sharing favorable gene combinations inherited from previous generations [50,54]. This makes the monumental Norway spruce trees even more precious, both biologically from an ecosystem point of view and sociologically from a human point of view.
Historically, Norway spruce spread to the mid-lowlands of Europe from two different gene pools originating from dissimilar origins. In connection with the paleobotanical analysis of pollen distribution in Europe and parallel mitochondrial gene studies, two main postglacial expansions of P. abies in central Europe occurred from the northern Baltico–Nordic areas, and the southern Hercyno–Carpathian refugia [36,59]. As the ice pool retreated in Early Holocene tie (ca. 18,000 years BP), Norway spruce started to colonize northeastern Poland. Changes in vegetation and fauna during this era led to new adaptations in Norway spruce populations driven by the various selection forces due to changing climatic conditions, pathogen and pest outbreaks, and anthropogenic pressure. In particular, old-growth forest habitats (composed either of native or introduced species) provide an opportunity to examine the impacts of environmental factors on the biodiversity of the forest communities. The investigations pursued in the British uplands have shown that old-growth spruces represent a particular niche to the various taxa such as fungi, lichens, bryophytes, hole-nesting birds, mammals, and insects [60]. Perhaps the ecosystems and species compositions which have been present since the last ice age are at risk because of climate change coupled with bark beetle outbreaks.

4.5. Genetic Structure of Monumental Trees

Very little is known about the genetic structure of various monumental trees at the DNA level. A recent study of molecular investigation of monumental olive trees (Olea europaea L.) in Italy, performed with nine microsatellite loci has shed light on genetic origins of olive cultivars, probably dating back thousands of years [37]. The overall level of genetic variability in the investigated Norway spruce stands was similar to that found in other P. abies populations in Europe [19,61], but some particularities of spruces from BPF are worth mentioning. Two critical allele-based parameters, i.e., allelic richness (AR) and private allele (Apriv) content reflect the gene variation found in the stand, and they both reflect a population’s long-term potential for adaptability and persistence [62]. Across all eight populations, the analyzed microsatellite loci showed moderate polymorphism, with observed and expected average number of alleles per locus equal to 13.648 and 7.102, respectively. Mean AR(11) values obtained for the studied stands differed from the observed mean allele numbers (Na) probably because of the high (ca. 9%) number of null alleles present in microsatellite loci. Taking into account null allele correction, the monumental spruces (Population 1) shared the highest overall allelic richness (AR(11) = 8.895) in comparison to the other populations. Many researchers consider high levels of allelic richness as crucial for persistence of species, because many various parameters such as migration rates, allele frequency and demographic constraints may influence the AR level [63,64]. This parameter sometimes better explains the gene diversity in a stand than observed heterozygosity HO coefficient [64,65].
Monumental trees also presented both the highest mean number of private alleles (0.909) and highest mean Shannon’s diversity index (I = 1.979) compared to the other stands. Private alleles are commonly thought to play an important role in the adaptive potential of plants [66,67], and high levels have been often observed in peripheral populations of Scots pine and Norway spruce in Italy and Slovenia [61,68].
A lower level of overall observed heterozygosity (HO) than expected heterozygosity (HE) in Norway spruce stands has also been frequently described for many forest tree species populations [69,70]. All studied spruces from BPF were characterized by a significant high excess of homozygotes (FIS = 0.217, p < 0.001). Usually, the observed significant deficit of heterozygotes results from the temporal Wahlund effect due to genetic drift or inbreeding processes occurring in populations [71]. Populations with a small number of individuals are especially prone to genetic drift due to a bottleneck effect that had occurred in the past [42,72]. Because BPF, in general, has been not extensively subjected to the anthropogenic pressure in the past, one can suppose that the high inbreeding coefficients of nSSR loci result from the selective pressure exerted by local environmental factors like limited pollen flow, short-distance seed dispersal or harmful insects or pathogens in the investigated stands. However, Norway spruce populations in BPF (and monumental trees among them) harbor quite high gene diversity estimated by the Gd parameter, giving a sense of the positive dynamic evolutionary processes occurring in these stands.
AMOVA patterns of genetic differentiation often reflect the general trend of genetic variation distribution in populations of long-living forest tree species [18,73]. Our results imply that there were no significant differences among gene pools of investigated populations. The one percent molecular differentiation within the studied populations matched a frequently observed trend in cross-pollinating plants, with most of the total genetic differentiation occurring between individuals within a population, rather than between populations themselves [74,75]. Previous studies conducted with the nuclear microsatellite markers on five natural spruce populations from the Northeast of Poland showed a higher or similar differentiation level of FST = 0.087 [76] and FST = 0.015 [38]. Based on chloroplast microsatellite DNA data, the older populations of spruces from BPF were genetically more differentiated than the younger ones, displaying FST = 0.023 and 0.005, respectively [40].

4.6. STRUCTURE Model and Specific Allelic Patterns

All investigated trees belonged to the same genetic group based on the results of Bayesian clustering implemented in the program structure. Despite the most probable number of clusters determined at the level of K = 5, no particular grouping of loci was revealed because all genotypes were uniformly assigned to the 5 partitions. Because the STRUCTURE model assumes that analyzed nSSR loci are not in linkage disequilibrium (LD), i.e., they share a random association of alleles within subpopulations [32], we can conclude that monumental trees harbor no specific allelic patterns compared to the other studied spruce stands in BPF. Even if higher genetic distances in the neighbor-joining dendrogram separated clusters 1, 4 and 5 from the clusters 2 and 3, this divergence of clusters was not confirmed. To summarize, overall genetic structure of the analyzed spruce tree genotypes from BPF seemed to be assigned into five major clusters according to value of Ln likelihood and ΔK estimates—the likelihood of such a partitioning is very low. That means 47 monumental trees shared many loci also present in neighboring stands, suggesting a gene flow between trees in this region.
Because STRUCTURE can have some limitations in detecting population structures under different evolutionary scenarios [77,78], the PCoA analysis was attempted to describe the most probable grouping of the studied populations on the basis of corrected pairwise distances FST(ENA) matrix. According to the PCoA plot, the monumental trees were grouped in one cluster with two other populations from BFD (4 and 5). The most different was Population 7, which was in concordance with PCoA data of spruce stands from the BPF assessed with the mitochondrial nad1 gene [39]. A similar study performed with EST-SSR markers showed two different clusters in STRUCTURE conducted on five Norway spruce natural populations in Serbia considered to be endangered due to the negative effect of biotic and abiotic stress factors [79]. These spruce populations were characterized by higher levels of mean expected heterozygosity (0.616) and higher allelic richness (10.22) than monumental spruces in BFD, but still the genetic differentiation among Serbian populations was low (FST = 0.007).
Some researchers point out that the genetic structure of Norway spruce ecotypes might be a good indicator (or marker) of the sustainability in forest ecosystems [80]. The results from the study of autochthonous Norway spruce populations in the Czech Republic revealed a low level of genetic differentiation among different ecotypes (FST = 0.008) based on EST–SSRs and genomic SSR markers. Allele frequency parameters estimated by Bínová et al. [80], such as the mean expected (0.722) and observed (0.585) heterozygosity and mean effective number of alleles (Ne = 5.943) were in concordance with our data from BFP.

4.7. Gene Diversity and Adaptive Potential

Neutral microsatellite markers are not a good indicator of the resistance level of individual trees to the bark beetle outbreak. However, the presence of private alleles and high gene diversity could be associated with a higher adaptive potential of surviving monumental trees against unfavorable environmental conditions prior to the last insect outbreak [70,79]. The adaptation process entails the selection of appropriate genes whose expression, determined by numerous endogenous (e.g., genetic, hormonal) and exogenous (e.g., precipitation, temperature) factors, promotes the survival of the species. The richness of the gene pool, expressed by the presence of numerous forms of individual genes provides a greater likelihood of a beneficial combination of alleles ensuring survival and adaptation of the species to changing environmental conditions [18,36,37].
In this respect, the active protection for these trees is being discussed now, because notable sites, animal refuges, reserves, stands more than a hundred years old, humid and bog habitats, and ecological sites (among others) are excluded from active management and are only passively protected. Due to their longevity, the monumental trees have certainly survived the effects of many damage-inducing biotic and abiotic factors. On the other hand, the survival and adaptation of tree species to certain environmental conditions are often genetically determined [81], and such genotypes should be preserved.

5. Conclusions

Among the ecologically valuable Norway spruce trees protected by law by 1996 as Monuments of Nature in the BFD, 74% have died by the year 2017. During the current European spruce bark beetle outbreak since 2012, there has been a marked decrease in the health status of the remaining spruce trees.
Although the climatic data did not differ significantly between the period before the outbreak (2000–2011) and during the outbreak (2012–2016), the severe heat and a drought wave in summer 2015 may have weakened spruce trees, along with the low precipitation during the growing season and the temperature (higher by more than 1 °C compared to the multi-annual mean).
No evident clustering between the studied monumental trees and other neighboring spruce populations was observed at the level of gene diversity or genetic differentiation based on SSR loci.
A few interesting features distinguished the long lived spruces in the BFD, such as a high level of allelic richness, the highest mean number of private alleles, and the highest gene diversity compared to the other P. abies stands in this region. The loss of the monumental trees inevitably entails the loss of genetic variability among the Norway spruce population in the highly protected area of Białowieża.
Monumental trees in the BFD are dying at a fast rate; therefore, a new strategy for the genetic conservation of spruces through the establishment of additional dynamic gene conservation units is needed to protect the adaptive and neutral genetic diversity of the species.

Supplementary Materials

The following are available online at https://0-www-mdpi-com.brum.beds.ac.uk/1999-4907/11/6/647/s1, Table S1: Comparison between ground and remote sensing inventory, Table S2: Genetic characteristics of eleven nSSR loci in eight Norway spruce populations (n = 328 individuals), Table S3: Estimated Ln probabilities and ΔK for 10 replicates from STRUCTURE Harvester calculation [32]. The highest values for mean LnP(K), |Ln’’(K)| and ΔK were highlighted, Figure S1: Determination of the K number of clusters best fitting the nSSR STRUCTURE-based data: (a) magnitude of ΔK as a function of K (mean ± SD over 10 replicates); (b) mean rate of change of the likelihood distribution for each K; (c) absolute value of LnK likelihood distribution; and (d) mean ΔK statistics, Figure S2: Dendrogram based on neighbor-joining algorithm for K = 5 partitions. Numbers refer to the different clusters.

Author Contributions

J.A.N. and T.O. conceived the study; P.P. carried out the field measurements and analyzed the remote sensing images; K.S. conceived the remote sensing; I.O. validated meteorological analyses; J.A.N. carried out genetic analyses; T.H. reviewed and supervised the final version of text; T.O. administrated the project. All authors contributed to writing the manuscript. All authors have read and agreed to the published version of the manuscript.

Funding

This research was partly supported by the Project LIFE+ ForBioSensing PL ‘Comprehensive monitoring of stand dynamics in the Białowieża Forest’, as supported by remote sensing techniques. The Project has been co-funded by Life Plus (LIFE13 ENV/PL/000048) and Poland’s National Fund for Environmental Protection and Water Management (485/2014/WN10/OP-NM-LF/D).

Acknowledgments

Special thanks are addressed to foresters from Białowieża FD for providing site data for this study.

Conflicts of Interest

The authors declare no conflict of interest. The funders had no role in the design of the study; in the collection, analyses, or interpretation of data; in the writing of the manuscript, or in the decision to publish the results.

References

  1. Okołów, C. Białowieża National Park: Know It, Understand It, Protect It; Białowieski Park Narodowy: Białowieski, Poland, 2009. [Google Scholar]
  2. Kowalczyk, B.; Mikowski, R.; Mikowski, L. Environmental Law in Poland; Wolters Kluwer: Philadelphia, PA, USA, 2019; p. 232. [Google Scholar]
  3. Schroeder, M.; Cocoş, D. Performance of the tree-killing bark beetles Ips typographus and Pityogenes chalcographus in non-indigenous lodgepole pine and their historical host Norway spruce. Agric. For. Entomol. 2018, 20, 347–357. [Google Scholar] [CrossRef] [Green Version]
  4. Marini, L.; Økland, B.; Jönsson, A.M.; Bentz, B.; Carroll, A.; Forster, B.; Grégoire, J.-C.; Hurling, R.; Nageleisen, L.M.; Netherer, S.; et al. Climate drivers of bark beetle outbreak dynamics in Norway spruce forests. Ecography 2017, 49, 1426–1435. [Google Scholar] [CrossRef]
  5. Brauns, A. Forest Insects. In Occurrence in Stands and Habitats; PWRiL: Warsaw, Poland, 1975. [Google Scholar]
  6. Wermelinger, B.; Seifert, M. Temperature dependent reproduction on the spruce bark beetle Ips typographus, and analysis of the potential population growth. Ecol. Entomol. 1999, 24, 103–110. [Google Scholar] [CrossRef]
  7. Fahse, L.; Heurich, M. Simulation and analysis of outbreaks of bark beetle infestations and their management at the stand level. Ecol. Model. 2011, 222, 1833–1846. [Google Scholar] [CrossRef]
  8. Linnakoski, R.; Mahilainen, S.; Harrington, A.; Eriksson, M.; Mehtalo, L.; Pappinen, A.; Wingfield, M.J. Season succession of fungi associated with Ips typographus beetles and their phoretic mites in an outbreak region of Finland. PLoS ONE 2016, 11, e0155622. [Google Scholar] [CrossRef] [Green Version]
  9. Six, D.L.; Wingfield, M.J. The role of phytopathogenicity in bark beetle-fungus symbioses: A challenge to the classic paradigm. Ann. Rev. Entomol. 2011, 56, 255–272. [Google Scholar] [CrossRef] [Green Version]
  10. State Forest Report. State Forest Information Centre: Warsaw, Poland, 2017. Available online: https://www.bdl.lasy.gov.pl/portal/Media/Default/Publikacje/raport_o_stanie_lasow_2017.pdf (accessed on 22 February 2019).
  11. Heyman, O.; Gaston, G.G.; Kimerling, A.J.; Campbell, J.T. A per-segment approach to improving aspen mapping from high-resolution remote sensing imagery. J. For. 2003, 101, 29–33. [Google Scholar] [CrossRef]
  12. Skakun, R.S.; Wulder, M.A.; Franklin, S.E. Sensitivity of the thematic mapper enhanced wetness difference index to detect mountain pine beetle red-attack damage. Rem. Sens. Environ. 2003, 86, 433–443. [Google Scholar] [CrossRef]
  13. Erfanifard, Y.; Stereńczak, K.; Miścicki, S. Management strategies alter competitive interactions and structural properties of Norway spruce in mixed stands of Białowieża Forest, Poland. For. Ecol. Manag. 2019, 437, 87–98. [Google Scholar] [CrossRef]
  14. Zhou, Z.; Woodcock, C.E.; Olofsson, P. Continuous monitoring of forest disturbance using all available Landsat imagery. Rem. Sens. Environ. 2012, 122, 75–91. [Google Scholar] [CrossRef]
  15. Michel, A.; Seidling, W.; Prescher, A.K. (Eds.) Technical Report of ICP Forests Report under the UNECE Convention on Long-Range Transboundary Air Pollution (CLRTAP). Available online: http://icp-forest.net (accessed on 31 January 2019).
  16. Zmarz, A.; Będkowski, K.; Miścicki, S.; Plutecki, W. Assessment of Norway spruce health using multispectral images acquired from unmanned aerial vehicle with non-metric cameras. Arch. Fotogram. Kartogr. Teledetekcji 2012, 23, 541–550. [Google Scholar]
  17. Sokołowski, A.W. Primeval Forests of Białowieża. Forest State Information Center; CILP: Warsaw, Poland, 2004; pp. 8–15. [Google Scholar]
  18. Eriksson, G.; Ekberg, I. An Introduction to Forest Genetics; SLU Repro: Uppsala, Sweden, 2001. [Google Scholar]
  19. Pfeiffer, A.; Olivieri, A.M.; Morgante, M. Identification and characterisation of microsatellites in Norway spruce (Picea abies K.). Genome 1997, 40, 411–419. [Google Scholar] [CrossRef] [PubMed]
  20. Yazdani, R.; Scotti, I.; Jansson, G.; Plomion, C.; Mathur, G. Inheritance and diversity of simple sequence repeat (SSR) microsatellite markers in various families of Picea abies. Hereditas 2003, 138, 219–227. [Google Scholar] [CrossRef] [PubMed] [Green Version]
  21. Peakall, R.; Smouse, P.E. GenAlEx 6.5: Genetic analysis in Excel. Population genetic software for teaching and research—an update. Bioinformatics 2012, 28, 2537–2539. [Google Scholar] [CrossRef] [PubMed] [Green Version]
  22. Goudet, J. FSTAT, a Program to Estimate and Test Gene Diversities and Fixation Indices (Version 2.9.4). Available online: http://www2.unil.ch/popgen/softwares/fstat.htm (accessed on 31 January 2019).
  23. Nei, M. Molecular Evolutionary Genetics; Columbia University Press: New York, NY, USA, 1987. [Google Scholar]
  24. Weir, B.S.; Cockerham, C.C. Estimating F-statistics for the analysis of population structure. Evolution 1984, 38, 1358–1370. [Google Scholar]
  25. Chapuis, M.P.; Estoup, A. Microsatellite null alleles and estimation of population differentiation. Mol. Biol. Evol. 2007, 24, 621–631. [Google Scholar] [CrossRef] [Green Version]
  26. Weir, B.S. Genetic Data Analysis II; Sinauer Associates: Sunderland, MA, USA, 1996. [Google Scholar]
  27. Dempster, A.P.; Laird, N.M.; Rubin, D.B. Maximum likelihood from incomplete data via the EM algorithm. J. Roy. Stat. Soc. B 1977, 39, 1–38. [Google Scholar]
  28. Michalakis, Y.; Excoffier, L. A generic estimation of population subdivision using distances between alleles with special reference for microsatellite loci. Genetics 1996, 142, 1061–1064. [Google Scholar]
  29. Pritchard, J.K.; Stephens, M.; Donnelly, P. Inference of population structure using multilocus genotype data. Genetics 2000, 155, 945–959. [Google Scholar]
  30. Corander, J.; Tang, J. Bayesian analysis of population structure based on linked molecular information. Math. Biosci. 2007, 205, 19–31. [Google Scholar] [CrossRef]
  31. Evanno, G.; Regnaut, S.; Goudet, J. Detecting the number of clusters of individuals using the software STRUCTURE: A simulation study. Mol. Ecol. 2005, 14, 2611–2620. [Google Scholar] [CrossRef] [PubMed] [Green Version]
  32. Earl, D.A.; von Holdt, B.M. STRUCTURE HARVESTER: A website and program for visualizing STRUCTURE output and implementing the Evanno method. Cons. Gen. Res. 2012, 4, 359–361. [Google Scholar] [CrossRef]
  33. Felsenstein, J. PHYLIP (Phylogeny Inference Package) Version 3.6; Department of Genome Sciences, University of Washington: Seattle, DC, USA, 2005. [Google Scholar]
  34. Saitou, N.; Nei, M. The neighbor-joining method: A new method for reconstructing phylogenetic trees. Mol. Biol. Evol. 1987, 4, 406–425. [Google Scholar] [PubMed]
  35. Nielsen, M.M.; Heurich, M.; Malmberg, B.; Brun, A. Automatic mapping of standing dead trees after an Insect outbreak using the window independent context segmentation method. J. For. 2014, 112, 564–571. [Google Scholar] [CrossRef]
  36. Ravazzi, C. Late quaternary history of spruce in southern Europe. Rev. Paleobot. Palynol. 2002, 120, 131–177. [Google Scholar] [CrossRef]
  37. Salimonti, A.; Simeone, V.; Cesari, G.; Lamaj, F.; Cattivelli, L.; Perri, E.; Desiderio, F.; Fanizzie, F.P.; Del Coco, L.; Zelasco, S. A first molecular investigation of monumental olive trees in Apulia region. Sci. Hortic. 2013, 162, 204–212. [Google Scholar] [CrossRef]
  38. Wojnicka-Półtorak, A.; Celiński, K.; Chudzińska, E. Temporal dynamics in the genetic structure of a natural population of Picea abies. Biologia 2016, 71, 875–884. [Google Scholar] [CrossRef]
  39. Nowakowska, J.A.; Łukaszewicz, J.; Borys, M.; Tereba, A.; Konecka, A.; Zawadzka, A.; Sułkowska, M.; Zajączkowski, P. Origin of the Norway spruce (Picea abies L. Karst.) stands from Białowieża Forest at the level of Białystok Regional Directorate of the State Forests based on mitochondrial DNA analysis. Sylwan 2017, 161, 40–51. [Google Scholar]
  40. Wojnicka-Półtorak, A.; Wachowiak, W.; Prus-Głowacki, W.; Celiński, K.; Korczyk, A. Genetic heterogeneity in age classes of naturally regenerated old growth forest of Picea abies (L.) Karst. Silv. Genet. 2014, 63, 185–190. [Google Scholar] [CrossRef] [Green Version]
  41. Mott, C.L. Environmental constraints to the geographic expansion of plant and animal species. Nat. Educ. Knowl. 2010, 3, 72. [Google Scholar]
  42. Schlyter, P.; Stjernquist, I.; Bärring, L.; Jönsson, A.M.; Nilsson, C. Assessment of the impacts of climate change and weather extremes on boreal forests in northern Europe, focusing on Norway spruce. Clim. Res. 2006, 31, 75–84. [Google Scholar] [CrossRef]
  43. Brandt, L.A.; Butler, P.R.; Handler, S.D.; Janowiak, M.K.; Shannon, P.D.; Swanston, C.W. Integrating science and management to assess forest ecosystem vulnerability to climate change. J. For. 2016, 115, 212–221. [Google Scholar] [CrossRef]
  44. Tiscar, P.A.; Lucas-Borja, M.E. Structure of old-growth and managed stands and growth of old trees in a Mediterranean Pinus nigra forest in southern Spain. Forestry 2016, 89, 201–207. [Google Scholar] [CrossRef] [Green Version]
  45. Mikusiński, G.; Bubnicki, J.W.; Churski, M.; Czeszczewik, D.; Walankiewicz, W.; Kuijper, D.P. Is the impact of loggings in the last primeval lowland forest in Europe underestimated? The conservation issues of Białowieża Forest. Biol. Cons. 2018, 227, 266–274. [Google Scholar] [CrossRef]
  46. Stereńczak, K.; Mielcarek, M.; Modzelewska, A.; Kraszewski, B.; Fassnacht, F.E.; Hilszczański, J. Intra-annual Ips typographus outbreak monitoring using multi-temporal GIS analysis based on hyperspectral and ALS data in the Białowieża Forests. For. Ecol. Manag. 2019, 442, 105–116. [Google Scholar] [CrossRef]
  47. Stereńczak, K.; Mielcarek, M.; Kamińska, A.; Kraszewski, B.; Piasecka, Ż.; Miścicki, S.; Heurich, M. Influence of selected habitat and stand factors on bark beetle Ips typographus (L.) outbreak in the Białowieża Forest. For. Ecol. Manag. 2020, 459, 117826. [Google Scholar] [CrossRef]
  48. Nebe, W. Über Beziehungen zwischen Klima Und Wachstum der Fichte (Picea abies L.) in ihrem europeischen Verbreitungsgebiet. Arch. Forstw. 1968, 17, 1219–1238. [Google Scholar]
  49. Gebauer, R.; Volarík, D.; Urban, J.; Børja, I.; Nagy, N.E.; Eldhuset, T.D.; Krokene, P. Effects of prolonged drought on the anatomy of sun and shade needles in young Norway spruce trees. Ecol. Evol. 2015, 5, 4989–4998. [Google Scholar] [CrossRef] [Green Version]
  50. Gebauer, R.; Volarík, D.; Urban, J.; Børja, I.; Nagy, N.E.; Eldhuset, T.D.; Krokene, P. Effects of mild drought on the morphology of sun and shade needles in 20-year-old Norway spruce trees. iForest-Biogeosciences For. 2019, 12, 27–34. [Google Scholar] [CrossRef]
  51. Grodzki, W. Mass outbreaks of the spruce bark beetle Ips typographus in the context of the controversies around the Białowieża Primeval Forest. For. Res. Papers 2016, 77, 324–331. [Google Scholar] [CrossRef] [Green Version]
  52. Desprez-Loustau, M.L.; Marcais, B.; Nageleisen, L.M.; Piou, D.; Vannini, A. Interactive effects of drought and pathogens in forest trees. Ann. For. Sci. 2006, 63, 597–612. [Google Scholar] [CrossRef] [Green Version]
  53. Allen, C.D.; Macalady, A.K.; Chenchouni, H.; Bachelet, D.; McDowell, N.; Vennetier, M.; Kitzbergerg, T.; Riglingh, A.; Breshearsi, D.D.; Hogg, E.H.T.; et al. A global overview of drought and heat-induced tree mortality reveals emerging climate change risks for forests. For. Ecol. Manag. 2010, 259, 660–684. [Google Scholar] [CrossRef] [Green Version]
  54. McDowell, N.; Pockman, W.T.; Allen, C.D.; Breshears, D.D.; Cobb, N.; Kolb, T.; Plaut, J.; Sperry, J.; West, A.; Williams, D.G.; et al. Mechanisms of plant survival and mortality during drought. New Phytol. 2008, 178, 719–739. [Google Scholar] [CrossRef] [PubMed]
  55. Wulder, M.A.; Dymond, C.C.; White, J.C.; Leckie, D.G.; Caroll, A.L. Surveying mountain pine beetle damage of forests: A review of remote sensing opportunities. For. Ecol. Manag. 2006, 221, 27–41. [Google Scholar] [CrossRef]
  56. Senf, C.; Seidl, R.; Hostert, P. Remote sensing of forest insect disturbances: Current state and future directions. Int. J. Appl. Earth Obs. Geoinf. 2017, 60, 49–60. [Google Scholar] [CrossRef] [Green Version]
  57. Heurich, M.; Ochs, T.; Andresen, T.; Schneider, T. Object-oriented image analyses for semi-automatic detection of dead trees following a spruce bark beetle (Ips typographus) outbreak. Eur. J. For. Res. 2010, 129, 313–324. [Google Scholar] [CrossRef]
  58. Polewski, P.; Yao, W.; Heurich, M.; Krzystek, P.; Stilla, U. Detection of single standing dead trees from aerial color infrared imagery by segmentation with shape and intensity priors. ISPRS Ann. Photogramm. Remote Sens. Spat. Inf. Sci. 2015, 2, 181–188. [Google Scholar] [CrossRef] [Green Version]
  59. Tollefsrud, M.M.; Latałowa, M.; van der Knaap, W.O.; Brochmann, C.; Sperisen, C. Late Quaternary history of North Eurasian Norway spruce (Picea abies) and Siberian spruce (Picea obovata) inferred from macrofossils, pollen and cytoplasmic DNA variation. J. Biogeogr. 2015, 42, 1431–1442. [Google Scholar] [CrossRef]
  60. Humphrey, J.W. Benefits to biodiversity from developing old-growth conditions in British upland spruce plantations: A review and recommendations. For. Intern. J. For. Res. 2005, 78, 33–53. [Google Scholar] [CrossRef]
  61. Westergren, M.; Bozic, G.; Kraigher, H. Genetic diversity of core vs. peripheral Norway spruce native populations at a local scale in Slovenia. iForest 2018, 11, 104–110. [Google Scholar] [CrossRef] [Green Version]
  62. Greenbaum, G.; Templeton, A.R.; Zarmi, Y.; Bar-David, S. Allelic richness following population founding events–a stochastic modeling framework incorporating gene flow and genetic drift. PLoS ONE 2014, 9. [Google Scholar] [CrossRef] [PubMed] [Green Version]
  63. Allendorf, F.W. Genetic drift and the loss of alleles versus heterozygosity. Zoo. Biol. 1986, 5, 181–190. [Google Scholar] [CrossRef]
  64. Hughes, R.A.; Inouye, B.D.; Johnson, M.T.J.; Underwood, N.; Vellend, M. Ecological consequences of genetic diversity. Ecol. Lett. 2008, 11, 609–623. [Google Scholar] [CrossRef] [PubMed]
  65. Szulkin, M.; Bierne, N.; David, P. Heterozygosity-fitness correlations: A time for reappraisal. Evolution 2010, 64, 1202–1217. [Google Scholar] [CrossRef] [PubMed]
  66. Szczecińska, M.; Sramko, G.; Wołosz, K.; Sawicki, J. Genetic diversity and population structure of the rare and endangered plant species Pulsatilla patens (L.) Mill. in East Central Europe. PLoS ONE 2016, 11, e0151730. [Google Scholar] [CrossRef] [Green Version]
  67. Martín, M.A.; Mattioni, C.; Cherubini, M.; Villani, F.; Martín, L.M. A comparative study of European chestnut varieties in relation to adaptive markers. Agrofor. Syst. 2017, 91, 97–109. [Google Scholar] [CrossRef]
  68. Belletti, P.; Ferrazzini, D.; Piotti, A.; Monteleone, I.; Ducci, F. Genetic variation and divergence in Scots pine (Pinus sylvestris L.) within its natural range in Italy. Eur. J. For. Res. 2012, 131, 1127–1138. [Google Scholar] [CrossRef] [Green Version]
  69. Rajora, O.P.; Pluhar, S.A. Genetic diversity impacts of forest fires, forest harvesting, and alternative reforestation practices in black spruce (Picea mariana). Theor. Appl. Genet. 2003, 106, 1203–1212. [Google Scholar] [CrossRef]
  70. Alcaide, F.; Solla, A.; Cherubini, M.; Mattioni, C.; Cuenca, B.; Camisón, Á.; Martín, M.Á. Adaptive evolution of chestnut forests to the impact of ink disease in Spain. J. Syst. Evol. 2020. [Google Scholar] [CrossRef]
  71. Sjölund, M.J.; Jump, A.S. Coppice management of forests impacts spatial genetic structure but not genetic diversity in European beech (Fagus sylvatica L.). For. Ecol. Manag. 2015, 336, 65–71. [Google Scholar] [CrossRef] [Green Version]
  72. Ramakrishnan, U. Detecting past population bottlenecks using temporal genetic data. Mol. Ecol. 2005, 14, 2915–2922. [Google Scholar] [CrossRef] [PubMed]
  73. Meirmans, P.G. Using the AMOVA framework to estimate a standardized genetic differentiation measure. Evolution 2006, 60, 2399–2402. [Google Scholar] [CrossRef] [PubMed]
  74. Hamrick, J.L.; Godt, M.J.W. Allozyme diversity in plant species. In Plant Population Genetics, Breeding and Genetic Resources; Brown, H.D., Clegg, M.T., Kahler, A.L., Weir, B.S., Eds.; Sinauer: Sunderland, MA, USA, 1989; pp. 43–63. [Google Scholar]
  75. Mousadik, A.; Agroforesterie, L.; Sciences, F. High level of genetic differentiation for allelic richness among populations of the argan tree [Argania spinosa (L.) Skeels] endemic to Morocco. Theor. Appl. Genet. 1996, 92, 832–839. [Google Scholar] [CrossRef] [PubMed]
  76. Nowakowska, J.A. Mitochondrial and nuclear DNA differentiation of Picea abies populations in Poland. Dendrobiology 2009, 61 (Suppl), 119–129. [Google Scholar]
  77. Jombart, T.; Devillard, S.; Balloux, F. Discriminant analysis of principal components: A new method for the analysis of genetically structured populations. BMC Genet. 2010, 11, 94. [Google Scholar] [CrossRef] [PubMed] [Green Version]
  78. Kalinowski, S.T. The computer program STRUCTURE does not reliably identify the main genetic clusters within species: Simulations and implications for human population structure. Heredity 2010, 106, 625–632. [Google Scholar] [CrossRef] [Green Version]
  79. Stojnić, S.; Avramidou, E.V.; Fussi, B.; Westergren, M.; Orlović, S.; Matović, B.; Trudić, B.; Kraigher, H.; Aravanopoulos, F.A.; Konnert, M. Assessment of Genetic Diversity and Population Genetic Structure of Norway Spruce (Picea abies (L.) Karsten) at Its Southern Lineage in Europe. Implications for Conservation of Forest Genetic Resources. Forests 2019, 10, 258. [Google Scholar] [CrossRef] [Green Version]
  80. Bínová, Z.; Korecký, J.; Dvořák, J.; Bílý, J.; Zádrapová, D.; Jansa, V.; Lstibůrek, M. Genetic Structure of Norway Spruce Ecotypes Studied by SSR Markers. Forests 2020, 11, 110. [Google Scholar] [CrossRef] [Green Version]
  81. Lefèvre, F. Human impacts on forest genetic resources in the temperate zone: An updated review. For. Ecol. Manag. 2004, 197, 257–271. [Google Scholar] [CrossRef]
Figure 1. Geographical location of 47 Monuments of Nature (Population 1) in Białowieża Forest District (BFD) (a part of Białowieża Primeval Forest (BPF)). The other stands investigated (Populations 2–8) surrounded this site within 10 to 35 km.
Forests 11 00647 g001
Figure 2. Health status evaluation from the ground of the same Norway spruce monumental tree. (a): high health status (2014); (b): dead (2017). Photo by A. Chrenowski.
Forests 11 00647 g002
Figure 3. STRUCTURE bar plots of nSSR data (n = 328 trees); (a) for K = 2; and (b) for K = 5 referring to a single population code from Table 2.
Forests 11 00647 g003
Figure 4. Principal Coordinate Analysis (PCoA) plot based on pairwise genetic distances of FST(ENA) values. Population numbers according to Table 2.
Forests 11 00647 g004
Table 1. Description of the crowns and their relationship to the damage level [16] with categories of tree crown status defined based on damage level.
Health StatusCrown ColorTree Crown Condition DescriptionTree Crown Condition Image
1—Very highSaturated redHealthy, full needles, with no visible color changes Forests 11 00647 i001
2—HighRed lightenedReduction in foliage, parts of needles with visible discoloration Forests 11 00647 i002
3—WeakWhite (with a slight addition of red)Significant reduction in foliage, many remaining needles are discolored Forests 11 00647 i003
4—DeadGreenDead trees Forests 11 00647 i004
Table 2. Geographical characteristics of the analyzed populations in BPF.
Population CodeForest DistrictPopulation NameNumber of TreesGeographic LocationMean Age (years 2)Area (ha)
1BiałowieżaMonumental trees4752°38′/46′ N, 23°43′/54′ E22512.59
2BiałowieżaBNP 1, parcel 256dg4052°46′ N, 23°50′ E15030.17
3BiałowieżaBNP, parcel 284dg2352°45′ N, 23°51′ E14025.95
4BiałowieżaTeremiski2852°44′52′′ N, 23°46′30′′ E1884.72
5BiałowieżaGrudki4052°40′40′′ N, 23°47′06′′ E14920.87
6HajnówkaDługi Bród5052°38′30′′ N, 23°37′05′′ E1629.90
7BrowskKrynica5052°52′46′′ N, 23°32′55′′ E1323.96
8BrowskJelonka5052°48′00′′ N, 23°47′50′′ E13314.21
1 Białowieski National Park 2 in 2018.
Table 3. Number of monumental spruce trees in BFD according to their health status from ground on-site inventory, 2014–2017.
Health Status 1Year
2014201520162017
1—Very high5111
2—High292499
3—Weak1532
4—Dead12173435
1 Classification of tree health status, detailed in Table 1.
Table 4. Comparison of health status of the 47 monumental spruce trees growing under different forms of protection as observed on-site in 2014 and 2017.
Health Status of Tree aNumber of Trees
Partial Nature ReservesValuable Fragments of Native ForestWater Protection Areas
201420172014201720142017
Healthy (1 + 2)19512332
Weak (3)--11-1
Dead (4)41861522
Total2323191955
a Health status categories from Table 1. Healthy—spruces not showing visible symptoms of their decline; weak—spruces with dead or dying branches in the crown; and dead—most of the needles fallen or brownish if still on the branches.
Table 5. Meteorological data from the climatic station located in Białowieża.
YearAnnual Precipitation [mm]Precipitation of Growing Season [mm]Rprep1Average Annual Temperature [°C]Average Temperature of Growing Season [°C]
2000533.33304.050.578.1313.19
2001605.20453.930.757.2013.55
2002625.61412.980.667.7813.71
2003548.96367.810.677.0112.88
2004660.95416.400.637.0512.54
2005633.49399.100.636.9412.85
2006567.18442.400.787.2313.87
2007692.92450.470.658.0013.36
2008666.61413.330.628.1513.10
2009786.06518.830.667.2212.96
2010870.12704.810.816.8113.60
2011637.22503.440.797.7413.79
2012675.50540.460.807.2313.61
2013721.89534.290.747.7013.71
2014608.38450.280.748.0113.41
2015512.57358.860.708.7913.43
2016842.50674.070.807.5113.39
Average 2000–2011652.30448.960.697.4413.28
Average 2012–2016672.17511.590.767.8513.51
1Rprep = precipitation during the season divided by annual precipitation.
Table 6. Genetic diversity parameters1 for the studied Norway spruce stands from BPF. Population codes are given in Table 2.
PopulationNNaNeAR(11)AprivIHOHEGdFIS
Pop14715.9097.6568.8950.9091.9790.5640.7070.7160.211 ***
Pop24013.1827.1248.5650.5451.9130.5780.7120.7240.203 ***
Pop3239.9095.7808.1130.4551.7450.6270.7030.7260.147 ***
Pop42812.3646.9178.7440.2731.8910.5500.7130.7300.246 ***
Pop54014.4557.5198.7600.6361.9300.5640.7020.7140.214 ***
Pop65013.8187.2658.4320.2731.9280.5410.7180.7270.255 ***
Pop75014.2736.9898.5090.1821.9160.5190.7020.7130.264 ***
Pop85015.2737.5628.6890.3641.9710.5870.7220.7310.196 ***
Mean4113.6487.1028.5880.4551.9090.5660.7100.7230.217 ***
Abbreviations: sample size (N); number of observed alleles (Na); number of effective alleles (Ne); allelic richness (AR(11), standardized for 30 individuals); number of private alleles (Apriv); Shannon’s diversity index (I); observed heterozygosity (HO); expected heterozygosity (HE); gene diversity of Nei (Gd) [23]; within-population Wright’s inbreeding coefficient (FIS) (*** p < 0.001).
Table 7. Analysis of molecular variance (AMOVA) results for genetic variation between and among investigated populations.
Source of Variabilityd.f. 1Sum of SquaresMean SquareEstimated VarianceVariation Share (%)p Value 2
Among populations753.5327.6470.03010.007
Within populations6482611.1238.00884.044990.300
Total6552664.655 4.074100
1 Degrees of freedom (d.f.). 2 p value based on 999 permutations.

