Article

The Pattern of Genetic Variation, Survival and Growth in the Abies alba Mill. Population within the Introgression Zone of Two Refugial Lineages in the Carpathians

Faculty of Forestry, University of Agriculture, Al. 29 Listopada 46, 31-425 Cracow, Poland
*
Author to whom correspondence should be addressed.
Submission received: 2 July 2020 / Revised: 31 July 2020 / Accepted: 3 August 2020 / Published: 5 August 2020
(This article belongs to the Section Forest Ecophysiology and Biology)

Abstract

:
Background and Objectives: The contact zones of different refugial lineages, where mixing of genetic backgrounds leads to new gene combinations or pre-adaptations, represent hotspots of genetic diversity. The aim of the study was to compare patterns in the genetic structure of the Abies alba Mill. population in the Eastern and Western Carpathians (Eastern Europe) within the introgression zone of two refugial lineages and the growth response of provenances located in a gradient of pollen-mediated gene fluxes. Materials and Methods: The mitochondrial nad5-4 marker and five polymorphic microsatellite nuclear markers (nSSR) were analyzed in 56 subpopulations from Romania, Ukraine, Slovakia and Poland. The survival rate and height growth up to an age of 15 years were compared for 33 subpopulations, forming a distance gradient between 170 and 470 km from the meeting zone of the refugial lineages. Results: The results of the analysis of molecular variance indicated that 8.2% of the total genetic variation is attributable to the between-subpopulation level and 1.7% to the between-lineage level. The pollen-mediated influence of the eastern lineage was detectable at a distance of at least 300 km in the western direction. Eastern provenances with origin sites closer to the meeting zone of the refugial lineages were characterized by lower survival rate and lower heights (about 8% lower than the average tree height) compared to subpopulations from the central and western part of the studied region. Conclusions: Pollen-mediated gene flow between lineages appears to have been sufficient to cause a significant change in phenotypic traits related to tree growth. Subpopulations from the central and western parts of the studied region are better adapted to current climatic conditions. Nonetheless, given the increasing aridity of the regional climate, a safe guideline is to increase genetic mixing.

1. Introduction

The current extent of a population’s genetic variability is a reflection of the influence of several factors with interpenetrative effects, such as the pressures of natural selection and postglacial migration associated with demographic processes and past human activities [1]. The adaptive potential of trees depends on the level of genetic variation and the rate of change in environmental conditions [2,3]. One challenge for forestry decision-making under climate change is to accelerate the response to current selection pressures while preserving diversity and adaptability to an uncertain future [4,5]. A safe guideline is to avoid random genetic erosion and increase genetic mixing.
Hotspots of genetic diversity have been found in refugial areas, in contact zones where different refugial lineages can interact [6,7] and in microrefugia [8] or cryptic refugia [9]. Refugial lineages originally contained different pre-adapted genomes, which have successfully adapted to changing environmental conditions during post-glacial migration. The mixing of different genetic backgrounds and genetic drift can lead to new gene combinations or pre-adaptations, which is an important evolutionary mechanism that tests new combinations of alleles in a given environmental setting [10,11,12]. Genetic enrichment might also result from spontaneous hybridization between related taxa [13,14].
Abies alba is an important component of forest ecosystems in terms of production and ecological features [15]. This species also has considerable potential to protect carbon stocks in forests in a changing climate, as evidenced by its positive response in recent decades to a warming climate in Central Europe and adjacent areas [16,17,18,19]. Nonetheless, the stress-sensitivity and adaptive potential of A. alba show considerable geographic variation [20,21,22,23,24,25], which is related to the Holocene remigration history [26] and genetic background [27]. Analyses of maternally inherited mtDNA revealed that there are two different haplotypes in the modern distribution range of A. alba in Europe [28,29,30]. Presumably, they have originated from two effective glacial refugial areas: one from the western location in the northern Apennines and southern Alps [31,32] and the other from the eastern Balkan location in northwestern Greece [33]. A. alba from the western refugium spread into the Massif Central; the Vosges Mountains; the Black, Bavarian, Bohemian and Thuringian Forests; the Ore Mountains; and the Western Carpathians. From the southern Balkan Peninsula, A. alba migrated along the Dalmatian coast and northwards through the Romanian Carpathians. Populations representing the western and eastern refugial lineages may have met in Croatia and Bosnia and in the Ukrainian Carpathians [26,29,30].
The Western and Eastern Carpathians are an interesting region for assessing the genetic variation of A. alba since its population has been influenced by genetic pools originating from both refugial areas. Bosea et al. [34] indicated that the geographical separation of post-glacial A. alba populations from different refugial regions coincides with significant differences in growth trends and climate response. Pollen-mediated gene flow over the boundary between lineages would be expected to lead to the enrichment of gene pools by alleles from the counterpart lineages and consequently to increased allelic richness at nuclear loci in the subpopulation located close to the boundary. In fact, Gömöry et al. [30], and recently also Teodosiu et al. [35], found that, within the Balkan lineage, genetic diversity and allelic richness increase towards the meeting point. Nevertheless, no such trend was observed for the western lineage, and Gömöry et al. [30] attributed this to the short geographic trend in the data set.
The aim of the current research is to bridge this gap and analyze the patterns of genetic variation and growth of the A. alba population within the pollen-mediated introgression zone in the western part of the Carpathian arc. The continuous distribution range and considerable proportion of A. alba in the total forest area (26%, [36]) make this region the northernmost hotspot of silver fir occurrence in Europe. We hypothesized (1) that the genetic pools originating from the western and eastern refugial areas interact with each other, and therefore, the proportions of genetic groups exhibit a cline pattern of genetic diversity in this region. We assumed also that (2) an extension of the geographical trend in the data set compared to that used by Gömöry et al. [30] would result in a higher estimate of introgression zone width between lineages. In addition, we hypothesized that (3) the genetic pools from different refugial areas are characterized by a different response pattern to climatic conditions and that pollen-mediated gene flow between lineages is sufficient to cause a significant change in phenotypic traits related to tree growth. Therefore, by analogy to the pattern of genetic variation, we expected a cline variation of survival and growth of the A. alba population within the pollen-mediated introgression zone.

2. Materials and Methods

2.1. Molecular Analyses

This study is an extension of a former study by Gömöry et al. [30] in the Eastern Carpathians, which determined the geographic location of the meeting point of the maternal lineages originating in the western and eastern refugial zones, with the boundary line crossing close to the Yablunitsky Pass (48°18′N 24°27′E). To gain a more general view of the pattern of genetic variation in the Abies alba Mill. population in the western direction from the contact zone of the two refugial lineages, this present analysis combines material from the Carpathians in Romania, Ukraine, Slovakia (31 stands) and Poland (25 stands). The location of the sampled stands is shown in Figure 1 and Table S1 (Supplementary Materials). The stands are located in the lower montane vegetation belt (500−950 m a.s.l.) under relatively homogenous site conditions typical for mixed forests consisting of Abies alba, Fagus sylvatica L. and/or Picea abies L. (H. Karst) [37,38]. The age of the stands ranges between 80 and 130 years. Because in the study region in forests with A. alba, almost exclusively silvicultural systems based on natural regeneration have been applied (shelterwood or irregular shelterwood) [39] and there are no records of A. alba plant or seed material being transferred, they are most probably native. In each stand, the current-year needles from 30 trees representing Kraft’s 2nd social class were taken for molecular analysis.
Plant material was lyophilized in a Labconco FreeZone 2.5 and then ground in a Retsch MM 400 mixer mill. Genomic DNA was extracted from 20 mg of the powdered dry needles by a modified CTAB method [40]. The DNA pellet obtained was re-suspended in 50.0 µL of TE buffer and then diluted 10 times.
MtDNA fragment analysis was performed to distinguish the two haplotypes originating from the two effective glacial refugial areas [28]. Amplification was conducted in a total volume of 10 µL. The PCR mixture contained 1.5 µL 10 × DreamTaq Buffer, 2.0 mM MgCl2 (Thermo Fisher Scientific, Waltham, MA, USA), 0.2 mM dNTPs (Thermo Fisher Scientific, Waltham, MA, USA), 0.5 U DreamTaq™ DNA Polymerase (Thermo Fisher Scientific, Waltham, MA, USA) and 0.2 µM of primers F (5 ‘GGACAATGACGATCCGAGATA 3’) and R (5 ‘CATCCCTCCCATTGCATTAT 3’) and 3 µL of DNA template. The thermo cycler program consisted of an initial denaturation step at 95 °C for 5 min, followed by 36 cycles of 60 s at 95 °C, 45 s at an annealing temperature of 52.5 °C, a 150 s extension at 72 °C and a final extension step for 480 s at 72 °C. Amplified fragments were separated by electrophoresis on 1.5% agarose gel (Agarose Basica LE, Prona, Burgos, Spain) in 1xTBE (Tris-Borate-EDTA) buffer and stained by Midori Green Advance DNA Stain (Nippon Genetics, Europe GmbH, Duren, Germany). The results were visualized in UV and documented in Bio1D++ software (Vilber Lourmat, Collégien, France). As a size standard marker, 100 BP plus (Thermo Fisher Scientific, Waltham, MA, USA) was used.
PCR reactions for nSSR analysis were performed on a final volume of 15.0 µL containing 3 µL DNA template, 1.5 µL 10 × DreamTaq Buffer with 2.0 mM MgCl2 (Thermo Fisher Scientific, Waltham, MA, USA), 0.2 mM each of dNTP (Thermo Fisher Scientific, Waltham, MA, USA), 0.5 U DreamTaq™ DNA Polymerase (Thermo Fisher Scientific, Waltham, MA, USA) and 0.2 µM of primers F (labeled fluorescent) and R. Initially, because of budget limitations, seven primers of the eleven developed by Cremer et al. [41] were tested. On the basis of the quality of the obtained amplification products and recurrence of electrophoretic images, the five most appropriate primers were selected and used in this study for assessment of nuclear genetic diversity: SF239 (VIC TD68), SFb5 (NED TD65), SFb4 (VIC TD65), SF333 (PET TD65), SF78 (FAM TD65). As indicated by the preliminary examination, the parameters of allelic richness (i.e., mean number of alleles per locus and number of effective alleles) determined for the five loci used in this study and seven loci described in Gömöry et al. [30] were closely correlated across stands (correlation coefficients of 0.80 and 0.93, respectively) and did not lead to significant loss of information. In the optimization step, two touchdown profiles were established: TD65 and TD68. Finally, amplification was carried out in an Eppendorf Gradient S thermal cycler under the following conditions: 5 min at 95 °C followed by 10 touchdown cycles of 30 s at 95 °C, 30 s at 65 °C (TD65) or 68 °C (TD68) (1 °C lower per cycle for TD65 or TD68), 40 s at 72 °C and 25 cycles of 30 s at 95 °C, 50 s at 55 °C (TD65) or 58 °C (TD68), 40 s at 72 °C and a final extension time of 480 s at 72 °C. The PCR products were separated by capillary electrophoresis using a 3500 Genetic Analyzer automated sequencer (Applied Biosystems, Foster City, CA, USA). The alleles were sized and analyzed using the internal size standard GeneScanTM −600 LIZ® Size Standard v2.0. (Applied Biosystems, Foster City, CA, USA) by GeneMapper® Software Version 4.0 (Applied Biosystems, Foster City, CA, USA). Allele calls (fragment sizes) were adjusted to those used in the former study of Gömöry et al. [30].

2.2. Provenance Trial

To compare the growth pattern of A. alba trees from subpopulations located at different distances from the meeting point of the two refugial lineages, data from a provenance trial carried out in southern Poland were used [42,43]. This experiment was established in 2000 and originally comprised 39 provenances of silver fir from the Polish part of the Carpathians and their foothills (Figure 1). To the best of our knowledge, this is the only provenance trial for A. alba in Europe, which comprises subpopulations growing in relatively homogeneous site conditions and forming a geographical gradient along the contact zone of lineages from different refugial areas. Seeds used for the production of planting stock were collected from 20 trees that were growing in mature stands aged 80−160 years, putatively autochthonous and designated as selected seed sources. All the plants for these experiments were raised at the nursery at Feleczyn (Forest District Nawojowa, 49°30′N 20°49′E). They were planted out as 4-year-old stock in nine test sites on abandoned mountain meadows (and in one case on former forestland after clear felling) at an altitude between 500 and 870 m a.s.l. (Figure 1). Each experiment was a randomized block with provenance as the treatment and three replicates (in total 90 trees per provenance). On each plot, A. alba was growing under the shelter of European larch (Larix decidua Mill.), which was planted four years prior (2 × 2 m spacing, 2-year-old stock) to fir. The planting spacing for A. alba was 2 × 2 m, and each block contained 30 (5 × 6) individuals. All experimental sites were fenced against deer and were regularly weeded for the first five years after planting. Survival rate in the first year after planting was between 96 and 100% (on average 97%), and regional variation was not observed [43]. Since planting, the larch has been thinned twice in a systematic manner, whereas no thinning has been carried out for fir. In 2004, 2009 and 2014 (at an age of 15 years), in each test site, the number of trees per plot (survival) was recorded, and the height of all trees measured to the nearest cm using a measuring staff.
For the present analysis, data from measurements in 2014 for eight test sites and 33 montane provenances with origin sites at altitudes between 420 and 910 m a.s.l. typical for the occurrence of A. alba in the Polish part of the Carpathians were used (Figure 1). One test site damaged by wind (treefalls of larch) and six provenances from the foothill region representing different site conditions were discounted from the analysis. Details regarding the geographic locations and site conditions of the subpopulations and test sites are contained in earlier reports [42,43]. In the origin sites, the growth period (with a mean daily temperature above 5 °C) is ca. 180–220 days, average annual temperature is 5–8 °C and annual precipitation is 750–1300 mm, 60% of which occurs between May and October [44,45].

2.3. Data Analysis

The obtained nuclear microsatellite data were screened for genotyping errors using Micro-Checker v.2.2.3 software [46,47]. After estimating the null allele frequency, allele frequencies were adjusted by using the method of Brookfield [48] (Null Allele Estimator no. 1). All loci were tested for Hardy–Weinberg equilibrium and linkage disequilibrium using GenePop version 4.5 [49]. The calculations of basic parameters of genetic diversity, i.e., the number of alleles per locus Na, number of effective alleles per locus Ne, observed heterozygosity Ho, expected heterozygosity He (an unbiased estimate following Nei [50]) and inbreeding coefficient FIS, were carried out using GenAlEx 6.5 software [51,52]. Because the number of sampled stands differed between the eastern and western maternal lineages, the total number of alleles after rarefaction was also given. The significance of differences between the parameters of genetic diversity calculated for the western and eastern maternal (mitochondrial) lineages was tested using a two-sided permutation procedure (1,000 random permutations [53]).
The F and Slatkin’s [54] R measures implemented in the GenAlEx 6.5 package were used for the analysis of the proportion of variation between mitochondrial lineages, between and within subpopulations (AMOVA, 1,000 random permutations). The same program was applied to calculate the genetic distance index by Nei [55] between subpopulations. The subpopulations were clustered based on genetic distance values using the UPGMA method (STATISTICA 12, Statsoft Inc, Tulsa, OK, USA). In addition, a model-based clustering procedure using Bayesian inference in the STRUCTURE software program [56] was applied to assign multilocus genotypes of the sampled trees to a predefined number of clusters (K). Thirty independent runs, each with 1,000,000 MCMC iterations after 200,000 burn-in periods, were carried out for the K set between 1 and 7. The number of clusters was determined on the basis of the highest Delta K parameter calculated according to an algorithm by Evanno et al. [57] implemented in the Structure Harvester software program [58]. The outputs of 30 runs for the best-fitted K were analyzed using the Clumpak application [59].
The gene pool proportions against geographical distance from the contact zone at the Yablunitsky Pass (24°27′E, 48°18′N) were fitted to a sigmoid model:
p = p 1 + p 2 p 1 0.5 + t a n h x b 1 b 2
where x is the distance of the subpopulation from the center of the cline (b1), b2 is the width of the cline and p1 and p2 denote group frequencies within the western and eastern lineage, respectively. The significance of F-statistic calculated for the sigmoid model was estimated using a permutation procedure (1,000 random permutations [53]). Mantel’s test was used to assess the statistical significance of the relationships between genetic distances (expressed by the Nei index [55]) and geographic distances. Similarly, the relationships between the survival and average heights reached at an age of 15 years by the trees representing the 33 tested provenances and the distances between their origin site and the meeting zone of the refugial lineages were tested. In this case, simple linear or quadratic models provided the best fit compared to linear or saturating models. To control for the effect of site variation between test locations, calculations were performed for variables expressed in nominal and standardized units for each of the eight test sites.

3. Results

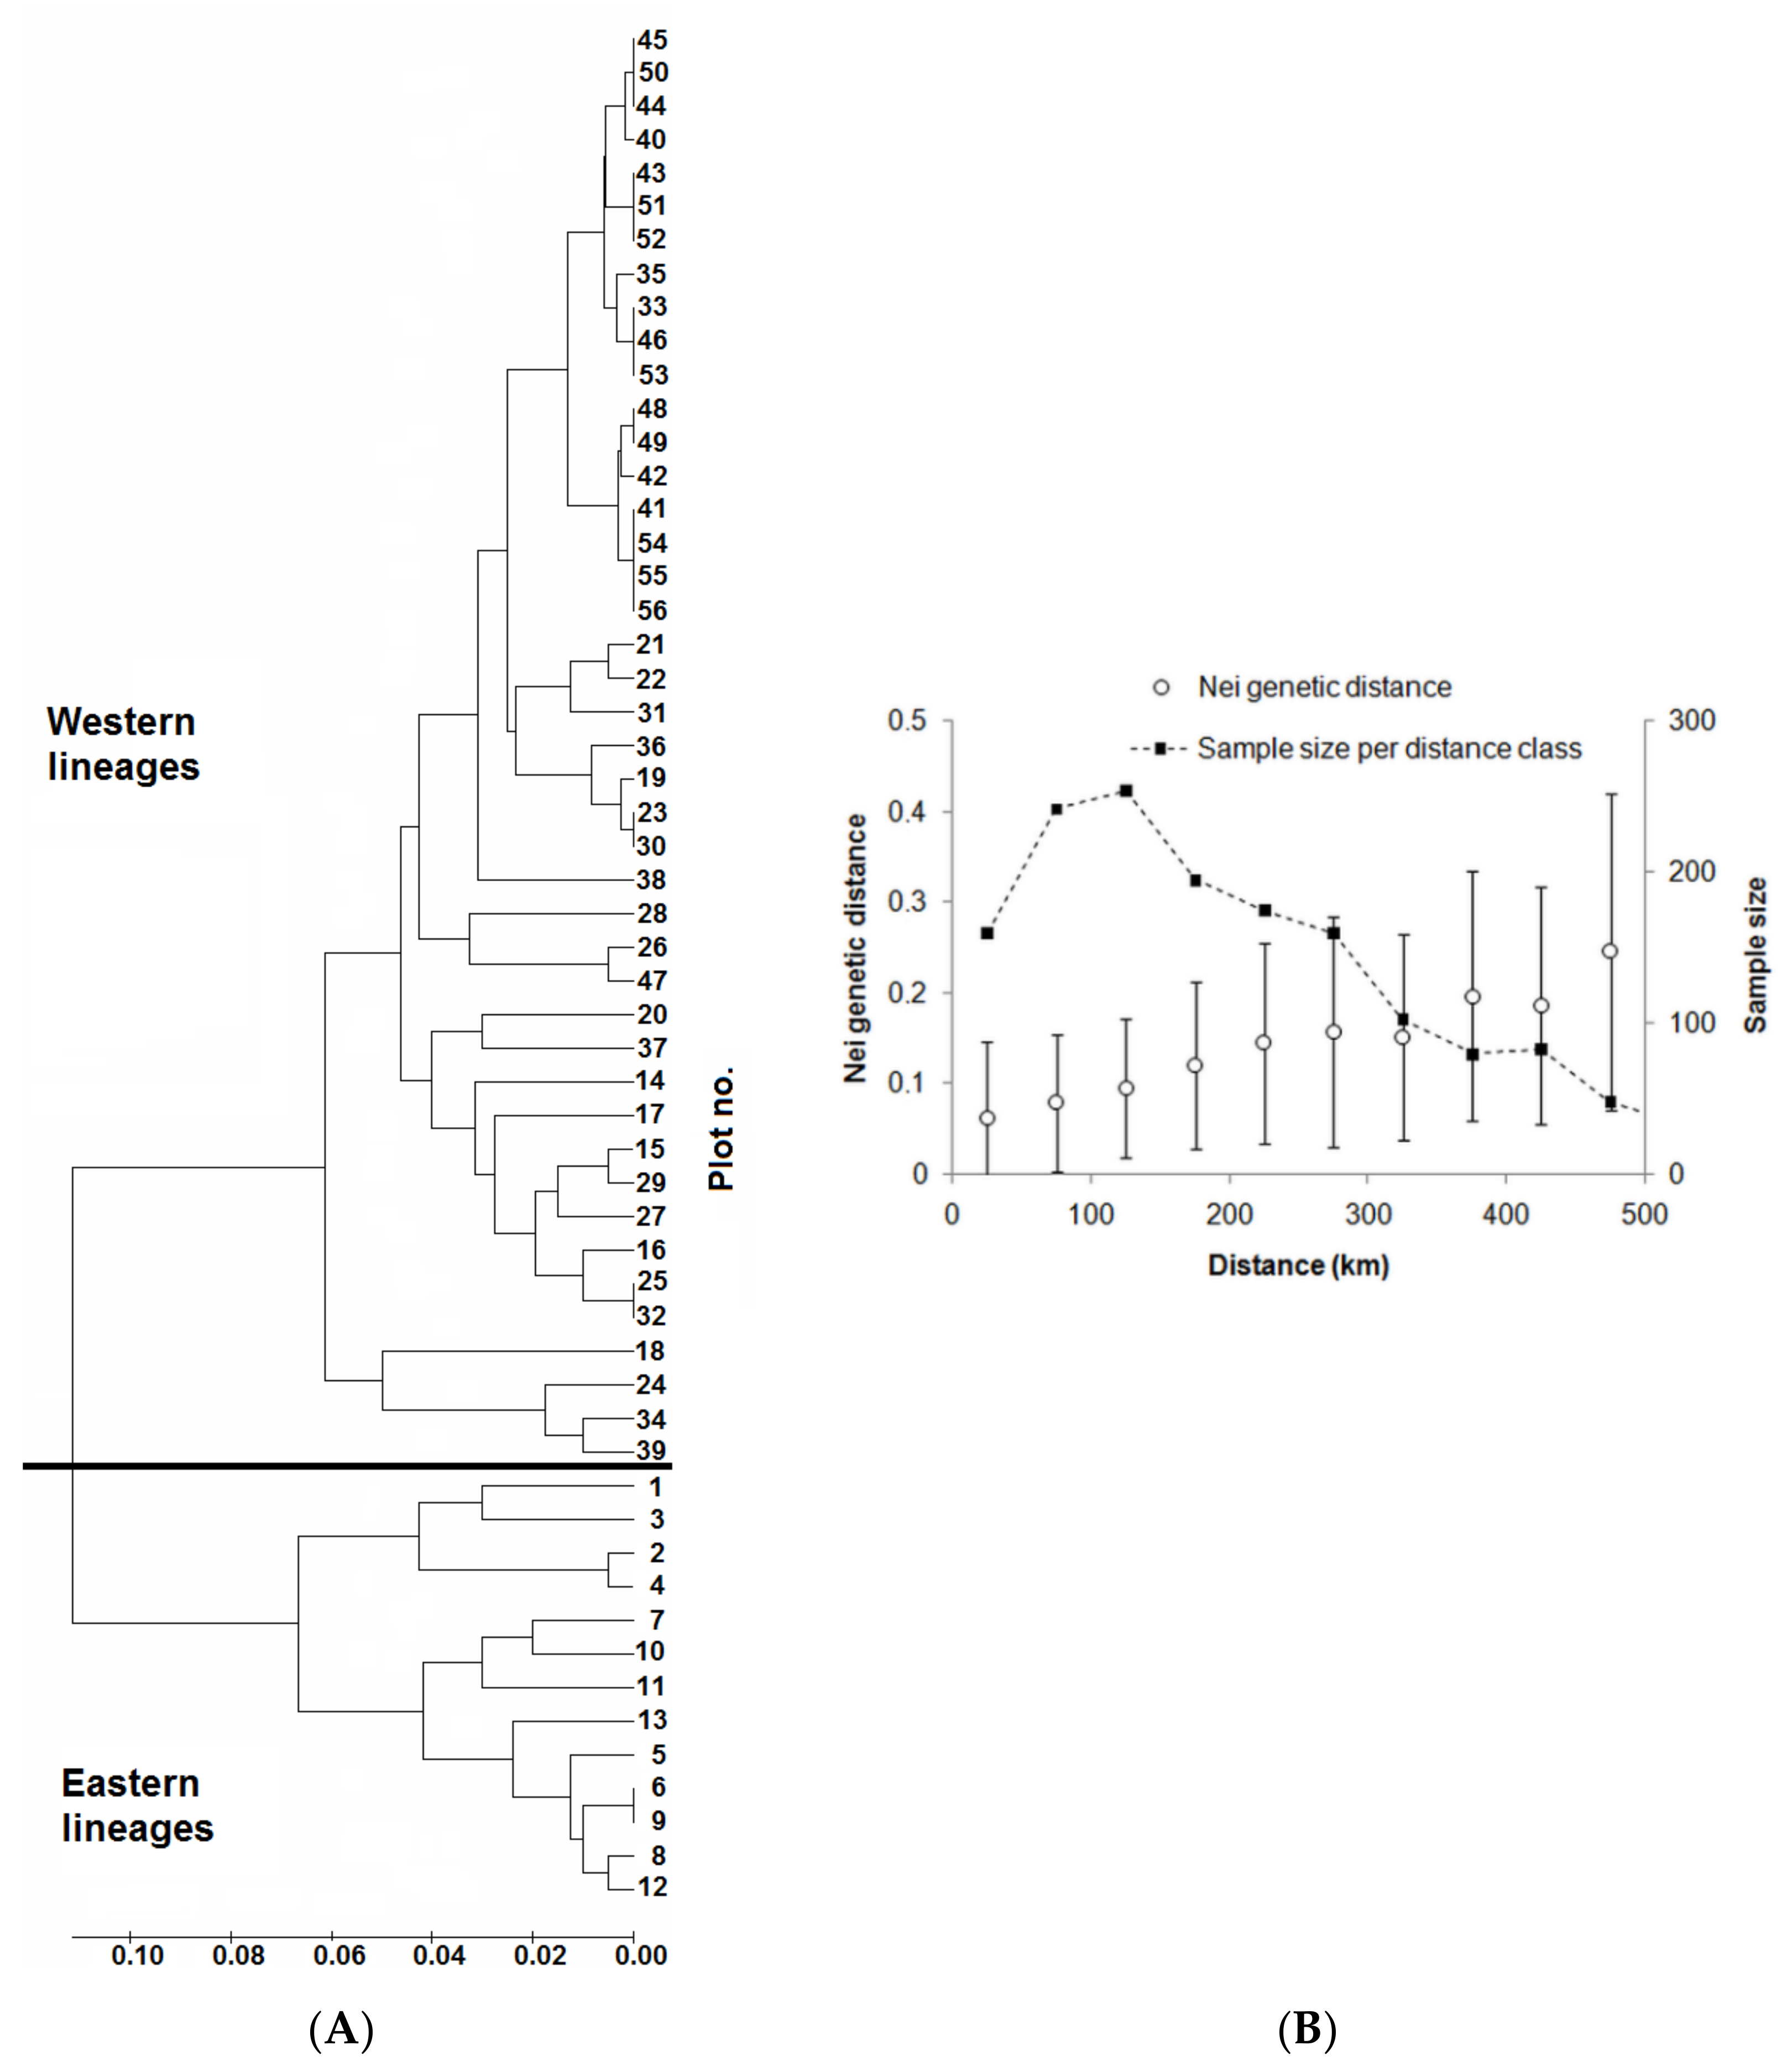
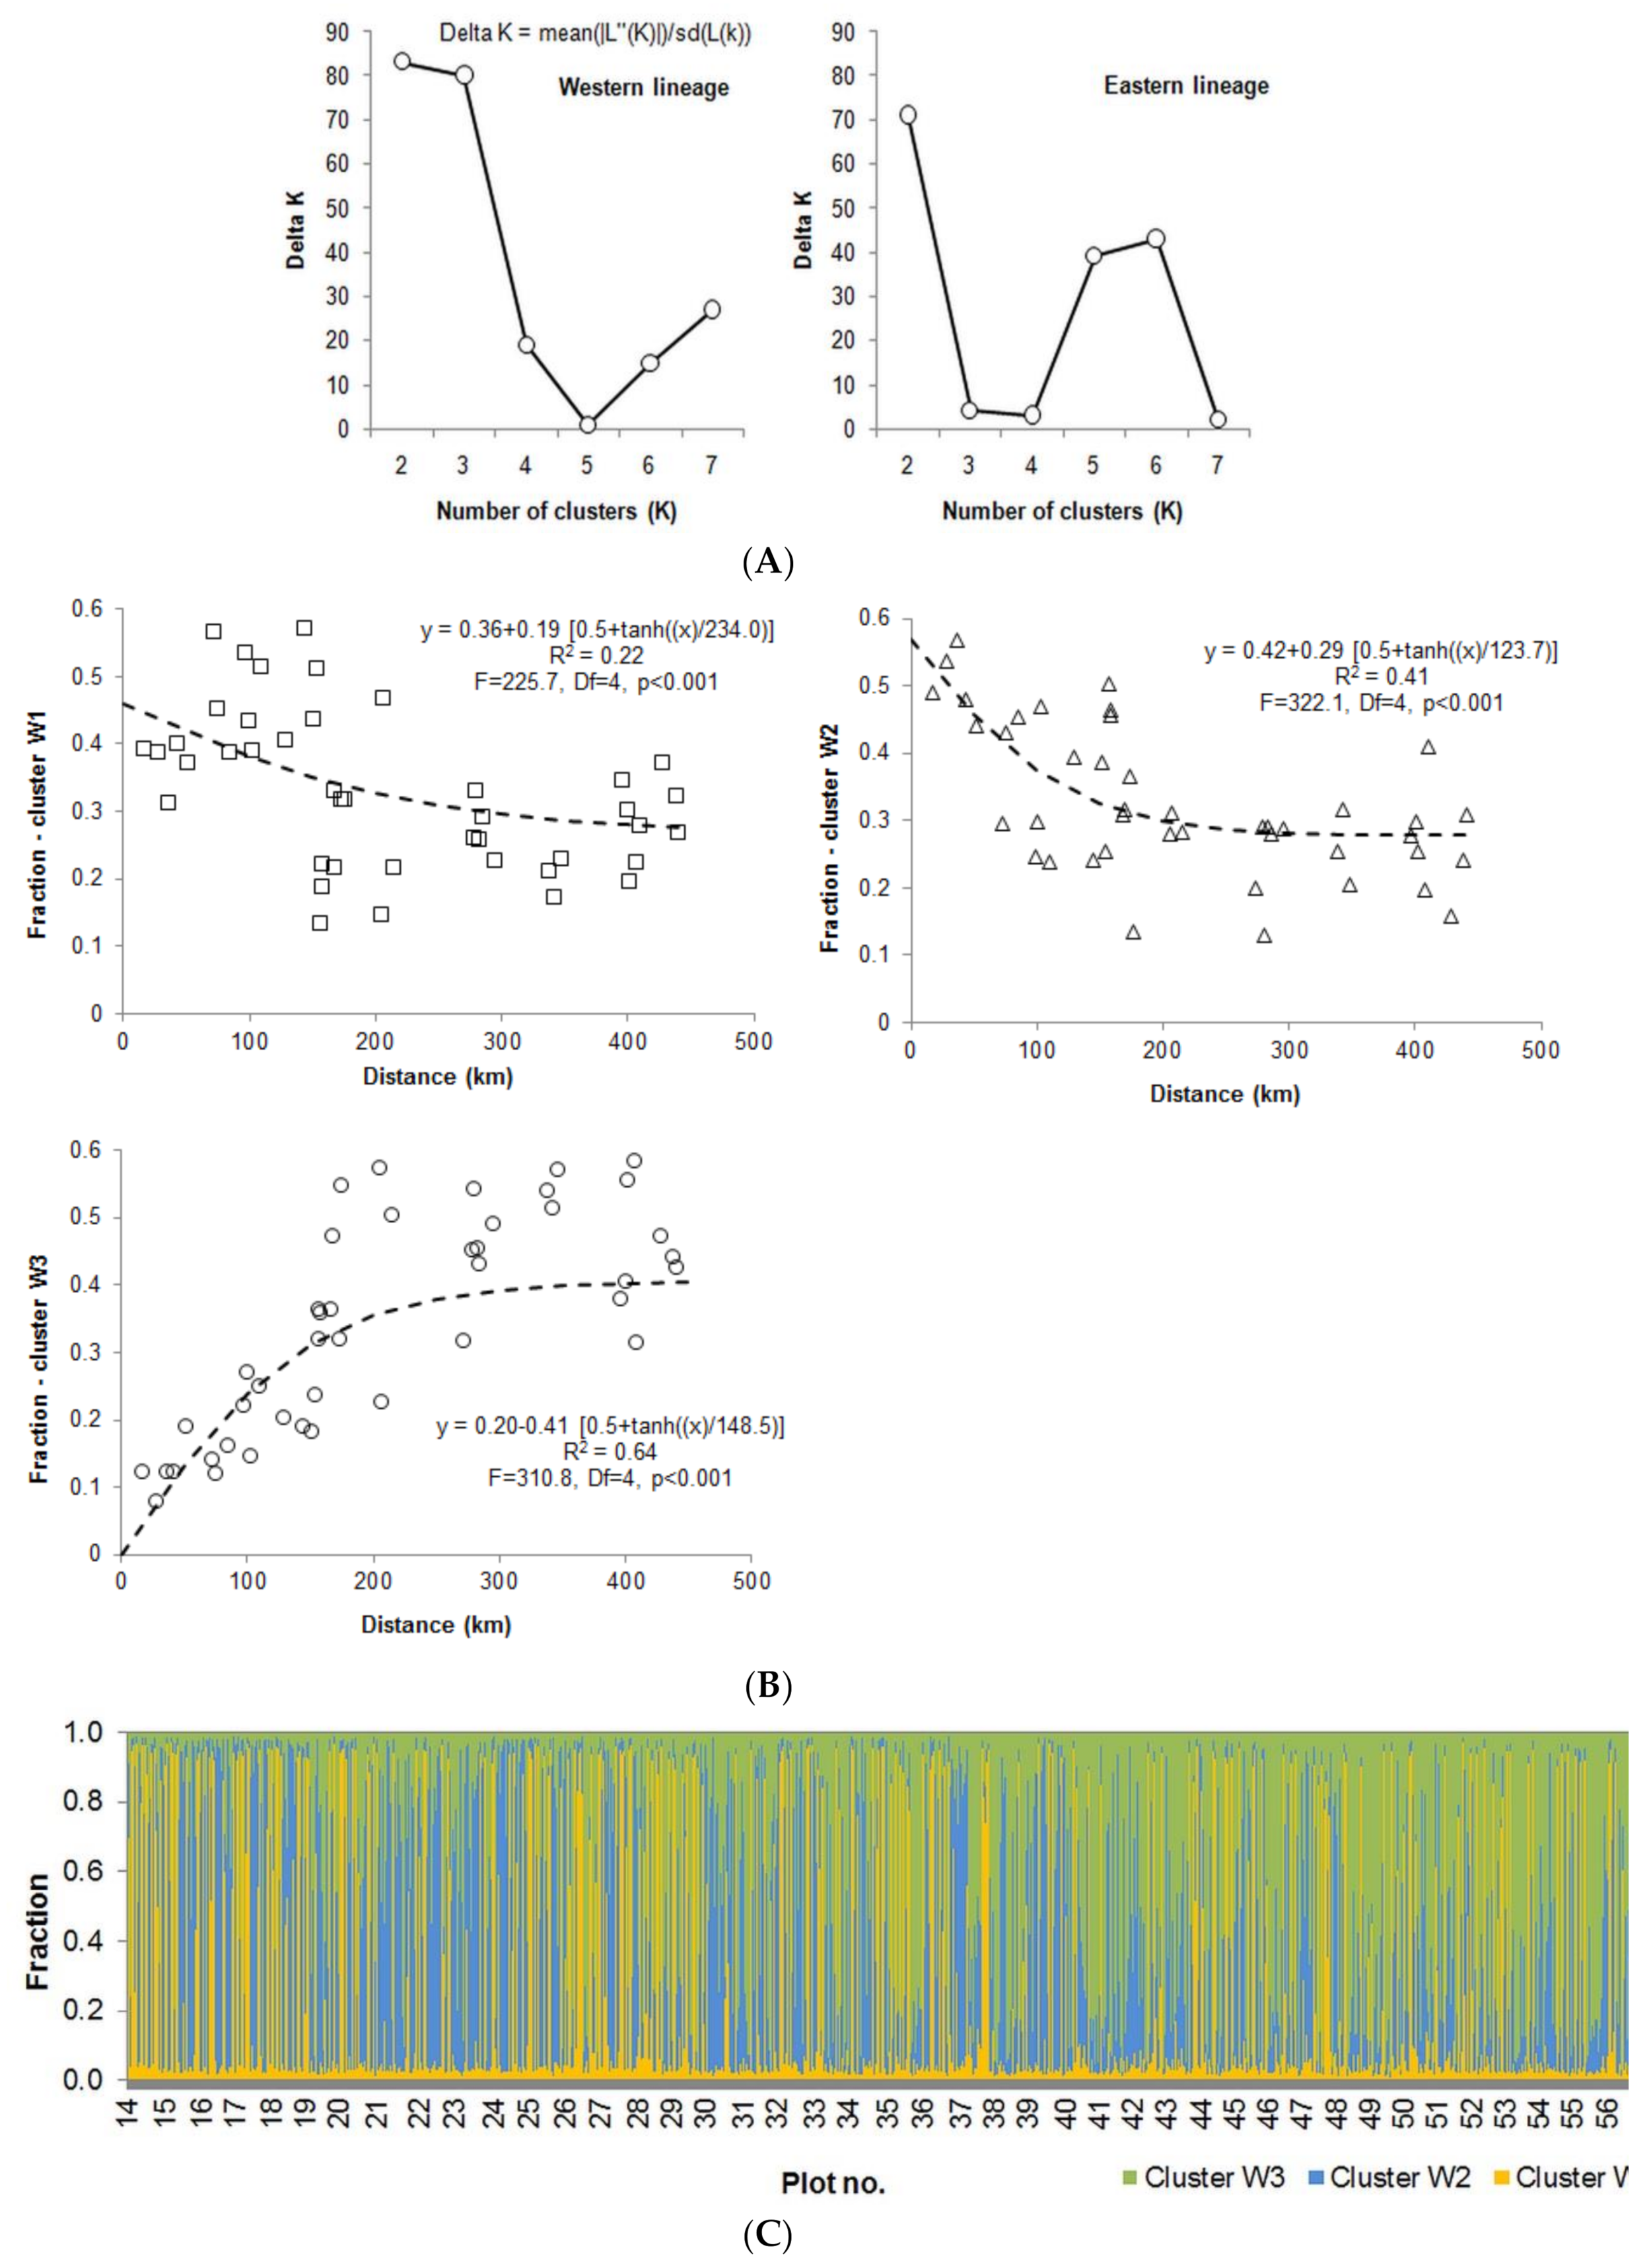
3.1. Genetic Analyses

The analysis confirmed the presence of two alleles of the mitochondrial nad5-4 marker (Figure 1, Table S1). In particular, in the western part of the study region, only mitochondrial haplotype 230 bp occurred, whereas in the eastern part only haplotype 150 bp occurred. In five nuclear microsatellite loci, a total of 122 alleles were found. The most polymorphic were the loci SF78 with 61 alleles and SFb4 with 29 alleles, whereas locus SF333 was the least polymorphic with only six alleles (Table S2). The overall number of different alleles after rarefaction did not differ between the eastern and western lineages (90.0 vs. 92.5). In the individual subpopulations, the number of alleles (Na) ranged between 7.2 and 12.0 per locus (Table S3).
Mean values of Na and the number of effective alleles (Ne) were significantly higher in the eastern lineage than in the western lineage (10.1 vs. 9.1 and 6.0 vs. 4.6, Figure 2). Ne values tended to decrease from east to west along the Carpathian arc (r = −0.50, p < 0.001). Nevertheless, when the subpopulations from the eastern lineage were excluded and only those from the western lineage were taken into account, the trend was insignificant. The expected heterozygosity (He) attained significantly higher values in the eastern lineage than in the western lineage (0.800 vs. 0.750, Figure 2) and decreased with distance in the western direction (r = −0.52, p < 0.001). This trend also remained valid when only the subpopulations from the western lineage were taken into account (r = −0.21, p < 0.001). The observed heterozygosity (Ho) averaged 0.575, and the proportion of homo- and heterozygotes deviated significantly from Hardy–Weinberg equilibrium (significance level <0.05). In particular, the excess of homozygotes was visible in loci SF239 (FIS = 0.599 and 0.488 in the eastern and western lineages, respectively) and SFb5 (FIS = 0.650 and 0.369, Table S3).
The AMOVA analysis and standard permutation tests for Slatkin’s R T statistic revealed significant levels of genetic differentiation: 90.1% of the total variation was attributable to the within-population level, 8.2% to the between-population level and 1.7% to the between-region level (Table 1). If genetic differentiation was expressed by F statistic, the effect of maternal lineages was not significant and the between- and within-population levels accounted for 2.8 and 97.2 of the total variation, respectively.
The Bayesian analysis of genetic variation (Figure 3) and UPGMA classification based on Nei genetic distances (Figure 4) indicated the existence of two distinct genetic clusters in the study region. The Mantel test showed that Nei genetic distances are significantly correlated with geographical distances (r = 0.49, p < 0.001). The fractions of the gene pools of each cluster decreased/increased from east to west. In the easternmost locations, the proportion of gene pools of the regionally dominant cluster ranged between 64 and 85%, and in the westernmost locations, it decreased to a level between 16 and 47%. The trend of this change was non-linear and tended to weaken in the western direction. The cline width estimated in the sigmoid model of gene pool frequencies against geographical distance was 199 km, and the group frequencies within the western and eastern lineage were 0.68 and 0.41, respectively. The parameters estimated based on individual membership coefficients to the two groups were similar: 201 km, 0.69 and 0.41.
The Bayesian analysis of genetic variation conducted separately for the eastern mitochondrial lineage indicated the existence of two dominant genetic clusters with the fractions of the gene pools of each cluster changing from west to east (Figure 5). However, for the western lineage, very similar Delta K values were obtained for two and three clusters. In the case of two clusters, changes in the fractions of the gene pools were similar to those from the eastern lineage. In the case of three clusters, the gene pools of two clusters showed increasing trends and those of one cluster a decreasing trend towards the contact zone.

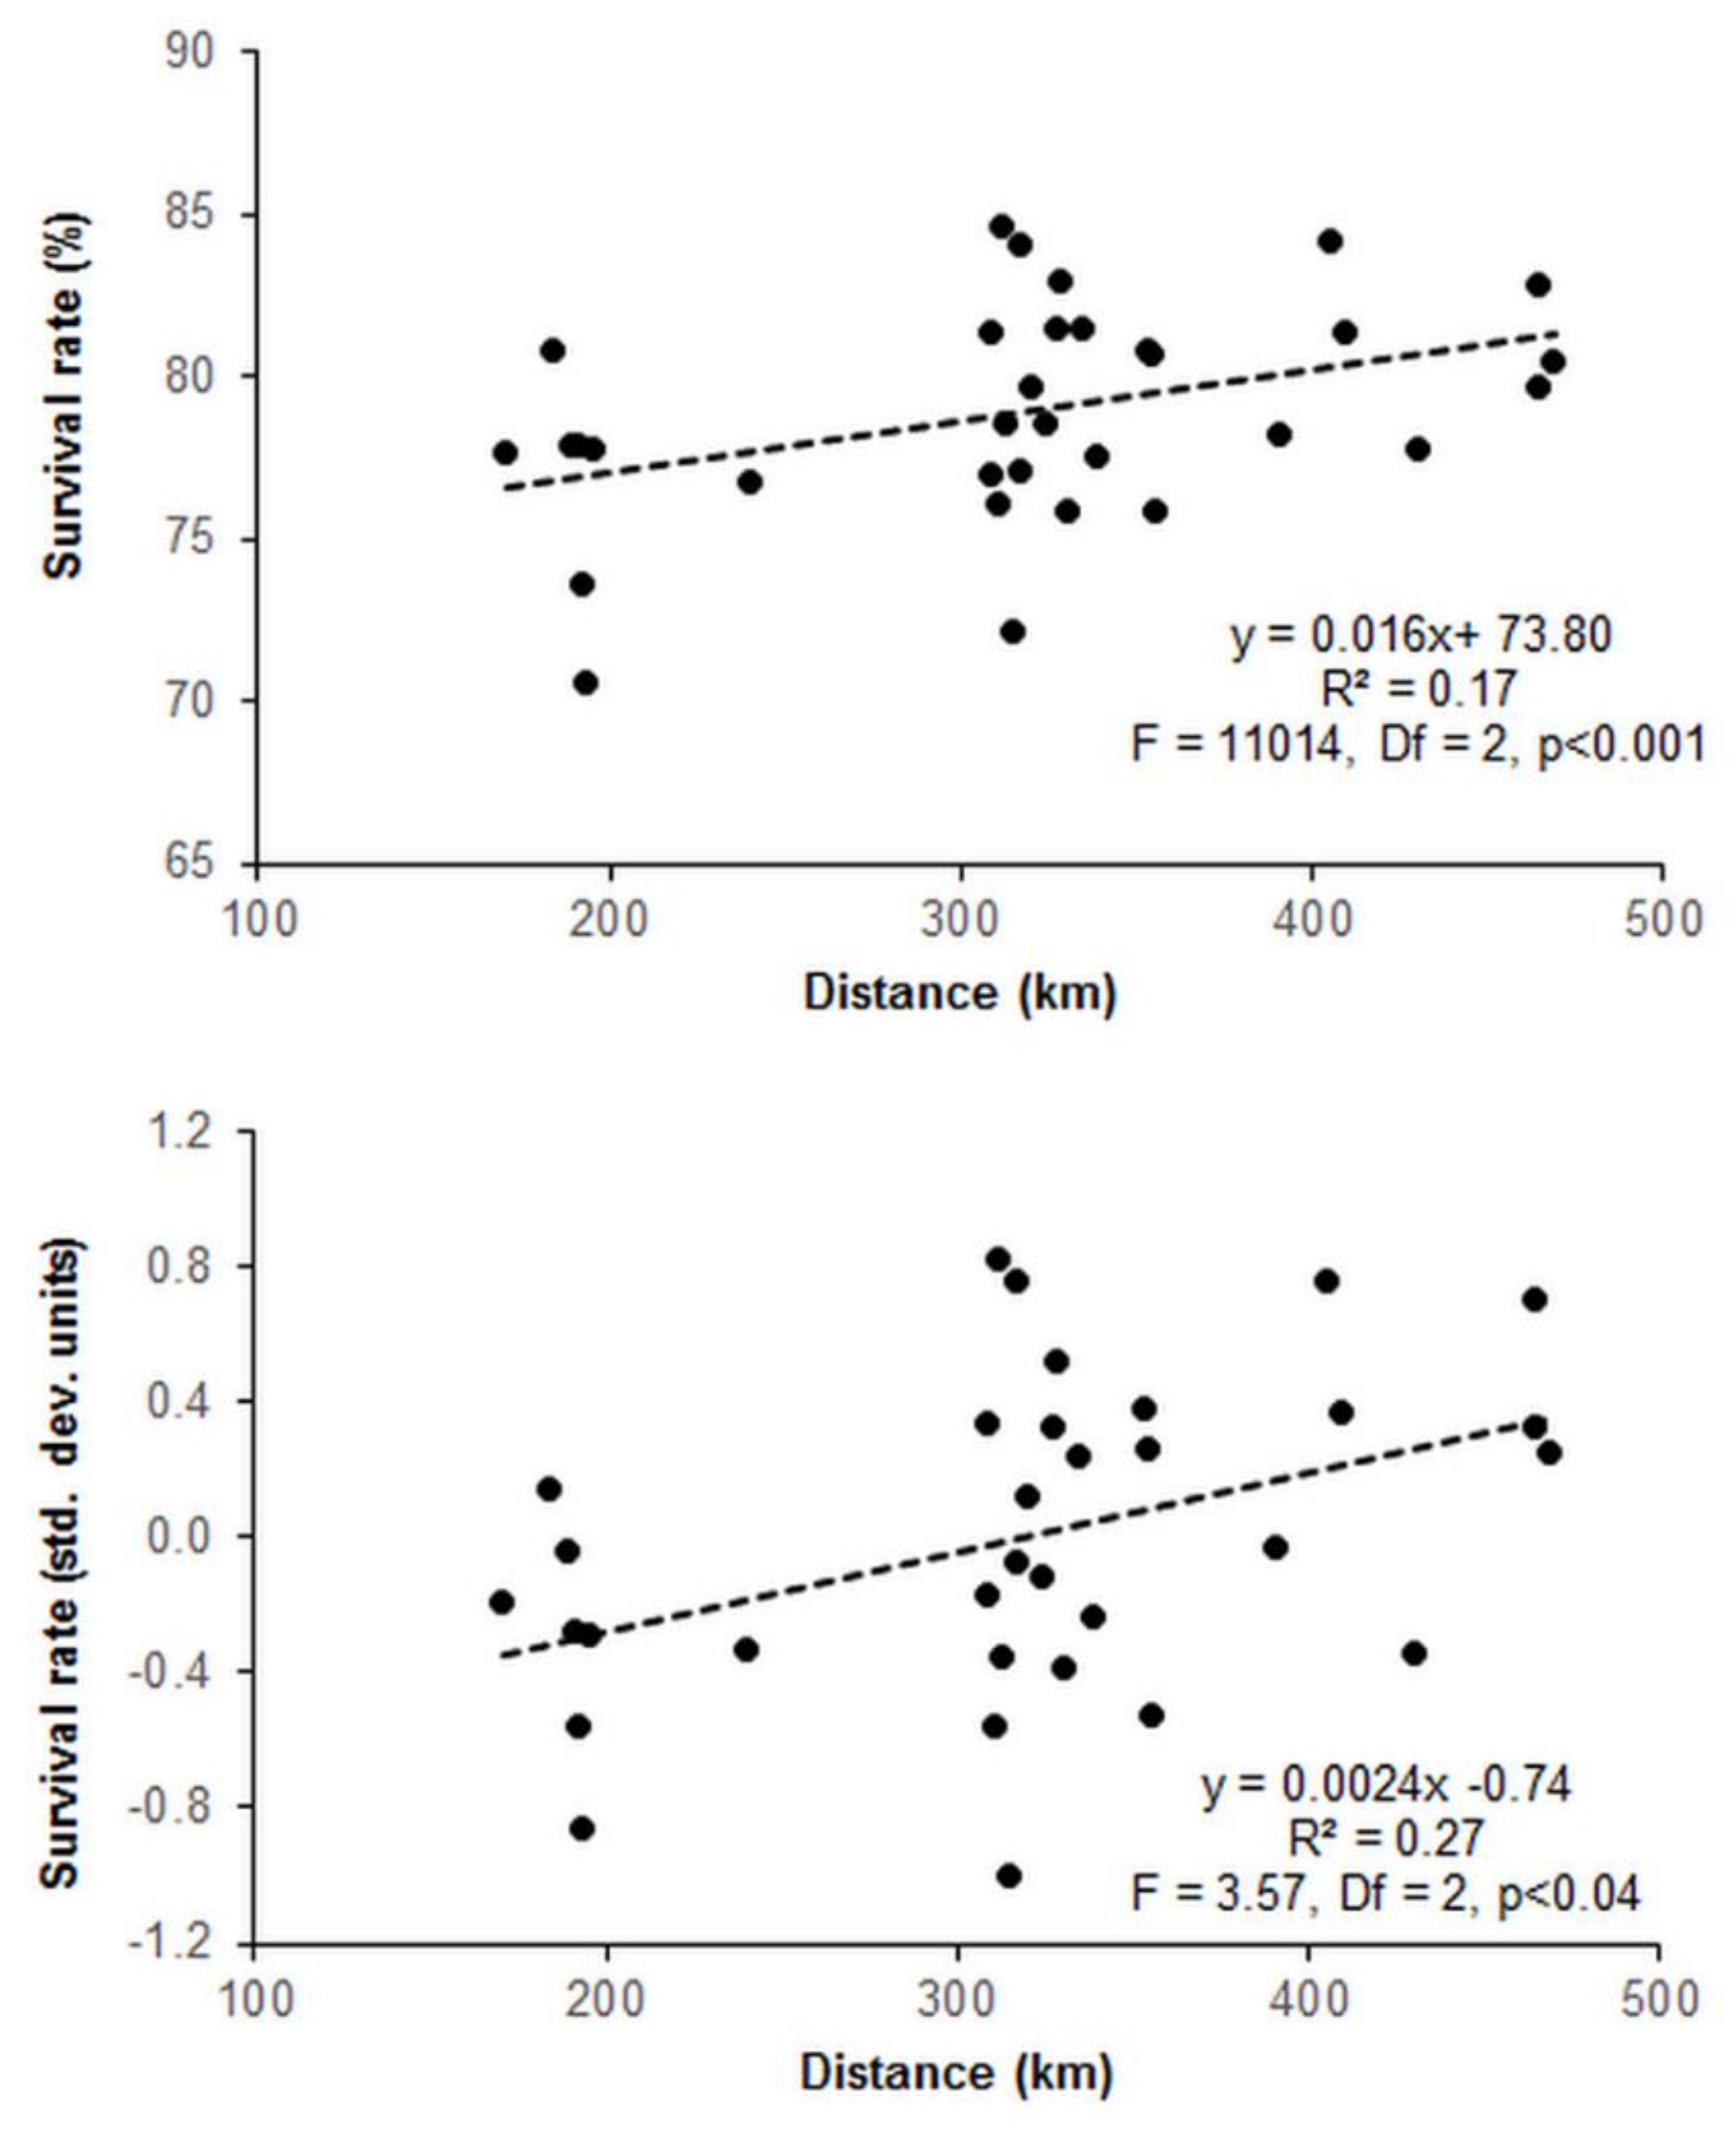
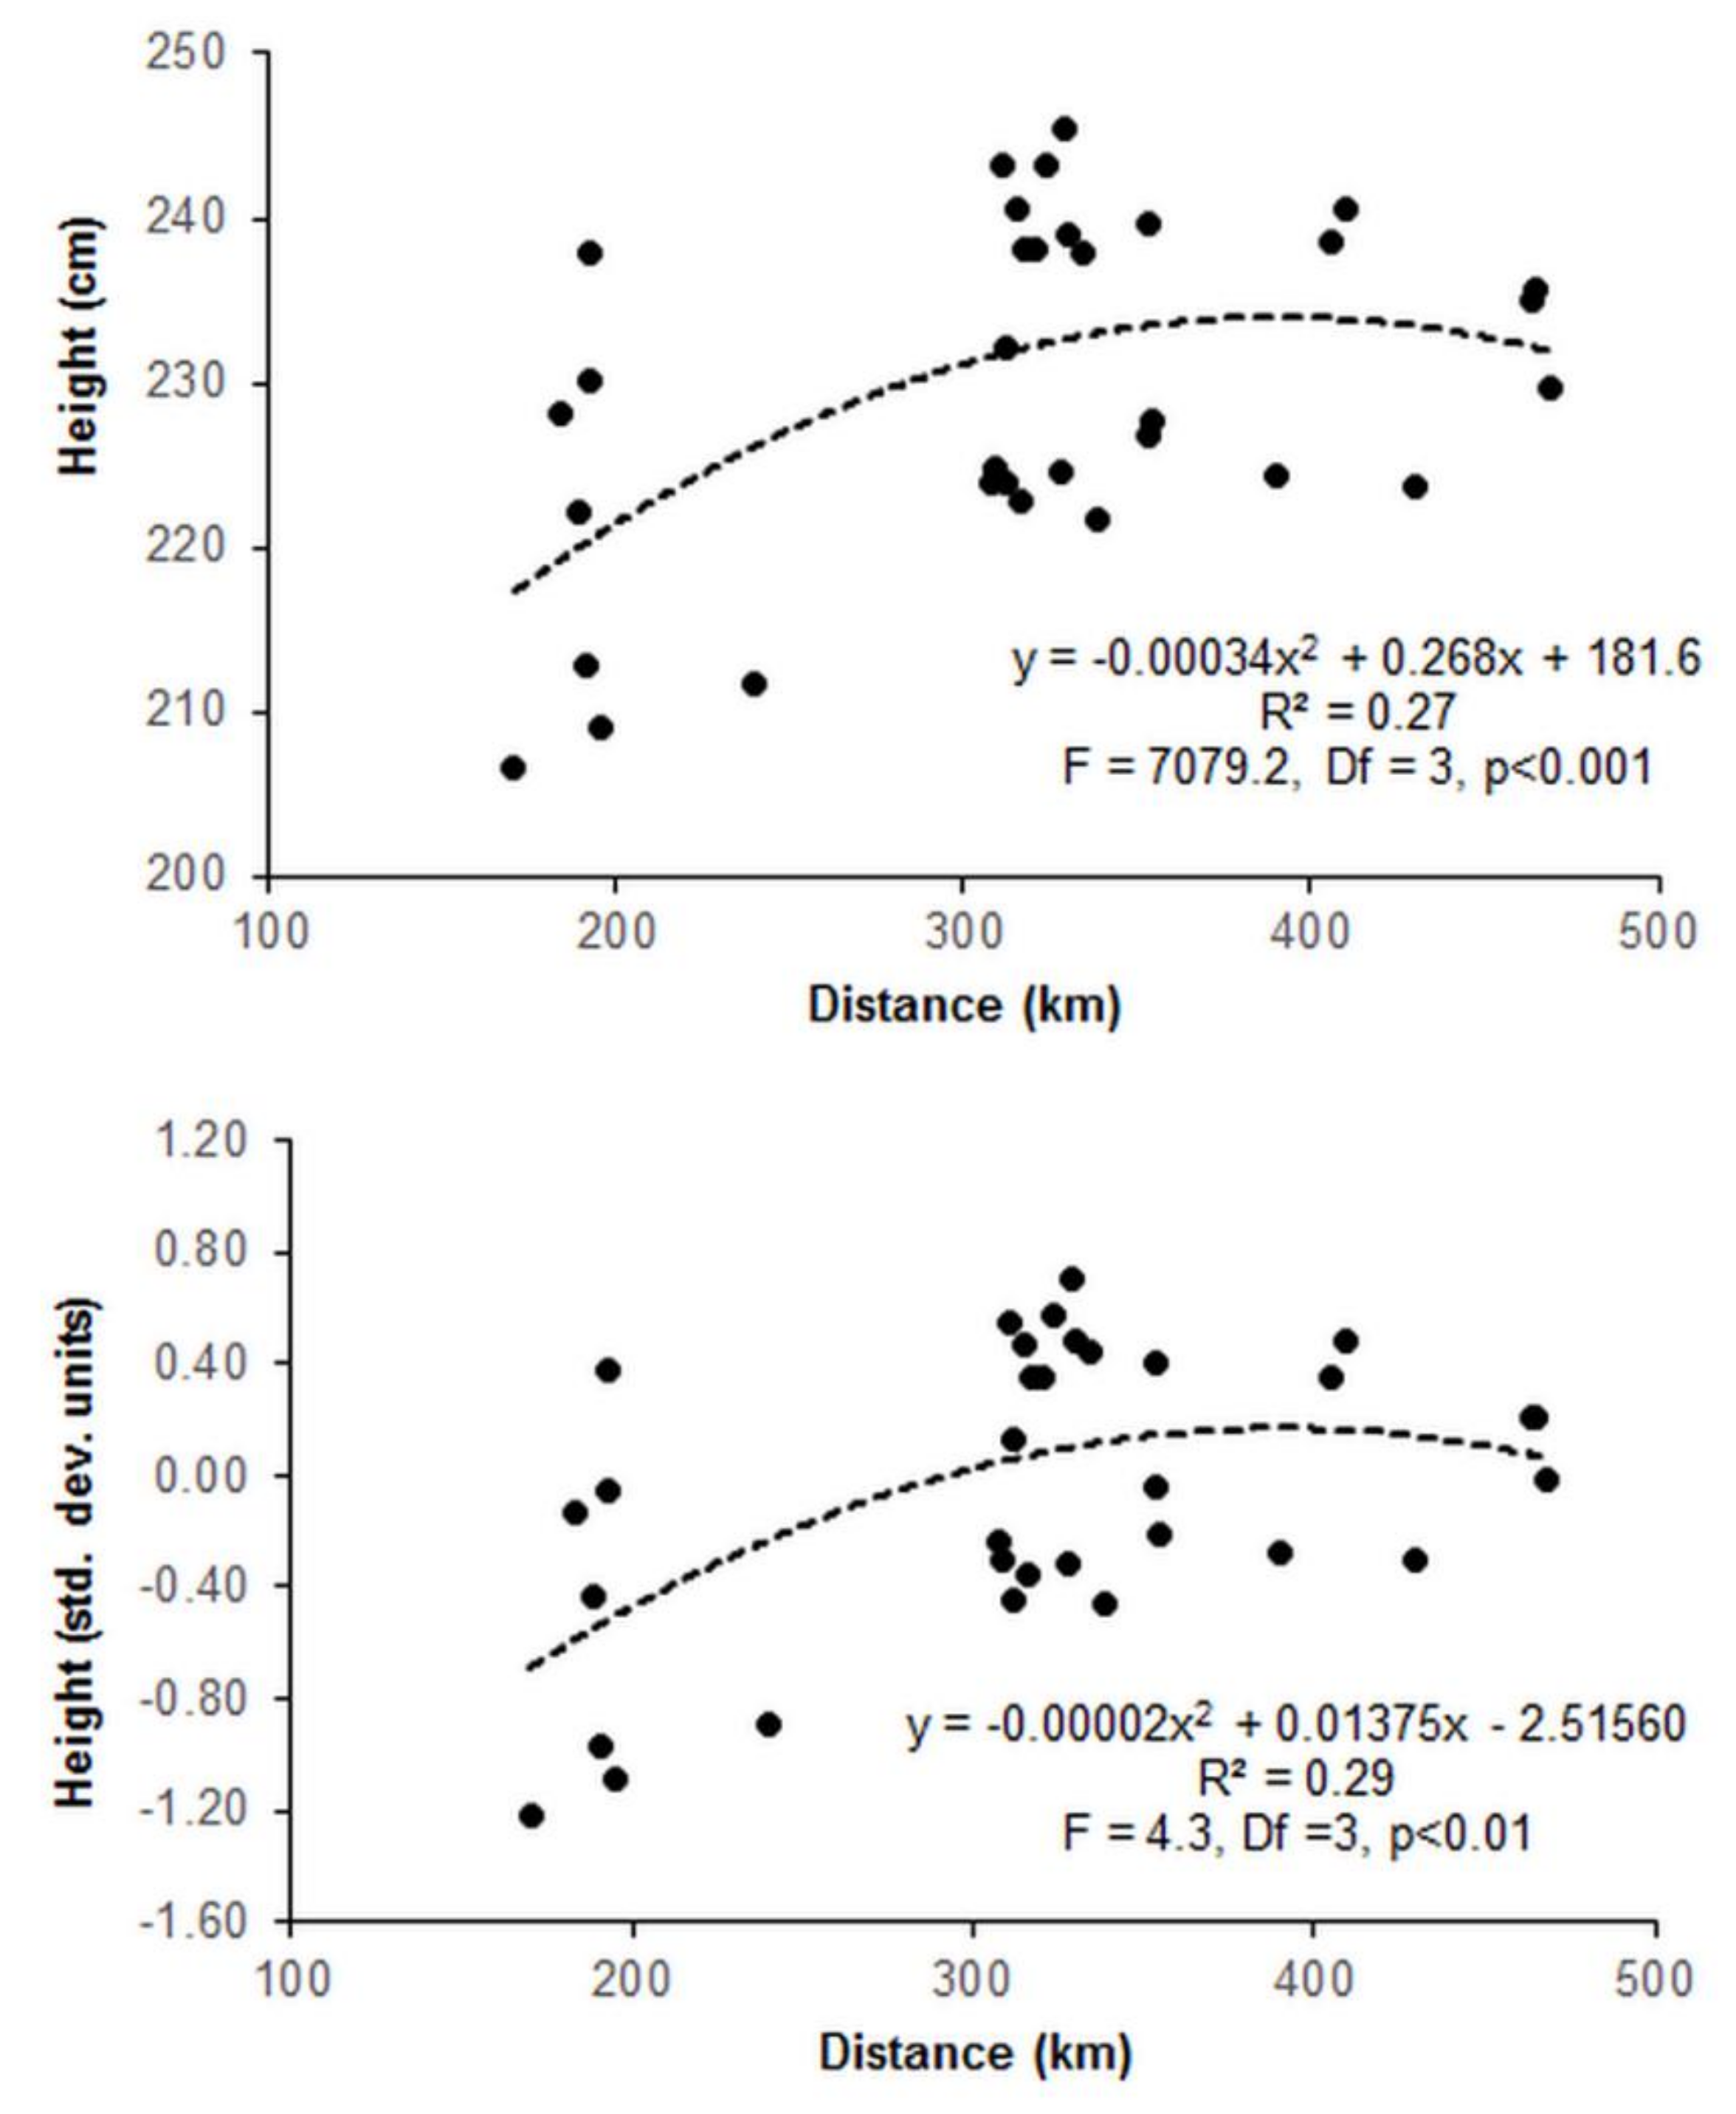
3.2. Provenance Trial

After 15 years, the survival rate of the provenances ranged between 71 and 85% (average for eight test sites, Figure 6). This variation might not be attributable to competitive exclusion, since no significant relationship between mean tree height and survival rate was found. However, the survival rate showed a significant gradient concordant with the distance from the meeting zone of the refugial lineages and indicating the lower survival of eastern compared to western provenances. A deepened analysis showed that this trend was not consistent over all the test sites and was statistically significant on five of them (Bircza: r = 0.21, p = 0.05; Nawojowa: r = 0.24, p = 0.03; Krościenko: r = 0.33, p < 0.001; Wisła, r = 0.46, p < 0.001, Figure S1). The occurrence of this trend was not related to the overall survival rate in the test sites.
At an age of 15 years, the mean heights reached by A. alba trees from different provenances ranged between 207 and 245 cm (average for eight test sites, Figure 7). The provenances representing subpopulations located closer to the meeting zone of the refugial lineages reached lower heights than the subpopulations from the central and western part of the study region. This effect was observed in six of eight test sites (Figure S2): Bircza (r = 0.27, p = 0.07), Baligród (r = 0.19, p = 0.07), Rymanów (r = 0.62, p < 0.001), Nawojowa (r = 0.31, p = 0.03), Krościenko (r = 0.36, p = 0.09) and Rabka (r = 0.19, p = 0.09). For the entire geographic gradient encompassed by the studied provenances, between 170 and 470 km from the meeting zone, the absolute difference between the mean values was estimated at 19 cm, 8% of the overall mean height (230 cm). The differences between the provenances increased with increasing mean height in the test sites, that is, with improving growth conditions (Figure 8). The effect of the altitude of the subpopulations on the height growth of their progeny on the test sites was not statistically significant.

4. Discussion

4.1. Pattern of Genetic Variation

Investigations on maternally inherited mitochondrial DNA in A. alba have confirmed the presence of two highly conservative haplotypes at the mitochondrial nad5-4 locus, which were assigned to two glacial refugial areas [26,28,29,30,35] and only one western haplotype in Poland [60,61]. The results also confirm considerable within-population variation in A. alba (97%), which is typical for wind-pollinated species over a continuous distribution range [62,63]. Admittedly, earlier studies using isoenzyme markers in Italy [64], Poland [65], the Balkans [66] and Slovakia [67] suggested a lower within-population proportion of about 80%. However, the results obtained for nuclear markers [35,41,68,69,70,71], because of their high polymorphism, selection neutrality and co-dominant character, are more appropriate for characterizing genetic diversity.
The distribution of genetic variation is strictly related to gene flow through pollen and seeds. [72,73]. Our study and the earlier report by Gömöry et al. [30] indicate that in the Carpathians the genetic pools of A. alba originating from the western and eastern refugial areas interact with each other and exhibit a cline pattern of genetic diversity in this region. Gömöry et al. [30] found that the fractions of the gene pools attributable to the maternal lineages form a clear geographic gradient and estimated the cline width at 93 km for individual samples and 120 km for gene pool frequencies at the subpopulation level. Our results based on a wider geographic trend indicate significantly higher values. Although the sigmoid model estimates were 199 and 201 km, respectively, the cluster proportions changed in a continuous manner, and the pollen-mediated influence of the eastern lineage was detectable in the western subpopulations at a distance of at least of 300 km. A recent study by Teodosiu et al. [35] suggests a similar gradient in the Romanian Carpathians; the highest level of genetic diversity, in both allelic richness and expected heterozygosity, was found in the northern and outer Eastern Carpathians, close to the contact zone of the two maternal lineages. In contrast to our study, in the research of Ballian et al. [74] in Croatia and Bosnia, A. alba subpopulations located east of the contact zone did not manifest any distinct cline variability in genetic parameters. The authors attributed this to high ecological diversity, fragmentation and the occurrence of genetic drift. In addition, free gene flow in large geographical areas may have a homogenizing effect on an allele’s frequency spectra [72,73].
The results of the present study corroborate the hypothesis that the Polish and Slovakian Carpathians were colonized by a population spreading from the western refugial area and that genetic pools related to both refugial lineages interact in this region. However, the analysis also indicated the presence of a third Bayesian group within the western maternal lineage. Hypothetically, its origin would be linked with an additional gene pool from a local cryptic refugium. Indeed, macroscopic charcoal remains suggest that populations of A. alba may have also existed locally in the Czech Republic and southern Poland between ca. 42,000 and 20,000 years before present (BP) [75]. In addition, both macrofossil remains and pollen data suggest that there may have been additional refugial areas for Abies in the Hungarian plain [75,76]. Nonetheless, as these remains were dated to before the last glacial maximum, and to date all others found in this geographical range have been dated between this period and the early Holocene, it is generally accepted that A. alba became extinct in these locations [77]. Another hypothesis is that the presence of the third group in the Western Carpathians is an effect of colonization by two introgressive populations representing the same western haplotype but migrating from two refugial areas: one located in the northern Apennines and the second in the Dinaric and Slovenian Alps [26,78]. The putative refugial lineage from the Dinaric and Slovenian Alps may have been most significant for the spread north- and eastwards until it met the Balkan lineages in the northeastern corner of the Carpathians. This hypothesis corresponds well with the finding of a considerable genetic distance between the populations from the Western Carpathians and Sudety Mountains highlighted by Lewandowski et al. [62] and Mejnartowicz [65]. Nonetheless, this matter warrants further study requiring greater genetic and paleobotanical data from the adjacent regions.

4.2. Survival and Growth Pattern in the Provenance Trial

The cline in genetic variation was evidenced by the pattern of survival and height growth found in the provenance trial. The provenances representing subpopulations located close to the meeting zone of the refugial lineages were characterized by a lower survival rate and reached lower heights than the subpopulations from the central and western part of the study region. Although the absolute differences in mean height between the provenances were not large and should be treated with caution due to the young age of the trees, they accounted for as much as 8% of the average tree height. It should also be noted that the provenance trial comprises only a part of the distance gradient (between 170 and 470 km), and data on the provenances located closest to the meeting zone, probably displaying the strongest introgression effect, are unfortunately missing. For comparison, in a British provenance trial including 33 provenances covering the natural range of the species in Europe, the difference between the shortest and tallest provenance at an age of 46 years was 24% [25], and in a Danish experiment for provenances from Calabria (Italy), Germany and Romania, it was between 10 and 34% at an age of 15 years [20]. The trend of declining tree growth for the eastern provenances was revealed on the majority of test sites, which may suggest the stability of this effect across a wider gradient of environmental conditions. Indeed, the mean survival rate and tree heights on the test sites displayed substantial variation (in terms of the mean values for the test sites, between 135 and 330 cm and between 56 and 96%, respectively), indicating substantial variation in site conditions.
Because the provenance trial allowed for the control of environmental variation, the observed phenotypic variation seems attributable to two factors: differences in genetic backgrounds formed by environmental selection during the Holocene remigration and pollen-mediated gene flow from the eastern lineage. The effect of past management on genetic variation in the geographic gradient is difficult to assess because management in the Polish part of the Carpathians was historically dominated by a fine-scale pattern of land use with diversified silvicultural systems ranging from rather rare clear-cuttings to the shelterwood system with short or long shelter periods and plenter-like management forms [39]. Paleobotanical evidence from pollen profiles indicates that in the Polish Carpathians, fir pollen steadily increased between ~5000 and ~2000 years BP [79], probably due to an increasingly moist climate [17,80]. This prehistoric peak was followed by a continuous decline that has lasted until the present day. Nonetheless, in the entire period, A. alba pollen had a lower percentage of the total terrestrial assemblage in the easternmost part of the massif than in the central and western part of the massif. One of the possible causes is that the western part of the study area experiences oceanic effects, resulting in higher precipitation totals [44,45]. Moreover, the eastern region is strongly influenced by warm and dry air masses flowing from the Great Hungarian Plain [45], and climate analyses for the period 1851–2010 show that the Western Carpathian region has been warming even faster than the global or hemispheric average [44]. Thus, the climatic gradient might affect gene pools and favor less drought-sensitive genotypes in the eastern region. Despite worsening climatic conditions in the eastern gradient, the present analysis and data by Gömöry et al. [30] and Teodosiu et al. [35] indicate that genetic variation increases toward the meeting zone of the refugial lineages in the Western Carpathians from west to east and in the Romanian Carpathians in the opposite direction. This strongly corroborates the hypothesis that the observed genetic and phenotypic variation is attributable to pollen-mediated influence.
Heterogeneous environments such as mountainous landscapes create spatially varying selection pressure [81]. Csilléry et al. [82] documented that subpopulations from regions characterized by pronounced summer droughts had higher water use efficiency and represent the “start early and grow fast” growth timing strategy. Populations originating from warmer localities are likely to be more resistant to heat and better adapted to high temperatures than those originating from cooler sites [83,84]. Therefore, the better adaptation of the eastern provenances to a warmer and drier climate probably should be advantageous given that future projections unequivocally forecast increasing aridity [44]. However, under the present climate with a moderate though consistent rise in summer temperatures and constant precipitation totals, western provenances tend to grow better than eastern provenances over the entire distribution range covered by the test sites. Although variation between provenances was generally low, this suggests that western provenances are better adapted to the present climatic conditions of the Western Carpathians. A similar trend was also documented in another experiment by Skrzyszewska [85] that compared 45 provenances from the Western Carpathians. Nevertheless, in this study, the highest ranks on the testing plots located in the mountain region were received by subpopulations from the central part of the Western Carpathians, which differed from the subpopulations growing in the eastern and western part of the massif. Büntgen et al. [18] documented narrower standardized tree ring-widths for firs originating from the eastern compared to western provenances within the western refugial lineage. Bosela et al. [34] reported significant differences in interannual and long-term growth trends and climate responses for two post-glacial populations from effective refugia originating from the Apennine and Balkan peninsulas. Moreover, the tree-ring widths of the western lineage strongly increased after 2000, while the growth of firs from the Balkan lineage was more consistent and stable in this period. The authors linked these effects to differences in genetic backgrounds, forest management and low precipitation in the eastern regions, which was not sufficient to allow enhanced growth of the Balkan lineage under a warmer climate [34].

5. Conclusions

This study comprised an extensive population of A. alba in the northernmost montane region of continuous and abundant occurrence of this species close to the meeting zone of two refugial lineages from northern Italy and north-western Greece. In an extension of a former study by Gömöry et al. [30], the analyses revealed a cline genetic variation of the studied population in the western direction from the meeting zone with the pollen-mediated influence of the eastern lineage detectable at a distance of at least 300 km and 1.7% of the total genetic variation attributable to the between-lineage level. The number of alleles per locus, the number of effective alleles and the expected heterozygosity increased from west to east. However, overall allelic richness did not differ significantly between the eastern and western lineages. The clustering procedure based on Bayesian inference allowed us to distinguish the presence of a third cluster in the central part of the studied region, whose origin might be linked with a local cryptic refugium or colonization by two introgressive populations representing the same western haplotype but migrating from two refugial areas.
Although the results from the provenance trial reported here refer to young trees and should be interpreted with caution, they indicate that provenances with origin sites located close to the meeting zone of the refugial lineages are characterized by a lower survival rate and reached lower heights than subpopulations from the central and western part of the Polish Carpathians, which suggests their better adaptation to present climatic conditions. Pollen-mediated gene flow between the lineages appears to have been sufficient to cause a significant change in phenotypic traits related to tree growth. Nonetheless, given that future projections unequivocally forecast increasing aridity of the regional climate, a safe guideline is to avoid random genetic erosion and increase genetic mixing. Therefore, we recommend a wide application of natural regeneration within diversified silvicultural systems (single-tree selection, group selection, irregular shelterwood) as a strategy for maintaining genetic diversity and evolutionary potential in large A. alba subpopulations. Reproductive isolation by assortative mating or spatial fragmentation at the landscape level should be avoided. In subpopulations of small effective sizes, some reintroductions may be necessary and an understanding of the genetic basis of adaptive variation will need to be accomplished with genetically and ecologically similar populations. The use of native genotypes in restoration is important as local ecotypes are adapted to site conditions. Nonetheless, local genotypes could be supplemented with non-local genotypes as bet-hedging against unforeseen environmental change. Important reservoirs of genetic diversity might provide subpopulations growing at lower elevations or sites of a higher level of aridity of the regional climate.

Supplementary Materials

The following are available online at https://0-www-mdpi-com.brum.beds.ac.uk/1999-4907/11/8/849/s1, Table S1: Location of the study subpopulations, Table S2: Parameters of genetic variation in the eastern (E) and western (W) maternal lineages, Table S3: Characteristics of the five SSR loci for the eastern (E) and western (W) maternal lineages, Figure S1: Relationships between the survival rate of the tested provenances after 15 years and the geographic distance between their origin sites and the meeting zone of the refugial lineages. The test sites are ordered concordant with their geographic location from east to west, Figure S2: Relationships between the mean heights reached at age of 15 years by the tested provenances and the geographic distance between their origin sites and the meeting zone of the refugial lineages. The test sites are ordered concordant with their geographic location from east to west.

Author Contributions

Conceptualization, M.K., M.Z., J.P.; methodology, M.K., M.Z., J.P.; genetic analyses, M.Z., M.K.; provenance trial, M.K.; writing, M.Z., J.P., M.K., funding acquisition, J.P. All authors have read and agreed to the published version of the manuscript.

Funding

This work was founded by the National Science Centre, Poland, grant number 2012/07/B/NZ9/00953.

Acknowledgments

The authors wish to thank D. Gömöry for making accessible the genetic data from Slovakia, Ukraine and Romania, Z. Kołodziej for his help in collecting the field data, and two anonymous reviewers for their pertinent comment to the original manuscript.

Conflicts of Interest

None declared.

References

  1. Hewitt, G. The genetic legacy of the quaternary ice ages. Nature 2000, 405, 907–913. [Google Scholar] [CrossRef] [PubMed]
  2. Hamrick, J.L. Response of forest trees to global environmental changes. Ecol. Manag. 2004, 197, 323–335. [Google Scholar] [CrossRef]
  3. Kremer, A.; Ronce, O.; Robledo-Arnuncio, J.J.; Guillaume, F.; Bohrer, G.; Nathan, R.; Bridle, J.R.; Gomulkiewicz, R.; Klein, E.K.; Ritland, K.; et al. Long-distance gene flow and adaptation of forest trees to rapid climate change. Ecol. Lett. 2012, 15, 378–392. [Google Scholar] [CrossRef] [PubMed] [Green Version]
  4. Alfaro, R.I.; Fady, B.; Vendramin, G.G.; Dawson, I.K.; Fleming, R.A.; Sáenz-Romero, C.; Lindig-Cisneros, R.A.; Murdock, T.; Vinceti, B.; Navarro, C.M.; et al. The role of forest genetic resources in responding to biotic and abiotic factors in the context of anthropogenic climate change. Ecol. Manag. 2014, 333, 76–87. [Google Scholar] [CrossRef]
  5. Lefèvre, F.; Boivin, T.; Bontemps, A.; Courbet, F.; Davi, H.; Durand-Gillmann, M.; Fady, B.; Gauzere, J.; Gidoin, C.; Karam, M.J.; et al. Considering evolutionary processes in adaptive forestry. Ann. Sci. 2014, 71, 723–739. [Google Scholar] [CrossRef] [Green Version]
  6. Widmer, A.; Lexer, C. Glacial refugia: Sanctuaries for allelic richness, but not for gene diversity. Trends Ecol. Evol. 2001, 16, 267–269. [Google Scholar] [CrossRef]
  7. Petit, R.J.; Aguinagalde, I.; De Beaulieu, J.L.; Bittkau, C.; Brewer, S.; Cheddadi, R.; Ennos, R.; Fineschi, S.; Grivet, D.; Lascoux, M.; et al. Glacial refugia: Hotspots but not melting pots of genetic diversity. Science 2003, 300, 1563–1565. [Google Scholar] [CrossRef] [Green Version]
  8. Rull, V. On microrefugia and cryptic refugia. J. Biogeogr. 2010, 37, 1623–1625. [Google Scholar] [CrossRef]
  9. Stewart, J.R.; Lister, A.M. Cryptic northern refugia and the origins of the modern biota. Trends Ecol. Evol. 2001, 16, 608–613. [Google Scholar] [CrossRef]
  10. Alleaume-Benharira, M.; Pen, I.R.; Ronce, O. Geographical patterns of adaptation within a species’ range: Interactions between drift and gene flow. J. Evol. Biol. 2006, 19, 203–215. [Google Scholar] [CrossRef]
  11. Bell, M.A.; Travis, M.P. Hybridization, transgressive segregation, genetic covariation, and adaptive radiation. Trends Ecol. Evol. 2005, 20, 358–361. [Google Scholar] [CrossRef] [PubMed]
  12. Wachowiak, W.; Żukowska, W.B.; Wójkiewicz, B.; Cavers, S.; Litkowiec, M. Hybridization in contact zone between temperate European pine species. Tree Genet. Genom. 2016, 12, 1–12. [Google Scholar] [CrossRef] [Green Version]
  13. Mitsopulos, D.; Panetsos, C. Origin of variation in fir forests of Greece. Silvae Genet. 1987, 36, 1–15. [Google Scholar]
  14. Krajmerová, D.; Paule, L.; Zhelev, P.; Voleková, M.; Evtimov, I.; Gagov, V.; Gömöry, D. Natural hybridization in eastern-Mediterranean firs: The case of Abies borisii-regis. Plant Biosyst. 2016, 150, 1189–1199. [Google Scholar] [CrossRef]
  15. Dobrowolska, D.; Bončina, A.; Klumpp, R. Ecology and silviculture of silver fir (Abies alba Mill.): A review. J. For. Res. 2017, 22, 326–335. [Google Scholar] [CrossRef]
  16. Svenning, J.C.; Skov, F. Limited filling of the potential range in European tree species. Ecol. Lett. 2004, 7, 565–573. [Google Scholar] [CrossRef]
  17. Tinner, W.; Colombaroli, D.; Heiri, O.; Henne, P.D.; Steinacher, M.; Untenecker, J.; Vescovi, E.; Allen, J.R.M.; Carraro, G.; Conedera, M.; et al. The past ecology of Abies alba provides new perspectives on future responses of silver fir forests to global warming. Ecol. Monogr. 2013, 83, 419–439. [Google Scholar] [CrossRef] [Green Version]
  18. Büntgen, U.; Tegel, W.; Kaplan, J.O.; Schaub, M.; Hagedorn, F.; Bürgi, M.; Brázdil, R.; Helle, G.; Carrer, M.; Heussner, K.-U.; et al. Placing unprecedented recent fir growth in a European-wide and Holocene-long context. Front. Ecol. Env. 2014, 12, 100–106. [Google Scholar] [CrossRef]
  19. Ruosch, M.; Spahni, R.; Joos, F.; Henne, P.D.; van der Knaap, W.O.; Tinner, W. Past and future evolution of Abies alba forests in Europe-comparison of a dynamic vegetation model with palaeo data and observations. Glob. Chang. Biol. 2016, 22, 727–740. [Google Scholar] [CrossRef]
  20. Hansen, J.K.; Larsen, J.B. European silver fir (Abies alba Mill.) provenances from Calabria, southern Italy: 15-year results from Danish provenance field trials. Eur. J. Res. 2004, 123, 127–138. [Google Scholar] [CrossRef]
  21. Carrer, M.; Nola, P.; Motta, R.; Urbinati, C. Contrasting tree-ring growth to climate responses of Abies alba toward the southern limit of its distribution area. Oikos 2010, 119, 1515–1525. [Google Scholar] [CrossRef]
  22. Koprowski, M. Reaction of silver fir (Abies alba) growing outside its natural range to extreme weather events and a long-term increase in march temperature. Tree Ring Res. 2013, 69, 49–61. [Google Scholar] [CrossRef] [Green Version]
  23. Gazol, A.; Camarero, J.J.; Gutiérrez, E.; Popa, I.; Andreu-Hayles, L.; Motta, R.; Nola, P.; Ribas, M.; Sangüesa-Barreda, G.; Urbinati, C.; et al. Distinct effects of climate warming on populations of silver fir (Abies alba) across Europe. J. Biogeogr. 2015, 42, 1150–1162. [Google Scholar] [CrossRef] [Green Version]
  24. George, J.P.; Schueler, S.; Karanitsch-Ackerl, S.; Mayer, K.; Klumpp, R.T.; Grabner, M. Inter-and intra-specific variation in drought sensitivity in Abies spec. and its relation to wood density and growth traits. Agric. Meteorol. 2015, 214–215, 430–443. [Google Scholar] [CrossRef] [PubMed] [Green Version]
  25. Kerr, G.; Stokes, V.; Peace, A.; Jinks, R. Effects of provenance on the survival, growth and stem form of European silver fir (Abies alba Mill.) in Britain. Eur. J. Res. 2015, 134, 349–363. [Google Scholar] [CrossRef] [Green Version]
  26. Liepelt, S.; Cheddadi, R.; de Beaulieu, J.-L.L.; Fady, B.; Gömöry, D.; Hussendörfer, E.; Konnert, M.; Litt, T.; Longauer, R.; Terhürne-Berson, R.; et al. Postglacial range expansion and its genetic imprints in Abies alba (Mill.)—A synthesis from palaeobotanic and genetic data. Rev. Palaeobot. Palynol. 2009, 153, 139–149. [Google Scholar] [CrossRef]
  27. Heer, K.; Behringer, D.; Piermattei, A.; Bässler, C.; Brandl, R.; Fady, B.; Jehl, H.; Liepelt, S.; Lorch, S.; Piotti, A.; et al. Linking dendroecology and association genetics in natural populations: Stress responses archived in tree rings associate with SNP genotypes in silver fir (Abies alba Mill.). Mol. Ecol. 2018, 27, 1428–1438. [Google Scholar] [CrossRef]
  28. Liepelt, S.; Bialozyt, R.; Ziegenhagen, B. Wind-dispersed pollen mediates postglacial gene flow among refugia. Proc. Natl. Acad. Sci. USA 2002, 99, 14590–14594. [Google Scholar] [CrossRef] [Green Version]
  29. Gömöry, D.; Longauer, R.; Liepelt, S.; Ballian, D.; Brus, R.; Kraigher, H.; Parpan, V.I.; Parpan, T.V.; Paule, L.; Stupar, V.I.; et al. Variation patterns of mitochondrial DNA of Abies alba Mill. in suture zones of postglacial migration in Europe. Acta Soc. Bot. Pol. 2004, 73, 203–206. [Google Scholar] [CrossRef] [Green Version]
  30. Gömöry, D.; Paule, L.; Krajmerová, D.; Romšáková, I.; Longauer, R. Admixture of genetic lineages of different glacial origin: A case study of Abies alba Mill. in the Carpathians. Plant Syst. Evol. 2012, 298, 703–712. [Google Scholar] [CrossRef]
  31. Kaltenrieder, P.; Belis, C.A.; Hofstetter, S.; Ammann, B.; Ravazzi, C.; Tinner, W. Environmental and climatic conditions at a potential glacial refugial site of tree species near the Southern Alpine glaciers. New insights from multiproxy sedimentary studies at Lago della Costa (Euganean Hills, Northeastern Italy). Quat. Sci. Rev. 2009, 28, 2647–2662. [Google Scholar] [CrossRef]
  32. Magri, D.; Agrillo, E.; Di Rita, F.; Furlanetto, G.; Pini, R.; Ravazzi, C.; Spada, F. Holocene dynamics of tree taxa populations in Italy. Rev. Palaeobot. Palynol. 2015, 218, 267–284. [Google Scholar] [CrossRef]
  33. Cheddadi, R.; Birks, H.J.B.; Tarroso, P.; Liepelt, S.; Gömöry, D.; Dullinger, S.; Meier, E.S.; Hülber, K.; Maiorano, L.; Laborde, H. Revisiting tree-migration rates: Abies alba (Mill.), a case study. Veg. Hist. Archaeobot. 2014, 23, 113–122. [Google Scholar] [CrossRef]
  34. Bosela, M.; Popa, I.; Gömöry, D.; Longauer, R.; Tobin, B.; Kyncl, J.; Kyncl, T.; Nechita, C.; Petráš, R.; Sidor, C.G.; et al. Effects of post-glacial phylogeny and genetic diversity on the growth variability and climate sensitivity of European silver fir. J. Ecol. 2016, 104, 716–724. [Google Scholar] [CrossRef] [Green Version]
  35. Teodosiu, M.; Mihai, G.; Fussi, B.; Ciocîrlan, E. Genetic diversity and structure of silver fir (Abies alba Mill.) at the south-eastern limit of its distribution range. Ann. Res. 2019, 62, 139–156. [Google Scholar] [CrossRef]
  36. WISL. Wielkoobszarowa Inwentaryzacja Stanu Lasu (Okr. 2014–2018); Biuro Urządzania Lasu i Geodezji Leśnej: Warszawa, Poland, 2018. [Google Scholar]
  37. Kramer, W. Die Weißtanne (Abies alba Mill.) in Ost-und Südosteuropa; Gustav Fischer Verlag: Stuttgart, Germany, 1992. [Google Scholar]
  38. Matuszkiewicz, J.M. Zespoły leśne Polski; Wydawnictwo Naukowe PWN: Warszawa, Poland, 2001. [Google Scholar]
  39. Fabijanowski, J.; Jaworski, A. Gospodarstwo leśne (Silviculture). In Karpaty Polskie, Człowiek i Jego Działalność; Warszyńska, J., Ed.; Wydawnictwo UJ: Kraków, Poland, 1995; pp. 253–263. [Google Scholar]
  40. Khanuja, S.; Shasany, A.; Darokar, M.P.; Kumar, S. Rapid Isolation of DNA from Dry and Fresh Samples of Plants Producing Large Amounts of Secondary Metabolites and Essential Oils. Plant Mol. Biol. Rep. 1999, 17, 74. [Google Scholar] [CrossRef]
  41. Cremer, E.; Liepelt, S.; Sebastiani, F.; Buonamici, A.; Michalczyk, I.M.; Ziegenhagen, B.; Vendramin, G.G. Identification and characterization of nuclear microsatellite loci in Abies alba Mill. Mol. Ecol. Notes 2006, 6, 374–376. [Google Scholar] [CrossRef]
  42. Kempf, M.; Sabor, J.; Stanuch, H. Ocena cech adaptacyjnych i morfologicznych potomstwa drzewostanow jodlowych objetych ochrona w Karpackim Banku Genow. Sylwan 2003, 147, 3–15. [Google Scholar]
  43. Kempf, M.; Sabor, J. Evaluation of the variability of adaptive traits in 5−year−old silver fir progenies from provenances protected on conservation plots in the Carpathian Gene Bank. Sylwan 2009, 153, 651–661. [Google Scholar]
  44. Wypych, A.; Ustrnul, Z.; Schmatz, D.R. Long-term variability of air temperature and precipitation conditions in the Polish Carpathians. J. Mt. Sci. 2018, 15, 237–253. [Google Scholar] [CrossRef]
  45. Paszyński, J.; Niedźwiedź, T. Klimat. In Geografia Polski. Środowisko Przyrodnicze.; Starkel, L., Ed.; Wydawnictwo Naukowe PWN: Warszawa, Poland, 1999; pp. 288–343. [Google Scholar]
  46. Van Oosterhout, C.; Hutchinson, W.F.; Wills, D.P.M.; Shipley, P. MICRO-CHECKER: Software for identifying and correcting genotyping errors in microsatellite data. Mol. Ecol. Notes 2004, 4, 535–538. [Google Scholar] [CrossRef]
  47. Van Oosterhout, C.; Weetman, D.; Hutchinson, W.F. Estimation and adjustment of microsatellite null alleles in nonequilibrium populations. Mol. Ecol. Notes 2006, 6, 255–256. [Google Scholar] [CrossRef]
  48. Brookfield, J.F.Y. A simple new method for estimating null allele frequency from heterozygote deficiency. Mol. Ecol. 1996, 5, 453–455. [Google Scholar] [CrossRef] [PubMed]
  49. Raymond, M.; Rousset, F. GENEPOP (version 1.2): Population genetics software for exact tests and ecumenicism. J. Hered. 1995, 86, 248–249. [Google Scholar] [CrossRef]
  50. Nei, M. Estimation of average heterozygosity and genetic distance from a small number of individuals. Genetics 1978, 89, 583–590. [Google Scholar]
  51. Peakall, R.; Smouse, P.E. GENALEX 6: Genetic analysis in Excel. Population genetic software for teaching and research. Mol. Ecol. Notes 2006, 6, 288–295. [Google Scholar] [CrossRef]
  52. Peakall, R.; Smouse, P.E. GenALEx 6.5: Genetic analysis in Excel. Population genetic software for teaching and research-an updat. Bioinformatics 2012, 28, 2537–2539. [Google Scholar] [CrossRef] [Green Version]
  53. Efron, B.; Tibshirani, R.J. An Introduction to the Bootstrap; Chapmann&Hall/CRC: New York, NY, USA, 1993; ISBN 0412042312. [Google Scholar]
  54. Slatkin, M. A measure of population subdivision based on microsatellite allele frequencies. Genetics 1995, 139, 457–462. [Google Scholar]
  55. Nei, M. Genetic Distance between Populations. Am. Nat. 1972, 106, 283–292. [Google Scholar] [CrossRef]
  56. Pritchard, J.K.; Stephens, M.; Donnelly, P. Inference of population structure using multilocus genotype data. Genetics 2000, 155, 945–959. [Google Scholar]
  57. Evanno, G.; Regnaut, S.; Goudet, J. Detecting the number of clusters of individuals using the software STRUCTURE: A simulation study. Mol. Ecol. 2005, 14, 2611–2620. [Google Scholar] [CrossRef] [PubMed] [Green Version]
  58. Earl, D.A.; VonHoldt, B.M. STRUCTURE HARVESTER: A website and program for visualizing STRUCTURE output and implementing the Evanno method. Conserv. Genet. Resour. 2012, 4, 359–361. [Google Scholar] [CrossRef]
  59. Kopelman, N.M.; Mayzel, J.; Jakobsson, M.; Rosenberg, N.A.; Mayrose, I. Clumpak: A program for identifying clustering modes and packaging population structure inferences across K. Mol. Ecol. Resour. 2015, 1179–1191. [Google Scholar] [CrossRef] [PubMed] [Green Version]
  60. Pawlaczyk, E.; Kroplewska, I.; Bobowicz, M. Postglacial migration of silver fir (Abies alba Mill.) to Poland-Analysis on the basis of mitochondrial DNA polymorphism. Sylwan 2013, 157, 458–463. [Google Scholar]
  61. Litkowiec, M.; Lewandowski, A.; Raczka, G. Spatial pattern of the mitochondrial and chloroplast genetic variation in poland as a result of the migration of Abies alba Mill. from different glacial refugia. Forests 2016, 7, 1–13. [Google Scholar] [CrossRef]
  62. Lewandowski, A.; Filipiak, M.; Burczyk, J. Genetic variation of Abies alba Mill. in Polish part of Sudety Mts. Acta Soc. Bot. Pol. 2001, 70, 215–219. [Google Scholar] [CrossRef]
  63. Longauer, R.; Paule, L.; Andonoski, A. Genetic diversity of southern populations of Abies alba Mill. Int. J. For. Genet. 2003, 10, 1–10. [Google Scholar]
  64. Parducci, L.; Szmidt, A.E.; Villani, F.; Wang, X.R.; Cherubini, M. Genetic variation of Abies alba in Italy. Hereditas 1996, 125, 11–18. [Google Scholar] [CrossRef]
  65. Mejnartowicz, L. Genetic analysis of silver-fir populations in the north Carpathian and Sudeten mountains. Acta Soc. Bot. Pol. 2004, 73, 285–292. [Google Scholar] [CrossRef] [Green Version]
  66. Ballian, D.; Kajba, D. Estimation of the isoenzyme genetic variability of the silver fir (Abies alba Mill.) the area of Gorski Kotar (Croatia). Period. Biol. 2005, 107, 67–72. [Google Scholar]
  67. Kormuťák, A.; Kádasi-Horáková, M.; Vooková, B.; Gömöry, D. Genetic structure of silver fir primeval forests in Slovakia. Lesn. Časopis For. J. 2008, 54, 37–42. [Google Scholar]
  68. Cremer, E.; Ziegenhagen, B.; Schulerowitz, K.; Mengel, C.; Donges, K.; Bialozyt, R.; Hussendörfer, E.; Liepelt, S. Local seed dispersal in European silver fir (Abies alba Mill.): Lessons learned from a seed trap experiment. Trees Struct. Funct. 2012, 26, 987–996. [Google Scholar] [CrossRef]
  69. Dering, M.; Sekiewicz, K.; Boratyńska, K.; Litkowiec, M.; Iszkuło, G.; Romo, A.; Boratyński, A. Genetic diversity and inter-specific relations of western Mediterranean relic Abies taxa as compared to the Iberian, Abies alba. Flora Morphol. Distrib. Funct. Ecol. Plants 2014, 209, 367–374. [Google Scholar] [CrossRef] [Green Version]
  70. Cvrčková, H.; Máchová, P.; Malá, J. Use of nuclear microsatellite loci for evaluating genetic diversity among selected populations of Abies alba Mill. in the Czech Republic. J. Sci. 2015, 61, 345–351. [Google Scholar] [CrossRef] [Green Version]
  71. Belletti, P.; Ferrazzini, D.; Ducci, F.; De Rogatis, A.; Mucciarelli, M. Genetic diversity of italian populations of Abies alba. Dendrobiology 2017, 77, 147–159. [Google Scholar] [CrossRef]
  72. White, G.M.; Boshier, D.H.; Powell, W. Increased pollen flow counteracts fragmentation in a tropical dry forest: An example from Swietenia humilis Zuccarini. Proc. Natl. Acad. Sci. USA 2002, 99, 2038–2042. [Google Scholar] [CrossRef] [PubMed] [Green Version]
  73. Craft, K.J.; Ashley, M.V. Pollen-mediated gene flow in isolated and continuous stands of bur oak, Quercus macrocarpa (Fagaceae). Am. J. Bot. 2010, 97, 1999–2006. [Google Scholar] [CrossRef] [Green Version]
  74. Ballian, D.; Bogunić, F.; Bajrić, M.; Kajba, D.; Kraigher, H.; Konnert, M. The genetic population study of Balkan silver fir (Abies alba Mill.). Period. Biol. 2012, 114, 55–65. [Google Scholar]
  75. Willis, K.J.; Van Andel, T.H. Trees or no trees? The environments of central and eastern Europe during the Last Glaciation. Quat. Sci. Rev. 2004, 23, 2369–2387. [Google Scholar] [CrossRef]
  76. Willis, K.J.; Rudner, E.; Sümegi, P. The full-glacial forests of central and southeastern Europe. Quat. Res. 2000, 53, 203–213. [Google Scholar] [CrossRef]
  77. Terhürne-Berson, R.; Litt, T.; Cheddadi, R. The spread of Abies throughout Europe since the last glacial period: Combined macrofossil and pollen data. Veg. Hist. Archaeobot. 2004, 13, 257–268. [Google Scholar] [CrossRef]
  78. Culiberg, M. Late Glacial Vegetation in Slovenia; SAZU: Ljubljana, Sovenia, 1991; ISBN 9788671310512. [Google Scholar]
  79. Obidowicz, A.; Szczepanek, K.; Madeyska, E.; Nalepka, D. Abies alba Mill.—Fir. In Late Glacial and Holocene History of Vegetation in Poland Based on Isopollen Maps; Ralska-Jasiewiczowa, M., Latałowa, M., Wasylikowa, K., Tobolski, K., Madeyska, E., Wright, H.E.J., Turner, C., Eds.; W. Szafer Institute of Botany, Polish Academy of Sciences: Kraków, Poland, 2004; pp. 31–38. [Google Scholar]
  80. Tinner, W.; Lotter, A.F. Central European vegetation response to abrupt climate change at 8.2 ka. Geology 2001, 29, 551–554. [Google Scholar] [CrossRef] [Green Version]
  81. Roschanski, A.M.; Csilléry, K.; Liepelt, S.; Oddou-Muratorio, S.; Ziegenhagen, B.; Huard, F.; Ullrich, K.K.; Postolache, D.; Vendramin, G.G.; Fady, B. Evidence of divergent selection for drought and cold tolerance at landscape and local scales in Abies alba Mill. in the French Mediterranean Alps. Mol. Ecol. 2016, 25, 776–794. [Google Scholar] [CrossRef] [PubMed]
  82. Csilléry, K.; Ovaskainen, O.; Sperisen, C.; Buchmann, N.; Widmer, A.; Gugerli, F. Adaptation to local climate in multi-trait space: Evidence from silver fir (Abies alba Mill.) populations across a heterogeneous environment. Heredity 2020, 124, 77–92. [Google Scholar] [CrossRef] [Green Version]
  83. Matías, L.; Gonzalez-Díaz, P.; Quero, J.L.; Camarero, J.J.; Lloret, F.; Jump, A.S. Role of geographical provenance in the response of silver fir seedlings to experimental warming and drought. Tree Physiol. 2016, 36, 1236–1246. [Google Scholar] [CrossRef] [Green Version]
  84. Konôpková, A.; Kurjak, D.; Kmeť, J.; Klumpp, R.; Longauer, R.; Ditmarová, Ľ; Gömöry, D. Differences in photochemistry and response to heat stress between silver fir (Abies alba Mill.) provenances. Trees Struct. Funct. 2018, 32, 73–86. [Google Scholar] [CrossRef]
  85. Skrzyszewska, K. Wartość selekcyjna jodły pospolitej (Abies alba Mill.) polskich pochodzeń w okresie juwenilnego wzrostu w zróżnicowanych warunkach siedliskowych. Zesz. Nauk. AR Krak. 2013, 377, 7–31. [Google Scholar]
Figure 1. Study sites representing the two maternal lineages originating from the western (white dots) and eastern (black dots) refugial regions within the present distribution (grey background) of Abies alba (EUFORGEN 2009, www.euforgen.org) (A) and location of the provenances (black dots) and test sites (red triangles) in the provenance trial in the Polish Carpathians (B).
Forests 11 00849 g001
Figure 2. Parameters of allelic richness and genetic diversity in the eastern and western maternal lineages: Na—number of different alleles per locus, Ne—number of effective alleles per locus, Ho—observed heterozygosity, He—unbiased expected heterozygosity, FIS—inbreeding coefficient. The significance levels (p) of a two-sided permutation test for differences between the lineages are given in brackets.
Forests 11 00849 g002
Figure 3. Values of the Delta K criterion used in the detection of the optimal number of genetic clusters by the Bayesian analysis implemented in STRUCTURE software (A), relationship between the frequency of the genetic group A distinguished by the Bayesian analysis in the study subpopulations and distance from the contact zone (B) and genetic structure of Abies alba subpopulations revealed for the two genetic groups, K = 2 (C). The Delta K parameter was calculated according to an algorithm by Evanno et al. [57]. The negative/positive values in Figure 3B indicate distances in the eastern/western direction from the contact zone.
Forests 11 00849 g003aForests 11 00849 g003b
Figure 4. UPGMA dendrogram for the study subpopulations based on genetic distance index by Nei [50] (A) and genetic distances (mean ± SD) between the study subpopulations in geographic distance classes (class width = 50 km) (B).
Forests 11 00849 g004
Figure 5. Values of the Delta K criterion in the Bayesian analysis conducted separately for the western and eastern maternal lineages (A), frequency of the three genetic groups distinguished by the Bayesian analysis in the western maternal lineage across distance from the contact zone (B) and genetic structure of Abies alba subpopulations in the western lineage for K = 3 (C).
Forests 11 00849 g005
Figure 6. Relationships between the survival rate of the tested provenances after 15 years and the geographic distance between their origin sites and the meeting zone of the refugial lineages. Survival rate is expressed both in nominal and standardized units for each test site. The dots show the mean survival rate of 33 tested provenances from the western lineage on eight test sites.
Forests 11 00849 g006
Figure 7. Relationships between the mean heights reached at an age of 15 years by trees of the tested provenances and the geographic distance between their origin sites and the meeting zone of the refugial lineages. Tree height is expressed both in nominal and standardized units for each test site. The dots show the mean tree heights of 33 tested provenances from the western lineage on eight test sites.
Forests 11 00849 g007
Figure 8. Relationship between growth conditions in test sites and the effect of provenance on tree growth. Site-specific growth conditions are expressed as the overall mean height reached by all trees growing in a given test site, while the effect of provenance was expressed as the slope coefficient of the regression of mean tree heights for provenances against the geographic distances between their origin sites and the meeting zone of the refugial lineages. In the calculations of the regression, absolute and standardized values of tree heights were used to eliminate the direct effect of site variation between the test locations on the slope coefficients.
Forests 11 00849 g008
Table 1. Analysis of molecular variance and associated Slatkin’s R and F statistics.
Source
of Variation
Degrees of Freedom (Df)Variance
Component (%)
R StatisticVariance
Component (%)
F Statistic
Between lineages11.7***0.0170.00.000
Between subpopulations548.2***0.0842.8***0.028
Within subpopulations346690.1***0.09997.2***0.016
Total3521100-100
Note: *** p < 0.001 for H0: R = 0 or H0: F = 0.

