Article

Divergent Hydraulic Strategies Explain the Interspecific Associations of Co-Occurring Trees in Forest–Steppe Ecotone

1
College of Urban and Environmental Science and MOE Laboratory for Earth Surface Processes, Peking University, Beijing 100871, China
2
College of Forestry, Inner Mongolia Agricultural University, Inner Mongolia 010000, China
3
Institute of Forest Ecology, Environment and Protection, Chinese Academy of Forestry, Beijing 100091, China
*
Author to whom correspondence should be addressed.
Submission received: 11 July 2020 / Revised: 20 August 2020 / Accepted: 27 August 2020 / Published: 28 August 2020
(This article belongs to the Special Issue Spatial Heterogeneity of Forest-Steppes)

Abstract

:
Research Highlights: Answering how tree hydraulic strategies explain the interspecific associations of co-occurring trees in forest–steppe ecotone is an approach to link plant physiology to forest dynamics, and is helpful to predict forest composition and function changes with climate change. Background and Objectives: The forest–steppe ecotone—the driest edges of forest distribution—is continuously threatened by climate change. To predict the forest dynamics here, it is crucial to document the interspecific associations among existing trees and their potential physiological drivers. Materials and Methods: Forest–steppe ecotone is composed of forest and grassland patches in a mosaic pattern. We executed two years of complete quadrat surveys in a permanent forest plot in the ecotone in northern China, calculated the interspecific association among five main tree species and analyzed their hydraulic strategies, which are presented by combining leaf-specific hydraulic conductivity (Kl) and important thresholds on the stem-vulnerability curves. Results: No intensive competition was suggested among the co-occurring species, which can be explained by their divergent hydraulic strategies. The negative associations among Populus davidiana Dode and Betula platyphylla Suk., and P. davidiana and Betula dahurica Pall. can be explained as the result of their similar hydraulic strategies. Tilia mongolica Maxim. got a strong population development with its effective and safe hydraulic strategy. Generally, hydraulic-strategy differences can explain about 40% variations in interspecific association of species pairs. Oppositely, species sensitivity to early stages of drought is convergent in the forest. Conclusions: The divergent hydraulic strategies can partly explain the interspecific associations among tree species in forest–steppe ecotone and may be an important key for semiarid forests to keep stable. The convergent sensitivity to early stages of drought and the suckering regeneration strategy are also important for trees to survival. Our work revealing the physiological mechanism of forest compositions is a timely supplement to forest–steppe ecotone vegetation prediction.

1. Introduction

The forest–steppe ecotone is located at the driest edges of forest distribution and is continually threatened by the increasing temperature and drought [1,2,3,4]. Forest patches and grassland patches distribute in a mosaic pattern in the forest–steppe ecotone [4]. To answer whether the forests are stable in the forest–steppe ecotone, it is helpful to explore what interspecific associations exist among tree species and what physiological mechanisms are driving them, as the interspecific associations of co-occurring trees will determine the forest composition variations [5].
Interspecific association—referring to the relationships and interactions among co-occurring species [6]—has been reported to be driven by many factors, including the forest succession process [5], the heterogeneity of microenvironment [7], etc. In the forest–steppe ecotone—the driest edges of forest distribution—water deficit is the most dominant environment stress affecting forest dynamics and functions [2,8], instead of reported interspecific association drivers. Moreover, water deficit here has been predicted to be exacerbated in the future [2,8]. For this reason, it is crucial to explore the importance and role of water deficit in shaping the vegetation community in the forest–steppe ecotone.
Facing the aggravated water deficit, plant hydraulic strategies balancing hydraulic safety and water-transport efficiency are believed to determine tree drought responses [9,10,11]. The water-transport efficiency of trees has direct impacts on the carbon uptake and productivity of trees, while xylem resistance to cavitation determines the safety of individuals when extreme drought events occur [11,12,13]. The safety and efficiency of trees generally occur as a tradeoff. A larger conduit diameter provides higher hydraulic efficiency as well as higher vulnerability to drought-induced embolism in the xylem, and vice versa [14,15]. The hydraulic safety–efficiency combination of trees can provide a way to map hydraulic strategy of each tree species, to describe the differences among the hydraulic strategies of co-occurring species and to judge the vulnerability of trees in the forest–steppe ecotone under ongoing climate change [16,17].
If water deficit plays a considerable role in forest interspecific associations, divergent hydraulic strategies should differentiate the water-use strategies of species and reduce interspecific water competitions [18], thus benefitting species co-occurrence. Further, we can expect the differences of species hydraulic strategies to be an effective predictor of interspecific relationships, i.e., the hydraulic strategies of co-existent species to be divergent, while the hydraulic strategies of mutually exclusive species to be convergent. Meanwhile, the species with both higher hydraulic safety and efficiency should have higher potential to be dominant in the community. Forest–steppe ecotone has all the ten genera of tree species distributing in semi-humid forests in northern China, even with a mean annual precipitation of about 300 mm [19]. If the diversity of tree hydraulic strategies can provide partitioning of the water resource, it may be the reason for forest–steppe ecotone to maintain the high tree species diversity. In general, we developed two hypotheses in this article, 1) there is a positive correlation between interspecific association and distance in species hydraulic strategy, and 2) species with both high hydraulic efficiency and safety may play a dominant role in the forest, or have experienced a rapid population development over the years.
To verify the hypotheses, we carried out a two-year vegetation survey and a series of hydraulic measurements in a permanent plot in the Saihan Wula National Nature Reserve, Inner Mongolia, China. In this work, hydraulic efficiency is represented by leaf-specific hydraulic conductivity (Kl), while hydraulic safety is represented by a series of important thresholds on the stem-vulnerability curves, stem water potential at a 50% loss of stem conductivity (P50) especially. The Kl and P50 are combined to show the hydraulic strategy of each species.

2. Materials and Methods

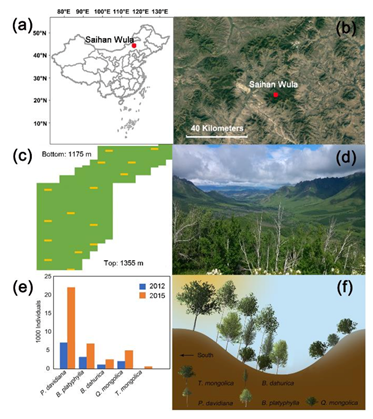
2.1. Site Description and Sampling Design

Field work was conducted within a 6-ha permanent plot in a temperate deciduous broadleaved forest in the Saihan Wula National Nature Reserve in the southern Da Hinggan Mountains, Inner Mongolia, China (Figure 1a,b, 44°12′ N, 118°44′ E). The plot is located in semiarid forest–steppe ecotone, with a mean annual temperature of 2 °C and a mean annual precipitation of 358 mm. The wet season is from May to September. The elevation of the plot is approximately 1175–1355 m ASL [20]. The studied forest is located on the north side of the mountain, while the steppe lies on the south (Figure 1d). Severe drought-induced forest mortality occurred during 2011–2012, followed by a huge amount of regeneration. Tree density increased from 1825.17 ha−1 in 2012 to 3812.17 ha−1 in 2015. No grazing, agricultural abandonment, forest management or fire interference have been found inside or around the plot since 1997.
Two comprehensive plot surveys were carried out in the whole permanent plot in 2012 and 2015, respectively. The permanent plot was divided into 608 contiguous 10 m × 10 m quadrats. Basic information of all trees with diameter at breast height >1 cm was carefully recorded, including species, tree height, diameter at breast height and the located quadrat identification number. Only main species were taken into further analysis, with the proportion in the total tree number over 1%, which are Populus davidiana Dode, Betula platyphylla Suk., Betula dahurica Pall., Quercus mongolica Fisch. ex Ledeb and Tilia mongolica Maxim. (Figure 1e,f). P. davidiana, B. platyphylla and B. dahurica are early successional species, while Q. mongolica and T. mongolica are late successional species. P. davidiana was the most dominant tree species in the forests, accounting for the largest amount of the tree mortality and regeneration during and after the extensive drought events in 2011–2012 (Figure 1e), with a mortality ratio of over 60% [21].
Hydraulic traits were measured for five trees per species at different elevations (Figure 1c). The maximal vessel lengths of each species are: P. davidiana: 11 cm, B. platyphylla: 14 cm, B. dahurica: 16 cm, Q. mongolica: 86 cm and T. mongolica: 20 cm.

2.2. Interspecific Association Quantification

The interspecific association of five species were quantified with the plot survey data. The variance ratio (VR) was used to test the overall association among species. If VR = 1, species are independent from each other. A VR >1 indicates positive correlation, while a VR <1 indicates negative correlation. Statistics W and χ2 test were used to test the significance of the difference between VR value and 1, with a χ2 (0.05, N) < W < χ2 (0.95, N) indicating statistically insignificant difference between VR value and 1, which suggests the original hypothesis is true. The formulas are listed below [6]:
VR = S T 2 δ T 2 = 1 N j = 1 N T j t 2 i = 1 S ( P i × 1 P i )   P i = n i N
W = VR × N
where S represents the total species number, N represents the total quadrat number, Tj represents the number of species occurring in the quadrat j, t represents the average number of species occurring in each quadrat, while Pi represents the percentage of the quadrats with the species i occurring in them.
Then, based on 2 × 2 contingency table among species, we used the Yates correlation coefficient, Ochiai index and principal component analysis (PCA) to reveal the interspecific association between each pair of species. First, Yates correlation coefficient was processed to test whether the associations of species pairs existed with the predetermined probability. In Yates test, index V > 0 indicates a positive correlation between the two species, while V <0 indicates a negative correlation between species. χ2 is used to show the significance of the correlation. If χ2 < 3.841, the two species are independently distributed, if 3.841 ≤ χ2 < 6.635, significant association is attached, and if χ2 > 6.635, the association between two species is highly significant [6]. Second, Ochiai index was used to measure the degree of the associations. Ochiai index distributed between 0 and 1. A higher OI indicates higher possibility for two species to occur in the same quadrat. The formulas of Yates correlation and Ochiai index are listed below [5,6]:
V = ad bc
χ 2 = n ad bc 0.5 n 2 a + b a + c b + d c + d
OI = a a + b a + c
where n represents the total quadrat number, a represents the number of quadrats with both two species, b and c represent the number of quadrats with only one species, while d represents the number of quadrats with neither of the two species. Finally, PCA analysis was adopted to show the relationship among species and quadrats at the community level.

2.3. Hydraulic Traits Measurement

Long branches over 50 cm with diameters of approximately 5 to 8 mm were cut by clippers, and all the leaves on the cut branch were retained. The branch samples were placed in black plastic bags, and the cross sections were immediately wrapped in moist tissue in the field to reduce moisture loss. The branch samples were cut twice into 27.4-cm length segments under water in the laboratory [22], removing the excess length from both ends, ensuring shaving off more than 5 cm from each end [22,23] and retaining a straight segment with as few embranchments as possible.
Maximum hydraulic conductivity (Kmax, 10−4 kg m MPa−1 s−1) was measured for each sample by flushing the stem segments with the 20-mM KCl solution at 0.1 MPa for 30 min and measuring the flow rate of ultrafiltered water passing through the segment under pressure difference of around 0.05 MPa [15,24]. All the leaves above the sampled branches were scanned using a portable scanner (Founder MobileOffice Z6, Beijing, China) and the total leaf area was calculated using MATLAB R2014a (The MathWorks, Natick, MA, USA). Leaf specific conductivity (Kl, 10−4 kg m−1 s−1 MPa−1) was then determined as the ratio of Kmax and the total leaf area of the branches. Kl is a synthetic proxy for the balance between the water demand of leaves and the hydraulic transport efficiency of stems [14]. All the measurements were made within two days after sampling.
The vulnerability of the stems to drought-induced cavitation, i.e., the stem-vulnerability curve, was estimated using the centrifugal force method [25] with a superspeed centrifuge (CTK150R, XiangYi Centrifuge Instrument, Changsha, China). The segment ends were kept immersed in water during spinning [25]. The Kmax of the stem segments was set as the starting point of the curve. Then, the hydraulic conductance (Kh, 10−4 kg m MPa−1 s−1) were measured after a series of stepwise increasing xylem tensions caused by different spinning speeds. The vulnerability curve was finally plotted as the variation in the percentage loss of hydraulic conductivity (PLC) with increasing xylem tension. The PLC of the stems was calculated as:
PLC   =   K max     K h / K max
From the vulnerability curves, we can extract some important water potential thresholds, which mark declines in stomatal conductance, hydraulic conductivity and potential for survival. Here, we choose stem water potential at 12% (P12), 50% (P50) and 88% (P88) loss of stem conductivity as the proxies for the early declines in water supply influencing leaf stomatal activities, gas exchange and carbon uptake, the maximum water stress trees can bear naturally and the threshold of irreversible xylem functional damage, respectively [26].

2.4. Statistical Analysis

The stem-vulnerability curves were fitted with a four-parameter Weibull model using SigmaPlot v14.0 (Systat Software, Inc., San Jose, CA, USA). Variance analysis was used to show the differences among the hydraulic traits of different species, followed by least significant difference (LSD) post hoc tests. To reveal the relationship between the interspecific association pattern and the hydraulic-strategy differences among species, we calculated the hydraulic differences between each pair of species with Kl and P50, including Euclidean, Manhattan, Canberra, Minkowski and maximum distance. If all of the distances show similar relationships with interspecific association indices, we can accept the hypothesis that linkages exist between hydraulic-strategy differences and interspecific associations. Correlation tests and linear regression were used further for the hydraulic differences and the interspecific association indices, V2012, V2015, OI2012 and OI2015 to map the relationship between them. All the statistical analyses were performed in R software (R Development Core Team, 2009), while figures were drawn with R software and SigmaPlot v14.0.

3. Results

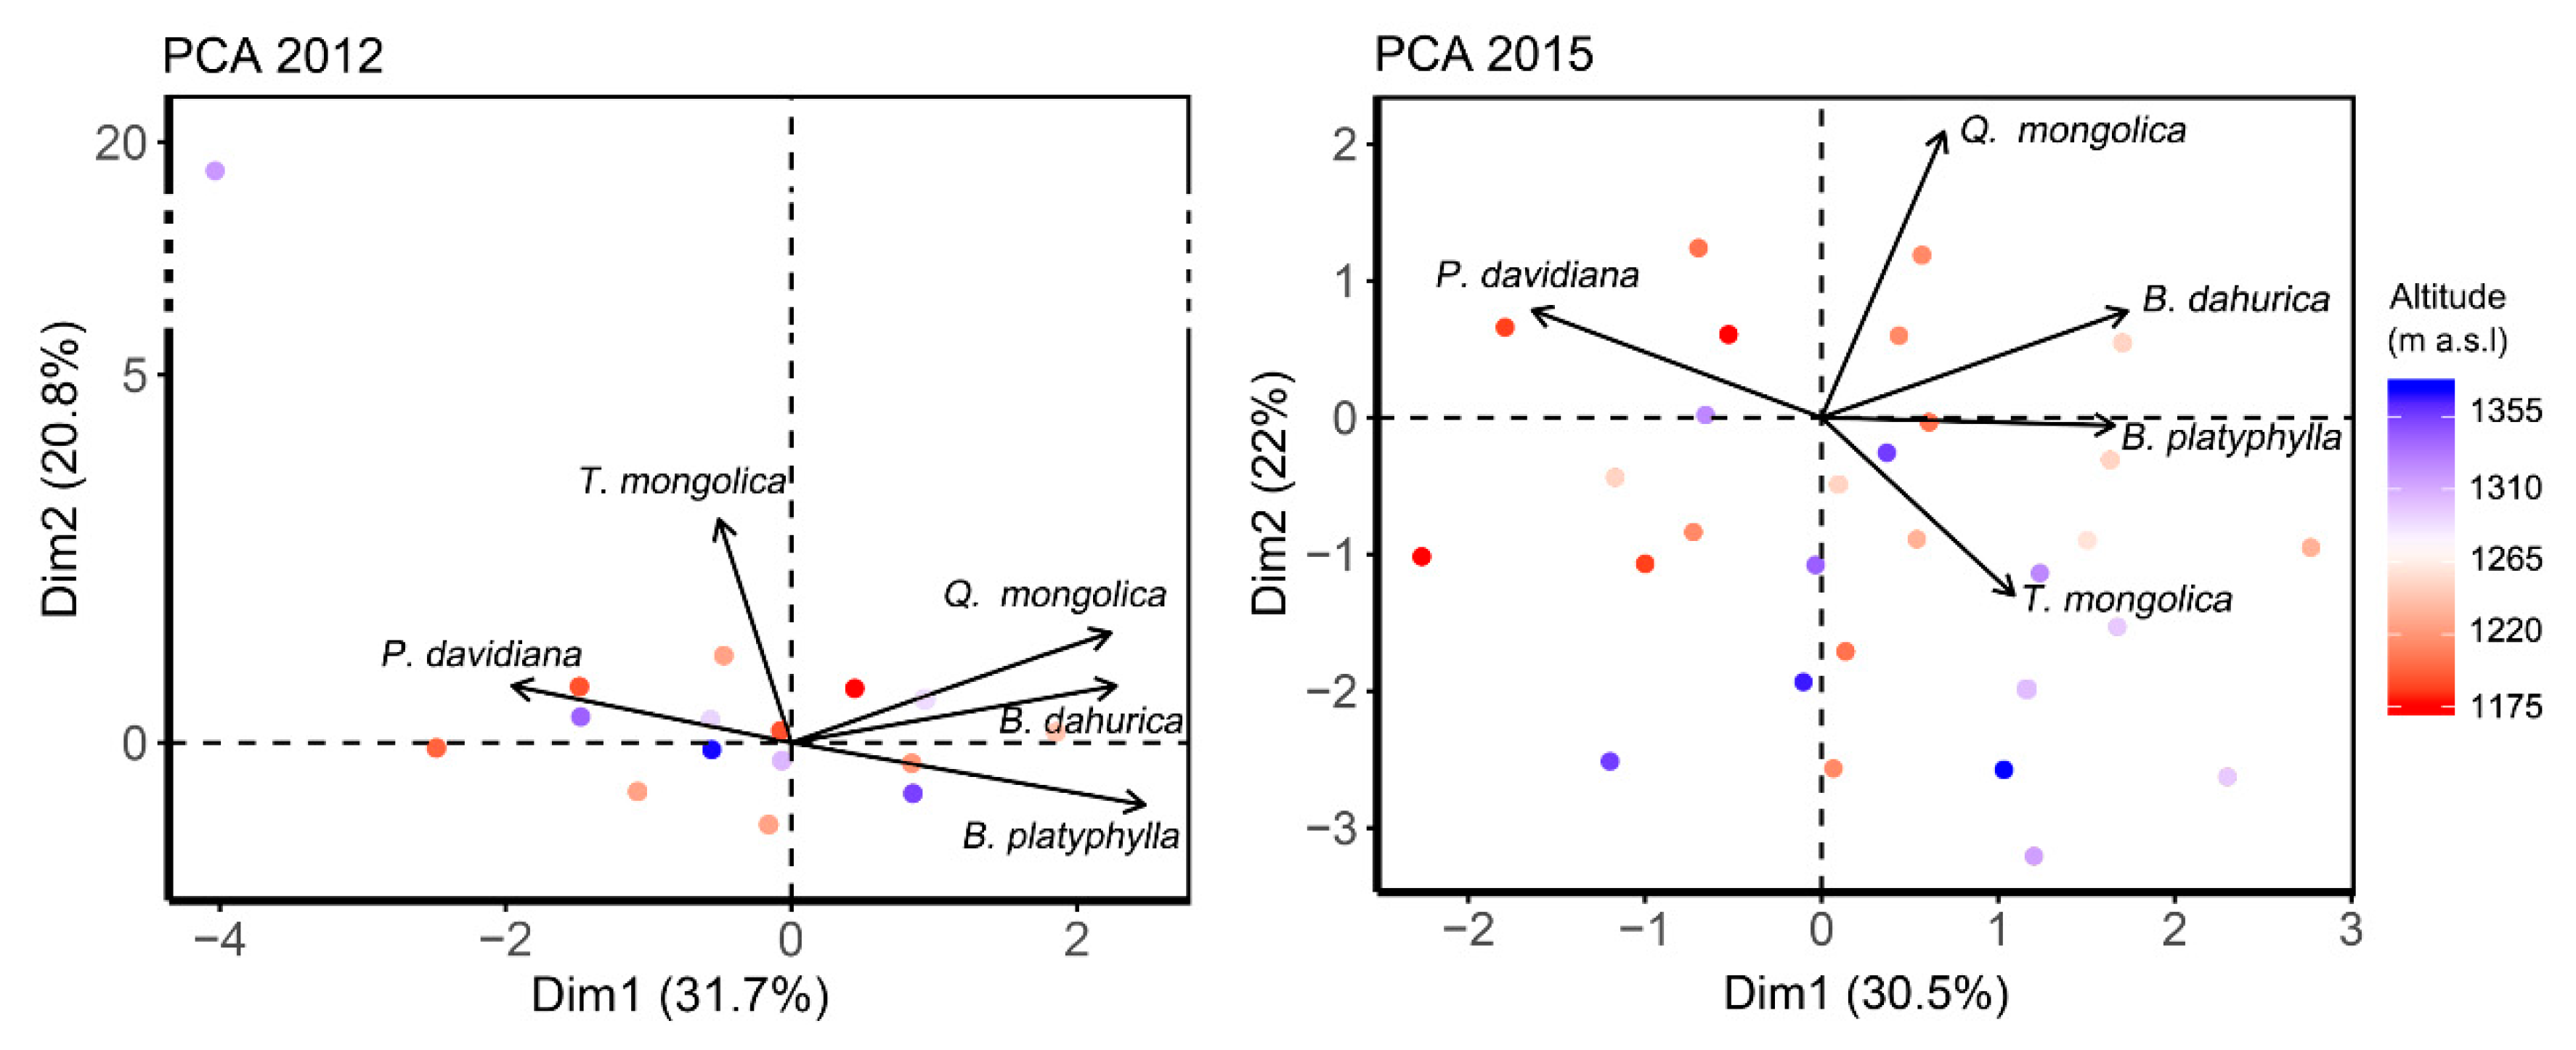
3.1. Interspecific Association among Species

The overall species association measured by the VR test revealed no significant correlation within the forest community in either 2012 or 2015 (in 2012, VR = 1.10 > 1, W = 569.10, χ2 (0.95, N) = 569.95, χ2 (0.05, N) = 464.32; in 2015, VR = 1.03 > 1, W = 604.23, χ2 (0.95, N) = 646.57, χ2 (0.05, N) = 533.71).
The association measurements between each pair of species revealed generally negative correlations between P. davidiana and co-occurring species (Table 1). In 2012, there was no significant correlation between P. davidiana and T. mongolica, while the relationship between P. davidiana and B. dahurica, B. platyphylla and Q. mongolica were all negative. In 2015, the relationship between P. davidiana and all the co-occurring species became negatively correlated.
The interspecies association among B. dahurica, B. platyphylla and Q. mongolica in both years were strong and significantly positive (V > 0, χ2 > 6.635 for all associations except the one between B. platyphylla and Q. mongolica in 2015; OI > 0.6), showing the distribution of the three species tend to be convergent (Table 1).
A strong increase of T. mongolica could be detected from 2012 to 2015. The total number of T. mongolica in plot increased from three in 2012 to 486 in 2015 (Figure 1e), and the percent of quadrats with T. mongolica increased from 0.2% in 2012 to 12.0% in 2015. Consequently, the association between T. mongolica and co-occurring species had prominently been increased (Table 1). In 2012, none of the association between T. mongolica and other species were significant (χ2 < 3.841 in Yates correlation; OI <0.1), while in 2015, T. mongolica showed extremely significant positive correlation with B. dahurica and negative correlation with P. davidiana2 > 6.635). For Ochiai index, though the association between T. mongolica and other species were both weak, OI value in 2015 were generally higher than OI in 2012.
Principle component analysis (PCA) integrated the interspecific associations within the forest in these two years (Figure 2). The first two components reflected 52.53% and 52.42% of the total variabilities in 2012 and 2015, respectively. B. platyphylla and B. dahurica located nearby the first component at the opposite of P. davidiana in both years. Q. mongolica located close to the first component in 2012, while close to the second component in 2015, indicating Q. mongolica being increasing decoupled with P. davidiana, B. platyphylla and B. dahurica over the years. The location of T. mongolica in 2015 was inversed to it in 2012 and be closer to the first component than 2012, indicating a closer association emerged over the years. Quadrats at the bottom of the mountain located generally at the top–left in PCA figures, while quadrats at the top of the mountain usually distributed at the bottom–right in figures, indicating P. davidiana to occupy more proportion at the bottom of the mountain, while T. mongolica and B. platyphylla occupying more proportion at the top of the mountain.

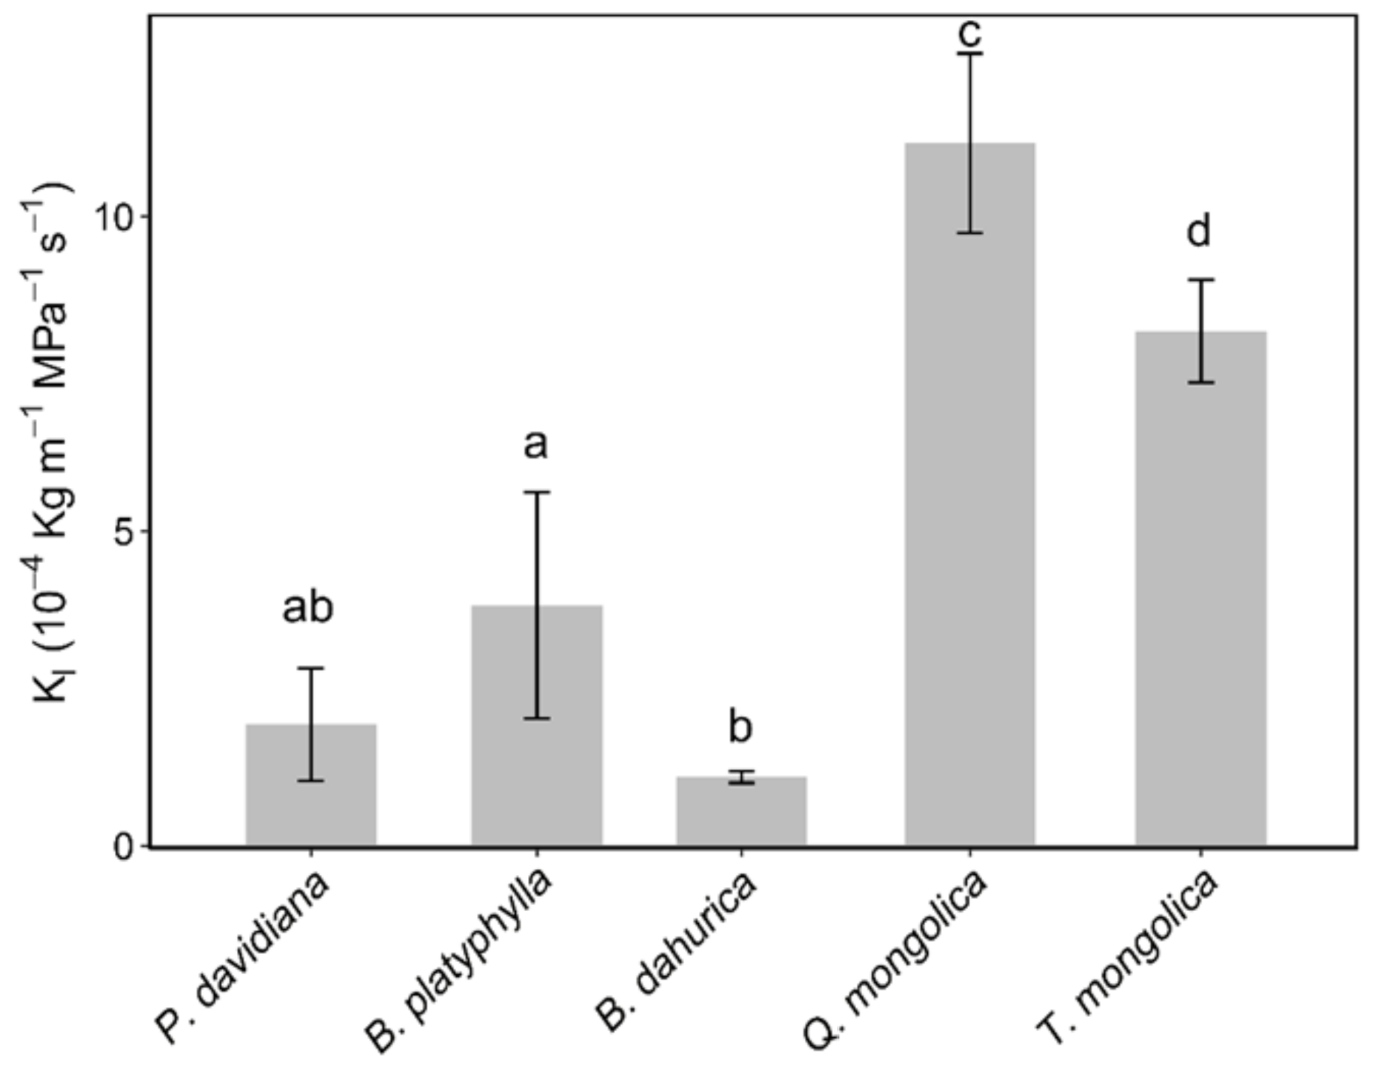
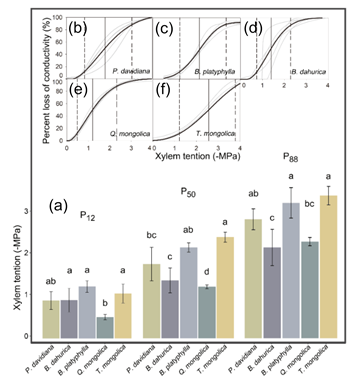
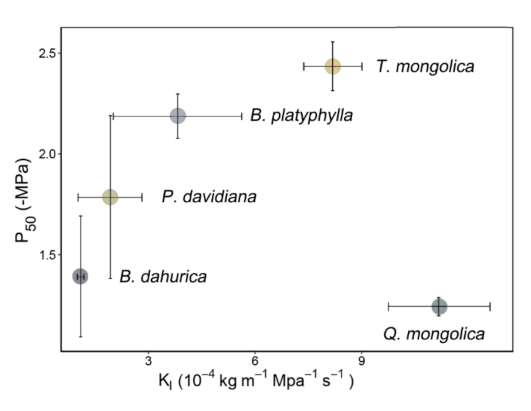
3.2. Hydraulic Safety and Efficiency Differences among Species

There were significant differences in Kl between species (Figure 3). The Kl value of B. dahurica, B. platyphylla, T. mongolica and Q. mongolica increased significantly in sequence (p < 0.05), ranging from 1.1 × 10⁻⁴ to 11.2 × 10⁻⁴ kg m MPa−1 s−1. There were no significant differences between the Kl value of P. davidiana and B. dahurica, nor between P. davidiana and B. platyphylla.
The stem-vulnerability curves showed generally convergent sensitivity to early stages of drought, but different stem cavitation resistance abilities among co-occurring tree species (Figure 4). All the species except Q. mongolica had the same P12. P12 of Q. mongolica, −1.24 MPa, was significantly lower than B. platyphylla, B. dahurica and T. mongolica, indicating Q. mongolica to be more sensitive to the early stages of drought. Though some species pairs did not show significant differences, the P50 and P88 values indicated the stem cavitation resistance of species to be generally ordered as: T. mongolica = B. platyphylla > P. davidiana > B. dahurica > Q. mongolica.
The interspecific differences on hydraulic strategies between safety and efficiency can be integrated as Figure 5 when representing xylem hydraulic safety by P50. Generally speaking, the hydraulic strategies of different species were divergent. Hydraulic strategy of P. davidiana has much overlap with B. platyphylla and B. dahurica, though the strategies of the latter two were different. Q. mongolica located at the right bottom corner, suggesting the xylem have high hydraulic conductance but poor ability for drought resistance. T. mongolica lied in the right top corner of figure, suggesting T. mongolica have both high hydraulic conductance and high threshold for cavitation. The same pattern could be found if the xylem hydraulic safety were represented by P88 (Figure S1).

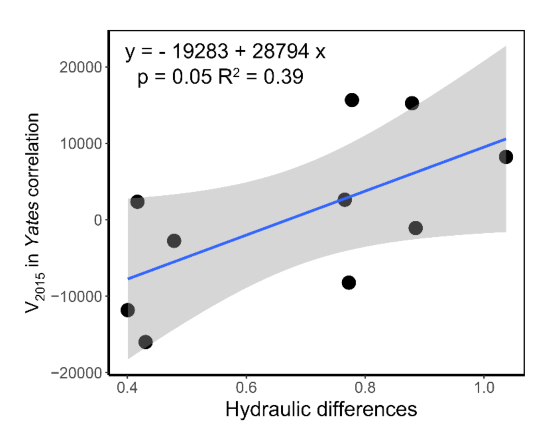
3.3. The Relationship between Interspecific Association and Species Hydraulic Strategy

The correlation between interspecific association indices and distances between species pairs calculated by hydraulic traits, Kl and P50, were generally positive, but not significant. The one between Canberra distance and V value in Yates correlation in 2015 was significant (Figure S2). By linear regression, V2015 could be predicted by Canberra distance with the model V2015 = −19,283 + 28,794 × Canberra distance (Figure 6, p = 0.05, R2 = 0.39). About 40% of the variance of interspecific association could be explained by the interspecific differences on hydraulic strategies in the forest we studied (Figure 6).

4. Discussion

Divergent hydraulic strategies can partly explain interspecific associations among tree species co-occurring in the temperate forest–steppe ecotone. The overall species associations within the forest were not significant in either years, suggesting the absence of species mutual exclusion caused by intensive interspecific competition in the plant community. The divergent hydraulic strategies illustrated that different water-use strategies may be a way trees avoid competition over water absorption, which was the primary limitation for the forests in forest–steppe ecotone [8,27]. The strong negative association within the forest occurred between P. davidiana and B. platyphylla, as well as P. davidiana and B. dahurica, indicating the strong interspecific competitions. The hydraulic strategies of these two species pairs were the least divergent ones. The efficient and safe hydraulic strategy of T. mongolica can explain the increase in abundance of T. mongolica during the studied years. In general, the positive relationship between interspecific association and hydraulic differences supported the previous hypotheses.
The divergent hydraulic strategies can reduce water stress among co-occurring species thus maintain the stability and species diversity of the forest community in drying forest–steppe ecotone. At the species level, divergent hydraulic strategies can reduce the interspecific competition for water resources. Species with higher water-transport efficiency can adopt more aggressive water absorbing strategies: trees can absorb and store as much water as possible after rainfall. Alternatively, species with strong water deficit tolerance can make use of small amounts of soil water in the long term. At the community level, the co-occurrence of species with divergent hydraulic strategies in forest–steppe ecotone can enlarge the moisture niche for tree species and increase the maintenance of semiarid forests. Thus, the divergent hydraulic strategies allow semiarid forests to maintain the same level of tree diversity with very large regional water supply differences. For example, the tree diversity in our study area with mean annual precipitation of 350 mm is quite similar to the ones with mean annual precipitation of 500–650 mm [19]. The maintaining of species diversity is increasingly important given that the forest–steppe ecotone is facing a drier and more variable climate in the future [28,29]. Divergent hydraulic strategies allow species to occupy moisture niches with many kinds of physical conditions such as slopes, aspects and soil textures [30]. However, we still lack the knowledge to determine water absorbing, storing and utilizing patterns for each species, which is urgently needed for forest dynamic studies and forest managements. Thus, enhanced long-term monitoring of plant physiological traits is needed in the forest–steppe ecotone in the future.
In contrast to the divergent hydraulic strategies, co-occurring species have convergent sensitivity to early stages of drought. The convergent P12 values of all the species except Q. mongolica indicate that the threshold for plant water uptake in response to early stages of drought [26] may be determined by the environment instead of the species. The convergent drought sensitivity can be explained by the hypothesis that plants tend to maximize their physiological functions at the edge of their environmental water limitation, which was put forward in a global meta-analysis for the hydraulic safety margin [31]. Only the “riskiest” approach does allow trees to maximize their carbon gains and biomass increase under normal water supply [31]. Moreover, the species with less safe hydraulic strategies must have some other strategies for drought tolerance or resilience improving, as all the species are facing the same level of drought and are similarly sensitive to the early stages of drought. The suckering regeneration strategy [21,32,33] seems to be a more important strategy for P. davidiana than the hydraulic strategies for its long-term survival in forest–steppe ecotone. The severe tree mortality during 2011 and 2012 can be explained by the neither safe nor highly efficient hydraulic strategy of P. davidiana in our results, while the rapid regeneration after drought events ensured the regrowth phase of P. davidiana instead of the succession to other species [21].

5. Conclusions

Our results revealed the linkage between plant hydraulic strategies and the interspecific associations of co-occurring trees in forest–steppe ecotone. Though missing some environmental data to fully investigate the relationships between the tree species and environment water resource supply, this study pointed out the important rule of plant physiology in the forest composition and dynamics, laying the foundation for further scientific exploration and data collection.

Supplementary Materials

The following are available online at https://0-www-mdpi-com.brum.beds.ac.uk/1999-4907/11/9/942/s1, Figure S1: The relationship between stem hydraulic transportation efficiency and safety (as measured by the water potential of stems at 88% loss of stem conductivity, P88) of all species, Figure S2: Spearman correlation between the interspecific association pattern and the hydraulic tradeoff differences among species.

Author Contributions

Conceptualization, H.L. and J.D.; methodology, J.D.; investigation, J.D., C.X., Y.Q., X.Z., B.L. and Y.W.; resources, M.Z.; data curation, J.D.; writing—original draft preparation, J.D.; writing—review and editing, J.D.; visualization, J.D.; supervision, H.L.; project administration, H.L.; funding acquisition, H.L. All authors have read and agreed to the published version of the manuscript.

Funding

This research was funded by National Natural Science Foundation of China, Grant Number 41530747, 41790422.

Acknowledgments

We are grateful to Guangyou Hao for his teaching in laboratory measurements and permission to use his laboratory facilities.

Conflicts of Interest

The authors declare no conflict of interest.

References

  1. Rotenberg, E.; Yakir, D. Contribution of semi-arid forests to the climate system. Science 2010, 327, 451–454. [Google Scholar] [CrossRef]
  2. Xu, C.; Liu, H.; Anenkhonov, O.A.; Korolyuk, A.Y.; Sandanov, D.V.; Balsanova, L.D.; Naidanov, B.B.; Wu, X. Long-term forest resilience to climate change indicated by mortality, regeneration, and growth in semiarid southern Siberia. Glob. Chang. Biol. 2017, 23, 2370–2382. [Google Scholar] [CrossRef] [PubMed]
  3. Allen, C.D.; Macalady, A.K.; Chenchouni, H.; Bachelet, D.; McDowell, N.; Vennetier, M.; Kitzberger, T.; Rigling, A.; Breshears, D.D.; Hogg, E.H.; et al. A global overview of drought and heat-induced tree mortality reveals emerging climate change risks for forests. For. Ecol. Manag. 2010, 259, 660–684. [Google Scholar] [CrossRef] [Green Version]
  4. Erdos, L. The edge of two worlds: A new review and synthesis on Eurasian forest-steppes. Appl. Veg. Sci. 2018, 21, 345–362. [Google Scholar] [CrossRef]
  5. Chun-yu, Y.; Shao-fei, L.I.U.; Li-fei, Y.U. Interspecific associations of dominant tree species with restoration of a karst forest. J. Zhejiang AF Univ. 2010, 27, 44–50. [Google Scholar]
  6. Liu, Z.; Zhu, Y.; Wang, J.; Ma, W.; Meng, J. Species association of the dominant tree species in an old-growth forest and implications for enrichment planting for the restoration of natural degraded forest in subtropical China. Forests 2019, 10, 957. [Google Scholar] [CrossRef] [Green Version]
  7. Xie, T.; Tian-Zhen, J.U.; Shi, H.X.; Fan, Z.H.; Yang, G.K.; Zhang, S.Z. Interspecific association of rare and endangered Pinus bungeana community in Xiaolongshan of Gansu. Chin. J. Ecol. 2010, 29, 448–453. [Google Scholar]
  8. Liu, H.; Park Williams, A.; Allen, C.D.; Guo, D.; Wu, X.; Anenkhonov, O.A.; Liang, E.; Sandanov, D.V.; Yin, Y.; Qi, Z.; et al. Rapid warming accelerates tree growth decline in semi-arid forests of Inner Asia. Glob. Chang. Biol. 2013, 19, 2500–2510. [Google Scholar] [CrossRef]
  9. Nardini, A.; Pitt, F. Drought resistance of Quercus pubescens as a function of root hydraulic conductance, xylem embolism and hydraulic architecture. New Phytol. 1999, 143, 485–493. [Google Scholar] [CrossRef]
  10. Zimmermann, M.H. Hydraulic architecture of some diffuse-porous trees. Can. J. Bot. 1978, 56, 2286–2295. [Google Scholar] [CrossRef] [Green Version]
  11. Carvalho, E.C.D.; Martins, F.R.; Soares, A.A.; Oliveira, R.S.; Muniz, C.R.; Araujo, F.S. Hydraulic architecture of lianas in a semiarid climate: Efficiency or safety? Acta Bot. Bras. 2015, 29, 198–206. [Google Scholar] [CrossRef]
  12. Sperry, J.S.; Meinzer, F.C.; Mcculloh, K.A. Safety and efficiency conflicts in hydraulic architecture: Scaling from tissues to trees. Plant Cell Environ. 2008, 31, 632–645. [Google Scholar] [CrossRef] [PubMed]
  13. Kondoh, S.; Yahata, H.; Nakashizuka, T.; Kondoh, M. Interspecific variation in vessel size, growth and drought tolerance of broad-leaved trees in semi-arid regions of Kenya. Tree Physiol. 2006, 26, 899–904. [Google Scholar] [CrossRef] [PubMed] [Green Version]
  14. Cruiziat, P.; Cochard, H.; Ameglio, T. Hydraulic architecture of trees: Main concepts and results. Ann. For. Sci. 2002, 59, 723–752. [Google Scholar] [CrossRef] [Green Version]
  15. Hao, G.Y.; Lucero, M.E.; Sanderson, S.C.; Zacharias, E.H.; Holbrook, N.M. Polyploidy enhances the occupation of heterogeneous environments through hydraulic related trade-offs in Atriplex canescens (Chenopodiaceae). New Phytol. 2013, 197, 970–978. [Google Scholar] [CrossRef]
  16. Choat, B.; Brodribb, T.J.; Brodersen, C.R.; Duursma, R.A.; Lopez, R.; Medlyn, B.E. Triggers of tree mortality under drought. Nature 2018, 558, 531–539. [Google Scholar] [CrossRef]
  17. Sperry, J.S.; Love, D.M. What plant hydraulics can tell us about responses to climate-change droughts. New Phytol. 2015, 207, 14–27. [Google Scholar] [CrossRef]
  18. Gebauer, R.L.E.; Schwinning, S.; Ehleringer, J.R. Interspecific competition and resource pulse utilization in a cold desert community. Ecology 2002, 83, 2602–2616. [Google Scholar] [CrossRef]
  19. Jiang, Z.H.; Ma, K.M.; Anand, M.; Zhang, Y.X. Interplay of temperature and woody cover shapes herb communities along an elevational gradient in a temperate forest in Beijing, China. Community Ecol. 2015, 16, 215–222. [Google Scholar] [CrossRef] [Green Version]
  20. Zeng, N.; Yao, H.X.; Zhou, M.; Zhao, P.W.; Dech, J.P.; Zhang, B.; Lu, X. Species-specific determinants of mortality and recruitment in the forest-steppe ecotone of northeast China. For. Chron. 2016, 92, 336–344. [Google Scholar] [CrossRef]
  21. Zhao, P.W.; Xu, C.Y.; Zhoul, M.; Zhang, B.; Ge, P.; Zeng, N.; Liu, H.Y. Rapid regeneration offsets losses from warming-induced tree mortality in an aspen dominated broad-leaved forest in northern China. PLoS ONE 2018, 13, e0195630. [Google Scholar] [CrossRef] [PubMed]
  22. Wheeler, J.K.; Huggett, B.A.; Tofte, A.N.; Rockwell, F.E.; Holbrook, N.M. Cutting xylem under tension or supersaturated with gas can generate PLC and the appearance of rapid recovery from embolism. Plant Cell Environ. 2013, 36, 1938–1949. [Google Scholar] [CrossRef] [PubMed]
  23. Venturas, M.D.; MacKinnon, E.D.; Jacobsen, A.L.; Pratt, R.B. Excising stem samples underwater at native tension does not induce xylem cavitation. Plant Cell Environ. 38, 1060–1068. [CrossRef] [PubMed]
  24. Zwieniecki, M.A.; Holbrook, N.M. Diurnal variation in xylem hydraulic conductivity in white ash (Fraxinus americana L.), red maple (Acer rubrum L,) and red spruce (Picea rubens Sarg,). Plant Cell Environ. 1998, 21, 1173–1180. [Google Scholar] [CrossRef] [Green Version]
  25. Alder, N.N.; Pockman, W.T.; Sperry, J.S.; Nuismer, S. Use of centrifugal force in the study of xylem cavitation. J. Exp. Bot. 1997, 48, 665–674. [Google Scholar] [CrossRef] [Green Version]
  26. Bartlett, M.K.; Klein, T.; Jansen, S.; Choat, B.; Sack, L. The correlations and sequence of plant stomatal, hydraulic, and wilting responses to drought. Proc. Natl. Acad. Sci. USA 2016, 113, 13098–13103. [Google Scholar] [CrossRef] [Green Version]
  27. Dulamsuren, C.; Hauck, M.; Leuschner, C. Recent drought stress leads to growth reductions in Larix sibirica in the western Khentey, Mongolia. Glob. Chang. Biol. 2010, 16, 3024–3035. [Google Scholar] [CrossRef]
  28. Seager, R.; Vecchi, G.A. Greenhouse warming and the 21st century hydroclimate of southwestern North America. Proc. Natl. Acad. Sci. USA 2010, 107, 21277–21282. [Google Scholar] [CrossRef] [Green Version]
  29. Piao, S.L.; Ciais, P.; Huang, Y.; Shen, Z.H.; Peng, S.S.; Li, J.S.; Zhou, L.P.; Liu, H.Y.; Ma, Y.C.; Ding, Y.H.; et al. The impacts of climate change on water resources and agriculture in China. Nature 2010, 467, 43–51. [Google Scholar] [CrossRef]
  30. Chesson, P.; Gebauer, R.L.E.; Schwinning, S.; Huntly, N.; Wiegand, K.; Ernest, M.S.K.; Sher, A.; Novoplansky, A.; Weltzin, J.F. Resource pulses, species interactions, and diversity maintenance in arid and semi-arid environments. Oecologia 2004, 141, 236–253. [Google Scholar] [CrossRef]
  31. Choat, B.; Jansen, S.; Brodribb, T.J.; Cochard, H.; Delzon, S.; Bhaskar, R.; Bucci, S.J.; Feild, T.S.; Gleason, S.M.; Hacke, U.G.; et al. Global convergence in the vulnerability of forests to drought. Nature 2012, 491, 752–755. [Google Scholar] [CrossRef] [PubMed] [Green Version]
  32. Landhausser, S.M.; Wachowski, J.; Lieffers, V.J. Transfer of live aspen root fragments, an effective tool for large-scale boreal forest reclamation. Can. J For. Res 2015, 45, 1056–1064. [Google Scholar] [CrossRef]
  33. Mitton, J.B.; Grant, M.C. Genetic variation and the natural history of quaking aspen. Bioscience 1996, 46, 25–31. [Google Scholar] [CrossRef] [Green Version]
Figure 1. Study area location and site characteristics. (a) Location of the study area in China; (b) landscape of semiarid forest–steppe ecotone in which the study area lies; (c) sketch of the plot (shown in green polygon) and quadrats containing sampled trees for hydraulic architecture measurements (shown as yellow squares). Each quadrat has an area of 100 m2; (d) landscape photography of the study area showing the mosaic distribution of forest (dark green patches) and grassland (light green patches); (e) amount of each tree species in 2012 (shown in blue) and 2015 (shown in orange); (f) schematic picture showing the forest structure within the plot.
Forests 11 00942 g001
Figure 2. Principle component analysis (PCA) showing the interspecific associations among main species in the forest in 2012 and 2015. Arrows show the load of each species on each principle components. Dots indicate the PCA scores for the quadrats. Color of the dots represents the location of the quadrats along the altitude.
Forests 11 00942 g002
Figure 3. Leaf-specific hydraulic conductivity (Kl) of the co-occurring species are shown in the bar figure. Error bars show ± 1 SE. Different characters show the significant differences according to a variance analysis (p < 0.05).
Forests 11 00942 g003
Figure 4. (a) Comparison of the water potential of stems at 12%, 50% and 88% loss of stem conductivity (P12, P50 and P88, respectively) of each species. The different characters indicate the significant differences among the thresholds of each species based on variance analysis; (bf) Vulnerability curves are shown as the dynamic of percent loss of stem hydraulic conductivity in response to centrifugal-force xylem tension for each tree species. Gray curves are fitted by each sample, while the black curves are fitted by the mean values. For each species, P12, P50 and P88 are shown as the single-dashed, solid and double-dashed vertical lines, respectively.
Forests 11 00942 g004
Figure 5. Relationship between stem hydraulic transportation efficiency (as measured by leaf-specific hydraulic conductivity, Kl) and safety (as measured by the water potential of stems at 50% loss of stem conductivity, P50) of all species. Error bars show ± 1 SE.
Forests 11 00942 g005
Figure 6. Relationship between hydraulic differences of each pair of species and their interspecific associations, represented by Canberra distance and V2015 in Yates correlation tests, respectively. Blue line shows the linear model result, while the gray region shows the confidence interval.
Forests 11 00942 g006
Table 1. Yates correlations and Ochiai indices showing interspecific associations among main species in the forest in 2012 and 2015.
SpeciesYates CorrelationOchiai Index
V2012χ22012V2015χ22015OI2012OI2015
P. davidianaB. platyphylla−12,38431.80−15,99834.440.390.38
P. davidianaB. dahurica−48162.74−11,81812.740.520.50
P. davidianaQ. mongolica−894410.07−10830.070.560.70
P. davidianaT. mongolica1720.13−822714.450.050.21
B. platyphyllaB. dahurica11,59224.8315,66127.450.680.67
B. platyphyllaQ. mongolica903615.0926200.730.730.75
B. platyphyllaT. mongolica−4200.6523531.180.000.33
B. dahuricaQ. mongolica17,69336.2615,24620.700.640.64
B. dahuricaT. mongolica−2390.01822012.010.000.33
Q. mongolicaT. mongolica2230.02−27561.340.060.26

