New Topsoil Sampler for the Assessment and Monitoring of Forest Soil Contamination


Institute of Soil Science and Environmental Protection, Wroclaw University of Environmental and Life Sciences, Grunwaldzka 53, 50-375 Wroclaw, Poland
*
Author to whom correspondence should be addressed.
Forests 2021, 12(1), 79; https://0-doi-org.brum.beds.ac.uk/10.3390/f12010079
Submission received: 1 January 2021
/
Revised: 10 January 2021
/
Accepted: 11 January 2021
/
Published: 13 January 2021
(This article belongs to the Special Issue Soil Properties, Quality Monitoring and Restoration in Forest Ecosystems)
Abstract
:The forest litter and underlying mineral topsoil are typically sampled and analyzed separately although they are in a dynamic balance, which ensures macro- and microelement cycling in the forest ecosystem, including the flux and accumulation of xenobiotics in the contaminated sites. Although the national legal regulations specify single limits of element concentration for the entire “topsoil” layer, irrespectively of the kind of materials resting at the earth surface down to the specified depth, the direct analysis of bicomponent forest topsoil (litter + mineral topsoil) was problematic because of the lack of a suitable sampler. The paper presents a comparative analysis of Cu, Pb, and Zn concentrations in the forest topsoil layers (0–25 cm), sampled using a new construction sampler invented for a joint collection of the litter layer and underlying mineral layer (to the specified depth). Litter samples (using a steel frame), mineral topsoil samples (0–25 cm, using gouge auger after litter removal), and mixed topsoil samples (0–25 cm, including litter) were collected in 16 replicates from four variably contaminated plots (copper mining and smelting area) afforested with poplar or pine. Pseudo-total concentration of Cu, Pb, and Zn was analyzed after sample digestion in aqua regia. The concentration of elements in the samples consisting of jointly collected litter and mineral layer was noticeably higher than in the samples consisting of the mineral topsoil only, which confirmed the effective inclusion of the litter. The concentrations of trace elements measured in the samples of jointly collected litter and mineral topsoil did not differ (NIR Fisher test at p < 0.05) from the concentrations calculated using the data for litter and mineral soil separately collected and analyzed, which confirmed the usefulness of the new sampler for reliable collection of the forest topsoil samples without skipping any material which may influence the results of soil contamination assessment and risk assessment.
1. Introduction
Soil sampling strategies and techniques depend on the aim of an investigation, land use, ecosystem and soil type, and available budget [1,2]. The most common objective of forest soil sampling, mainly from topsoil layers, is to provide reliable information about soil fertility and productivity [3], effects of forest management [4,5,6], and soil contamination with various substances [7,8,9,10,11,12]. Forest soils are also common objects of studies on water cycling, quality and retention [13,14], and carbon cycling and sequestration in relation to climate change [15,16,17]. Beside the unique scientific projects and problem-oriented inventories, large scale monitoring programs (i.e., on a regional, national, and continental scale) were launched to determine both the spatial and temporal trends in relation to environmental factors and human impacts [18,19,20,21].
Where the observation of the temporal variation has a priority, it is essential to minimize the impact of spatial variability and maximize the reliability of the mean values for the representative plots [1,22]. The typical solution is a respectively high number of primary samples (replicates) from the plot, fitted to the expected or observed local variability [2,23]. However, one of the most important sources of topsoil variability in forest soils is litter, a key component of forest humus that may occur in a wide range of forms, depending on soil trophic status, forest stand composition and age, climate and altitude, as well as an ecosystem balance/transformation related to anthropic impacts (e.g., management or pollution) [24,25]. Forest litter, depending on the humus form, may have little thickness (as in a case of mull humus) or even more than 20 cm and noticeable layerin, as in the case of mor humus [26]. Thus, forest litter may have variable physico-chemical and biological properties [7,27] and may influence the rates of nutrient cycling [28], carbon sequestration [29], soil acidification and base leaching [5,30]. Therefore, the forest litter may influence the direction and rate of soil formation or transformation [31,32]. Moreover, the surface organic layer may accumulate trace metals and other xenobiotics from industrial or traffic emissions [33,34,35,36,37,38] and, therefore, must be included in the ecological and health risk assessments [39,40,41].
Forest litter and mineral topsoil differ in their physical forms and are, thus, most commonly, separately sampled and analyzed, sometimes using different laboratory protocols [5,16,30,37,38,42,43,44,45]. Alternatively, even in the contaminated sites, the litter layer is omitted and only the mineral topsoil is sampled and analyzed [7,9,11,27,32,34,39,46]. The legal regulations (national soil quality standards) commonly distinguish different contamination levels for arable and forest sites. However, they do not specify separate limits for forest litter and mineral topsoil but do specify a single baseline for the “topsoil” layer, most commonly for the depth of 0–20, 0–25 or 0–30 cm [47,48,49]. Depending on the “soil” and “humus” definitions in particular countries, forest litter is included or excluded from the “soil”. This generates further questions about the “zero depth” in the soil profile and the involvement of the litter layer thickness into the specified thickness of the “topsoil” layer. It is clear that the complete risk assessment should include all surface layers, because each of them may be a source of risk, respectively to the kind of contamination, risk type (ecological or health risk), and the exposure path [39,40,49,50,51]. Due to the decomposition and bioturbation, the litter is in a dynamic balance with the underlying mineral topsoil, and there is no reason to exclude it from the contamination assessment [18,42]. Unfortunately, there is no available device (sampler) or sampling technique which allows joint sampling of the litter and mineral topsoil as one sample. The simple spade sampling and standard professional samplers for mineral soils do not solve one or both technical problems, that is, they (a) are unable to set the “zero” depth if litter is present, and (b) are unable to tightly cut the litter and collect it proportionally to the thicknesses of organic and mineral sublayers within a sampled interval.
The aim of the present study was to test the applicability of a new kind of soil sampler, originally invented, which allows a simultaneous (joint), proportional sampling of the litter and mineral layers considered as an inseparable forest “topsoil” in the context of legal quality standards.
2. Materials and Methods
The sampler was tested on four variably contaminated plots located in an area influenced by copper ore mining and smelting in south-west Poland, where the soil contamination was previously assessed using variable techniques [11,52,53]. The plots HML1 and HML2 were located ca. 300 and 2000 m from the copper smelter, respectively, on Haplic Luvisols developed from loess, formerly arable and afforested with poplar (Populus spp.) in the early 1980s [14,54]. The plots ZM3 and ZM4 were located ca. 300 and 500 m from the central tailings impoundment, respectively, on Brunic Arenosols developed from glaciofluvial sands, which were previously arable and afforested with pine (Pinus sylvestris L.) in the late 1990s [6,22].
On each plot, 16 sampling sites (as 16 replicates) were located in a square grid (2 m distance between sampling sites) to quantify the variability within the plot and to get reliable data for the comparison of the results of various sampling techniques. In each sampling site, three samples were collected for further analyses. Forest litter (L) was collected using a stainless-steel cylinder frame (diameter 20 cm). The natural thickness of litter was noticed in each sampling site after averaging of at least five measurements. After litter sampling (i.e., complete removal of the organic layer within the frame), the mineral topsoil (T) was sampled from the depth 0–25 cm (as required by [49]) using the gouge auger (diameter 5 cm, working length 30 cm) provided by Eijkelkamp (Figure 1A). This means the “zero depth” for the T sample was at the mineral soil surface, and the sample consisted of the mineral topsoil only. In the direct neighborhood of the frame, the joint litter + topsoil sample (TLs) was collected from the depth 0–25 cm, where the “zero depth” was at the surface of the litter layer, using a 25 cm long stainless-steel sampler, 5 × 5 cm in cross section (Figure 1B,C). The sampler had (a) a flat, horizontal upper wall of the working section, which compacted the litter layer during sampling, and (b) a transverse bar welded directly above the working section of the sampler, which controlled the depth of sampler insertion (Figure 1B). The edges of the sampler walls were tightly sharpened to precisely cut the litter, irrespectively of the structure of the organic matter (important in the case of fibrous litters). The rotation of the sampler inserted into the soil was impossible because of its square cross-section. Thus, after complete sampler insertion, the standard spade (at least 25 cm long) was driven to soil along the open (front) wall of the sampler to cut the sampled soil and to dig the free space in front of the sampler (Figure 1D), which allowed sampler tilting and safe removal without any loss of the collected sample (Figure 1E). Typically, the sampler was fully inserted “manually” (in fact using the leg pressure on the lower crossbar as a footstep) to the depth of 25 cm. However, in some dry silty soils, the use of hammer was necessary to reach the last 2–3 cm (the use of hammer was typically required to insert the gouge auger without the footsteps, Figure 1A). The sampler construction is currently under the patent application procedure in the Patent Office of Poland.
Moreover, to characterize the changes in soil properties and contamination with depth, which may influence the results of investigation at different sampling depths, disturbed soil samples were collected from the layers 0–5, 5–10, 10–15, 15–20, 20–25, and 25–30 cm in four replicates (then mixed to obtain a representative sample) on each plot. The entire volume of soil in the above-mentioned depth increments (starting from the soil surface) was collected by spade from additionally prepared microprofiles. Additionally, undisturbed samples were collected from the same layers, using the steel cylinders (Kopecky type), to measure the soil bulk density. The “zero depth” for this sampling was at the mineral soil surface, as in the case of the T samples.
All samples were dried at a temperature of 50 °C to a constant weight. L samples were ground to pass the 2 mm sieve and partitioned to obtain the analytical samples (ca. 50 g), which were further ground to pass the 0.1 mm sieve. T and TLs samples were crushed and then manually ground and sieved to separate the skeletal fraction (>2 mm) if present. All larger organic fragments remaining on the sieve (if any) were collected, separately ground, and returned to respective soil samples. After thorough mixing and partitioning, the derived analytical soil samples (ca. 100 g) were ground to pass 0.1 mm sieve.
The following analyses were conducted in all samples using the methods as described by [55]: soil pH in distilled water, potentiometrically (Mettler Toledo Seven Multi S47), at a soil:water ratio of 1:2.5 v/v; soil organic carbon (SOC)—by high-temperature catalytic combustion (Elementar Analysensysteme Vario MACROcube); samples were free of carbonates, the measured total carbon was equal to SOC; pseudo-total concentration of Cu, Pb, and Zn—by microwave plasma atomic emission spectrophotometry (Agilent Technologies 4200 MP-AES) after sample digestion with aqua regia (3:1 hydrochloric acid:nitric acid) in aluminium heating block (VELP Scientifica Heating Digester DKL20). Soil digestion was made in triplicate. Blank (reagent) samples and reference soil/sludge samples (BCR–142R, BCR–277R, BCR–280R, ERM–CC136a) were used to control the quality of analysis. Particle-size distribution was measured in the mineral samples collected in the 5 cm increments, using the sieves (for sand fraction) and hydrometer (for silt and clay), after organic matter removal and sample dispersion with Na-hexametaphosphate. Bulk density was measured by weighing the samples in steel cylinders after drying in a temperature of 105 °C to a constant weight (according to [56]).
To check the reliability of a new sampler, which provides the data for mixed samples of topsoil and litter collected jointly, the concentration of elements was calculated based on the separate results for L (litter) and T (mineral topsoil) samples, where the thickness of a mineral part in a combination was reduced by litter thickness:
where CTL is calculated element concentration in a two-component topsoil layer (mg kg−1); CL is element concentration in litter as measured in L samples (mg kg−1); CT is element concentration in mineral topsoil layer, as measured in T samples (mg kg−1); ML is mass of the litter layer on a 1 m2 surface (kg); MT is the mass of the mineral topsoil on a 1 m2 surface (kg); and where MT was calculated using Equation (2):
where dv is bulk density of mineral topsoil averaged for the layer 0–25 cm (g cm−3), hL is thickness of the litter layer (cm), 25 is the total thickness of the topsoil sample, and 10 is the unit recalculation factor.
CTL = [(CL × ML) + (CT × MT)]/(ML + MT)
MT = dv × (25 − hL) × 10
Nearly all measured variables (from individual plots) had the normal distribution (checked by Shapiro–Wilk test), thus the mean values, standard errors, and standard deviations were calculated to characterize the central tendency and data dispersion. Correlation coefficients were calculated using the Pearson algorithm. Significance of differences between means was checked using the post-hoc NIR Fisher test at p < 0.05. All calculations were performed using the Statistica 13 package.
3. Results
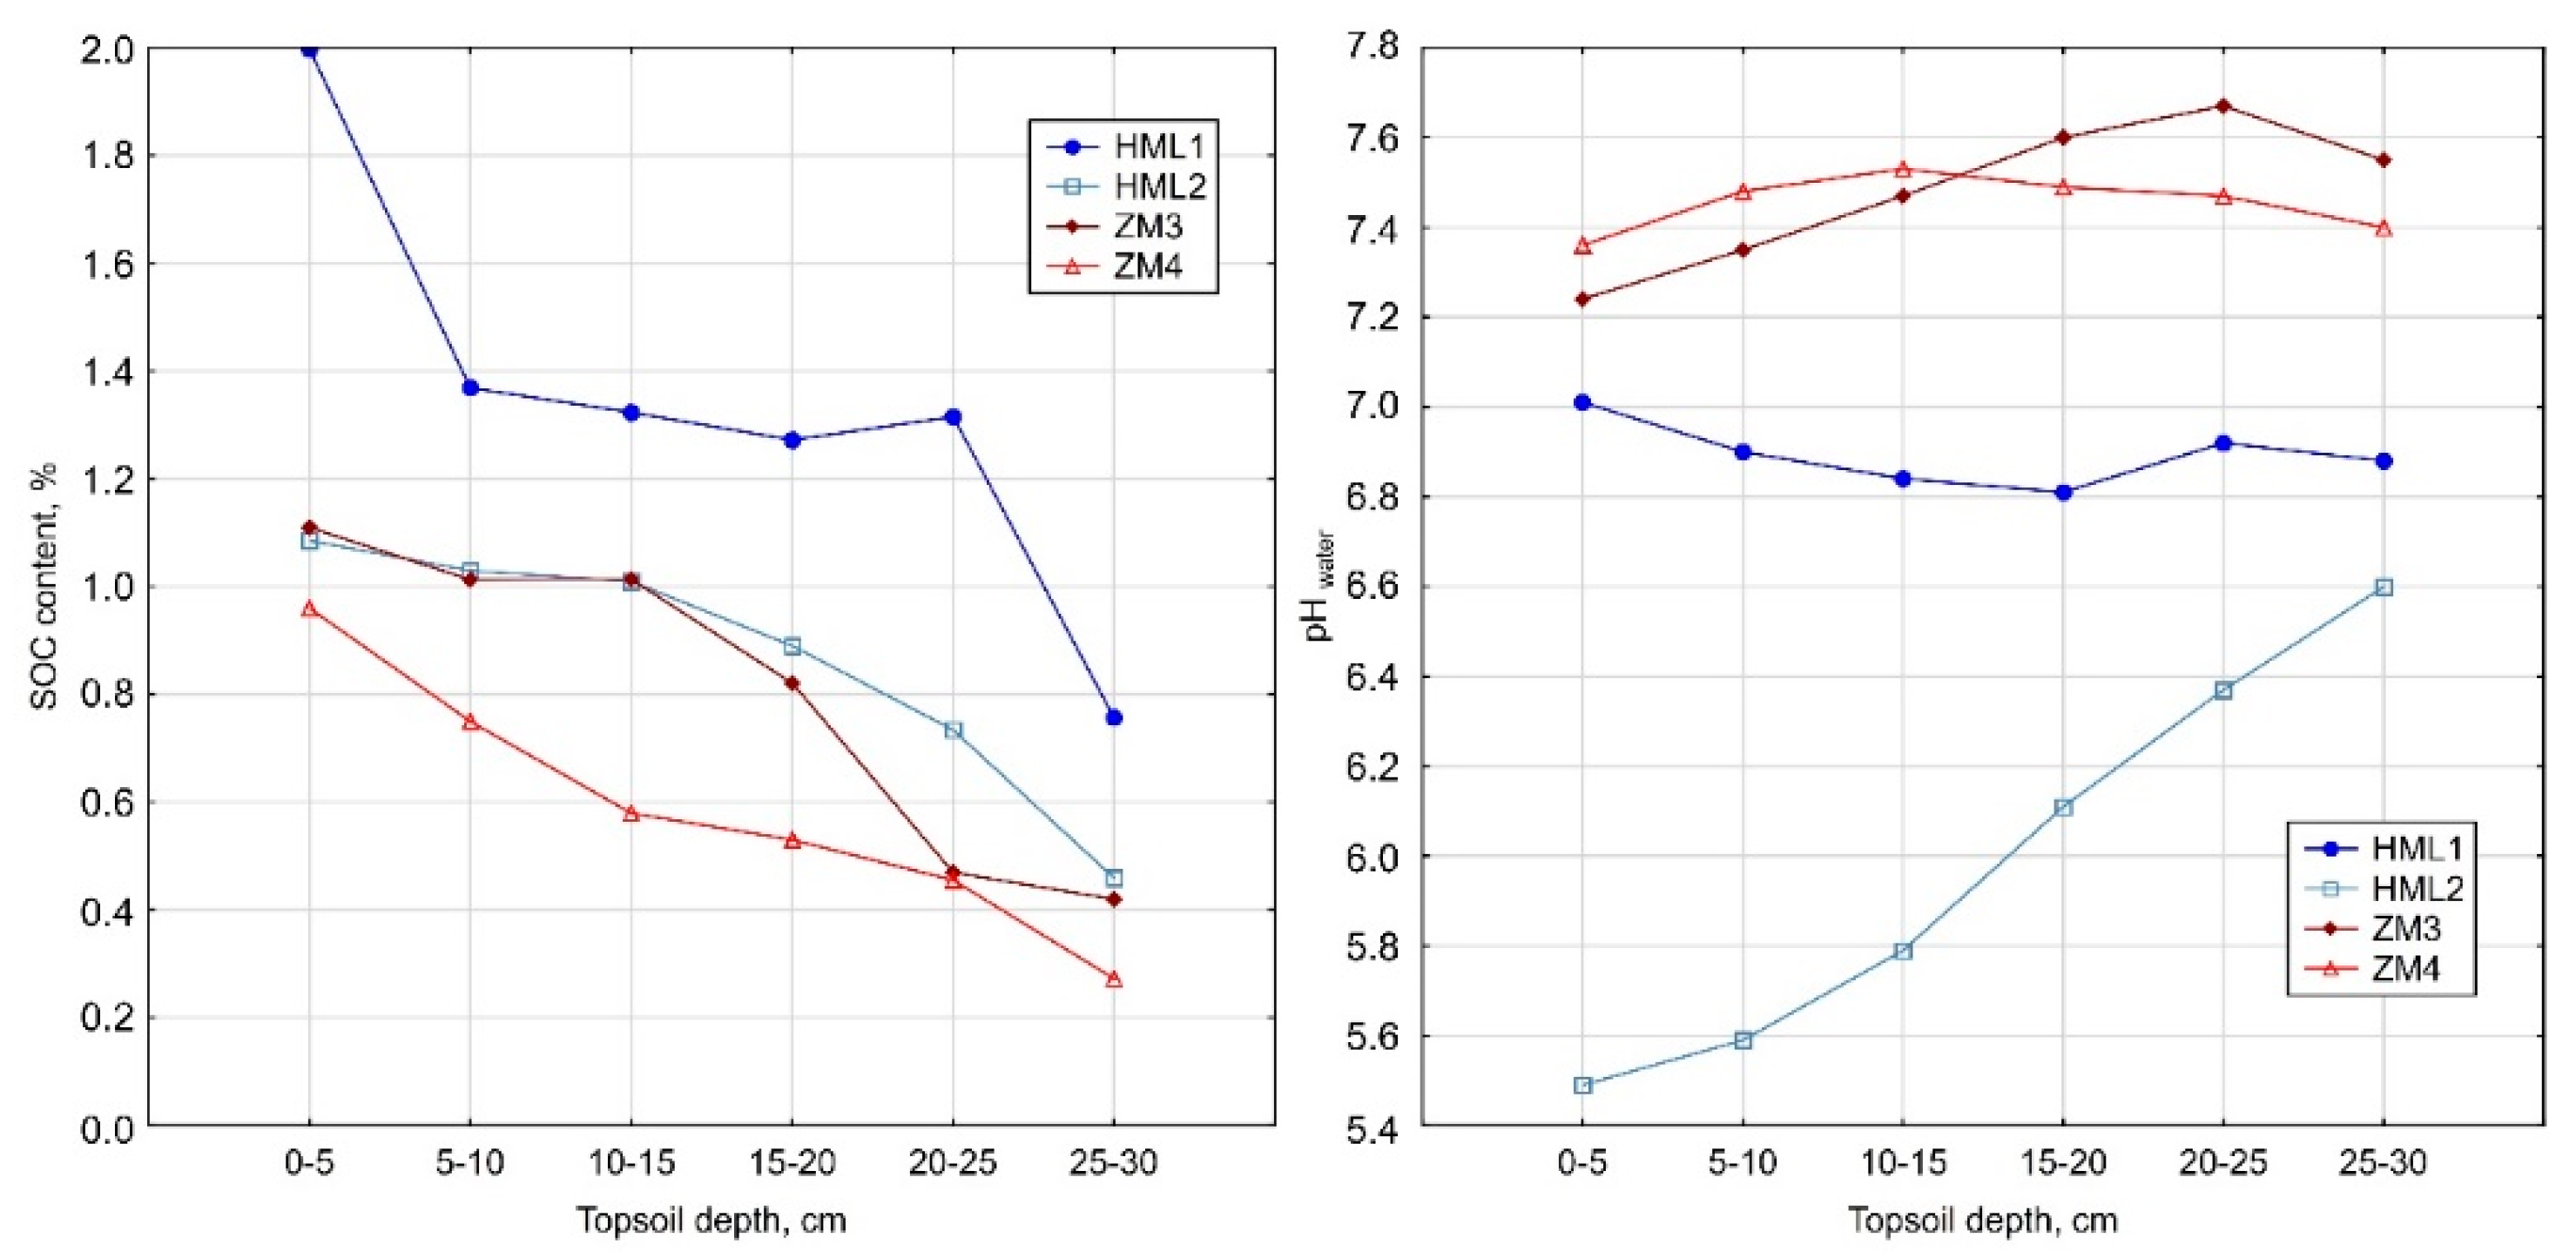
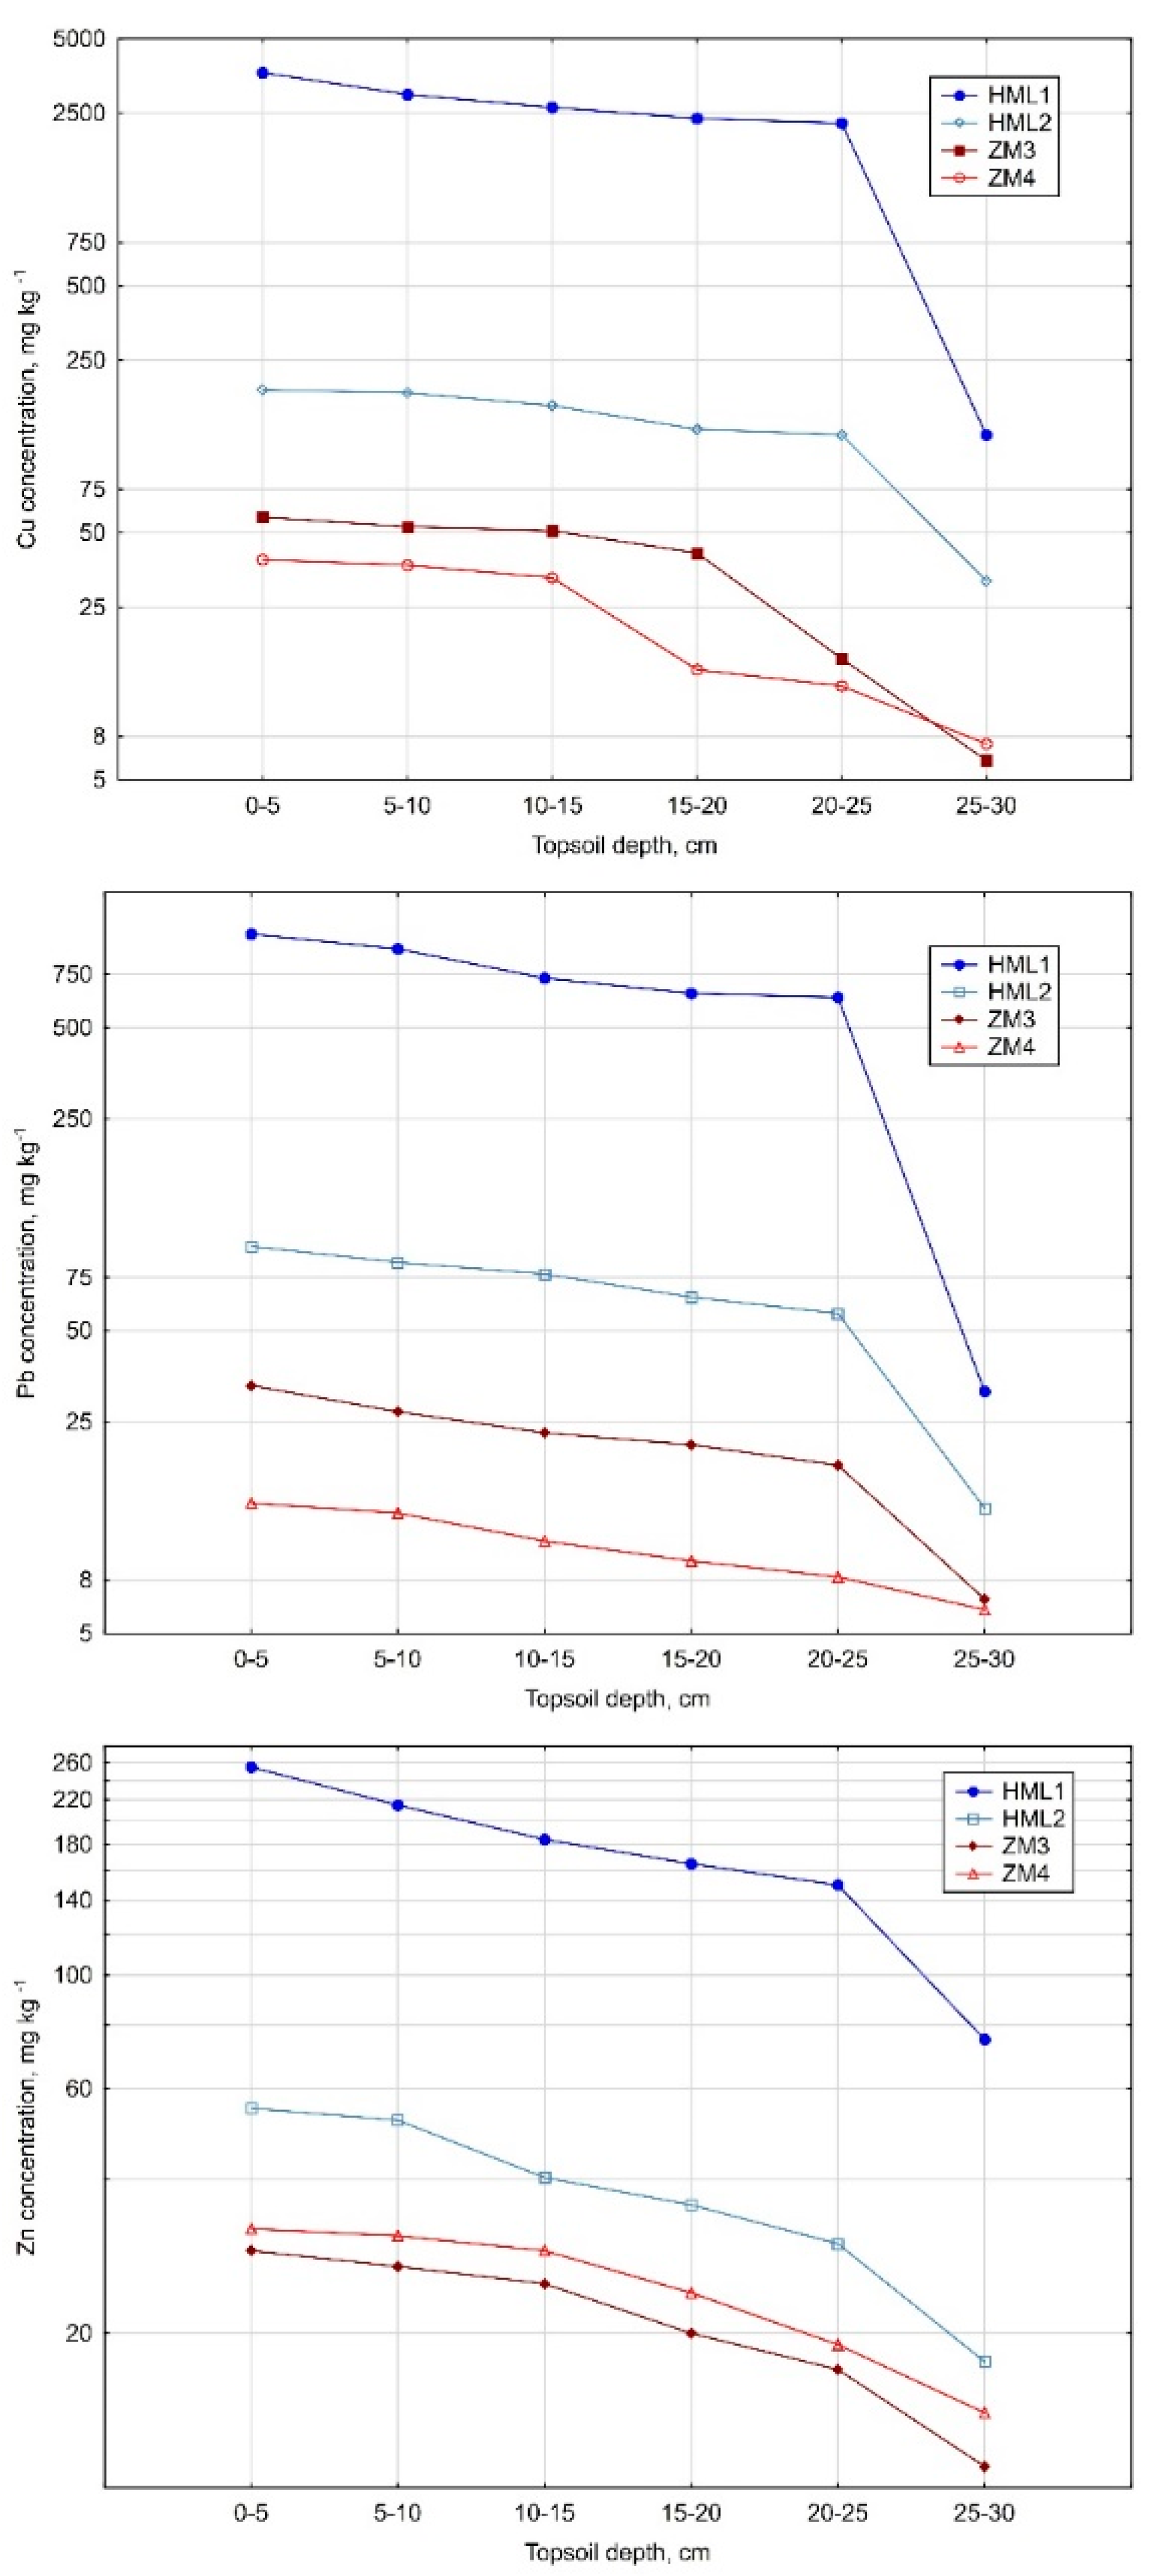
Soils selected for a comparative analysis significantly differed in texture, physicochemical properties, and contamination level. All soils were arable before their afforestation in the 1980s–1990s, thus thick (22–26 cm) plough layers were still easily recognizable in the profiles by their sharp (HML1 and HML2 plots) or clear (ZM3 and ZM4 plots) transition to subsoil. Soils of the plots HML1 and HML2 had the texture class of silt loam: in ZM3, sand, and in ZM4, loamy sand (Table 1). The SOC content was differentiated in the topsoil layers, i.e., was noticeably uplifted in the sublayer 0–5 cm in all plots and then subsequently decreased with depth, excluding the plot HML1, where SOC content was relatively stable below the depth of 5 cm until the depth of 20–25 cm (Figure 2). The decrease of SOC was abrupt or at least more rapid below the depth 20 or 25 cm, i.e., below the former ploughing limit. Soil pH was neutral or slightly alkaline and relatively stable throughout the topsoil layer in the plots HML1 and ZM4, slightly increasing with depth in ZM3 and noticeably increasing with depth, i.e., clearly acidified in the near-surface sublayers, in HML2 (Figure 2). The topsoil contamination with Cu and Pb in the plots under study was in the following order: HML1 >> HML2 > ZM3 > ZM4. For Zn, it was HML1 >> HML2 > ZM4 > ZM3 (Table 1). In all cases, it decreased with depth (please note the logarithmic scale of Y axis) (Figure 3). The largest decrease (often abrupt) was documented directly below the depth of 25 cm, which may have a significant influence on the results of topsoil contamination assessment at different sampling depths.
The L (litter) layer, characterized in early September, i.e., before an autumn leaf-fall, had a mean thickness of 4–4.5 cm on HML1-HML2 plots and ca. 6 cm on ZM3-ZM4 plots (Table 1), and was clearly in relation to forest type, i.e., broadleaf versus coniferous, respectively. L layers contained large amounts of trace elements in the HML1 plot, i.e., up to 13,900 mg kg−1, 9320 mg kg−1, and 3180 mg kg−1 of Cu, Pb, and Zn, respectively (Table 1). Concentrations of elements in the L layer decreased on the other plots in a similar order as listed above for mineral topsoil layers and were the lowest on ZM4 plot (Table 1).
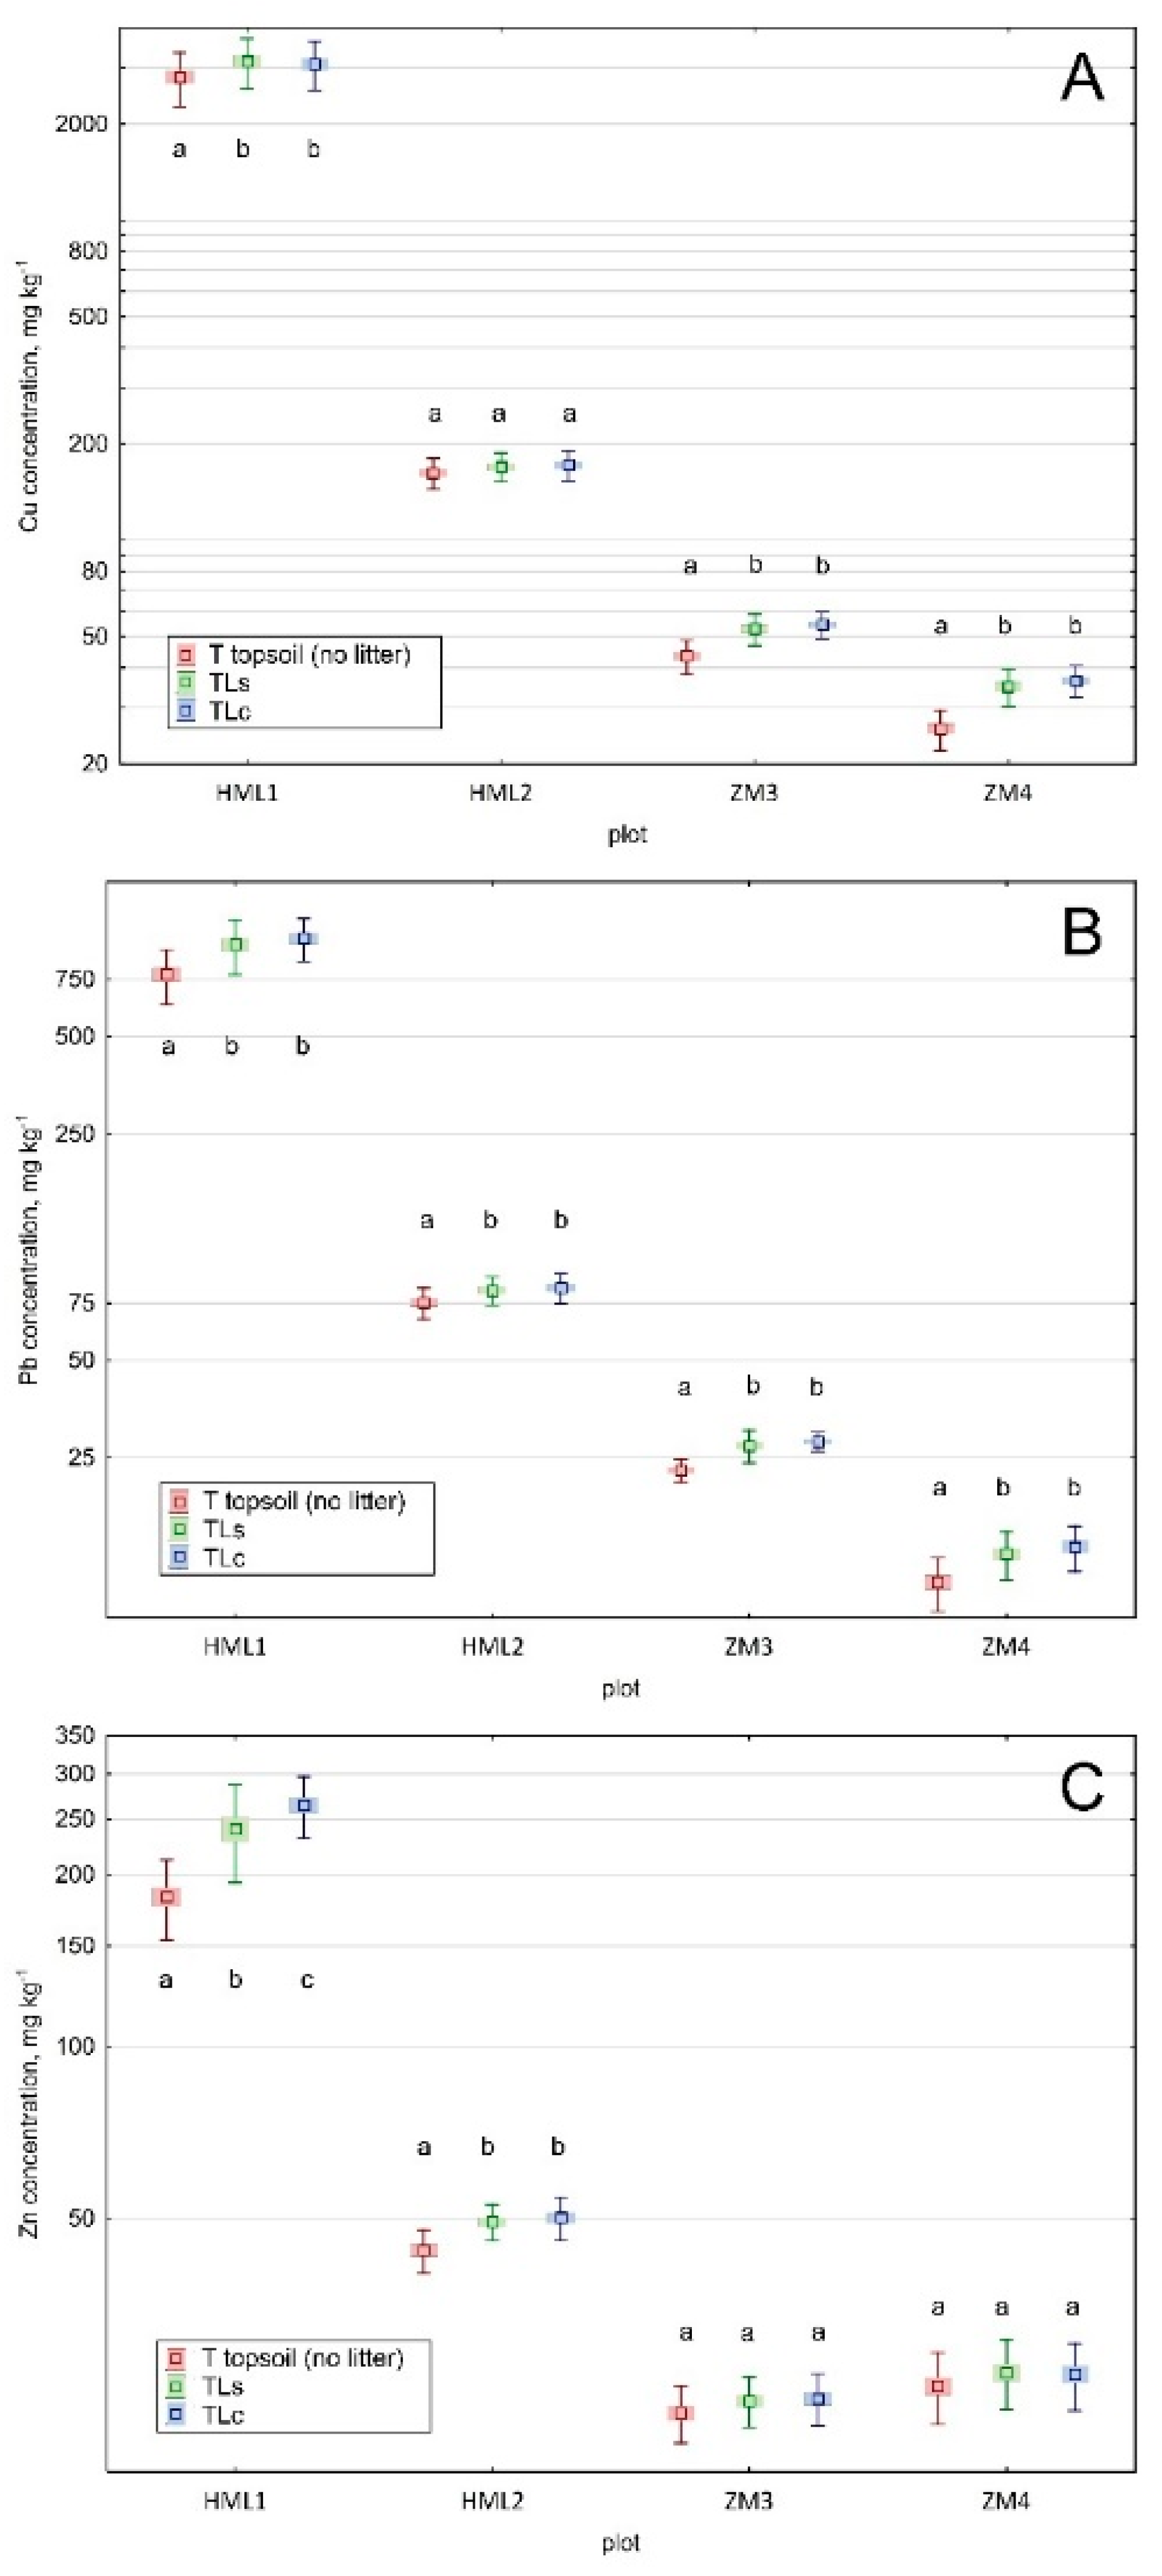
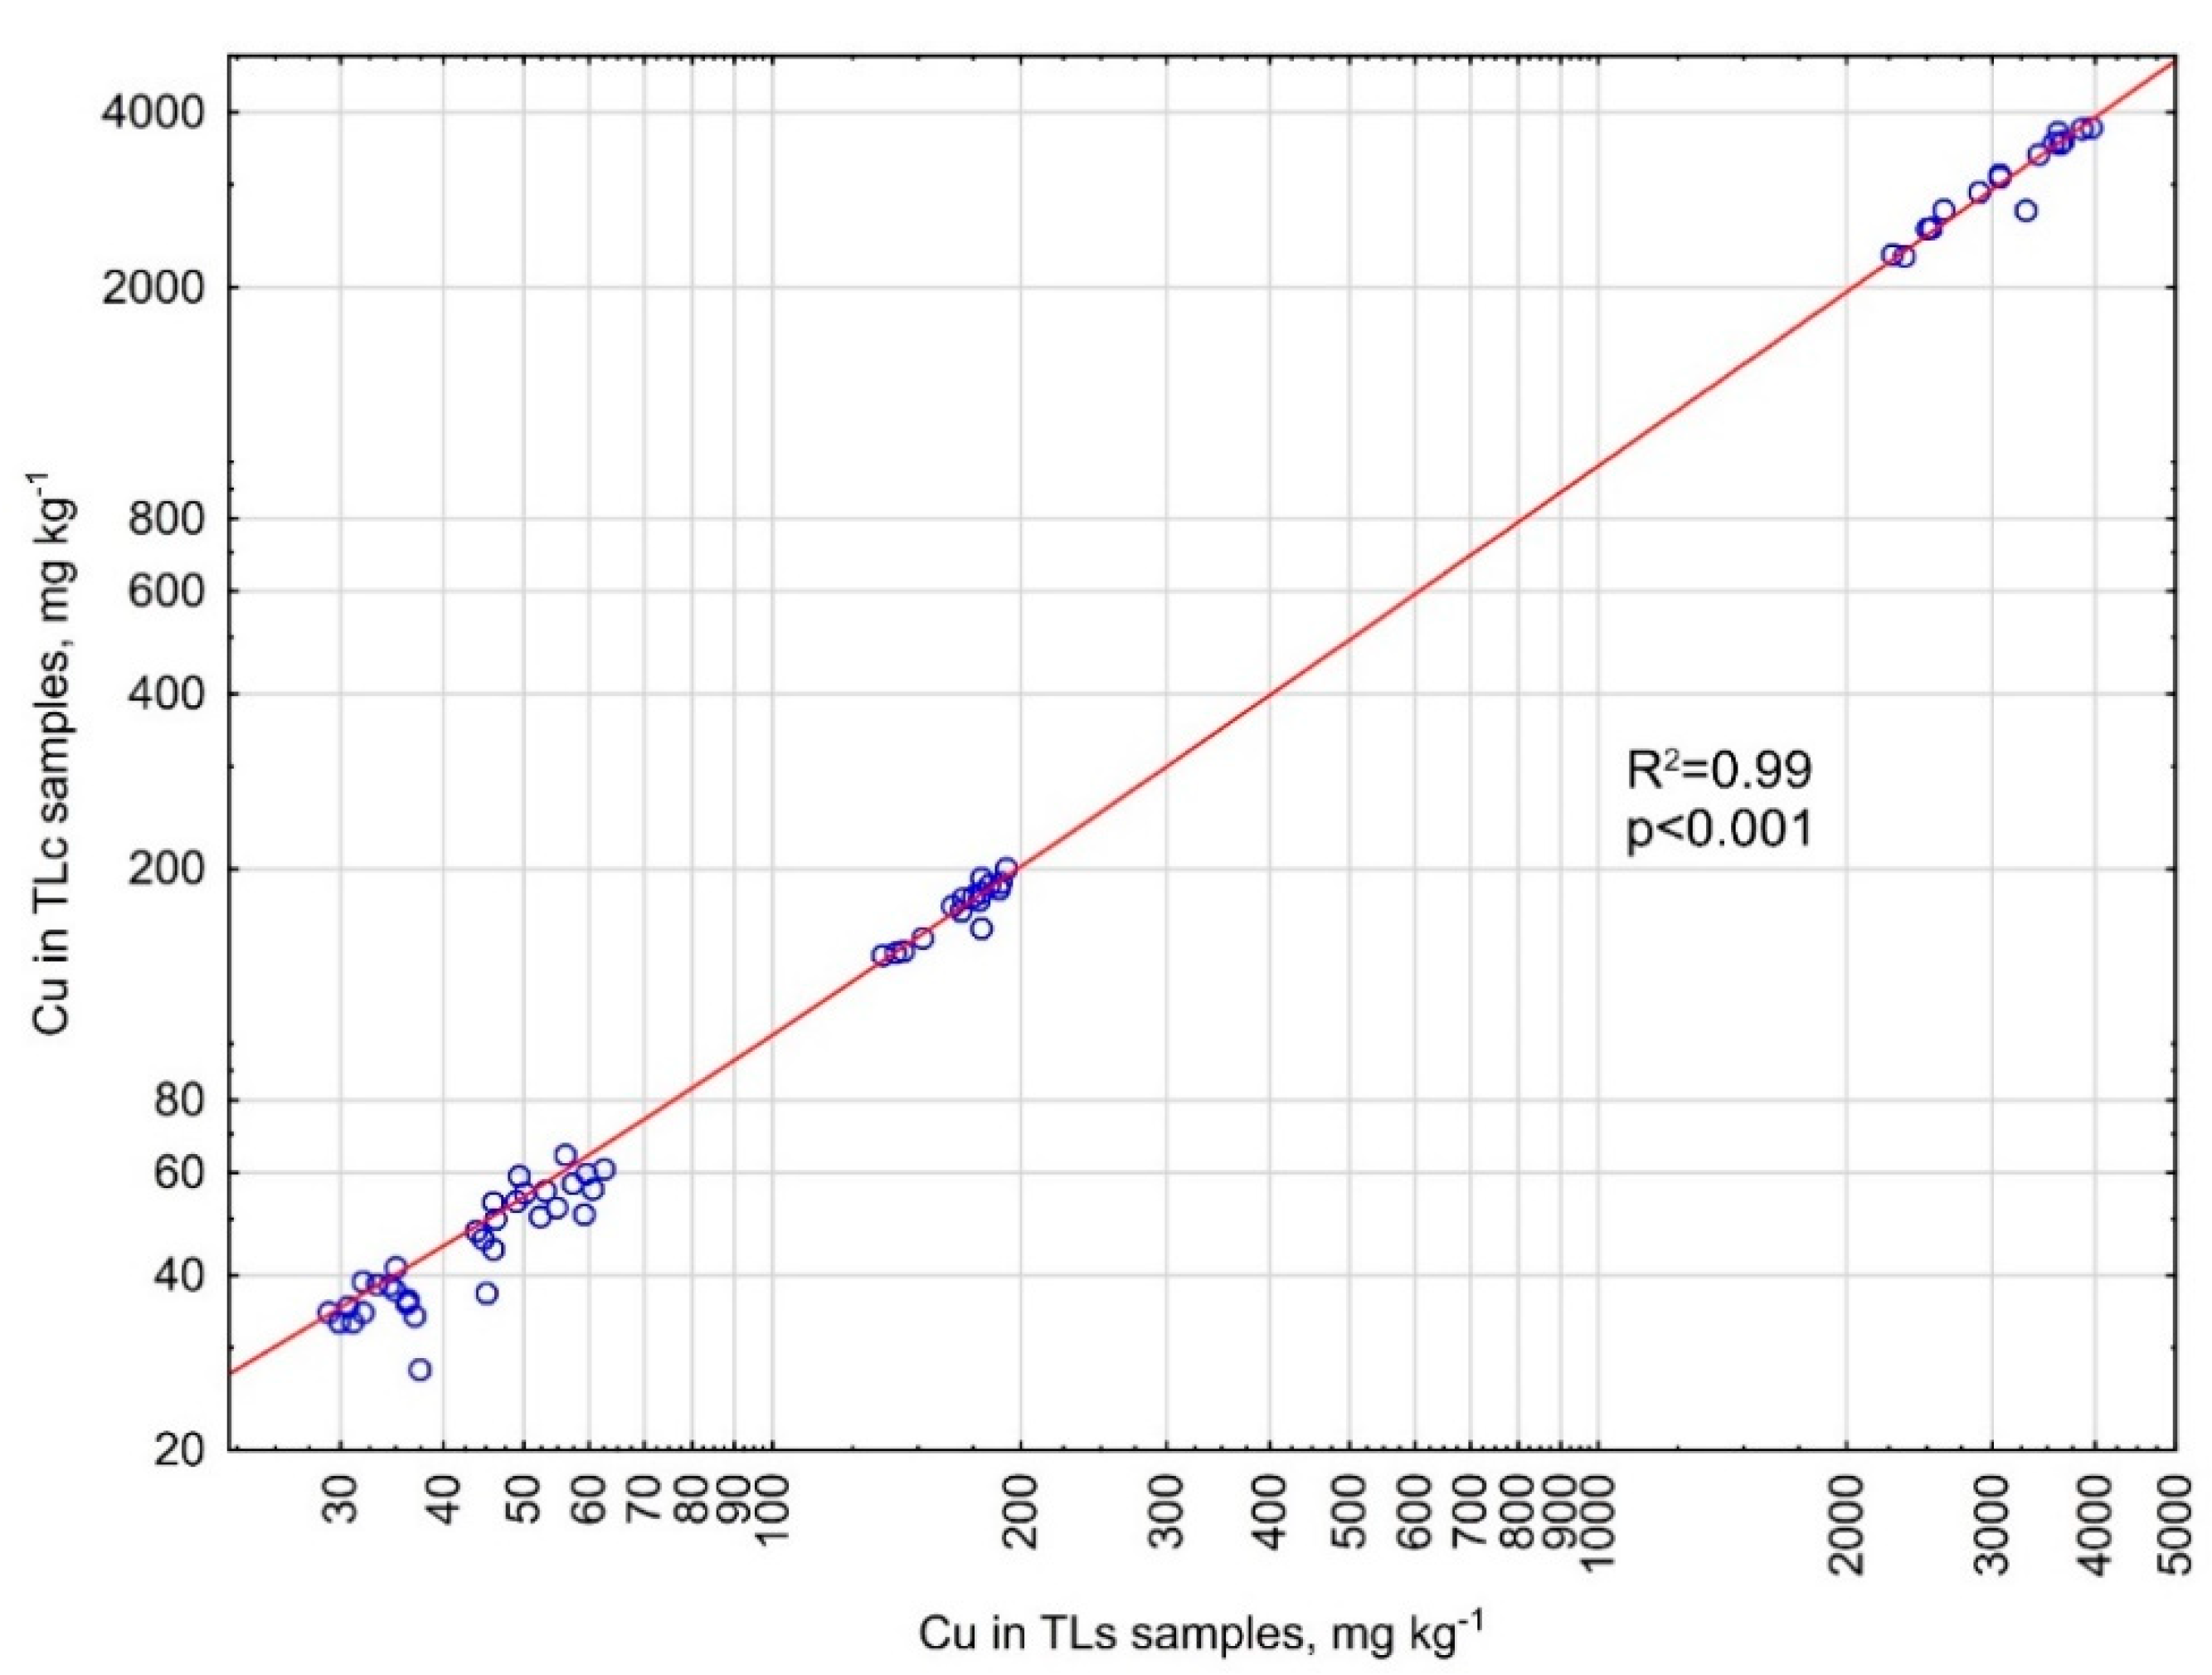
Cu and Pb concentrations in L layer were 4–11 times higher than in the T layer (mineral topsoil layer, 0–25 cm), and Zn concentrations were 3–15 times higher in L than T layers (Table 1). Therefore, the inclusion of litter to a jointly sampled topsoil (TLs), collected using the new sampling device, often resulted in noticeably higher concentrations of all elements in TLs than in T samples (Table 1). The differences were statistically significant in most cases, excluding Cu in HML2 and Zn in ZM3-ZM4 (Figure 4). This means that the inclusion of litter resulted in a significant difference between TLs and T if the element concentration in L layer was at least 5 times higher than in T layer. Estimated element concentrations in the 0–25 cm topsoil layers (TLc), calculated according to Equations (1) and (2), based on separately measured values for L and T samples, were also significantly higher than the concentrations in the T layer. The exceptions were the concentrations of Cu in HML2 and Zn in ZM3-ZM4, which were higher than in the T layer, but the difference was not significant. The calculated concentrations (TLc) were very well correlated with TLs concentrations and, in most cases, slightly higher than TLs (Figure 5, the case for Cu), but this difference was generally insignificant (at p < 0.05), while statistically significant in one case only, i.e., for Zn on the plot HML1 (Figure 4C).
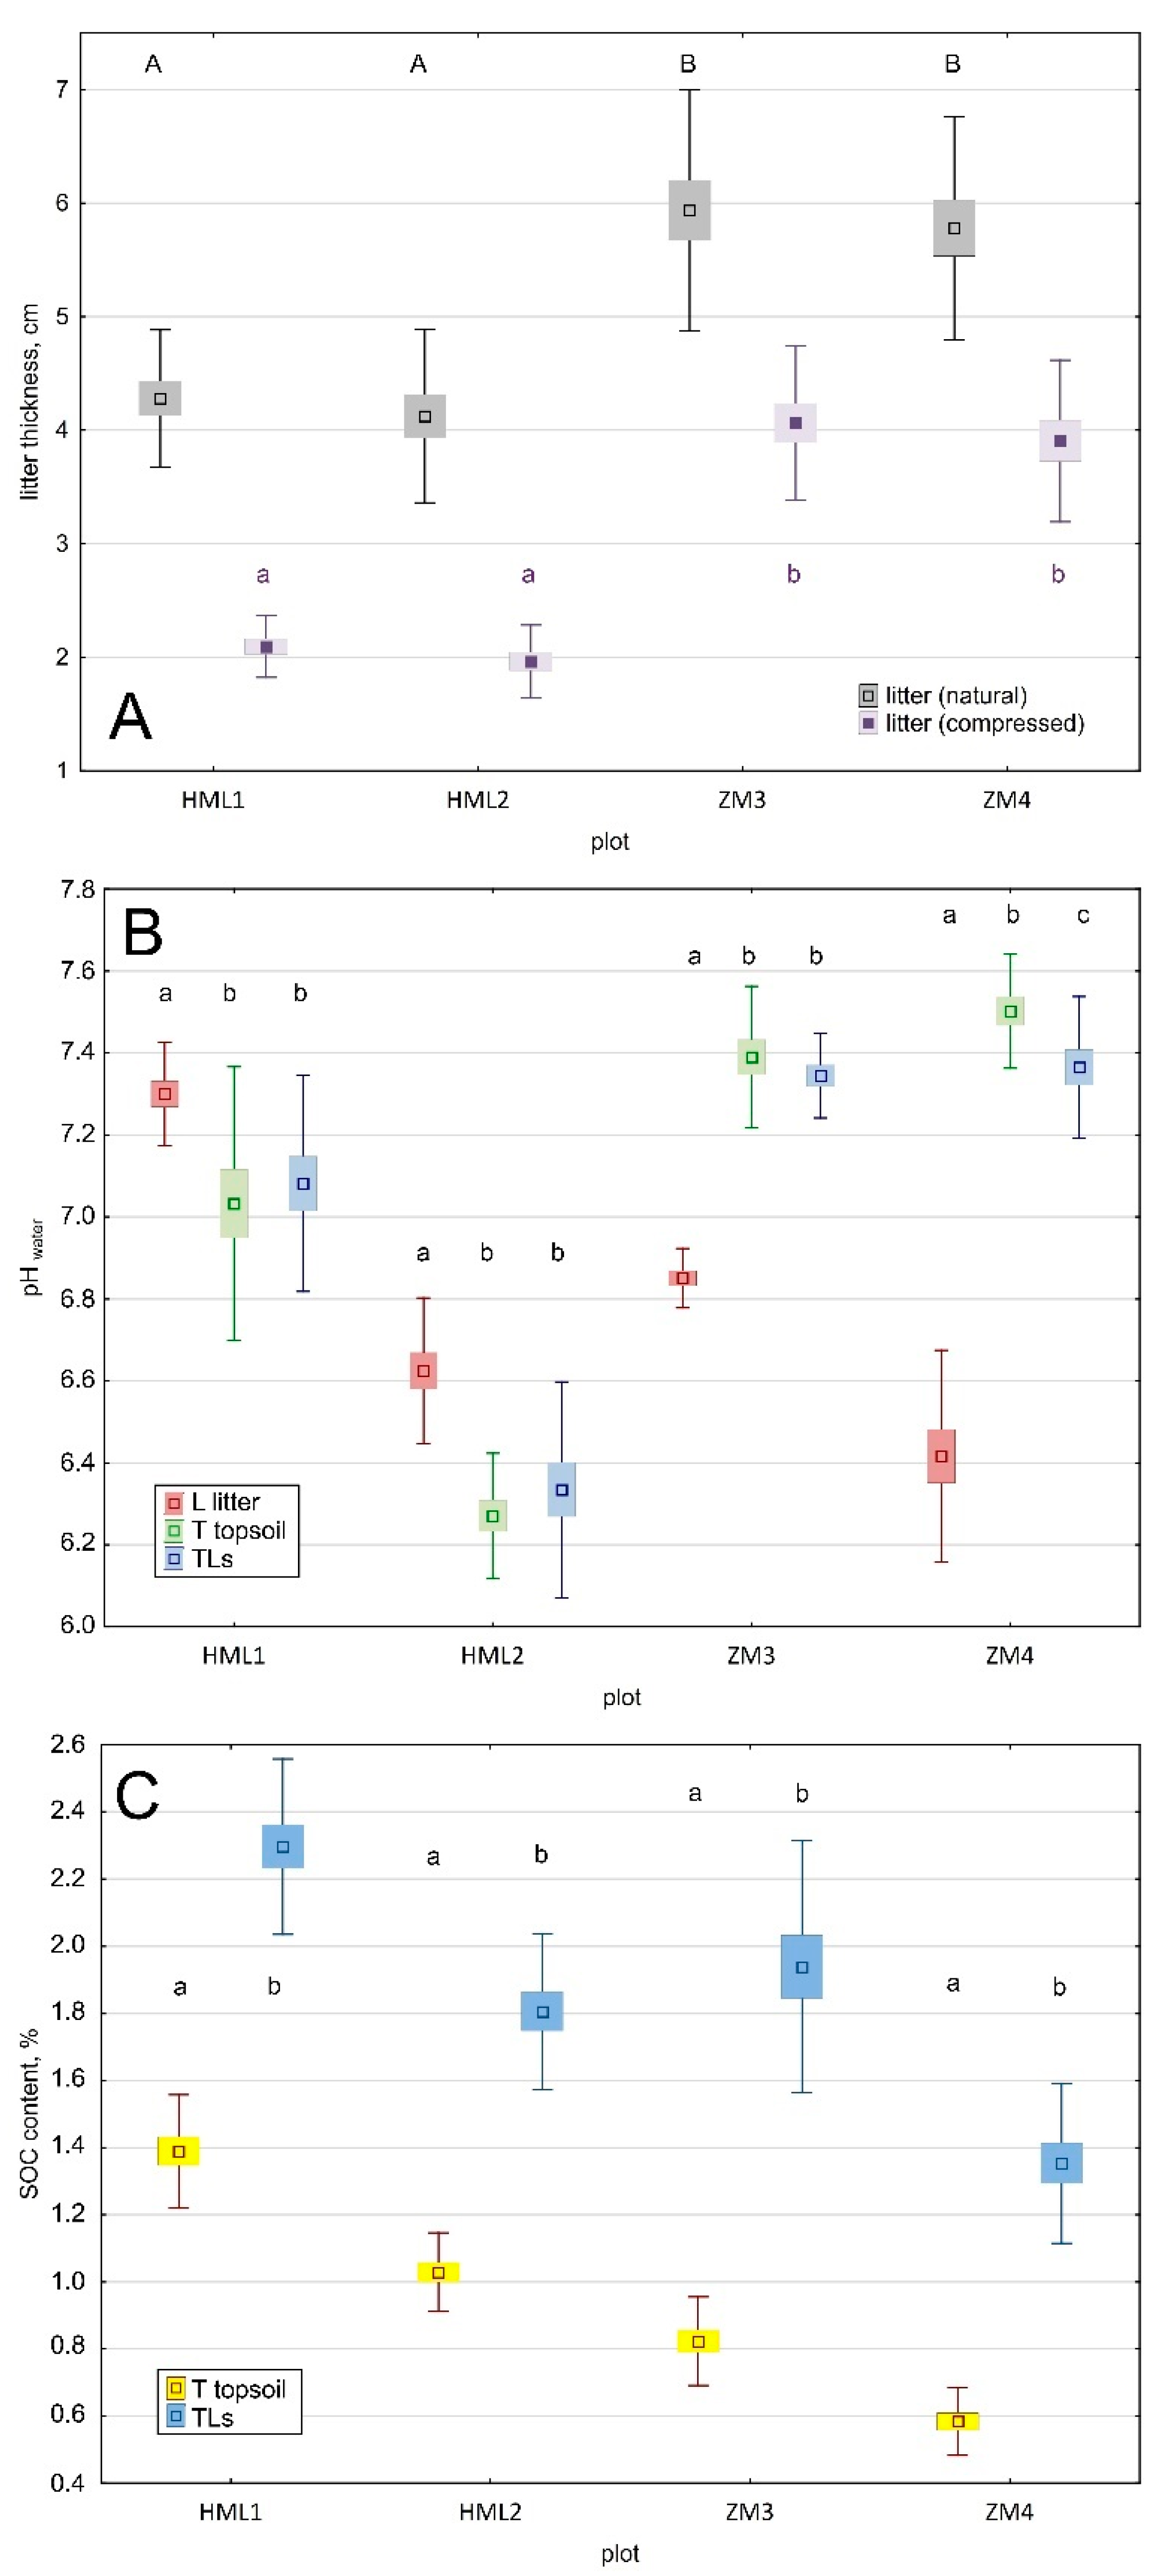
Moreover, the admixture of the forest litter in the jointly collected topsoil samples’ TLs was reflected in soil pH and SOC content (Figure 6). As expected, the pH of TLs samples on HML1-HML2 plots was higher than in T samples because of the significantly higher pH of L layers (Figure 6B). Adversely, the significantly lower pH of L compared to T layers in ZM3-ZM4 plots resulted in reduced pH values in TLs samples. However, the differences in pH values in T and TLs samples typically were not significant due to the noticeable variability of results within the plots (Figure 6B). The enrichment with organic matter from litter during the joint collection of TLs samples resulted in SOC contents higher by 1.7–2.4 times in TLs compared to T layers (Figure 6C). The variability of SOC content in TLs samples was clearly higher than in T samples, but the differences between mean values were large enough to be significant in all plots. The lower enrichment of TLs samples with SOC on HML plots was related to the lower thickness of litter on these plots, in particular after compression in a sampler (Figure 6A). Mean thickness of the compressed litter from the HML1-HML2 plots amounted to ca. 2 cm, while from ZM3-ZM4 plots it reached ca. 4 cm, which resulted in respectively reduced thickness of the sampled mineral soil.
4. Discussion
4.1. Including or Excluding the Litter Layer at the Contamination Assessment
Some authors believe there is no need to sample the forest litter layer for the assessment of topsoil contamination because the element pools in the litter do not have a significant impact on the total element concentration in the bi-component topsoil due to the low bulk density of the litter layers and low element pools in the litter even at their high concentrations in this layer [7,9,11,39,46]. In fact, the importance of litter may be hard to provide evidence for in the case of ecosystems characterized by a high rate of biomass decomposition, where the organic remains may disappear within months or even weeks of the leaf-fall [27,32,34]. In the broadleaf forests of temperate climate in Europe, it may be the case of soils with mull humus on base-rich bedrock [24]. However, the results of the present study have shown that the key factor may be the contamination level because it may disturb biomass decomposition and lead to an accumulation of undecomposed plant remains [57,58] and accumulation of air-born elements in atypically thick litter, even in potentially eutrophic sites [53]. Broadleaf forests on silt-textured Luvisols are considered (in Poland and Central Europe) eutrophic, biologically active habitats. Thus, in late summer, they may not have any litter layer or may have a thin, residual layer only [26,59]. In contrast, in the close vicinity of the copper smelter (in the plots HML1 and HML2), the litter in early September formed a continuous cover of still undecomposed leaves, 4 cm thick on average (Figure 6A), and, in some sites in the surroundings of the HML1 plot, up to 10 cm thick. An omission of that layer, as in the former inventories [11], may result in statistically lower results for all three elements under study (Figure 4), and an improper spatial classification of contaminated sites, which require remediation. The differences between mineral topsoil (T) and joint (TL) samples were insignificant for Cu and Zn in some plots (Figure 4A,C), where the element concentration in the litter was less than 5 times higher than in the underlying mineral topsoil. It means that the omission of litter may give statistically lower results of contamination assessment under various conditions, depending on the soil contamination and trophic status, but also depending on the site history, i.e., previous land use, reclamation techniques influencing the mobility of trace elements (e.g., depth of ploughing, liming, and organic fertilization), forest species composition and forest management, etc. Most of these factors are unknown or are hard to predict at the beginning of the investigation/assessment (in particular, the ratio of element concentration in the litter and mineral topsoil). Thus, the obligatory inclusion of the litter layer in the assessment of the topsoil contamination seems a reliable rule, as it allows avoiding the error in any case. Moreover, the presumed requirements of the legal regulations cannot be ignored [47]. If the regulations specify the concentration limits for the topsoil at 0–25 cm (or other, respectively), all the materials which rest on the earth surface down to this specified depth must be included in the analyzed sample [48,49,50]. This rule makes impossible any selective (intentional) “overlooking” of wastes/pollutants resting on the soil (ground) surface, which may have crucial importance for contamination and risk assessments [51].
4.2. Applicability of the New Forest Topsoil Sampler
An assessment of a reliability of the sampler used for joint collection of litter and mineral topsoil is difficult because no comparable or alternative samplers or techniques exist. We assumed the concentration of elements in a sample collected jointly using a new sampler should be similar to the concentration calculated based on the separately collected and analyzed litter and mineral topsoil layers. At least two methodological problems have to be decided in such a calculation. First, the weighed mean concentration cannot be calculated simply from the element concentration and the thicknesses of the layers, as the layers have incomparable bulk densities. Thus, the calculation was based on the pools of elements in the subsequent layers (litter and mineral topsoil) creating the block of soil (in Equations (1) and (2) the block had a dimension of 100 cm × 100 cm × 25 cm, where 25 cm was a vertical dimension, i.e., the topsoil thickness). Second, the sum of the thicknesses of separately sampled litter and mineral topsoil layers always exceeded the required thickness of 25 cm. However, in the case of significantly lower contamination of the mineral topsoil than the litter, each additional centimeter of mineral soil may result in a noticeable decrease of the calculated element concentration due to the significantly higher bulk density of the mineral soil. Therefore, the thickness of the mineral topsoil taken for calculation was a difference between 25 (total required thickness of the assessed layer) and the natural thickness (measured in the field, uncompressed) of the litter layer In Equation (2), mean concentrations of elements in TLc samples (calculated concentrations) were expectedly higher than in T samples (mineral topsoil without litter), excluding the case of Cu in HML2 and Zn in ZM3-ZM4 plots, where TLs (jointly sampled topsoil sublayers) also did not differ from T (Figure 4A,C). Of crucial importance for the present study was the fact that the mean concentrations of elements in TLc samples were somewhat higher but did not differ statistically from the concentrations in TLs samples, with the only exception of Zn in HML1 (Figure 4). The lower concentrations of elements in TLs samples (compared to TLc) were expected, as described above, due to compression of the litter by the sampler (Figure 6A), which resulted in a larger thickness of the sampled mineral layer by ca. 2 cm (on average). Zn concentration noticeably decreased with depth in the plot HML1 (Figure 3), and the difference in Zn concentrations between litter (L) and mineral topsoil (T) samples was the largest in this plot (Table 1), which explains the significant difference between TLs and TLc for Zn (in HML1, Figure 4C), which was done with an additional 2 cm of soil from the sublayer 20–25 cm.
Topsoil sampling using the new sampler requires the additional use of the spade to both cut the sample from one side and to allow sampler removal from the soil. The use of the spade and digging are disadvantages of the sampling technique. However, a standard “round” sampler (as, for example, the gouge auger used for mineral topsoil sampling) did not guarantee precise cutting off the fibrous litter layer during the turning of the sampler, even if the wall edges were tightly sharpened. Moreover, the large-diameter sampler removed from the soil without supporting digging may lose its content, in particular in the case of dry sandy soil, whereas larger diameters (cross-sections) of samplers are recommended to decrease the possible error of litter sampling [60,61].
Theoretically, the topsoil samples could be collected using the spade alone, by digging a soil “slide” and cutting a rectangular bar from the “slide” [2]. The spade sampling technique, tested and proven for arable and grassland mineral soils, was useless in the present study. First, the extraction of undisturbed soil “slide” was highly problematic in sandy forest soils overgrown with tree roots. Then, the precise cut-out of the bar (having the same thickness along all its length) from both the mineral topsoil (due to roots) and, in particular, from the litter layer was impossible due to dispersal (crushing) after slide extraction. It was concluded that the litter and underlying mineral material layers have to be cut from all sides before sample extraction if the proportional sampling of all sublayers is a priority.
The precisely defined (square) cross-section and the volume of the sampler allow the calculation of the pools of elements (macro- and microelements) and SOC in the topsoil of forest soils without additional sampling and analysis of soil bulk density, which is an additional source of uncertainty and cost [56,62]. Joint collection of litter and mineral topsoil will allow the comparability of data for arable and forest sites without skipping any important topsoil component, and it will also allow avoiding separate data presentation for mineral topsoil and litter layers in the forest sites [2].
5. Conclusions
Comparative analysis of Cu, Pb, and Zn concentrations in the forest topsoil layers (0–25 cm), sampled using a new construction sampler, invented for an intentional joint collection of the litter layer and underlying mineral layer (to the specified depth), led to the following conclusions. The concentration of trace elements in the samples consisting of jointly collected litter and underlying mineral layer was noticeably higher than in the samples consisting of the mineral topsoil only, which confirmed the effective inclusion of the litter in the sample collection. The difference was statistically significant if the concentration of elements in the litter was at least five times higher than in the underlying mineral layer. The concentrations of trace elements measured directly in the samples of jointly collected litter and mineral topsoil did not differ (NIR Fisher test at p < 0.05) from their concentrations calculated for the topsoil consisting of litter and mineral soil, but based on separately collected and analyzed litter and mineral topsoil layers. The comparability of directly measured and calculated results confirmed the usefulness of the new sampler for reliable collection of forest topsoil samples without skipping any material, which may influence the results of soil contamination assessment and risk assessment. In particular, the sampling of the forest topsoil using the new sampler, ensured a conceptual concordance of the sampling procedure and analyzed samples to the legal regulations, which specify single limits of element concentration for the entire “topsoil” layer, irrespectively of the kind of materials resting on the earth surface down to the specified depth.
6. Patents
The forest topsoil sampler construction is currently under the patent application procedure in the Patent Office of Poland.
Author Contributions
All authors contributed to the development of the idea and authoring of the paper: C.K. invented the construction of sampler and provided expert knowledge used in data analysis and interpretation; C.K., B.G., and S.Y. conducted the field work; C.K. and B.G. prepared the manuscript; all authors have read and agreed to the published version of the manuscript.
Funding
This work was financed from the statute project of Wrocław University of Environmental and Life Sciences, Institute of Soil Science and Environmental Protection, from the subsidy of Ministry of Higher Education and Science of Poland. The language correction was financed under the Leading Research Groups support project from the subsidy of Ministry of Higher Education and Science of Poland.
Acknowledgments
Authors wish to express their gratitude to Hanna Wojtałowicz and Daniela Pytlarz for their assistance during laboratory analyses.
Conflicts of Interest
The authors declare no conflict of interest. The funders had no role in the design of the study; in the collection, analyses, or interpretation of data; in the writing of the manuscript, or in the decision to publish the results.
References
- Cools, N.; De Vos, B. Forest soil: Characterization, sampling, physical, and chemical analyses. Dev. Environ. Sci. 2013, 12, 267–300. [Google Scholar]
- Fernández-Ugalde, O.; Jones, A.; Meuli, R.G. Comparison of sampling with a spade and gouge auger for topsoil monitoring at the continental scale. Eur. J. Soil Sci. 2020, 71, 137–150. [Google Scholar]
- Łabaz, B.; Kabala, C.; Bogacz, A. Problems of trophic status diagnosis in the forest habitats on former arable alluvial soils. Sylwan 2016, 160, 684–695. [Google Scholar]
- Burger, J.A.; Kelting, D.L. Soil quality monitoring for assessing sustainable forest management. In The Contribution of Soil Science to the Development of and Implementation of Criteria and Indicators of Sustainable Forest Management; SSSA Special Publications; Adams, M.B., Ramakrishna, K., Davidson, E.A., Eds.; Soil Society of America, Inc.: Madison, WI, USA, 1999; Volume 53, pp. 17–52. [Google Scholar]
- Gałka, B.; Kabala, C.; Łabaz, B.; Bogacz, A. Influence of stands with diversed share of Norway spruce in species structure on soils of various forest habitats in the Stołowe Mountains. Sylwan 2014, 158, 684–694. [Google Scholar]
- Kabala, C.; Bojko, O.; Medynska, A.; Szczepaniak, A. Spatial variability and temporal changes in the heavy metal content of soils with a deep furrow-and-ridge microrelief formed by an afforestation plowing. Environ. Monit. Assess. 2013, 185, 5141–5150. [Google Scholar] [PubMed] [Green Version]
- Błońska, E.; Lasota, J.; Szuszkiewicz, M.; Łukasik, A.; Klamerus-Iwan, A. Assessment of forest soil contamination in Krakow surroundings in relation to the type of stand. Environ. Earth Sci. 2016, 75, 1205. [Google Scholar]
- Egiarte, G.; Pinto, M.; Ruíz-Romera, E.; Arbestain, M.C. Monitoring heavy metal concentrations in leachates from a forest soil subjected to repeated applications of sewage sludge. Environ. Pollut. 2008, 156, 840–848. [Google Scholar]
- Grigalaviciene, I.; Rutkoviene, V.; Marozas, V. The accumulation of heavy metals Pb, Cu and Cd at roadside forest soil. Pol. J. Environ. Stud. 2005, 14, 109–115. [Google Scholar]
- Krüger, A.L.; Snyman, R.; Odendaal, J. The impact of urban pollution on metal contamination of selected forest pockets in Cape Town, South Africa. Environ. Sci. Pollut. Res. 2019, 26, 12537–12549. [Google Scholar]
- Karczewska, A.; Kaszubkiewicz, J.; Jezierski, P.; Kabala, C.; Król, K. Stan zanieczyszczenia miedzią, ołowiem i kadmem gleb strefy ochronnej huty miedzi Legnica w 1982 i 2005 roku. Soil Sci. Annu. Rocz. Glebozn. 2010, 61, 45–51. [Google Scholar]
- Szopka, K.; Karczewska, A.; Jezierski, P.; Kabala, C. Spatial distribution of lead in the surface layers of mountain forest soils, an example from the Karkonosze National Park, Poland. Geoderma 2013, 192, 259–268. [Google Scholar] [CrossRef]
- Schoenholtz, S.H.; Van Miegroet, H.; Burger, J.A. A review of chemical and physical properties as indicators of forest soil quality: Challenges and opportunities. For. Ecol. Manag. 2000, 138, 335–356. [Google Scholar] [CrossRef]
- Kabala, C.; Karczewska, A.; Medynska-Juraszek, A. Variability and relationships between Pb, Cu, and Zn concentrations in soil solutions and forest floor leachates at heavily polluted sites. J. Plant Nutr. Soil Sci. 2014, 177, 573–584. [Google Scholar] [CrossRef]
- Muukkonen, P.; Häkkinen, M.; Mäkipää, R. Spatial variation in soil carbon in the organic layer of managed boreal forest soil—Implications for sampling design. Environ. Monit. Assess. 2009, 158, 67–76. [Google Scholar] [CrossRef]
- Prietzel, J.; Falk, W.; Reger, B.; Uhl, E.; Pretzsch, H.; Zimmermann, L. Half a century of Scots pine forest ecosystem monitoring reveals long-term effects of atmospheric deposition and climate change. Glob. Chang. Biol. 2020, 26, 5796–5815. [Google Scholar] [CrossRef]
- Szopka, K.; Kabala, C.; Karczewska, A.; Jezierski, P.; Bogacz, A.; Waroszewski, J. The pools of soil organic carbon accumulated in the surface layers of forest soils in the Karkonosze Mountains, SW Poland. Soil Sci. Annu. 2016, 67, 46–56. [Google Scholar] [CrossRef] [Green Version]
- Morvan, X.; Saby, N.P.A.; Arrouays, D.; Le Bas, C.; Jones, R.J.A.; Verheijen, F.G.A.; Kibblewhite, M.G. Soil monitoring in Europe: A review of existing systems and requirements for harmonisation. Sci. Total Environ. 2008, 391, 1–12. [Google Scholar] [CrossRef]
- McHale, M.R.; Lawrence, G.B.; Siemion, J.; Bonville, D.B. Establishing a national forest soil monitoring network: Chemical variability in forest soils. AGUFM 2018, 2018, H13J-1855. [Google Scholar]
- Vasenev, I.; Tikhonova, M.; Avilova, A. Forest soil quality analysis at the potential reference site for Moscow megalopolis environmental monitoring. In Proceedings of the International Multidisciplinary Scientific GeoConference, Sofia, Bulgaria, 5 July 2017; Volume XVII, pp. 545–552. [Google Scholar]
- De Vries, W.; Vel, E.; Reinds, G.J. Intensive monitoring of forest ecosystems in Europe: 1. Objectives, set-up and evaluation strategy. For. Ecol. Manag. 2003, 174, 77–95. [Google Scholar] [CrossRef]
- Kabala, C.; Galka, B.; Jezierski, P. Assessment and monitoring of soil and plant contamination with trace elements around Europe’s largest copper ore tailings impoundment. Sci. Total Environ. 2020, 738, 139918. [Google Scholar] [CrossRef]
- Karczewska, A.; Szopka, K.; Bogacz, A. Zinc and lead in forest soils of Karkonosze National Park—Data for assessment of environmental pollution and soil monitoring. Pol. J. Environ. Stud. 2006, 15, 336–342. [Google Scholar]
- Zanella, A.; Ponge, J.F.; Matteodo, M. Humusica 1, article 7: Terrestrial humus systems and forms—Field practice and sampling problems. Appl. Soil Ecol. 2018, 122, 92–102. [Google Scholar] [CrossRef]
- Bayranvand, M.; Kooch, Y.; Hosseini, S.M. Humus forms in relation to altitude and forest type in the Northern mountainous regions of Iran. For. Ecol. Manag. 2017, 385, 78–86. [Google Scholar] [CrossRef]
- Labaz, B.; Galka, B.; Bogacz, A. Factors influencing humus forms and forest litter properties in the mid-mountains under temperate climate of southwestern Poland. Geoderma 2014, 230, 265–273. [Google Scholar] [CrossRef]
- Yuan, Y.; Zhao, Z.; Niu, S.; Li, X. Reclamation promotes the succession of the soil and vegetation in opencast coal mine: A case study from Robinia pseudoacacia reclaimed forests, Pingshuo mine, China. Catena 2018, 165, 72–79. [Google Scholar] [CrossRef]
- Van Langenhove, L.; Verryckt, L.T.; Stahl, C. Soil nutrient variation along a shallow catena in Paracou, French Guiana. Soil Res. 2020. [Google Scholar] [CrossRef]
- Bojko, O.; Kabala, C. Organic carbon pools in mountain soils—Sources of variability and predicted changes in relation to climate and land use changes. Catena 2017, 149, 209–220. [Google Scholar] [CrossRef]
- Kooch, Y.; Samadzadeh, B.; Hosseini, S.M. The effects of broad-leaved tree species on litter quality and soil properties in a plain forest stand. Catena 2017, 150, 223–229. [Google Scholar] [CrossRef]
- Kõlli, R.; Rannik, K. Matching Estonian humus cover types’ (pro humus forms’) and soils’ classifications. Appl. Soil Ecol. 2018, 123, 627–631. [Google Scholar] [CrossRef]
- Rosemary, F.; Indraratne, S.P.; Weerasooriya, R. Exploring the spatial variability of soil properties in an Alfisol soil catena. Catena 2017, 150, 53–61. [Google Scholar] [CrossRef]
- Gruba, P.; Socha, J.; Pietrzykowski, M.; Pasichnyk, D. Tree species affects the concentration of total mercury (Hg) in forest soils: Evidence from a forest soil inventory in Poland. Sci. Total Environ. 2019, 647, 141–148. [Google Scholar] [CrossRef]
- Hojjati, S.M.; Tavakoli, M.; Kooch, Y.; Tafazoli, M. Soil contamination pattern affected by coal mining activities in a deciduous temperate forest. ECOPERSIA 2020, 9, 23–31. [Google Scholar]
- Łyszczarz, S.; Błońska, E.; Lasota, J. The application of the geo-accumulation index and geostatistical methods to the assessment of forest soil contamination with heavy metals in the Babia Góra National Park (Poland). Arch. Environ. Prot. 2020, 46, 69–79. [Google Scholar]
- Mazurek, R.; Kowalska, J.; Gąsiorek, M.; Zadrożny, P.; Józefowska, A.; Zaleski, T.; Orłowska, K. Assessment of heavy metals contamination in surface layers of Roztocze National Park forest soils (SE Poland) by indices of pollution. Chemosphere 2017, 168, 839–850. [Google Scholar] [CrossRef]
- Melnyk, V.; Kurbet, T.; Shelest, Z.; Davydova, I. Soil sampling when examining forests for radioactive contamination. East. Eur. J. Enterp. Technol. 2020, 4, 106. [Google Scholar] [CrossRef]
- Mertes, F.; Mumbo, J.; Pandelova, M.; Bernhöft, S.; Corsten, C.; Henkelmann, B.; Schramm, K.W. Comparative study of dioxin contamination from forest soil samples (BZE II) by mass spectrometry and EROD bioassay. Environ. Sci. Pollut. Res. 2018, 25, 3977–3984. [Google Scholar] [CrossRef] [PubMed]
- Baran, A.; Wieczorek, J.; Mazurek, R. Potential ecological risk assessment and predicting zinc accumulation in soils. Environ. Geochem. Health 2018, 40, 435–450. [Google Scholar] [CrossRef] [PubMed] [Green Version]
- Huang, J.; Guo, S.; Zeng, G.M. A new exploration of health risk assessment quantification from sources of soil heavy metals under different land use. Environ. Pollut. 2018, 243, 49–58. [Google Scholar] [CrossRef]
- Lin, W.; Wu, K.; Lao, Z.; Hu, W.; Lin, B.; Li, Y.; Hu, J. Assessment of trace metal contamination and ecological risk in the forest ecosystem of dexing mining area in northeast Jiangxi Province, China. Ecotoxicol. Environ. Saf. 2019, 167, 76–82. [Google Scholar] [CrossRef]
- Sucharovà, J.; Suchara, I.; Hola, M.; Marikova, S.; Reimann, C.; Boyd, R.; Filzmoser, P.; Englmaier, P. Top/bottom-soil ratios and enrichment factors: What do they really show? Appl. Geochem. 2012, 27, 138–145. [Google Scholar] [CrossRef]
- Szopka, K.; Karczewska, A.; Kabala, C. Mercury accumulation in the surface layers of mountain soils: A case study from the Karkonosze Mountains, Poland. Chemosphere 2011, 83, 1507–1512. [Google Scholar] [CrossRef] [PubMed]
- Waroszewski, J.; Kabala, C.; Szopka, K. Trace elements in soils of upper zone of spruce forest on Szrenica Mount and the Kowarski Grzbiet Range in the Karkonosze Mountains. J. Elem. 2009, 14, 805–814. [Google Scholar] [CrossRef] [Green Version]
- Bojko, O.; Kabala, C.; Mendyk, Ł.; Markiewicz, M.; Pagacz-Kostrzewa, M.; Glina, B. Labile and stabile soil organic carbon fractions in surface horizons of mountain soils—Relationships with vegetation and altitude. J. Mt. Sci. 2017, 14, 2391–2405. [Google Scholar] [CrossRef]
- Ngaba, M.J.Y.; Mgelwa, A.S. Ecological risk assessment of heavy metal contamination of six forest soils in China. Int. J. Innov. Appl. Stud. 2020, 30, 1–10. [Google Scholar]
- Kumar, V.; Sharma, A.; Kaur, P. Pollution assessment of heavy metals in soils of India and ecological risk assessment: A state-of-the-art. Chemosphere 2019, 216, 449–462. [Google Scholar] [CrossRef]
- US EPA. Soil Screening Guidance: Technical Background Document; US Environmental Protection Agency: Washington, DC, USA, 1996.
- Regulation of the Ministry of Environment (Poland) on the Method of Assessing the Pollution of the Earth’s Surface. Available online: http://isap.sejm.gov.pl/isap.nsf/DocDetails.xsp?id=WDU20160001395 (accessed on 27 December 2020).
- Canadian Soil Quality Guidelines for the Protection of Environmental and Human Health. Available online: http://st-ts.ccme.ca/en/index.html (accessed on 27 December 2020).
- Karczewska, A.; Kabala, C. Environmental risk assessment as a new basis for evaluation of soil contamination in Polish law. Soil Sci. Annu. 2017, 68, 67–80. [Google Scholar] [CrossRef] [Green Version]
- Karczewska, A.; Szerszen, L.; Kabala, C. Forms of selected heavy metals and their transformation in soils polluted by the emissions from copper smelters. Adv. Geoecol. 1998, 31, 705–712. [Google Scholar]
- Kabala, C.; Singh, B.R. Fractionation and mobility of copper, lead, and zinc in soil profiles in the vicinity of a copper smelter. J. Environ. Qual. 2001, 30, 485–492. [Google Scholar] [CrossRef] [Green Version]
- Medyńska-Juraszek, A.; Kabała, C. Heavy metal pollution of forest soils affected by the copper industry. J. Elem. 2012, 17, 441–451. [Google Scholar] [CrossRef]
- Van Reeuwijk, L.P. Procedures for Soil Analysis; Technical Paper 19; International Soil Reference and Information Centre: Wageningen, The Netherlands, 1992. [Google Scholar]
- Kabala, C.; Galka, B. Estimation of bulk density in mountain soils based on the content of organic carbon. Sylwan 2019, 163, 320–327. [Google Scholar]
- Liu, C.; Duan, C.; Pan, Y. Cadmium pollution alters earthworm activity and thus leaf-litter decomposition and soil properties. Environ. Pollut. 2020, 267, 115410. [Google Scholar] [CrossRef] [PubMed]
- Niklińska, M.; Chodak, M.; Laskowski, R. Characterization of the forest humus microbial community in a heavy metal polluted area. Soil Biol. Biochem. 2005, 37, 2185–2194. [Google Scholar] [CrossRef]
- Lasota, J.; Brożek, S.; Zwydak, M.; Wanic, T. Soil diversity of the rich beech and oak-hornbeam forest communities. Soil Sci. Annu. Rocz. Glebozn. 2011, 62, 93–108. [Google Scholar]
- Medyńska, A.; Kabala, C. Heavy metals concentration and extractability in forest litters in the area impacted by copper smelter near Legnica. Ecol. Chem. Eng. A 2010, 17, 981–989. [Google Scholar]
- Bélanger, N.; Van Rees, K.C. Sampling forest soils. In Soil Sampling and Methods of Analysis; Carter, M.R., Gregorich, E.G., Eds.; CRC Press: Boca Raton, FL, USA, 2008; pp. 15–24. [Google Scholar]
- Jurgensen, M.F.; Page-Dumroese, D.S.; Brown, R.E.; Tirocke, J.M.; Miller, C.A.; Pickens, J.B.; Wang, M. Estimating carbon and nitrogen pools in a forest soil: Influence of soil bulk density methods and rock content. Soil Sci. Soc. Am. J. 2017, 81, 1689–1696. [Google Scholar] [CrossRef]
Figure 1.
Litter and topsoil sampling: (A) mineral topsoil sampling using gouge auger in a site where first litter layer was sampled within a circle frame, (B) general view of a new sampler for joint litter + topsoil sampling, (C) jointly sampled litter + topsoil (0–25 cm), (D) cutting the soil sample with spade and digging the hole in a sampler’s front, (E) the tilted sampler with the sampled topsoil.

Figure 2.
SOC and pH in subsequent sublayers of the mineral topsoil layer in the plots under study.

Figure 3.
Cu, Pb, and Cu concentrations in the subsequent sublayers of the mineral topsoil layers.

Figure 4.
Comparison of (A) Cu, (B) Pb, and (C) Zn concentrations in the mineral topsoil layer 0–25 cm collected without litter (T), in the jointly collected litter + mineral topsoil layer 0–25 cm (TLs), and calculated for the topsoil layer 0–25 cm from separately analyzed litter and mineral topsoil (TLc). Central square indicates the mean value, box—the standard error, whiskers—the standard deviation. Letters a, b designate the homogeneous groups of means checked by NIR-Fisher test (on each plot separately).

Figure 5.
Correlation between Cu concentrations in TLs (topsoil layer 0–25 cm, litter and mineral topsoil sampled jointly) and TLc (calculated data for topsoil layer 0–25 cm, where the litter and mineral topsoil were sampled separately).
Figure 5.
Correlation between Cu concentrations in TLs (topsoil layer 0–25 cm, litter and mineral topsoil sampled jointly) and TLc (calculated data for topsoil layer 0–25 cm, where the litter and mineral topsoil were sampled separately).

Figure 6.
Comparison of the measured variables in the plots under study: (A) natural thickness of forest litter layers and thickness of the litter compressed during sampling (TLs samples), (B) pH of the litter layer (L), mineral topsoil layer (T), jointly collected litter+mineral topsoil layer (TLs), (C) SOC content in the mineral topsoil layer (T) and jointly collected litter+mineral topsoil layer (TLs). Central square indicates the mean value, box—standard error, whiskers—the standard deviation. Letters A, B, a, b designate the homogeneous groups of means checked by NIR-Fisher test.


Table 1.
Range (minimum–maximum), means and standard deviations of the soil properties and concentration of Cu, Pb, and Zn.
Table 1.
Range (minimum–maximum), means and standard deviations of the soil properties and concentration of Cu, Pb, and Zn.
| Variable, Unit | HML1 | HML2 | ZM3 | ZM4 | ||||
|---|---|---|---|---|---|---|---|---|
| Range | Mean ± SD | Range | Mean ± SD | Range | Mean ± SD | Range | Mean ± SD | |
| L thickness (natural), cm | 3.5–5.5 | 4.3 ± 0.61 | 3.0–5.5 | 4.1 ± 0.76 | 4.5–7.5 | 5.9 ± 1.01 | 4.5–7.5 | 5.8 ± 0.98 |
| L thickness (compressed), cm | 1.5–2.5 | 2.1 ± 0.27 | 1.5–2.5 | 2.0 ± 0.32 | 3.0–5.0 | 4.1 ± 0.68 | 3.0–5.0 | 3.9 ± 0.71 |
| clay fraction in T, % | 9–16 | 12 ± 2.3 | 13–16 | 15 ± 1.0 | 1–3 | 2 ± 0.6 | 6–7 | 7 ± 0.5 |
| silt fraction in T, % | 72–75 | 73 ± 1.1 | 51–63 | 59 ± 4.4 | 1–8 | 5 ± 2.3 | 13–17 | 15 ± 1.6 |
| sand fraction in T, % | 12–17 | 15 ± 2.3 | 22–34 | 26 ± 1.1 | 91–97 | 93 ± 0.6 | 77–80 | 78 ± 0.6 |
| dv in T, g cm−3 | 1.15–1.46 | 1.30 ± 0.21 | 1.18–1.55 | 1.35 ± 0.20 | 1.21–1.62 | 1.50 ± 0.18 | 1.17–1.60 | 1.45 ± 0.16 |
| SOC in L, % | 20.7–32.3 | 24.9 ± 3.0 | 21.0–29.9 | 23.8 ± 2.45 | 20.1–27.8 | 23.6 ± 2.35 | 22.2–32.5 | 26.4 ± 2.99 |
| SOC in T, % | 1.2–1.7 | 1.4 ± 0.17 | 0.7–1.2 | 1.0 ± 0.12 | 0.5–1.0 | 0.8 ± 0.13 | 0.4–0.8 | 0.6 ± 0.10 |
| SOC in TL, % | 2.0–2.9 | 2.3 ± 0.26 | 1.6–2.3 | 1.8 ± 0.23 | 1.5–2.5 | 1.9 ± 0.37 | 1.0–1.9 | 1.4 ± 0.24 |
| pH in L | 7.1–7.6 | 7.31 ± 0.34 | 6.4–7.0 | 6.62 ± 0.17 | 6.7–7.0 | 6.85 ± 0.07 | 6.0–6.7 | 6.42 ± 0.26 |
| pH in T | 6.4–7.5 | 7.03 ± 0.33 | 6.0–6.5 | 6.27 ± 0.15 | 6.9–7.6 | 7.39 ± 0.17 | 7.2–7.7 | 7.50 ± 0.14 |
| pH in TL | 6.5–7.5 | 7.08 ± 0.26 | 6.1–6.8 | 6.33 ± 0.26 | 7.0–7.5 | 7.35 ± 0.10 | 7.1–7.7 | 7.37 ± 0.17 |
| Cu in L, mg kg−1 | 9960–13,900 | 11,530 ± 1050 | 392–784 | 582 ± 119 | 339–580 | 441 ± 75.5 | 325–628 | 439 ± 85.7 |
| Cu in T, mg kg−1 | 1990–3520 | 2810 ± 543 | 130–189 | 163 ± 17.7 | 31.5–53.5 | 43.5 ± 5.28 | 15.5–33.0 | 25.8 ± 3.72 |
| Cu in TLs, mg kg−1 | 2270–3950 | 3140 ± 556 | 136–192 | 170 ± 17.6 | 43.8–62.5 | 52.8 ± 5.94 | 29.0–45.1 | 34.9 ± 4.66 |
| Cu in TLc, mg kg−1 | 2260–3760 | 3090 ± 532 | 142–200 | 172 ± 18.7 | 44.3–64.4 | 54.5 ± 5.22 | 27.5–46.2 | 36.4 ± 4.09 |
| Pb in L, mg kg−1 | 6950–9320 | 7880 ± 765 | 330–570 | 449 ± 84.2 | 160–270 | 212 ± 31.1 | 95.0–155 | 124 ± 19.4 |
| Pb in T, mg kg−1 | 530–950 | 777 ± 149 | 58.0–85.5 | 75.2 ± 8.37 | 19.5–26.5 | 22.9 ± 1.85 | 8.6–13.5 | 10.3 ± 1.93 |
| Pb in TLs, mg kg−1 | 675–1210 | 960 ± 184 | 64.8–94.5 | 82.2 ± 8.23 | 21.1–31.8 | 27.3 ± 3.18 | 9.5–16.9 | 12.6 ± 2.14 |
| Pb in TLc, mg kg−1 | 762–1190 | 1000 ± 150 | 67.4–93.1 | 83.7 ± 8.95 | 25.0–33.2 | 28.1 ± 1.91 | 10.6–16.8 | 13.3 ± 2.13 |
| Zn in L, mg kg−1 | 2390–3180 | 2740 ± 274 | 205–484 | 316 ± 79.7 | 58.0–87.0 | 72.3 ± 9.16 | 59.0–87.0 | 69.5 ± 8.40 |
| Zn in T, mg kg−1 | 145–230 | 183 ± 29.1 | 37.8–51.4 | 43.9 ± 3.82 | 15.5–26.0 | 22.8 ± 2.61 | 21.5–36.0 | 25.5 ± 3.65 |
| Zn in TLs, mg kg−1 | 185–340 | 240 ± 46.6 | 42.8–56.6 | 49.3 ± 3.56 | 17.0–27.0 | 23.9 ± 2.43 | 23.2–37.8 | 26.9 ± 3.74 |
| Zn in TLc, mg kg−1 | 213–315 | 264 ± 32.5 | 43.2–57.7 | 50.1 ± 4.37 | 16.8–27.1 | 24.2 ± 2.52 | 22.5–36.8 | 26.6 ± 3.59 |
Explanation: L—forest litter layer, T—mineral topsoil layer (0–25 cm, without litter), TLs—topsoil layer (0–25 cm, litter and mineral topsoil sampled jointly), TLc—calculated data for topsoil layer (0–25 cm, litter and mineral topsoil sampled separately), dv—bulk density, SOC—soil organic carbon, SD–standard deviation.
Publisher’s Note: MDPI stays neutral with regard to jurisdictional claims in published maps and institutional affiliations. |
© 2021 by the authors. Licensee MDPI, Basel, Switzerland. This article is an open access article distributed under the terms and conditions of the Creative Commons Attribution (CC BY) license (http://creativecommons.org/licenses/by/4.0/).
Share and Cite
MDPI and ACS Style
Kabala, C.; Galka, B.; Yurkouski, S. New Topsoil Sampler for the Assessment and Monitoring of Forest Soil Contamination. Forests 2021, 12, 79. https://0-doi-org.brum.beds.ac.uk/10.3390/f12010079
AMA Style
Kabala C, Galka B, Yurkouski S. New Topsoil Sampler for the Assessment and Monitoring of Forest Soil Contamination. Forests. 2021; 12(1):79. https://0-doi-org.brum.beds.ac.uk/10.3390/f12010079
Chicago/Turabian StyleKabala, Cezary, Bernard Galka, and Siarhei Yurkouski. 2021. "New Topsoil Sampler for the Assessment and Monitoring of Forest Soil Contamination" Forests 12, no. 1: 79. https://0-doi-org.brum.beds.ac.uk/10.3390/f12010079
Note that from the first issue of 2016, this journal uses article numbers instead of page numbers. See further details here.