Article

Comparison of Selected Terramechanical Test Procedures and Cartographic Indices to Predict Rutting Caused by Machine Traffic during a Cut-to-Length Thinning Operation

1
Department of Forest Work Science and Engineering, University of Göttingen, Büsgenweg 4, 37077 Göttingen, Germany
2
School of Forestry, University of Canterbury, Forestry Road, 8041 Christchurch, New Zealand
3
Department of Soil Science of Temperate Ecosystems, University of Göttingen, Büsgenweg 2, 37077 Göttingen, Germany
*
Author to whom correspondence should be addressed.
Submission received: 8 December 2020 / Revised: 12 January 2021 / Accepted: 18 January 2021 / Published: 20 January 2021

Abstract

:
Timber harvesting operations using heavy forest machinery frequently results in severe soil compaction and displacement, threatening sustainable forest management. An accurate prediction of trafficability, considering actual operating conditions, minimizes these impacts and can be facilitated by various predictive tools. Within this study, we validated the accuracy of four terramechanical parameters, including Cone Index (MPa, Penetrologger), penetration depth (cm, Penetrologger), cone penetration (cm blow−1, dual-mass dynamic cone penetrometer) and shear strength (kPa, vane meter), and additionally two cartographic indices (topographic wetness index and depth-to-water). Measurements applying the four terramechanical approaches were performed at 47 transects along newly assigned machine operating trails in two broadleaved dominated mixed stands. After the CTL thinning operation was completed, measurement results and cartographic indices were correlated against rut depth. Under the rather dry soil conditions (29 ± 9 vol%), total rut depth ranged between 2.2 and 11.6 cm, and was clearly predicted by rut depth after a single pass of the harvester, which was used for further validations. The results indicated the easy-to-measure penetration depth as the most accurate approach to predict rut depth, considering coefficients of correlation (rP = 0.44). Moreover, cone penetration (rP = 0.34) provided reliable results. Surprisingly, no response between rut depth and Cone Index was observed, although it is commonly used to assess trafficability. The relatively low moisture conditions probably inhibited a correlation between rutting and moisture content. Consistently, cartographic indices could not be used to predict rutting. Rut depth after the harvester pass was a reliable predictor for total rut depth after 2–5 passes (rP = 0.50). Rarely used parameters, such as cone penetration or shear strength, outcompeted the highly reputed Cone Index, emphasizing further investigations of applied tools.

1. Introduction

Currently, the forest in Germany and other countries suffer from several climate change-induced stressors like drought, fires and other extreme weather conditions [1,2]. One consequence of these weather phenomena is an ongoing large scale bark beetle infestation [3]. Thus, prompt salvaging of infected trees is necessary for forest protection [4,5,6] and to limit economic losses for forest owners. In some regions, the required machine-operating trails for off-road traffic still have to be established to ensure the necessary year-round access to the affected stands. Despite this, off-road traffic is currently a general matter of debate, since it causes multiple adverse impacts to soil characteristics [7,8,9,10,11], and thus the stand growth (e.g., [12]). Negative impacts like compaction (e.g., [13]) and soil displacement (e.g., [14]) are the consequence of heavy machine traffic on forest soils. Following Horn et al. [15], soil displacement, caused by shearing forces and soil compression under wet conditions, leads to ruts. Soil moisture content, terrain slope, soil properties and the operating vehicle are decisive for the creation of ruts (e.g., [16]). Additionally, the cumulative weight associated with the number of passes is linked to rut formation [7,17,18]. Since ruts show a strong relationship with decreased forest productivity in the affected areas [19], it is a priority of sustainable operation management to keep their formation to a minimum.
Estimating soil trafficability is a key aspect for preserving soil integrity and thus the forest as an ecosystem on the one hand, and for optimizing timber harvest and efficient machine utilization on the other. In theory, soil trafficability can be derived from terrain characteristics, machine configurations, and weather conditions. An accurate prediction of rutting is necessary for sustainable, low-impact harvesting operations, since it supports the mitigation and avoidance of impacts [18,20,21] on machine operating trails, which are established without a pavement or any other fixation. The assessment of forest sites’ trafficability continues to be commonly based on the appraisal of the forester in charge (e.g., [22]), mainly requiring a long-year experience to enable a sufficient estimation of current harvesting conditions in a designated area. However, because of varying weather conditions considerably affecting the trafficability, the assessment of current conditions and subsequently the timing of operations is a challenging task. In many cases, the machine operator himself is faced with this task when arriving at the site of operation. Usually, the machine operator starts the operation, until the occurring ruts are individually judged as too severe. Consequently, the operation has to be stopped, requiring a cost-intensive relocation of the machine to alternative stands with better trafficability. Hence, lacking knowledge of current trafficability on stand levels may result in manifold drawbacks such as financial shortcuts and, even worse, ecological damages with long lasting, severe impacts on tree growth, water infiltration, soil organisms and soil erosion [23].
A prediction of such damages can be facilitated by terramechanical test procedures (e.g., [24]) or by trafficability maps [25]. Recent approaches show the possibility to incorporate information on trafficability, measured during the first machine pass, in such maps [18,26,27]. Both terramechanical tests and trafficability maps can sufficiently support the operational flexibility of company management and entrepreneurs as well as machine operators, in order to avoid and reduce disturbances to forest soils, with associated high costs. Some of the equipment used for assessing soil’s bearing capacity has already been validated towards the predictability of ruts. For example, Sirén et al. [18,28] reported a correlation between rut depth after harvest and Cone Index (CI). The same index has been frequently used for validations of accessibility maps, where CI was used instead of assessing actual machine traffic (e.g., [29]). Less commonly used, but already reported by Heubaum et al. [30], a vane meter can be used to assess soil trafficability through the determination of shear strength. Especially if measured in a mineral soil depth between 10 and 15 cm, this rather simple instrument has been reported as promising regarding the accuracy of prediction. Besides, the relatively unknown dual-mass dynamic cone penetrometer has been used in the estimation of pavements moduli [31,32]. However, as far as we know, it was not validated in forest soils up to now. Certainly, numerous studies revealed the link between soil moisture content and rutting [23,33], giving this parameter a high relevance for the prediction of rutting.
Subsequently, two pivotal approaches of remote analyses for the simulation of soil moisture content were chosen in addition. The calculated indices topographic wetness index (TWI) [34,35] and depth-to-water (DTW) index [36,37,38] link the terrain characteristics with the soil wetness by the simulation of accumulating water runoff. In principal, both indices quantify the contributing area to a distinct cell within a grid, and calculate the likelihood for cells to be water-saturated or moist. Especially in dense stands, with a lacking network of machine operating trails, visibility is restricted for machine operators. The cartographic knowledge of moist and therefore sensitive areas, in particular when available through geo-referenced digital maps on the forest machine’s on-board computer screen, can highly contribute to the avoidance of deep ruts and other soil impacts [39].
Still, the above-mentioned approaches for the prediction of rutting differ in regard to accuracy, financial efforts, handling and applicability, leading to specific advantages and drawbacks. Nevertheless, comparative studies between different approaches are lacking. In order to fill this knowledge gap, we conducted a study which aimed to assess relevant terramechanical test procedures and cartographic indices, all assumed to predict rutting during forest operations. In particular, the following questions were addressed:
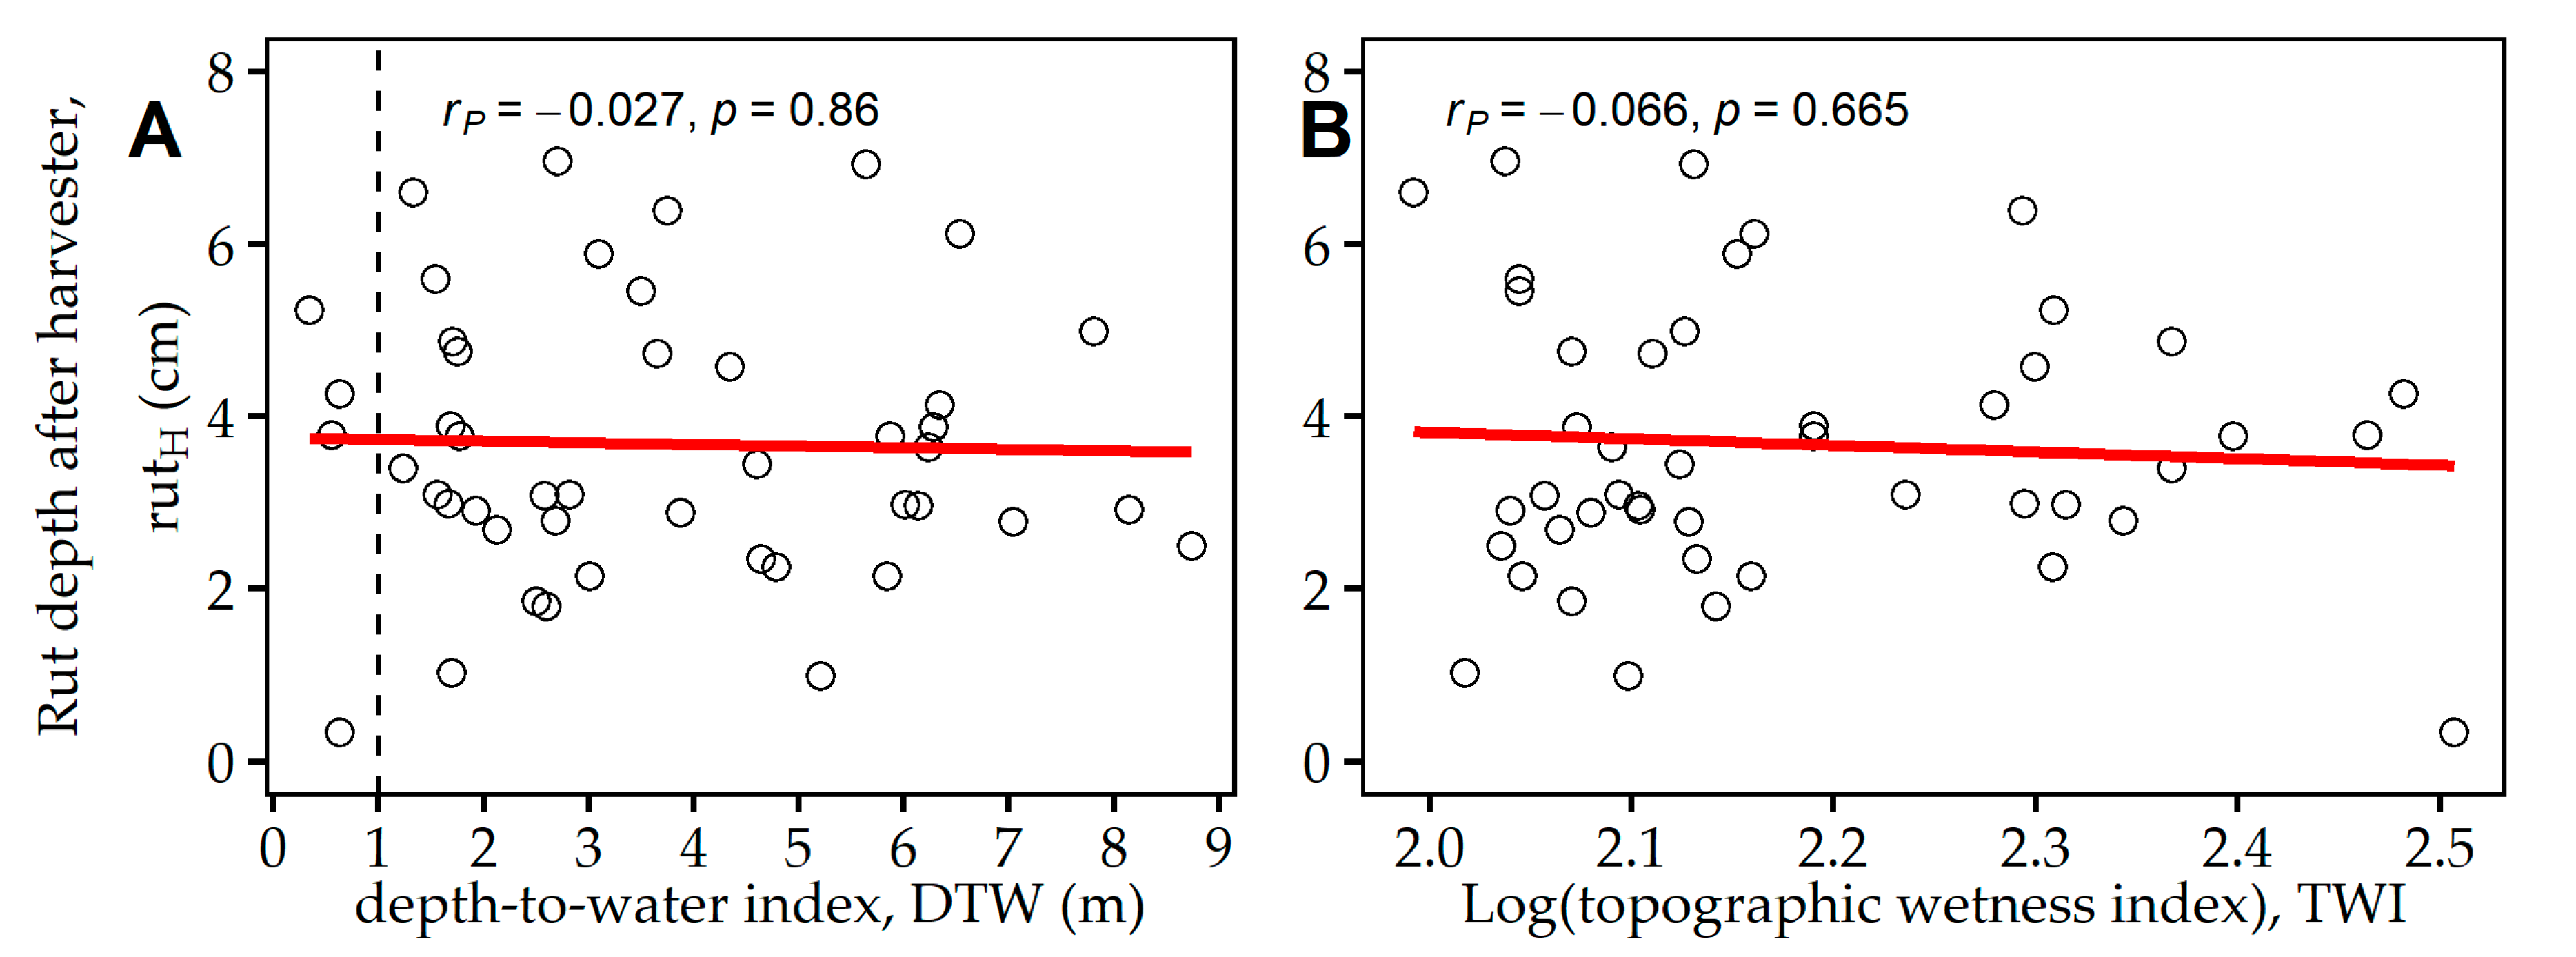
  • Can rut depth after a cut-to-length (CTL) thinning-operation be predicted by the two used cartographic indices (i.e., depth-to-water and topographic wetness index)?
  • Which of the applied terramechanical test procedures show a reliable response with occurring rut depth, in terms of a high Pearson coefficient of correlation?
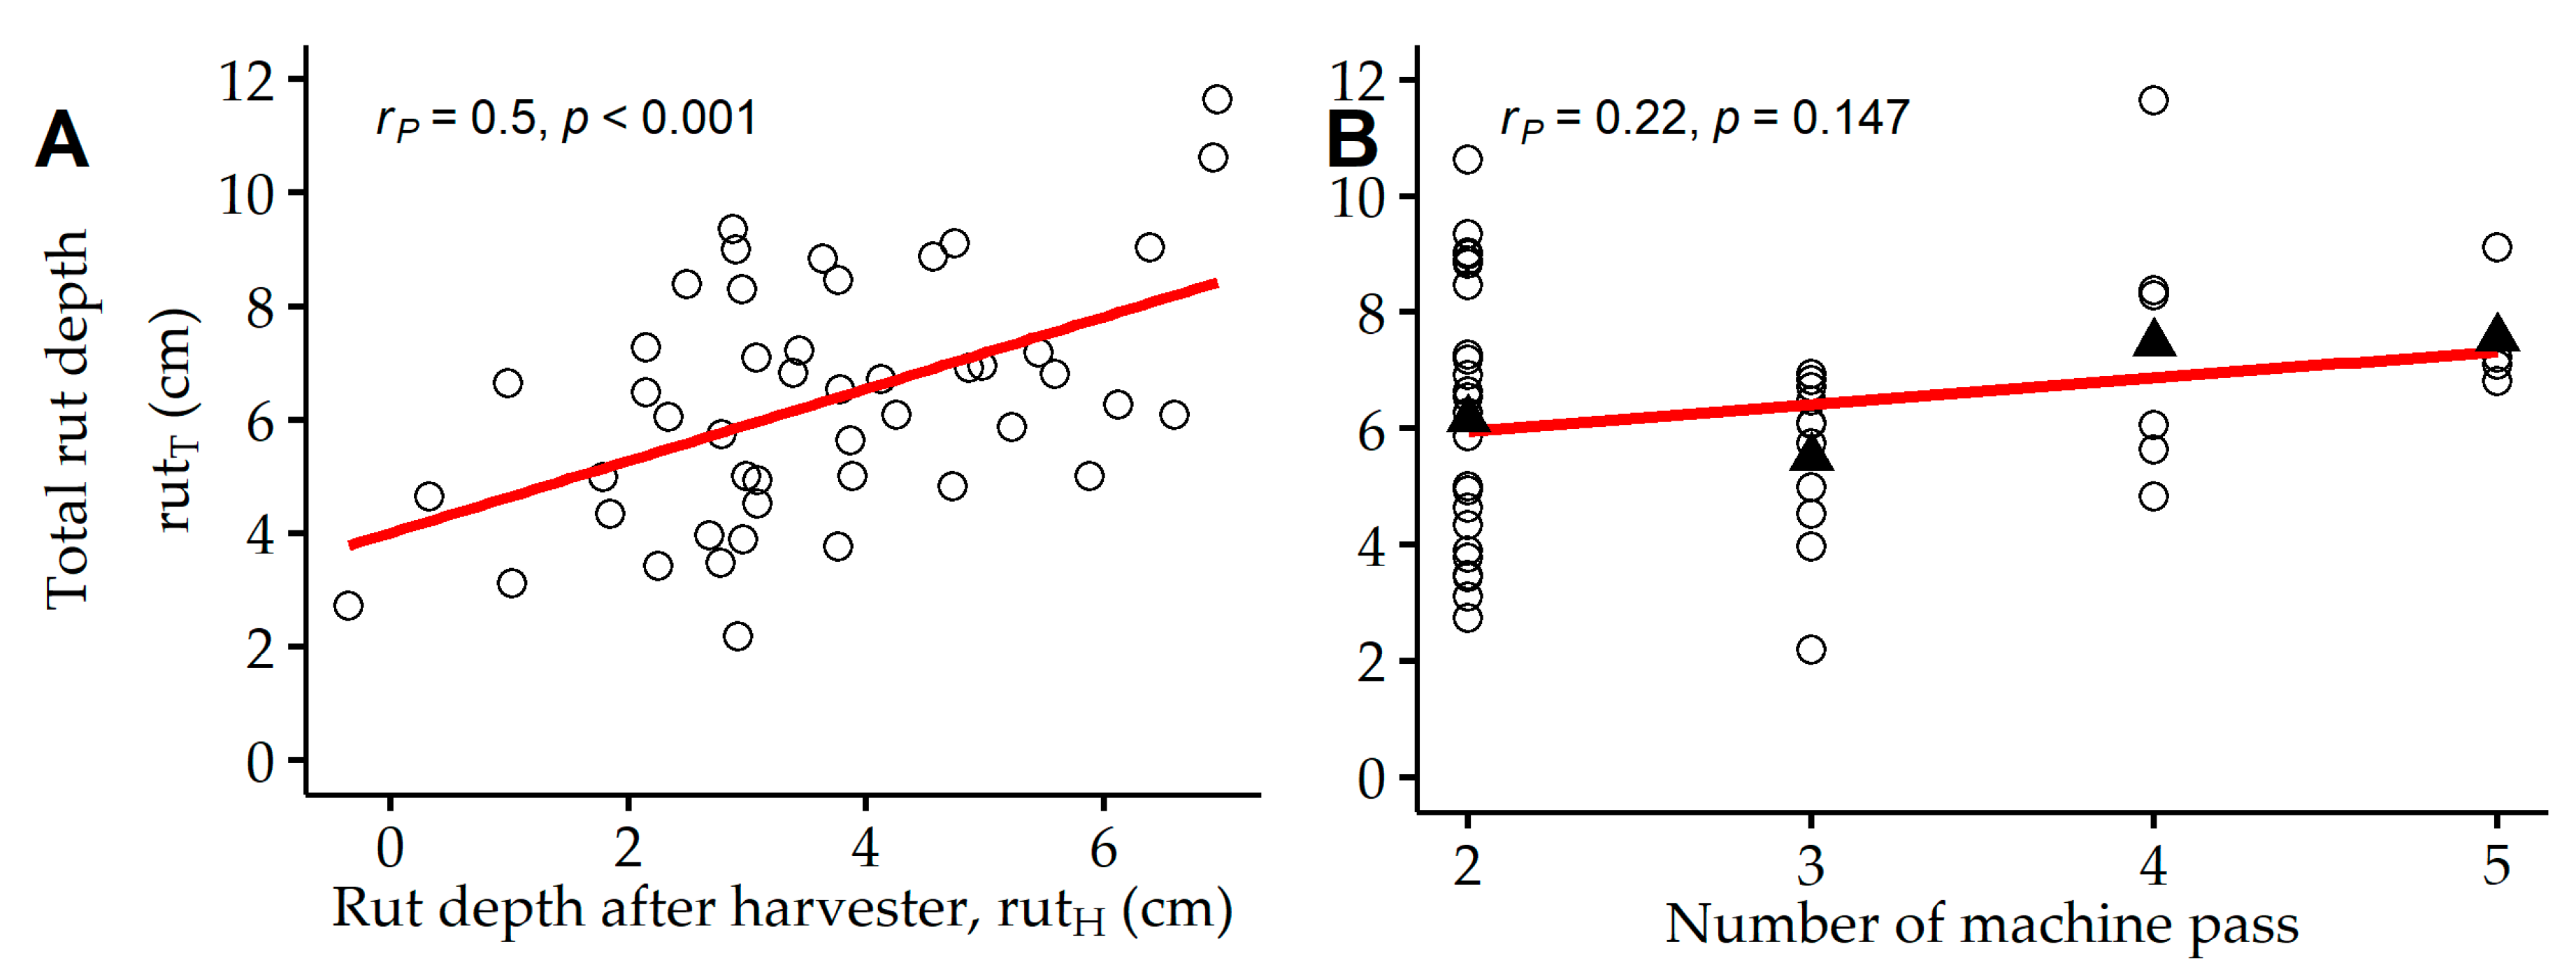
  • Is rut depth formation after the first machine pass (i.e., facilitated by a harvester) a reliable figure to predict total rutting of a consecutive CTL thinning operation?
To answer these questions, a field trial was conducted at newly assigned machine operating trails. There, cartographic indices were calculated and in-situ measurements were performed in advance to a regularly planned CTL thinning operation. Rut depth was estimated after the first and final machine pass and analyzed in relation to cartographic indices and previously conducted field measurements.

2. Materials and Methods

2.1. Stand Characteristics

The study was performed in two stands, both located near the town of Uslar in Lower Saxony, Germany. The larger stand B (Figure 1B, area: 7.7 ha, x: 9.61, y: 51.71, WGS 84) was characterized by 95-year-old beech (Fagus sylvatica), showing a mean diameter at breast height of 28 cm. This stand was intermixed with grouped Norway Spruce (Picea abies, age: 75 years). The smaller stand A (Figure 1A, area: 1.9 ha, x: 9.60, y: 51.70, WGS 84) was stocked by 40-year-old beech, scattered with European larch (Larix decidua) and Norway Spruce. The stands were growing on Cambisol [40], based on a silicate bedrock. The terrain was smooth with a slight slope, less than 30%. The long-term mean of annual precipitation amounts 892 mm [41]. Yet, overall dry conditions were present during the field campaigns, caused by a low precipitation of 345 mm between March and August [42].

2.2. Harvesting Operation

A CTL thinning operation was performed at the study sites. Felling and processing were executed by a single grip harvester (see Table 1 for machine specifications) on 4 August 2020 (Table 2). In the days between felling and forwarding (Table 1, 17–21 August), 45 mm of precipitation occurred at the site. On average, 36 m3 ha−1 were harvested at the study area by clearing the machine-operating trails and thinning the forest stands.
The operating harvester resulted in a single machine pass on the machine operating trails (number of machine pass = 1). The subsequently operating forwarder was equipped with a GNSS device, constantly tracking the machine position during timber extraction. Thus, the number of passes, as illustrated in Figure 1, was assigned to all 47 measuring transects.

2.3. Field Measurements

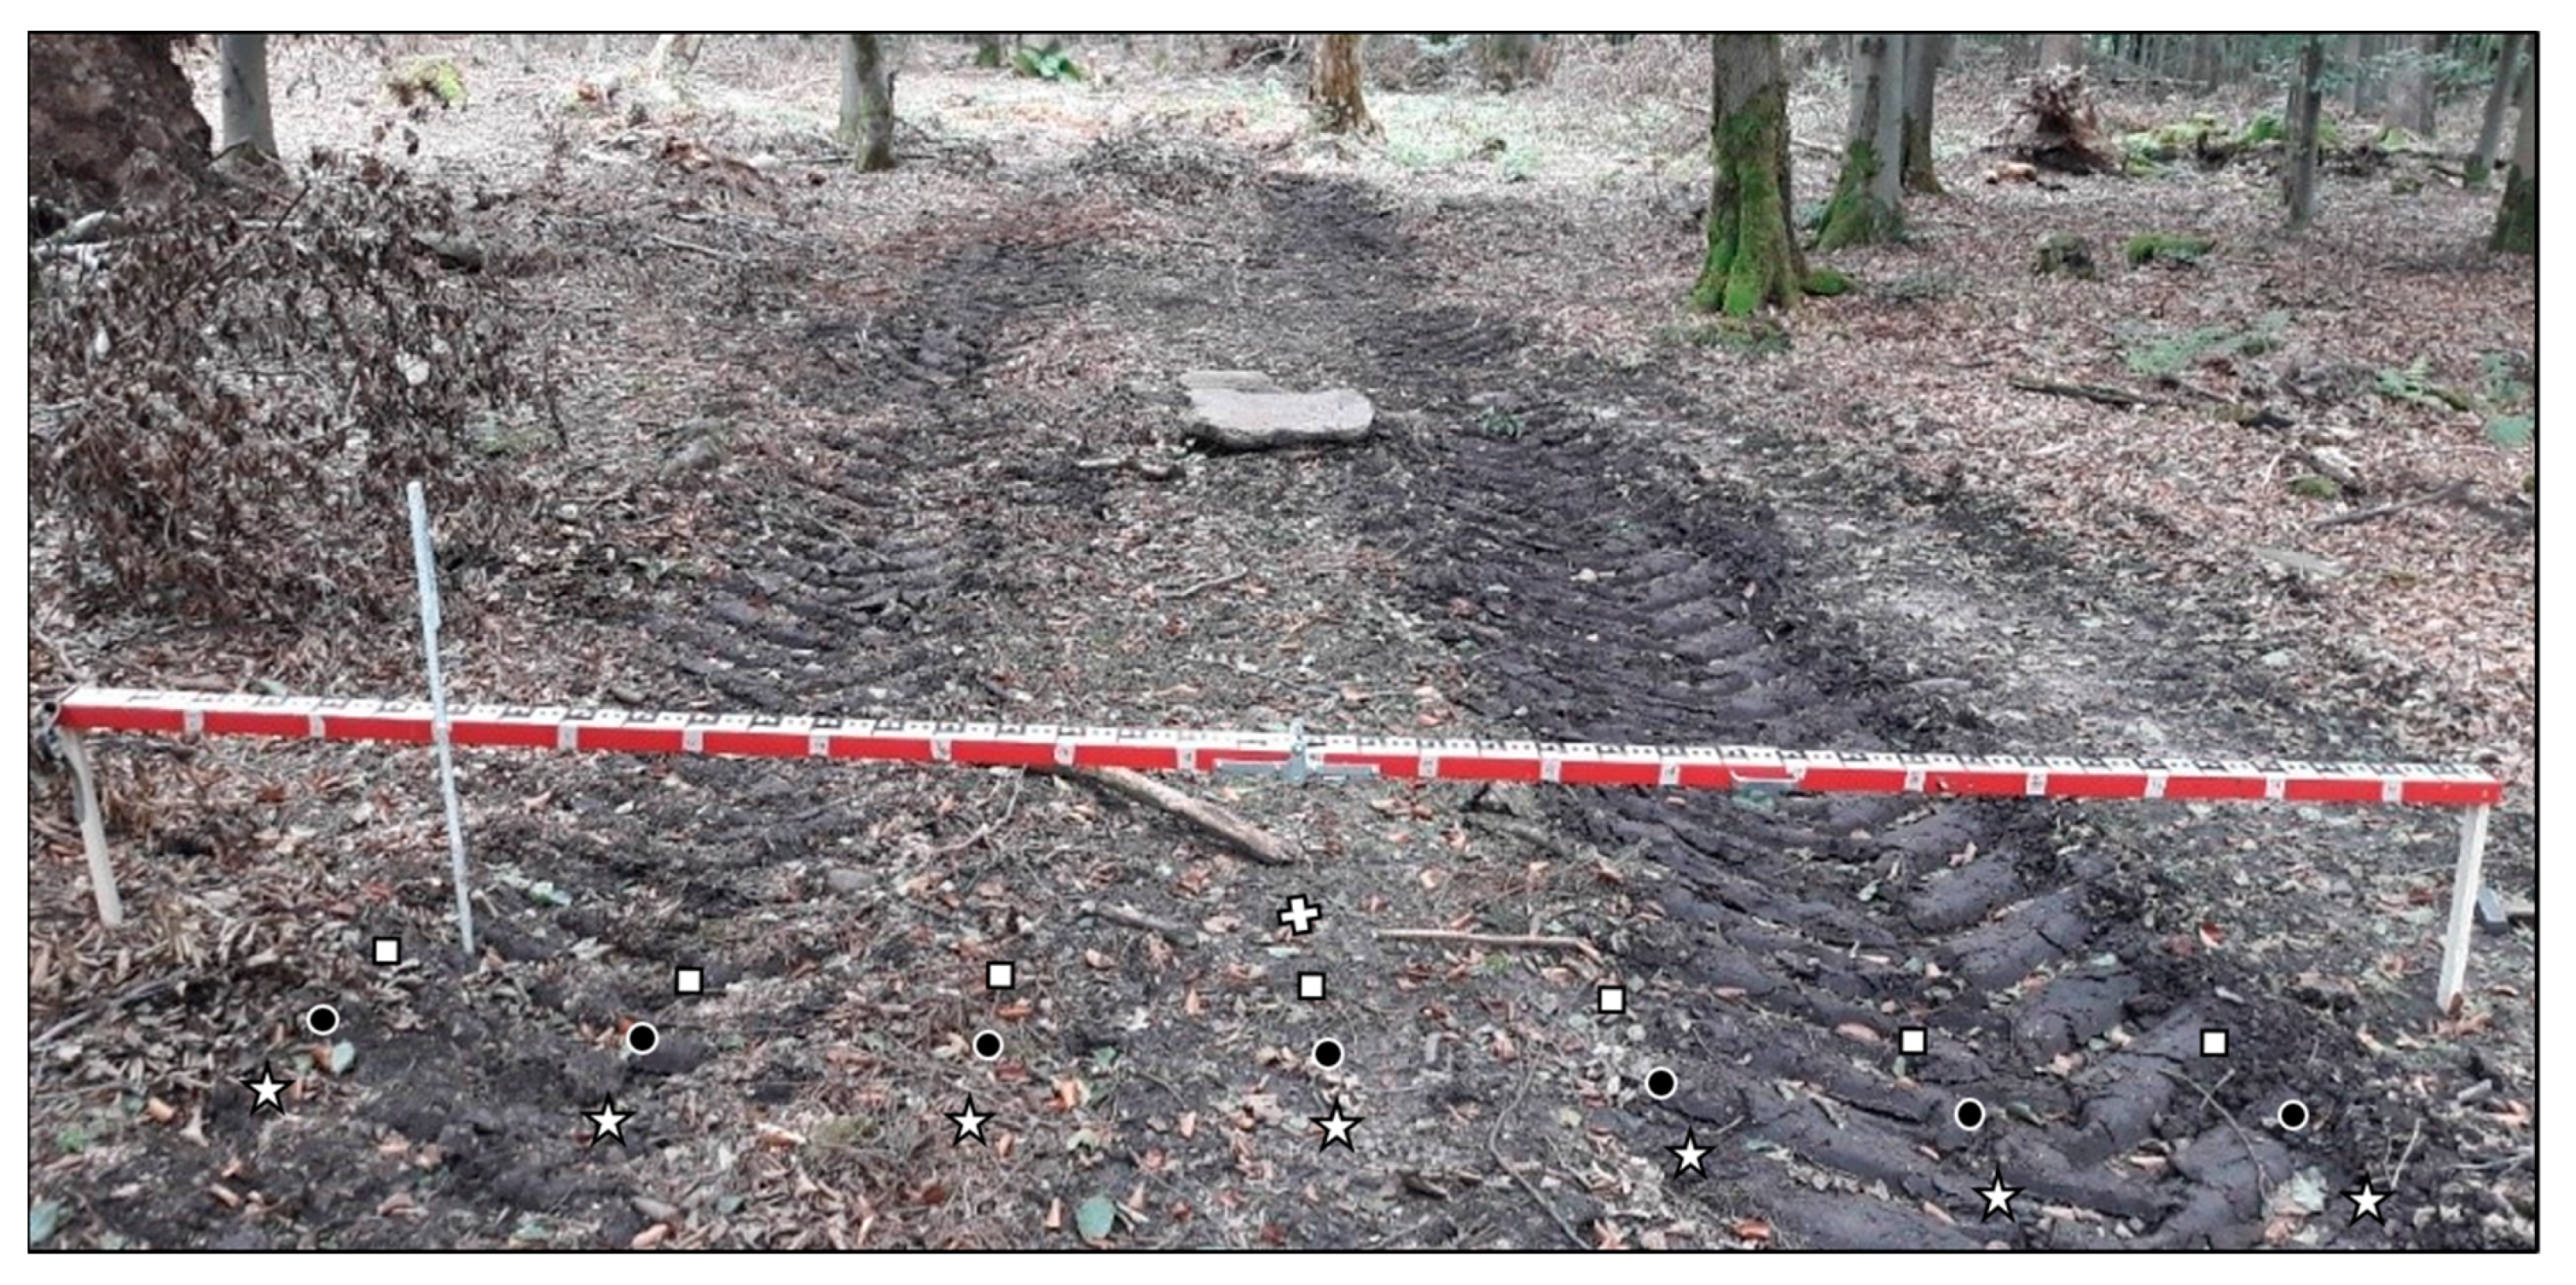
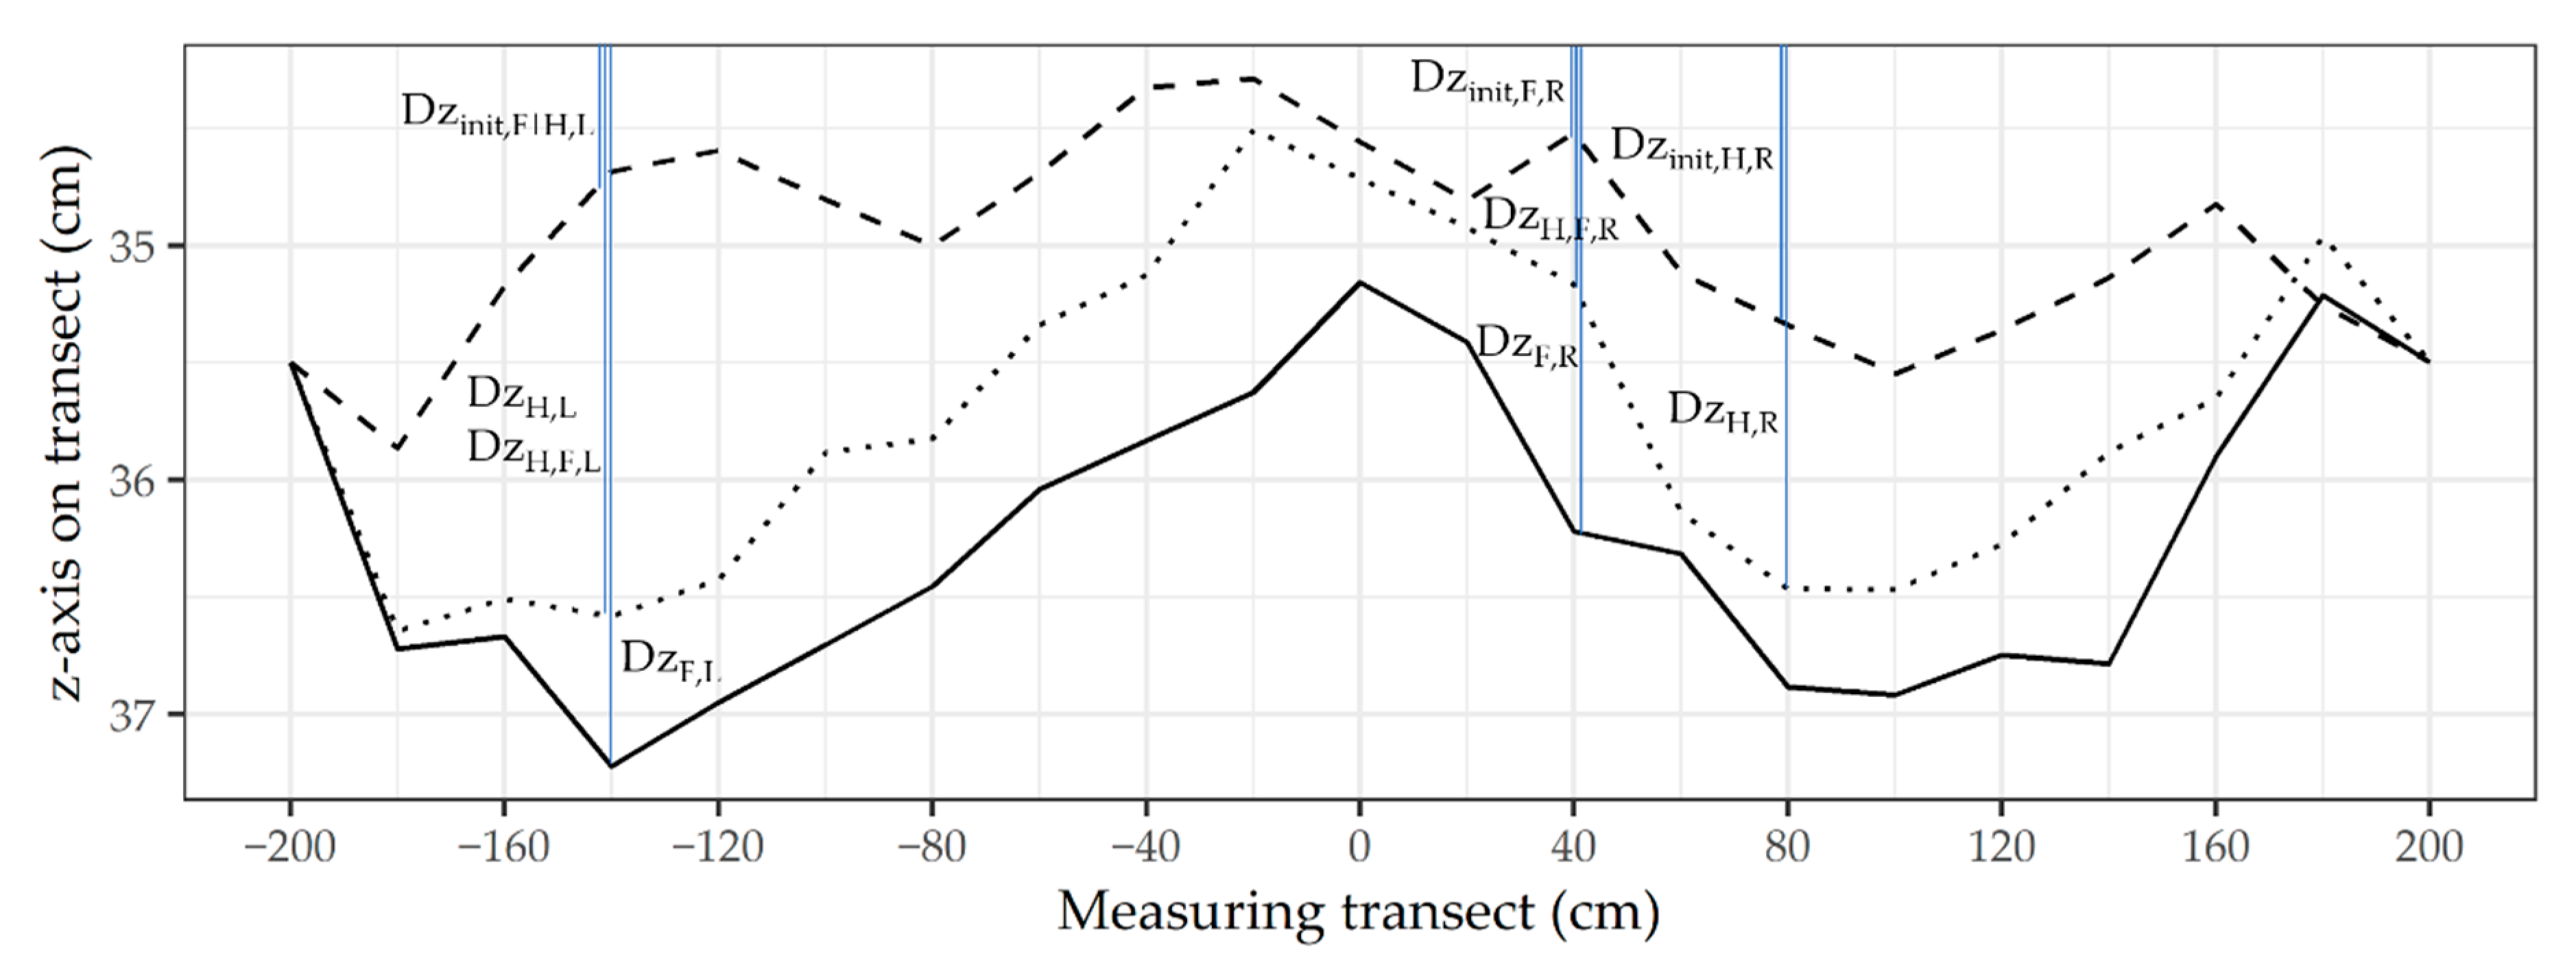
2.3.1. Rutting on Machine-Operating Trails

Following the concept of permanent machine operating trails, a new system of parallel running machine-operating trails, with a spacing of 24 m from the center line, was established in both stands to make the area of 9.6 ha in total accessible for forest machines. Therefore, the projected machine operating trails were marked in the stands. On a total of 19 newly planned machine operating trails, 90 perpendicularly positioned transects with a length of 4 m each, were created. At both ends, wooden pegs were placed, in order to mark each transect and to position a reference beam (Figure 2), used to measure the rutting process during the conducted harvesting operation. For that purpose, the initial profiles along each transect were measured using a yardstick at 20 cm spacing.
This initial profile or reference surface was defined by the distance between the beam (levelled at the wooden pegs) and the surface, giving Dzinit (Figure 3). This (1.) measurement was done after loose humus material had been removed. Profiles along each transect were repeatedly measured: (2.) after the harvester passed, giving DzH (Figure 3) and (3.) after the timber extraction via forwarder was accomplished, giving DzF (Figure 3). Several wooden pegs, used to position the reference beam, were severely displaced during the harvesting operation, reducing the initial 90 measuring transects to the remaining 47 ones (Figure 1), since the rut depth could not be quantified anymore. When DzH and DzF were measured, the position of the tracks on the transect was captured as a dummy variable (t, where a visually detectable track was defined as “L” (left machine track) or “R” (right machine track, Table A1), used for the calculation of occurring rutting (Appendix B). Consequently, where t equals “L” or “R”, the maximum difference between DzH and Dzinit (Figure 3) of the left and right track were used to calculate the rut depth after the operating harvester, rutH (cm), according to Equation (1):
rut H = n = 2     D z H , i D z i n i t , H , i n
Used variables for Equations (1)–(3) are illustrated in Figure 3, where i represents “L” or “R”; the applied R-grammar is shown in Appendix B.
Following the same approach, rutting after forwarding (rutF, cm) was calculated according to Equation (2), whereas the differences between DzF and DzH were used to quantify rutF, describing the additional rutting after the harvester has passed already:
rut F = n = 2     D z F , i D z H , F , i n
Since total rut depth (rutT, cm) cannot be calculated as the sum of rutH and rutF, as both machines might not drive exactly in the same machine track, the same procedure was applied to quantify rutT. The differences between either DzF or DzH, and Dzinit were analyzed on tracks, after the CTL thinning operation was accomplished, as illustrated in Figure 3, according to Equation (3):
rut T = n = 2     D z F | H , i D z i n i t , F , i n

2.3.2. Soil Samples

Along the newly assigned and still uncleared machine operating trails, soil samples were collected at randomly chosen measuring transects. Pre- and post-operational sampling was done at 15 measuring transects (Figure 1, rhombs), out of the 90 initial transects. Samples collected at nine of these 15 transects could be used to correlate parameters derived from soil samples with occurring rut depth, due to the above-mentioned reduction of measuring transects to 47 remaining ones (Section 2.3.1). Still, the six remaining sampling positions (Figure 1, black rhombs) were used for correlations with terramechanical test procedures only (Section 2.3.3).
The soil samples were either collected at the potential right or left machine track (position was assumed during the initial sampling), using 100 cm3 sampling rings. Pre- and post-operational samples were taken in a depth between 10 and 15 cm of the mineral soil. Subsequently, initial soil bulk density (SBDINIT, g cm−3), as well as post-operational soil bulk density (SBDPOST, g cm−3) were used to calculate compaction (comp, %), according to Equation (4):
c o m p =   S B D P O S T   S B D I N I T S B D I N I T 100
The fresh samples were weighed, giving an initial mass (MFRESH, g), then dried in an oven (105 °C) until mass constancy was reached. Afterwards, samples were weighed again, giving MDRY (g), used to calculate gravimetric soil moisture content (SMCGRAV, %), according to Equation (5). Additionally, soil texture was analyzed on three mixture probes, containing all soil samples, according to the approach of Durner et al. [43]
S W C G R A V =   M F R E S H   M D R Y M D R Y 100

2.3.3. Terramechanical Test Procedures

Despite SBDJ and MJ, both being measured before and after the CTL thinning operation, the remaining soil parameters were measured in advance of the operation only (Table 2), describing initial conditions. These initial conditions were further used to address the posed research question concerning the comparison among the included terramechanical test procedures. For that, initial measurement results were associated with rutH. Soil moisture content, penetration resistance, depth and shear strength were measured on the 90 initial measuring transects, but only 47 of them could be used to be correlated with rutH. The measurements by the used instruments (Figure 4) were spaced by 10 cm to each other, with a spacing of 50 cm along each transect (Figure 2):
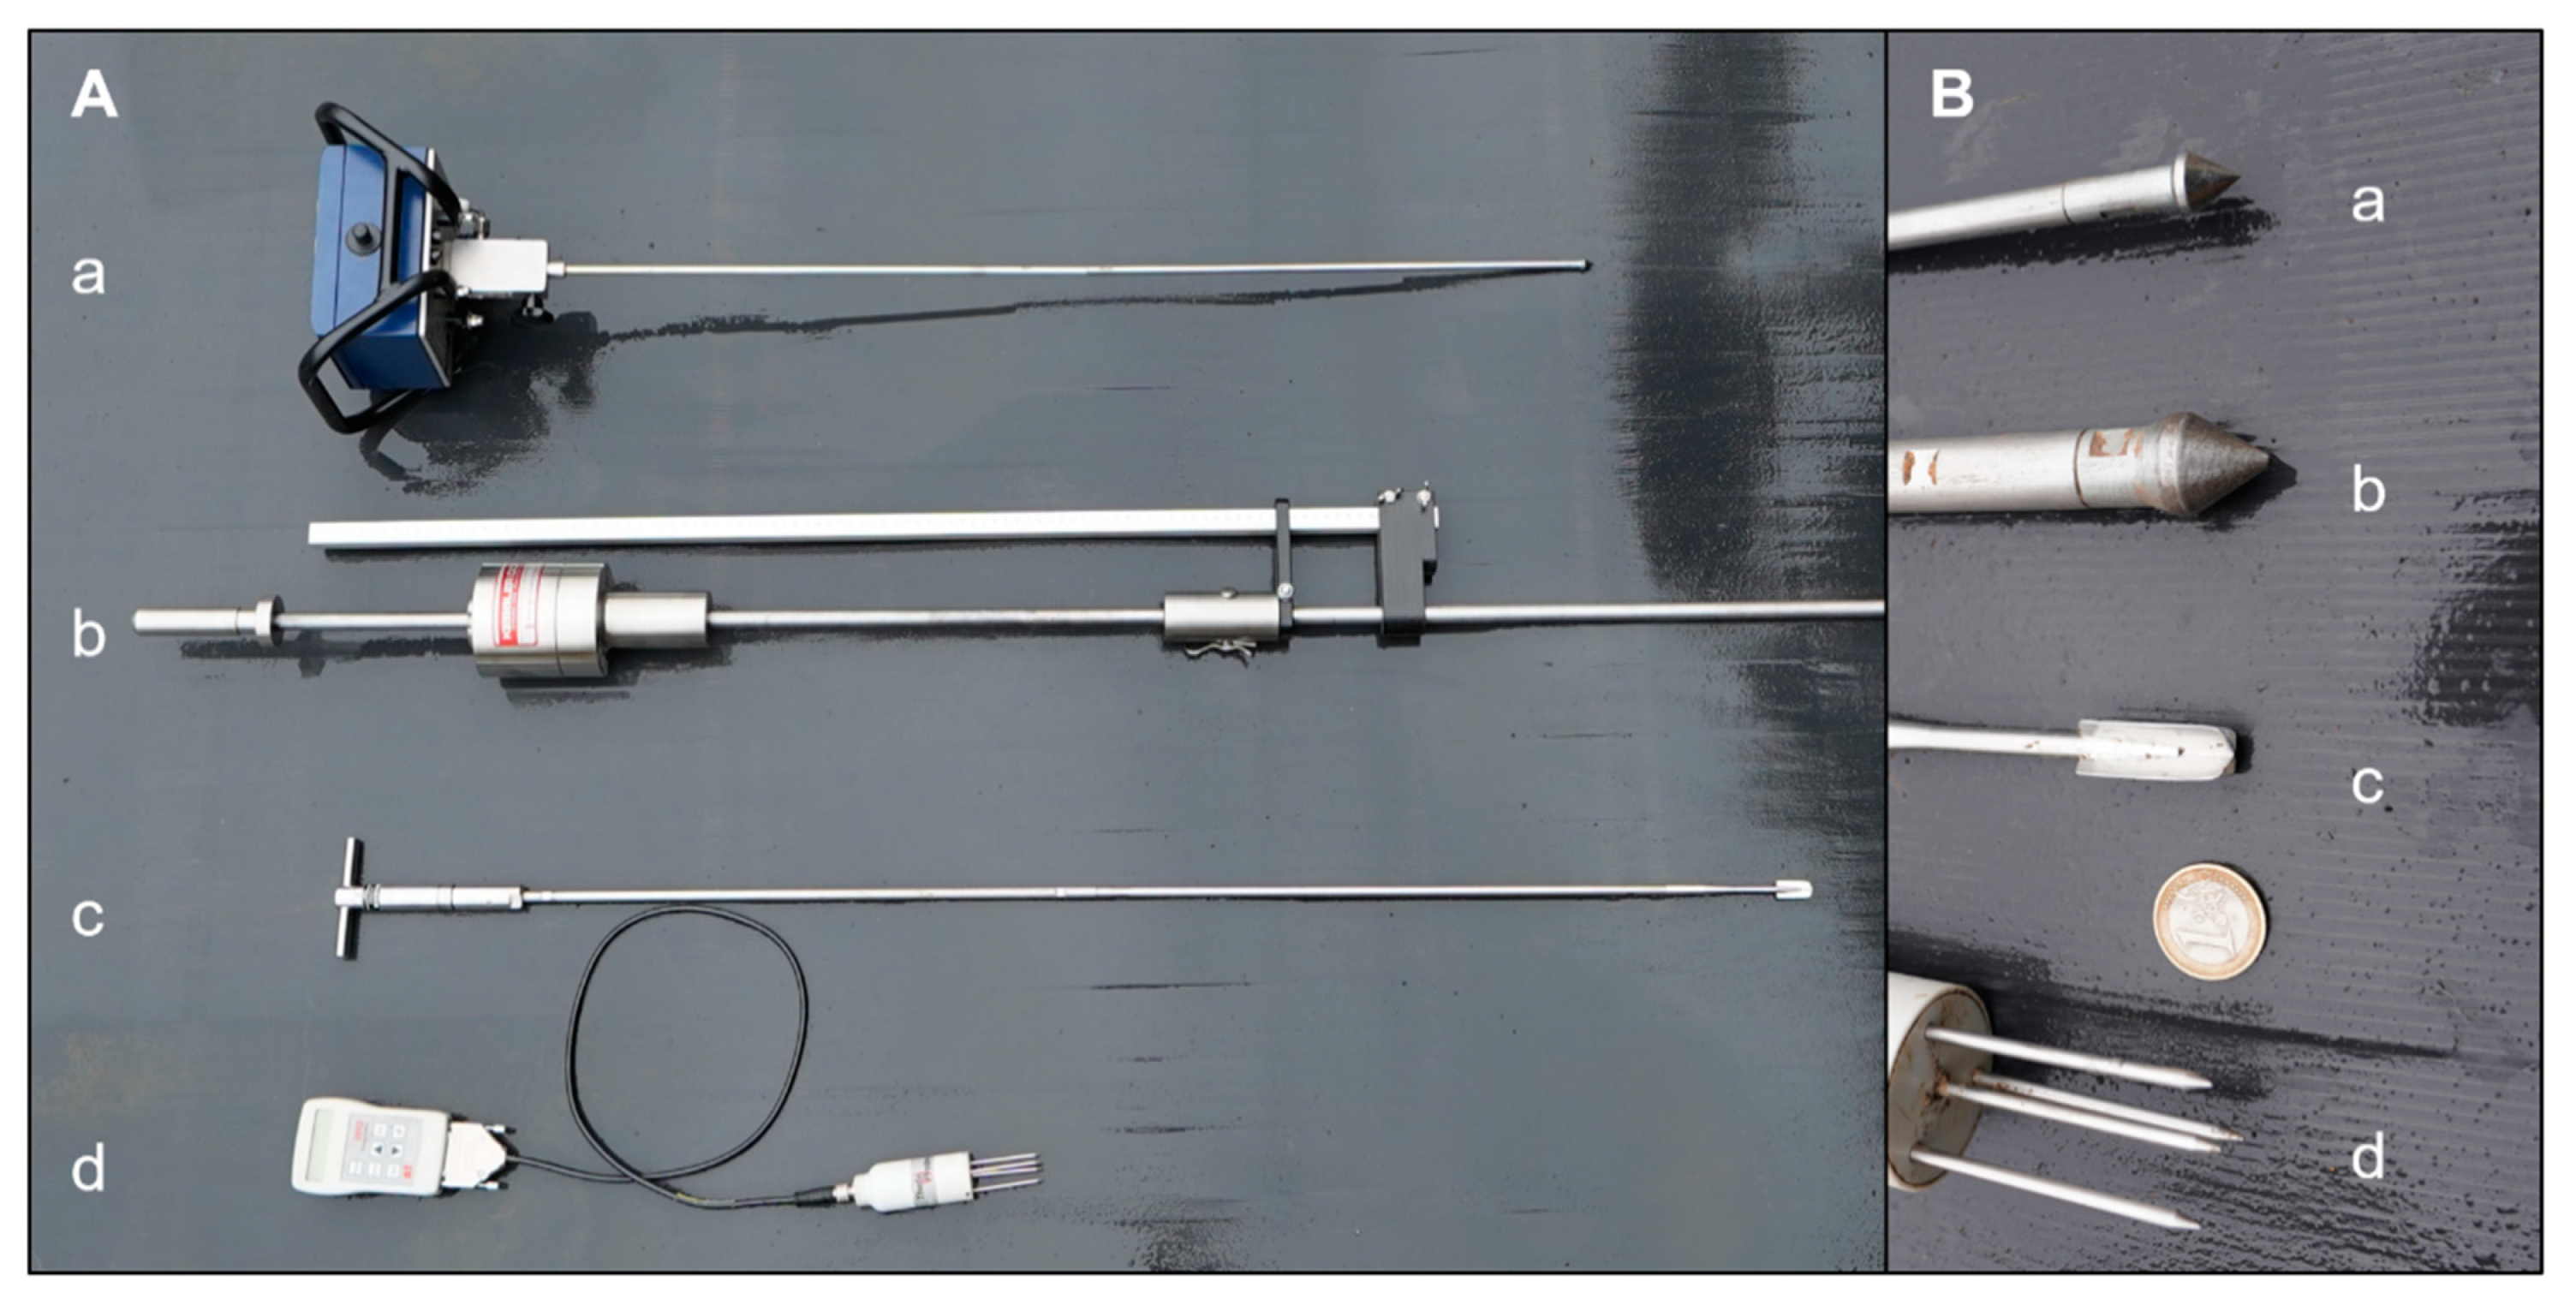
  • Moisture meter: Volumetric soil moisture content (SMCVOL, vol%) was quantified in the mineral topsoil, where a 57 mm long TDR probe (HH2-moisture meter, Delta-T-Devices, Cambridge, UK) was inserted from above, after the removal of humus. This moisture meter measures volumetric moisture content, θv, by responding to changes in the apparent dielectric constant of moist soil, resulting in a ratio between the volume of water and the total volume of the soil sample [44]. Seven measurements on each transect were averaged, giving SMCVOL.
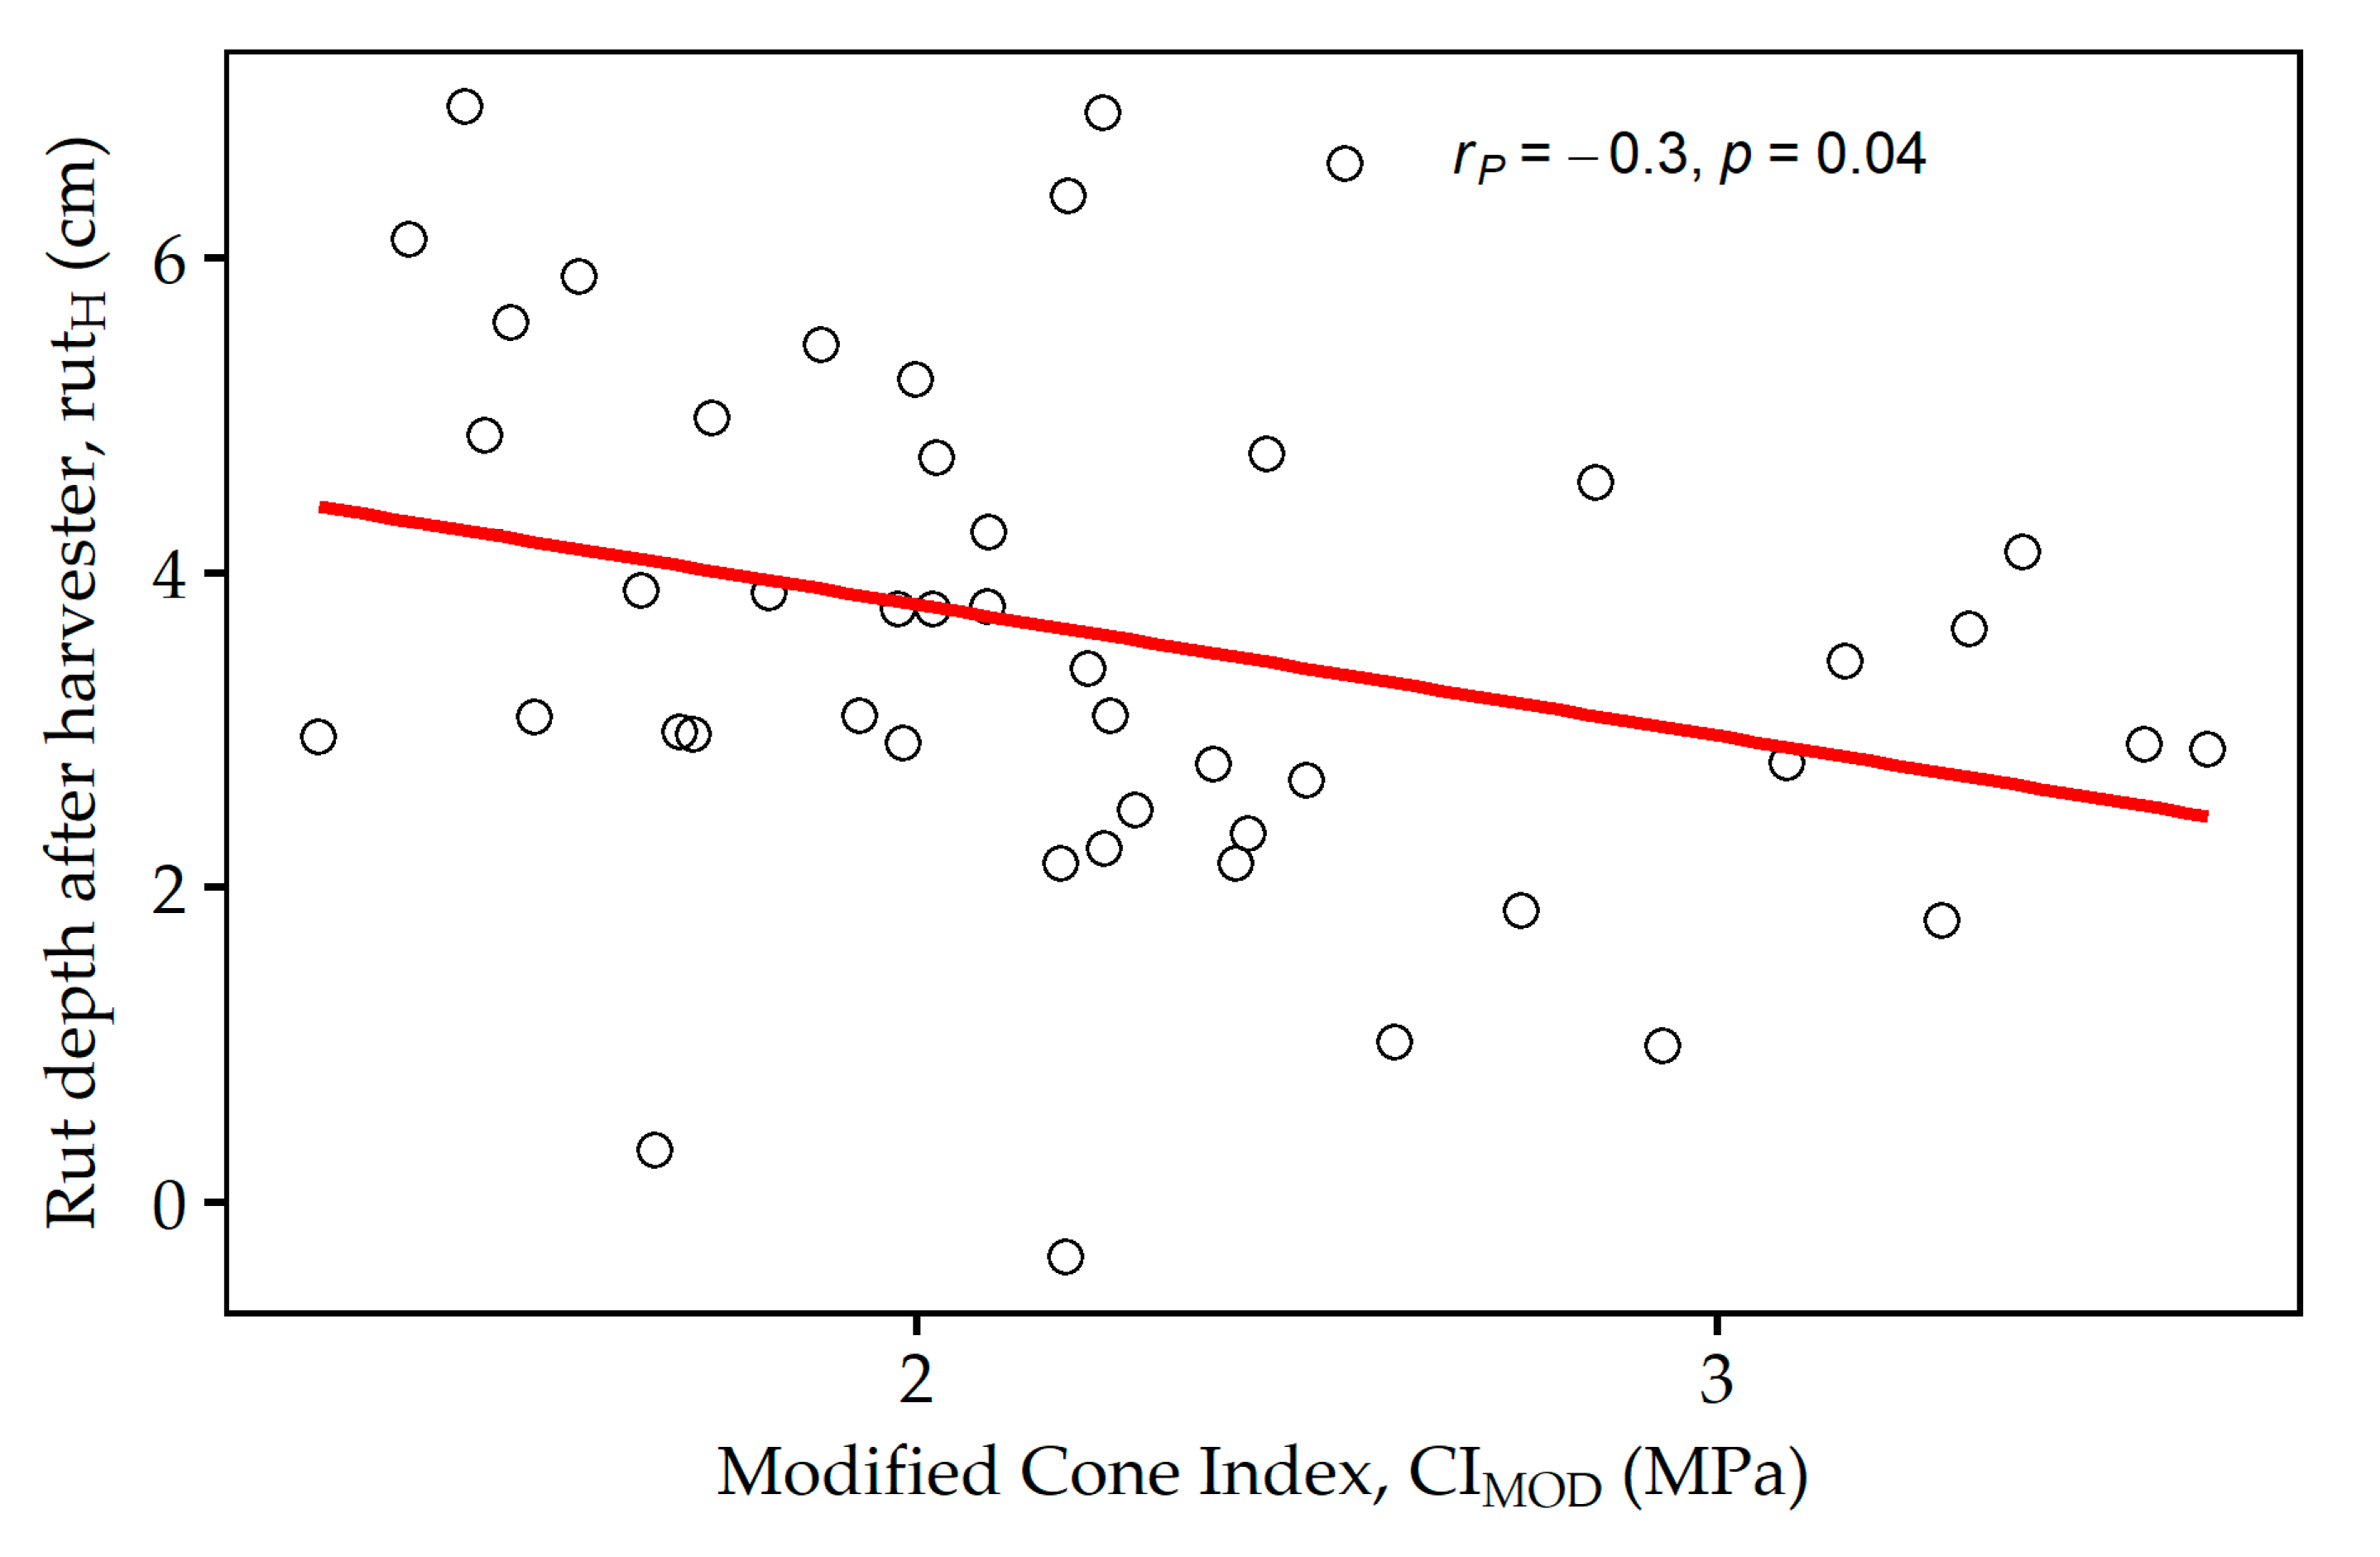
  • Penetrologger: Penetration resistance was measured, using a handheld Penetrologger (1.0 cm2, 60° cone, Eijkelkamp Soil and Water, Giesbeek, The Netherlands). This device captures the soil penetration resistance for each centimeter by means of a load cell, whereas values of the upmost 15 cm of mineral soil were averaged giving a Cone Index (CI, MPa), as mean value for seven penetrations on each transect. Based on previous experience by the authors [45], a modified Cone Index (CIMOD, MPa) was calculated in addition. In contrast to the estimation of CI, soil penetration values between 10 and 20 cm were considered to quantify CIMOD, due to the high variance of penetration resistance in the upmost centimeters. Besides, the total penetration depth, captured by the Penetrologger, was averaged for each measuring transect, giving PD (cm).
  • Dual-mass dynamic cone penetrometer: Since we decided to keep the time demand for measurements approximately similar between the compared methods, the number of samples was reduced for this instrument. Consequently, one measurement, consisting of six hammer blows, was done in the middle of each transect. The incremental penetration depth was captured and used to calculate the corresponding parameter, derived by the dual-mass dynamic cone penetrometer, DCP (cm blow−1), defined as the average of penetration depth per hammer blow, until it exceeded 15 cm penetration depth.
  • Vane tester: The used Eijkelkamp (Eijkelkamp Soil and Water, Giesbeek, The Netherlands) field inspection vane tester is an instrument for in-situ measurements of shear strength through vanes of different sizes. Measurements are conducted through a spiral spring, detecting the torque, which needs to be applied to a handle in order to displace the soil through the vane. The used (and smallest, 16 mm × 32 mm sized) vane allows to cover readings up to 260 kPa, by an accuracy within 10% [46]. The current measurements were done in a mineral soil depth of 10 to 15 cm, as recommended by Heubaum et al. [30], giving shear strength (τ, kPa) as mean value for each measuring transect.

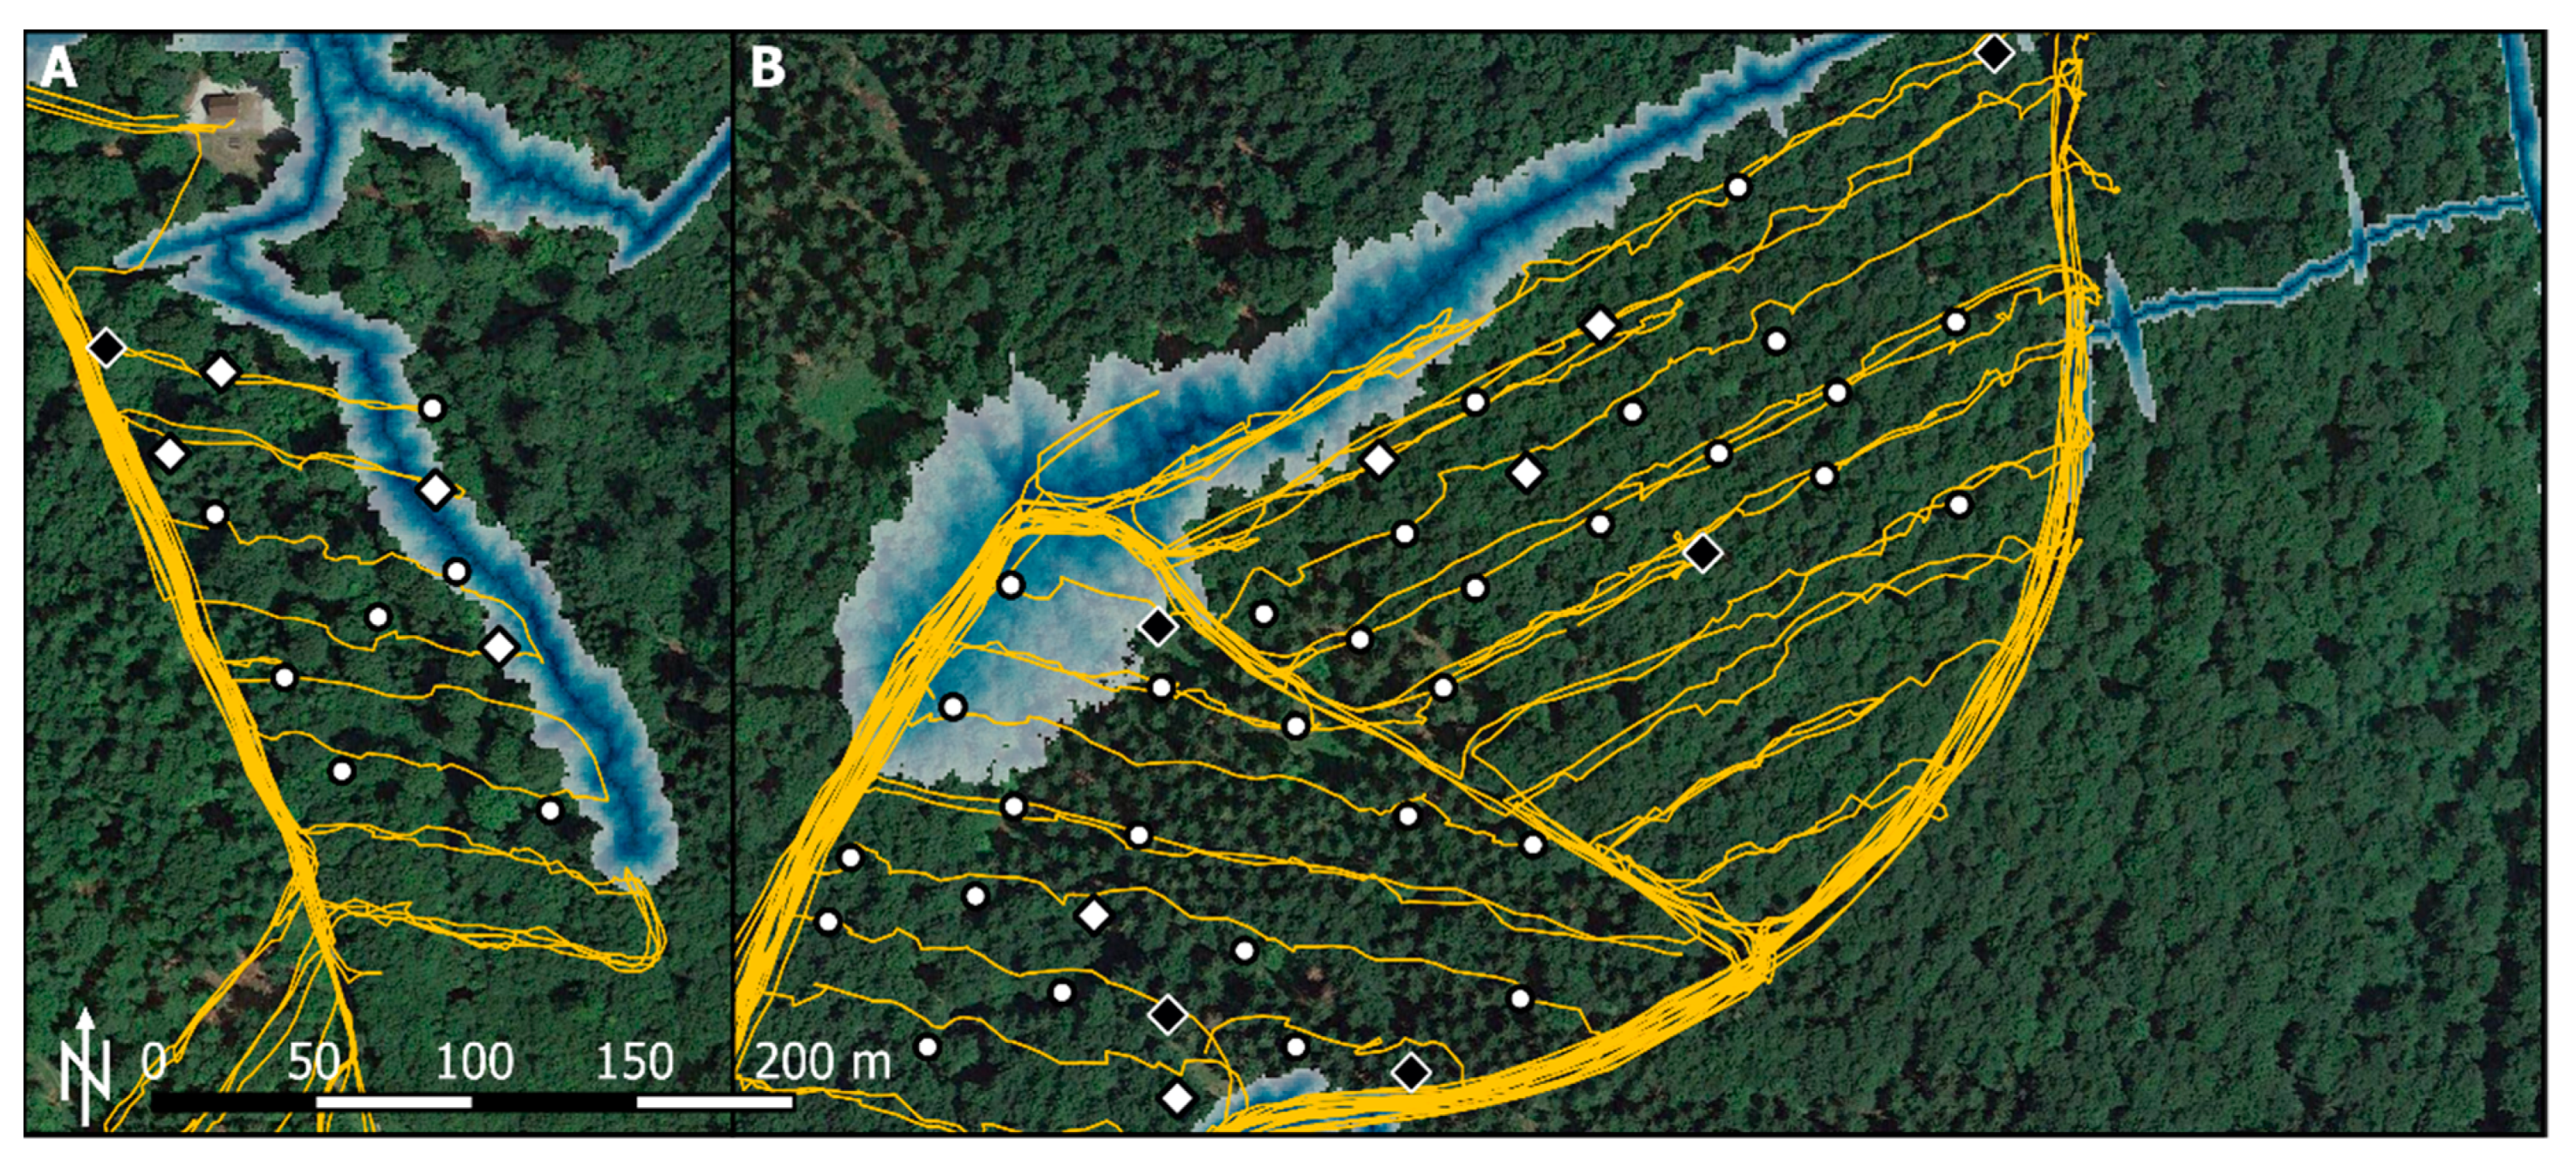
2.4. Trafficability Maps

During the field campaigns, multiple positioning measurements were conducted using a handheld GPS device (Oregon 700, Garmin Ltd., Olathe, KS, USA). Later, these waypoints were averaged to get the nearest approximation of the transects’ position. From the 90 initial measuring transects, 47 were used for the correlation between measured rut depth and calculated indices. These point positions were used to join field measured data with remote processed data using QGIS (version 3.10.10, Open Source Geospatial Foundation Project [47]). Two trafficability indices for the identification of wet and therefore sensitive areas within forest stands were calculated using QGIS.

2.4.1. Depth-to-Water Index

Digital terrain models (DTM) are the only prerequisite input data to calculate depth-to-water (DTW) maps. Within this study, a DTM with a grid size of 1 m has been used, originally collected by the State Office for Geoinformation of Lower Saxony [48]. Based on this model, DTW maps were created according to Murphy et al. [36], as extensively described already [25,36,37,49,50,51,52,53]. In short, a flow accumulation model of the DTM is generated using the D8 flow algorithm. When the flow accumulation of a cell reaches a certain value, the very cell is defined as the starting point of a flow line, which continues the flow downhill until leaving the mapped area. The required area to start a flow line is defined as “Flow Initiation Area” and herein was set to 4 ha, as suggested by Jones and Arp [29] for likewise conditions. Subsequently, a least-cost function calculates the least slope path from each cell within the grid towards the nearest flow line [36,37]. Hence, low values of the metric DTW index indicates a spatial proximity (in a vertical direction) to the nearest flow line, with assumed wet or poorly to imperfectly drained areas. A DTW index of up to 1 m is usually assumed to show areas with water-saturation, which are associated with a high susceptibility towards rutting. Contrarily, high values of the index generally indicate dryer and therefore accessible areas.

2.4.2. Topographic Wetness Index

In addition, the topographic wetness index (TWI), commonly used to quantify topographic control on hydrological processes was calculated according to Sörensen et al. [54]. This index combines the local upslope contributing area (a) and slope (β), given by Equation (6):
T W I = ln a tan β
Within this study, we aggregated the grid size of 1 m to receive a grid of 5 m resolution [53]. The procedure Zevenberg Thorne was chosen within a GDAL algorithm to calculate the slope grid, since the terrain was smooth. To generate the required flow accumulation grid, a SAGA algorithm was applied, which filled occurring sinks during reprocessing. Subsequently, having slope and contributing area given by the flow accumulation, TWI could be calculated according to Equation (6).

2.5. Data Analysis

All data were merged and analyzed using R core (version 4.0.2, R Foundation for Statistical Computing, Vienna, Austria [55]), interfaced with R studio (version 1.3.959, PBC, Boston, USA [56]). Normal distribution of CI, CIMOD, DCP, τ, rutH and rutF was assessed and approved via QQ-plots. Both cartographic indices were adjusted, DTW was transformed into a dummy-variable, with a margin of 1 m, TWI was log-transformed. Individual linear models were fitted between parameters. Coherently, Pearson coefficients of correlation (rP) were used to evaluate the quality of the given models, and were depicted applying a modified correlation matrix [57]. Residuals of linear models were visually assessed to identify outliers. In addition, values from transects with exceptionally high traffic were identified. Accordingly, four observations were removed. Afterwards, normal distribution of residuals was tested and confirmed by Shapiro–Wilk tests. Initial gravimetric soil moisture content was compared with post-operational, by means of a one-sided paired t-test. An unpaired t-test was applied to test for differences of rutH measured within predicted sensitive areas (DTW) and remaining ones. Analyses were usually performed on 47 observations (90 initial transects, 43 of them unusable, since rut depth could not be measured, or seemed unreliable according to the outlier analysis), or 15 observations for variables derived from soil samples. The correlation between soil bulk density and rutH was performed on nine remaining observations. All tests were done using a significance level of 0.05, tendencies were reported up to a significance level of 0.10. Values within the text are usually given as mean ± standard deviation.

3. Results

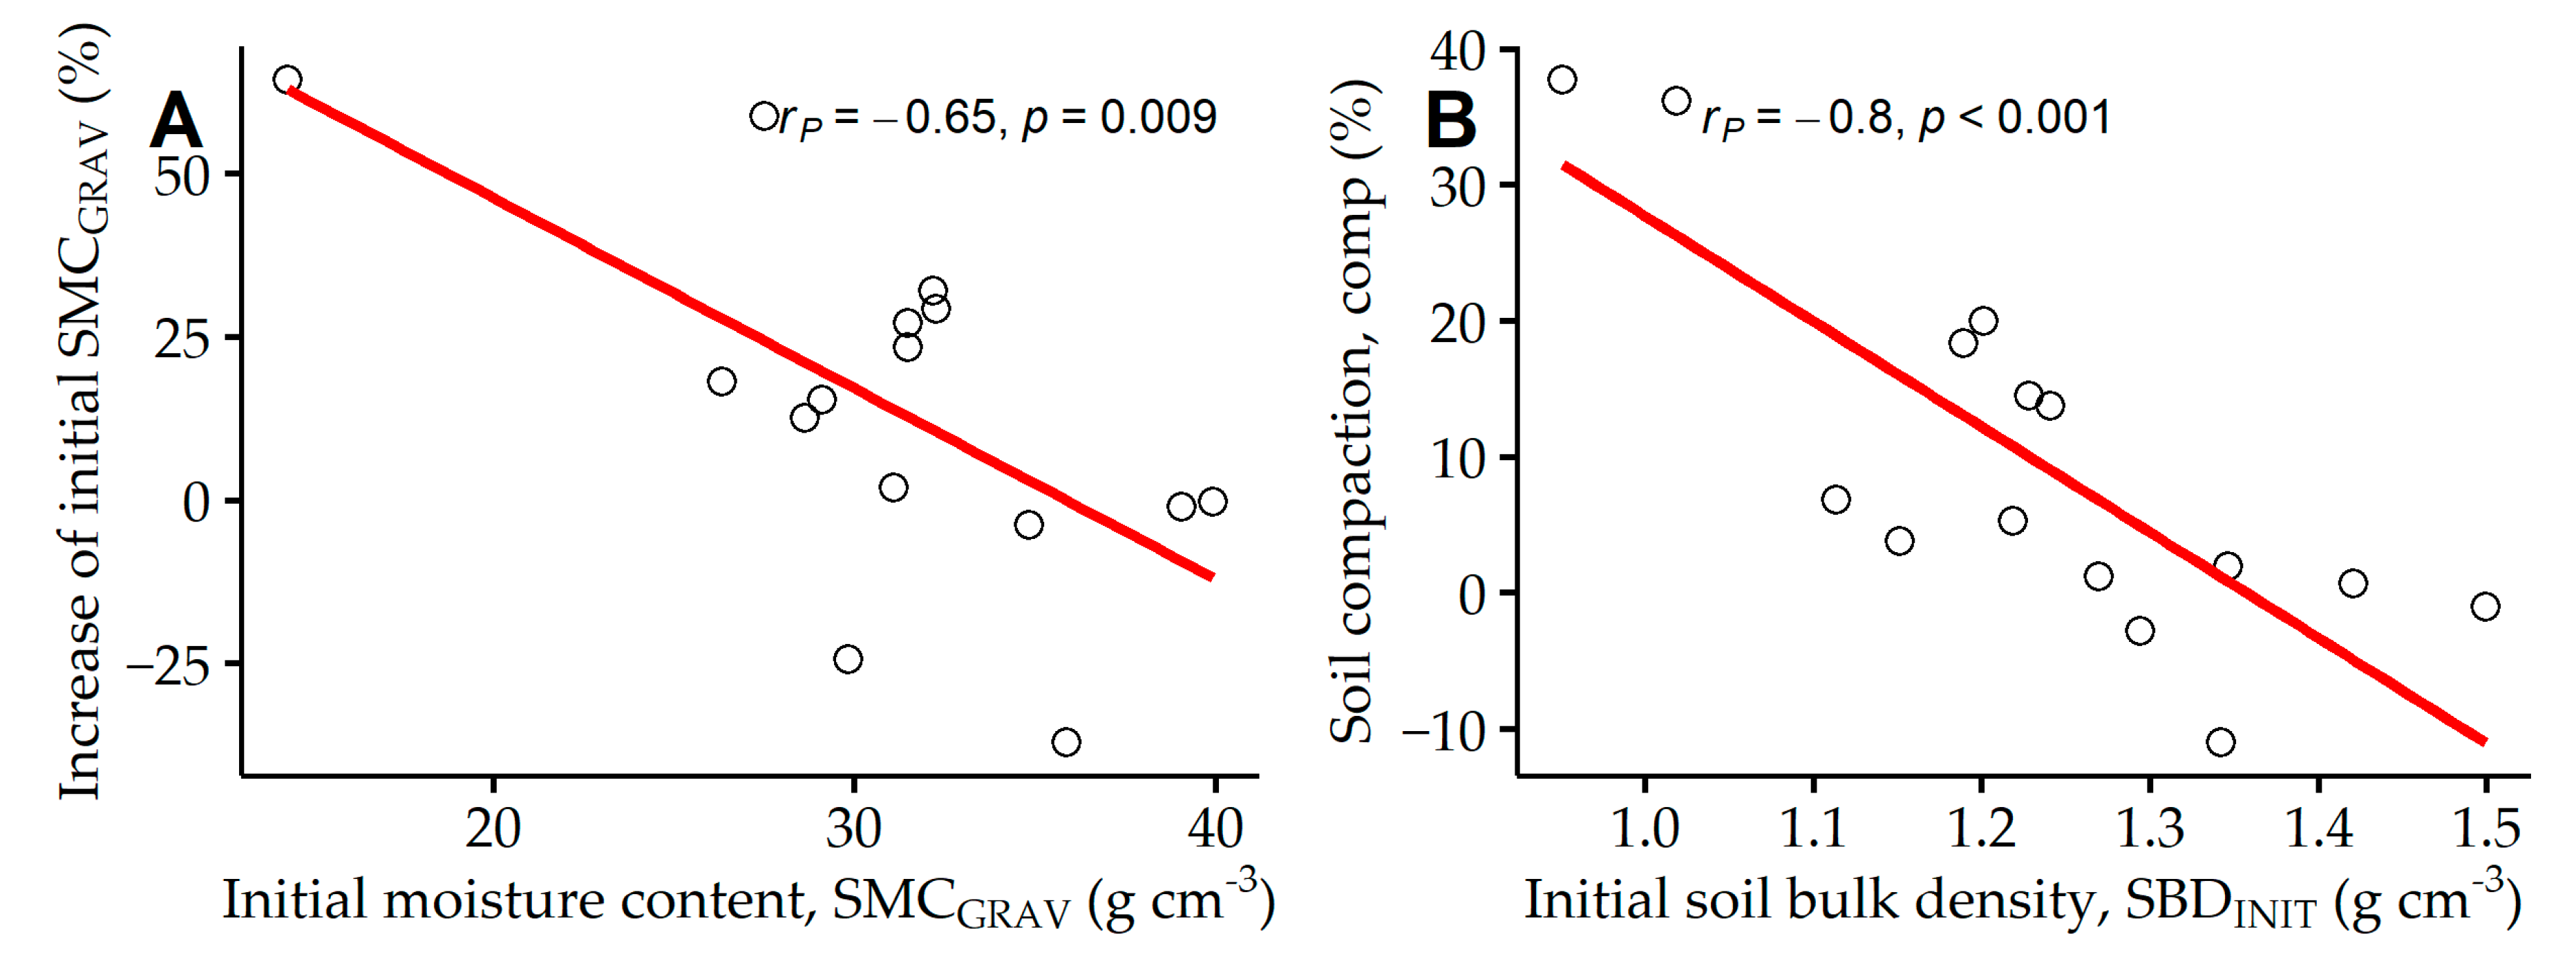
3.1. Soil Properties

The Cambisol [40] at the study area, composed of 33 ± 5% sand, 35 ± 10% silt and 32 ± 7% clay, showed a mean penetration depth of 31 ± 15 cm, derived from measurements using the Penetrologger. Across the study site, the initial volumetric moisture content averaged at 29 ± 9 vol% (spatial distribution is depicted in Figure 5), before the operation had been started. Initial gravimetric soil moisture content (SMCGRAV), estimated on 15 gathered soil samples, described similar values, with an average of 31 ± 6%. Due to 45 mm of rainfall, occurring between the time of felling (harvester) and forwarding (Table 1 and Table 2), SMCGRAV slightly increased to 34 ± 7% (p = 0.046). Apparently, the increase of SMCGRAV was higher on measuring transects with low initial SMCGRAV (Figure 6A), compared to rather moist initial conditions. Soil bulk density across the study site was quantified with 1.2 ± 0.1 g cm−3. Through the harvesting operation, this initial density increased by 10% (p = 0.017), up to 1.3 ± 0.1 g cm−3. It was observed that measured compaction showed higher extents on measuring transects with lower initial soil bulk density (Figure 6B).

3.2. Rutting

The clearing of the 19 machine operating trails and the thinning of the adjacent stand area (Figure 1) was conducted by the 24.5 Mg heavy harvester (Table 1), resulting in on average 3.6 ± 1.7 cm deep ruts (rutH), ranging from −0.4 to 7.0 cm. The subsequently driving forwarder, trafficking the same machine operating trails, resulted in additional average rutF of 3.8 ± 2.1 cm, ranging from 0.0 to 9.9 cm. Although differences between rutH and rutF were low, rutF clearly explained more variance of total rut depth (rutT), with r2 of 0.63, compared to r2 of 0.25, when rutH was correlated with rutT. Still, rutT responded to rutH, given as rut depth after the first machine pass (p < 0.001), as can be seen in Figure 7A. Thereby, rutT could be quantified with 6.3 ± 2.1 cm (2.2 to 11.6 cm). Under the given operational conditions of the current study, rutT showed no dependency of traffic frequency (2–5 passes, Figure 7B).

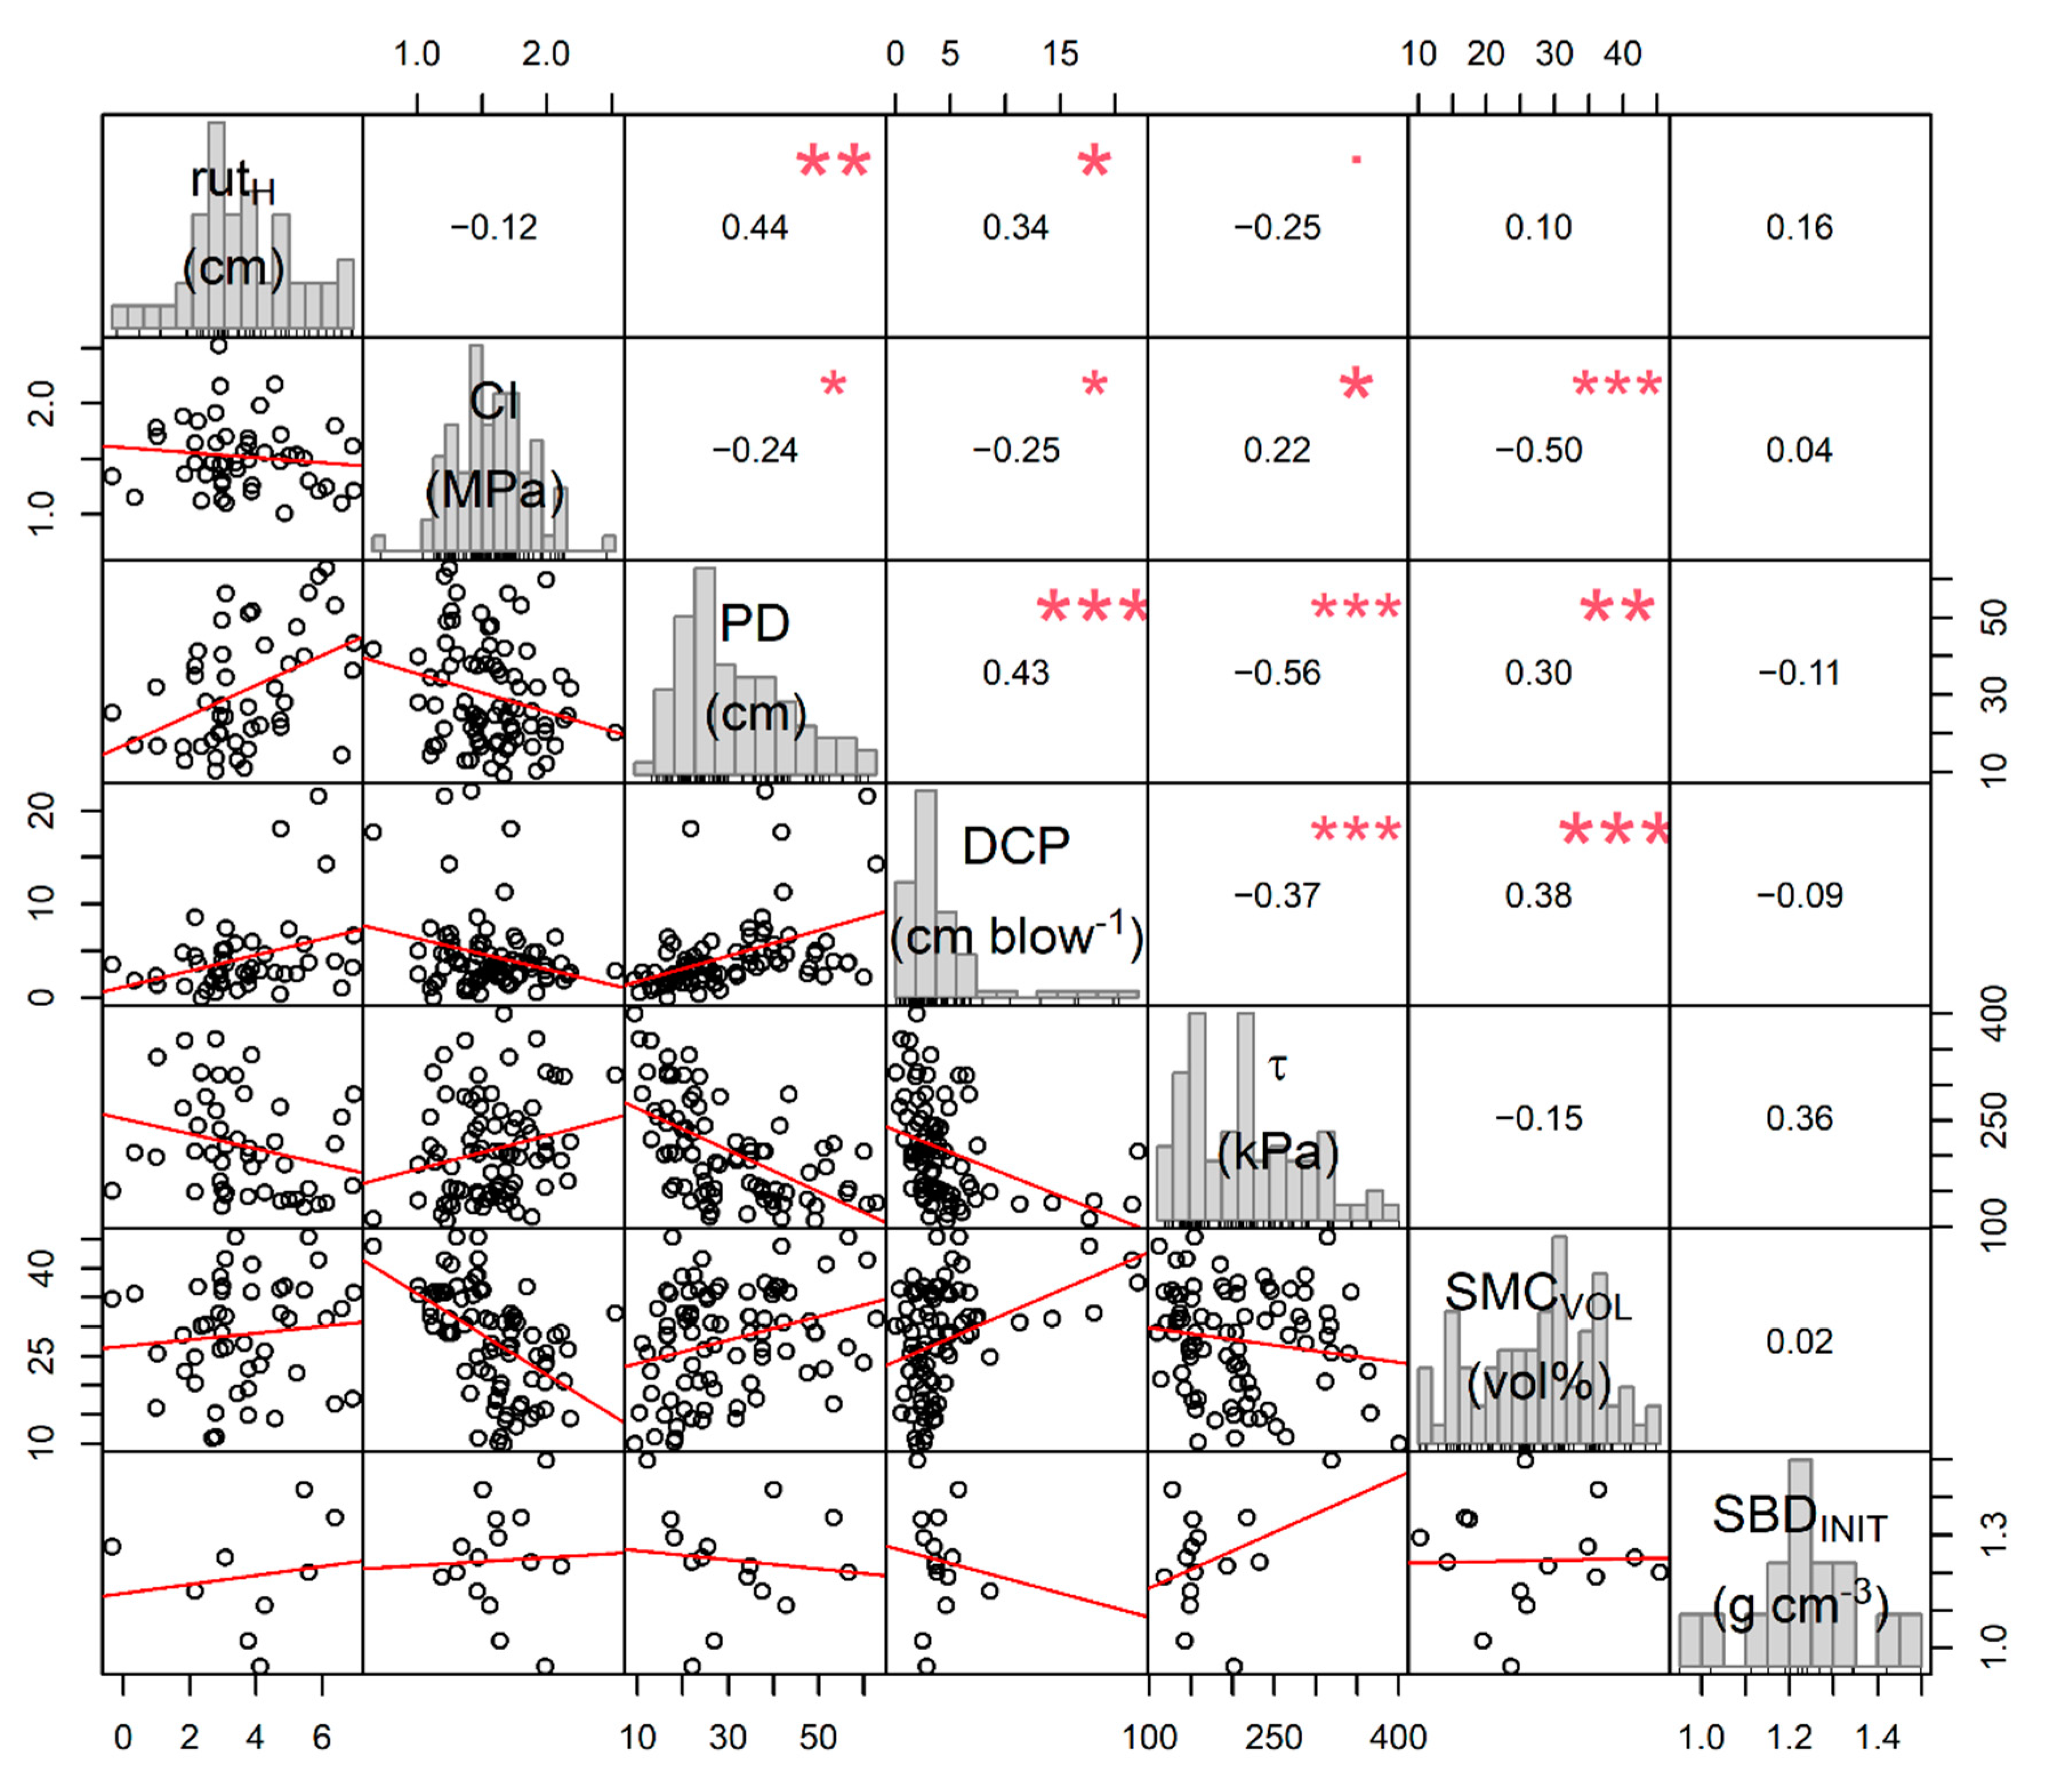
3.3. Correlations with Terramechanical Tests

Terramechanical tests were applied on every measuring transect along the previously marked machine operating trails, to capture initial conditions. Descriptive statistics for these tests are given in Table 3.
Due to high uncertainties regarding the load mass of the forwarder, we decided to use rutH to validate the surveyed cartographic indices, and terramechanical test procedures. Three of the contained parameters, CI, CIMOD and shear strength (τ), are capturing forces, required to overcome a given resistance within the soil. Analogously, these parameters showed inverse responses to rutH, as can be seen in Figure 8 and Section 4.2. Whereas a correlation can be assumed for τ (p = 0.088), an unreliable response was observed for CI (p = 0.415). Regardless of a standard definition of CI, given as the mean penetration resistance of the upmost 15 cm soil, we also generated a modified CI. For this, penetration resistance of a soil depth between 10 and 20 cm was averaged, giving CIMOD, which was significantly linked with rutH (rP = −0.30, p = 0.040, Section 4.2). In addition to CI and CIMOD, penetration depth (PD) was also derived from measurements by the Penetrologger. Whereas CI possessed an insufficient prediction of rutH, the latter showed a significant correlation to PD (p = 0.001) with a high rP of 0.44. As indicated in Figure 8, DCP, measured by means of the dual-mass cone penetrometer, correlated with rutH (p = 0.020), resulting in the second highest value of rP (0.34).

3.4. Correlations with Cartographic Indices

A DTW map with a flow initiation area of 4 ha was calculated for the study area. There, the values of DTW ranged between 0 and 8.7 m. The overall mean at the analyzed transects was 3.6 ± 2.3 m. Out of those, four measuring transects exhibited a DTW index below 1 m (Table 4 and Figure 1), usually assumed to indicate areas with a low bearing capacity and high susceptibility to soil displacement. Within this study, rutH measured on these transects averaged at 2.65 cm. Besides, beneficial operational conditions were predicted for 43 measuring transects, where a similar extent of rut depth was estimated (Table 4). The relatively dry conditions, from the perspective of forest operations, might have caused a missing relationship between rutH and DTW values (Figure 9A). In addition, it might impede a correlation between values of SMCVOL and DTW values (p = 0.336, rP = −0.14).
Similar to the observations made regarding DTW, the TWI was also not able to predict occurring rutting, since no correlation between log-transformed TWI and rutH could be approved (Figure 9B).

4. Discussion

Within this study, a regularly scheduled forest operation was analyzed in two broadleaved dominated mixed stands, with machine traffic on 19 newly established permanent machine operating trails. Prior to the operation, measuring transects have been established along the machine operating trails. On each of these, terramechanical parameters were quantified in advance of the operation, using different equipment. Additionally, two cartographic indices were calculated. In order to validate the compiled parameters and indices, correlations with an occurring rut depth, measured after the first and final machine, were performed.

4.1. Soil Impact

Numerous factors, like wheel slippage, high traffic and the relationship between soil bearing capacity and a machine’s ground pressure, can lead to severe soil impacts, harming physical soil properties [58]. The long-lasting [59] impacts, disturbing the integrity of the soil, can be caused by all vehicles. Due to a compression stress and plastic deformation [60], soil impacts and displacement emerge.
After the off-road traffic by heavy forest machines (Table 1), values of soil compaction within this study averaged at 10%, related to the initial soil bulk density of 1.2 g cm−3. This is in line with the results reported in the meta-analysis by Ampoorter et al. [13], revealing an average increase in soil bulk density of 15% under similar operational conditions. Kozlowski [12] reported a critical soil bulk density of 1.4–1.6 g cm−3 to hamper root penetration into fine-textured soil [61]. It can be assumed that, in particular, the first machine passes prevailingly lead to soil compaction [13,62,63]. Consequently, additional machine passes result in a lower increase in soil bulk density, since preceding passes pre-compacted the soil already. In agreement, we have clear evidence for a higher soil compaction on measuring transects with a low initial soil bulk density (Figure 6B). Although soil compaction by forest machines might decrease with additional traffic frequency, rut depth increments can be enhanced after a certain compaction has been reached [64,65]. Soils are susceptible to compression, especially under moist and wet soil conditions [15,66], since the particle-to-particle bonding is low then [67]. The measured initial soil moisture content in the study area of only 29 vol% can be associated with a smaller extent of soil displacement [23,68] and might have impeded a vast soil displacement [64]. In this respect, Poltorak et al. [33] resumed deep ruts and a high soil compaction was more likely to occur in soils with a moisture content of more than 50 vol%, much higher than our measured 29 vol%.
Subsequently, ruts measured within this study appeared at a moderate extent, averaging at 6.3 ± 2.1 cm, with a maximum depth of 11.6 cm. Overall, only on 2 out of the 47 measuring transects, ruts deeper than 10 cm were observed. These results are in line with findings from other studies, reporting moderate rut depths between 3 cm [69], over 9–12 cm [8,63,70], and up to 20 cm [9,15,71], when measured on designated machine operating trails. In general, rutting that appeared within this study was in agreement with the recommendations of Owende et al. [14], who proposed to limit rut depths to a maximum of 10 cm to ensure an eco-efficient wood harvesting in Europe. Considering that the presented field study was conducted on newly assigned machine operating trails, the experienced rut formation was further below the internal guidelines of the state forest enterprise of Lower Saxony, stating a maximum tolerance value of a 15 cm rut depth on 90% of length of the machine operating trail [72]. These guidelines are set to ensure the technical trafficability of permanent machine operating trails for future operations, rather than actively protecting forest soils. Yet, since maintaining that the technical trafficability is inevitable to avoid the conversion of further stand areas to new machine operating trails, counteracting the soil conservation thoughts behind the permanent machine operating trail concept, it is fundamental to keep rut formation there as low as possible too [13,60]. However, it should be noted that the moderate extent of ruts experienced in this study after the crossing of a 24.5 Mg harvester, and subsequent timber extraction by a forwarder, is most likely supported by the relatively low logging volume of just 36 m3 ha−1. This, in return, led to a low traffic frequency (Figure 1 and Figure 7B) with limited loads. It should be mentioned that rutting at the measuring transects was favored due to the conductance of this study, since operators were advised not to create brush mats in the transect areas, contrary to common recommendations to reduce rut formation [73].

4.2. Validation of Surveyed Tools

In general, observed rutting and soil compaction are in line with earlier findings [13,23]. Still, rut formations arising after forwarding possess an unfortunate nuisance within the current study, which is also reflected by the relatively weak correlation between rutH and rutF. The latter mentioned was probably deranged: (i) by changing moisture conditions, as rain fall occurred in the time gap between harvester and forwarder trafficked the study site; (ii) through the study’s arrangement within a real harvesting operation, where numerous measuring transects became unusable, since the wooden pegs, used to position the reference beam, were displaced, reducing our number of observations to 47 (from initial 90); and (iii) because loads and consequently total mass of the machine could not be captured during forwarding, reducing the potential independent variables in the linear models. Hence, linear models of the parameters to be validated were fitted with rutH, created by the harvester, in order to account for the uncertainties (i–iii) within the validation of the surveyed approaches. Deviations from a standardized study design were assumed to be lower when using rutH, compared to rutT. Although, we assumed that one machine pass by the harvester (driving without GNSS-tracking) and short back and forth movements of the harvester may have led to multiple crossings on a measuring transect during the felling and processing, which is difficult to quantify at a given transect.
Although Sirén et al. [18,28] reported a Cone Index (CI), measured by means of a handheld Penetrologger, to be correlated with rut depth after a harvester pass (rP = −0.27 [18] or rP = −0.24 [28]), we were not able to statistically confirm this relationship within the current study (rP = −0.12, p = 0.415). This instrument possesses a pivotal nuisance, as the measured values are highly dependent on user handling [21], which might have perturbed the correlation within this study. In addition, patterns of the upmost few centimeters of soil might not have been associated with actual bearing capacity, as organic matter content [74] or divergent soil moisture conditions can highly affect measured penetration resistance there. To avoid these uncertainties, we calculated a modified Cone Index, CIMOD, which includes penetration resistance of between 10 cm and 20 cm soil depth, as compared to CI, considering the values measured in a depth between 0 and 15 cm. As shown in Figure 10, CIMOD inversely responded to rutH. Contrarily, common CI turned out to be the least accurate terramechanical parameter to predict rutH, as summarized in Figure 8. Interestingly, the much easier to measure penetration depth (PD), herein also derived from the Penetrologger, turned out to be in a clear response with rutH. A lower PD might be driven by increased coarse fraction [75] or a more intense root network within the soil, which both can be considered to impede rutting.
Besides penetration depth, the dual-mass dynamic cone penetrometer also uses a metric scale (DCP). Measurements of this relatively simple mechanical device appeared to show robust predictions of rutH and resulted in a more reliable rP (0.11), with total rut depth, rutT, compared to CI. The latter-mentioned, curiously, showed a positive trend to rutT, meaning that deeper ruts tended to occur where highest values of CI were captured (p = 0.15). During the application of the dual-mass dynamic cone penetrometer, the hammer is raised carefully without lifting the cone before it is allowed to drop [76]. By doing so, an artificial bias during handling can be avoided almost certainly. We assume that this, in combination with a larger cone, resulted in a better prediction of rutH, compared to the Penetrologger. However, it should be noted that the penetrometer is an instrument with a weight of 12.8 kg, limiting its application for individual users at extended stand levels.
Although seldomly used in research, shear strength (τ), measured by the use of a vane meter, led to rather reliable results, regarding the correlation of τ and rutH. Thereby, rP of −0.25 exceeded the coefficients achieved by CI. This correlation is in close agreement with the findings of Jacke et al. [77], who promoted the usage of a vane meter to measure shear strength and to assess temporal soil trafficability, as already verified [30].
In summary, the surveyed terramechanical parameters PD, DCP and τ (in decreasing order according to revealed rP) bear a high potential towards the prediction of rutting.

4.3. Correlations with Cartographic Indices and Soil Moisture

Nonetheless, these measurements are time-consuming and might not be doable in day-to-day work by harvesting operators and entrepreneurs. Subsequently, remotely analyzed trafficability maps, covering the whole area of operation, could match the demands of practitioners, presuming that those maps show a valid prediction of expectable rutting. Both used cartographic indices simulate water saturation or soil wetness, as it would accumulate in depressions, sinks or if a sufficiently sized area drains into a spot. However, measured spatial distribution of soil moisture content (SMCVOL) could not be reflected by depth-to-water (DTW) maps within the present study, as shown in Figure 5. This might have also caused the contradictory response between DTW index and observed rutH, which occurred completely independent of DTW (Figure 9A). The analyzed DTW maps, which were calculated with a flow initiation area of 4 ha [36,37], would represent a low overall moisture [29]. The created index is usually converted to a dummy variable, with a threshold of 1 m [51], where values below this threshold are assumed to predict wet and sensitive areas. By doing so, four measuring transects would have been assessed to have an inferior bearing capacity due to the assumed water saturation. Measured rutH and rutT at these four transects showed low means of 2.7 cm or 5.2 cm, respectively, similar to values measured on the remaining transects (Table 4). However, considering the generally acceptable extents of rutT [14,72], the DTW index reasonably assessed actual operational conditions for 43 out of 47 transects, as favorable trafficability was predicted there. In addition, the occurring precipitation between felling and forwarding may limit the meaningfulness of the made observations. The validity of this approach could be restricted, since soil moisture increased particularly at dryer transects (Figure 6A), thereby smoothing the spatial distribution of moisture. Hence, the prediction of wet or water-saturated areas might be jeopardized. Along with the DTW, also the second surveyed cartographic index, topographic wetness index, revealed no reasonable correlation with rutH (Figure 9B).
The inferior performance of both surveyed indices might be driven by two main aspects: (i) Due to the systematic allocation of measuring transects, some of these were positioned at former machine-operating trails, which could be observed at both forest stands, although they were assumed to be un-trafficked. Whereas terramechanical test procedures capture the divergent soil conditions there, trafficability maps are not able to include these effects. (ii) The influence of soil moisture on rutting has been reported extensively [23,33], with inevitable influence on soil displacement. However, within this study, the measured rutting turned out to be independent of soil moisture content (SMCVOL), which is simulated by DTW and TWI in the first place. The relatively low SMCVOL (from the perspective of forest operations) during the field trials, with only six observations above 40 vol%, could have limited the effect of SMCVOL [74] on the appearing rut formation and consequently the predictability of rut depth by means of both cartographic indices.

4.4. Prediction of Rutting

As none of the surveyed tools were able to predict final rutting to a satisfying level at the given conditions, alternative approaches are requested to match the desired prediction of soil impact [20,21]. Findings of Sirén et al. [18,28] approved the rut formation of the first machine pass, and in our case, by the harvester (rutH), to predict further rutting caused by the consecutive passes of the forwarder. In agreement with these findings, rutH of the present study turned out to be the best indicator for total rut depth after 2 to 5 machine passes, possessing a highly significant correlation among both variables (Figure 7A). Under the given conditions, higher traffic frequency did not lead to additional rut depth increments (Figure 7B), which supports the overall assumptions of this survey. The results give a further impetus to use rutH with regard to the prediction of rutting. In the modelling of Sirén et al. [18], variables like SMC and CI did not further increase accuracy when rutH had been included already. In agreement with this, rutH acted as a pivotal influence, explaining the highest share of deviations in the present study, where additional variables did not increase the model’s quality (not shown). An exchange of information between both operating machines could contribute to the optimal routing of the subsequently driving forwarder and thereby support an eco-efficient forestry through the avoidance of areas with a high susceptibility to rut formation. Making it useful for operational purposes, Lidar-based sensors could detect actual rutting, created by an operating harvester, evolving the real-time generation of trafficability maps as a part of normal forestry operations [26]. Another sensor-based solution aims at rolling resistance, which has been recently assumed to be able to assess machine-operating trail trafficability [27]. In agreement, Salmivaara et al. [78] reported the high potential of CAN-bus-derived rolling resistance to be used for predictions of trafficability across complex landscapes and changing conditions.
These more operation-based monitoring approaches in particular have potential to support the management of extraction activities, consecutive to the harvester’s felling and processing, in order to prevent further soil impact whilst forwarding. Such technologies could support harvesting operations without fixed machine operating trails, as conducted in many plantations of the tropics or boreal forests. If the harvester detected areas with low bearing capacity, timber extraction could be conducted on alternative routes, in order to avoid severe soil impact. However, this does not solve the problem of the impact caused by the first machine pass, which requires a reliable pre-operation assessment of the trafficability situation at both, permanent machine-operating trails with pre-compaction, and previously non-trafficked areas.

5. Conclusions

The findings of the current study can be used to answer the posed research questions. One of these questions addressed the potential prediction of total rut depth after CTL operations, based on rutting after an initial machine pass. The results give clear evidence that rut depth caused by the first machine pass of the harvester remains a reliable indicator of further rut formation through up to four consecutive machine passes in current site conditions, and should therefore be cautiously monitored during the felling. However, for operational planning purposes, assessment of the logging sites prior to machine traffic is mandatory to ensure efficient machine utilization and to avoid negative impacts on soils or the technical trafficability of permanent machine operating trails in the first way. In this respect, the auspicious remote sensing-based cartographic indices DTW and TWI seem promising towards an operational usage, presuming a high accuracy of rut prediction. However, both used indices did not prove to be reliable alternatives compared to conventional terramechanical in-situ measurements of actual site conditions, at least during the experienced situation with already long-lasting precipitation deficits. The surveyed terramechanical test procedures possess specific advantages and drawbacks, but have not been compared with each other so far. This begs the question of the tool-specific ability to assess operational conditions in terms of trafficability, and in turn the ability to predict ruts. Surprisingly, the frequently used site assessment indicator CI showed a low certainty of rut depth prediction, compared to the less commonly applied dual-mass dynamic cone penetrometer and vane tester. Finally, none of the investigated methods can be fully approved or disapproved due to the limited scale of observations and the intensity of monitored machine traffic in this study. However, the results clearly revealed that the various approaches, already available for operational planning, would lead to a different assessment of the situation. Thus, state-of-the-art applications like cartographic indices need further adaptation to increase the predictive power on the one hand, but also parameters measured by more simple instruments such as the DCP, should be further considered as an alternative, or at least as a supplementary aid to determine current site conditions and risks of trafficability.

Author Contributions

M.S. and S.H. conceived and designed the experiments; M.S. and S.H. performed the experiments, with the acknowledged help of two associates; J.M. and M.S. calculated the cartographic maps; data preparation, M.S.; data analysis and interpretation, M.S. and S.H.; writing—original draft preparation, M.S., J.M. and S.H.; writing—review and editing, M.J., S.H., D.J., J.M. and M.S.; supervision, D.J. and M.J.; project administration, D.J. All authors have read and agreed to the published version of the manuscript.

Funding

This research was funded by the Bio Based Industries Joint Undertaking under the European Union’s Horizon 2020 research and innovation program, TECH4EFFECT Knowledge and Technologies for Effective Wood Procurement—project, [grant number 720757] and by the cooperation project “BefahrGut” funded by the State of North Rhine-Westphalia, Germany, through its Forest Education Center FBZ/State Enterprise Forestry and Timber NRW, Arnsberg/Germany. We highly appreciate the generous financial support by Eva Mayr-Stihl Stiftung. The APC was funded by the Open Access Publication Funds of the University of Göttingen.

Institutional Review Board Statement

Not applicable.

Informed Consent Statement

Not applicable.

Data Availability Statement

The data presented in this study are openly available in GROpublications at https://0-doi-org.brum.beds.ac.uk/10.25625/LQJBML, reference number [79].

Acknowledgments

The authors acknowledge the opportunity for conducting this survey, as well as the contribution during the field work, both provided by “Niedersächsische Landesforsten” (State Forest Enterprise), “Forstamt Dassel”, in particular supported by Jendrik Niebel, Furthermore, we acknowledge the help of Thilo Habert and Christopher Pohle for performing the measurements with the dual-mass dynamic cone penetrometer. We acknowledge the help of Heike Strutz, Soil Science Department, accomplishing soil analyses. In addition, we acknowledge the valuable suggestions of the two anonymous reviewers, which contributed to the improvement of the paper.

Conflicts of Interest

The authors declare no conflict of interest.

Appendix A

Table A1. Example of a measured transect, used to calculate rutH, rutF and rutT (Section 2.3.1), by means of the code shown in Appendix B. Respectively to DzH and DzF, tH and tF were noted, to capture the position of visible machine tracks across the measuring transect.
transecttr.lengthDzINITDzHDzFtHtF
41−20036343400
41−18032333300
41−16032323200
41−14032323100
41−120303231L0
41−100313333LL
41−80313233LL
41−60293035LL
41−403029320L
41−202728290L
41029292800
412029302900
414030293000
416029302900
418031323100
41100293231R0
41120323334RR
41140333436RR
41160353637RR
411803737370R
412003839380R

Appendix B

R-grammar used to calculate rutH, rutF and rutT (Section 2.3.1).
  • library(dplyr) #package: {dplyr} [80]
  • Mean <- function(x) round(mean(x, na.rm=T), digits = 2)
  • Max <- function(x) ifelse( !all(is.na(x)), max(x, na.rm=T), NA)
  • data.frame %>% group_by(transect) %>%
  •  summarise(rutH = Mean(c(Max(DzH[tH == ‘L’] - Dzinit[tH == ‘L’]),
  •             Max(DzH[tH == ‘R’] - Dzinit[tH == ‘R’]))),
  •       rutF = Mean(c(Max(DzF[tF == ‘L’] - DzH[tF == ‘L’]),
  •             Max(DzF[tF == ‘R’] - DzH[tF == ‘R’]))),
  •       rutT = Mean(c(Max(DzF[tH != 0 | tF != 0] - Dzinit[tH != 0 | tF != 0]),
  •             Max(DzF[tH != 0 | tF != 0] - Dzinit[tH != 0 | tF != 0]))))

References

  1. Overpeck, J.T.; Rind, D.; Goldberg, R. Climate-induced changes in forest disturbance and vegetation. Nature 1990, 343, 51–53. [Google Scholar] [CrossRef]
  2. Seidl, R.; Schelhaas, M.-J.; Lexer, M.J. Unraveling the drivers of intensifying forest disturbance regimes in Europe. Glob. Chang. Biol. 2011, 17, 2842–2852. [Google Scholar] [CrossRef]
  3. Schelhaas, M.-J.; Nabuurs, G.-J.; Schuck, A. Natural disturbances in the European forests in the 19th and 20th centuries. Glob. Chang. Biol. 2003, 9, 1620–1633. [Google Scholar] [CrossRef]
  4. Adams, H.D.; Macalady, A.K.; Breshears, D.D.; Allen, C.D.; Stephenson, N.L.; Saleska, S.R.; Huxman, T.E.; McDowell, N.G. Climate-Induced Tree Mortality: Earth System Consequences. Eos Trans. Am. Geophys. Union 2010, 91, 153–154. [Google Scholar] [CrossRef]
  5. Jenkins, M.J.; Hebertson, E.; Page, W.; Jorgensen, C.A. Bark beetles, fuels, fires and implications for forest management in the Intermountain West. For. Ecol. Manag. 2008, 254, 16–34. [Google Scholar] [CrossRef]
  6. Simard, M.; Romme, W.H.; Griffin, J.M.; Turner, M.G. Do mountain pine beetle outbreaks change the probability of active crown fire in lodgepole pine forests? Ecol. Monogr. 2011, 81, 3–24. [Google Scholar] [CrossRef]
  7. Botta, G.F.; Becerra, A.T.; Tourn, F.B. Effect of the number of tractor passes on soil rut depth and compaction in two tillage regimes. Soil Tillage Res. 2009, 103, 381–386. [Google Scholar] [CrossRef]
  8. Eliasson, L. Effects of forwarder tyre pressure on rut formation and soil compaction. Silva Fenn. 2005, 39, 549–557. [Google Scholar] [CrossRef] [Green Version]
  9. Labelle, E.R.; Jaeger, D. Soil Compaction Caused by Cut-to-Length Forest Operations and Possible Short-Term Natural Rehabilitation of Soil Density. Soil Sci. Soc. Am. J. 2011, 75, 2314–2329. [Google Scholar] [CrossRef] [Green Version]
  10. Sakai, H.; Nordfjell, T.; Suadicani, K.; Talbot, B.; Bøllehuus, E. Soil compaction on forest soils from different kinds of tires and tracks and possibility of accurate estimate. Croat. J. For. Eng. 2008, 29, 15–27. [Google Scholar]
  11. Beylich, A.; Oberholzer, H.-R.; Schrader, S.; Höper, H.; Wilke, B.-M. Evaluation of soil compaction effects on soil biota and soil biological processes in soils. Soil Tillage Res. 2010, 109, 133–143. [Google Scholar] [CrossRef]
  12. Kozlowski, T.T. Soil compaction and growth of woody plants. Scand. J. For. Res. 1999, 14, 596–619. [Google Scholar] [CrossRef]
  13. Ampoorter, E.; Verheygen, K.; Hermy, M. Soil Damage after Mechanized Harvesting: Results of a Meta-Analysis; COFE: Lake Tahoe, CA, USA, 2009. [Google Scholar]
  14. Owende, P.M.O.; Lyons, J.; Haarlaa, R.; Peltola, A.; Spinelli, R.; Molano, J.; Ward, S.M. Operations Protocol for Eco-Efficient Wood Harvesting on Sensitive Sites; 2002; Available online: https://www.ucd.ie/foresteng/html/ecowood/op.pdf (accessed on 19 January 2021).
  15. Horn, R.; Vossbrink, J.; Peth, S.; Becker, S. Impact of modern forest vehicles on soil physical properties. For. Ecol. Manag. 2007, 248, 56–63. [Google Scholar] [CrossRef]
  16. Bygdén, G.; Eliasson, L.; Wästerlund, I. Rut depth, soil compaction and rolling resistance when using bogie tracks. J. Terramechan. 2003, 40, 179–190. [Google Scholar] [CrossRef]
  17. Starke, M.; Derron, C.; Heubaum, F.; Ziesak, M. Rut Depth Evaluation of a Triple-Bogie System for Forwarders—Field Trials with TLS Data Support. Sustainability 2020, 12, 6412. [Google Scholar] [CrossRef]
  18. Sirén, M.; Salmivaara, A.; Ala-Ilomäki, J.; Launiainen, S.; Lindeman, H.; Uusitalo, J.; Sutinen, R.; Hänninen, P. Predicting forwarder rut formation on fine-grained mineral soils. Scand. J. For. Res. 2019, 34, 145–154. [Google Scholar] [CrossRef]
  19. Lacey, S.T.; Ryan, P.J. Cumulative management impacts on soil physical properties and early growth of Pinus radiata. For. Ecol. Manag. 2000, 138, 321–333. [Google Scholar] [CrossRef]
  20. Uusitalo, J.; Ala-Ilomäki, J.; Lindeman, H.; Toivio, J.; Siren, M. Modelling soil moisture—Soil strength relationship of fine-grained upland forest soils. Silva Fenn. 2019, 53, 10050. [Google Scholar] [CrossRef]
  21. Jones, M.-F.; Arp, P.A. Relating Cone Penetration and Rutting Resistance to Variations in Forest Soil Properties and Daily Moisture Fluctuations. Open J. Soil Sci. 2017, 7, 149–171. [Google Scholar] [CrossRef] [Green Version]
  22. Rönnqvist, M.; Flisberg, P.; Willén, E.; Frisk, M.; Friberg, G. Spatial optimization of ground based primary extraction routes using the BestWay decision support system. Can. J. For. Res. 2020. [Google Scholar] [CrossRef]
  23. Cambi, M.; Certini, G.; Neri, F.; Marchi, E. The impact of heavy traffic on forest soils: A review. For. Ecol. Manag. 2015, 338, 124–138. [Google Scholar] [CrossRef]
  24. Montgomery, D.R. Assessment of Soil Compaction Bulk Density Indices and Cone Index in Different Moistures and Depths for Application in Precise Tillage. World Appl. Sci. J. 1993, 29, 3925–3934. [Google Scholar]
  25. Schönauer, M.; Talbot, B.; Jaeger, D. TECH4EFFECT. Terrain Accessibility Maps for 4 Case Study Areas. 2019. Available online: http://www.tech4effect.eu/wp-content/uploads/2020/02/d41-terrain-accessability-maps-for-4-case-study-areas.pdf (accessed on 10 February 2020).
  26. Salmivaara, A.; Miettinen, M.; Finér, L.; Launiainen, S.; Korpunen, H.; Tuominen, S.; Heikkonen, J.; Nevalainen, P.; Sirén, M.; Ala-Ilomäki, J.; et al. Wheel rut measurements by forest machine-mounted LiDAR sensors—Accuracy and potential for operational applications? Int. J. For. Eng. 2018, 29, 41–52. [Google Scholar] [CrossRef] [Green Version]
  27. Ala-Ilomäki, J.; Salmivaara, A.; Launiainen, S.; Lindeman, H.; Kulju, S.; Finér, L.; Heikkonen, J.; Uusitalo, J. Assessing extraction trail trafficability using harvester CAN-bus data. Int. J. For. Eng. 2020, 31, 138–145. [Google Scholar] [CrossRef]
  28. Sirén, M.; Ala-Ilomäki, J.; Lindeman, H.; Uusitalo, J.; Kiilo, K.; Salmivaara, A.; Ryynänen, A. Soil disturbance by cut-to-length machinery on mid-grained soils. Silva Fenn. 2019, 53, 1013. [Google Scholar] [CrossRef]
  29. Jones, M.-F.; Arp, P. Soil Trafficability Forecasting. OJF 2019, 9, 296–322. [Google Scholar] [CrossRef] [Green Version]
  30. Heubaum, F. Bodenscherfestigkeit auf Rückegassen. Forst Tech. 2015, 8, 18–22. [Google Scholar]
  31. Siekmeier, J.A.; Young, D.; Beberg, D. Comparison of the dynamic cone penetrometer with other tests during subgrade and granular base characterization in Minnesota. In Nondestructive Testing of Pavements and Backcalculation of Moduli: Third Volume; ASTM International: Conshohocken, PA, USA, 2000. [Google Scholar]
  32. David Suits, L.; Sheahan, T.C.; Chen, D.-H.; Lin, D.-F.; Liau, P.-H.; Bilyeu, J. A Correlation between Dynamic Cone Penetrometer Values and Pavement Layer Moduli. Geotech. Test. J. 2005, 28, 42–49. [Google Scholar] [CrossRef]
  33. Poltorak, B.J.; Labelle, E.R.; Jaeger, D. Soil displacement during ground-based mechanized forest operations using mixed-wood brush mats. Soil Tillage Res. 2018, 179, 96–104. [Google Scholar] [CrossRef]
  34. Pei, T.; Qin, C.-Z.; Zhu, A.-X.; Yang, L.; Luo, M.; Li, B.; Zhou, C. Mapping soil organic matter using the topographic wetness index: A comparative study based on different flow-direction algorithms and kriging methods. Ecol. Indic. 2010, 10, 610–619. [Google Scholar] [CrossRef]
  35. Waga, K.; Malinen, J.; Tokola, T. A Topographic Wetness Index for Forest Road Quality Assessment: An Application in the Lakeland Region of Finland. Forests 2020, 11, 1165. [Google Scholar] [CrossRef]
  36. Murphy, P.N.C.; Ogilvie, J.; Arp, P. Topographic modelling of soil moisture conditions: A comparison and verification of two models. Eur. J. Soil Sci. 2009, 60, 94–109. [Google Scholar] [CrossRef]
  37. Murphy, P.N.C.; Ogilvie, J.; Meng, F.-R.; White, B.; Bhatti, J.S.; Arp, P.A. Modelling and mapping topographic variations in forest soils at high resolution: A case study. Ecol. Model. 2011, 222, 2314–2332. [Google Scholar] [CrossRef]
  38. Campbell, D.M.H.; White, B.; Arp, P.A. Modeling and mapping soil resistance to penetration and rutting using LiDAR-derived digital elevation data. J. Soil Water Conserv. 2013, 68, 460–473. [Google Scholar] [CrossRef] [Green Version]
  39. Tuomasjukka, D.; Herder, M.D.; Wallius, V.; Rois, M.; Kunttu, J.; Korhonen, M.; Prinz, R.; Routa, J.; Eberhard, B.R.; Pucher, C.; et al. TECH4EFFECT. Knowledge and Technologies for Our Forests of the Future. 2020. Available online: http://www.tech4effect.eu/wp-content/uploads/2020/09/policy-brief-web.pdf (accessed on 10 December 2020).
  40. IUSS Working Group WRB. World Reference Base for Soil Resources 2014, Update 2015: International Soil Classification System for Naming Soils and Creating Legends for Soil Maps; FAO: Rome, Italy, 2015. [Google Scholar]
  41. DWD. Niederschlag: Vieljährige Mittelwerte 1981–2010. Available online: https://www.dwd.de/DE/leistungen/klimadatendeutschland/mittelwerte/nieder_8110_fest_html.html?view=nasPublication&nn=16102 (accessed on 23 September 2020).
  42. WetterKontor. Rückblick für Uslar (N)—WetterKontor. Available online: https://www.wetterkontor.de/de/wetter/deutschland/rueckblick.asp?id=R666&datum0=01.07.2020&datum1=31.08.2020&jr=2020&mo=9&datum=22.09.2020&t=8&part=0 (accessed on 23 September 2020).
  43. Durner, W.; Iden, S.C.; von Unold, G. The integral suspension pressure method (ISP) for precise particle-size analysis by gravitational sedimentation. Water Resour. Res. 2017, 53, 33–48. [Google Scholar] [CrossRef]
  44. Eijkelkamp Agrisearch Equipment. User Manual for the Moisture Meter Type HH2. Available online: https://www.eijkelkamp.com/download.php?file=M1142602e_Soil_moisture_meter_f1ab.pdf (accessed on 7 August 2020).
  45. Schönauer, M.; Väätäinen, K.; Lindemann, H.; Prinz, R.; Pszenny, D.; Heppelmann, J.; Jansen, M.; Jaeger, D.; Talbot, B.; Astrup, R.; et al. Prediction of forest soil trafficability by depth-to-water-maps considering temporal variations of soil moisture and penetration resistance. TECH4EFFECT. manuscript in preparation.
  46. Eijkelkamp. Field Inspection Vane Tester. Available online: https://en.eijkelkamp.com/products/field-measurement-equipment/field-inspection-vane-tester.html (accessed on 29 September 2020).
  47. QGIS.org. QGIS Geographic Information System; Open Source Geospatial Foundation Project, 2020. [Google Scholar]
  48. LGLN. Landesamt für Geoinformation und Landesvermessung Niedersachsen. Available online: https://www.lgln.niedersachsen.de/startseite/ (accessed on 24 September 2020).
  49. Bartels, S.F.; Caners, R.T.; Ogilvie, J.; White, B.; Macdonald, S.E. Relating Bryophyte Assemblages to a Remotely Sensed Depth-to-Water Index in Boreal Forests. Front. Plant Sci. 2018, 9, 858. [Google Scholar] [CrossRef]
  50. Mohtashami, S.; Eliasson, L.; Jansson, G.; Sonesson, J. Influence of soil type, cartographic depth-to-water, road reinforcement and traffic intensity on rut formation in logging operations: A survey study in Sweden. Silva Fenn. 2017, 51, 2018. [Google Scholar] [CrossRef] [Green Version]
  51. White, B.; Ogilvie, J.; Campbell, D.M.H.; Hiltz, D.; Gauthier, B.; Chisholm, H.K.; Wen, H.K.; Murphy, P.N.C.; Arp, P.A. Using the Cartographic Depth-to-Water Index to Locate Small Streams and Associated Wet Areas across Landscapes. Can. Water Resour. J. 2012, 37, 333–347. [Google Scholar] [CrossRef]
  52. Jones, M.-F. Mapping Soil Trafficability by Way of Temporal Hydrology Modeling and Spatial Wet-Areas-Mapping. Ph.D. Dissertation, University of New Brunswick, Fredericton, NB, Canada, 2019. [Google Scholar]
  53. Ågren, A.; Lidberg, W.; Strömgren, M.; Ogilvie, J.; Arp, P.A. Evaluating digital terrain indices for soil wetness mapping—A Swedish case study. Hydrol. Earth Syst. Sci. 2014, 18, 3623–3634. [Google Scholar] [CrossRef] [Green Version]
  54. Sörensen, R.; Zinko, U.; Seibert, J. On the calculation of the topographic wetness index: Evaluation of different methods based on field observations. Hydrol. Earth Syst. Sci. 2006, 10, 101–112. [Google Scholar] [CrossRef] [Green Version]
  55. R Core Team. R: A Language and Environment for Statistical Computing; R Foundation for Statistical Computing: Vienna, Austria, 2019; Available online: https://www.R-project.org (accessed on 21 June 2020).
  56. RStudio Team. RStudio: Integrated Development Environment for R; RStudio, PBC: Boston, MA, USA, 2016; Available online: http://www.rstudio.com (accessed on 21 June 2020).
  57. Peterson, B.G.; Carl, P. PerformanceAnalytics: Econometric Tools for Performance and Risk Analysis. 2020. Available online: https://CRAN.R-project.org/package=PerformanceAnalytics (accessed on 10 December 2020).
  58. Labelle, E.R.; Jaeger, D. Effects of steel flexible tracks on forwarder peak load distribution: Results from a prototype load test platform. Croat. J. For. Eng. 2019, 40, 1–23. [Google Scholar]
  59. Rab, M.A. Recovery of soil physical properties from compaction and soil profile disturbance caused by logging of native forest in Victorian Central Highlands, Australia. For. Ecol. Manag. 2004, 191, 329–340. [Google Scholar] [CrossRef]
  60. Vossbrink, J.; Horn, R. Modern forestry vehicles and their impact on soil physical properties. Eur. J. For. Res. 2004, 123, 259–267. [Google Scholar] [CrossRef]
  61. Daddow, R.L.; Warrington, G. Growth-Limiting Soil Bulk Densities as Influenced by Soil Texture; Watershed Systems Development Group, USDA Forest Service: Fort Collins, CO, USA, 1983. [Google Scholar]
  62. Han, H.-S.; Page-Dumroese, D.; Han, S.-K.; Tirocke, J. Effects of Slash, Machine Passes, and Soil Moisture on Penetration Resistance in a Cut-to-length Harvesting. Int. J. For. Eng. 2006, 17, 11–24. [Google Scholar] [CrossRef]
  63. Agherkakli, B.; Najafi, A.; Sadeghi, S.H. Ground based operation effects on soil disturbance by steel tracked skidder in a steep slope of forest. J. For. Sci. 2010, 56, 278–284. [Google Scholar] [CrossRef] [Green Version]
  64. McNabb, D.H.; Startsev, A.D.; Nguyen, H. Soil wetness and traffic level effects on bulk density and air-filled porosity of compacted boreal forest soils. Soil Sci. Soc. Am. J. 2001, 65, 1238–1247. [Google Scholar] [CrossRef]
  65. Jamshidi, R.; Jaeger, D.; Raafatnia, N.; Tabari, M. Influence of two ground-based skidding systems on soil compaction under different slope and gradient conditions. Int. J. For. Eng. 2008, 19, 9–16. [Google Scholar] [CrossRef]
  66. Arvidsson, J.; Sjöberg, E.; van den Akker, J.J.H. Subsoil compaction by heavy sugarbeet harvesters in southern Sweden. Soil Tillage Res. 2003, 73, 77–87. [Google Scholar] [CrossRef]
  67. Hillel, D. Environmental Soil Physics: Fundamentals, Applications, and Environmental Considerations; Elsevier: San Diego, CA, USA, 1998. [Google Scholar]
  68. Froehlich, H.A.; Azevedo, J.; Cafferata, P.; Lysne, D. Predicting Soil Compaction on Forested Land: Final Project Report to U.S. Forest Service; U.S. Forest Service: Missoula, MT, USA, 1980. [Google Scholar]
  69. Schönauer, M.; Holzfeind, T.; Hoffmann, S.; Holzleitner, F.; Hinte, B.; Jaeger, D. Effect of a traction-assist winch on wheel slippage and machine induced soil disturbance in flat terrain. Int. J. For. Eng. 2020, 39. [Google Scholar] [CrossRef]
  70. Haas, J.; Hagge Ellhöft, K.; Schack-Kirchner, H.; Lang, F. Using photogrammetry to assess rutting caused by a forwarder—A comparison of different tires and bogie tracks. Soil Tillage Res. 2016, 163, 14–20. [Google Scholar] [CrossRef]
  71. Naghdi, R.; Bagheri, I.; Lotfalian, M.; Setodeh, B. Rutting and soil displacement caused by 450C Timber Jack wheeled skidder (Asalem forest northern Iran). J. For. Sci. 2009, 55, 177–183. [Google Scholar] [CrossRef] [Green Version]
  72. NLF. Bodenschutz bei der Holzernte in den Niedersächsischen Landesforsten. 2017. Available online: https://www.landesforsten.de/wp-content/uploads/2018/06/merkblatt_bodenschutz_apr_2017.pdf (accessed on 19 January 2021).
  73. Labelle, E.R.; Poltorak, B.J.; Jaeger, D. The role of brush mats in mitigating machine-induced soil disturbances: An assessment using absolute and relative soil bulk density and penetration resistance. Can. J. For. Res. 2019, 49, 164–178. [Google Scholar] [CrossRef]
  74. Uusitalo, J.; Ala-Ilomäki, J.; Lindeman, H.; Toivio, J.; Siren, M. Predicting rut depth induced by an 8-wheeled forwarder in fine-grained boreal forest soils. Ann. For. Sci. 2020, 77, 42. [Google Scholar] [CrossRef] [Green Version]
  75. Niemi, M.T.; Vastaranta, M.; Vauhkonen, J.; Melkas, T.; Holopainen, M. Airborne LiDAR-derived elevation data in terrain trafficability mapping. Scand. J. For. Res. 2017, 32, 762–773. [Google Scholar] [CrossRef]
  76. Webster, S.L.; Grau, R.H.; Williams, T.P. Description and Application of Dual Mass Dynamic Cone Penetrometer; Geotechnical Laboratory (US): Vicksburg, MS, USA, 1992. [Google Scholar]
  77. Jacke, H.; Hittenbeck, J.; Stiehm, C. Spuren im Wald: Zur Spurrillen-Diskussion um und auf Rückegassen; Bericht über die Ergebnisse einer Kurzstudie (zu Teilen gefördert durch Forschungsmittel des Landes Rheinland-Pfalz): Goettingen, Germany, 2011. [Google Scholar]
  78. Salmivaara, A.; Launiainen, S.; Perttunen, J.; Nevalainen, P.; Pohjankukka, J.; Ala-Ilomäki, J.; Sirén, M.; Laurén, A.; Tuominen, S.; Uusitalo, J.; et al. Towards dynamic forest trafficability prediction using open spatial data, hydrological modelling and sensor technology. Forestry 2020, 93, 662–674. [Google Scholar] [CrossRef]
  79. Schönauer, M. Supplementary Data for: Comparison of Selected Terramechanical Test Procedures and Cartographic Indices to Predict Rutting Caused by Machine Traffic during a Cut-to-Length Thinning-Operation. 2020. Available online: https://0-doi-org.brum.beds.ac.uk/10.25625/LQJBML (accessed on 19 January 2021).
  80. Wickham, H.; François, R.; Henry, L.; Müller, K. dplyr: A Grammar of Data Manipulation. 2020. Available online: https://CRAN.R-project.org/package=dplyr (accessed on 21 June 2020).
Figure 1. Study area of the field trial, conducted in two broadleaved dominated mixed stands (A,B). White symbols represent 47 remaining cross-sectional measuring transects from initial 90 transects in total (Section 2.3.1) with four meters of width, located at newly assigned machine-operating trails. Terramechanical parameters and rutting process were quantified there (Section 2.3). On nine of these transects, soil samples were collected (white rhombs). Additional soil samples were taken on six transects (black rhombs), where terramechanical parameters were captured, but rutting could not be measured. Lines show forwarder tracks. Blue coloring indicates predicted wet areas, according to the depth-to-water (DTW) index ranging from 0 to 1 m (Section 2.4.1).
Forests 12 00113 g001
Figure 2. Example of a cross-sectional measuring transect on a machine operating trail. In-situ measurements were performed in advance of the regularly planned CTL thinning operation, using a Penetrologger (squares), vane tester (circles), a dual-mass dynamic cone penetrometer (cross) and a TDR probe (asterisks) as described in Section 2.3.3. The levelled reference beam, positioned on wooden pegs and a yardstick were used to determine rut depth (Figure 3), as it occurred during the given operation.
Forests 12 00113 g002
Figure 3. Scheme of recording rut depth during a CTL thinning operation, applied on an exemplary measuring transect: The initial surface along the measuring transect (dashed line) was scaled by Dzinit. After the harvester passed (dotted line), DzH was measured. Coherently, DzF was measured after the timber was extracted (solid line) by a forwarder (Table 1). Each of the Dz values were used to calculate rutH, rutF and rutT, according to Equations (1)–(3), respectively. The maximum difference of the left and right machine track (i = “R” or “L”) were averaged therefore.
Forests 12 00113 g003
Figure 4. Selected terramechanical instruments to assess trafficability and to predict rutting caused by machine traffic during a CTL thinning operation. (A) shows a Penetrologger (a), dual-mass dynamic cone penetrometer (b), a vane tester (c) and the used moisture meter (d). Tips are shown in (B), respectively.
Forests 12 00113 g004
Figure 5. Sites of study (A,B). Initial volumetric soil moisture content (SMCVOL) was measured at 90 transects and is indicated by blue points. Blue coloring indicates predicted wet areas, according to the depth-to-water (DTW) index ranging from 0 to 1 m, as described in Section 2.4.1.
Forests 12 00113 g005
Figure 6. Scatterplot and regression line (A) between the increase from initial to post-operational gravimetric soil moisture content, related to initial values and (B), describing soil compaction after 2–5 machine passes, according to Equation (4), depending on initial soil bulk density. With Pearson coefficients of correlation (rP) and p-value for 15 observations.
Forests 12 00113 g006
Figure 7. Scatterplot and regression line between total rut depth after completion of a CTL thinning operation (2–5 passes) and (A) rut depth after a single pass of the operating harvester (rutH, Table 1), as well as (B) number of machine passes. Note, that total rut depth was quantified after completion of forwarding at various locations (Figure 1), containing a different number of forwarder passes. Average values of rutH for each traffic frequency are represented by filled triangles. With Pearson coefficients of correlation (rP) and p-value for 47 observations.
Forests 12 00113 g007
Figure 8. Correlation plot between field measured parameters, with labeled Pearson coefficients of correlation. Red asterisks indicate significance codes (*** 0.001 ** 0.01 * 0.05 ˙ 0.10), regression lines are shown by red lines. Histograms are showing data distributions. Parameters are rut depth after harvester (rutH), Cone Index (CI), penetration depth (PD), DCP (measured by dual-mass cone penetrometer), shear strength (τ), volumetric soil moisture content (SMCVOL) and initial soil bulk density (SBDINIT), as described in Section 2.3.
Forests 12 00113 g008
Figure 9. Scatterplot and regression line between rut depth after a harvester performed a CTL thinning operation (single pass), and values of two accessibility maps, (A) depth-to-water and (B) topographic wetness index (Section 2.4). (A): The dashed line indicates the threshold at 1 m, whereas sensitive conditions are assumed in the range between 0 and 1 m of DTW. With Pearson coefficients of correlation (rP) and p-value for 47 observations.
Forests 12 00113 g009
Figure 10. Scatterplot and regression line between modified Cone Index, given as mean of penetration resistance between 10 cm and 20 cm soil depth, and rut depth after first machine pass (harvester), with Pearson coefficients of correlation (rP) and p-value for 47 observations.
Forests 12 00113 g010
Table 1. Machine specifications of the used 8-wheel machines, a harvester (Ponsse Bear) and a forwarder (Ponsse Buffalo), conducting the investigated CTL thinning operation.
CharacterUnitPonsse BearPonsse Buffalo
powerkW260210
typical massMg24.519.8
loading capacityMg-15.0
tire type Nokian Forest King TRS 2Alliance Forestar 344, 20 PR
tire size (width, diameter)mm750, 1485710, 1340
inflation pressurekPa600500
Table 2. Overview and date of performed in-situ measurements. For the study, volumetric and gravimetric soil moisture content (SMCVOL, vol%; SMCGRAV, % (MFRESH and MDRY, Equation (5)), respectively), commonly used and a modified Cone Index (CI, CIMOD, respectively, MPa), penetration depth (PD, cm), penetration resistance by means of dual-mass dynamic cone penetrometer (DCP, cm blow−1) shear strength (τ, kPa) initial and post-operational soil bulk density (SBDINIT, SBDPOST, respectively, g cm−3) were measured. For the estimation of rut depth increments, transect profiles were measured (Dzinit, DzH, DzF, Figure 3, cm).
Date (2020) ObjectiveMeasurement
15 Julyinitial measurements
of 90 transects
reference profile to estimate rut depth increment andDzinit
terramechanical parametersSMCVOL, CI, CIMOD, PD, DCP, τ, SBDINIT, SMCGRAV
4 Augustharvester performed the felling and processing
10 Augustmeasurement of profilesrut depth after harvesterDzH
17–21 Augustforwarder excavated timber
1 Septemberpost-operational measurementsrut depth after forwarder, total rut depth andDzF
on the remaining 47 transectspost-operational soil bulk density and moisture contentSBDPOST, SMCGRAV
Table 3. Descriptive statistics of terramechanical parameters, measured prior to harvesting operation. Parameters are regular and modified Cone Index (CI, CIMOD, respectively) and penetration depth (PD), measured by Penetrologger, DCP (cm blow−1, dual-mass cone penetrometer) and shear strength (τ, kPa, vane tester). With the number of observations, mean value, standard deviation, extreme values, first and third quantiles.
ParameternMeanSDMin.0.250.75Max.
CI (MPa)471.520.311.011.291.702.53
CIMOD (MPa)472.240.611.251.782.513.61
PD (cm)4730.8614.7810.2918.0041.0062.86
DCP (cm blow−1)474.184.220.001.774.9421.60
τ (kPa)47214.0269.63127.43150.14265.57365.14
Table 4. Mean values and standard deviations (SD) of rut depth after the harvester (rutH, Table 1) and after a CTL thinning operation was accomplished (rutT) on newly assigned machine operating trails (Figure 1). An unequal variance t-test was used to compare between 4 values of rutH within predicted sensitive areas, where the depth-to-water (DTW) index was below 1 m and 43 values, measured within areas with predicted high trafficability (see Section 2.4.1).
rutH (cm)rutT (cm)Test Statistics for rutH
DTWnMeanSDMeanSDt-Valuep-Value
<1 m42.652.505.171.54
>1 m433.711.566.432.141.350.18
Publisher’s Note: MDPI stays neutral with regard to jurisdictional claims in published maps and institutional affiliations.

