
A Small-Scale Test to Examine Heat Delamination in Cross Laminated Timber (CLT)


1
Tallwood Design Institute, Oregon State University, Corvallis Oregon, OR 97331, USA
2
USDA Forest Service, Forest Products Laboratory, Madison, WI 53726, USA
*
Author to whom correspondence should be addressed.
Forests 2021, 12(2), 232; https://doi.org/10.3390/f12020232
Submission received: 22 January 2021
/
Revised: 2 February 2021
/
Accepted: 7 February 2021
/
Published: 17 February 2021
(This article belongs to the Special Issue Performance of Wood and Wood-Based Materials)
Abstract
:This paper examines the strength of wood adhesive bonds at high temperatures. The goal of this research is to better understand the conditions of heat delamination in cross laminated timber (CLT) that is exposed to fire. Heat delamination in CLT occurs when one lamination detaches from the composite panel before the char front reaches the bondline. Timber that falls from the panel, as a result of delamination, contributes additional fuel to the fire, which can cause fire regrowth, while the loss of a lamination causes a sudden loss in strength. Currently, to demonstrate that an adhesive does not delaminate, it must pass a full scale (6 m by 3 m) compartment fire test as prescribed in the PRG-320 product standard. In this work, we scaled down the mechanical loads and temperatures to 300 mm lap shear specimens. Seven different adhesives were tested and compared against solid wood controls with the same geometry as the lap shear specimens. Quasi-static tests were run where the specimens were loaded to failure at 25 °C and 260 °C, when the samples were at thermal equilibrium. Additionally, creep tests were performed where the load and temperature ramp was matched to the adhesive bondline temperatures measured in the large scale PRG-320 tests. With the exception of some of the polyurethane formulations, all adhesives passed the scaled-down creep test that resembles the PRG-320 standard. Of the polyurethane adhesives tested, only one formulation remained intact for the duration of the test. These results can be used to help better predict which adhesives may pass the PRG-320 test prior to full scale testing.
1. Introduction
Mass timber buildings are being rapidly adopted in North America. Mass timber refers to a type of timber construction where the structural elements are made up of large, engineered wood elements, such as glue-laminated timber (glulam), structural composite lumber (SCL), or cross laminated timber (CLT). CLT is a wood composite made up of dimensioned lumber whose axes are rotated 90° from the previous layer, and which is shipped as large (up to 18 m long) panels, with all fenestrations precut in the factory [1]. The unique structural aspects of mass timber makes it possible to build tall wood buildings, with notable North American examples being the 18-story Brock Commons in Vancouver, British Colombia, and the 8-story Carbon12 building in Portland, Oregon, with many more under construction [2,3]. Recently, the International Code Council voted to change the regulation of mass timber buildings in the International Building Code (IBC) allowing mass timber buildings up to 18 stories to be constructed to the code; an increase of three-fold over the previous height limit for timber buildings [4].
Fire safety is a concern in all buildings, and this is no different for mass timber structures. In general, the properties of mass timber give excellent performance when compared to traditional, light frame wood construction. Wood chars in a very repeatable manner (approximately 0.6 mm min−1), and the fire resistance of wood has been studied since at least the 13th century [5,6,7]. The char formation and reduction of strength of these mass timber elements can be calculated with useful approximations if the engineered wood composite acts like solid wood [8]. However, in some early fire testing on cross-laminated timber, the wood–adhesive bond failed before the char front reached the adhesive bond line. This is known as “delamination” and results in fresh, uncharred wood surface of the next lamination becoming exposed. In compartment fire scenarios, a delamination can lead to fire regrowth, because fuel is added to the fire from the freshly exposed wood surface on the wall or ceiling, and by unburnt wood that dropped onto the floor of the room. Delamination and fire regrowth cannot be reliably modeled with simplified expressions, which presents one of the biggest challenges for designing fire-safe mass timber buildings [9]. The 2021 IBC requires CLT for mass timber buildings be constructed with “non-heat delaminating adhesives” as defined by the PRG-320 product standard for CLT in North America [4,10].
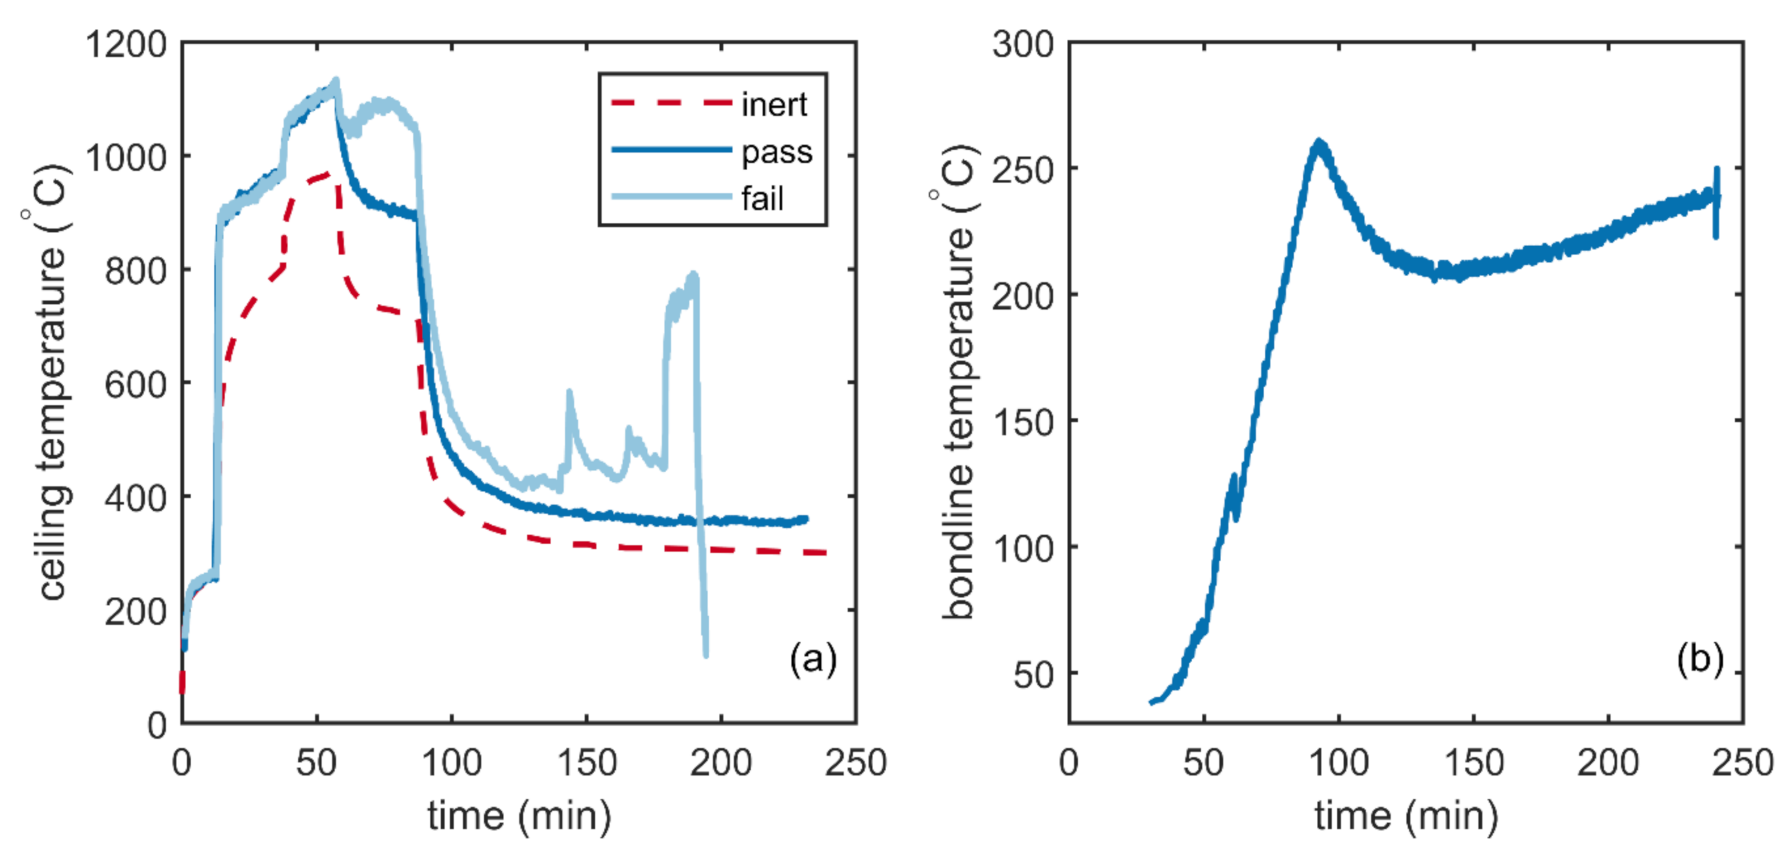
The PRG-320 product standard requires that to qualify as a non-heat delaminating adhesive, CLT made with the adhesive must pass a full-scale compartment fire test as described in Annex A of the standard. The supplied energy, temperature profile, and ventilation factor of the compartment were designed to closely match the conditions in largescale fire tests funded by the Fire Protection Research Foundation, where delamination and fire regrowth in a CLT compartment was observed [11]. In the test, energy is supplied to the compartment through the use of a gas burner. A test is run in a completely non-combustible (“inert”) compartment to match the temperature profile shown in Figure 1a, while the gas flow is measured. Tests with CLT are then run while the gas flow is metered at the same rate as the “inert” case. To pass the Annex A test, the temperature in the compartment must not rise after 150 min until the test is terminated at 240 min (4 h). For reference, Figure 1a also includes data from CLT tests with a passing and failing adhesive. Failures are easy to detect as the delamination causes fire regrowth and a large deviation from the cooling portion of the curve.
The PRG-320 test is the current product standard and sets the minimum performance to enter the marketplace. However, the test is costly to run and cannot distinguish other aspects of adhesive performance beyond a simple pass or fail. Small scale tests can help better understand how adhesive formulations may resist delamination. As small scale tests are easier and less costly to run, multiple tests can be run to understand how changes in chemistry affect heat delamination. Furthermore, because temperature and loading can be more precisely controlled under these situations, the test variables can be altered to better understand the physics of heat delamination.
In both the PRG-320 test and in realistic fire scenarios with a CLT floor/ceiling assembly, heat transfer through the CLT is one-dimensional. The thermal wave moves through the CLT in a very repeatable manner in response to the fuel load and temperature in the compartment. The bondline temperature increases as the thermal wave and char front approach the bondline. This is illustrated in Figure 1b, which shows data collected during a PRG-320 test for a polyurethane adhesive that passed the test. The maximum bondline temperature observed during the test was 261 °C. In contrast, delamination occurs when an adhesive can no longer resist shear and normal forces on the bondline below the char temperature of wood (300 °C). Since this delamination happens below the char temperature of wood and in the absence of flaming combustion, by characterizing the wood and wood adhesive bondline strength as a function of temperature, delamination can be predicted.
Recently, we measured the strength of four different engineered wood adhesives as a function of temperature [13]. The test utilized lap-shear specimens that were pulled in tension once they reached equilibrium at 100, 140, 180, 220, and 260 °C. Additionally, solid wood specimens were tested in the same geometry as the lap shear specimens so that the strength of the adhesive joint could be normalized to that of solid wood. The most dramatic strength loss was observed between 220 and 260 °C. Even in solid wood, the strength decreased by 54% from 100 °C to 260 °C, although the greatest strength reductions were observed in joints made with polyurethane adhesives whose strength at 260 °C was just 14% of their strength at 100 °C, and 30% of the strength of solid wood at 260 °C.
These previous experiments characterized the instantaneous strength of the adhesive bonds at elevated temperatures. However, under realistic conditions or the PRG-320 test, the bondline temperature slowly increases throughout the test under load. In this regard, it may be more appropriate to use a creep test where the sample temperature is increased while the specimen is loaded. Zelinka, et al. [14] examined the available data from the FPRF and PRG-320 tests and concluded that the temperature at the first bondline in CLT increases between 2–5 °C min−1 until a maximum temperature is reached or delamination occurs (see also Figure 1).
In this paper, we extend our previous work on small-scale tests on adhesive performance at elevated temperatures to include creep tests. The tests use a linear temperature ramp, with the ramp-rate based off of measured temperature data from PRG-320 tests under two different mechanical loading scenarios. Seven different adhesives were characterized and compared against control samples made of solid wood. The results are discussed in terms of predicting adhesive performance under fire for CLT.
2. Materials and Methods
2.1. Materials
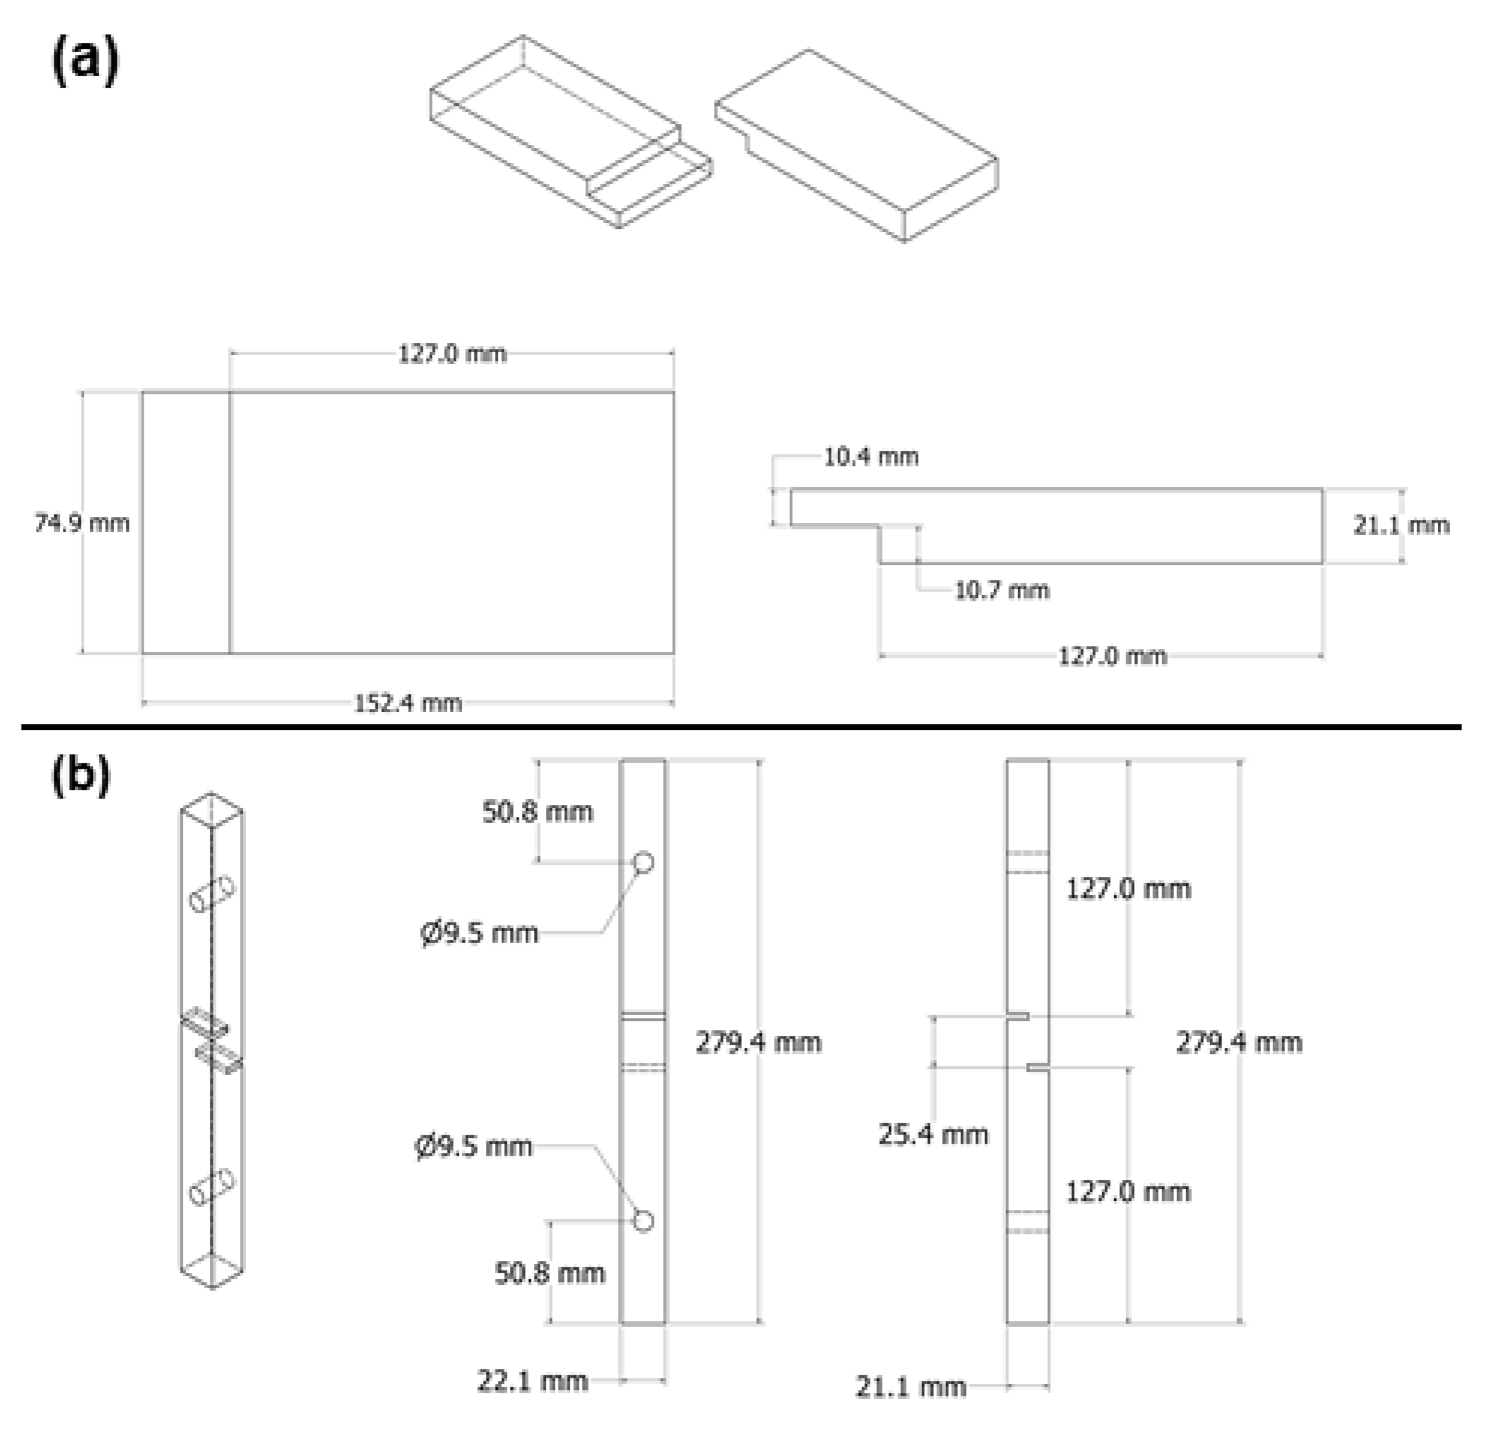
A lap shear specimen (Figure 2) was cut from clear Douglas-fir (Pseudotsuga menziesii) #1 grade boards that were 38 mm × 89 mm × 2.44 m (nominal 2” × 4” × 8′); Douglas-fir is commonly used in high temperature adhesive standards [15,16,17]. Each board was planed to a thickness of 21 mm, cut in half, and a stepped notch was cut on both sides using a router. Samples were mated with the corresponding half such that grain pattern was matched. Adhesive was applied to the exposed surfaces per the manufacturer’s prescribed procedure for each formulation and held in a mechanical press at ambient temperature for 24 h. The adhered samples were cut into three specimens with the geometry depicted in Figure 2b, and each notch was cut to prevent excessive adhesive from bonding to the top or bottom edge of the stepped surface. The test specimens were free from knots and other defects.
Commercial wood adhesives were tested from four different adhesive classes used in engineered wood composites: phenol-resorcinol formaldehyde (PRF), melamine formaldehyde (MF), emulsion polymer isocyanate (EPI), and polyurethane (PUR). Currently, MF and PUR adhesives are being used for CLT manufacturing. PRF was included as a control as the strength of PRF wood joints at high temperatures is relatively well known. Typically, at elevated temperatures the strength of a PRF wood joint is limited by the wood strength and the char front moves through PRF at the same rate as that for solid wood in fire scenarios [13,16,18]. One formulation each of PRF and MF was tested, two EPI formulations were tested, and three PUR formulations were tested, for a total of seven adhesive formulations. Solid wood controls were also tested, these samples were made by cutting one notch on each side placed 25 mm apart. The notches went halfway through the depth of the sample and had a width of the kerf of the saw blade.
2.2. Methods
2.2.1. Quasi-Static Tests
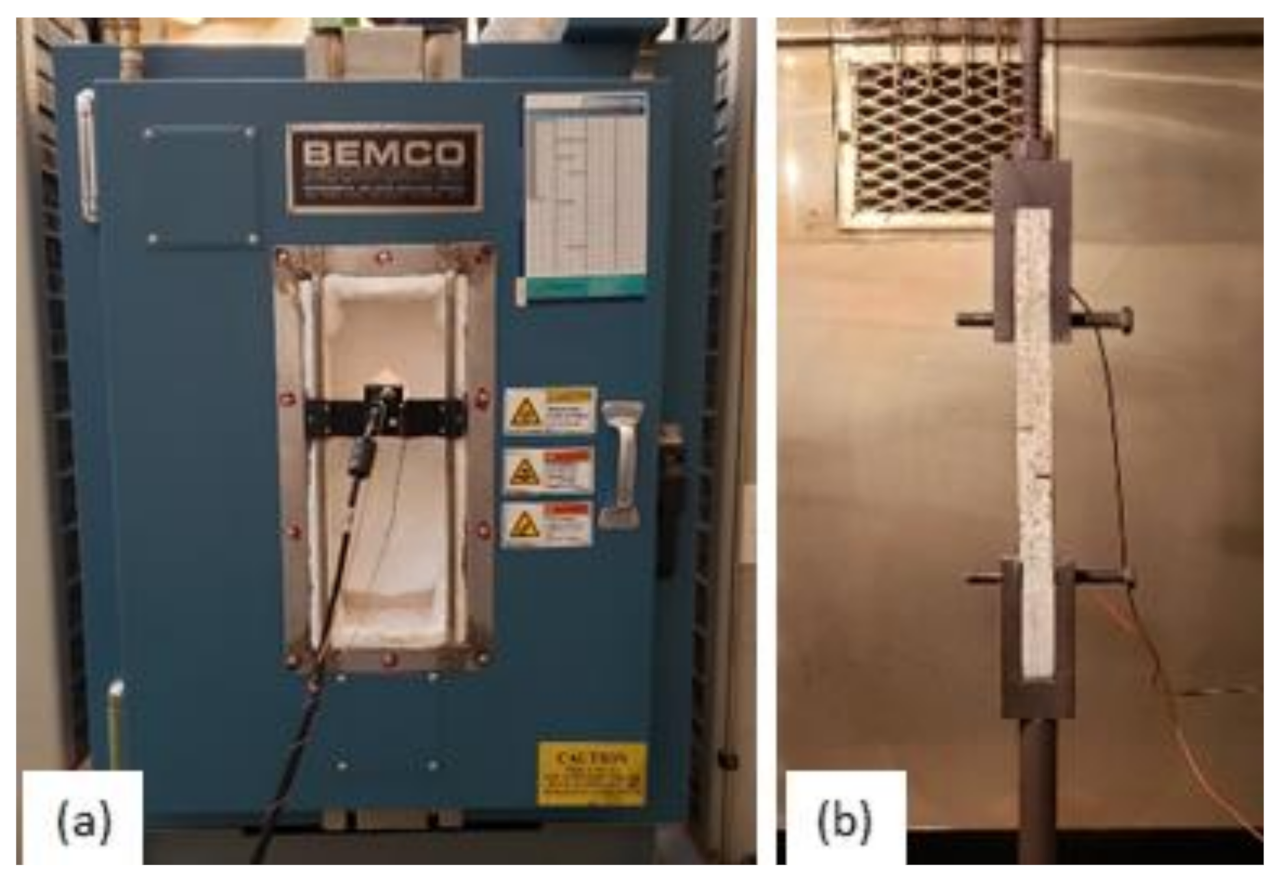
To gather baseline information about the strength of the adhesives as a function of temperature, quasi-static tests were performed at room temperature (25 °C) and 260 °C. The test procedure was similar to previous works [13,19]. Samples were tested at a rate of 1 mm min−1 within a temperature-controlled chamber (BEMCO FTU7.0-100 × 600, Simi Valley (CA), USA, which was installed within a universal testing machine testing frame (Figure 3). To minimize the effect of moisture differences on the relative strength of the assemblies, the samples tested at 25 °C were dried in a vacuum oven overnight at 50 °C and 0.1 MPa, and stored in desiccant prior to testing; moisture was removed from the samples tested at 260 °C as they were brought to temperature. The 260 °C samples were heated until thermal equilibrium was reached, as determined by an embedded thermocouple at mid-depth of the sample. Once the sample reached the oven temperature, as indicated from the internal thermocouple, load was applied to the sample.
2.2.2. Creep Tests
Zelinka, et al. [14] examined the bondline thermocouple data of previously conducted compartment fire and PRG-320 tests. They found that the rate of temperature increase at the first bondline depended on the adhesive type. For the adhesive that failed the PRG-320 test, the first layer dropped off early in the test; the second flashover was caused by the failure of the adhesive at the second bondline. For the adhesives that passed the test, the temperature at the first bondline never exceeded the char temperature of wood. The passing adhesives had an increasing temperature from 50 °C to 250 °C over the course of 50 min, for an average thermal ramp rate of 4 °C min−1.
In this study, creep tests were designed to match the temperatures and shear stress of the PRG-320 test on the first bondline. The shear stress was previously calculated and shown to be 56 kPa [14]. Likewise, the temperature ramp rate was selected from matching the average temperature ramp rate at the first bondline for adhesives that passed the PRG-320 test. The creep tests were conducted for a total of 125 min or until failure.
The shear stress on the bondline in the PRG-320 test was many times smaller than the bonded wood strength at 260 °C. Therefore, for the adhesives that passed the creep test, additional creep tests were run at a higher load and a slower ramp rate to better understand the performance of the adhesive bondline. In these tests, a load equivalent to 50% of the average maximum load at 260 °C for each passing adhesive was applied, and the temperature was ramped at 2 °C min−1.
In total, five replicates for each adhesive and a solid wood control were run with a shear stress of 6.8 MPa to match the PRG-320 test (40 specimens). Additionally, three replicates of four different adhesive formulations (EPI1, EPI2, MF, PRF) and solid wood were tested at 50% of the maximum load obtained at 260 °C.
The load was measured with a 10 kN loadcell, while the overall extension was measured using the crossarm displacement of the load frame. The specimens were wired with two thermocouples outside of the testing zone. One was to measure the approximate bondline temperature. The other thermocouple was connected to the environmental chamber controller, which would heat the specimen at 4 °C min−1 rather than the chamber. The deformations were measured with digital image correlation. Images were acquired at 1 Hz.
2.2.3. Statistical Analysis
A statistical analysis was carried out on the performance of the quasi-static test data to examine the behaviors of the different adhesives. The analyses were conducted in the R software package, with a p < 0.05 significance level for all tests [20]. The first steps within the analysis were to check the assumptions of normality and equal variances of the data. A Shapiro–Wilks normality test and Flinger–Killeen test of homogeneity were performed on the shear stress values of 25 °C and 260 °C. The shear stress at 25 °C followed both assumptions allowing for an ANOVA to be performed, which then was further analyzed with a Tukey test. Due to violations of the assumptions, the shear stress at 260 °C had a Kruskal–Wallis test performed, which is a common alternative to a one-way ANOVA. The shear stresses at 260 °C were then further analyzed using a Kruskalmc test to identify difference between each adhesive [21].
3. Results
3.1. Quasi-Static Tests
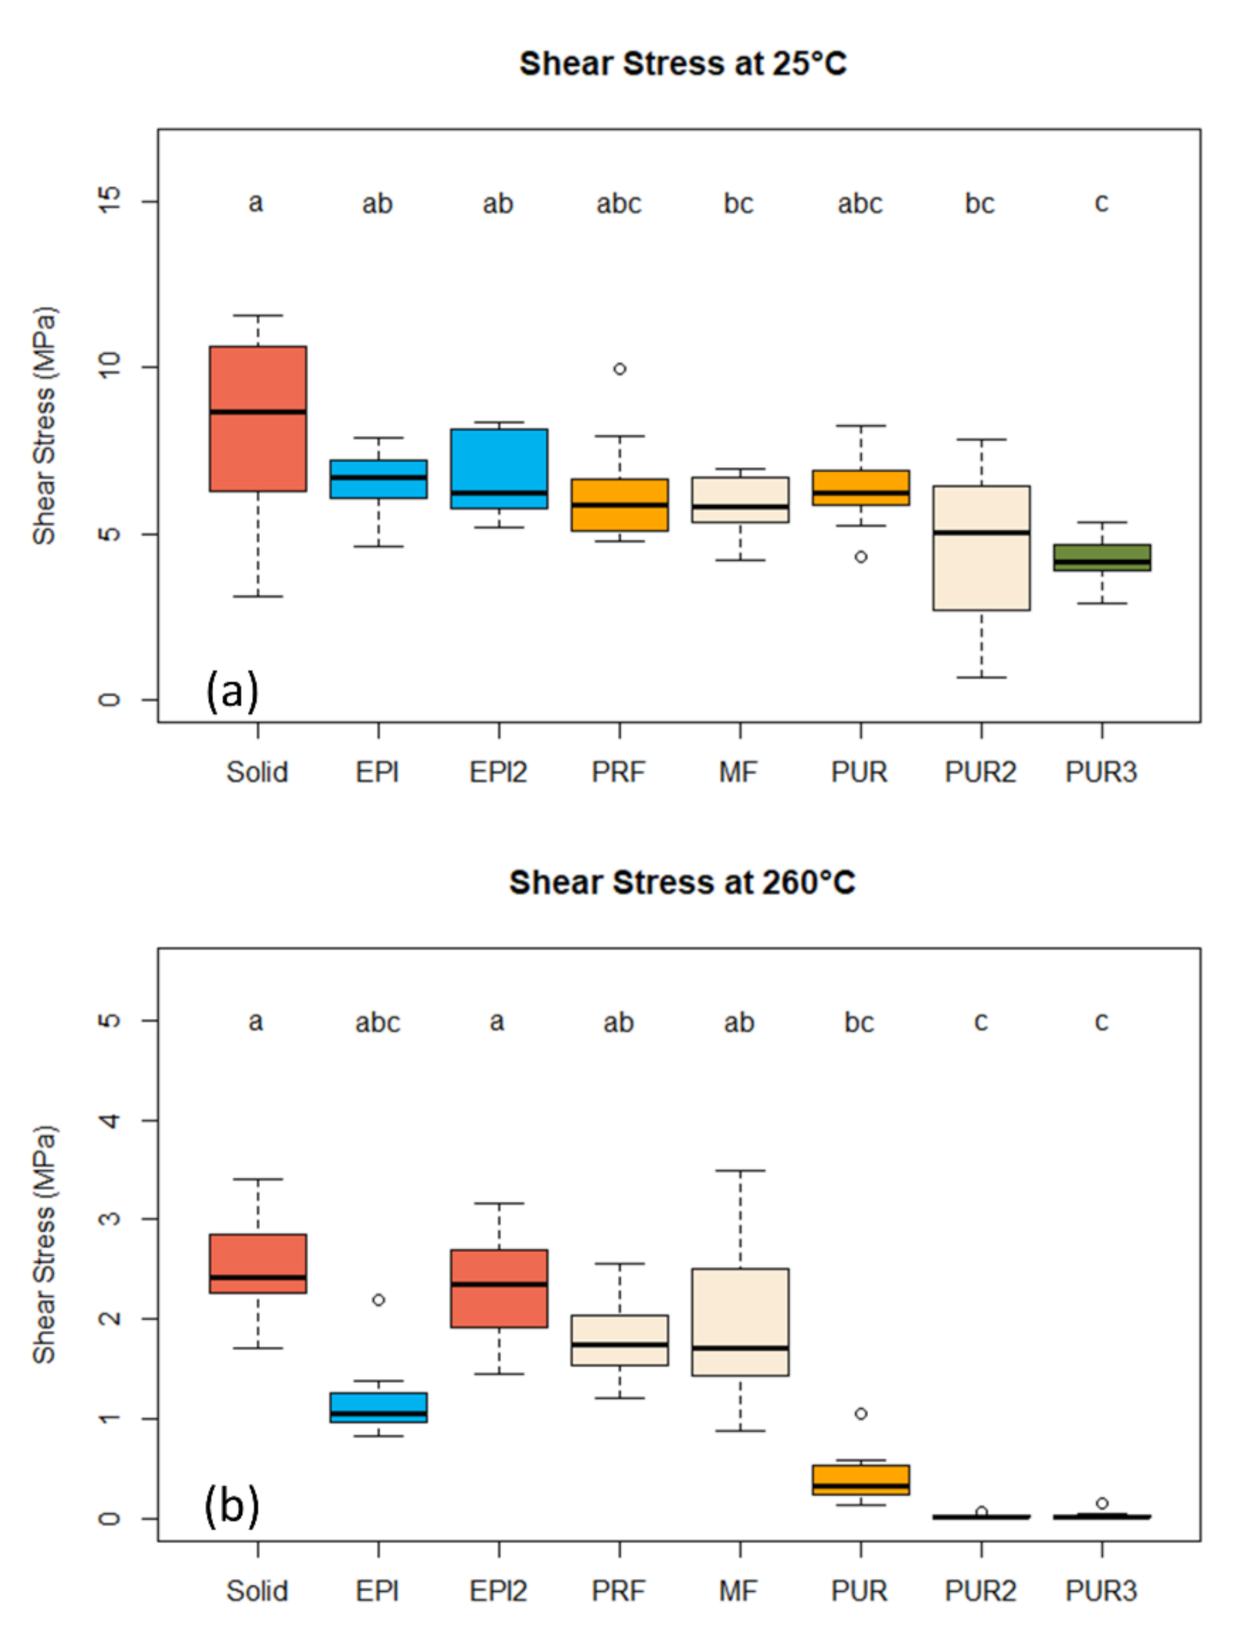
Figure 4 presents box and whisker diagrams of the maximum shear stress for the different adhesives at 25 °C (Figure 4a) and 260 °C (Figure 4b). Within the boxplot figure the whiskers represent the minimum and maximum, while the box is the interquartile range, with the top of the box being the 75th percentile and the bottom of the box being the 25th percentile. The line within the box is the data median, and any dots above or below are considered outliers. Mean stress values are given in Table 1 and Table 2. A Kruskalmc test was performed to examine statistical differences between groups, and the letters above the boxes indicate significant differences between adhesive groups.
At 25 °C the solid wood samples had the highest mean strength, but were not significantly different from the EPIs, PRF, MF, and PUR-1. No significant differences were found between all of the adhesively bonded samples, with the exception of PUR-3, which had the lowest mean strength of 4 MPa. PUR-3 could be statistically separated from the solid wood and both EPI formulations, but was not significantly different from the PRF, MF, and the other PUR adhesives.
Typically, wood adhesive joints are designed to be stronger than solid wood at room temperature [22]. However, we found that the samples with adhesive bonds were not as strong as the solid wood controls. One possible cause for the observed behavior is that the samples were vacuum dried before testing. It is known that dry wood has a higher strength than wood at the typical test conditions of 12% wood moisture content; however, this strengthening may not happen over the adhesive bonds. Since the goal of these tests were to compare the strength loss due to heat alone (and avoid moisture effects) all tests were conducted under dry conditions.
At 260 °C, a much wider range of adhesive performance could be observed. Again, the solid wood had the highest mean strength. All adhesives, except for the PURs, were not statistically different from solid wood at 260 °C. EPI-1 had a mean strength of 1.2 MPa at 260 °C, and its performance was significantly better than the PUR formulations but below that of all other adhesives. Finally, no significant differences could be observed among the PUR formulations, although PUR-1 had the highest mean failure stress of 0.3 MPa.
3.2. Creep Tests
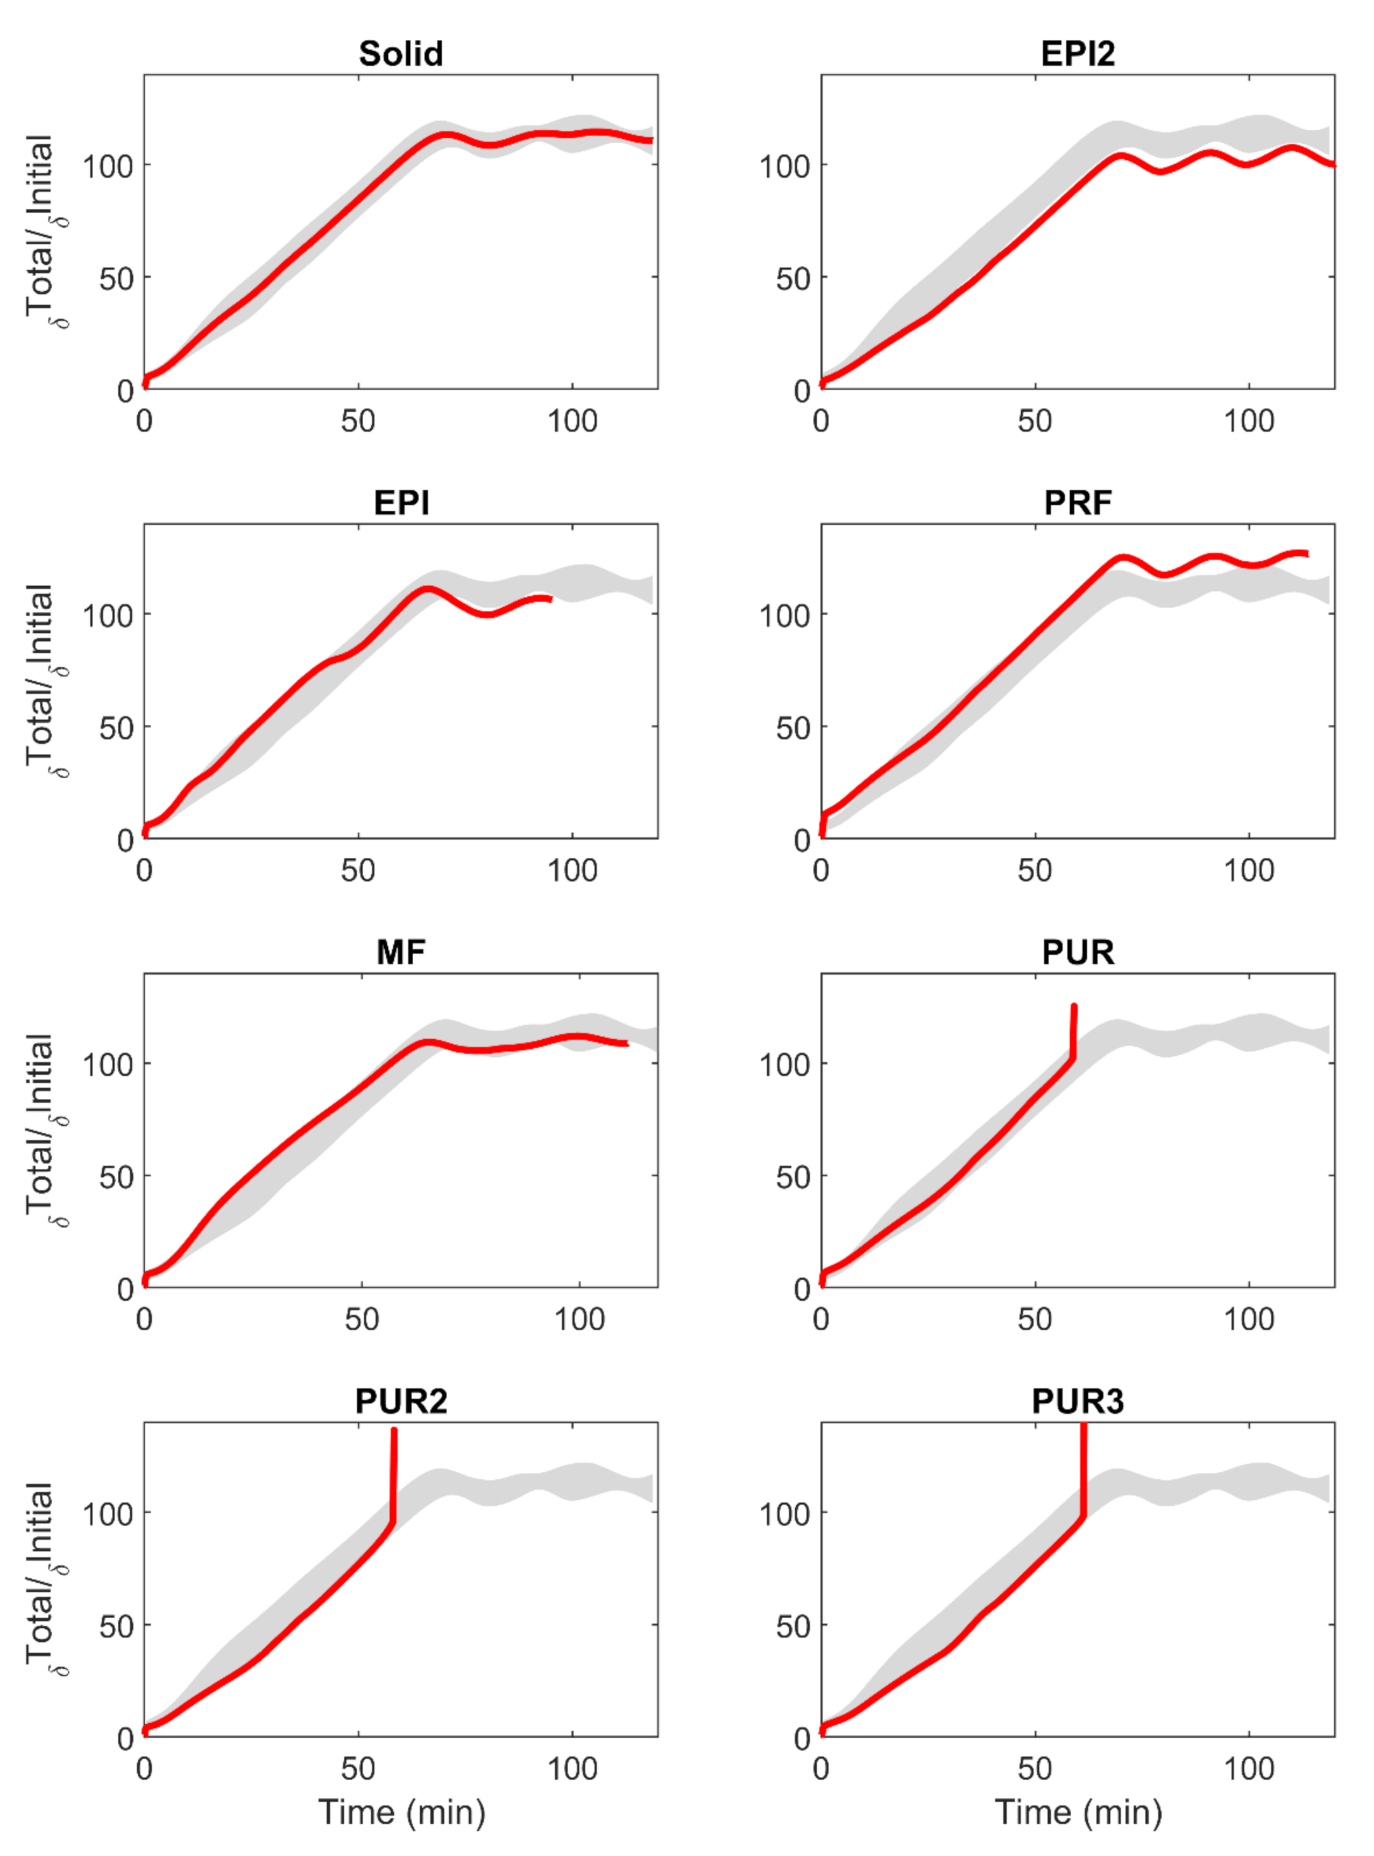
The results of the creep tests with an applied bondline stress of 6.8 MPa are represented with the average curve of the five replicates in Figure 5. On the Y-axis is the deformation normalized to the initial deformation this normalization helps to account for variation in stiffness between samples, so that the creep behavior can be compared against samples [23]. In these tests the internal temperature of the wood was raised at 4 °C per minute until 260 °C (approximately 60 min into the test). Once the samples reached 260 °C they were held at temperature for an additional 60 min, or until failure. As can be seen, the normalized deformation increased in an approximately linearly fashion until the maximum temperature was reached. For the adhesives that passed the test, the deformation was relatively constant after the maximum temperature was reached.
All adhesive chemical formulations, except the polyurethanes, passed the creep test and exhibited no failures either during the temperature ramp, or during the remaining hold time at elevated temperature. The polyurethane adhesives began to fail after the 60-min mark, with failure times ranging from 58 to 72 min of heating. Of the polyurethane chemistries, PUR-2 and PUR-3 failed in all five replicates. Of the two adhesives, PUR-3 lasted longer during the creep test, with an average time of 61 min and 24 s, compared to 58 min and 7 s for PUR-2. PUR-1 passed the test two times and failed three of the five replicates, with an average failure time of 66 min and 39 s for the three replicates that failed. All three polyurethane adhesives showed that there were no significant differences between the failure times in the cases that failed (ANOVA, p-value = 0.58).
4. Discussion
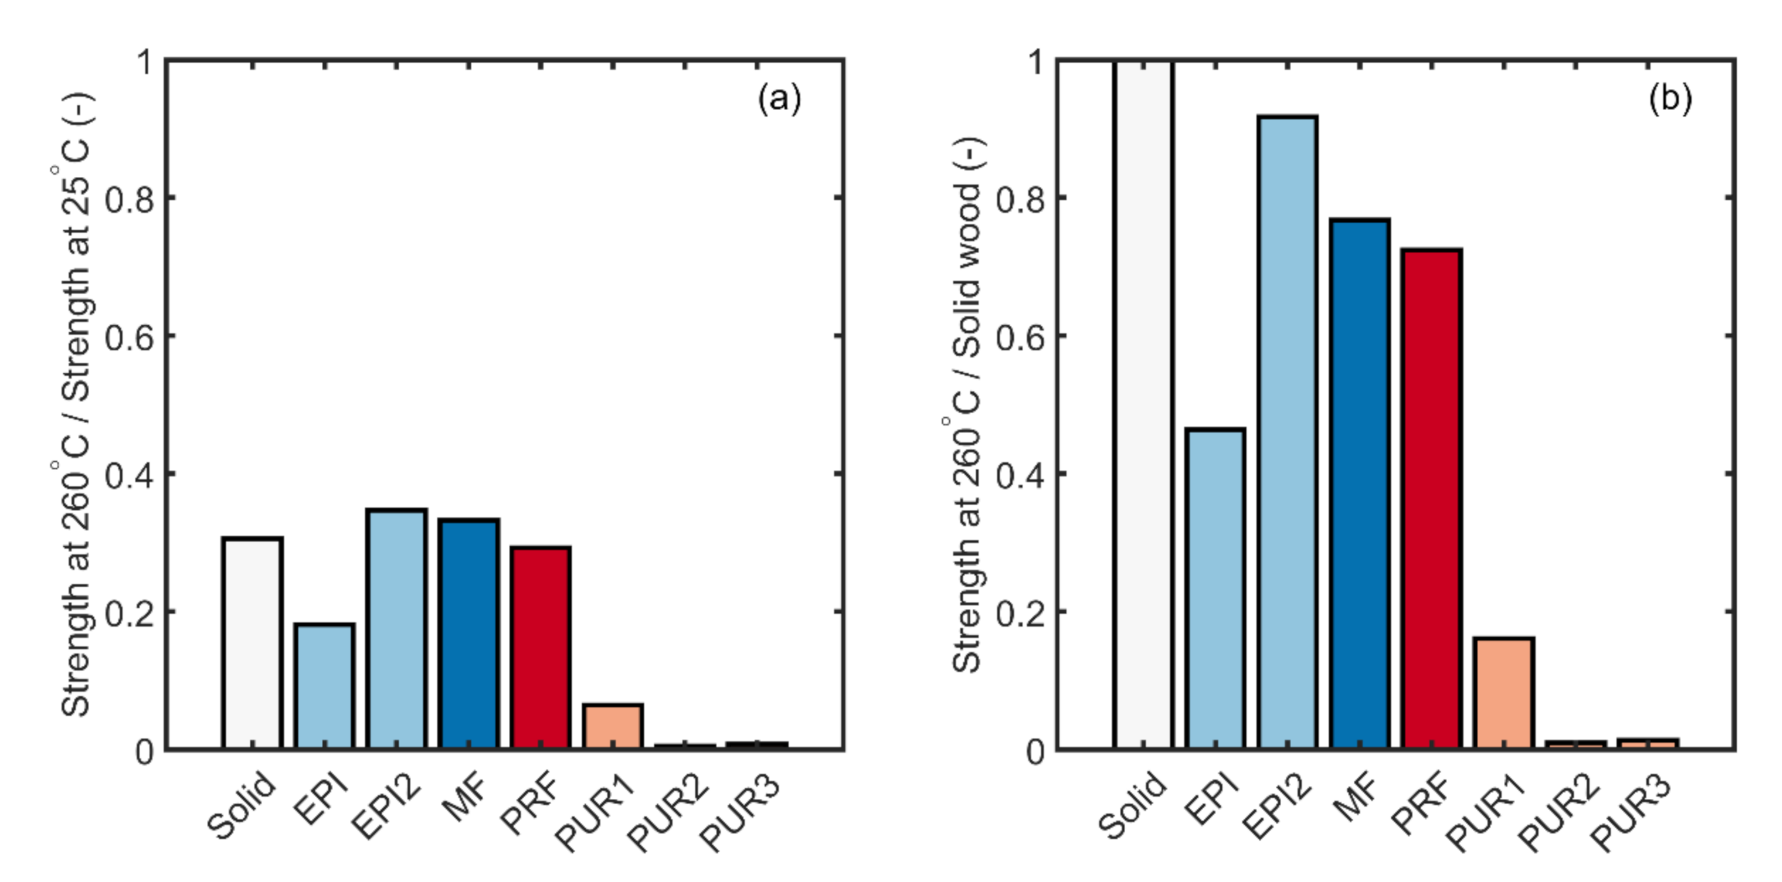
The purpose of this work was to better understand how the risk of heat delamination in CLT depends upon the adhesive. It builds upon the previous work of Zelinka, et al. [13], who used quasi-static tests to explore how adhesive strength depended on temperature. There are two different ways to examine the reduction in strength with temperature; the results at high temperature for a given type of adhesive can be either normalized to the same adhesive’s strength at room temperature, or it can be compared against the strength of solid wood at any temperature. The first analysis is useful for comparing how different adhesives lose strength as the temperature is increased, while the second method is useful for examining which adhesives are the strongest at high temperatures. Both analyses are shown in Figure 6.
The strength of the adhesives relative to solid wood shown in Figure 6 can be used to better understand the risk of delamination during a fire event for CLT compartments. At present, three different adhesive formulations have passed the full-scale fire test as presented in PRG-320 for non-heat delaminating adhesives. Of the three qualifying adhesives, two were MF formulations and one was a PUR formulation [12,24]. The quasi-static test data shown in Figure 6 shows that PUR adhesives have very little strength at 260 °C. Therefore, the fact that a PUR adhesive passed the full-scale test without delamination leading to fire regrowth suggests that very little strength at elevated temperature is needed to prevent delamination. This should not be surprising as it can be shown that shear forces acting along the fire-exposed adhesive bondline were minimal within CLT floor systems [14]. The implications of these findings suggests that it should be relatively easy for non-PUR systems to pass the PRG-320 test, and that even the PUR systems do not need to have excessive strength at 260 °C to pass the test.
While some insights into how adhesive formulations may perform in the PRG-320 test can be gleaned from the data in Figure 6, the creep data collected in this paper gives the clearest indication of how an adhesive formulation may perform in the full-scale test. In these tests, the stresses and bondline temperatures were matched to the full-scale test, and the deformation was observed until potential failure. The creep test was highly correlated to the quasi-static testing at 260 °C; all adhesive formulations with an ultimate strength greater than 1 MPa at 260 °C passed the creep test, with no failures. Likewise, the two PUR formulations with the lowest strength failed in the creep test but also had almost no strength (<0.05 MPa) at 260 °C. PUR-1 passed the creep test three out of five times, and requires further discussion. This adhesive had a high coefficient of variation (65%) in the quasi-static tests; the maximum strength is given in Table 1 and Table 2 for each replicate. Since samples for the creep tests were made at the same time and in the same batch as the quasi-static samples, it is likely that a similar distribution of quasi-static strengths was tested in the creep test. Therefore, the samples that failed the creep test may have had a similar quasi-static strength to the lowest replicates, and the three that passed the creep test were on the higher end of the distribution. These data suggest that minimum bond strength required to pass the creep test is somewhere between 0.2 MPa and 0.6 MPa, and likely lies in the higher end of that range.
One goal of this work was to work towards developing a small-scale test that can be used to determine the likelihood of heat delamination in a CLT fire scenario. The data presented in this paper show that clear differences in adhesive behavior at high temperatures, in both the creep test and quasi-static test, that are consistent with full-scale PRG-320 tests, and can be easily used to separate adhesives and make predictions about which adhesives will pass the full scale test. Testing these joints under both heat and load simultaneously allows the potential for delamination to be observed without the additional uncertainty, variability, and cost of charring through an entire layer of wood before the bondline temperature becomes elevated. While the creep test is the most accurate representation of the physics of the full-scale test, these tests are slightly more difficult and time consuming to run. Measuring the adhesive strength at 260 °C may be a slightly easier test; if the adhesive has a strength greater than 1 MPa at 260 °C, the presented data suggests it is likely to pass in both the small scale creep test and the full-scale PRG-320 test. The data from PUR-1 suggest that minimum bond strength measured at 260 °C required to pass the creep test is at least 0.6 MPa, but may be as low as 0.2 MPa. Measuring the bond strength at 260 °C in this configuration can be a useful screening test in the development of new adhesives.
5. Conclusions
Within this study lap shear test specimens were tested at elevated temperatures using two types of testing methods; a quasi-static tensile test and creep tests. The quasi-static tests were performed at both 25 °C and 260 °C, showing the bond strength at room temperature and near the char temperature. During the elevated temperature testing the polyurethane group all showed the largest amount of strength reduction compared to the other adhesives. The results of the quasi-static testing were an indicator on how the adhesives would react during the creep tests. The creep tests appeared to follow similar trends of that of the PRG-320 tests, with the polyurethane adhesive failing after 60 min of exposure. These tests showed that minimal stress applied to the specimen was a good representation of the first bondline of a typical CLT panel. Overall, these tests suggest that this small-scale method may be used to gain insights into the performance of CLT adhesives in large-scale fire tests, including the PRG-320 standard.
Author Contributions
Conceptualization, S.L.Z. and D.R.R.; methodology, S.L.Z., B.M. and N.J.B.; software, N.J.B. and B.M.; formal analysis, B.M. and N.J.B.; writing—original preparation, S.L.Z.; writing—review and editing, S.L.Z., B.M., N.J.B. and D.R.R.; visualization, B.M., S.L.Z. and N.J.B.; supervision, S.L.Z.; project administration, S.L.Z.; funding acquisition, B.M. and S.L.Z. All authors have read and agreed to the published version of the manuscript.
Funding
This material is based upon work supported by the National Science Foundation under Grant No. 1624599, NSF IUCRC Wood-Based Composites Center.
Data Availability Statement
The data presented in this study are available on request from the corresponding author.
Conflicts of Interest
The authors declare no conflict of interest.
References
- Mohammad, M.; Gagnon, S.; Douglas, B.K.; Podesto, L. Introduction to Cross Laminated Timber. Wood Des. Focus 2012, 22, 3–12. [Google Scholar]
- Iqbal, A. Recent developments in tall wood buildings. In Proceedings of the 1st International Conference on New Horizons in Green Civil Engineering (NHICE-01), Victoria, BC, USA, 25–27 April 2018; pp. 111–116. [Google Scholar]
- Green, M.; Karsh, J. TALL WOOD—The Case for Tall Wood Buildings; Report prepared for the Canadian Wood Council on behalf of the Wood Enterprise Coalition and Forest Innovation Investment: Vancouver, BC, USA, 2012. [Google Scholar]
- Anon. International Building Code; Delmar Cengage Learning: Florence, KY, USA, 2021. [Google Scholar]
- Fitz-Thedmar, A. Liber de Antiqus Legibus. (Chronicles of the Mayors and Sheriffs of London, A.D. 1188 to A.D. 1274); Corporation of the City of London: London, UK, 1274.
- Knowles, C.C.; Pitt, P.H. The History of Building Regulation in London, 1189–1972: With an Account of the District Surveyors' Association; Architectural Press: London, UK, 1972. [Google Scholar]
- White, R.H.; Dietenberger, M.A. Fire Safety of Wood Construction. In Wood Handbook: Wood as an Engineering Material; Ross, R.J., Ed.; U.S. Department of Agriculture, Forest Service, Forest Products Laboratory: Madison, WI, USA, 2010. [Google Scholar]
- White, R.H. Analytical methods for determining fire resistance of timber members. In The SFPE Handbook of Fire Protection Engineering, 2nd ed.; National Fire Protection Association: Quincy, MA, USA, 1995. [Google Scholar]
- Gerard, R.; Barber, D.; Wolski, A. Fire Safety Challenges of Tall Wood Buildings; National Fire Protection Research Foundation: Quincy MA, USA, 2013. [Google Scholar]
- Anon. ANSI/APA PRG 320: Standard for Performance Rated Cross-Laminated Timber; APA—The Engineered Wood Association: Tacoma, WA, USA, 2018. [Google Scholar]
- Su, J.; Lafrance, P.-S.; Hoehler, M.; Bundy, M. Fire Safety Challenges of Tall Wood Buildings—Phase 2: Task 2 & 3 Cross Laminated Timber Compartment Fire Tests; Fire Protection Research Foundation: Quincy, MA, USA, 2018. [Google Scholar]
- Janssens, M. Development of a Fire Performance Assesment Methodology for Qualifying Cross-Laminated Timber Adhesives; SwRI Project No.01.23086.01.001a; Southwest Research Institute: San Antonio, TX, USA, 2017. [Google Scholar]
- Zelinka, S.L.; Sullivan, K.; Pei, S.; Ottum, N.; Bechle, N.; Rammer, D.R.; Hasburgh, L.E. Small scale tests on the performance of adhesives used in cross laminated timber (CLT) at elevated temperatures. Int. J. Adhes. Adhes. 2019, 95, 102436. [Google Scholar] [CrossRef]
- Zelinka, S.L.; Miyamoto, B.; Bechle, N.J.; Rammer, D. Small Scale Test to Measure the Strength of Adhesives at Elevated Temperatures for Use in Evaluating Adhesives for Cross Laminated Timber (CLT). In Wood & Fire Safety; Springer: Cham, Switzland, 2020; pp. 3–8. [Google Scholar]
- Yeh, B.; Brooks, R. Evaluation of adhesive performance at elevated temperatures for engineered wood products. In Proceedings of the 9th world conference on timber engineering, Portland, OR, USA, 6–10 August 2006. [Google Scholar]
- Yeh, B.; Herzog, B.; Ipsen, P.; Brooks, R. Adhesive performance at elevated temperatures for engineered wood products. In Proceedings of the International Conference on Wood Adhesives, San Diego, CA, USA, 2–4 November 2006; pp. 195–201. [Google Scholar]
- Yeh, B. ASTM standards for engineered wood products: Focus on glulam, I-Joists, and structural composite lumber. Astm. Stand. News 2003, 31, 33–35. [Google Scholar]
- Schaffer, E.L. A Simplified Test for Adhesive Behavior in Wood Sections Exposed to Fire; USDA Forest Service Research Note FPL-0175; U.S. Department of Agriculture: Madison, WI, USA, 1968.
- Zelinka, S., L.; Pei, S.; Bechle, N.; Sullivan, K.; Ottum, N.; Rammer, D.R.; Hasburgh, L.E. Performance of wood adhesives for cross laminated timber under elevated temperature. Paper MAT-O1-04. In Proceedings of the World Conference of Timber Engineering, Seoul, Korea, 20–23 August 2018. [Google Scholar]
- R_Core_Team. R: A Language and Environment for Statistical Computing; R Foundation for Statistical Computing: Vienna, Austria, 2019. [Google Scholar]
- Siegel, S.; Castellan, J.J. Nonparametric Statistics for the Behavioral Sciences, 2nd ed.; McGraw-Hill Book Company: New York, NY, USA, 1988. [Google Scholar]
- Ross, R.J. Wood Handbook. Wood as an Engineering Material; US Department of Agriculture: Madison, WI, USA, 2010.
- Anon. Standard Specification for Evaluation of Duration of Load and Creep Effects of Wood and Wood-Based Products; ASTM D6815-09; American Society for Testing and Materials: West Conshohocken, PA, USA, 2016. [Google Scholar]
- Janssens, M. Proposed Fire Performance Assesment Methodology for Qualifying Cross-Laminated Timber Adhesives Developed for the American Wood Council. Mass Plywood Panel Experimental Results; SwRI project number 01.23086.01.001c; Southwest Research Institute: San Antonio, TX, USA, 2017. [Google Scholar]
Figure 1.
(a) Temperature profile specified in the PRG-320 test (labeled inert) with corresponding temperature profiles for cross laminated timber (CLT) with adhesives that passed and failed the test. (b) Temperature profile at the first bondline for an adhesive that passed the PRG-320 test. Data replotted from [12].

Figure 2.
Specimen fabrication and geometry. (a) Douglas-fir #1 and better notched board before adhering. (b) Final dimensions of the specimens tested.
Figure 2.
Specimen fabrication and geometry. (a) Douglas-fir #1 and better notched board before adhering. (b) Final dimensions of the specimens tested.

Figure 3.
Test setup (a) BEMCO environmental chamber installed within the test frame. (b) Lap shear test specimen installed with BEMCO chamber.
Figure 3.
Test setup (a) BEMCO environmental chamber installed within the test frame. (b) Lap shear test specimen installed with BEMCO chamber.

Figure 4.
(a) Maximum shear stress at 25 °C. Letters at the top of the figure represent groupings from the Tukey Test. (b) Maximum shear stress at 260 °C. Letters at the top of the figure represent groupings from the Kruskalmc test. Whiskers represent the minimum and maximum and any dots (°) above or below are considered outliers

Figure 5.
The average curve of all the adhesives, compared with solid wood. The averaged curve of each treatment is represented in (red) with the shaded (grey) area indicating +/−1 standard deviation.
Figure 5.
The average curve of all the adhesives, compared with solid wood. The averaged curve of each treatment is represented in (red) with the shaded (grey) area indicating +/−1 standard deviation.

Figure 6.
Mean strength at 260 °C normalized to (a) strength at room temperature, and (b) solid wood at 260 °C.
Figure 6.
Mean strength at 260 °C normalized to (a) strength at room temperature, and (b) solid wood at 260 °C.


Table 1.
Sample Means of Specimens Tested at 25 °C.
| Adhesive | Solid | EPI | EPI2 | MF | PRF | PUR | PUR2 | PUR3 |
|---|---|---|---|---|---|---|---|---|
| Mean (MPa) | 8.32 | 6.49 | 6.71 | 5.87 | 6.28 | 6.36 | 4.60 | 4.19 |
| StDev (MPa) | 2.75 | 1.15 | 1.27 | 0.86 | 1.60 | 1.21 | 2.31 | 0.68 |
| COV % | 0.33 | 0.18 | 0.19 | 0.15 | 0.25 | 0.19 | 0.50 | 0.16 |
Table 2.
Sample Means of Specimens Tested at 260 °C.
| Adhesive | Solid | EPI | EPI2 | MF | PRF | PUR | PUR2 | PUR3 |
|---|---|---|---|---|---|---|---|---|
| Mean (MPa) | 2.55 | 1.18 | 2.33 | 1.95 | 1.84 | 0.41 | 0.03 | 0.03 |
| StDev (MPa) | 0.51 | 0.39 | 0.49 | 0.79 | 0.45 | 0.27 | 0.02 | 0.04 |
| COV % | 0.20 | 0.33 | 0.21 | 0.40 | 0.25 | 0.66 | 0.68 | 1.29 |
Publisher’s Note: MDPI stays neutral with regard to jurisdictional claims in published maps and institutional affiliations. |
© 2021 by the authors. Licensee MDPI, Basel, Switzerland. This article is an open access article distributed under the terms and conditions of the Creative Commons Attribution (CC BY) license (http://creativecommons.org/licenses/by/4.0/).
Share and Cite
MDPI and ACS Style
Miyamoto, B.; Bechle, N.J.; Rammer, D.R.; Zelinka, S.L. A Small-Scale Test to Examine Heat Delamination in Cross Laminated Timber (CLT). Forests 2021, 12, 232. https://0-doi-org.brum.beds.ac.uk/10.3390/f12020232
AMA Style
Miyamoto B, Bechle NJ, Rammer DR, Zelinka SL. A Small-Scale Test to Examine Heat Delamination in Cross Laminated Timber (CLT). Forests. 2021; 12(2):232. https://0-doi-org.brum.beds.ac.uk/10.3390/f12020232
Chicago/Turabian StyleMiyamoto, Byrne, Nathan J. Bechle, Douglas R. Rammer, and Samuel L. Zelinka. 2021. "A Small-Scale Test to Examine Heat Delamination in Cross Laminated Timber (CLT)" Forests 12, no. 2: 232. https://0-doi-org.brum.beds.ac.uk/10.3390/f12020232
Note that from the first issue of 2016, this journal uses article numbers instead of page numbers. See further details here.