
Intraspecific Growth Response to Drought of Abies alba in the Southeastern Carpathians


1
Department of Forest Genetics and Tree Breeding, “Marin Dracea” National Institute for Research and Development in Forestry, 077190 Voluntari, Romania
2
Faculty of Silviculture and Forest Engineering, Transilvania University of Brasov, 500123 Brasov, Romania
3
Department of Research and Infrastructure Projects, National Meteorological Administration, 013686 Bucharest, Romania
*
Authors to whom correspondence should be addressed.
Forests 2021, 12(4), 387; https://0-doi-org.brum.beds.ac.uk/10.3390/f12040387
Submission received: 21 February 2021
/
Revised: 18 March 2021
/
Accepted: 22 March 2021
/
Published: 24 March 2021
(This article belongs to the Special Issue Climate Change and Air Pollution Effects on Forest Ecosystems)
Abstract
:The intensity and frequency of drought have increased considerably during the last decades in southeastern Europe, and projected scenarios suggest that southern and central Europe will be affected by more drought events by the end of the 21st century. In this context, assessing the intraspecific genetic variation of forest tree species and identifying populations expected to be best adapted to future climate conditions is essential for increasing forest productivity and adaptability. Using a tree-ring database from 60 populations of 38-year-old silver fir (Abies alba) in five trial sites established across Romania, we studied the variation of growth and wood characteristics, provenance-specific response to drought, and climate-growth relationships during the period 1997–2018. The drought response of provenances was determined by four drought parameters: resistance, recovery, resilience, and relative resilience. Based on the standardized precipitation index, ten years with extreme and severe drought were identified for all trial sites. Considerable differences in radial growth, wood characteristics, and drought response parameters among silver fir provenances have been found. The provenances’ ranking by resistance, recovery, and resilience revealed that a number of provenances from Bulgaria, Italy, Romania, and Czech Republic placed in the top ranks in almost all sites. Additionally, there are provenances that combine high productivity and drought tolerance. The correlations between drought parameters and wood characters are positive, the most significant correlations being obtained between radial growth and resilience. Correlations between drought parameters and wood density were non-significant, indicating that wood density cannot be used as indicator of drought sensitivity. The negative correlations between radial growth and temperature during the growing season and the positive correlations with precipitation suggest that warming and water deficit could have a negative impact on silver fir growth in climatic marginal sites. Silvicultural practices and adaptive management should rely on selection and planting of forest reproductive material with high drought resilience in current and future reforestation programs.
1. Introduction
Climate change is a major threat to forests in the 21st century. According to the reports of the Intergovernmental Panel on Climate Change [1,2], temperatures have increased globally, and the highest rates of warming have taken place in the last decades. Furthermore, recent evidence has shown a significant increase in the frequency of extreme weather events (prolonged droughts, heat waves, cold snaps, and floods) related to global climate change [3,4].
Among the extreme meteorological events, drought is considered to have the largest detrimental impact on forest ecosystems. Drought and heat stress associated with climate change could fundamentally alter the productivity, genetic diversity, and distribution of forest ecosystems [5,6,7]. In recent years, it was observed that drought frequency, severity, and duration increased in many regions in Europe [8]. The most affected regions have been southern Europe with the Mediterranean region as a hotspot [9,10] and South-eastern Europe, particularly the Carpathian region [11,12,13].
The moderate scenario projections (RCP4.5) show that southern Europe, western Europe, and northern Scandinavia will be affected by a substantial increase in drought frequency by the end of the 21st century. However, the extreme emission scenario (RCP8.5) suggests that the entirety of Europe will be affected by more frequent and severe droughts compared to the last century. Under both scenarios, drought frequency is projected to increase in spring and summer everywhere in Europe, but especially in southern Europe [14,15].
The climate changes will also enhance the action of the new biotic (pest and disease) and abiotic disturbance factors (fire, windstorm) with major consequences for forest ecosystems. Increasing the extreme events, such as drought and disturbance factors, in the near future will pose serious threats to the growth and persistence of forest species than gradual climate changes [16,17]. There is a consensus that the ability of forest ecosystems to provide multiple goods and services will be impacted [18]. The mountain ecosystems and those located at the edges of forest species’ distribution will be the most vulnerable.
Silver fir (Abies alba Mill.) is one of the main species of mountain ecosystems in Europe with multiple functions, including ecological, economic, and soil protection roles. European silver fir is a shade-tolerant species and can grow in an array of soil conditions, with various amounts of nutrients, but prefers humid and deep soils [19]. Results so far regarding the potential of silver fir to thrive under expected warmer and drier conditions are optimistic. The species distribution models (SDMs) suggest that the suitable distribution area of silver fir will decrease by the end of the century, particularly in the southern and eastern parts of its distribution, but the lowest decrease is projected for silver fir compared to other coniferous species [20,21]. On the other hand, paleoecological studies, as well as dynamic models accounting for biotic and abiotic disturbances, suggest that this species has a high potential to cope with the expected climate change [22] and can even expand in regions with summer water deficit from central and eastern Europe [23,24]. Additionally, other recent studies showed that European silver fir has high phenotypic plasticity [25] and is less vulnerable to drought stress than other conifers of temperate forests [26,27,28,29,30,31]. However, a possible decline may occur in the driest and warmest areas at the distribution edge [32,33,34]. Therefore, European silver fir could be one of the future species for consideration under changing climate conditions, particularly at lower altitudes in the mixed vegetation layer.
Considering that drought events will become more frequent and intense in the near future, the strategies to cope with climate change have to prepare forests by increasing the adaptive capacity of tree populations [35]. Recent research shows that selecting and transferring forest reproductive material adapted to the new environmental conditions of the planting site could increase genetic diversity in those areas and could facilitate the adaptation of forest species [36,37,38]. Therefore, assessment of intraspecific genetic variation and identifying populations expected to be best adapted to the future climate conditions is essential for increasing forest productivity and adaptability in the context of climate changes.
Many classical studies in the field of dendrochronology have investigated the potential impact of climate changes on tree growth [28,29,32]. Unfortunately, these studies do not take into account the existence of intraspecific genetic variation, considering genetically homogeneous species. Provenance trials, where tree populations throughout the entire distribution of a species are tested in different site conditions, can provide important data concerning intraspecific adaptive capacity and selection of suitable populations for reforestation programs. These genetic tests facilitate the identification of climatic variables that exert strong selective pressure on studied populations and the developing of the models that can be used to predict species’ response to future climates [39,40].
Provenance trials have been used to analyze intraspecific variation in climate growth response in several tree species, such as Pinus contorta [39,41], Pinus sylvestris, Fagus sylvatica and Quercus petraea [42], Quercus robur [43], Picea glauca [44,45], Pseudotsuga menziesii var. menziesii [46,47], Picea abies [42,48,49,50,51], and Abies alba [34,52]. However, there are still gaps in our knowledge concerning the intraspecific genetic response of forest species to extreme climate events, such as severe or extreme droughts, because they require long-term experiments and growth and climate assessments over several decades. Recent studies have shown that there are significant genetic variations in drought response both within and among trees populations [53,54,55,56]. The provenance-specific drought response for silver fir has been investigated in even fewer studies [30,57,58].
The Romanian Carpathians represent the southeastern distribution limit of silver fir in Europe. Meteorological records show a warming trend and increasingly severe and extreme summer droughts in recent decades in this region. Considering that negative effects of predicted climate change will be more pronounced, especially at the xeric edge of species distribution range [14,15,34], knowing the adaptive capacity of silver fir becomes of major importance. In this context, the aim of this study was to investigate the genetic adaptive capacity and response of silver fir provenances originated from nine European countries to extreme drought events that have occurred in this region in the last 22 years. Understanding of the population’s performance in relation to climate stress, selection of the best adapted seed sources to future climate conditions, and using them in reforestation programs (i.e., assisted migration) is essential for increasing forest productivity and adaptability.
Based on the assumption that drought will significantly impact silver fir ecosystems in southeastern Europe, in the near future, the objectives of this study were to (1) assess the genetic variation of radial growth and wood characteristics among silver fir provenances, (2) evaluate the provenances-specific drought response, (3) establish the climate–growth relationships, (4) determine correlations between radial growth and wood characteristics, and drought parameters, and (5) provide practical information for sustainable forest management in a changing climate context.
2. Materials and Methods
2.1. Trial Site and Plant Material
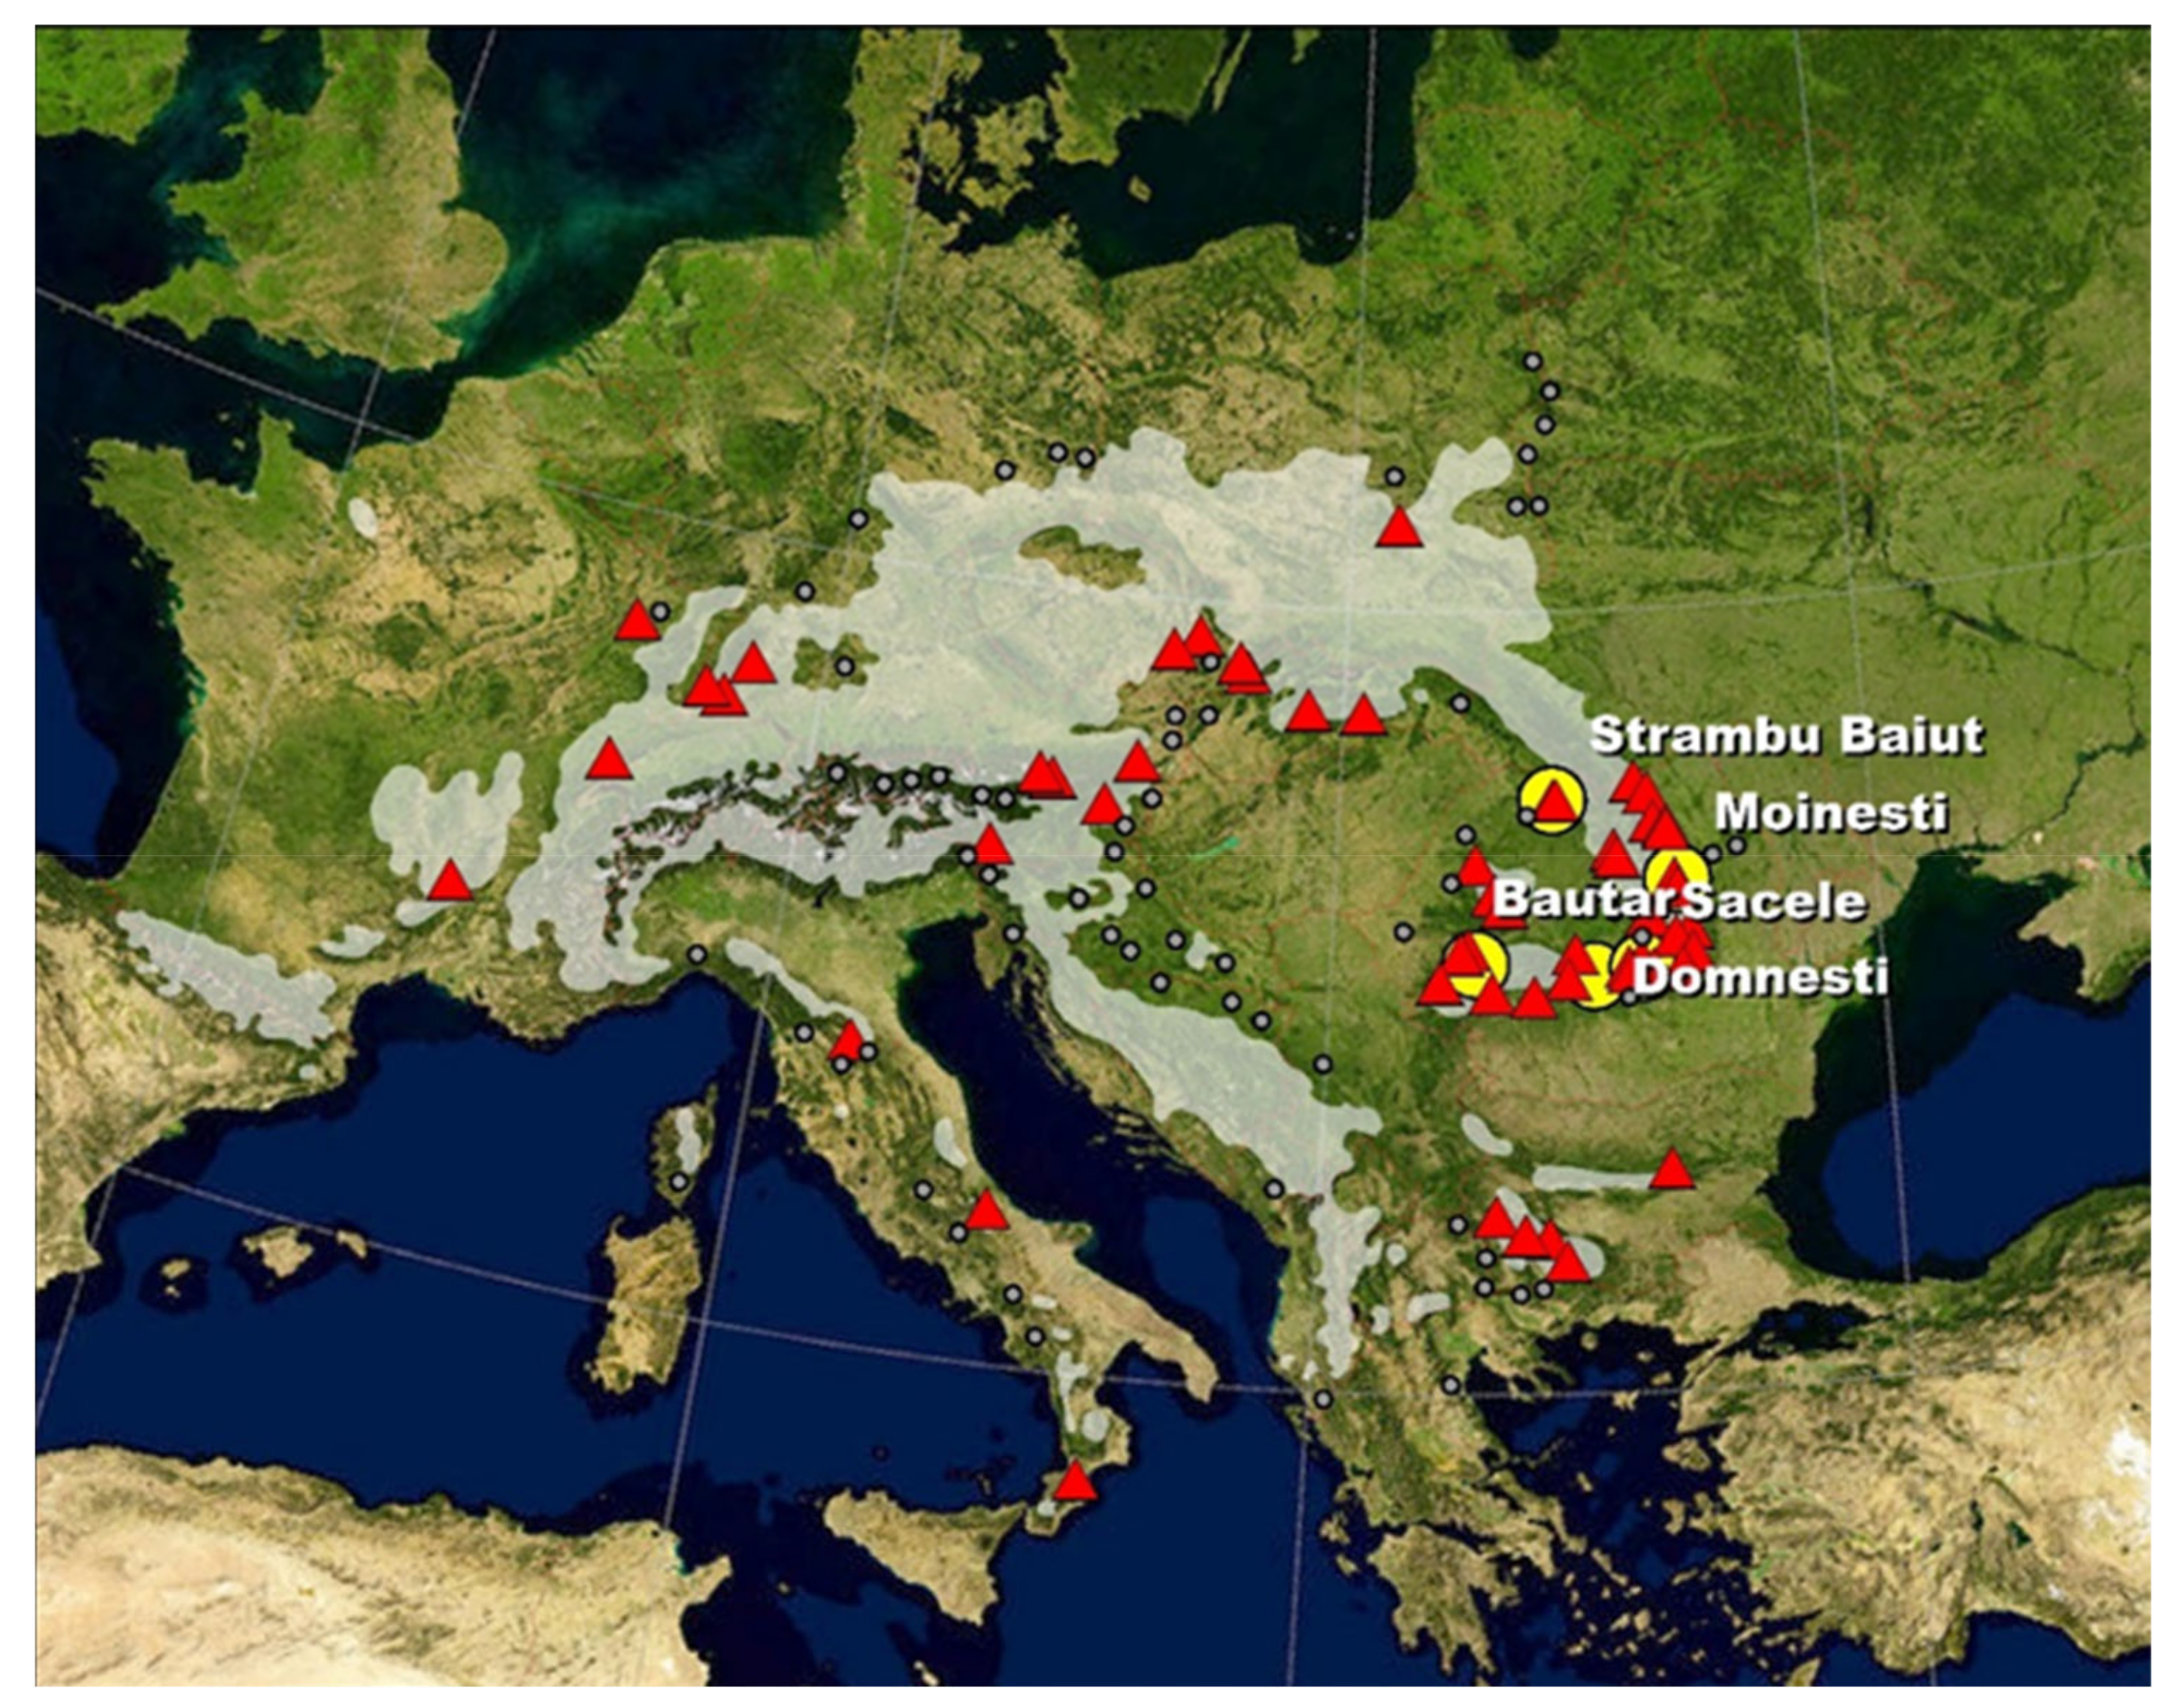
The study was conducted in a series of five provenances trials established in 1980 in Romania. The provenance trials were established in five geographic regions with different climatic conditions (Figure 1 and Table 1). Two trials are located outside of the natural range of silver fir in Romanian Carpathians, in the European beech zone, while three are within the natural range.
In these trials are tested 60 populations originating from the entire species distribution range in Europe (Figure 1). They were grouped as core, western, eastern, northern, southeastern, and southern according to their location within the natural distribution range (Table A1 in Appendix A). Forty-three provenances are common in all trials, and 17 provenances are tested additionally at the Sacele trial only. The silver fir tested provenances range from 38°33′ to 51°07′ N and from 4°00′ to 26°40′ E, and include both lower as well as higher mountain regions (altitudes between 130–1600 m above sea level). In four sites, the field layout was the randomized square lattice, type 7 × 7, with three repetitions and 25 trees per plot planted at 1.0 × 2.0 m, while at the Sacele trial, the field layout was the randomized square lattice, type 8 × 8, also with tree repetitions. The five field trials were established with six-year-old bare root seedlings, which have been produced in the Sinaia nursery situated in the mountain beech zone, at 45°29′ N latitude, 25°59′ E longitude, and at 695 m a.s.l.
2.2. Phenotypic and Climatic Data
In each provenance trial, four dominant or (co)dominant trees per provenance and repetition (12 trees in total for each provenance) have been cored at 1.3 m breast height using 5 mm increment borers (Haglof, Sweden), from slope-parallel stem radii, to avoid tension and compression wood. In order to avoid tree damage, only one core per tree was taken. Cores were dried and progressively sanded [59]. Then, the core samples were scanned at 1200 dpi, using an Epson Expression 10,000 XL, and the ring width (RW), earlywood width (EW), and latewood width (LW) were measured using the Ligno Vision software package to the nearest 0.001 mm. Additionally, latewood proportion (LWP) was calculated as an indicator of wood quality.
For each trial, the tree-ring series has been cross-dated using COFECHA [60] to avoid dating errors due to missing or false rings, which could be present in an increment radial core. Only the tree-ring series that presented intercorrelation values > 0.328 (p < 0.01) were included in final tree-ring data. All tree-ring time series were standardized to a mean value of one to obtain a width index (RWI) [61,62]. The negative exponential regression in the R package dplR [63,64] was applied for each raw measurement series, because it is deterministic, meaning that it follows a model of tree growth. The final tree ring data set comprised 2699 tree-ring series, 669 from the Sacele trial and 500 from each of the other four trials. The analyzed period was 1997–2018, being the common interval for all tree-ring series.
Additionally, wood density (WD) in g/cm3 was determined for each core sample and whole analyzed period using the [65] formula:
where: ρc = conventional density (g/cm3), Mmax = weight of saturated sample (g), Mo = weight of dried sample (g), ρml = wood density (1.53 g/cm3).
ρc = 1/[(Mmax/Mo) − 1 + 1/ρml]
The climatic data have been calculated using a daily gridded climatic dataset covering the Romanian territory (ROCADA). The dataset used herein consists of a higher spatial resolution (1 × 1 km) for improved reproduction of the climatic spatial variability and has been made using state-of-the-art interpolation techniques [66]. The following climatic variables have been calculated for each trial site over the period 1997–2018: mean annual temperature (MAT); mean temperature during the growing season (April to September) (MTVEG); mean temperature for January (MTJAN) and July (MTJUL) (the coldest and the warmest months, respectively); mean temperature from October to December of the previous year (MTOCT-DEC); mean temperature from October of the previous year to March of the current year (MTOCT-MAR); mean temperature from January to March of the current year (MTJAN-MAR); mean annual precipitation amount (MAP); mean precipitation during the growing season (MPVEG); mean precipitation of the coldest (MPJAN) and the warmest (MPJUL) months; mean precipitation from October to December of the previous year (MPOCT-DEC); mean precipitation from January to March of the current year (MPJAN-MAR); mean precipitation from October of the previous year to March of the current year (MPOCT-MAR); annual precipitation amount (SAP); precipitation amount in the growing season (SPVEG); precipitation amount in the autumn-winter of the previous year (SPOCT-DEC); precipitation amount from January to March of the current year (SPJAN-MAR); precipitation amount from October of the previous year to March of the current year (SPOCT-MAR) (Table 2).
2.3. Determination of Drought Events and Drought Response Parameters
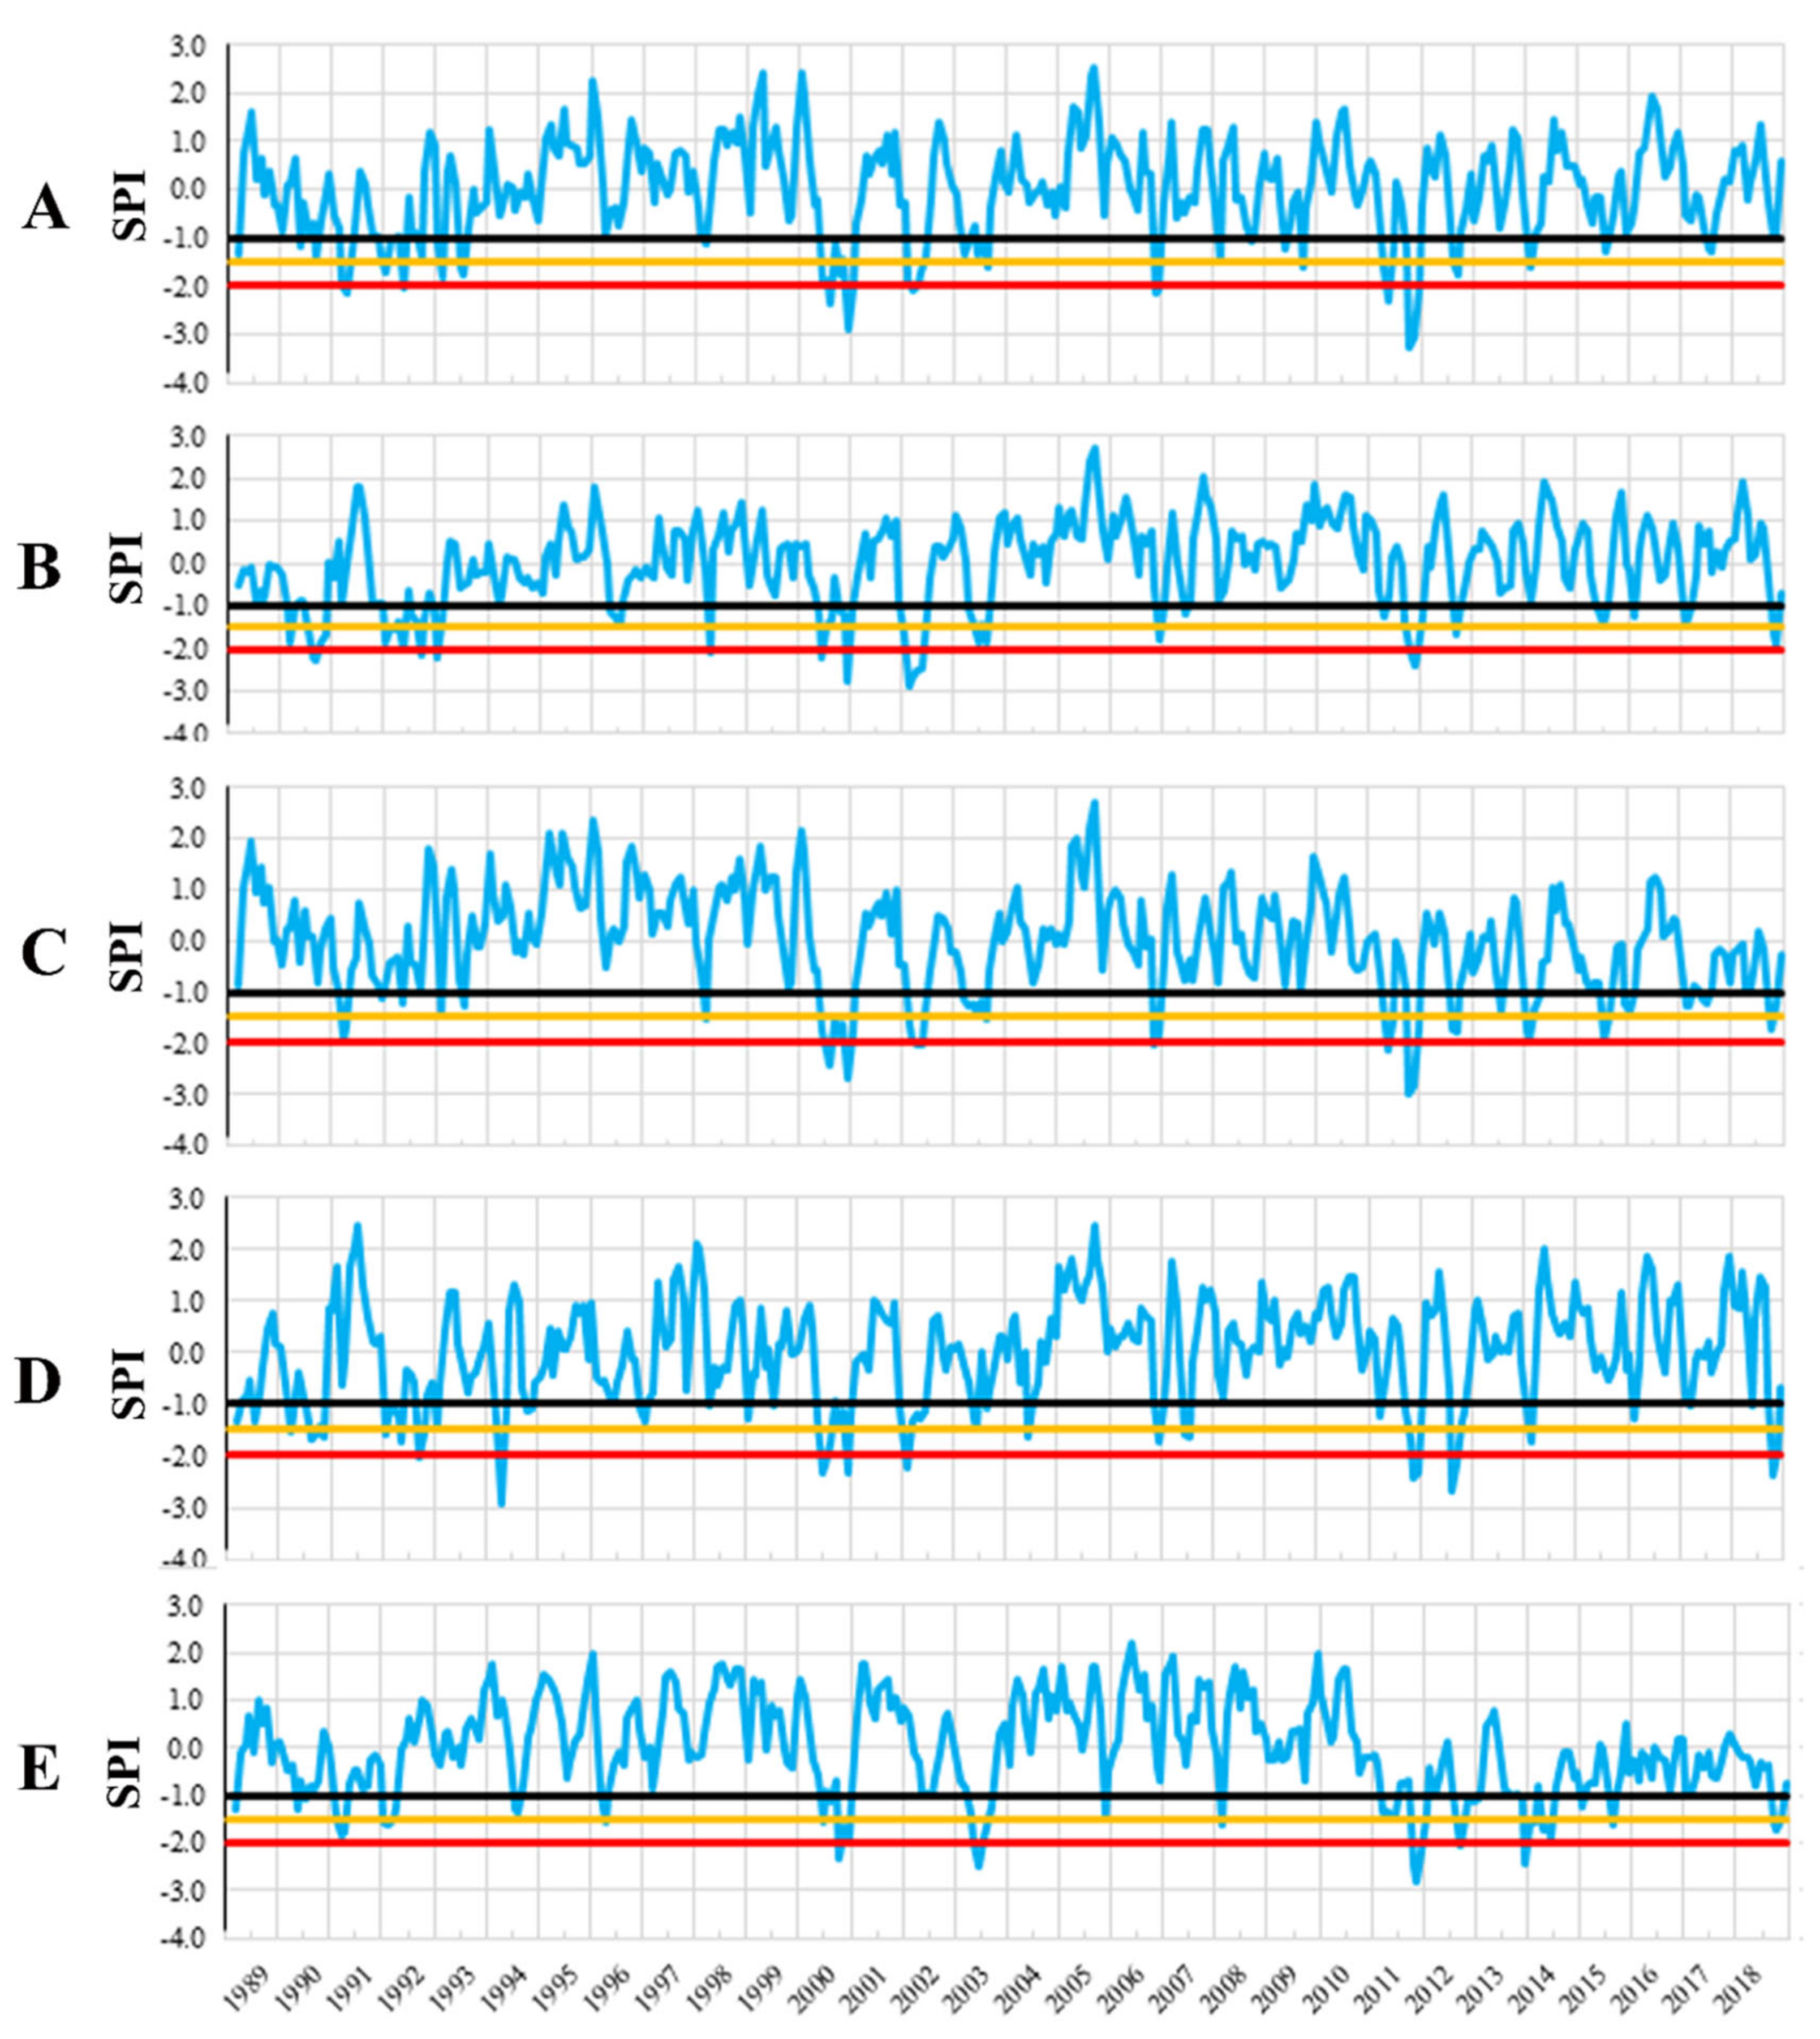
As an indicator for the meteorological droughts, we calculated the standardized precipitation indices (SPI) [67], which account for anomalous low rainfall, over the period 1989–2018. Given that an extreme drought event obviously lasts two to three months, to identify drought years within the analyzed period, we calculated SPI for three consecutive drought months in each trial site. That allowed us to detect both seasonal and annual variation of drought events during the analyzed period. The drought years have been classified as follows: SPI ≤ −2—extreme drought year, SPI between −1.99 to −1.50—severe drought year, SPI between −1.49 to −1.0—moderate drought year, SPI between −1.0 to +1.0—normal precipitation year [57].
The response of provenances to drought events was evaluated by four drought parameters [68]: resistance (Res), recovery (Rec), resilience (Rsl), and relative resilience (rRsl). Resistance was calculated as the ratio between ring width during (Dr) and before the drought event (preDr): Res = Dr/preDr and indicates how much the radial growth decreased during drought (Res ≥ 1 means high tolerance, Res < 1 means low tolerance). Recovery was calculated as the ratio between the ring width after drought event (postDr) and during drought (Rc = postDr/Dr) and indicates the revitalization capacity after a drought period. Resilience (Rsl) represents the ratio of the ring width after drought (postDr) and pre-drought (preDr): Rsl = postDr/preDr and describes the capacity of a provenance to reach pre-drought increment after a drought event (Rsl ≥ 1 means full restoration, Rs < 1 means long-term growth reductions). Relative resilience (rRsl) was calculated by rRsl = (postDr − Dr)/preDr. Pre-drought and post-drought ring widths were calculated as average values for three-year period before or after the drought year.
2.4. Data Analysis
Analyses of variance were performed at two levels, each trial site and among sites, using the GLM procedure (SPSS v20). The total amount of variation was divided into the following sources of variation: provenance, site, year, and the interaction between them. All effects were considered random, except for the trial location, which was considered fixed.
The following mixed model was applied:
where: Zijkln = the trait (wood characters, drought parameters), μ = the overall mean, Pi, Sl, Bj,Yk, PSil, PYik, SYlk, and eijkln are the effect due to the ith provenance, lth site, jth repetition (block), kth year, interaction due to ith provenance and lth site, interaction due to ith provenance and kth year, interaction due to lth site and kth year, and random error associated with the ijklnth trees.
Zijkln = μ + Pi + Sl + Bj +Yk + PSil + PYik + SYlk + eijkln
In order to investigate to what extent the local adaptation to climate conditions of origin location influence traits variation, Pearson correlations based on provenance means were computed between the wood characters, the drought parameters, and the geographical coordinates of the provenances’ origin for each trial site.
Relationships between the wood characters and the climatic variable of trial sites were investigated by regression analysis. The growth response functions were developed to assess the impact of climate at trial sites on provenances radial growth. The quadratic models based on both temperature and precipitation were used to develop growth response functions, considering them more suitable [34,40,41,44]. We used seven temperature variables and 12 precipitation variables, and the best models were chosen based on the R2 coefficient (SPSS program, stepwise selection method).
3. Results
3.1. Identification of Drought Years
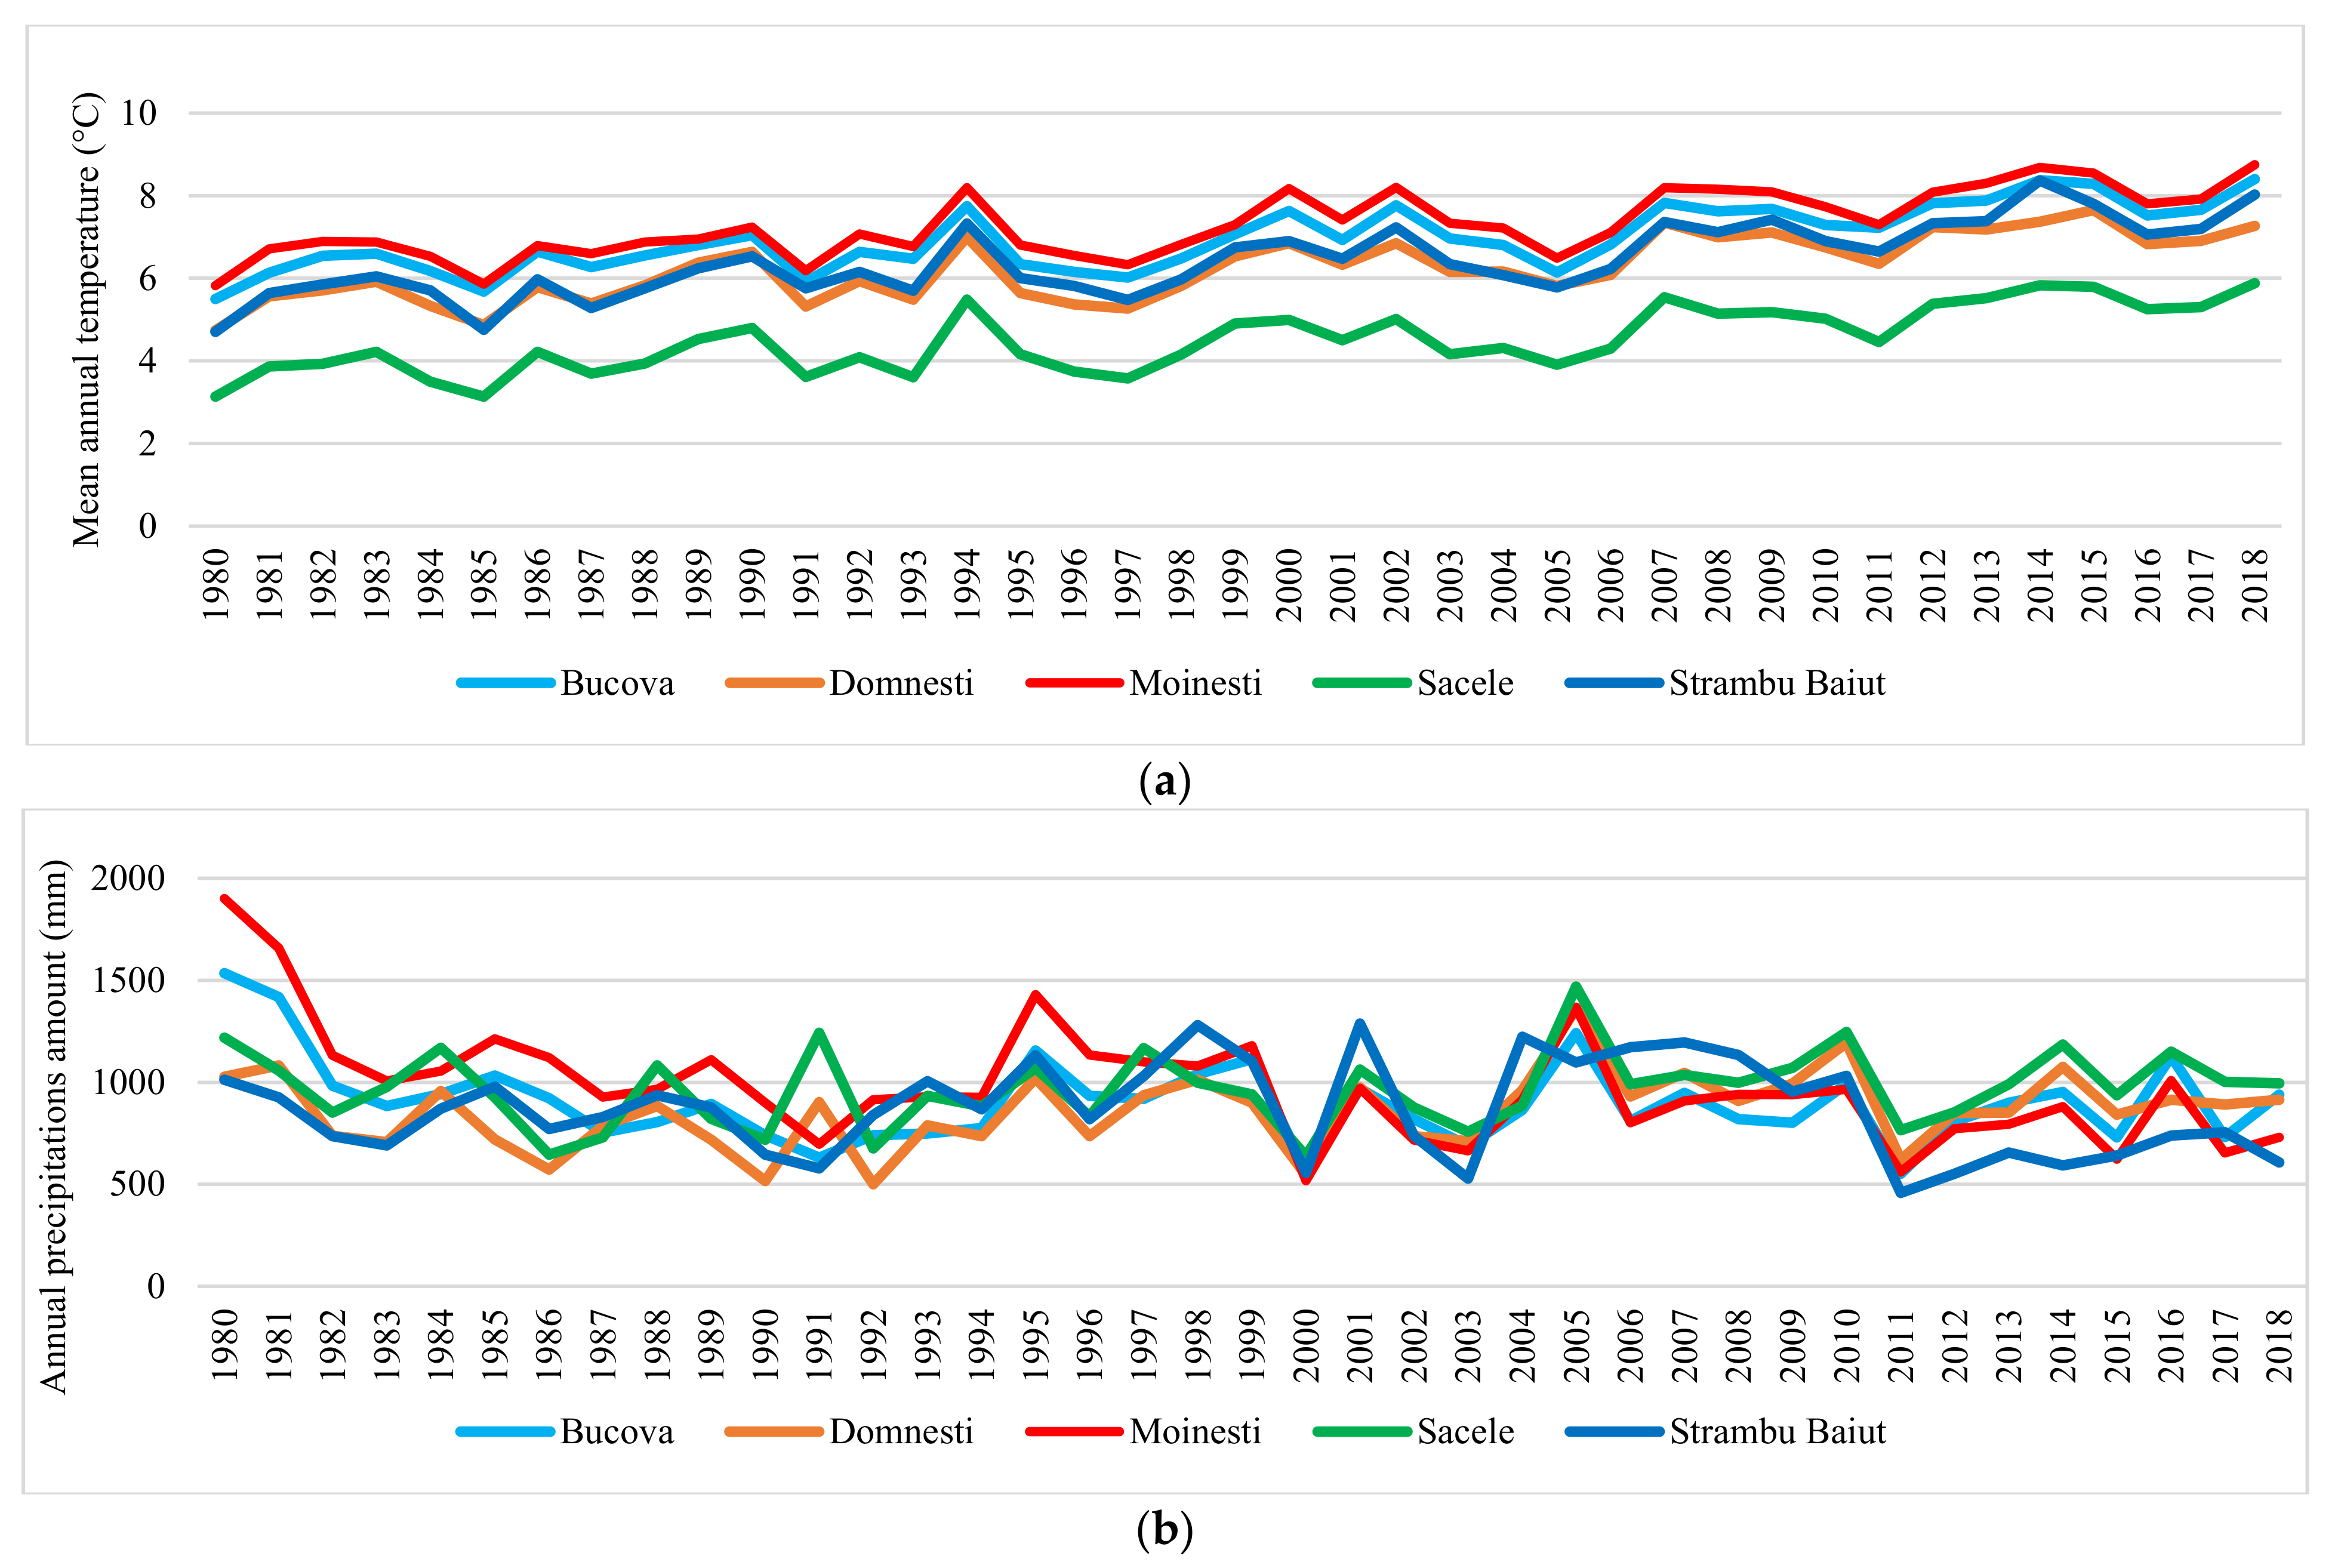
Large variation in mean annual temperature and annual precipitation amount were recorded in each trial site (Figure 2). Based on SPI values we have identified the moderate, severe, and extreme drought years in each trial site in the period 1989–2018 (Figure 3). Ten years with extreme and severe drought during the analyzed period have been identified, in all trial sites. Most of the extreme and severe drought events occurred after the year 2000. Additionally, during this period, the most consecutive drought years were recorded, such as 2002–2003, 2011–2012, and 2013–2015.
The number of extreme drought years during the analyzed period (1997–2018) have varied among sites and ranged between three at Moinesti and Domnesti trials to five at the Strambu Baiut trial. However, 2000, 2002, and 2011 were the common extreme drought years in all testing sites.
The most significant drought event occurred in 2000 when the highest number of months with severe and extreme drought (nine at Moinesti, seven at Bucova, five at Sacele, four at Stambu Baiut, and three at Domnesti) has been recorded (Table 3). Among all extreme droughts, the 2000 drought had the longest duration in almost all sites. Furthermore, the drought overlapped with the growing season, in four of the five trial sites. The 2011 drought was characterized by the highest intensity and generally by two peaks, while the 2002 drought by lower duration and intensity (five to two months with extreme and severe drought).
3.2. The Effect of Provenance, Site, and Year on Radial Growth and Wood Characteristics
The analysis of variance for each trial site and analyzed period was presented in Table 4. Results have highlighted that both provenance and year effects were significant for studied traits in all trial sites. Provenance x year interaction was also significant in three testing sites. Multifactorial analysis of variance across sites highlighted significant provenance, year, and also site effects. Provenance x site and site x year interactions were very significant also (Table 5).
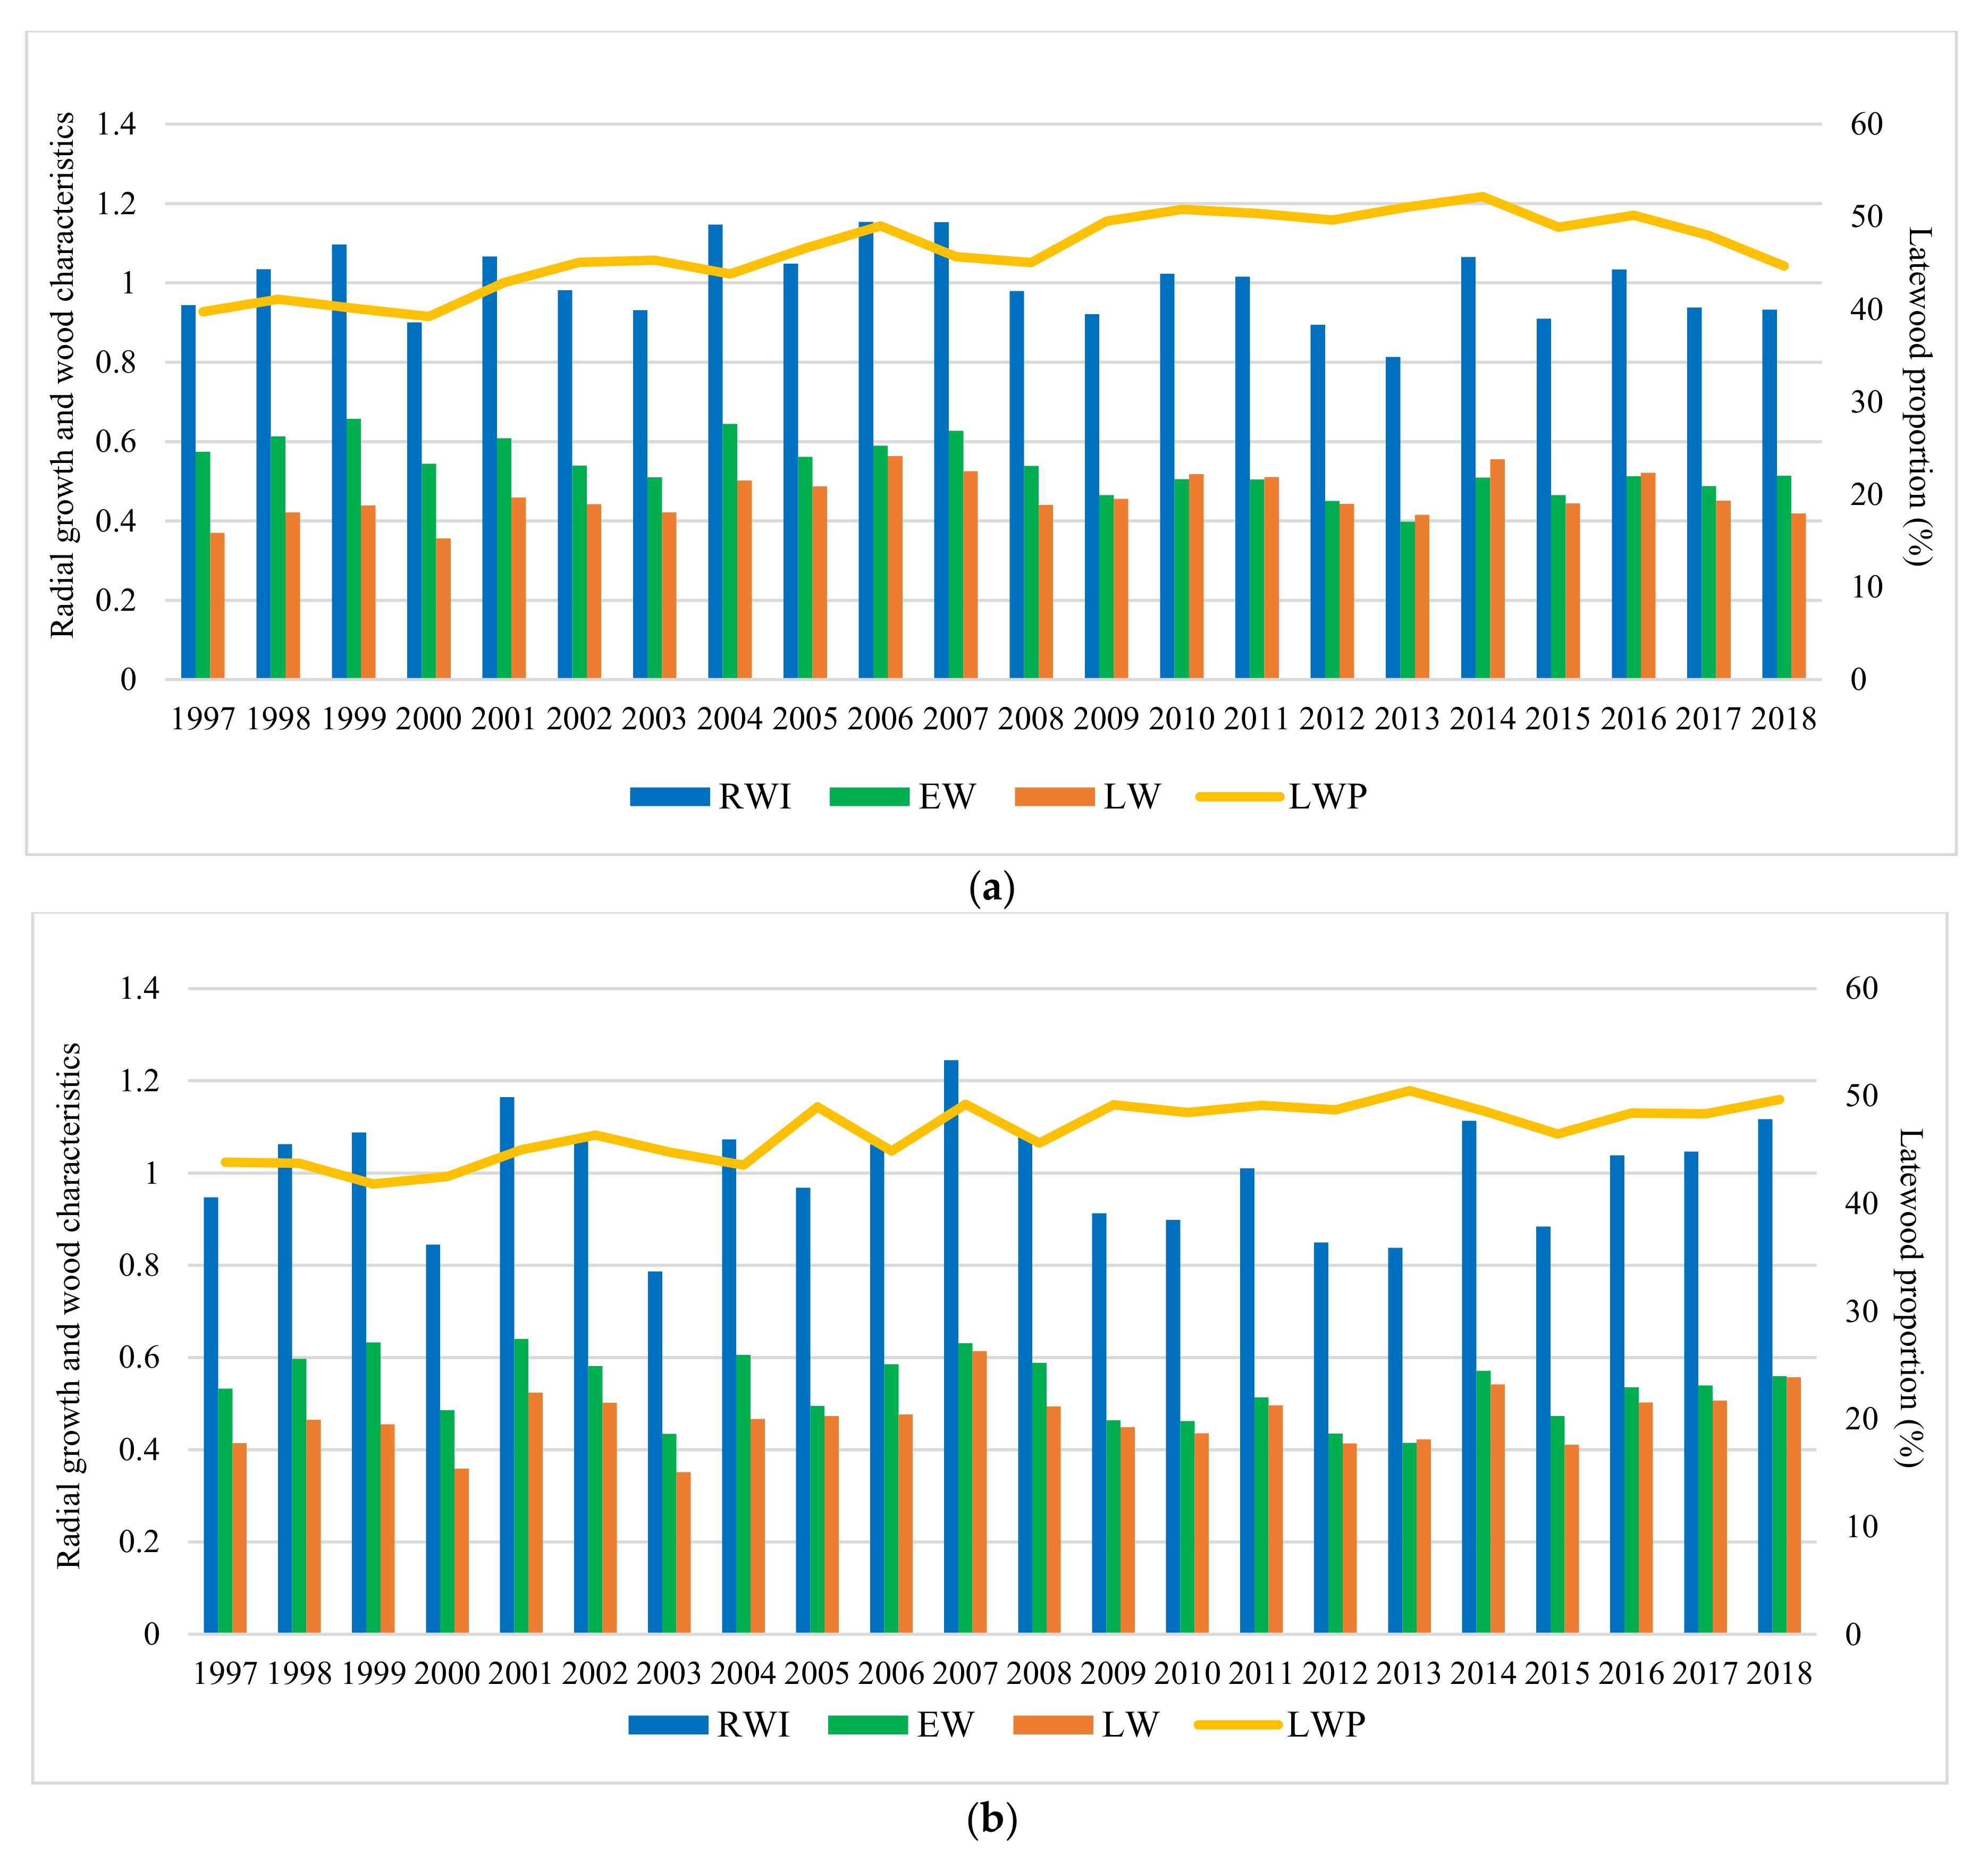
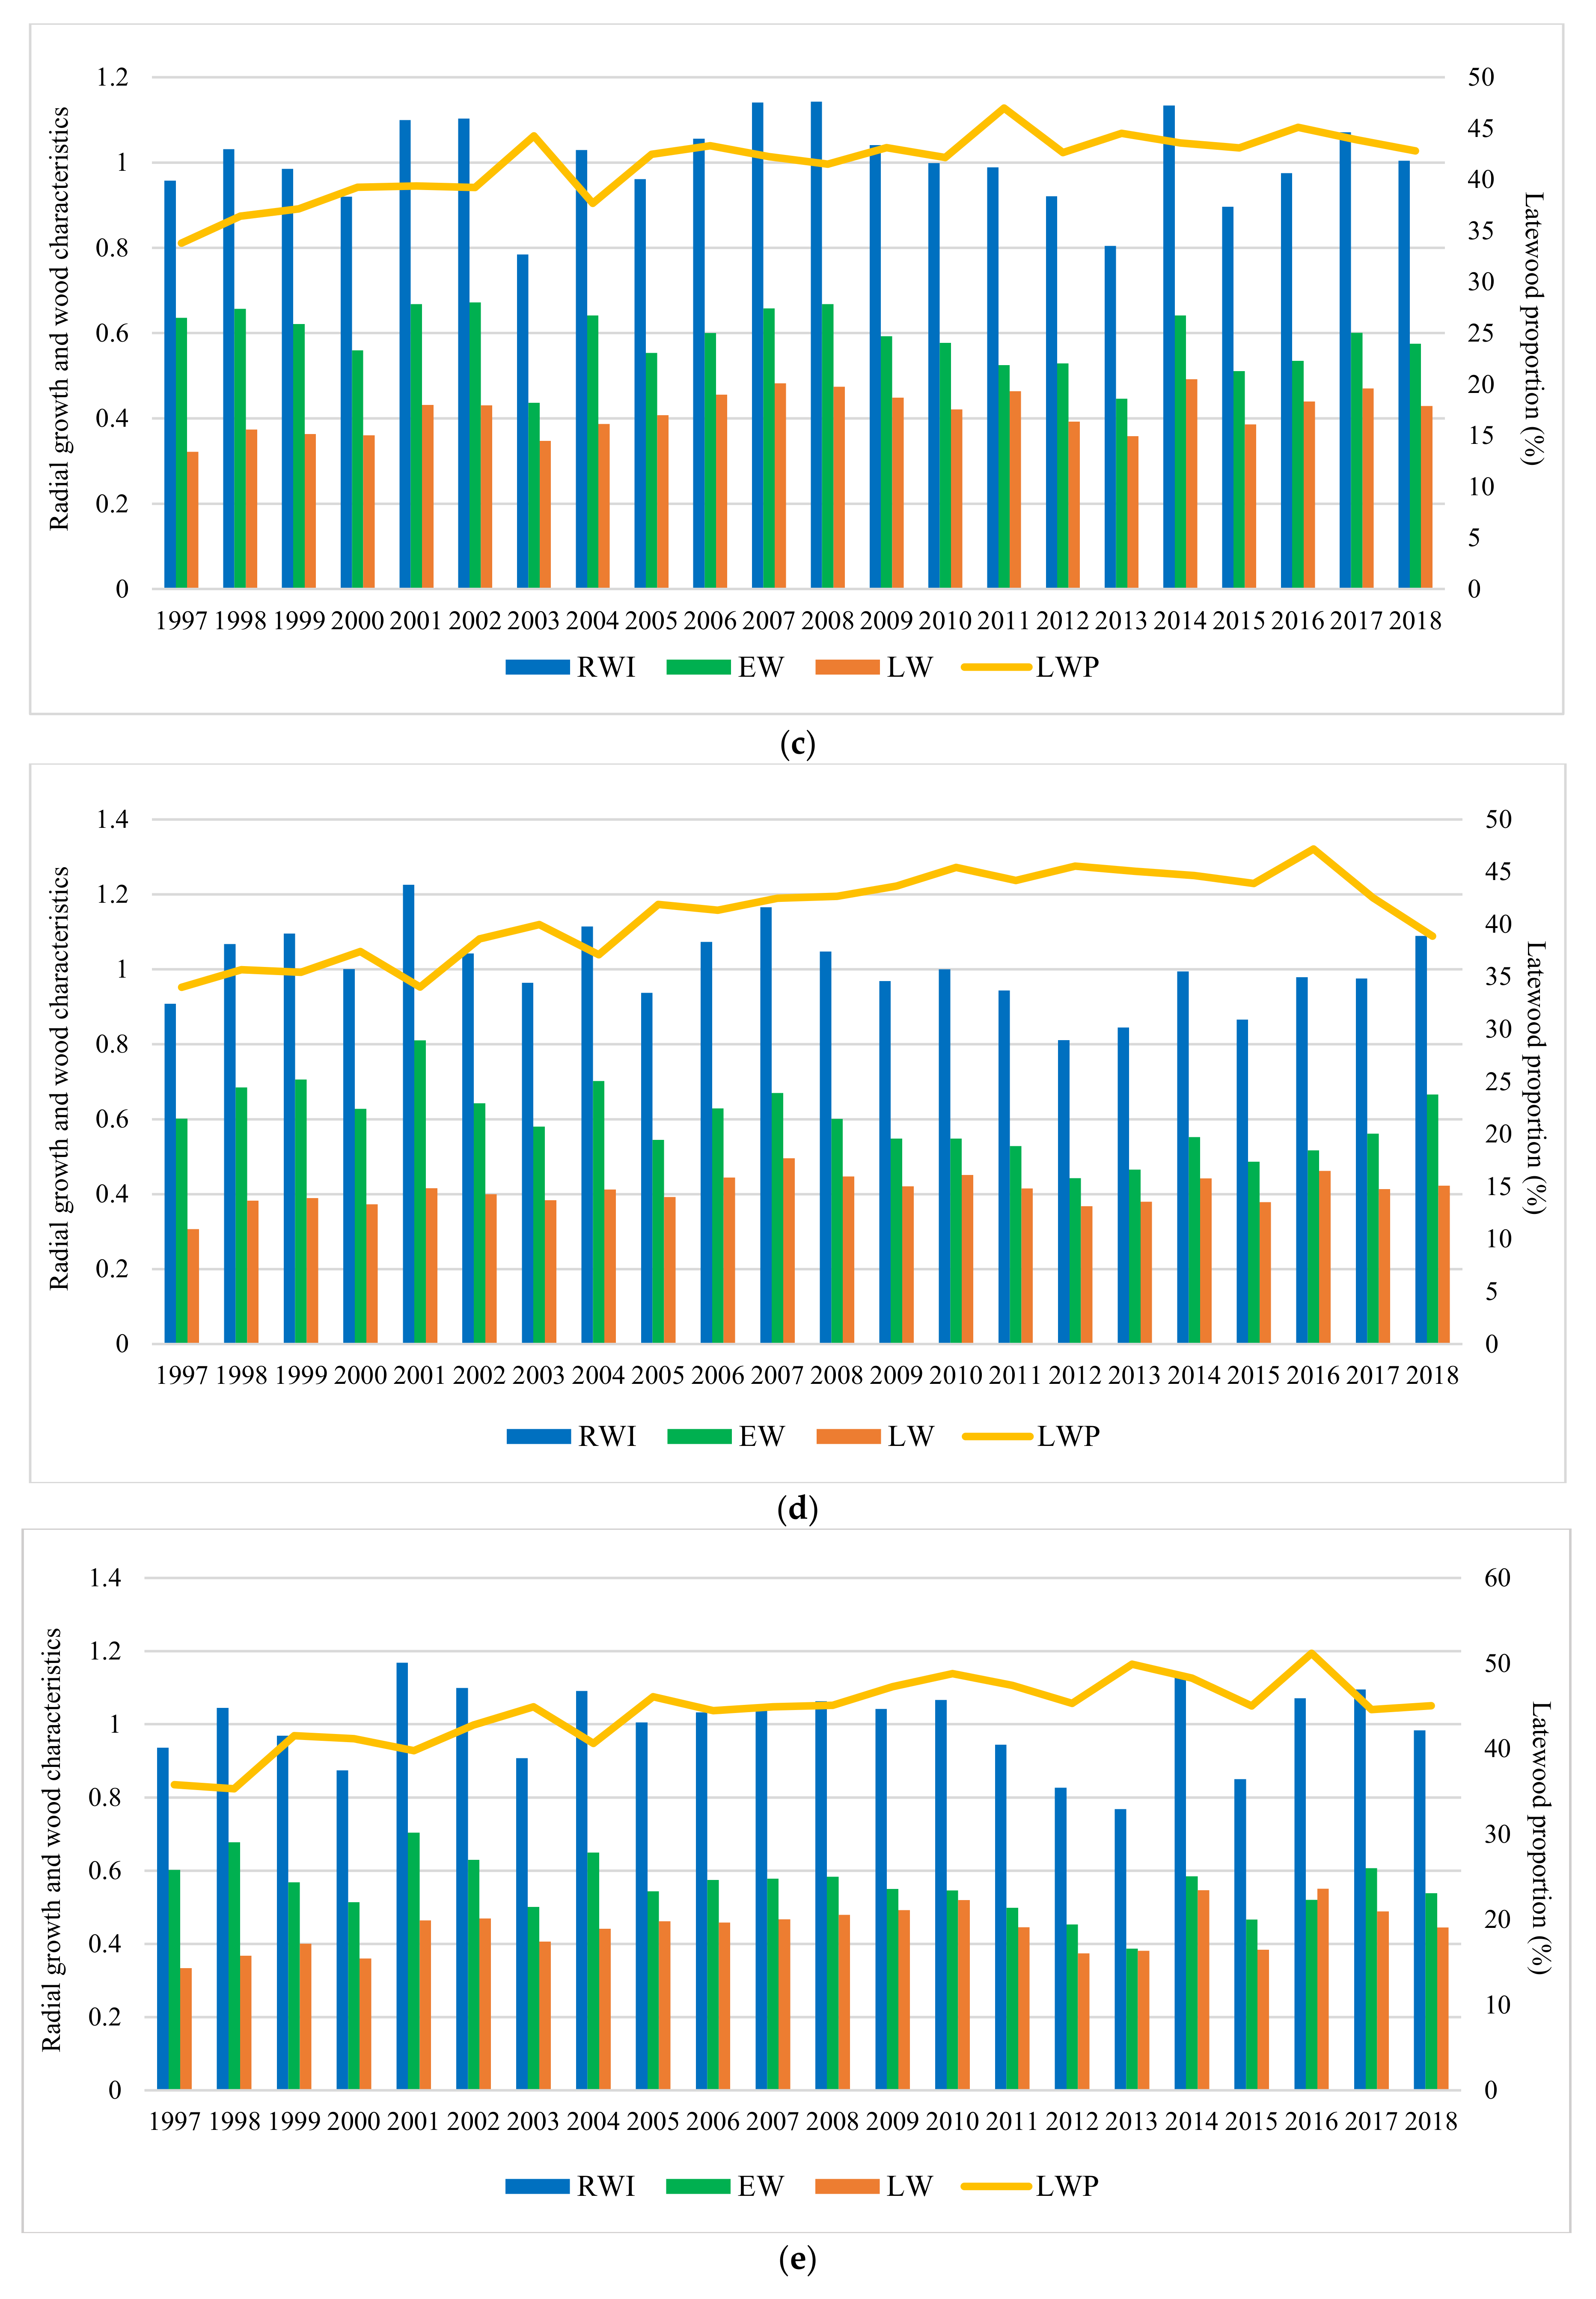
Results indicate that, during the analyzed period, the studied characters have varied significantly among sites (Figure 4). The highest values of average on experiment for RW were obtained at Strambu Baiut trial (3.8 mm) followed by Sacele (3.7 mm) and Domnesti (3.7 mm) trials. The lowest values were recorded at Moinesti trial (3.4 mm). Regarding the LWP and WD, the highest value of average on experiment was obtained at Domnesti trial (47% LWP and 0.36 g/cm3 WD). The lowest values for LWP (41%) and WD (0.34 g/cm3) have been recorded at Sacele and Bucova, respectively.
In all trials, it can be seen a strong relationship between the RW variation and severe and extreme drought years. The tree-ring pattern of provenances showed a strong increment drop in those years (Figure 4). The descriptive statistics of silver dendrochronology in each trial were presented in Table A2.
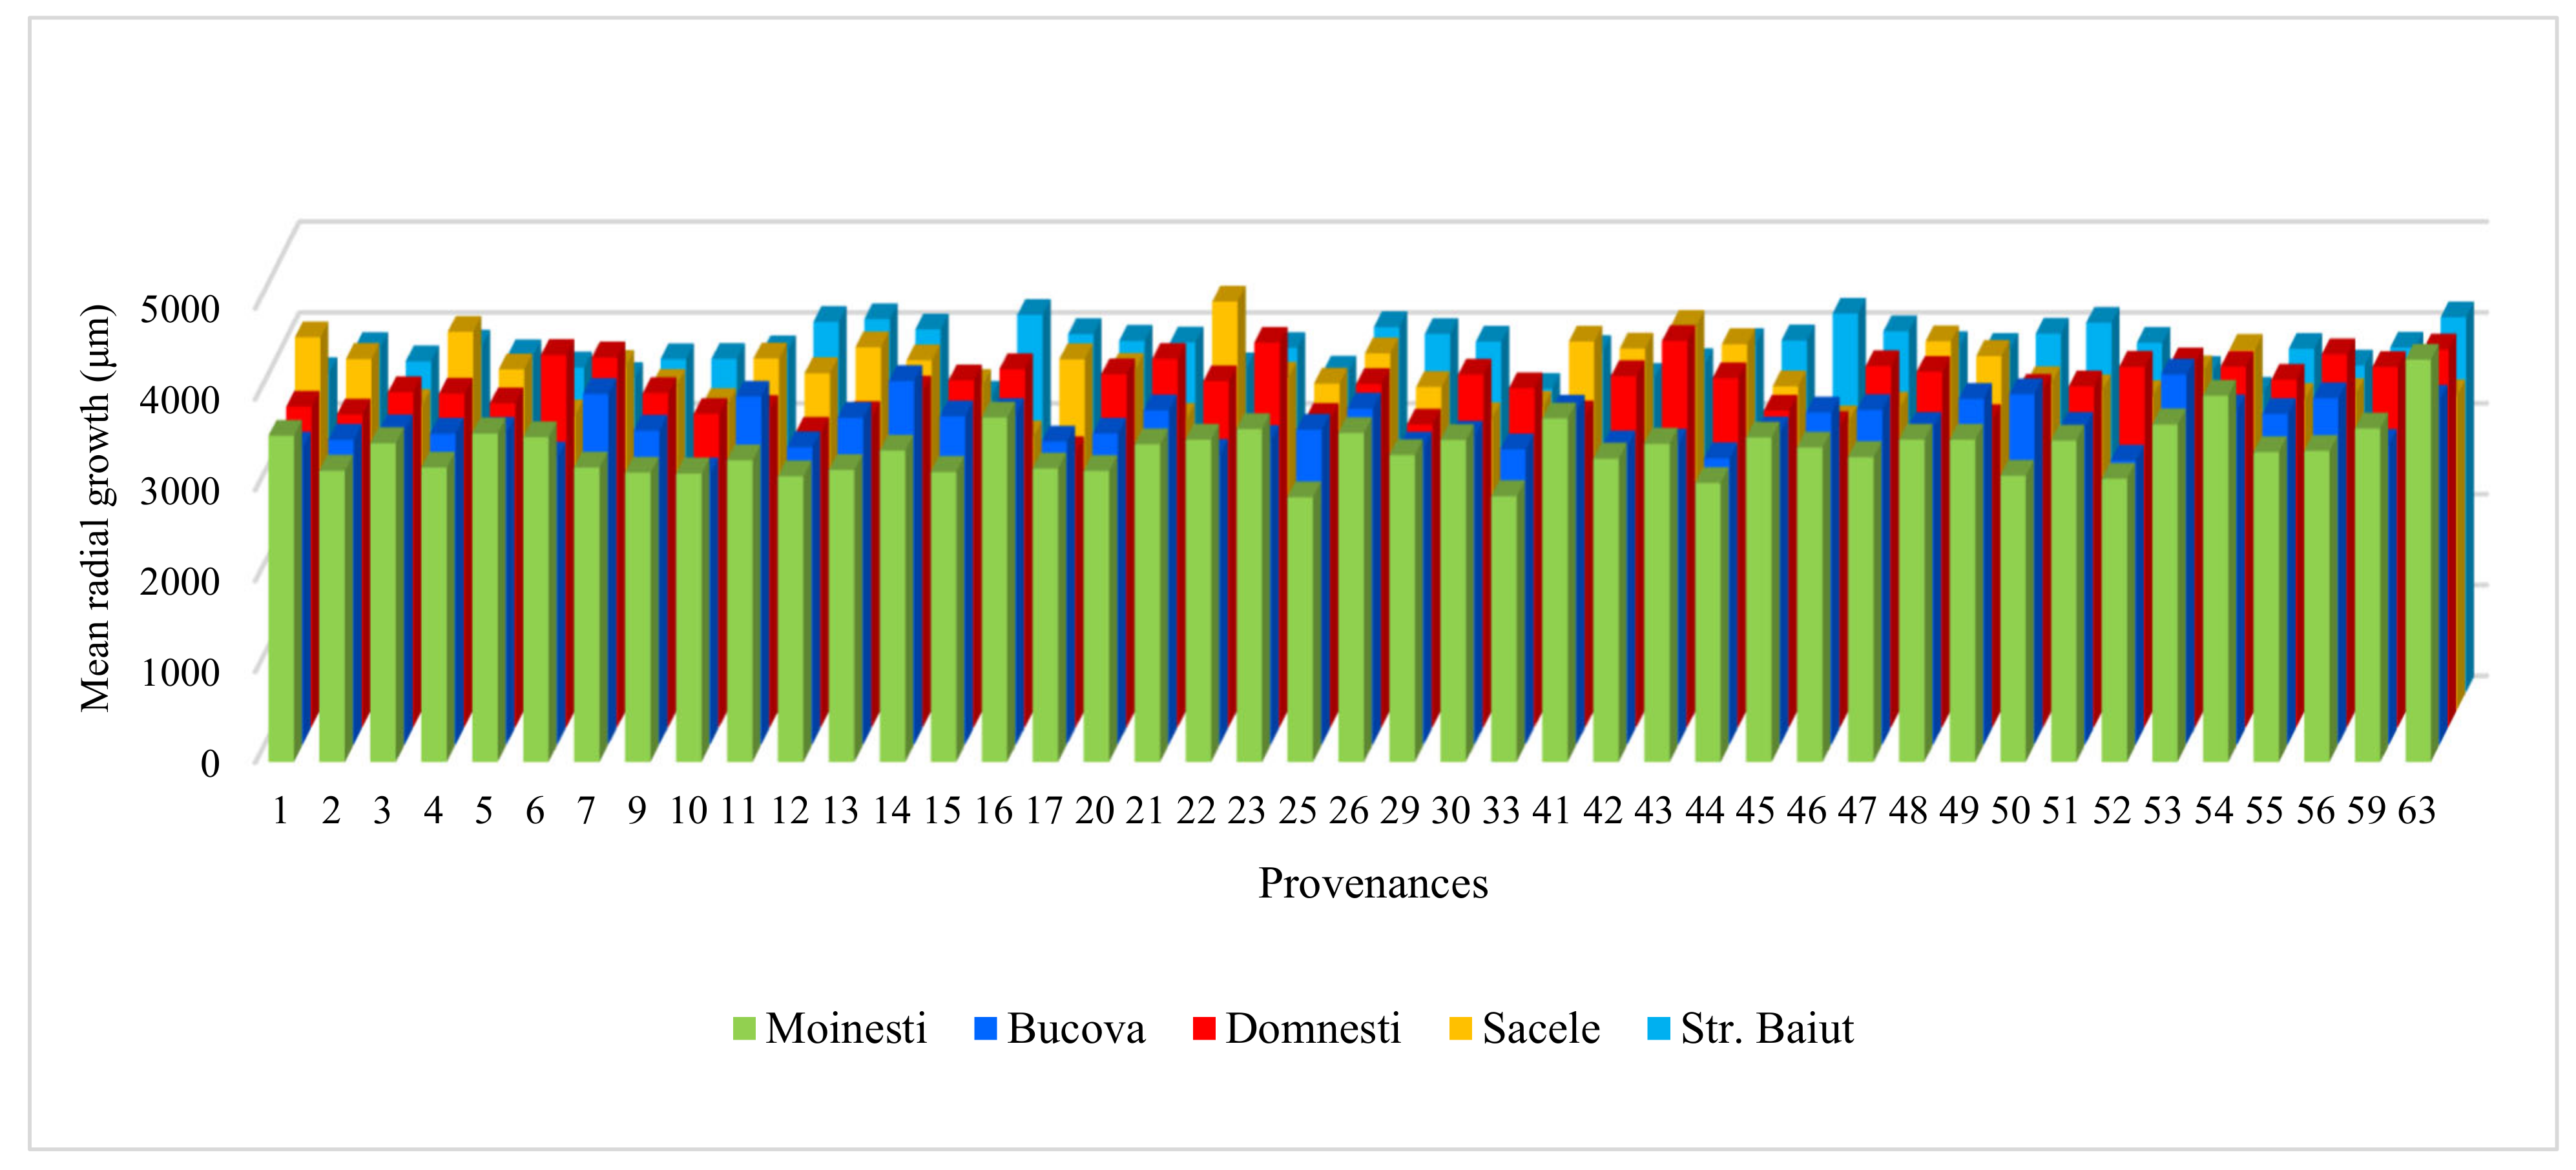
The average radial growth has varied between 4.83 mm (provenance 24-Devin at Sacele trial) to 2.91 mm (provenance 25-Kitilovo at Moinesti trial), latewood percentage between 53% (provenance 45-Le Joux at Bucova trial) to 33% (provenance 37-Liezen at Sacele trial), whereas wood density has varied from 0.45 g/cm3 (provenance 45-Le Joux at Strambu Baiut trial) to 0.31 g/cm3 (provenance 59-Banska Bystrica at Strambu Baiut trial) (Figure A1). However, despite this high variability among sites, there were some provenances that have obtained RW values over the average of the experiment in all trial sites: 63-Zarovice, 54-Strambu Baiut, 16-Toplita, 55-Valea Iadului, 21-Azuga, 26-St. Dimitrov, 51-Gura Putnei, 48-Pangarati, 47-Moinesti, and 14-Asau. The ranking by LWP has shown that the highest spatial stability had the provenances 43-Greseuss, 26-St. Dimitrov, 29-Vallombrosa, 45-Le Joux, 41-Enzklosterle, 42-Sulzburg, and 44-Lepilat.
3.3. Genetic Variation in Drought Response
The analysis of variance for all extreme drought years, taken together, revealed significant variation in drought response among silver fir provenances in all trial sites, except the Bucova trial (Table 6). Additionally, significant differences were obtained for the year’s effect and provenance x year interaction. The highest variation among provenances was obtained for the resilience to drought, in four of the five trials. Significant differences for resistance capacity were obtained at Sacele and Stambu Baiut, while for recovery only at Domnesti.
Considering only the common extreme drought years in all testing sites 2000, 2002 (2003 at Strambu Baiut), and 2011, significant differences were found among drought parameters of silver fir provenances (Table 7). The provenance-specific drought response depended on the trial site and drought year. Thus, significant differences for all parameters and all extreme drought years were obtained at Domnesti and Moinesti trials. The highest differences in drought response were found in the year 2000, in all trial sites. Additionally, the 2011 drought caused a significant genetic variation in the drought response of silver fir provenances.
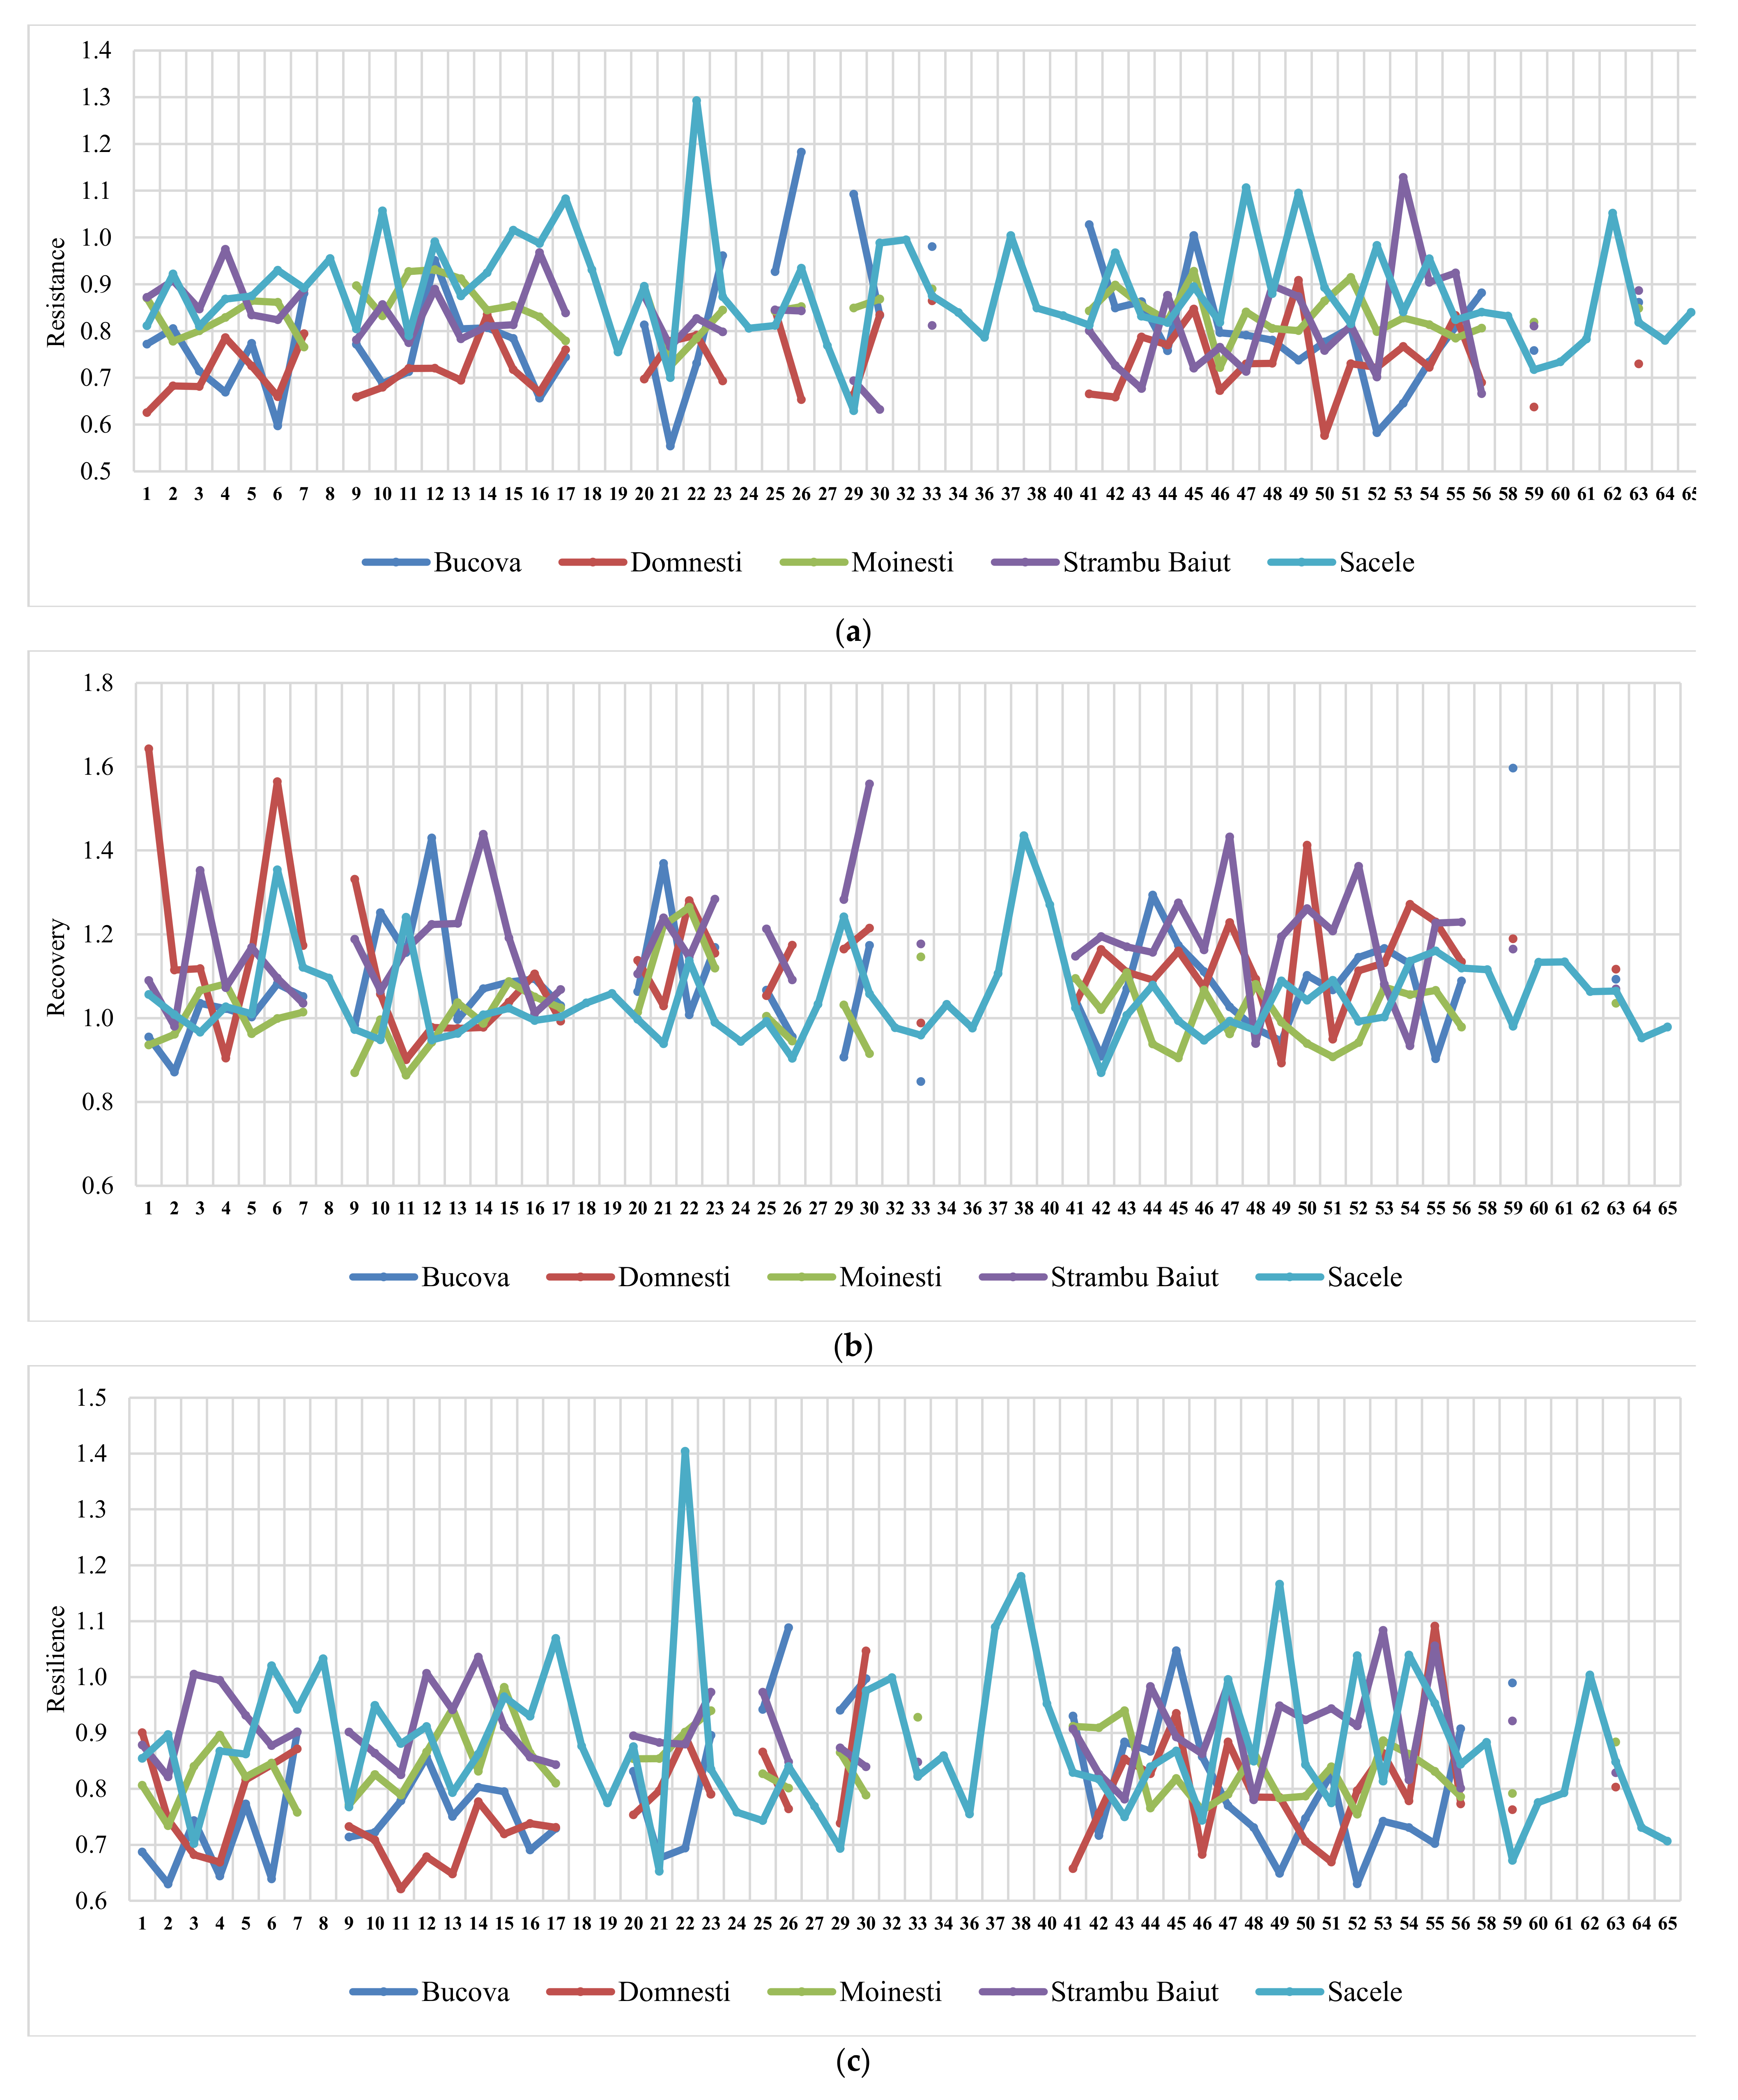
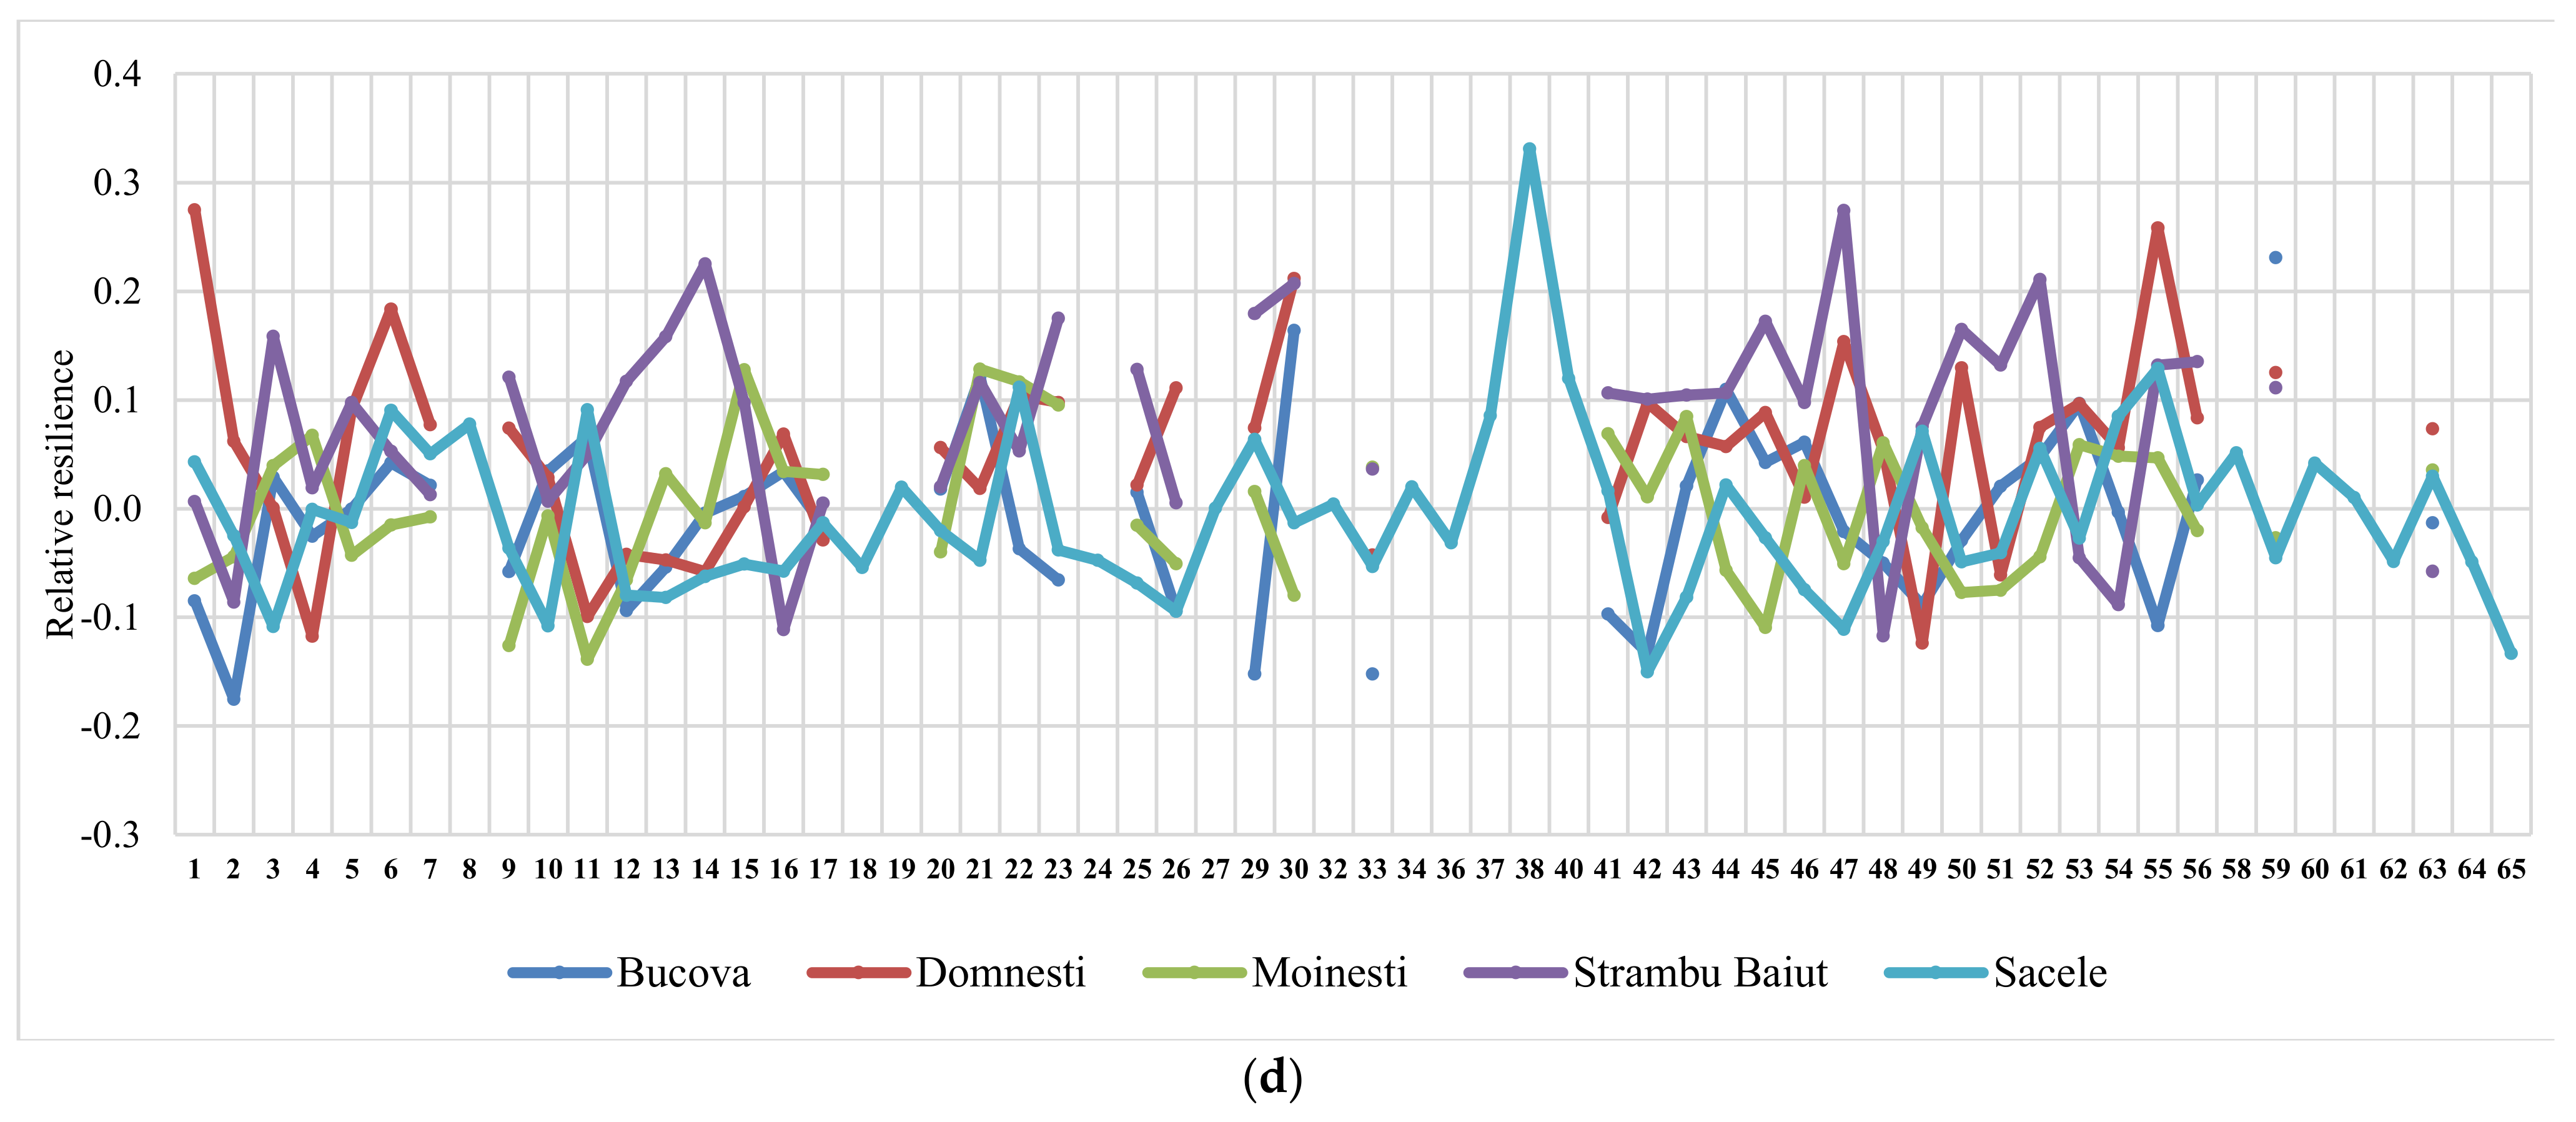
The ranking of silver fir provenances by drought parameters in the year 2000, as the most significant drought year, and in all sites, revealed a certain variation pattern (Figure 5). Thus, the provenances ranking by resistance, recovery, and resilience, taken together, have highlighted a best performing group placed at the top ranks in almost all sites. This group include the following silver fir provenances: 23-Rakitovo, 30-Paularo, 7-Vadul Dobri, 53-Botiza, 55-Valea Iadului, and 63-Zarovice. In terms of resistance and resilience, the most valuable provenances were 12-Naruja I, 25-Kitilovo, 33-Abeti Soprani, 43-Greseuss, and 45- Le Joux. Regarding the resistance and recovery, the most valuable provenances were 51-Gura Putnei, 54-Strambu Baiut, and 56-Ilisoara Mures, while regarding the recovery and resilience the provenance 6-Bucium obtained good results. Additionally, there are provenances that obtained a good response and high spatial stability for only one drought parameter. For instance, 26- St. Dimitrov revealed high resistance capacity; 21-Azuga, 50-Malini, 52-Solca, and 59-Banska Bystrica revealed high recovery; while 22-Vallombrosa, 41-Enzklosterle, 44-Lepilat, 47-Moinesti, and 4-Avrig showed high resilience (Figure 5).
Making the ranking of drought parameters for all extreme drought years, the highest values of resistance were observed at Moinesti and Bucova trials (the drought-prone environments), while for recovery and resilience at the Strambu Baiut trial.
3.4. Phenotypic Correlations
The correlations between wood characters and WD were negative in all trial sites, although statistically significant correlations were obtained in few trials only (Table A3).
Additionally, the correlations between wood characters and geographic coordinates of the provenances were few and indicate low pattern of local adaptation. The most significant correlations were found with LONG and, generally, they have been negative in almost all trials, except for RW and EW at Bucova trial, and for LW and LWP at Sacele trial, where they were positive. Statistically, correlations with LAT and ALT of seed origin were few and only at Moinesti trials and Strambu Baiut, respectively.
The correlations between drought parameters and wood characters were positive, and the most were obtained between RW and resilience (Table 8). Correlations between drought parameters and wood density were non-significant.
3.5. Growth Response Functions
The influence of climate on the RW and LWP in each trial site has been investigated using quadratic regressions, and the best models obtained were presented in Table 9 and Table 10. The main climatic drivers explaining the radial growth of silver fir were MTVEG, MPOCT-MAR, and MPJAN-MAR. The growth–climate relationship was moderate, R2 ranging between 0.37 and 0.50, indicating that a substantial amount of the radial growth variation can be explained by these climatic factors. Partial R2 indicates that silver fir is less sensitive to precipitation than to temperature. The influence of temperature during the growing season accounted for 29% and 48% of the total variation of RW. For latewood percentage, the response models founded were modest (R2 varied between 0.09 and 0.15). MAT, MTVEG, MAP, and MTVEG are the main climatic factors that influence LWP of silver fir (Table 10). The temperature variables accounted for the greater part of LWP variation.
4. Discussion
In this study, we have analyzed the radial growth, wood characteristics, and drought response of 60 silver fir provenances tested in five long-term trials established in different geographic regions and climatic conditions across Romania. Considerable differences in radial growth and wood characteristics among silver fir provenances were found. The influence of the local site conditions of each experiment and interaction of provenance with site and year were also significant in three testing sites, suggesting that the stability over time of silver fir radial growth and wood characteristics depends on site conditions.
The analysis of climate data during the period 1997–2018 showed large variations in terms of temperature and precipitation at site and time scale too. Results revealed a warming trend and a decreasing in the sum of annual precipitation during the analyzed period. The De Martonne aridity index, calculated for each trial site at the entire year level and entire period, had a value between 50 to 67 indicating that climatic conditions of the trial sites fall into the wet category. However, the values of De Martonne aridity index calculated for the growing season ranged between 22 to 27 that classifies the sites climate into silvostepic.
Extreme drought events have increased their frequency during the last two decades and among all extreme droughts, the most significant in duration and intensity have been the 2000, 2002, and 2011 droughts, in all trial sites. Abrupt growth changes were detected in tree ring chronologies related to these drought events. The losses in RW caused by drought have varied depending on the site, drought year, and provenance. The highest losses in RW have occurred in 2011, characterized by the highest drought intensity and two peaks in all sites, ranging between 18% at Moinesti to 27% at the Sacele trial. The year 2011 exerted the highest water stress on vegetation over the half-century in many regions of Europe [1].
Results revealed significant genetic variation in drought response among tested provenances. The drought reaction of silver fir provenances varied significantly depending on the extreme drought year and site conditions. The highest response by almost all drought parameters was found in the year 2000 when a consistent pattern in provenances drought response across the sites was observed. Thus, the provenances ranking by resistance, recovery, and resilience revealed several provenances placed in the top ranks in almost all sites. This group include provenances from Bulgaria, Italy, Romania, and Czech Republic. Additionally, some provenances had a good tolerance and high spatial stability for two or only one drought parameter. The remarkable performance combining superior growth with high tolerance to drought events had the provenances 63-Zarovice, 53-Botiza, 54-Strambu Baiut, 55-Valea Iadului from core distribution range, 47-Moinesti, 50-Malini, 51-Gura Putnei from eastern edge, and 7-Vadul Dobrii and 26-St. Dimitrov from southeastern edge. The highest values of resistance to drought were observed at Moinesti and Bucova trials, in the drought-prone environments.
It is notable that our results highlight higher genetic variation in drought response among silver fir provenances compared to previous studies. Thus, George et al. [57], studying drought sensitivity of ten provenances of silver fir and four Mediterranean fir species in eastern Austria, found both intra- and inter-specific variation to drought. However, his results indicated that genetic variation in drought response among silver fir provenances is more reduced than among Abies species. Additionally, Sagnard et al. [69], analyzing growth traits and drought resistance of silver fir seedlings in France, found a low variation among provenances in drought response, while Sindelar and Beran [70] found little genetic differentiation among silver fir provenances for drought resilience. The high genetic differentiation of drought response revealed in our study can be explained by the broad geographic amplitude of the provenances tested in these trials. This geographic area comprises two putative glacial refugia in southern Europe where silver fir survived during the last glaciation: in the Appenines and in the Balkan Peninsula of southeastern Europe. The remarkable growth performances and drought resilience of some provenances from the eastern distribution range (48, 52, 53) and southeastern (7,23, 25, 26) and southern edge (33) indicate that these populations, most of them peripheral, possess high adaptive potential, most likely as a consequence of the selection pressure.
Forest species hold different adaptive capacity to withstand the impacts of drought according to their ecophysiological characteristics and evolutionary adaptation. For instance, Arend et al. [54] showed that Quercus robur needs a prolonged recovery phase after the drought, indicating a lower fitness for drought tolerance. Forner et al. [71] found that Pinus nigra was able to recover after the extreme event while Quercus faginea was not. Additionally, Gazol et al. [72] revealed that Pinus ponderosa and Pseudotsuga menziesii displayed greater plasticity in resistance to a drought that the two more frequently oaks (Quercus alba and Quercus stellate) in North America. Our study has demonstrated that the resilience and resistance to drought varied significantly among silver fir provenances.
Silver fir is a species that highlights low genetic variability among populations, but high genetic diversity within populations, even in marginal populations [33,73], which could be a benefit for adapting to climate warming. Heer et al. [74] analyzed dendroecological and genetic data of surviving silver fir trees to the drought episodes of the 1970s and 1980s that caused forest dieback in Central Europe and found fifteen genes associated with the dendrophenotypes, including genes linked to photosynthesis and drought stress. Therefore, besides the so-called “avoidance strategy” of silver fir through bud cessation at the end of July and deep root system [75], there is a genetic basis of adaptation to drought.
The correlations between drought parameters and wood characters of silver fir provenances are positive. The most significant correlations have been obtained between radial growth and resilience. Our results are in accordance with findings from Eilmann et al. [56], while other studies have shown that drought-tolerant provenances were less productive [76]. Correlations between drought parameters and wood density were non-significant, indicating that wood density cannot be used as an indicator of drought sensitivity. Results can be explained by lower genetic variation of WD compared to RW among silver fir provenances at this age. Similar results for silver fir have been obtained by George at al. [57], while for other species like Picea abies and Pseudotsuga menziesii, correlations between wood density and trees sensitivity to drought have been found to be moderate to strong negative [55,77].
The wood characteristics varied, especially along the longitude, which represents an important gradient of increasing aridity eastward within Romania. In the Bucova trial, located in Banat Mountains with a warmer climate and an increasing deficit in rainfall, the best-performing provenances come from Eastern Carpathians.
The growth response functions revealed that the climatic variables of the trial sites were the significant drivers of the growth performance of the silver fir provenances. The main climatic variables explaining the radial growth of silver fir were MTVEG, MPOCT-MAR, and MPJAN-MAR, while for latewood percentage were MAT, MTVEG, MAP, and MTVEG. The negative correlations between RW and temperature during the growing season and positive correlations with precipitation suggest that warming and water deficit could have a negative impact on silver fir growth in climatic marginal sites, the more so because precipitation patterns are projected to change more than temperature in near future.
5. Conclusions
Even though silver fir experienced the most stressful droughts over the last two decades, it has revealed a plastic response to drought. Results revealed significant genetic variation among silver fir provenances by resistance, recovery, and resilience to drought. The provenance-specific response depended on the climatic conditions of the planting site and drought year. However, there are some local and foreign provenances that combine high radial growths and high drought tolerance.
Silvicultural practices and forest adaptive management should increase and maintain a high genetic diversity and resilience within forest stands. One of the adaptive measures could be selection, transfer, and planting of high-productive and drought resilient forest reproductive material in reforestation programs (assisted migration). Assisted migration may support adaptation process and help to conserve and increase genetic diversity, especially at the species distribution edges.
Finally, we argue that silver fir holds a great potential to thrive under warmer and drier conditions at the eastern limit of its distribution, in the southeastern Carpathians.
Author Contributions
Conceptualization: G.M.; methodology: G.M., A.M.A., and M.V.B.; software: G.M., A.M.A., E.S., and M.V.B.; validation: G.M., A.M.A., and M.V.B.; statistical analysis: G.M. and A.M.A.; resources: G.M. and M.V.B.; writing-original draft preparation: G.M.; writing-review and editing: G.M., A.M.A., E.S., and M.V.B.; project administration: G.M. and A.M.A.; funding acquisition: G.M. All authors have read and agreed to the published version of the manuscript.
Funding
This research was funded by Ministry of Research, Innovation and Digitization, grant number PN 19070303, Nucleu Program.
Institutional Review Board Statement
Not applicable.
Informed Consent Statement
Not applicable.
Data Availability Statement
Datasets generated and/or analyzed during the current study are available from the corresponding author on request.
Acknowledgments
We would like to thank the editor and anonymous reviewers for their useful advice that helped to improve the manuscript.
Conflicts of Interest
The authors declare no conflict of interest.
Appendix A

Table A1.
List of silver fir provenances tested in comparative trials.
| No. Prov. | Provenance | Country | Location within Distribution Range | Longitude E | Latitude N | Altitude (m) |
|---|---|---|---|---|---|---|
| 1 | Cheia | Romania | Southeastern edge | 25°55′ | 45°25′ | 950 |
| 2 | Azuga I | Romania | Southeastern edge | 25°35′ | 45°25′ | 1100 |
| 3 | Ghelinta | Romania | Eastern edge | 26°20′ | 45°55′ | 880 |
| 4 | Avrig | Romania | Southeastern edge | 24°30′ | 45°40′ | 660 |
| 5 | Valea Motilor | Romania | Core | 22°45′ | 46°30′ | 750 |
| 6 | Bucium | Romania | Core | 23°10′ | 46°15′ | 910 |
| 7 | Vadul Dobri | Romania | Southeastern edge | 22°35′ | 45°40′ | 1150 |
| 8 | Tismana | Romania | Southeastern edge | 23°00′ | 45°05′ | 950 |
| 9 | Polovragi | Romania | Southeastern edge | 23°48′ | 45°15′ | 1100 |
| 10 | Cozia | Romania | Southeastern edge | 24°20′ | 45°20′ | 1300 |
| 11 | Gura Teghii | Romania | Eastern edge | 26°20′ | 45°35′ | 1100 |
| 12 | Naruja I | Romania | Eastern edge | 26°40′ | 45°40′ | 800 |
| 13 | Soveja | Romania | Eastern edge | 26°40′ | 46°00′ | 750 |
| 14 | Asau | Romania | Eastern edge | 26°25′ | 46°25′ | 1050 |
| 15 | Tusnad | Romania | Eastern edge | 25°50′ | 46°10′ | 650 |
| 16 | Toplita | Romania | Eastern edge | 25°25′ | 46°55′ | 930 |
| 17 | Garcin | Romania | Southeastern edge | 25°45′ | 45°35′ | 1000 |
| 18 | Rasnov | Romania | Southeastern edge | 25°32′ | 45°35′ | 700 |
| 19 | Valiug | Romania | Southeastern edge | 22°10′ | 45°12′ | 600 |
| 20 | Rusca Montana | Romania | Southeastern edge | 22°28′ | 45°35′ | 880 |
| 21 | Azuga II | Romania | Southeastern edge | 25°35′ | 45°25′ | 1125 |
| 22 | Toplita II | Romania | Eastern edge | 23°25′ | 46°55′ | 900 |
| 23 | Rakitovo | Bulgaria | Southeastern edge | 24°05′ | 41°59′ | 1550 |
| 24 | Devin | Bulgaria | Southeastern edge | 24°24′ | 41°42′ | 1500 |
| 25 | Kitilovo | Bulgaria | Southeastern edge | 26°13′ | 42°54′ | 500 |
| 26 | St. Dimitrov | Bulgaria | Southeastern edge | 23°09′ | 42°15′ | 1450 |
| 27 | Raslog | Bulgaria | Southeastern edge | 23°40′ | 42°01′ | 1600 |
| 29 | Vallombrosa | Italy | Southern edge | 11°33′ | 43°45′ | 960 |
| 30 | Paularo | Italy | Core | 13°30′ | 46°31′ | 950 |
| 32 | San Bruno | Italy | Southern edge | 16°20′ | 38°33′ | 1250 |
| 33 | Abeti Soprani | Italy | Southern edge | 14°20′ | 41°52′ | 800 |
| 34 | Trieben | Austria | Core | 14°30′ | 47°28′ | 1125 |
| 36 | Passail | Austria | Core | 15°32′ | 47°13′ | 800 |
| 37 | Liezen | Austria | Core | 14°15′ | 47°31′ | 800 |
| 38 | Hohe Wand | Austria | Core | 16°04′ | 47°49′ | 750 |
| 40 | Todtmoos | Germany | Western edge | 8°05′ | 47°47′ | 320 |
| 41 | Enzklosterle | Germany | Western edge | 8°30′ | 48°16′ | 280 |
| 42 | Sulzburg | Germany | Western edge | 7°43′ | 47°51′ | 560 |
| 43 | Greseuss | France | Western edge | 6°09′ | 48°28′ | 400 |
| 44 | Lepilat | France | Western edge | 4°00′ | 44°40′ | 340 |
| 45 | Le Joux | France | Western edge | 6°15′ | 46°40′ | 260 |
| 46 | Naruja II | Romania | Eastern edge | 26°40′ | 45°40′ | 750 |
| 47 | Moinesti | Romania | Eastern edge | 26°25′ | 46°25′ | 940 |
| 48 | Pangarati | Romania | Eastern edge | 26°10′ | 46°53′ | 860 |
| 49 | Rasca | Romania | Eastern edge | 25°14′ | 47°20′ | 560 |
| 50 | Malini | Romania | Eastern edge | 25°56′ | 47°24′ | 820 |
| 51 | Gura Putnei | Romania | Eastern edge | 25°33′ | 47°47′ | 620 |
| 52 | Solca | Romania | Eastern edge | 24°52′ | 47°40′ | 480 |
| 53 | Botiza | Romania | Core | 23°05′ | 47°40′ | 970 |
| 54 | Strambu Baiut | Romania | Core | 22°55′ | 47°35′ | 760 |
| 55 | Valea Iadului | Romania | Core | 22°40′ | 46°50′ | 800 |
| 56 | Ilisoara Mures | Romania | Eastern edge | 25°08′ | 46°55′ | 1050 |
| 58 | Brezno Michalova | Slovakia | Core | 20°20′ | 48°40′ | 700 |
| 59 | Banska Bystrica | Slovakia | Core | 19°15′ | 48°40′ | 850 |
| 60 | Banska Bystrica | Slovakia | Core | 19°15′ | 48°40′ | 800 |
| 61 | Lidečko | Czech Republic | Core | 18°02′ | 49°05′ | 740 |
| 62 | Vizovice | Czech Republic | Core | 17°52′ | 49°12′ | 650 |
| 63 | Zarovice | Czech Republic | Core | 17°01′ | 49°30′ | 860 |
| 64 | Deblin | Czech Republic | Core | 16°32′ | 49°18′ | 740 |
| 65 | Skarzysko | Poland | Northern edge | 20°50′ | 51°07′ | 130 |
Figure A1.
Variation of mean radial growth for period 1997–2018 of silver fir provenances in trial sites.
Figure A1.
Variation of mean radial growth for period 1997–2018 of silver fir provenances in trial sites.

Table A2.
Descriptive statistics of silver fir dendrochronology.
| GLK | RBAR | EPS | SNR | Provenance rbar min | Provenance rbar max | |
|---|---|---|---|---|---|---|
| Bucova | 0.596 | 0.659 | 0.999 | 989.01 | 0.702—Prov. 30 | 0.892—Prov. 17 |
| Domnesti | 0.682 | 0.773 | 0.999 | 1700.15 | 0.752—Prov. 55 | 0.854—Prov. 16 |
| Moinesti | 0.635 | 0.691 | 0.999 | 1096.01 | 0.607—Prov. 33 | 0.905—Prov. 55 |
| Sacele | 0.612 | 0.706 | 0.999 | 1605.15 | 0.633—Prov. 22 | 0.920—Prov. 26 |
| Str. Baiut | 0.627 | 0.689 | 0.999 | 1001.36 | 0.728—Prov. 3 | 0.918—Prov. 50 |
Table A3.
Phenotypic correlations between the wood characters and geographic coordinates of the origin place of silver fir provenances.
Table A3.
Phenotypic correlations between the wood characters and geographic coordinates of the origin place of silver fir provenances.
| Trial | Trait | LW | EW | LWP | WD | LAT | LONG | ALT |
|---|---|---|---|---|---|---|---|---|
| SACELE | RW | 0.570 *** | 0.870 *** | −0.258 * | 0.082 | −0.083 | −0.172 | −0.028 |
| LW | - | 0.098 | 0.599 *** | 0.007 | −0.092 | 0.303 * | −0.123 | |
| EW | - | −0.663 *** | 0.090 | −0.043 | −0.389 ** | 0.034 | ||
| LWP | - | 0.059 | −0.126 | 0.522 *** | −0.115 | |||
| WD | - | −0.103 | 0.050 | −0.065 | ||||
| DOMNESTI | RW | 0.885 *** | 0.934 *** | −0.098 | −0.189 | 0.230 | −0.128 | 0.133 |
| LW | - | 0.667 *** | 0.310 * | 0.011 | 0.264 | −0.189 | 0.003 | |
| EW | - | −0.424 ** | −0.292 * | 0.171 | −0.096 | 0.207 | ||
| LWP | - | 0.179 | 0.205 | −0.029 | −0.217 | |||
| WD | - | −0.299 * | −0.173 | −0.170 | ||||
| BUCOVA | RW | 0.495 ** | 0.801 *** | −0.242 | −0.077 | 0.240 | 0.292 * | 0.166 |
| LW | - | −0.123 | 0.709 *** | −0.201 | 0.103 | −0.425 ** | −0.176 | |
| EW | - | −0.764 *** | 0.051 | 0.201 | 0.627 *** | 0.300 * | ||
| LWP | - | −0.172 | −0.059 | −0.723 *** | −0.326 * | |||
| WD | - | −0.240 | 0.050 | −0.031 | ||||
| STRAMBU BAIUT | RW | 0.695 *** | 0.827 *** | −0.071 | −0.304 * | 0.081 | 0.127 | 0.094 |
| LW | - | 0.172 | 0.632 *** | −0.137 | −0.077 | −0.036 | −0.115 | |
| EW | - | −0.594 *** | −0.306 * | 0.166 | 0.198 | 0.230 | ||
| LWP | - | 0.039 | −0.151 | −0.224 | −0.258 | |||
| WD | - | −0.279 * | 0.165 | 0.096 | ||||
| MOINESTI | RW | 0.809 *** | 0.918 *** | −0.192 | −0.362 * | 0.486 ** | −0.100 | 0.072 |
| LW | - | 0.508 *** | 0.397 ** | −0.245 | 0.266 | −0.344 * | −0.005 | |
| EW | - | −0.549 *** | −0.365 * | 0.532 *** | 0.086 | 0.113 | ||
| LWP | - | 0.148 | −0.341 * | −0.382 * | −0.036 | |||
| WD | - | −0.268 | −0.044 | −0.099 |
The level of significance is represented as follows: * p < 0.05; ** p < 0.01; *** p < 0.001.
References
- Field, C.B.; Barros, T.F.V.; Stocker, Q.D.; Dokken, D.J.; Ebi, K.L.; Mastrandrea, M.D.; Mach, K.J.; Plattner, G.K.; Allen, S.K.; Tignor, M. IPCC Report on Managing the Risks of Extreme Events and Disasters to Advance Climate Change Adaptation; Cambridge University Press: Cambridge, UK, 2012; p. 582. [Google Scholar]
- Masson-Delmotte, V.; Zhai, P.; Pörtner, H.O.; Roberts, D.; Skea, J.; Shukla, P.R.; Pirani, A.; Moufouma-Okia, W.; Péan, C.; Pidcock, R. IPCC Special Report on the Impacts of Global Warming of 1.5 °C Above Pre-Industrial Levels and Related Global Greenhouse Gas Emission Pathways, in the Context of Strengthening the Global Response to the Threat of Climate Change, Sustainable Development, and Efforts to Eradicate Poverty; Intergovernmental Panel on Climate Change, IPCC: Geneva, Switzerland, 2019; p. 26. [Google Scholar]
- Mishra, A.K.; Singh, V.P. A review of drought concepts. J. Hydrol. 2010, 391, 202–216. [Google Scholar] [CrossRef]
- Naumann, G.; Spinoni, J.; Vogt, J.V.; Barbosa, P. Assessment of drought damages and their uncertainties in Europe. Environ. Res. Lett. 2015, 10, 124013. [Google Scholar] [CrossRef]
- Allen, C.D.; Macalady, A.K.; Chenchouni, H.; Bachelet, D.; McDowell, N.; Vennetier, M.; Kitzberger, T.; Rigling, A.; Breshears, D.D.; Hogg, E.H.; et al. A global overview of drought and heat-induced tree mortality reveals emerging climate change risks for forests. For. Ecol. Manag. 2010, 259, 660–684. [Google Scholar] [CrossRef] [Green Version]
- Ciais, P.; Reichstein, M.; Viovy, N.; Granier, A.; Ogée, J.; Allard, V.; Aubinet, M.; Buchmann, N.; Bernhofer, C.; Carrara, A.; et al. Europe-wide reduction in primary productivity caused by the heat and drought in 2003. Nature 2005, 437, 529–533. [Google Scholar] [CrossRef] [PubMed]
- Lloret, F.; Escudero, A.; Iriondo, J.M.; Martinez-Vilalta, J.; Valladares, F. Extreme climatic events and vegetation: The role of stabilizing processes. Glob. Chang. Biol. 2012, 18, 797–805. [Google Scholar] [CrossRef]
- Blauhut, V.; Stahl, K.; Stagge, J.H.; Tallaksen, L.M.; de Stefano, L.; Vogt, J. Estimating drought risk across Europe from reported drought impacts, drought indices, and vulnerability factors. Hydrol. Earth Syst. Sci. 2016, 20, 2779–2800. [Google Scholar] [CrossRef] [Green Version]
- Briffa, K.R.; van der Schrier, G.; Jones, P.D. Wet and dry summers in Europe since 1750: Evidence of increasing drought. Int. J. Clim. 2009, 29, 1894–1905. [Google Scholar] [CrossRef]
- Gudmundsson, L.; Seneviratne, S.I. European drought trends. Proc. Int. Assoc. Hydrol. Sci. 2015, 369, 75–79. [Google Scholar] [CrossRef] [Green Version]
- Dumitrescu, A.; Bojariu, R.; Birsan, M.-V.; Marin, L.; Manea, A. Recent climatic changes in Romania from observational data (1961–2013). Theor. Appl. Clim. 2014, 122, 111–119. [Google Scholar] [CrossRef]
- Spinoni, J.; Szalai, S.; Szentimrey, T.; Lakatos, M.; Bihari, Z.; Nagy, A.; Németh, Á.; Kovács, T.; Mihic, D.; Dacic, M.; et al. Climate of the Carpathian Region in the period 1961–2010: Climatologies and trends of 10 variables. Int. J. Clim. 2014, 35, 1322–1341. [Google Scholar] [CrossRef] [Green Version]
- Ionita, M.; Scholz, P.; Chelcea, S. Assessment of droughts in Romania using the Standardized Precipitation Index. Nat. Hazards 2016, 81, 1483–1498. [Google Scholar] [CrossRef] [Green Version]
- Meinshausen, M.; Smit, S.; Calvin, J.H.; Daniel, K.; Kainuma, J.S.; Lamarque, M.L.T.; Matsumoto, J.F.; Montzka, K.; Raper, S.; Riahi, S. The RCP greenhouse gas concentrations and their extensions from 1765 to 2300. Clim. Chang. 2011, 109, 213–241. [Google Scholar] [CrossRef] [Green Version]
- Spinoni, J.; Vogt, J.V.; Naumann, G.; Barbosa, P.; Dosio, A. Will drought events become more frequent and severe in Europe? Int. J. Clim. 2018, 38, 1718–1736. [Google Scholar] [CrossRef] [Green Version]
- Hamrick, J. Response of forest trees to global environmental changes. For. Ecol. Manag. 2004, 197, 323–335. [Google Scholar] [CrossRef]
- Lindner, M. Developing adaptive forest management strategies to cope with climate change. Tree Physiol. 2000, 20, 299–307. [Google Scholar] [CrossRef] [PubMed] [Green Version]
- Bréda, N.; Huc, R.; Granier, A.; Dreyer, E. Temperate forest trees and stands under severe drought: A review of ecophysiological responses, adaptation processes and long-term consequences. Ann. For. Sci. 2006, 63, 625–644. [Google Scholar] [CrossRef] [Green Version]
- Mauri, A.; de Rigo, D.; Caudullo, G. Abies alba in Europe: Distribution, habitat, usage and threats. In European Atlas of Forest Tree Species; San-Miguel-Ayanz, J., de Rigo, D., Caudullo, G., Houston, D.T., Mauri, A., Eds.; Publication Office of the European Union: Brusels, Belgium, 2016; pp. 48–49. [Google Scholar]
- Maiorano, L.; Cheddadi, R.; Zimmermann, N.E.; Pellissier, L.; Petitpierre, B.; Pottier, J.; Laborde, H.; Hurdu, B.I.; Pearman, P.B.; Psomas, A.; et al. Building the niche through time: Using 13,000 years of data to predict the effects of climate change on three tree species in Europe. Glob. Ecol. Biogeogr. 2012, 22, 302–317. [Google Scholar] [CrossRef]
- Dyderski, M.K.; Paz, S.; Frelich, L.E.; Jagodzinski, A.M. How much does climate change threaten European forest tree species distributions? Glog. Chang. Biol. 2018, 24, 1150–1163. [Google Scholar] [CrossRef]
- Vitasse, Y.; Bottero, A.; Rebetez, M.; Conedera, M.; Augustin, S.; Brang, P.; Tinner, W. What is the potential of silver fir to thrive under warmer and drier climate? Eur. J. For. Res. 2019, 138, 547–560. [Google Scholar] [CrossRef]
- Tinner, W.; Colombaroli, D.; Heiri, O.; Henne, P.D.; Steinacher, M.; Untenecker, J.; Vescovi, E.; Allen, J.R.; Carraro, G.; Conedera, M. The past ecology of Abies alba provides new perspectives on future responses of silver fir forests to global warming. Ecol. Monogr. 2013, 83, 419–439. [Google Scholar] [CrossRef] [Green Version]
- Ruosch, M.; Spahni, R.; Joos, F.; Henne, P.D.; Knaap, W.O.; Tinner, W. Past and future evolution of Abies alba forests in Eu-rope—Comparison of a dynamic vegetation model with palaeodata and observations. Glob. Chang. Biol. 2016, 22, 727–740. [Google Scholar] [CrossRef]
- Latreille, A.C.; Pichot, C. Local-scale diversity and adaptation along elevational gradients assessed by reciprocal transplant experiments: Lack of local adaptation in silver fir populations. Ann. For. Sci. 2017, 74, 77. [Google Scholar] [CrossRef] [Green Version]
- Becker, M. The role of climate on present and past vitality of silver fir forests in the Vosges mountains of northeastern France. Can. J. For. Res. 1989, 19, 1110–1117. [Google Scholar] [CrossRef]
- Maaten-Theunissen, M.; Kahle, H.P.; Maaten, E. Drought sensitivity of Norway spruce is higher than that of silver fir along an altitudinal gradient in southwestern Germany. Ann. For. Sci. 2013, 70, 185–193. [Google Scholar] [CrossRef] [Green Version]
- Bouriaud, O.; Popa, I. Comparative dendroclimatic study of Scots pine, Norway spruce, and silver fir in the Vrancea Range, Eastern Carpathian Mountains. Trees 2008, 23, 95–106. [Google Scholar] [CrossRef]
- Lévesque, M.; Saurer, M.; Siegwolf, R.T.W.; Eilmann, B.; Brang, P.; Bugmann, H.; Rigling, A. Drought response of five conifer species under contrasting water availability suggests high vulnerability of Norway spruce and European larch. Glob. Chang. Biol. 2013, 19, 3184–3199. [Google Scholar] [CrossRef] [PubMed]
- Zang, C.; Hartl-Meier, C.; Dittmar, C.; Rothe, A.; Menzel, A. Patterns of drought tolerance in major European temperate forest trees: Climatic drivers and levels of variability. Glob. Chang. Biol. 2014, 20, 3767–3779. [Google Scholar] [CrossRef]
- Gazol, A.; Camarero, J.J. Functional diversity enhances silver fir growth resilience to an extreme drought. J. Ecol. 2016, 104, 1063–1075. [Google Scholar] [CrossRef]
- Bosela, M.; Lukac, M.; Castagneri, D.; Sedmák, R.; Biber, P.; Carrer, M.; Konôpka, B.; Nola, P.; Nagel, T.A.; Popa, I.; et al. Contrasting effects of environmental change on the radial growth of co-occurring beech and fir trees across Europe. Sci. Total Environ. 2018, 615, 1460–1469. [Google Scholar] [CrossRef] [PubMed]
- Klisz, M.; Ukalski, K.; Ukalska, J.; Jastrzębowski, S.; Puchałka, R.; Przybylski, P.; Mionskowski, M.; Matras, J. What Can We Learn from an Early Test on the Adaptation of Silver Fir Populations to Marginal Environments? Forests 2018, 9, 441. [Google Scholar] [CrossRef] [Green Version]
- Mihai, G.; Bîrsan, M.-V.; Dumitrescu, A.; Alexandru, A.; Mirancea, I.; Ivanov, P.; Stuparu, E.; Teodosiu, M.; Daia, M. Adaptive genetic potential of European silver fir in Romania in the context of climate change. Ann. For. Res. 2018, 61, 95–108. [Google Scholar] [CrossRef]
- Eriksson, G.; Namkoong, G.; Roberds, J.H. Dynamic gene conservation for uncertain futures. For. Ecol. Manag. 1993, 62, 15–37. [Google Scholar] [CrossRef]
- Kremer, A. How well can existing forests withstand climate change. In Climate Change and Forest Genetic Diversity: Implications for Sustainable Forest Management in Europe; Koskela, J., Buck, A., Teissier du Cros, E., Eds.; Bioversity International: Rome, Italy, 2007; pp. 3–17. [Google Scholar]
- Lindner, M.; Maroschek, M.; Netherer, S.; Kremer, A.; Barbati, A.; Garcia–Gonzalo, J.; Seidl, R.; Delzon, S.; Corona, P.; Kol-strom, M. Climate change impacts, adaptive capacity and vulnerability of European forest ecosystems. For. Ecol. Manag. 2010, 259, 698–709. [Google Scholar] [CrossRef]
- Mihai, G.; Teodosiu, M.; Birsan, M.-V.; Alexandru, A.-M.; Mirancea, I.; Apostol, E.-N.; Garbacea, P.; Ionita, L. Impact of Climate Change and Adaptive Genetic Potential of Norway Spruce at the South-Eastern Range of Species Distribution. Agric. For. Meteorol. 2020, 291, 108040. [Google Scholar] [CrossRef]
- Rehfeldt, G.E.; Wykoff, W.R.; Ying, C.C. Physiologic Plasticity, Evolution, and Impacts of a Changing Climate on Pinus Contorta. Clim. Chang. 2001, 50, 355–376. [Google Scholar] [CrossRef]
- Wang, T.; O’Neill, G.A.; Aitken, S.N. Integrating environmental and genetic effects to predict responses of tree populations to climate. Ecol. Appl. 2010, 20, 153–163. [Google Scholar] [CrossRef]
- Rehfeldt, G.E.; Ying, C.C.; Spittlehouse, D.L.; Hamilton, D.A. Genetic responses to climate in Pinus contorda: Niche breadth, climate change, and reforestation. Ecol. Monogr. 1999, 69, 375–407. [Google Scholar] [CrossRef]
- Sáenz-Romero, C.; Kremer, A.; Nagy, L.; Újvári-Jármay, É.; Ducousso, A.; Kóczán-Horváth, A.; Hansen, J.K.; Mátyás, C. Common garden comparisons confirm inherited differences in sensitivity to climate change between forest tree species. PeerJ 2019, 7, e6213. [Google Scholar] [CrossRef] [PubMed]
- Buras, A.; Sass-Klaassen, U.; Verbeek, I.; Copini, P. Provenance selection and site conditions determine growth performance of pedunculate oak. Dendrochronologia 2020, 61, 125705. [Google Scholar] [CrossRef]
- Andalo, C.; Beaulieu, J.; Bousquet, J. The impact of climate change on growth of local white spruce populations in Québec, Canada. For. Ecol. Manag. 2005, 205, 169–182. [Google Scholar] [CrossRef]
- Rweyongeza, D.M.; Yang, R.-C.; Dhir, N.K.; Barnhardt, L.K.; Hansen, C. Genetic Variation and Climatic Impacts on Survival and Growth of White Spruce in Alberta, Canada. Silvae Genet. 2007, 56, 117–127. [Google Scholar] [CrossRef]
- St Clair, J.B.; Mandel, N.L.; Vance-Borland, K.W. Genecology of Douglas fir in western Oregon and Washinton. Ann. Bot. 2005, 96, 1199–1214. [Google Scholar] [CrossRef] [Green Version]
- Chakraborty, D.; Wang, T.; Andre, K.; Konnert, M.; Lexer, M.J.; Matulla, C.; Schueler, S. Selecting Populations for Non-Analogous Climate Conditions Using Universal Response Functions: The Case of Douglas-Fir in Central Europe. PLoS ONE 2015, 10, e0136357. [Google Scholar] [CrossRef] [PubMed]
- Schmidtling, R.C. Use of provenance tests to predict response to climate change: Loblolly pine and Norway spruce. Tree Physiol. 1994, 14, 805–817. [Google Scholar] [CrossRef] [PubMed]
- Gömöry, D.; Longauer, R.; Hlásny, T.; Pacalaj, M.; Strmeň, S.; Krajmerová, D. Adaptation to common optimum in different populations of Norway spruce (Picea abies Karst.). Eur. J. For. Res. 2011, 131, 401–411. [Google Scholar] [CrossRef]
- Kapeller, S.; Lexer, M.J.; Geburek, T.; Hiebl, J.; Schueler, S. Intraspecific variation in climate response of Norway spruce in the eastern Alpine range: Selecting appropriate provenances for future climate. For. Ecol. Manag. 2012, 271, 46–57. [Google Scholar] [CrossRef]
- Klisz, M.; Ukalska, J.; Koprowski, M.; Tereba, A.; Puchałka, R.; Przybylski, P.; Jastrzębowski, S.; Nabais, C. Effect of provenance and climate on intra-annual density fluctuations of Norway spruce Picea abies (L.) Karst. in Poland. Agric. For. Meteorol. 2019, 269, 145–156. [Google Scholar] [CrossRef]
- Vitasse, Y.; Delzon, S.; Bresson, C.C.; Michalet, R.; Kremer, A. Altitudinal differentiation in growth and phenology among populations of temperate-zone tree species growing in a common garden. Can. J. For. Res. 2009, 39, 1259–1269. [Google Scholar] [CrossRef] [Green Version]
- Burczyk, J.; Giertych, M. Response of Norway Spruce (Picea abies [L] Karst) annual increments to drought for various prov-enances and locations. Silvae Genet. 1991, 40, 146–152. [Google Scholar]
- Arend, M.; Kuster, T.; Günthardt-Goerg, M.S.; Dobbertin, M. Provenance-specific growth responses to drought and air warming in three European oak species (Quercus robur, Q. petraea and Q. pubescens). Tree Physiol. 2011, 31, 287–297. [Google Scholar] [CrossRef] [PubMed] [Green Version]
- Dalla-Salda, G.; Martinez-Meier, A.; Cochard, H.; Rozenberg, P. Genetic variation of xylem hydraulic properties shows that wood density is involved inadaptation to drought in Douglas-fir (Pseudotsuga menziesii (Mirb.)). Ann. For. Sci. 2011, 68, 747–757. [Google Scholar] [CrossRef] [Green Version]
- Eilmann, B.; de Vries, S.M.; Ouden, J.D.; Mohren, G.M.; Sauren, P.; Sass-Klaassen, U. Origin matters! Difference in drought tolerance and productivity of coastal Douglas-fir (Pseudotsuga menziesii (Mirb.)) provenances. For. Ecol. Manag. 2013, 302, 133–143. [Google Scholar] [CrossRef]
- George, J.-P.; Schueler, S.; Karanitsch-Ackerl, S.; Mayer, K.; Klumpp, R.T.; Grabner, M. Inter- and intra-specific variation in drought sensitivity in Abies spec. and its relation to wood density and growth traits. Agric. For. Meteorol. 2015, 214, 430–443. [Google Scholar] [CrossRef] [Green Version]
- George, J.-P.; Grabner, M.; Campelo, F.; Karanitsch-Ackerl, S.; Mayer, K.; Klumpp, R.T.; Schüler, S. Intra-specific variation in growth and wood density traits under water-limited conditions: Long-term-, short-term-, and sudden responses of four conifer tree species. Sci. Total. Environ. 2019, 660, 631–643. [Google Scholar] [CrossRef]
- Stokes, M.A.; Smiley, T.L. An Introduction to Tree-Ring Dating; University of Chicago Press: Chicago, IL, USA, 1996; p. 73. [Google Scholar]
- Grissino-Mayer, H.D. Evaluating crossdating accuracy: A manual and tutorial for the computer program COFECHA. Tree Ring Res. 2001, 57, 205–221. [Google Scholar]
- Fritts, H.C. Tree Rings and Climate; Academic Press: San Francisco, CA, USA, 1976; p. 582. [Google Scholar]
- Briffa, K.R.; Jones, P.D. Basic chronology statistics and assessment. In Methods of Dendrochronology; Cook, E.R., Kairiukstis, L., Eds.; Kluwer Academic: Dordrecht, The Netherlands, 1990; pp. 137–153. [Google Scholar]
- Speer, J.H. Fundamentals of Tree-Ring Research; Indiana State University: Terre Haute, IN, USA, 2009; p. 508. [Google Scholar]
- Bunn, A.G. A dendrochronology program library in R (dplR). Dendrochronologia 2008, 26, 115–124. [Google Scholar] [CrossRef]
- Dumitriu-Tataranu, I.; Ghelmeziu, N.; Florescu, I.; Milea, I.; Mos, V.; Tocan, M. Estimarea Calitatii Lemnului Prin Metoda Carotelor de Sondaj; Editura Tehnica: Bucuresti, Romania, 1983; p. 347. [Google Scholar]
- Dumitrescu, A.; Birsan, M.-V. ROCADA: A gridded daily climatic dataset over Romania (1961–2013) for nine meteorological variables. Nat. Hazards 2015, 78, 1045–1063. [Google Scholar] [CrossRef]
- McKee, T.B.N.; Doesken, J.; Kleist, J. The relationship of drought frequency and duration to time scales. In Proceedings of the 9th Conference on Applied Climatology, Dallas, TX, USA, 15–20 January 1995; pp. 179–184. [Google Scholar]
- Lloret, F.; Keeling, E.G.; Sala, A. Components of tree resilience: Effects of successive low-growth episodes in old ponderosa pine forests. Oikos 2011, 120, 1909–1920. [Google Scholar] [CrossRef]
- Sagnard, F.; Barberot, C.; Fady, B. Structure of Genetic diversity in Abies alba Mill. from southwestern Alps: Multivariate analysis of adaptive and non-adaptive traits for conservation in France. For. Ecol. Manag. 2002, 157, 175–189. [Google Scholar] [CrossRef]
- Sindelar, J.; Beran, F. Comparison of some exotic species of Abies genus with chosen silver fir provenances on the plots of town Pisek. Commun. Inst. For. Bohem. 2008, 24, 99–114. [Google Scholar]
- Forner, A.; Aranda, I.; Granier, A.; Valladares, F. Differential impact of the most extreme drought event over the last half century on growth and sap flow in two coexisting Mediterranean trees. Plant Ecol. 2014, 215, 703–719. [Google Scholar] [CrossRef] [Green Version]
- Gazol, A.; Camarero, J.J.; Anderegg, W.R.L.; Vicente-Serrano, S.M. Impacts of droughts on the growth resilience of Northern Hemisphere forests. Glob. Ecol. Biogeogr. 2017, 26, 166–176. [Google Scholar] [CrossRef]
- Brousseau, L.; Postolache, D.; Lascoux, M.; Drouzas, A.D.; Källman, T.; Leonarduzzi, C.; Liepelt, S.; Piotti, A.; Popescu, F.; Roschanski, A.M.; et al. Local Adaptation in European Firs Assessed through Extensive Sampling across Altitudinal Gradients in Southern Europe. PLoS ONE 2016, 11, e0158216. [Google Scholar] [CrossRef]
- Heer, K.; Behringer, D.; Piermattei, A.; Bassler, C.; Brandl, R.; Fady, B.; Jehl, H.; Liepelt, S.; Lorch, S.; Piotti, A. Linking dendroecology and association genetics in natural populations: Stress responses archived in tree rings associate with SNP genotypes in silver fir (Abies alba Mill.). Mol. Ecol. 2018, 27, 1428–1438. [Google Scholar] [CrossRef] [PubMed]
- Jones, H.G.; Sutherland, R.A. Stomatal control of xylem embolism. Plant Cell Environ. 1991, 14, 607–612. [Google Scholar] [CrossRef]
- St Clair, J.B.; Howe, G.T. Genetic maladaptation of coastal Douglas-fir seedlings to future climates. Glob. Chang. Biol. 2007, 13, 1441–1454. [Google Scholar] [CrossRef]
- Rosner, S.; Světlík, J.; Andreassen, K.; Børja, I.; Dalsgaard, L.; Evans, R.; Karlsson, B.; Tollefsrud, M.; Solberg, S. Wood density as a screening trait for drought sensitivity in Norway spruce. Can. J. For. Res. 2014, 44, 154–161. [Google Scholar] [CrossRef]
Figure 1.
Location of silver fir provenances (triangles) and trials (circles). Gray area/dots—the natural distribution of silver fir (by EUFORGEN).
Figure 1.
Location of silver fir provenances (triangles) and trials (circles). Gray area/dots—the natural distribution of silver fir (by EUFORGEN).

Figure 2.
Variation of the mean annual temperature (a) and annual precipitation amount (b) in trial sites.
Figure 2.
Variation of the mean annual temperature (a) and annual precipitation amount (b) in trial sites.

Figure 3.
Standardized precipitation index (SPI) for the trial sites. Trials are Bucova (A), Domnesti (B), Moinesti (C), Sacele (D), and Strambu Baiut (E).
Figure 3.
Standardized precipitation index (SPI) for the trial sites. Trials are Bucova (A), Domnesti (B), Moinesti (C), Sacele (D), and Strambu Baiut (E).

Figure 4.
Variation of the radial growth and wood characteristics in trial sites during the analyzed period. Trials are Bucova (a), Domnesti (b), Moinesti (c), Sacele (d), and Strambu Baiut (e).
Figure 4.
Variation of the radial growth and wood characteristics in trial sites during the analyzed period. Trials are Bucova (a), Domnesti (b), Moinesti (c), Sacele (d), and Strambu Baiut (e).


Figure 5.
Variation of the drought parameters of silver fir provenances calculated for 2000 drought year in each trial site. Drought parameters are resistance (a), recovery (b), resilience (c), and relative resilience (d).
Figure 5.
Variation of the drought parameters of silver fir provenances calculated for 2000 drought year in each trial site. Drought parameters are resistance (a), recovery (b), resilience (c), and relative resilience (d).


Table 1.
Geographic and climatic variables for silver fir trial sites.
| Trials | Prov. Region | Altitude m | TMA °C | TMVEG °C | SAP mm | PMVEG °C | SPVEG mm | De Martonne Index | De Martonne IndexVEG |
|---|---|---|---|---|---|---|---|---|---|
| Bucova | D2 | 650 | 7.37 | 13.46 | 878 | 92 | 550 | 50 | 23 |
| Domnesti | C2 | 880 | 6.68 | 12.83 | 916 | 104 | 622 | 55 | 27 |
| Moinesti | A2 | 815 | 7.72 | 13.71 | 868 | 91 | 544 | 49 | 23 |
| Sacele | B1 | 1225 | 4.92 | 10.91 | 1001 | 113 | 678 | 67 | 32 |
| Strambu-Baiut | A1 | 890 | 6.90 | 13.24 | 879 | 87 | 521 | 52 | 22 |
Table 2.
Description of the wood and climatic characteristics.
| Abbreviation | Wood and Climate Characteristics |
|---|---|
| RW | Ring width |
| EW | Earlywood width |
| LW | Latewood width |
| LWP | Latewood proportion |
| DW | Wood density |
| MAT | Mean annual temperature |
| MTVEG | Mean temperature during growing season (April to September) |
| MTJAN | Mean temperature for January (the coldest month) |
| MTJUL | Mean temperature for July (the warmest month) |
| MTOCT-DEC | Mean temperature from October to December of previous year |
| MTOCT-MAR | Mean temperature from October of previous year to March of current year |
| MTJAN-MAR | Mean temperature from January to March of current year |
| MAP | Mean annual precipitation amount |
| MPVEG | Mean precipitation during growing season |
| MPJAN | Mean precipitation of the coldest month |
| MPJUL | Mean precipitation of the warmest month |
| MPOCT-DEC | Mean precipitation from October to December of previous year |
| MPOCT-MAR | Mean precipitation from October of previous year to March of current year |
| MPJAN-MAR | Mean precipitation from January to March of the current year |
| SAP | Annual precipitation amount |
| SPOCT-DEC | Precipitation amount in autumn-winter of previous year |
| SPOCT-MAR | Precipitation amount from October of previous year to March of current year |
| SPJAN-MAR | Precipitation amount from January to March of current year |
Table 3.
The months when occurred extreme and severe droughts during 2000, 2002, 2003, and 2011.
| Trial | 2000 | 2002/2003 (1) | 2011 | ||||||
|---|---|---|---|---|---|---|---|---|---|
| Extreme Drought | Severe Drought | Total Months | Extreme Drought | Severe Drought | Total Months | Extreme Drought | Severe Drought | Total Months | |
| Bucova | I, II, VIII, XII | VI, VII, X | 7 | III, IV | II, V | 4 | V, X, XI, XII | IV | 5 |
| Domnesti | VI, XII | VII | 3 | II, III, IV, V | I | 5 | X, XI, XII | - | 3 |
| Moinesti | I, VII, VIII, XII | II, VI, IX, X, XI | 9 | IV, V | II, III | 4 | V, XI | VI, XII | 4 |
| Sacele | VI, VII, XII | VIII, X | 5 | II | I | 2 | XI, XII | X | 3 |
| Strambu Baiut | X, XII | VI, XI | 4 | V, VI, VII | VIII | 4 | X, XI, XII | - | 3 |
(1) Explanatory note: the year 2003 was extremely dry at Strambu Baiut only.
Table 4.
Analysis of variance of wood traits for the period 1997–2018.
| Trial | Source of Variation | DF | Variance (s2) | ||||
|---|---|---|---|---|---|---|---|
| RW | LW | EW | LWP | WD | |||
| SACELE | Provenance (P) | 59 | 8750.95 *** | 2054.92 *** | 5973.12 *** | 0.071 *** | 0.002 *** |
| Repetition (B) | 2 | 0.010 | 0.079 | 0.115 | 0.098 | 0.001 | |
| Year (Y) | 21 | 1.880 *** | 0.289 *** | 1.422 *** | 0.290 *** | - | |
| Interaction P × Y | 1239 | 0.038 *** | 0.011 | 0.018 * | 0.004 | - | |
| Error | 2640 | 0.032 | 0.010 | 0.017 | 0.004 | 0.001 | |
| DOMNESTI | Provenance (P) | 42 | 5568.98 *** | 1543.09 *** | 2011.95 *** | 0.015 *** | 0.003 ** |
| Repetition (B) | 2 | 0.003 | 0.036 | 0.035 | 0.036 | 0.009 | |
| Year (Y) | 21 | 1.868 *** | 0.497 *** | 0.623 *** | 0.088 *** | - | |
| Interaction P × Y | 882 | 0.023 *** | 0.007 *** | 0.007 *** | 0.001 | - | |
| Error | 2838 | 0.015 | 0.005 | 0.006 | 0.002 | 0.001 | |
| BUCOVA | Provenance (P) | 42 | 4107.42 *** | 1495.19 *** | 3182.79 *** | 0.072 *** | 0.001 |
| Repetition (B) | 2 | 0.002 | 0.234 | 0.265 | 0.244 | 0.001 | |
| Year (Y) | 21 | 1.080 *** | 0.387 *** | 0.568 *** | 0.201 *** | - | |
| Interaction P × Y | 882 | 0.024 | 0.008 | 0.012 | 0.003 | - | |
| Error | 2838 | 0.023 | 0.009 | 0.011 | 0.004 | 0.001 | |
| STRAMBU BAIUT | Provenance (P) | 42 | 3543.39 *** | 1139.49 *** | 1930.62 *** | 0.036 *** | 0.005 |
| Repetition (B) | 2 | 0.003 | 0.136 | 0.100 | 0.125 | 0.006 | |
| Year (Y) | 21 | 1.426 *** | 0.467 *** | 0.708 *** | 0.213 *** | - | |
| Interaction P × Y | 882 | 0.020 *** | 0.008 | 0.011 ** | 0.004 | - | |
| Error | 2838 | 0.014 | 0.007 | 0.010 | 0.005 | 0.004 | |
| MOINESTI | Provenance (P) | 42 | 5347 *** | 1137 *** | 2497 *** | 0.023 *** | 0.002 * |
| Repetition (B) | 2 | 0.006 | 0.304 | 0.329 | 0.289 | 0.001 | |
| Year (Y) | 21 | 1.241 *** | 0.305 *** | 0.617 *** | 0.133 *** | - | |
| Interaction P × Y | 882 | 0.013 | 0.005 | 0.009 | 0.003 | - | |
| Error | 2838 | 0.015 | 0.006 | 0.010 | 0.004 | 0.001 | |
The level of significance is represented as follows: * p < 0.05; ** p < 0.01; *** p < 0.001.
Table 5.
Multifactorial analysis of variance of wood traits for the period 1997–2018.
| Source of Variation | DF | Variance (s2) | ||||
|---|---|---|---|---|---|---|
| RW | LW | EW | LWP | WD | ||
| Provenance (P) | 42 | 5894.39 *** | 1476.69 *** | 2743.90 *** | 0.032 *** | 0.003 ** |
| Site (S) | 4 | 62,418.47 *** | 44,090.87 *** | 30,738.85 *** | 1.616 *** | 0.009 *** |
| Year (Y) | 21 | 5.405 *** | 1.369 *** | 2.860 *** | 0.471 *** | - |
| Interaction P × S | 168 | 50,470.00 *** | 14,551.71 *** | 27,404.64 *** | 0.042 *** | 0.001 |
| Interaction P × Y | 882 | 0.024 | 0.008 | 0.011 | 0.004 | - |
| Interaction S × Y | 84 | 0.396 *** | 0.118 *** | 0.153 *** | 0.056 *** | - |
| Error | 13,200 | 0.023 | 0.009 | 0.013 | 0.005 | 0.001 |
The level of significance is represented as follows: ** p < 0.01; *** p < 0.001.
Table 6.
Analysis of variance for drought parameters of silver fir provenances in all extreme drought years and each trial site.
Table 6.
Analysis of variance for drought parameters of silver fir provenances in all extreme drought years and each trial site.
| Trial | Source of Variation | DF | Variance (s2) | |||
|---|---|---|---|---|---|---|
| Res | Rec | Rsl | rRsl | |||
| SACELE | Provenance (P) | 59 | 0.119 *** | 0.100 | 0.138 *** | 0.049 |
| Repetition (B) | 2 | 0.288 | 0.622 | 0.602 | 0.209 | |
| Extreme drought year (DrY) | 3 | 2.418 *** | 4.893 *** | 4.272 *** | 2.863 *** | |
| Interaction P x DrY | 177 | 0.078 | 0.093 | 0.110 ** | 0.050 | |
| Error | 2436 | 0.068 | 0.103 | 0.079 | 0.052 | |
| DOMNESTI | Provenance (P) | 42 | 0.038 | 0.108* | 0.087 ** | 0.033 |
| Repetition (B) | 2 | 0.260 | 0.154 | 0.110 | 0.082 | |
| Extreme drought year (DrY) | 2 | 6.318 *** | 16.716 *** | 0.520 *** | 9.681 *** | |
| Interaction P x DrY | 86 | 0.080 *** | 0.119 ** | 0.066 * | 0.061 *** | |
| Error | 1368 | 0.049 | 0.081 | 0.052 | 0.034 | |
| BUCOVA | Provenance (P) | 42 | 0.074 | 0.121 | 0.071 | 0.049 |
| Repetition (B) | 2 | 0.304 | 0.858 | 0.034 | 0.148 | |
| Extreme drought year (DrY) | 3 | 3.873 *** | 8.484 *** | 0.307 *** | 4.845 *** | |
| Interaction P x DrY | 126 | 0.099 * | 0.162 | 0.089 * | 0.075 | |
| Error | 1856 | 0.081 | 0.185 | 0.073 | 0.063 | |
| STRAMBU BAIUT | Provenance (P) | 42 | 0.081 * | 0.125 | 0.081 *** | 0.063 |
| Repetition (B) | 2 | 0.330 | 0.168 | 0.342 | 0.108 | |
| Extreme drought year (DrY) | 4 | 0.911 *** | 9.110 *** | 3.391 *** | 3.856 *** | |
| Interaction P x DrY | 168 | 0.052 | 0.102 | 0.037 | 0.050 | |
| Error | 2055 | 0.061 | 0.098 | 0.042 | 0.054 | |
| MOINESTI | Provenance (P) | 42 | 0.029 | 0.048 | 0.065 ** | 0.027 |
| Repetition (B) | 2 | 0.069 | 0.111 | 0.291 | 0.076 | |
| Extreme drought year (DrY) | 2 | 4.277 *** | 6.144 *** | 0.950 *** | 6.171 *** | |
| Interaction P x DrY | 86 | 0.044 | 0.065 ** | 0.035 | 0.048 ** | |
| Error | 1368 | 0.035 | 0.043 | 0.039 | 0.030 | |
The level of significance is represented as follows: * p < 0.05; ** p < 0.01; *** p < 0.001.
Table 7.
ANOVA of drought parameters of silver fir provenances for the common extreme drought years during the analyzed period.
Table 7.
ANOVA of drought parameters of silver fir provenances for the common extreme drought years during the analyzed period.
| Trial | Drought Parameters | s2 | |||
|---|---|---|---|---|---|
| 2000 | 2002/2003 (1) | 2011 | 2012 | ||
| SACELE | Resistance | 0.143 * | 0.082 | 0.066 * | 0.064 |
| Recovery | 0.123 | 0.102 | 0.082 | 0.074 | |
| Resilience | 0.207 *** | 0.085 | 0.078 * | 0.098 * | |
| Rel. resilience | 0.071 | 0.044 | 0.039 | 0.044 | |
| DOMNESTI | Resistance | 0.060 | 0.072 ** | 0.067 ** | - |
| Recovery | 0.272 * | 0.023 | 0.050 * | - | |
| Resilience | 0.109 * | 0.048 * | 0.063 * | - | |
| Rel. resilience | 0.090 ** | 0.022 | 0.042 * | - | |
| BUCOVA | Resistance | 0.203 ** | 0.049 | 0.046 | - |
| Recovery | 0.251 | 0.217 | 0.059 | - | |
| Resilience | 0.159 * | 0.072 | 0.062 | - | |
| Rel. resilience | 0.084 | 0.058 | 0.051 | - | |
| STRAMBU BAIUT | Resistance | 0.085 | 0.035 | 0.053 | 0.033 |
| Recovery | 0.174 * | 0.078 | 0.060 | 0.081 | |
| Resilience | 0.054 | 0.043 | 0.032 | 0.044 | |
| Rel. resilience | 0.090 | 0.025 | 0.042 | 0.046 | |
| MOINESTI | Resistance | 0.027 | 0.061 * | 0.028 | |
| Recovery | 0.080 ** | 0.051 | 0.049 * | ||
| Resilience | 0.041 | 0.049 | 0.047 * | ||
| Rel. resilience | 0.050 * | 0.039 | 0.035 | ||
Explanatory note: (1) the year 2003 was extremely dry at Strambu Baiut only. The level of significance is represented as follows: * p < 0.05; ** p < 0.01; *** p < 0.001.
Table 8.
Phenotypic correlations between wood characters and drought parameters of silver fir provenances.
Table 8.
Phenotypic correlations between wood characters and drought parameters of silver fir provenances.
| Trial | Trait | RW | LW | EW | LWP | WD |
|---|---|---|---|---|---|---|
| SACELE | Resistance | 0.211 | 0.301 * | 0.097 | 0.188 | 0.262 |
| Recovery | 0.077 | 0.068 | 0.063 | −0.014 | 0.065 | |
| Resilience | 0.261 * | 0.320 * | 0.144 | 0.139 | 0.145 | |
| Rel. resilience | 0.129 | 0.091 | 0.100 | −0.053 | 0.096 | |
| DOMNESTI | Resistance | 0.301 * | 0.317 * | 0.255 | 0.121 | 0.137 |
| Recovery | 0.244 | 0.206 | 0.207 | 0.014 | −0.101 | |
| Resilience | 0.389 ** | 0.362 * | 0.337 * | 0.090 | 0.052 | |
| Rel. resilience | 0.295 * | 0.214 | 0.281 | −0.038 | −0.086 | |
| BUCOVA | Resistance | 0.094 | 0.513 *** | −0.242 | 0.465 ** | 0.094 |
| Recovery | 0.131 | 0.170 | 0.030 | 0.033 | −0.167 | |
| Resilience | 0.316 * | 0.698 *** | −0.115 | 0.473 ** | −0.123 | |
| Rel. resilience | 0.255 | 0.162 | 0.181 | −0.058 | −0.243 | |
| STRAMBU BAIUT | Resistance | −0.170 | −0.150 | −0.122 | −0.084 | 0.265 |
| Recovery | 0.225 | 0.252 | 0.106 | 0.126 | 0.027 | |
| Resilience | 0.130 | 0.223 | −0.004 | 0.119 | 0.249 | |
| Rel. resilience | 0.308 * | 0.402 ** | 0.106 | 0.231 | 0.043 | |
| MOINESTI | Resistance | 0.336 * | 0.240 | 0.329 * | −0.084 | 0.106 |
| Recovery | 0.126 | −0.095 | 0.249 | −0.365 * | 0.094 | |
| Resilience | 0.298 * | 0.109 | 0.363 * | −0.263 | 0.114 | |
| Rel. resilience | 0.110 | −0.055 | 0.198 | −0.262 | 0.068 |
The level of significance is represented as follows: * p < 0.05; ** p < 0.01; *** p < 0.001.
Table 9.
Climatic response models for radial growth of silver provenances. MTVEG—the mean temperature of the growing season, MPOCT-MAR—the mean precipitation from October of the previous year to March of the current year, MPJAN-MAR—the mean precipitation from January to March of the current year.
Table 9.
Climatic response models for radial growth of silver provenances. MTVEG—the mean temperature of the growing season, MPOCT-MAR—the mean precipitation from October of the previous year to March of the current year, MPJAN-MAR—the mean precipitation from January to March of the current year.
| Trial | Growth Response Model | Signif. | R2 | Partial R2 | |
|---|---|---|---|---|---|
| Temp. | Precip. | ||||
| Bucova | 10,632.399—41.943 MT2VEG + 0.154 MP2JAN-MAR | *** | 0.458 | 0.412 | 0.043 |
| Domnesti | 15,399.754—55.908 MT2VEG—46.317 MPOCT-MAR | *** | 0.496 | 0.475 | 0.154 |
| Moinesti | 8780.790—29.468 MT2VEG + 0.060 MP2JAN-MAR | *** | 0.372 | 0.292 | 0.017 |
| Sacele | 11,985.713—49.258 MT2VEG—41.649 MPOCT-MAR | *** | 0.415 | 0.326 | 0.093 |
| S. Baiut | 9154.895—36.635 MT2VEG + 17.794 MPOCT-MAR | *** | 0.503 | 0.326 | 0.062 |
The level of significance is represented as follows: *** p < 0.001.
Table 10.
Climatic response models for late wood percentage of silver provenances. MAT—the mean annual temperature, MTVEG—the mean temperature of the growing season, MAP—the mean annual precipitation amount, MTVEG—the mean precipitation, during the growing season.
Table 10.
Climatic response models for late wood percentage of silver provenances. MAT—the mean annual temperature, MTVEG—the mean temperature of the growing season, MAP—the mean annual precipitation amount, MTVEG—the mean precipitation, during the growing season.
| Trial | Growth Response Model | Signif. | R2 | Partial R2 | |
|---|---|---|---|---|---|
| Temp. | Precip. | ||||
| Bucova | 32.271 + 0.212 MAT2 + 0.027 MPVEG | *** | 0.091 | 0.092 | 0.008 |
| Domnesti | 26.927 + 0.087 MT2VEG + 0.052 MPVEG | *** | 0.222 | 0.206 | 0.111 |
| Moinesti | 30.329 + 0.069 MT2VEG − 0.002 MAP | *** | 0.136 | 0.066 | 0.006 |
| Sacele | 16.864 + 0.147 MT2VEG + 0.057 MPVEG | *** | 0.154 | 0.152 | 0.052 |
| S. Baiut | 32.411 + 0.081 MT2VEG − 0.003 MAP | *** | 0.150 | 0.058 | 0.011 |
The level of significance is represented as follows: * p < 0.05; ** p < 0.01; *** p < 0.001.
Publisher’s Note: MDPI stays neutral with regard to jurisdictional claims in published maps and institutional affiliations. |
© 2021 by the authors. Licensee MDPI, Basel, Switzerland. This article is an open access article distributed under the terms and conditions of the Creative Commons Attribution (CC BY) license (http://creativecommons.org/licenses/by/4.0/).
Share and Cite
MDPI and ACS Style
Mihai, G.; Alexandru, A.M.; Stoica, E.; Birsan, M.V. Intraspecific Growth Response to Drought of Abies alba in the Southeastern Carpathians. Forests 2021, 12, 387. https://0-doi-org.brum.beds.ac.uk/10.3390/f12040387
AMA Style
Mihai G, Alexandru AM, Stoica E, Birsan MV. Intraspecific Growth Response to Drought of Abies alba in the Southeastern Carpathians. Forests. 2021; 12(4):387. https://0-doi-org.brum.beds.ac.uk/10.3390/f12040387
Chicago/Turabian StyleMihai, Georgeta, Alin Madalin Alexandru, Emanuel Stoica, and Marius Victor Birsan. 2021. "Intraspecific Growth Response to Drought of Abies alba in the Southeastern Carpathians" Forests 12, no. 4: 387. https://0-doi-org.brum.beds.ac.uk/10.3390/f12040387
Note that from the first issue of 2016, this journal uses article numbers instead of page numbers. See further details here.