
The United States’ Implementation of the Montréal Process Indicator of Forest Fragmentation


1
Forestry Sciences Laboratory, USDA Forest Service, Research Triangle Park, NC 27709, USA
2
Inventory, Monitoring, and Assessment Research, USDA Forest Service, Washington, DC 20250, USA
*
Author to whom correspondence should be addressed.
Forests 2021, 12(6), 727; https://0-doi-org.brum.beds.ac.uk/10.3390/f12060727
Submission received: 17 May 2021
/
Revised: 27 May 2021
/
Accepted: 2 June 2021
/
Published: 3 June 2021
(This article belongs to the Special Issue Sustainable Forest Management Criteria and Indicators)
Abstract
:The United States’ implementation of the Montréal Process indicator of forest fragmentation presents a case study in the development and application of science within a criteria and indicator framework to evaluate forest sustainability. Here, we review the historical evolution and status of the indicator and summarize the latest empirical results. While forest cover fragmentation is increasing, the rate of increase has slowed since 2006. Most of the fragmentation in the western United States is associated with changes in semi-natural land cover (e.g., shrub and grass) while most of the eastern fragmentation is associated with changes in agriculture and developed (including roads) land covers. Research conducted pursuant to indicator implementation exemplifies the role of a criteria and indicator framework in identifying policy-relevant questions and then focusing research on those questions, and subsequent indicator reporting exemplifies the value of a common language and developed set of metrics to help bridge the gaps between science and policy at national and international scales.
1. Introduction
For nearly three decades, criteria and indicators (C&I) have been used to define forest sustainability and to monitor its change at local to international scales. Structured C&I allow us to move quickly between a general summary of forest conditions as they relate to sustainability on one hand, and focused technical discussion of specific indicators on the other. From a policy perspective, C&I help to bridge the perennial gap between science and policy in forest management. From a science perspective, a C&I framework provides impetus for developing policy-relevant lines of forest research. More broadly, organizing knowledge into a common language and set of metrics is one key to achieving natural resource sustainability [1], and a C&I framework facilitates communication and discussion of science findings among diverse groups of stakeholders. Moreover, the emphasis C&I place on concise, replicable measures helps focus research on the development of compact strategies for summarizing complex phenomena for broader public edification.
International efforts to harmonize C&I reporting of sustainable forest management were stimulated by adoption of Agenda 21 [2] at the 1992 United Nations Conference on Environment and Development (the “Earth Summit”). Brand [3] reviewed the subsequent development of forest C&I within emerging regional frameworks such as the Helsinki Process, the Montréal Process, and the Tarapoto Proposal, concluding that significant advances had been made in gauging sustainability as an integrated social-economic-ecological outcome, but there remained important questions related to C&I definitions, harmonization, and managing for regional forest sustainability at the level of working forests.
The United States is one of 12 countries participating in the Montréal Process which together represent 90% of the world’s temperate and boreal forests, 49% of all forests, 49% of global roundwood production, and 31% of the world’s population [4]. Currently comprised of 54 indicators arranged under 7 criteria and spanning the ecological, social, economic, and institutional dimensions of forest sustainability, the Montréal Process C&I framework is flexibly applied by member countries in line with their respective forest conditions, information needs, and reporting capabilities. Chandran and Innes [5] reviewed country-level implementations of the Montréal Process, identified key obstacles and opportunities to achieve the common goals, and concluded that “...despite each country’s specific situation, it is possible and useful to agree and adhere to a common set of criteria and indicators...” Affirmation of that principle and other tenets of sustainable forest management has preserved the relevance of the Montréal Process in the United States for almost three decades.
The objective of this paper is to examine the United States’ implementation of the Montréal Process indicator of forest fragmentation and how it exemplifies the useful features of a C&I framework. The term “fragmentation” refers generally to the loss, diminution, and/or separation of forest parcels. In the original Montréal Process framework [6], “fragmentation of forest types” was one of five indicators of “ecosystem diversity” addressing the criterion “conservation of biological diversity.” The rationale was that fragmentation may disrupt ecological processes and habitat availability, ultimately contributing to the potential loss of plant and animal species. While recognizing the relevance of fragmentation measures to forest sustainability, initial and subsequent formulations of the fragmentation indicator in the Montréal Process framework remained general, and specific analysis techniques were not stipulated, leaving an open field for indicator development. Concurrent with an evolving rationale to also consider the causes of fragmentation as well as its relationships to other criteria and indicators [4], important changes in the United States’ implementation have resulted from lessons learned, improved data streams, and new reporting requirements. We summarize current reporting practice for this indicator with illustrations from the most recent United States’ reporting effort and conclude with a discussion of the utility of the indicator for promoting forest sustainability.
Implementing the Fragmentation Indicator
With the acceptance of the Montréal Process C&I [7], forest sustainability reporting in the United States became the responsibility of the Department of Agriculture Forest Service (https://www.fs.fed.us/research/sustain/; accessed on 17 May 2021). The Montréal Process First Approximation Report [8] noted that fragmentation reporting was problematic for all countries because, among other things, there was no consensus on what to measure. The United States’ view [9] was that more than one indicator was needed, that input data should come from maps (rather than point-based samples), and that fragmentation was best understood by examining temporal trends (rather than by comparison to baselines). The U.S. Roundtable on Sustainable Forests was convened in 1998 to coordinate, among other things, a technical working group charged with developing recommendations for the fragmentation indicator [10]. The resulting Indicator Analysis Report, prepared by the Federal Geographic Data Committee (FGDC) Sustainable Forest Data Working Group, applied a “patch-mosaic” concept [11] and recommended four indicators which are relevant to forest wildlife habitat. The four indicators were average forest patch size, amount of forest edge, inter-patch distance, and landscape contrast [12,13]. The Working Group further recommended measuring the indicators within geographic tiles superimposed on the best available land cover maps developed from remotely sensed images. That report and ongoing FGDC discussions [14] revealed tensions between a biocentric focus (wildlife habitat) versus an anthropocentric focus (roads, ownerships), and between precision (e.g., relevance to a particular species) versus generality (e.g., relevance to a broad range of ecosystem services). Additionally, the Working Group’s recommendation of four distinct indicators highlighted the tension between the parsimony sought by the C&I approach (one indicator) and the amount of information needed to evaluate complex phenomena.
The FGDC recommendations were implemented for the 2003 National Report on Sustainable Forests [15] using the 1992 National Land Cover Database (NLCD) map, a 30 m resolution land cover map of the conterminous US derived from LandSat images [16]. A supporting Data Report [13] documented the translation of the FGDC recommendations into specific measurement procedures, summarized the results, critiqued the recommendations, and suggested improvements. A companion manuscript [17] highlighted four issues: (1) it was a single-scale approach to an inherently multi-scale phenomenon; (2) the indicators could not be interpreted reliably without also considering the absolute area of forest; (3) there were no thresholds or baselines for comparisons; (4) the patch-mosaic concept was not useful where forest was the dominant land cover and therefore did not form discrete patches.
Ultimately the format of the 2003 National Report allowed only one page per indicator and therefore the full suite of measurements could not appear in the main report. Instead, the Data Report became a supplement to the main report, and a separate analysis of the same data [18] was adapted for the one-page version. Figure 1 illustrates the reporting of a single metric called “forest area density”—roughly, how much forest is surrounded by how much other forest—which was measured and mapped at multiple measurement scales. Specifically, the percentage of forest within a fixed-area neighborhood (“landscape”) of each forest pixel was compared to minimum threshold values of 60, 90, and 100 percent to identify the forest pixels that were “dominant”, “interior”, or “core”, respectively. Measurement scales were varied by using several neighborhood sizes such that a given forest pixel could be, for example, “core” at a small scale and “dominant” at a larger scale. The reporting format thus accounted for the well-known scale and observer dependence of fragmentation. Referring to Figure 1, the interpretation is that if there was no fragmentation, then all forest area would meet all forest area density thresholds at all measurement scales (landscape sizes). Fragmentation was therefore relative to a baseline corresponding to a completely forested condition and deviations from the 100 percent forested baseline arose from natural (and endemic) fragmentation as well as anthropogenic fragmentation. Supporting manuscripts addressed down-scaling results to the forest type level [19] and accounting for the fragmenting effect of roads that were not well represented on the land cover map [20].
In the second edition of the Montréal Process C&I, the indicator name was changed to “fragmentation of forests” [21]. Concurrent discussion [22] acknowledged a continuing lack of consensus among member countries, invited alternate approaches based on the causes or consequences of fragmentation, and focused attention on changes resulting from human intervention. The United States 2010 National Report on Sustainable Forests [23] updated the one-page version of 2003 National Report using the 2001 NLCD land cover map [24] but fragmentation change could not be evaluated because the underlying land cover mapping procedures were not the same as those used for the 1992 map.
The 2010 National Report represented a turning point in fragmentation reporting in the United States. By then, it was clear that an unambiguous characterization of fragmentation per se was prerequisite to any meaningful analysis of the causes or consequences of fragmentation [25], and that the forest area density metric was arguably the best single indicator of forest fragmentation that could be applied to a land cover map [26]. Analysis of temporal changes since 2001 became possible because, starting with the 2006 NLCD map [27], each release of later NLCD land cover maps included updated and comparable versions of the earlier maps. The technical problem became one of taking advantage of a spatially explicit and broad-scale approach to address a variety of more specific and local questions about fragmentation.
In addition to Montréal Process reporting, technical results were increasingly presented in other USDA Forest Service inventory and assessment reports. For example, the characterization and interpretation of fragmentation were improved by (1) deploying additional indicators derived from the same land cover maps in the 2010 Resources Planning Act (RPA) assessment [28,29]; (2) integrating maps of fragmentation with plot data from the United States’ Forest Inventory and Analysis (FIA) program [30]; (3) developing techniques to assess temporal changes with comparable land cover maps [31]. The first report of fragmentation change using comparable maps from 2001 and 2006 appeared in an FIA “forest facts” brochure [32]. An interim update of the 2010 RPA assessment included analyses of change from 2001 to 2011 and fragmentation of FIA forest types in 2006 [33].
Some progress has also been made on characterizing the “proximate causes” of fragmentation by examining forest edge typology [30] and the relationships between forest change, landscape change, and causal factors [34,35,36]. Related research showed that the forest area density metric supports inferences about patch-level forest characteristics such as edge shape, interior/exterior context, and inter-patch distance [37,38,39] as well as interpretations of landscape-level forest connectedness and fragility [26,40,41]. Less progress has been made on interpreting the national consequences of fragmentation, which clearly required aggregating many detailed investigations of consequences in specific circumstances. The latter has been problematic because many wildlife species as well as criteria other than biodiversity depend on the spatial arrangement of forest but in different ways. More importantly from a biodiversity perspective, the underlying rationale of the Montréal Process fragmentation indicator—that fragmentation per se is necessarily bad for biodiversity—has been challenged seriously [42]. This observation highlights the fact that not all indicators can be seen in dichotomous terms of “good” and “bad” but may still provide information essential to understanding and sustaining complex ecosystems. In any case, the indicator as implemented provides a common language and quantitative anchor for the incorporation of fragmentation in different settings and analyses [26].
2. Results: What Does the Indicator Tell Us
With the recent advent of comparable land cover maps at five-year intervals from 2001 to 2016 [43], the latest United States’ National Report for the Montréal Process updates the fragmentation indicator using the previous format (Figure 2 and Figure 3) supplemented by a tabular summary of the changing rate of fragmentation over time (Table 1) with a supporting analysis of forest edge typology where forests are actually fragmented (Figure 4). The additional content is possible, in part, because the one-page limit maintained in earlier National Reports has been relaxed.
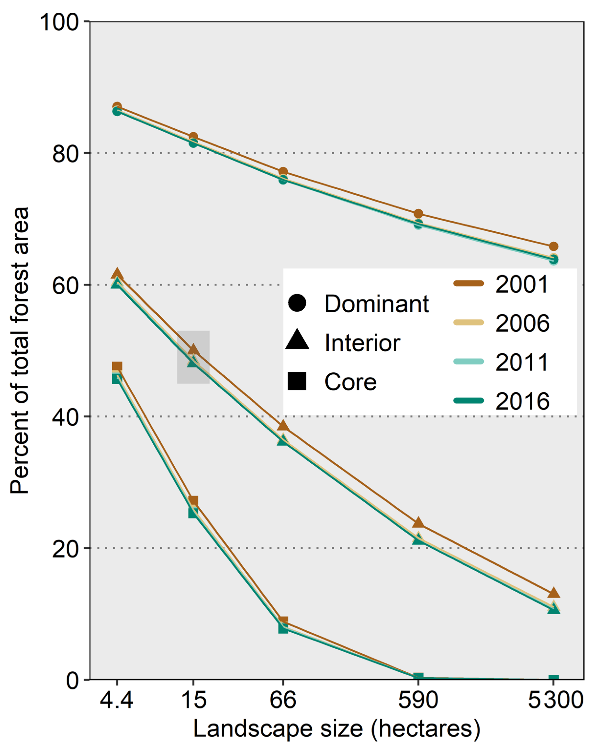
Because forested places tend to be clustered in proximity to one another, forest is usually the dominant land cover in these areas. Thus, for landscapes up to 5300 ha in size, more than 60 percent of all forest area is in forest-dominated landscapes (Figure 2; “Dominant”). However, because larger blocks of forest land are increasingly subject to inclusion of at least some non-forest land (natural or anthropogenic), the percentage of forest land that is relatively unfragmented decreases rapidly as landscape size increases from 4.4 ha to 5300 ha (Figure 2; “Interior”). Fragmentation is so extensive that only 8 percent of forest land occurs in 66 ha landscapes that are completely forested (Figure 2; “Core”).
Between 2001 and 2016, the conterminous United States experienced a 2.6 percent net loss of total forest land cover area (Table 1). In comparison, the net loss of interior forest was between 5.0 and 20.7 percent and increased with increasing landscape size (Table 1). Interior forest was lost at higher rates than total forest because the forest losses tended to occur in core and interior areas while the forest gains tended to occur in dominant and subdominant areas [44]. The rates of forest cover loss and fragmentation decreased during the three five-year intervals between 2001 and 2016 but the rate of interior forest loss continued to exceed that of total forest cover (Table 1).
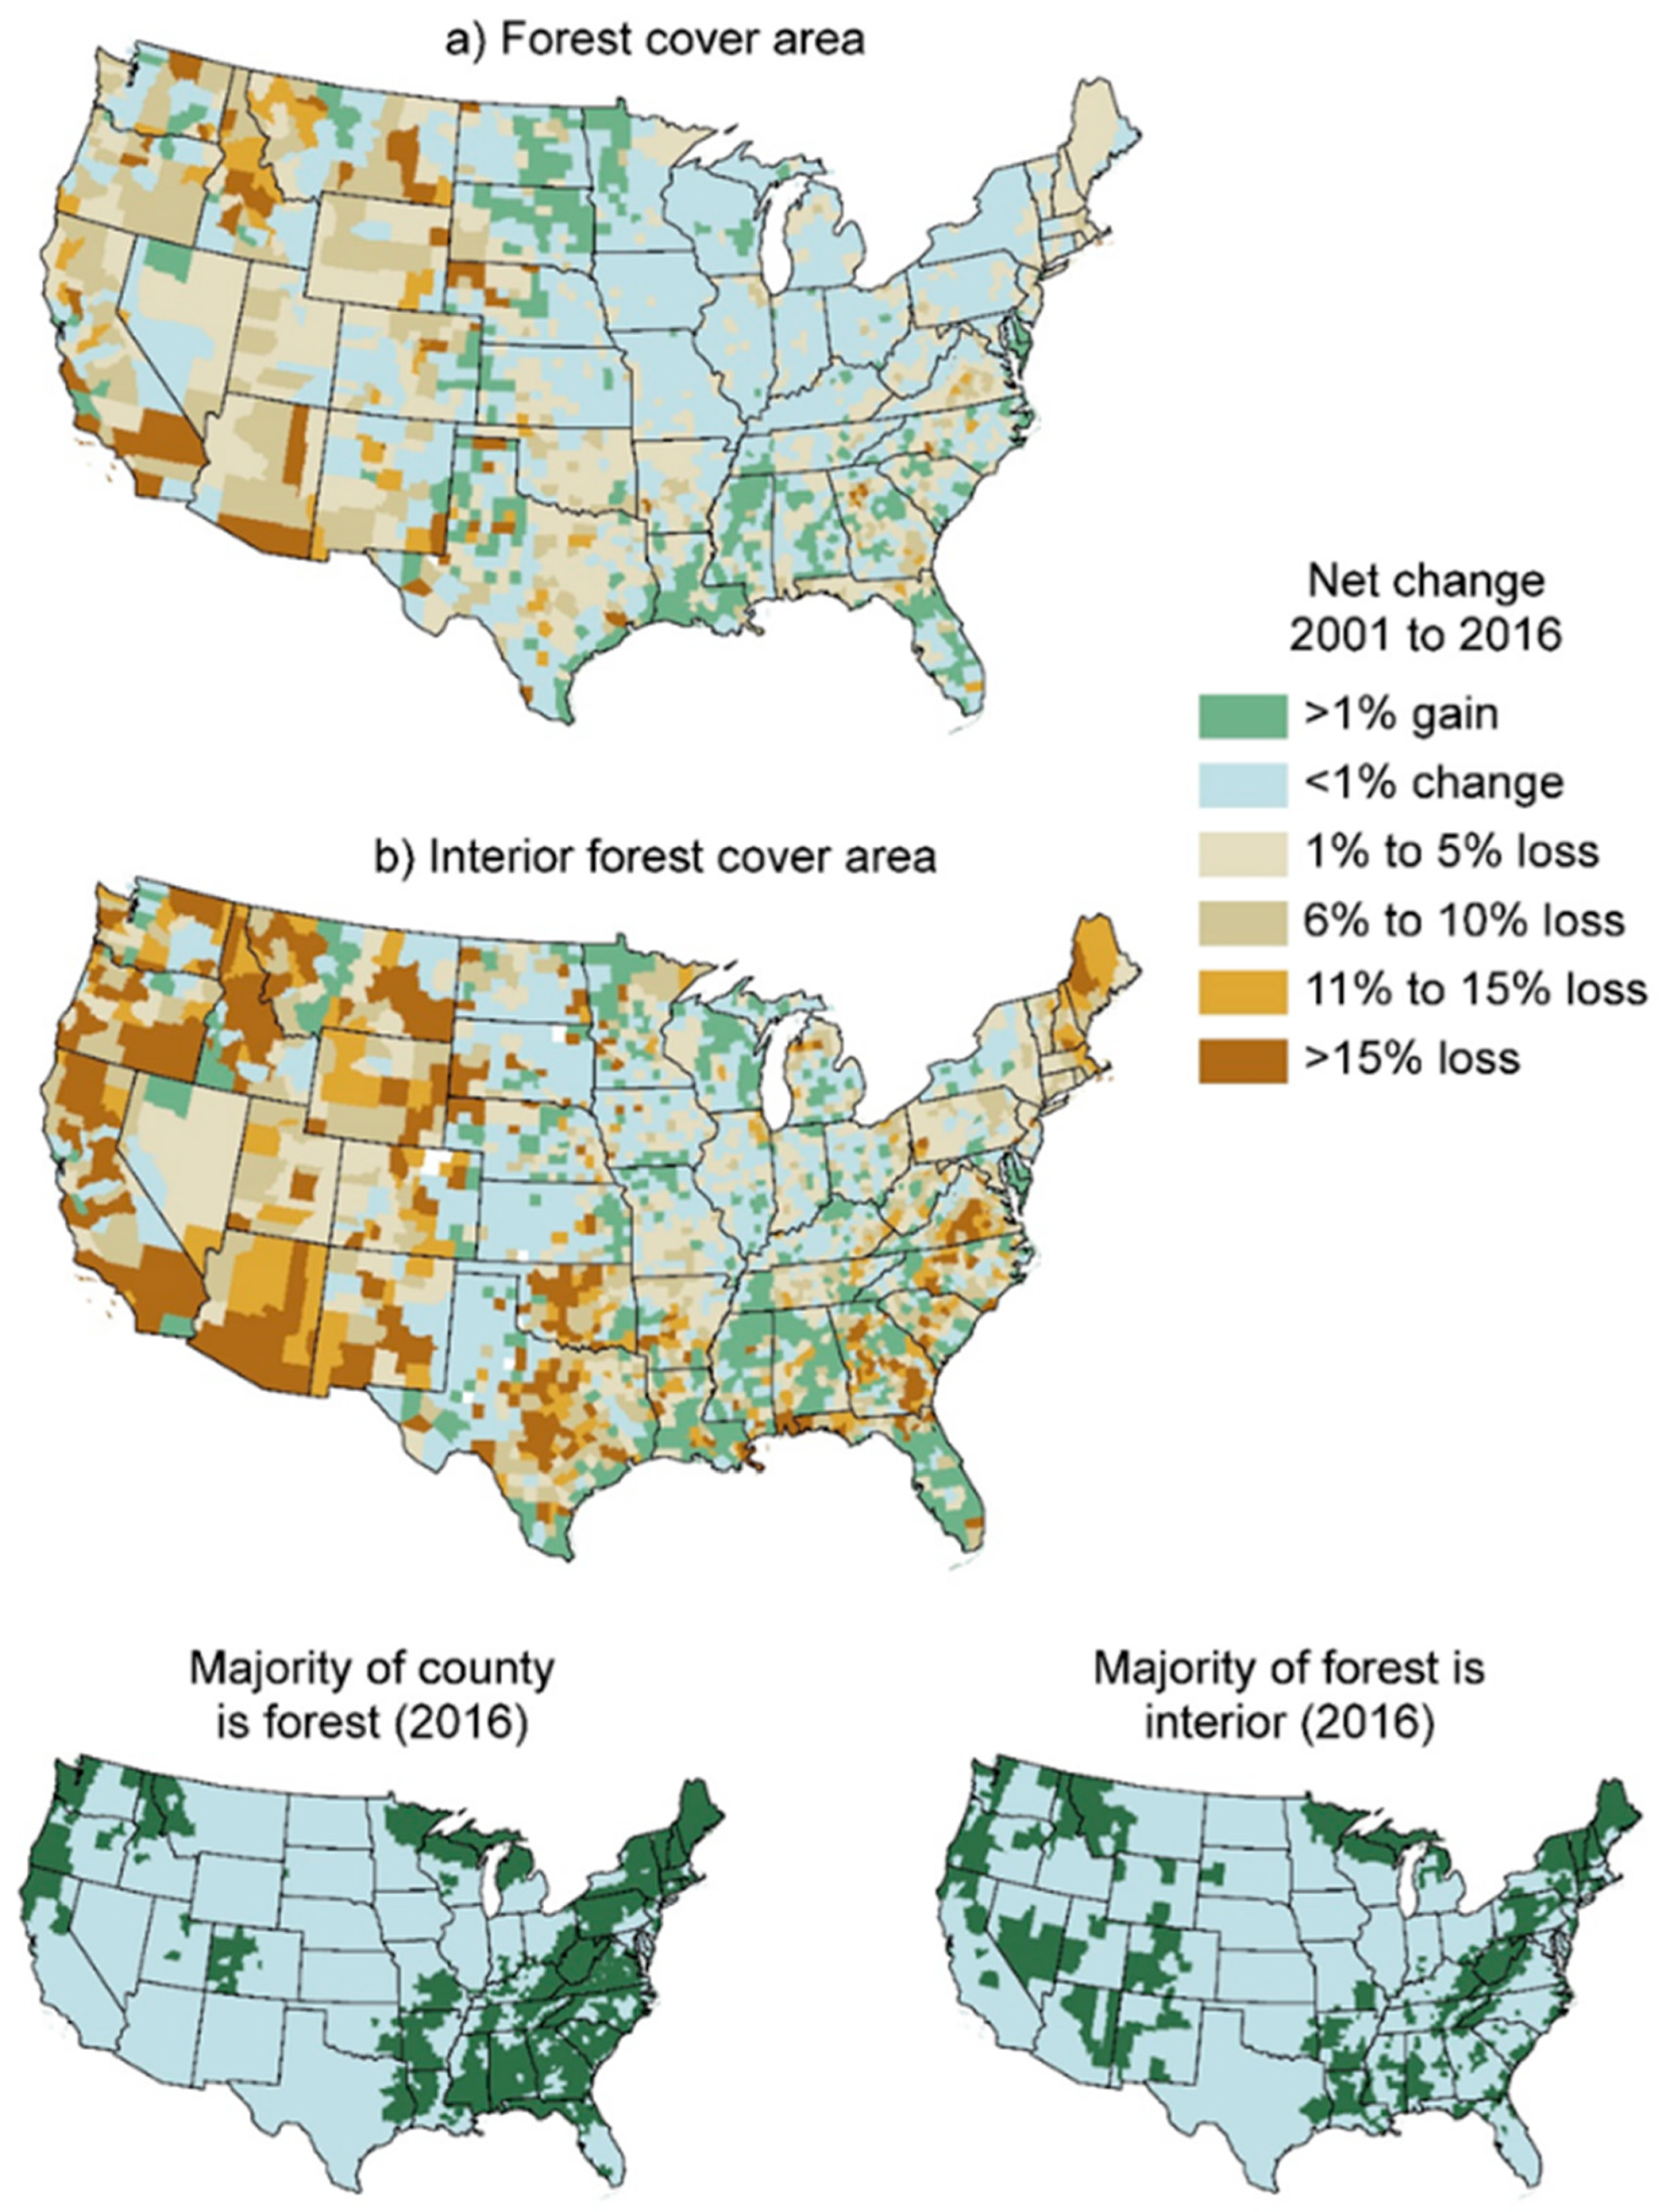
Shifting to a county-level analysis, for counties experiencing forest loss, relatively small net reductions in total forest area from 2001 to 2016 (Figure 3a) translated to larger net reductions in interior forest area, similar to the national-level findings (Figure 3b). There was a net loss of interior forest in 2054 of all 3109 counties and 334 counties exhibited net losses larger than 15 percent. Relatively few counties experienced increases in interior forest area, and interior forest area was reduced even in some counties that experienced increases in total forest area. In forest-dominated areas of the Nation, interior forest cover losses greater than 5 percent were typical in the West but less common in the East where many counties exhibited net gains of interior forest cover. Interior forest cover percent gains and losses were commonly large in the intermountain and Great Plains areas, but those areas had relatively low total forest cover and interior forest cover, and therefore had little influence on national statistics.
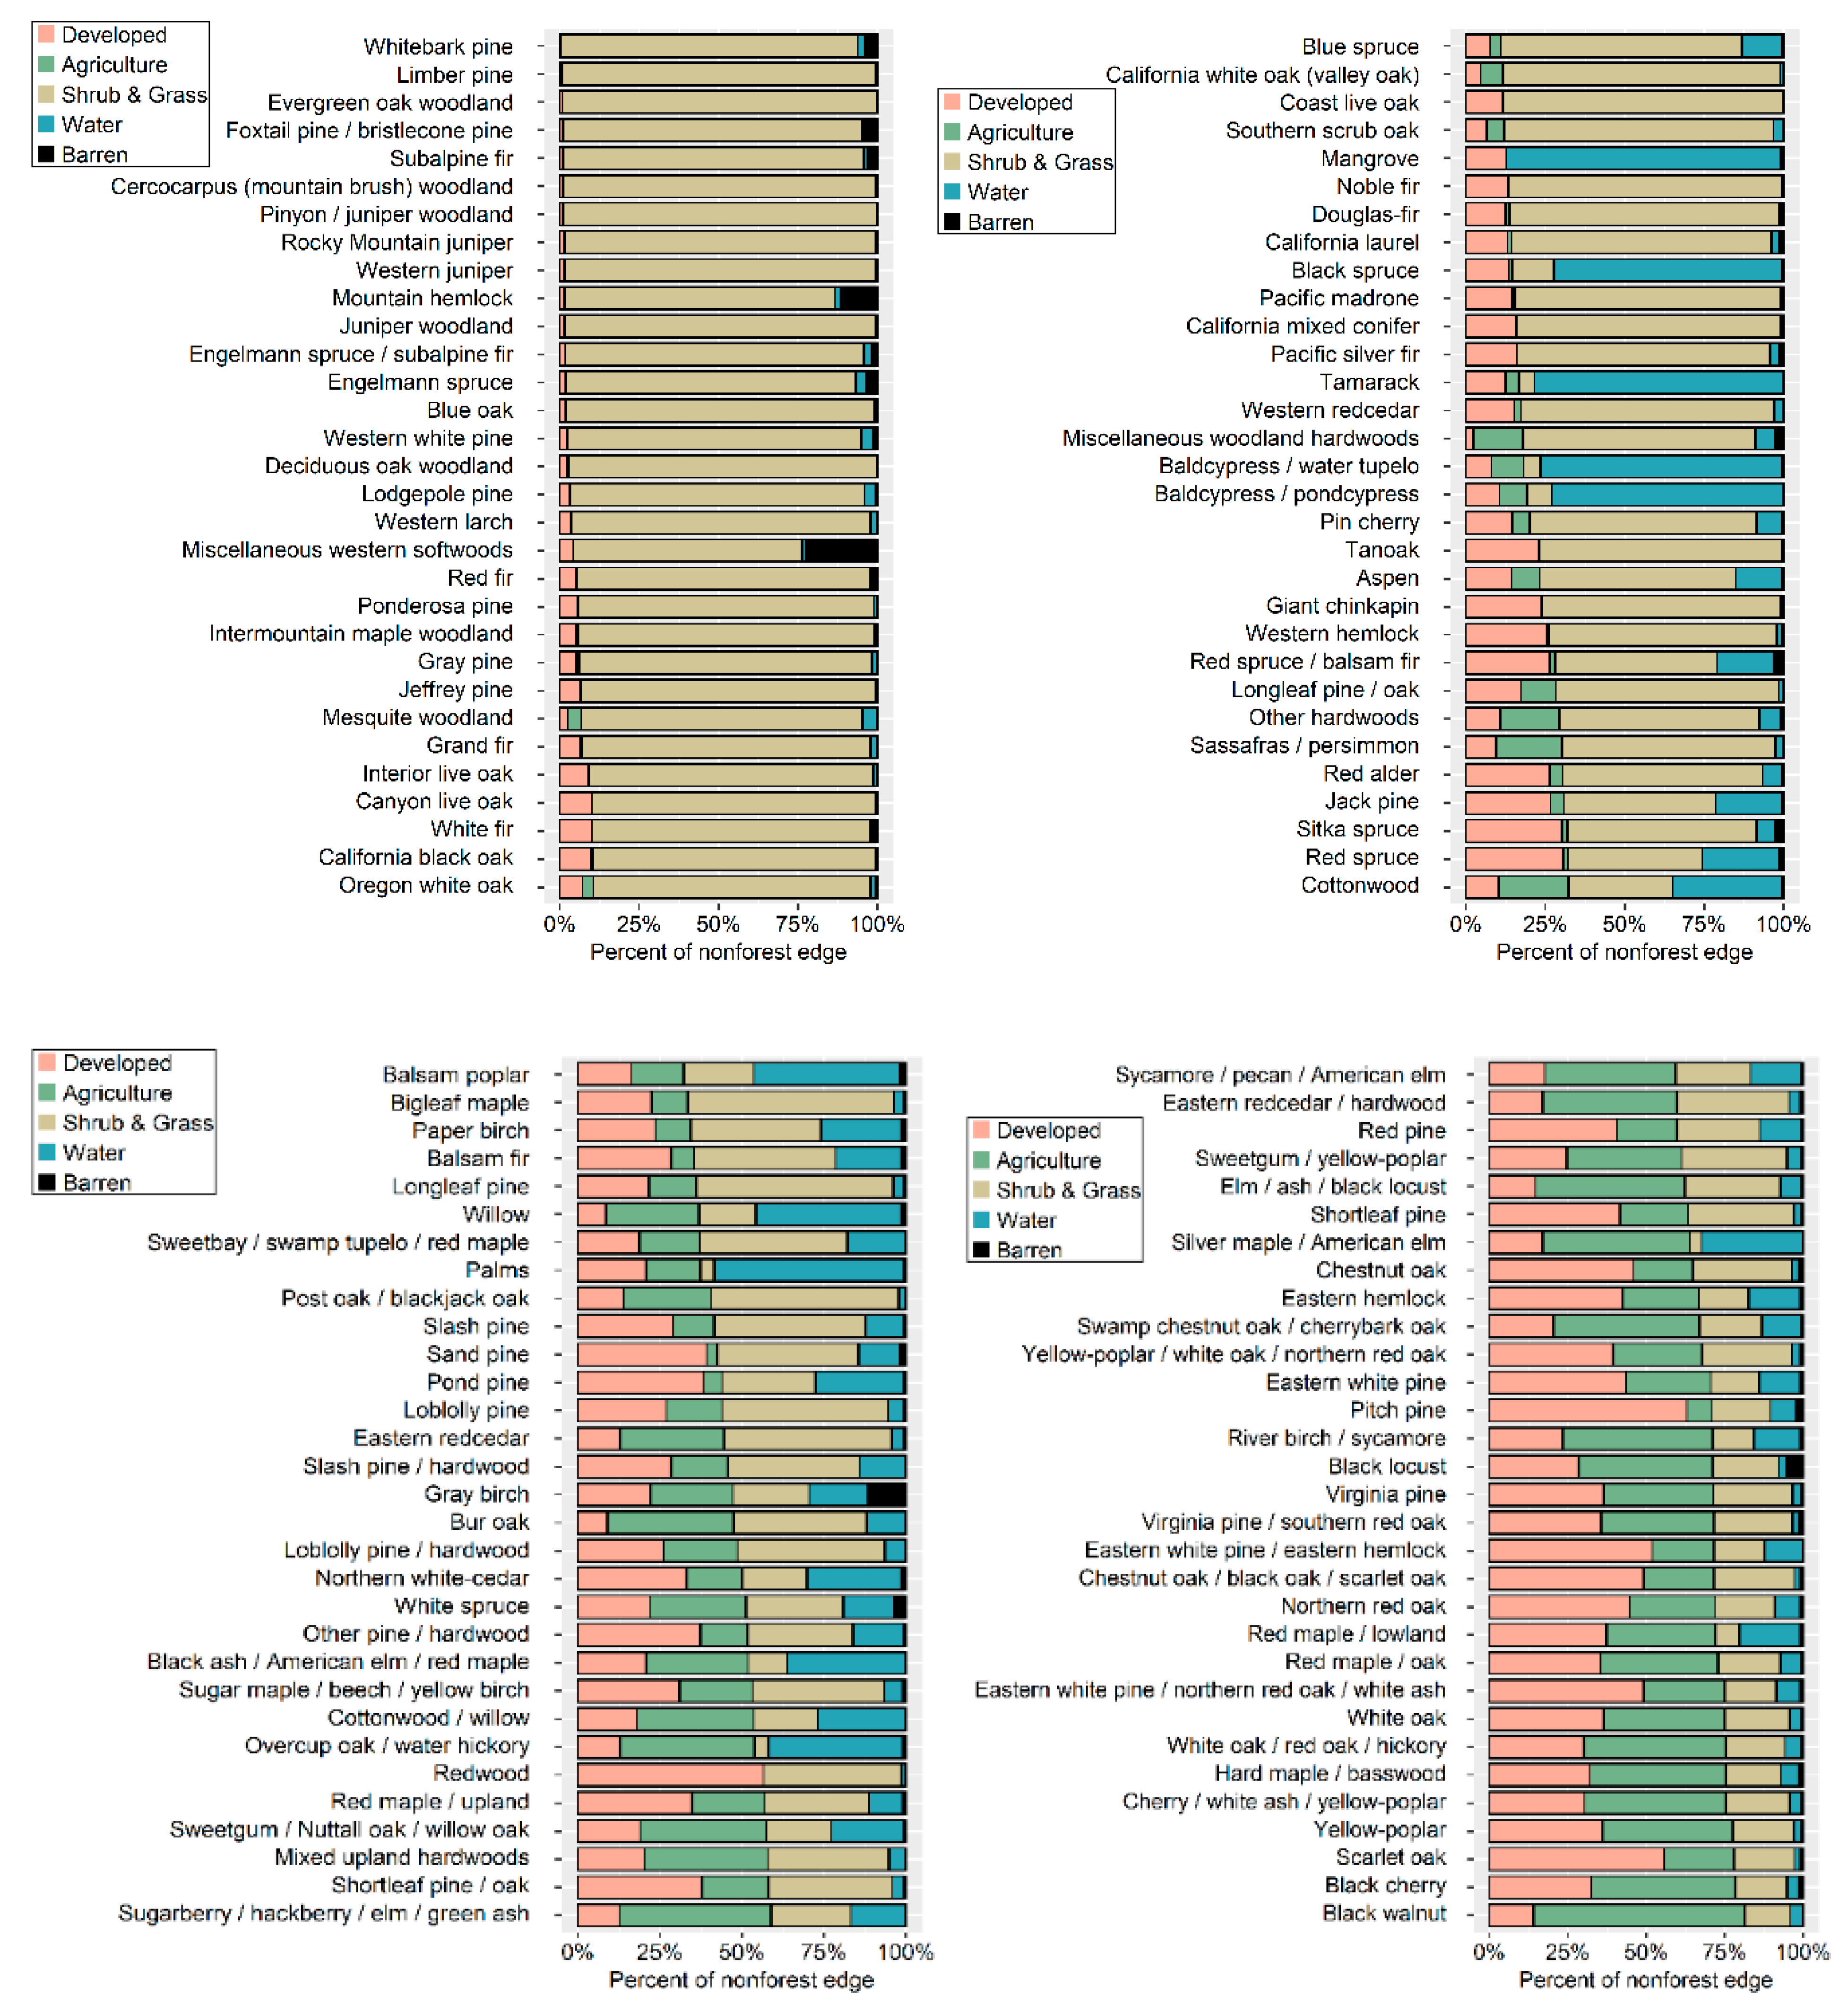
An analysis of forest edge typology [30] has been added as an appendix to the most recent reporting for the Montréal Process fragmentation indictor, providing an example of how indicators may be adjusted and enhanced over time. The analysis addresses differences in the proximate causes of fragmentation where there is evidence of fragmentation. Briefly, individual FIA forest inventory plots are attributed with the types of forest edges that occur in the surrounding neighborhood and FIA statistical estimators are used to summarize the results by forest type (Figure 4). Combining information in that way only characterizes the patterns in the vicinity of a given forest type, but still comes closer to the original Montréal Process definition of the indicator (i.e., as “fragmentation of forest types”). Furthermore, forest edge typology does not characterize the magnitude of fragmentation for different forest types, instead it describes the non-forest cover near FIA plots where the forest cover is fragmented. The results reflect well known regional differences such as the tendencies for forest edge (where it exists) to be associated with shrub and grass land cover in the west (i.e., western forest types), with agriculture and developed land cover in the east (eastern forest types), and with water in riparian or coastal areas (riparian forest types). This information helps to understand the relative importance of different fragmenting agents for different forest types. It also reveals insights such as the large proportion of the forest-developed edge in some relatively remote western forest types (e.g., Sitka spruce and Redwood) and eastern types typical of poor building sites (e.g., Black spruce and Mangrove), which results from roads (a type of development) traversing otherwise unfragmented forests [30]. Still under consideration for the National Report are similar analyses (not shown here) of FIA plots in relation to nearby “core” forest cover to quantify the magnitudes of fragmentation at the forest type level [45], and analyses of plots in relation to nearby “interfaces” with agriculture and developed land to help identify future threats resulting from land use changes [46].
3. Conclusions
The United States’ approach to reporting forest fragmentation in the Montréal Process has evolved from the original biocentric focus on wildlife habitat to a focus on assessing fragmentation per se (i.e., as a spatial property of forest) as a necessary step to facilitate interpretations of the same indicator in a variety of contexts including the causes and consequences of the fragmentation. Along the way, the results have fostered connections between high-level policy issues such as “keeping forests as forest” [47] and the underlying science to address those issues, thus helping to bridge the gap between science and policy in sustainable forest management. The role of the Montréal Process as an impetus for developing policy-relevant lines of forest research is evidenced by institutional support for research that was targeted specifically at improving the forest fragmentation indicator. The “common language” aspect of our implementation is exemplified by closelyrelated applications of the forest area density metric in the Forest Europe C&I framework [48,49] and in FAO global forest reporting [50,51]. The potential for integration with other relevant data may be fully realized by the recent deployment of this and other indicators of forest spatial patterns on the FAO SEPAL cloud computing platform (https://sepal.io; accessed on 17 May 2021). Despite the progress made, the United States’ Montréal Process reporting still contains significant gaps, most notably the lack of full geographic coverage of Alaska, Hawaii, and US territories. Looking ahead, the method is equally applicable to other input data and the remarkable improvements in mapping historical forest land use and cover [52,53] as well as potential future forests [54] will undoubtedly improve the scope and utility of forest fragmentation reporting in the United States.
Author Contributions
K.R. conceived the ideas and wrote most of the manuscript. G.R. wrote portions of the manuscript. Both authors participated equally in review and revision. All authors have read and agreed to the published version of the manuscript.
Funding
This research received no external funding.
Acknowledgments
The preparation of this manuscript was funded by the Inventory, Monitoring, and Assessment Research Staff, USDA Forest Service.
Conflicts of Interest
The authors declare no conflict of interest.
References
- Ostrom, E. A general framework for analyzing sustainability of social-ecological systems. Science 2009, 325, 419–422. [Google Scholar] [CrossRef] [PubMed]
- UN Department of Public Information. Agenda 21: Programme of Action for Sustainable Development, Rio Declaration on Environment and Development, Statement of Forest Principles: The Final Text of Agreements Negotiated by Governments at the United Nations Conference on Environment and Development (UNCED), 3 to 14 June 1992, Rio de Janeiro, Brazil; UN: New York, NY, USA, 1993; 294p, ISBN 9211005094. Available online: https://sustainabledevelopment.un.org/content/documents/Agenda21.pdf (accessed on 21 March 2021).
- Brand, D.G. Criteria and indicators for the conservation and sustainable management of forests: Progress to date and future directions. Biomass Bioenergy 1997, 13, 247–253. [Google Scholar] [CrossRef]
- Montréal Process Liaison Office. The Montréal Process Criteria and Indicators for the Conservation and Sustainable Management of Temperate and Boreal Forests. Fifth Edition. 2015. Available online: https://www.montrealprocess.org/documents/publications/techreports/MontrealProcessSeptember2015.pdf (accessed on 21 March 2021).
- Chandran, A.; Innes, J. The state of the forest: Reporting and communicating the state of forests by Montreal Process countries. Int. For. Rev. 2014, 16, 103–111. [Google Scholar] [CrossRef]
- Montréal Process Liaison Office. Criteria and Indicators for the Conservation and Sustainable Management of Temperate and Boreal Forests. 1995. Available online: https://www.montrealprocess.org/documents/publications/techreports/1995santiago_e.pdf (accessed on 21 March 2021).
- Anonymous. Sustaining the World’s Forests: The Santiago Agreement. J. For. 1995, 93, 18–21. [Google Scholar] [CrossRef]
- Montréal Process Liaison Office. First Approximation Report of the Montréal Process. 1997. Available online: https://www.montrealprocess.org/documents/publications/techreports/FirstApproxReport1997_e.pdf (accessed on 21 March 2021).
- Anonymous. Report of the United States on the Criteria and Indicators for the Sustainable Management of Temperate and Boreal Forests 1997. (from http://web.archive.org/). Available online: http://www.fs.fed.us:80/global/pub/links/report/candi.htm (accessed on 21 March 2021).
- Montréal Process Liaison Office. The Montréal Process: Year 2000 Progress Report. 2000. Available online: https://www.montrealprocess.org/documents/publications/techreports/2000progressreport_e.pdf (accessed on 21 March 2021).
- Forman, R.T.T.; Godron, M. Patches and structural components for a landscape ecology. BioScience 1981, 31, 733–740. [Google Scholar] [CrossRef]
- FGDC (Federal Geographic Data Committee). FGDC Sustainable Forest Data Working Group. Notes of Meeting 4 May 2001. (from http://web.archive.org/). 2001. Available online: http://www.pwrc.usgs.gov/brd/SFD010504.htm (accessed on 21 March 2021).
- USDA Forest Service. Data Report: A Supplement to the National Report on Sustainable Forests—2003; FS-766A; USDA Forest Service: Washington, DC, USA, 2004. Available online: https://www.fs.fed.us/research/sustain/docs/national-reports/2003/data/summariesandsupporting%20analyses.htm (accessed on 21 March 2021).
- FGDC (Federal Geographic Data Committee). FGDC Sustainable Forest Data Working Group. Notes of Meeting 21 June 2001. (from http://web.archive.org/). 2001. Available online: http://www.pwrc.usgs.gov/brd/SFD010621.htm (accessed on 21 March 2021).
- USDA Forest Service. National Report on Sustainable Forests—2003; FS-766; USDA Forest Service: Washington, DC, USA, 2004; 139p. Available online: https://www.fs.fed.us/research/sustain/2003-sustainability.php (accessed on 21 March 2021).
- Vogelmann, J.E.; Howard, S.M.; Yang, L.; Larson, C.R.; Wylie, B.K.; Van Driel, N. Completion of the 1990s national land cover data set for the conterminous United States from Landsat Thematic Mapper data and ancillary data sources. Photogramm. Eng. Remote Sens. 2001, 67, 650–662. [Google Scholar]
- Riitters, K.H.; Wickham, J.D.; Coulston, J.W. A Preliminary Assessment of Montréal Process Indicators of Forest Fragmentation for the United States. Environ. Monit. Assess. 2004, 91, 257–276. [Google Scholar] [CrossRef] [PubMed]
- Riitters, K.H.; Wickham, J.D.; O’Neill, R.V.; Jones, K.B.; Smith, E.R.; Coulston, J.W.; Wade, T.G.; Smith, J.H. Fragmentation of Continental United States Forests. Ecosystems 2002, 5, 815–822. [Google Scholar] [CrossRef]
- Riitters, K.H.; Coulston, J.W.; Wickham, J.D. Localizing national fragmentation statistics with forest type maps. J. For. 2003, 101, 18–22. [Google Scholar] [CrossRef]
- Riitters, K.; Wickham, J.; Coulston, J. Use of Road Maps in National Assessments of Forest Fragmentation in the United States. Ecol. Soc. 2004, 9, 13. Available online: http://www.ecologyandsociety.org/vol9/iss2/art13/ (accessed on 21 March 2021). [CrossRef]
- Montréal Process Liaison Office. Montréal Process Criteria and Indicators. Second Edition (Poster). 2007. Available online: https://www.montrealprocess.org/documents/publications/techreports/2009p_1-3.pdf (accessed on 21 March 2021).
- Montréal Process Liaison Office. Technical Notes on Implementation of the Montréal Process Criteria and Indicators. Third Edition. 2009. Available online: https://www.montrealprocess.org/documents/publications/techreports/2009p_2.pdf (accessed on 21 March 2021).
- USDA Forest Service. National Report on Sustainable Forests—2010; FS-979; USDA Forest Service: Washington, DC, USA, 2011; 212p. Available online: https://www.fs.fed.us/research/sustain/sustainability-reports.php (accessed on 17 May 2021).
- Homer, C.; Huang, C.; Yang, L.; Wylie, B.; Coan, M. Development of a 2001 National Land-Cover Database for the United States. Photogramm. Eng. Remote. Sens. 2004, 70, 829–840. [Google Scholar] [CrossRef] [Green Version]
- Bogaert, J. Lack of Agreement on Fragmentation Metrics Blurs Correspondence between Fragmentation Experiments and Predicted Rffects. Conserv. Ecol. 2003, 7, r6. Available online: http://0-www-jstor-org.brum.beds.ac.uk/stable/26271933 (accessed on 21 March 2021).
- Riitters, K. Pattern metrics for a transdisciplinary landscape ecology. Landsc. Ecol. 2018, 34, 2057–2063. [Google Scholar] [CrossRef] [Green Version]
- Fry, J.A.; Xian, G.; Jin, S.M.; Dewitz, J.A.; Homer, C.G.; Yang, L.M.; Barnes, C.A.; Herold, N.D.; Wickham, J.D. Completion of the 2006 National Land Cover Database for the conterminous United States. Photogramm. Eng. Remote Sens. 2011, 108, 858–859. [Google Scholar]
- Riitters, K.H. Spatial Patterns of Land Cover in the United States: A Technical Document Supporting the Forest Service 2010 RPA Assessment; Gen. Tech. Rep. SRS-136; Department of Agriculture Forest Service, Southern Research Station: Asheville, NC, USA, 2011; 64p. [CrossRef]
- USDA Forest Service. Future of America’s Forest and Rangelands: Forest Service 2010 Resources Planning Act Assessment; Gen. Tech. Rep. WO-87; USDA Forest Service: Washington, DC, USA, 2012; 198p.
- Riitters, K.H.; Coulston, J.W.; Wickham, J.D. Fragmentation of forest communities in the eastern United States. For. Ecol. Manag. 2012, 263, 85–93. [Google Scholar] [CrossRef]
- Wickham, J.D.; Riitters, K.H.; Wade, T.G.; Homer, C. Temporal change in fragmentation of continental US forests. Landsc. Ecol. 2008, 23, 891–898. [Google Scholar] [CrossRef]
- Oswalt, S.N.; Smith, W.B. US Forest Resource Facts and Historical Trends; FS-1035; (Brochure); US Department of Agriculture, Forest Service: Washington, DC, USA, 2014. Available online: https://www.fia.fs.fed.us/library/brochures/docs/2012/ForestFacts_1952-2012_English.pdf (accessed on 21 March 2021).
- USDA Forest Service. Future of America’s Forests and Rangelands: Update to the 2010 Resources Planning Act Assessment; Gen. Tech. Report WO-GTR-94; USDA Forest Service: Washington, DC, USA, 2016; 250p. [CrossRef]
- Riitters, K.H.; Wickham, J.D.; Wade, T.G. An indicator of forest dynamics using a shifting landscape mosaic. Ecol. Indic. 2009, 9, 107–117. [Google Scholar] [CrossRef]
- Riitters, K.; Schleeweis, K.; Costanza, J. Forest Area Change in the Shifting Landscape Mosaic of the Continental United States from 2001 to 2016. Land 2020, 9, 417. [Google Scholar] [CrossRef]
- Schleeweis, K.G.; Moisen, G.G.; Schroeder, T.A.; Toney, C.; Freeman, E.A.; Goward, S.N.; Huang, C.; Dungan, J.L. US National Maps Attributing Forest Change: 1986–2010. Forests 2020, 11, 653. [Google Scholar] [CrossRef]
- Riitters, K.H. Downscaling indicators of forest habitat structure from national assessments. Ecol. Indic. 2005, 5, 273–279. [Google Scholar] [CrossRef]
- Riitters, K.; Costanza, J.; Buma, B. Interpreting multiscale domains of tree cover disturbance patterns in North America. Ecol. Indic. 2017, 80, 147–152. [Google Scholar] [CrossRef] [Green Version]
- Zhang, Y.; Guindon, B. Detecting and quantifying extended landscape structure with spatial co-occurrence surfaces. Pattern Anal. Appl. 2015, 20, 519–529. [Google Scholar] [CrossRef]
- Zurlini, G.; Riitters, K.; Zaccarelli, N.; Petrosillo, I.; Jones, K.; Rossi, L. Disturbance patterns in a socio-ecological system at multiple scales. Ecol. Complex. 2006, 3, 119–128. [Google Scholar] [CrossRef]
- Zurlini, G.; Riitters, K.H.; Zaccarelli, N.; Petrosillo, I. Patterns of disturbance at multiple scales in real and simulated landscapes. Landsc. Ecol. 2006, 22, 705–721. [Google Scholar] [CrossRef]
- Fahrig, L.; Arroyo-Rodríguez, V.; Bennett, J.R.; Boucher-Lalonde, V.; Cazetta, E.; Currie, D.J.; Eigenbrod, F.; Ford, A.T.; Harrison, S.P.; Jaeger, J.A.; et al. Is habitat fragmentation bad for biodiversity? Biol. Conserv. 2019, 230, 179–186. [Google Scholar] [CrossRef] [Green Version]
- Homer, C.; Dewitz, J.; Jin, S.; Xian, G.; Costello, C.; Danielson, P.; Gass, L.; Funk, M.; Wickham, J.; Stehman, S.; et al. Conterminous United States land cover change patterns 2001–2016 from the 2016 National Land Cover Database. ISPRS J. Photogramm. Remote. Sens. 2020, 162, 184–199. [Google Scholar] [CrossRef]
- Riitters, K.H.; Wickham, J.D. Decline of forest interior conditions in the conterminous United States. Sci. Rep. 2012, 2, 653. [Google Scholar] [CrossRef] [PubMed] [Green Version]
- Oswalt, S.N.; Smith, W.B.; Miles, P.D.; Pugh, S.A. Forest Resources of the United States, 2017: A Technical Document Supporting the Forest Service 2020 RPA Assessment; Gen. Tech. Rep. WO-97; U.S. Department of Agriculture, Forest Service, Washington Office: Washington, DC, USA, 2019; 223p. [CrossRef] [Green Version]
- Riitters, K.; Costanza, J. The landscape context of family forests in the United States: Anthropogenic interfaces and forest fragmentation from 2001 to 2011. Landsc. Urban Plan. 2019, 188, 64–71. [Google Scholar] [CrossRef]
- Malmsheimer, R.W.; Bowyer, J.L.; Fried, J.S.; Gee, E.; Izlar, R.; Miner, R.A.; Munn, I.A.; Oneil, E.; Stewart, W.C. Managing forests because carbon matters: Integrating energy, products, and land management policy. J. For. 2011, 109, S7–S50. [Google Scholar]
- Vogt, P.; Riitters, K.H.; Caudullo, G. An Approach for Pan-European Monitoring of Forest Fragmentation, EUR 29944 EN; JRC118541; Publications Office of the European Union: Luxembourg, 2019; ISBN 978-92-76-10374-5. [Google Scholar] [CrossRef]
- Forest Europe. State of Europe’s Forests 2020. 2020. Ministerial Conference on the Protection of Forests in Europe—FOREST EUROPE. Liaison Unit Bratislava. Available online: https://foresteurope.org/wp-content/uploads/2016/08/SoEF_2020.pdf (accessed on 17 May 2021).
- Vogt, P.; Riitters, K.H.; Caudullo, G. FAO—State of the World’s Forests: Forest Fragmentation, EUR 29972 EN; JRC118594; Publications Office of the European Union: Luxembourg, 2019; ISBN 978-92-76-13036-9. [Google Scholar] [CrossRef]
- FAO; UNEP. The State of the World’s Forests 2020. Forests, Biodiversity and People; FAO: Rome, Italy, 2020. [Google Scholar] [CrossRef]
- Healey, S.P.; Cohen, W.B.; Yang, Z.; Brewer, K.; Brooks, E.; Gorelick, N.; Gregory, M.; Hernandez, A.; Huang, C.; Hughes, J.; et al. Next-Generation Forest Change Mapping across the United States: The Landscape Change Monitoring System (LCMS). In Pushing Boundaries: New Directions in Inventory Techniques and Applications: Forest Inventory and Analysis (FIA) Symposium 2015; Gen. Tech. Rep. PNW-GTR-931; Stanton, S.M., Christensen, G.A., Eds.; U.S. Department of Agriculture, Forest Service, Pacific Northwest Research Station: Portland, OR, USA, 2015; p. 217. Available online: https://www.fs.usda.gov/treesearch/pubs/all/50338 (accessed on 17 May 2021).
- Brown, J.F.; Tollerud, H.J.; Barber, C.P.; Zhou, Q.; Dwyer, J.L.; Vogelmann, J.E.; Loveland, T.R.; Woodcock, C.E.; Stehman, S.V.; Zhu, Z.; et al. Lessons learned implementing an operational continuous United States national land change monitoring capability: The Land Change Monitoring, Assessment, and Projection (LCMAP) approach. Remote Sens. Environ. 2020, 238, 111356. [Google Scholar] [CrossRef]
- Brooks, E.B.; Coulston, J.W.; Riitters, K.H.; Wear, D.N. Using a hybrid demand-allocation algorithm to enable distributional analysis of land use change patterns. PLoS ONE 2020, 15, e0240097. [Google Scholar] [CrossRef] [PubMed]
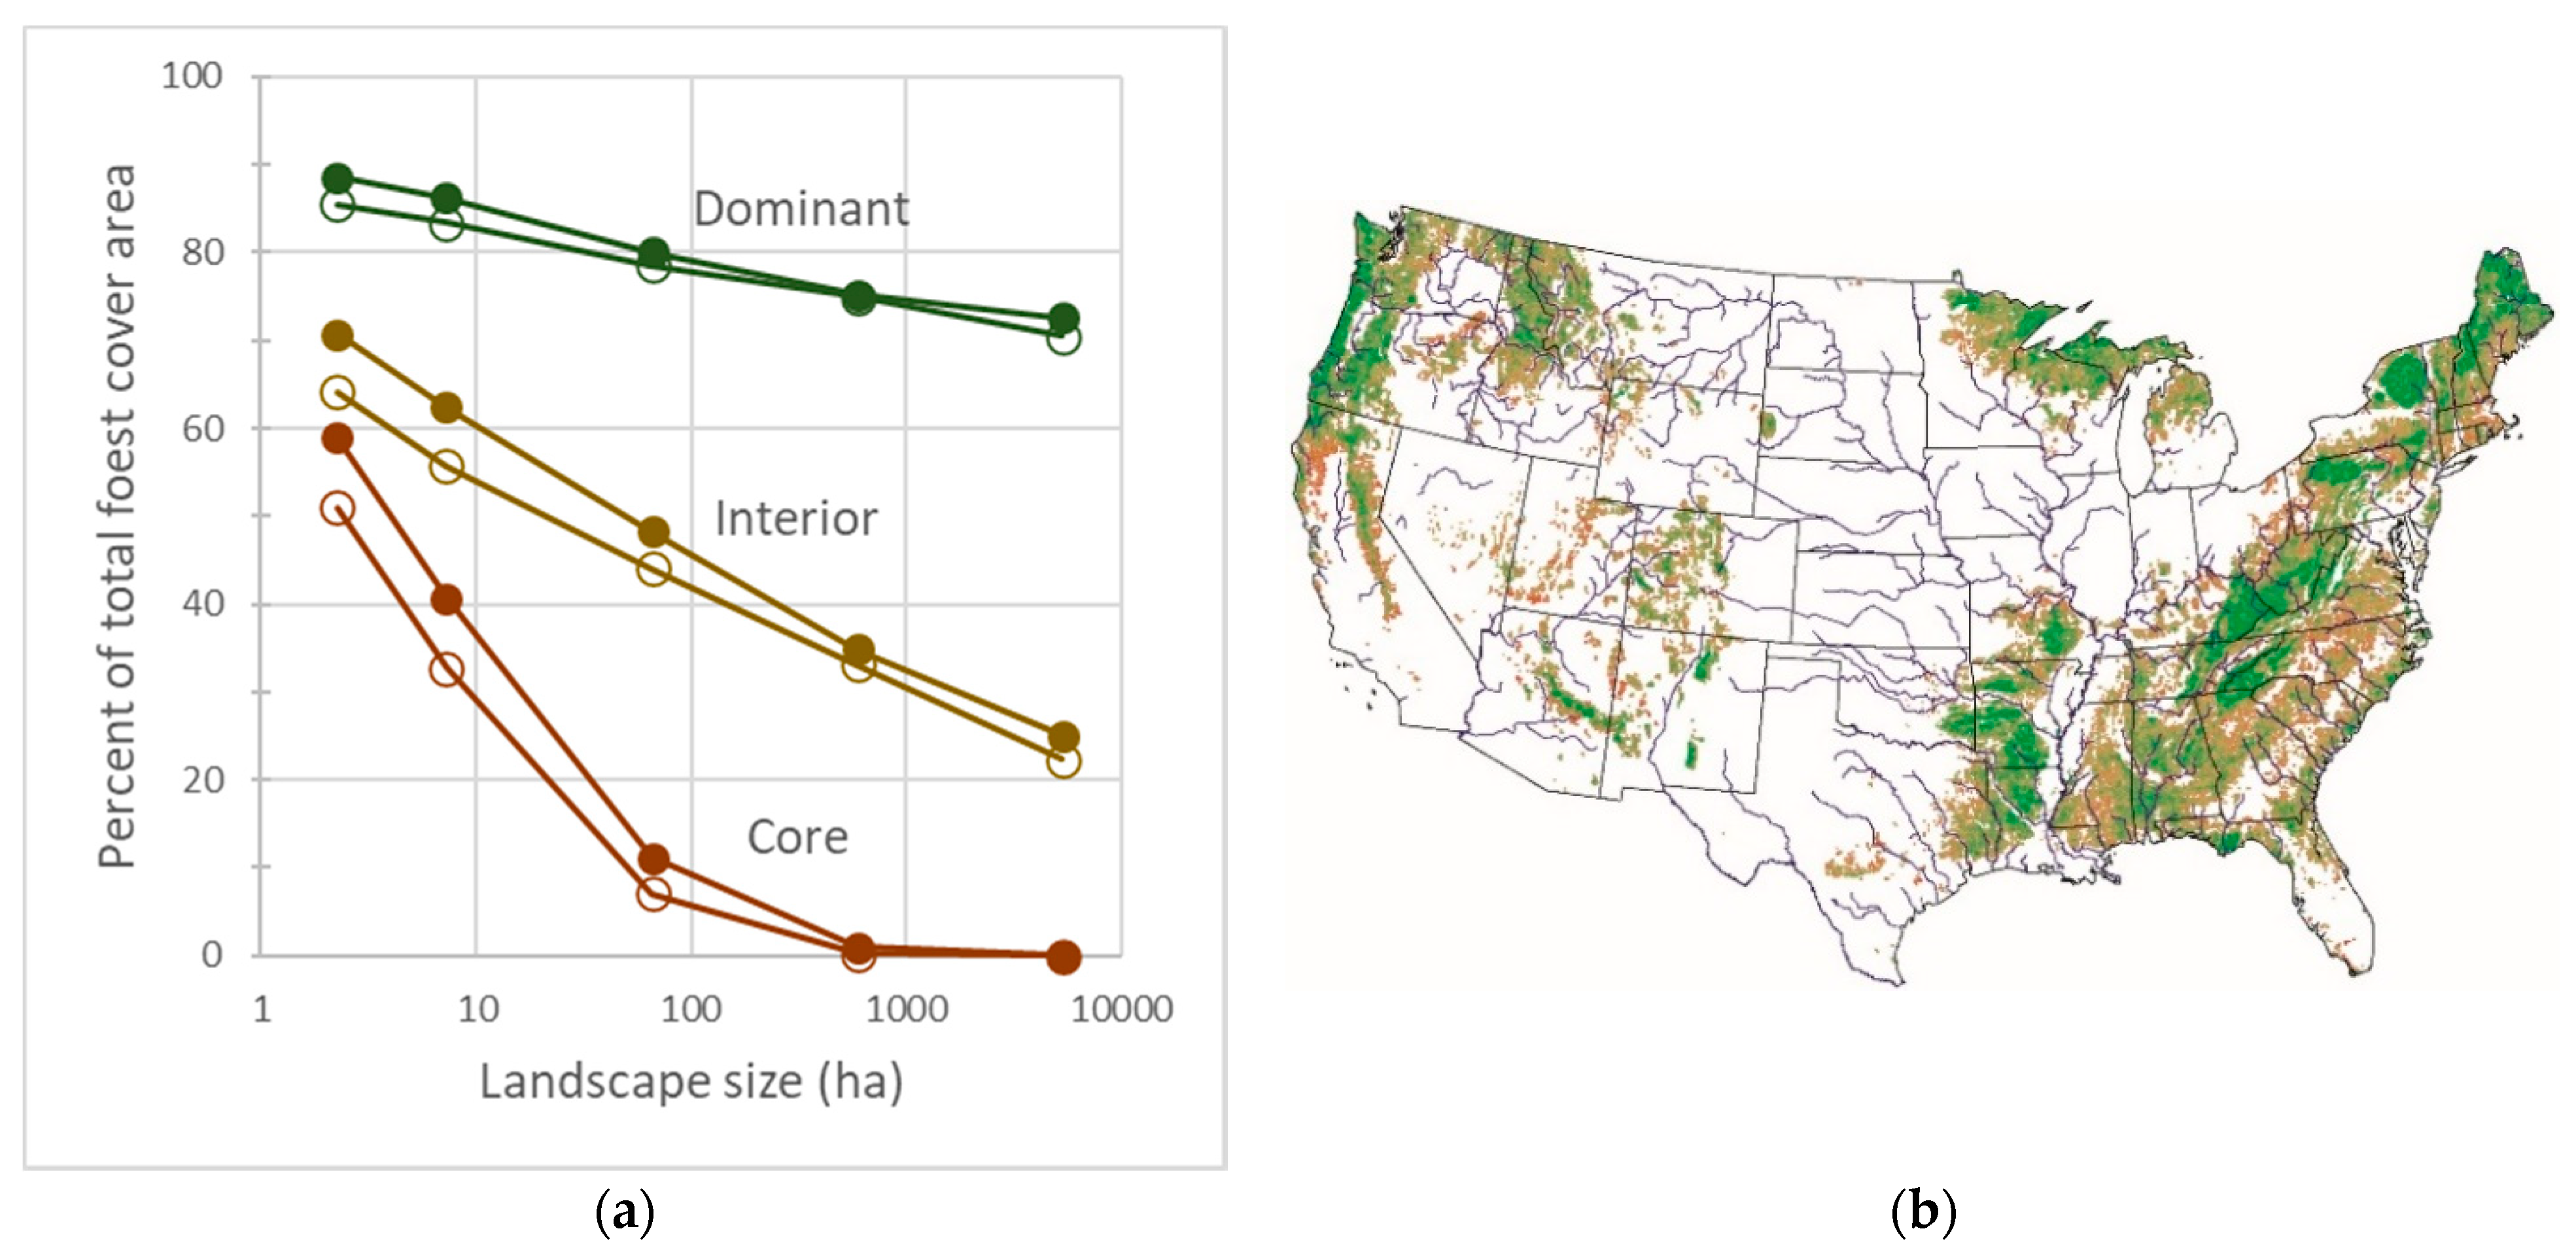
Figure 1.
The fragmentation indicator as reported in the United States 2003 National Report on Sustainable Forests. (a) The percentage of forest cover located in landscapes of different sizes that met thresholds for “core” (brown), “interior” (yellow), and “dominant” (green) conditions (see text for explanation). Note that that core is a subset of interior, which is a subset of dominant, which is a subset of total forest cover area. Open and closed symbols indicate eastern and western forests, respectively. (b) The geography of fragmentation was illustrated by color-coding forest-dominated 56.25 km2 map tiles according to the proportion of forest cover meeting the criterion for “interior” forest at the 7 ha scale. Note that this map does not use the same legend as part (a); the large green areas contained the major concentrations of less-fragmented forest cover. This figure was re-drawn from public domain sources.

Figure 2.
Forest land cover fragmentation from national land cover maps from 2001 to 2016. The chart shows the percentage of forest cover area in the conterminous United States that is considered core (at the center of a completely forested landscape), interior (landscape is more than 90 percent forested), or dominant (landscape is more than 60 percent forested), and how those proportions changed over time and with landscape size. The highlighted symbols identify conditions mapped in Figure 3.

Figure 3.
(a) The net change in total forest land cover in a county from 2001 to 2016, expressed as a percentage of the total forest area in 2001. (b) The net change in interior forest land cover in a county from 2001 to 2016, when analyzed at the 15 ha scale in 2001. (corresponding to the highlighted symbols in Figure 2). Because the same legend applies to both maps, it is possible to compare net percent changes in total forest area and interior forest area at the county level. The two inset maps identify counties where more than 50 percent of total area was forest land cover in 2016, and where more than 50 percent of the extant forest land cover in 2016 was interior.

Figure 4.
Mean shares of forest–non-forest edge within a 15 ha neighborhood of FIA forestland in 2016, by forest type. Forest types are sorted in ascending order by the total of the developed and agriculture shares of non-forest edge.
Figure 4.
Mean shares of forest–non-forest edge within a 15 ha neighborhood of FIA forestland in 2016, by forest type. Forest types are sorted in ascending order by the total of the developed and agriculture shares of non-forest edge.


Table 1.
Annual percentage rates of net change in conterminous United States interior forest cover area (i.e., forest cover at the center of a landscape that is at least 90 percent forested) at five landscape sizes, for three time periods. The corresponding changes of all forest cover area (mapped at a fixed spatial resolution of 0.09 ha) are shown for comparison.
| Compound Annual Rate of Net Change | ||||||
|---|---|---|---|---|---|---|
| Interior Forest Cover | 2001 | 2016 | Net Change | 2001 to 2006 | 2006 to 2011 | 2011 to 2016 |
| Landscape Size Hectares | Million km2 | Million km2 | Percent | Percent | ||
| 4.4 | 1.47 | 1.40 | −5.0 | −0.78 | −0.19 | −0.05 |
| 15 | 1.19 | 1.12 | −6.4 | −1.04 | −0.23 | −0.05 |
| 66 | 0.92 | 0.84 | −8.4 | −1.46 | −0.27 | −0.02 |
| 590 | 0.57 | 0.49 | −13.1 | −2.33 | −0.42 | −0.04 |
| 5300 | 0.31 | 0.25 | −20.7 | −3.61 | −0.73 | −0.24 |
| All forest cover | 2.39 | 2.33 | −2.6 | −0.41 | −0.11 | −0.01 |
Publisher’s Note: MDPI stays neutral with regard to jurisdictional claims in published maps and institutional affiliations. |
© 2021 by the authors. Licensee MDPI, Basel, Switzerland. This article is an open access article distributed under the terms and conditions of the Creative Commons Attribution (CC BY) license (https://creativecommons.org/licenses/by/4.0/).
Share and Cite
MDPI and ACS Style
Riitters, K.; Robertson, G. The United States’ Implementation of the Montréal Process Indicator of Forest Fragmentation. Forests 2021, 12, 727. https://0-doi-org.brum.beds.ac.uk/10.3390/f12060727
AMA Style
Riitters K, Robertson G. The United States’ Implementation of the Montréal Process Indicator of Forest Fragmentation. Forests. 2021; 12(6):727. https://0-doi-org.brum.beds.ac.uk/10.3390/f12060727
Chicago/Turabian StyleRiitters, Kurt, and Guy Robertson. 2021. "The United States’ Implementation of the Montréal Process Indicator of Forest Fragmentation" Forests 12, no. 6: 727. https://0-doi-org.brum.beds.ac.uk/10.3390/f12060727
Note that from the first issue of 2016, this journal uses article numbers instead of page numbers. See further details here.