
Impact of Shrimp Ponds on Mangrove Blue Carbon Stocks in Ecuador
by
 , and
, and
Jéssica Merecí-Guamán
1,2,*, 
Fernando Casanoves
2,
Diego Delgado-Rodríguez
2,
Pablo Ochoa
3 and
Miguel Cifuentes-Jara
2 1
Facultad de Ciencias Agropecuarias, Universidad de Cuenca, Cuenca 010107, Ecuador
2
CATIE—Centro Agronómico Tropical de Investigación y Enseñanza, Turrialba 30501, Costa Rica
3
Departamento de Ciencias Biológicas y Agropecuarias, Universidad Técnica Particular de Loja, San Cayetano Alto, Loja 110107, Ecuador
*
Author to whom correspondence should be addressed.
Forests 2021, 12(7), 816; https://0-doi-org.brum.beds.ac.uk/10.3390/f12070816
Submission received: 3 June 2021
/
Revised: 9 June 2021
/
Accepted: 11 June 2021
/
Published: 22 June 2021
(This article belongs to the Special Issue Carbon Cycling in Mangrove Ecosystems)
Abstract
:Mangrove forests play an important role in mitigating climate change but are threatened by aquaculture expansion. The inclusion of mangroves in climate change mitigation strategies requires measuring of carbon stocks and the emissions caused by land use change over time. This study provides a synthesis of carbon stocks in mangrove and shrimp ponds in the Gulf of Guayaquil. In this study area, we identified 134,064 ha of mangrove forest and 153,950 ha of shrimp farms. Two mangrove strata were identified according to their height and basal area: medium-statured mangrove (lower height and basal area) and tall mangrove (greater height and basal area). These strata showed statistical differences in aboveground carbon stocks. In both strata, the most abundant mangrove species was Rhizophora mangle. For both strata, trees had a maximum height (>30 m), and their density was greater than 827 ha−1. Total ecosystem level carbon stocks (measured to 1 m soil depth) were 320.9 Mg C ha−1 in medium-statured mangroves and 419.4 Mg C ha−1 in tall mangroves. The differences are attributable to higher basal area, soil organic carbon concentrations and salinity, tidal range, origin of allochthonous material, and herbivory patterns. Mangrove soils represented >80% of the total ecosystem carbon. Ecosystem carbon stocks were lower (81.9 Mg C ha−1) in the shrimp farms, 50% less than in undisturbed mangroves. Our results highlight mangroves as tropical ecosystems with extremely high carbon storage; therefore, they play an important role in mitigating climate change. This research provides a better understanding of how carbon stocks in this gulf are found and can be used for design strategies to protect global natural carbon sinks.
1. Introduction
Mangrove forests have an area of 152,361 km2 worldwide [1], with 15.7% of that surface in South America (23,882 km2) [2]. Currently, mangrove forests in Ecuador occupy 1906 km2 [3]. These ecosystems are wildlife refuges with high natural, cultural, and scientific value, as well as the largest artisanal and industrial fishing area in Ecuador [4].
Mangrove forests play an important role in the global carbon cycle because they are highly productive ecosystems [5]. Currently, coastal ecosystems such as mangroves present burial rates of 353 gm−2 y−1 [6]. Although they occupy only a small fraction of the coastal area globally (0.5%), mangroves store 10%–15% of carbon (C) present in coastal sediments (at a rate of 24 Tg C y−1) and export 10%–11% of terrestrial carbon particles to the ocean [7]. In addition, they contribute 55% of air–sea exchange and 14% of organic carbon burial, and export 28% of dissolved inorganic carbon (DIC) and 13% of dissolved organic carbon (DOC) plus particulate organic matter (POC) from the coastline and estuaries [8].
In these ecosystems, soils are the largest carbon sinks due to high contents of organic matter (OM) [5] and deep soil horizons. Soil C accumulation depends on several factors such as organic matter inputs, root turnover, necromass, algae and benthic organisms, the slow decomposition of refractory material, the magnitude and frequency of waves, the activity of micro- and macro-organisms, tree species and the composition of litter, and high humidity and temperature [9]. Average soil stocks are more than 1023 Mg C ha−1, representing between 48 and 98% of carbon stored at depths from 0.5 to more than 3 m [10]. These values double and even triple carbon stocks in terrestrial tropical forest soils; one example is the terrestrial forest of Sumatra with 180 Mg C ha−1 [11,12]. However, accelerated deforestation threatens the stability of mangrove carbon sinks. Global CO2 emissions caused by the loss of mangrove forests have been estimated to be ~ 7.0 Tg CO2e y−1. Countries with the highest CO2 emissions due to mangrove loss are Indonesia (3410 Gg CO2e y−1) and Malaysia (1288 Gg CO2e y−1) [13].
Land use change in mangrove forests results in mineralization of C that has been stored for decades or millennia. From 1982 to 2002, the loss of 35% of the world’s mangroves resulted in the release of 3.8 × 10¹⁴ g C stored in the aboveground biomass of these forests [14,15]. It is estimated that 10,600 Mg CO2 km−2 will be emitted in the first year after mangrove cover changes to other land uses, and 20 years later, 3000 Mg CO2 km−2 y−1 [16]. Globally, the estimates of emissions vary between 0.02 and 0.12 Pg C y−1, equivalent to 10% of globlal emissions caused by deforestation [10,17,18]. In this sense, international agreements such as the mechanism for reducing emissions from deforestation and degradation (REED+), whose main strategy is to maintain C stored through economic incentives to forest conservation, are a cost-effective option to mitigate climate change [10]. In addition, there are other programs from the United Nations Framework Convention on Climate Change (UNFCCC), which require rigorous monitoring of carbon sinks and emissions.
To generate information about carbon stocks in mangroves, we chose the Gulf of Guayaquil because it covers approximately 80% of mangrove forest in Ecuador and has presented annual loss rates between 0.42% (Guayas province) and 2.69% (Manbí province) from 1969 to 1984 [19]. We estimated carbon stocks in two mangrove strata dominated by Rizhophrora mangle. These are the result of number of trees, age, and environmental conditions and are differenced mainly by their dominant tree height. Additionally, we compared soil carbon stocks in mangroves and shrimp ponds. Low carbon stocks in shrimp ponds relative to the mangrove forests are a measure of potential losses from land use change.
2. Materials and Methods
2.1. Study Region
This study was carried out in the mangrove forests and shrimp farms belonging to the tropical forest life zone of the Gulf of Guayaquil, located in Guayas and El Oro provinces in Ecuador, at 81°00′00″ W and 03°23′34″ S. The area has a tropical climate with two seasons: a rainy season influenced by El Niño warm ocean current, which runs from December to May, and a dry season influenced by the Humboldt cold ocean current, from June to November [20]. The average annual precipitation is 680 mm, and the mean annual temperature fluctuates between 20 and 32 °C. The average humidity is 48.7%, and tides vary between 1.8 and 3 m in amplitude [21]. Mangrove ecosystems within the gulf are characterized by developing on muddy soils, are poorly consolidated, are poor in oxygen, and are subject to periodic flooding and saline intrusion that occurs within the intertidal zone [22].
2.2. Forest Stratification and Transects Selection
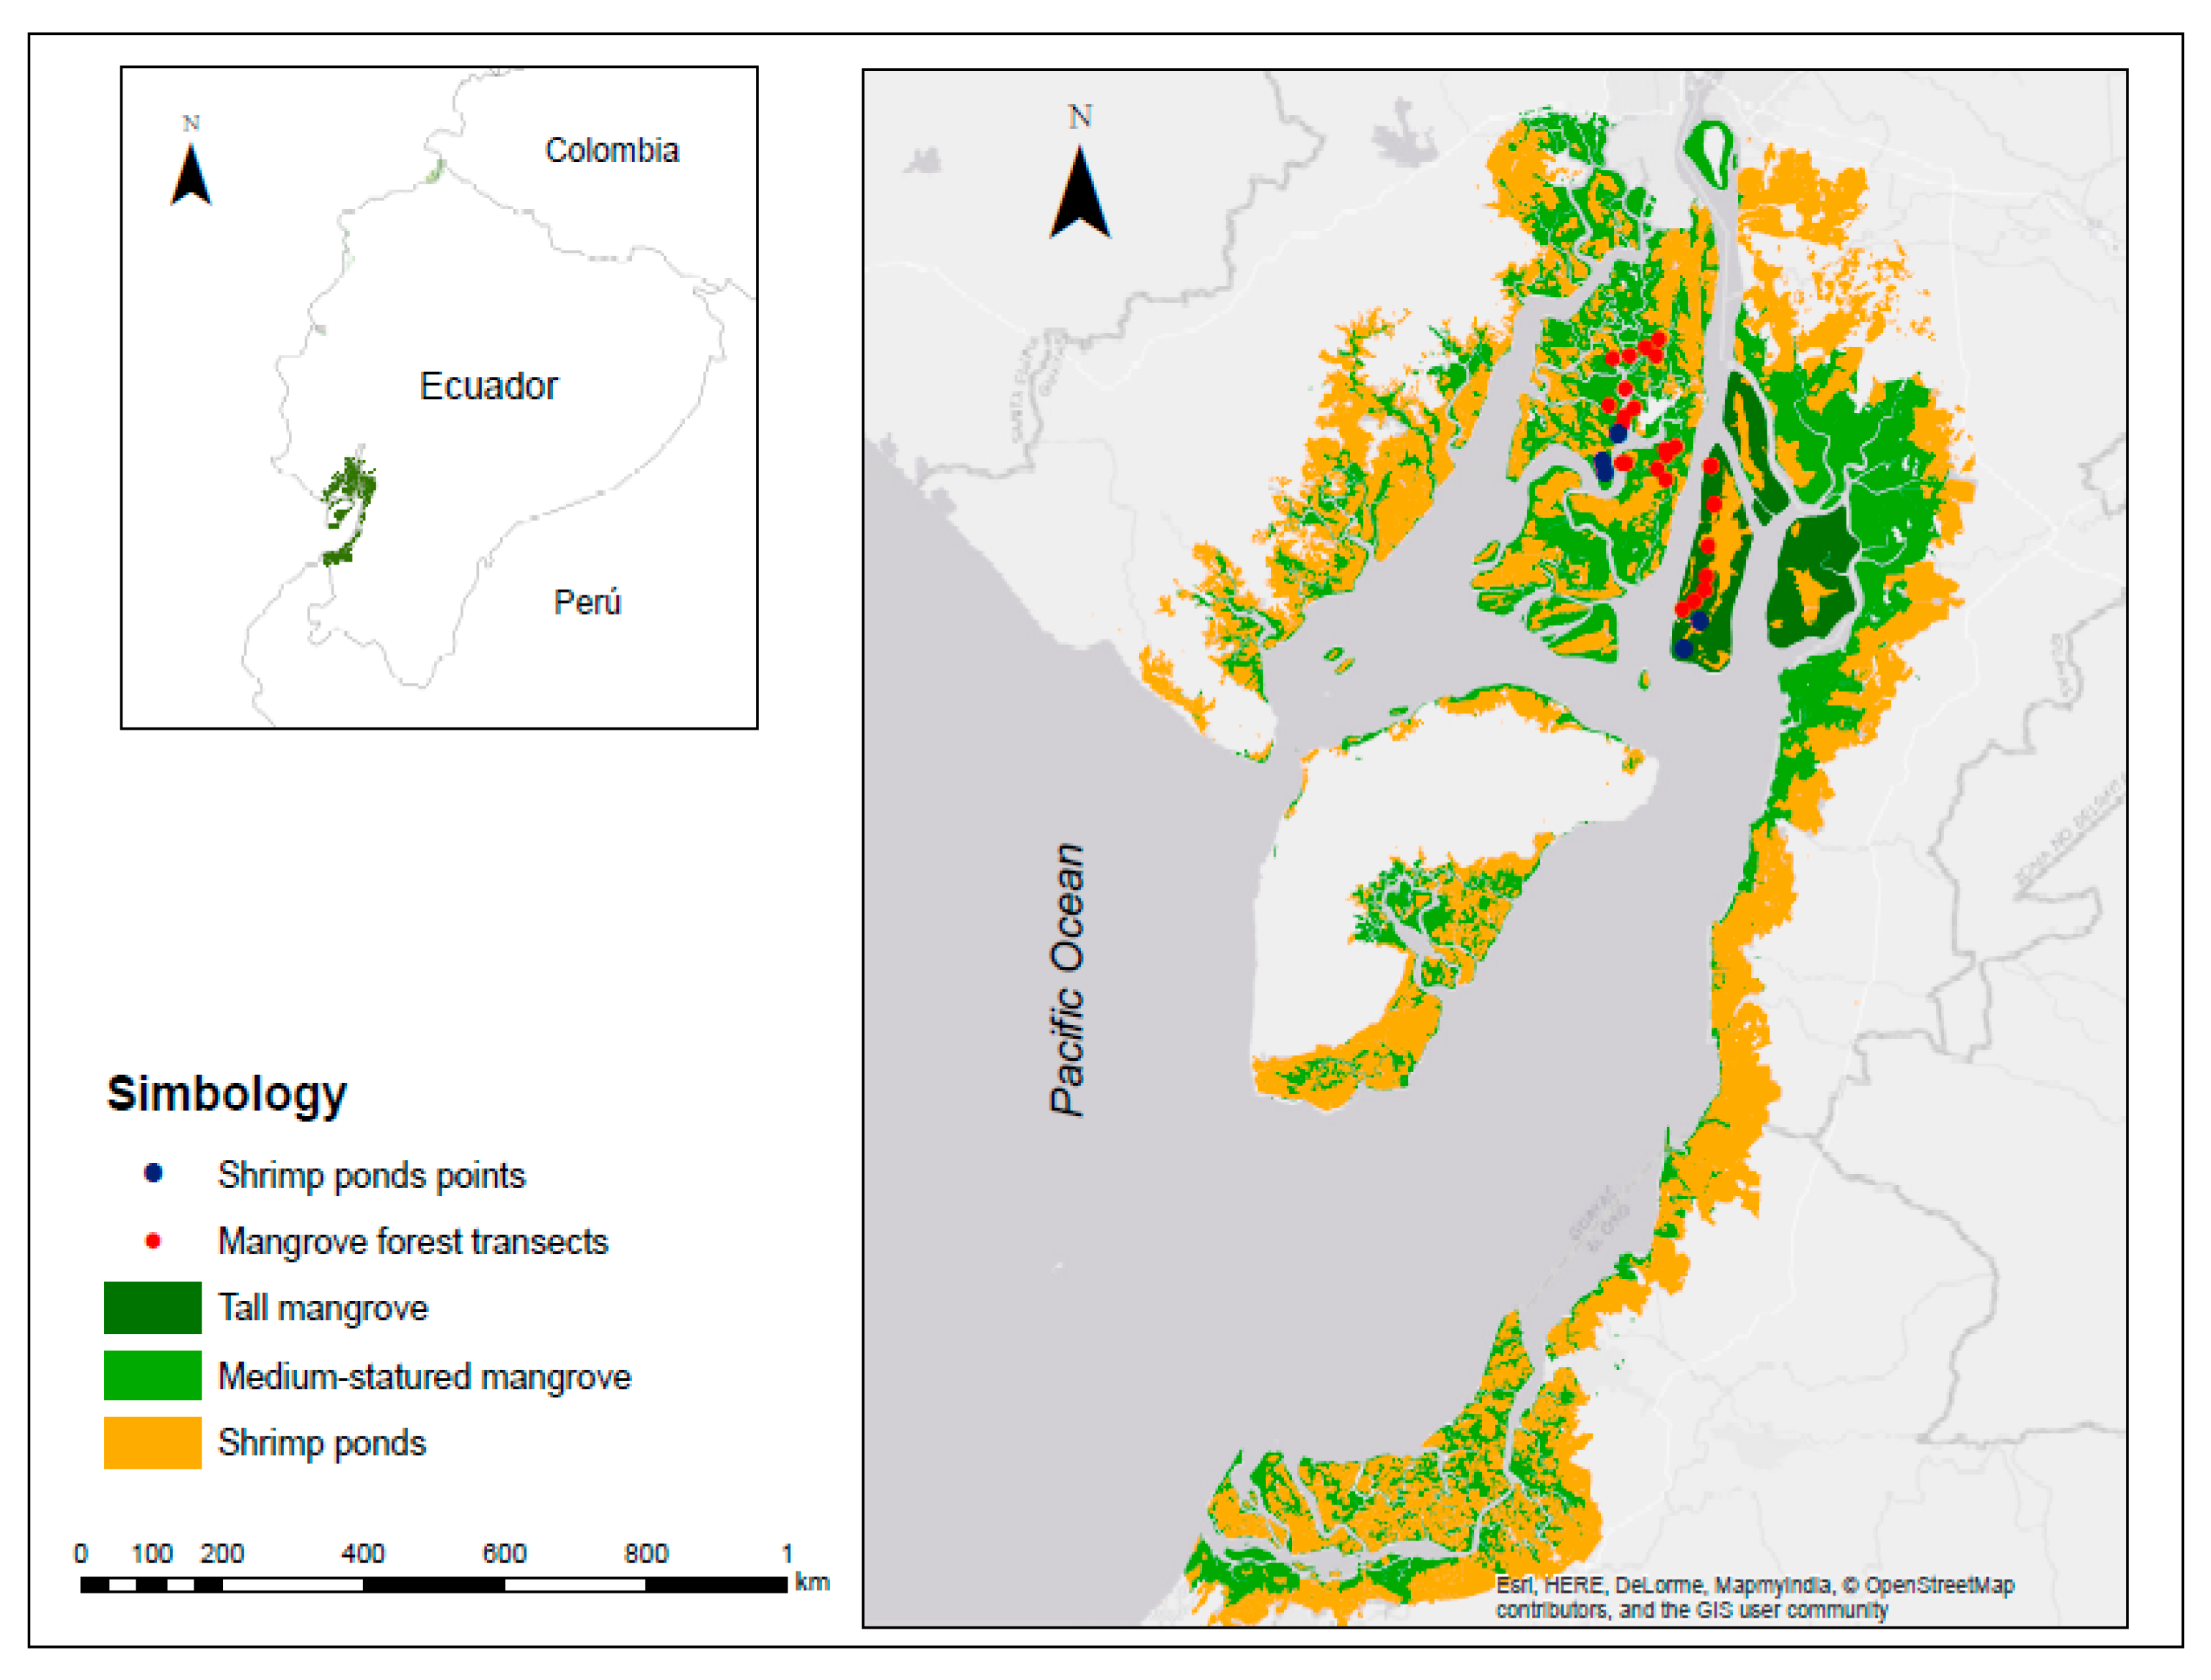
We visually identified a priori two mangrove strata (medium-statured mangrove and tall mangrove) and shrimp farms using Google Earth (Figure 1). The medium-statured mangrove stratum had trees with smaller basal area that the tall mangrove stratum. Their structure was heterogeneous compared to inland channels. This stratum was located along coastal lines where elevation is greater than the average height of waves. There is also greater saline intrusion, and it is flooded by the tide for 12 h daily. In addition, these forests have a highly developed root system that serves as a substrate anchor and an organic matter trap. The medium-mangrove stratum was identified in seven islands across the gulf (Bellavista, Canoa, Chupadores chico, Chupadores maduro, Tortuga, Bocana, and San Ignacio).
On the other hand, the tall mangrove stratum grows mainly as riparian forests on riverbanks. These forests are dominated by Rhizophora mangle, with small areas of Avicennia germinans [23]. In this environment, fresh water and nutrient discharge are high, producing forests with well-developed dasometric and structural characteristics. The tides do not completely flood the tall mangroves due to a higher surface elevation [22,23]. The tall mangrove stratum was identified only on Mondragón island. Finally, shrimp farms were identified by their rectangular or triangular shape and by their proximity to the mangroves.
We delimited transects using geographic information systems tools (ArcGIS 10.5) and available satellite image servers (Earth Explorer). To visualize the mangrove coverage, we used land use maps from 2016, on which a grid and a layer of points (1000 × 1000 m) was applied to ensure that the transects were adequately separated from each other and to minimize spatial autocorrelation. A total of 29 points were chosen randomly according to their accessibility: 17 points in medium-statured mangrove, 7 for tall mangroves, and 5 for shrimp farms.
2.3. Aboveground Carbon
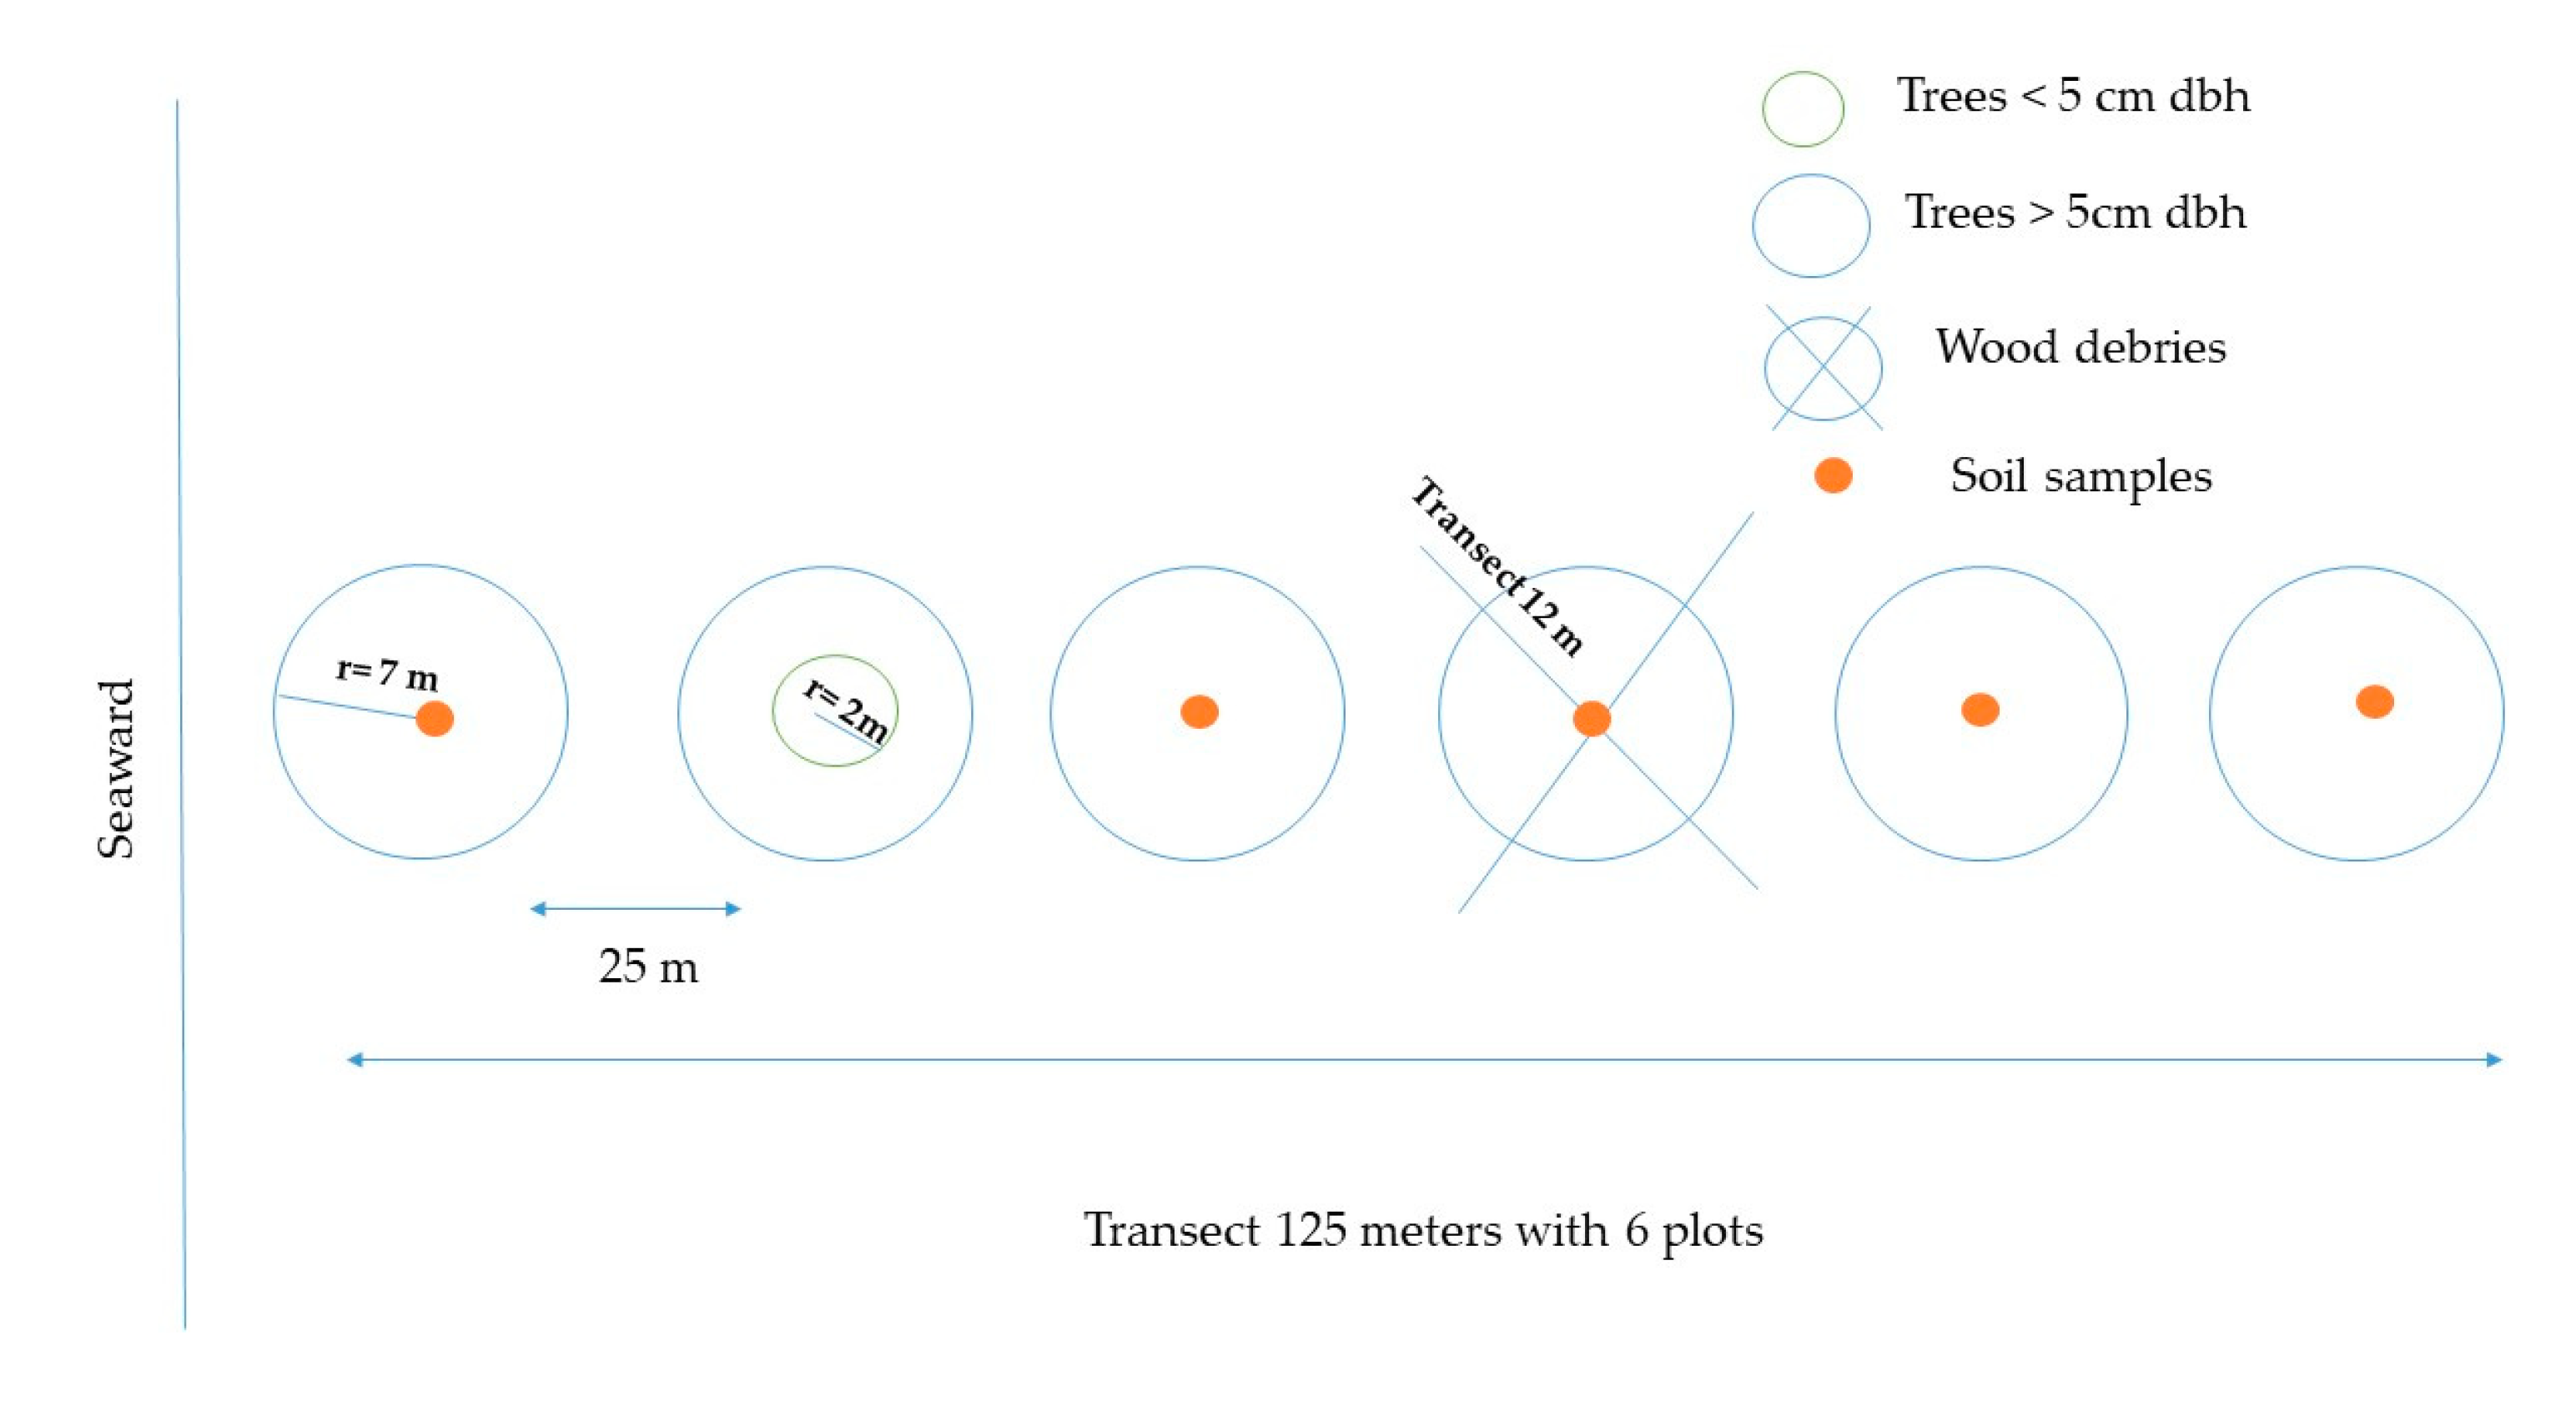
We used Kauffman et al.′s methodology [24], which consists of establishing 150 m linear transects located perpendicular to the coastline. Along the transect, six circular plots of 7 m radius (153.9 m2) were located every 25 m (Figure 2). This design makes it possible to determine the composition, structure, and carbon stocks of mangroves, encompassing the variability in mean surface elevation and tidal flooding [24].
We measured tree diameter (DBH) and height for trees (alive and dead) with dbh > 5 cm. DBH was measured at 1.30 m in height or 30 cm above the last aerial root with a fiberglass diametric tape. Additionally, in plots of 2 m radius (12.6 m2), height and dbh were measured for trees with stem diameters < 5 cm. Samples of mangrove leaves and flowers were taken for species identification [24,25].
Aboveground biomass was determined with allometric equations using the following criteria: (i) equations for mangrove forests of the same region or the same continent, and (ii) equations for the species identified in the field. Since there are no allometric equations to measure aboveground in Ecuador, we used equations from French Guiana (Rizhophrora mangle and Laguncularia racemosa var. glabriflora) [26] (Table 1). We used a factor of 0.47 to convert mangrove living biomass to C [24,27].
To measure downed wood biomass, we used the planar intersect method [28,29]. This entails counting and measuring the diameter of all the downed wood ≥ 2.5 cm that intersected 4 transects of 12 m in length, running perpendicularly from each other and bisecting the main circular plot. Each piece of wood was assigned a category according to its decomposition status (hard or rotten) [27]. In total, five wood samples were collected by diameter and by decomposition status to determine their specific gravity. We used the water volume displacement method to measure the specific gravity of these samples. Herbaceous and litter biomass samples were collected and weighed in the field using 0.50 × 0.50 m (0.25 m2) micro-plots, which were randomly placed within the plots. A subsample of approximately 250–500 g was taken and dried at 60 °C for 48 h or until constant weight [24].
To calculate downed wood density biomass, we used specific gravity values of 0.89 g cm−3 for R. mangle and 0.620 g cm−3 for L. racemosa [30]. Biomass of downed wood resulted from the product between its volume (Equation (1)) and the corresponding specific gravity [29]. For estimating downed carbon, we used a factor conversion of 0.47. Litter carbon stocks were calculated from dry weight and conversion factor of 0.45 [24].
Volume
where: d = density of wood; L = transect length
(m3 ha−1) = ((π2 × ∑d2))/(8 × L)
2.4. Soil Carbon
At the center of each sampling plot, soil samples were collected at 0–15, 15–30, 30–50, 50–100, and >100 cm depth. The samples were extracted with an open face auger, specifically designed for unconsolidated soils. Undisturbed soil samples from corresponding depths were also taken to determine bulk density. For determining soil carbon concentration, we used composite samples for each depth along each transect, obtaining five samples per transect. We took soil samples from working shrimp farms following a similar approach. Soil carbon concentration was determined by the total dry combustion method. This method consisted of drying, sifting (sieve 2 mm), and subjecting the soil samples to high temperatures (> 1500 °C) using an automated total C analyzer [31]. The soil carbon (Mg ha−1) was calculated using Equation (2) [24,32]
Soil carbon
(Mg ha−1) = bulk density (g cm−3) × soil depth interval (cm) × Carbon (%)
Total carbon at the ecosystem level was calculated by adding the aboveground and belowground carbon stocks. Carbon stocks at the landscape level were calculated by multiplying the ecosystem C values by the area of corresponding land use strata (mangrove forest and shrimp ponds).
2.5. Statistical Analysis
We used general linear models (GLM) to evaluate the fixed effect or strata (medium-statured, tall mangrove cover, and shrimp farms) on carbon stocks. In the case of soil C, we also considered the fixed effect of depth and its interaction with strata. The assumption of normality and equal variances was analyzed by graphical inspection of model residuals [33]. We used Fisher′s LSD to find differences among strata. The means comparison was made for (i) total carbon between mangrove strata, (ii) aboveground and belowground carbon for mangrove strata, (iii) aboveground carbon mangrove strata with respect to channel distance, and (iv) carbon concentrations at different soil depths in mangrove strata and shrimp farms. Pearson correlation coefficient was calculated for the relationship between aboveground and belowground carbon for the two mangrove strata. All these analyses were performed with InfoStat software version 2017 and using a significance level of 0.05.
3. Results
3.1. Mangrove Forest Strata and Shrimp Ponds
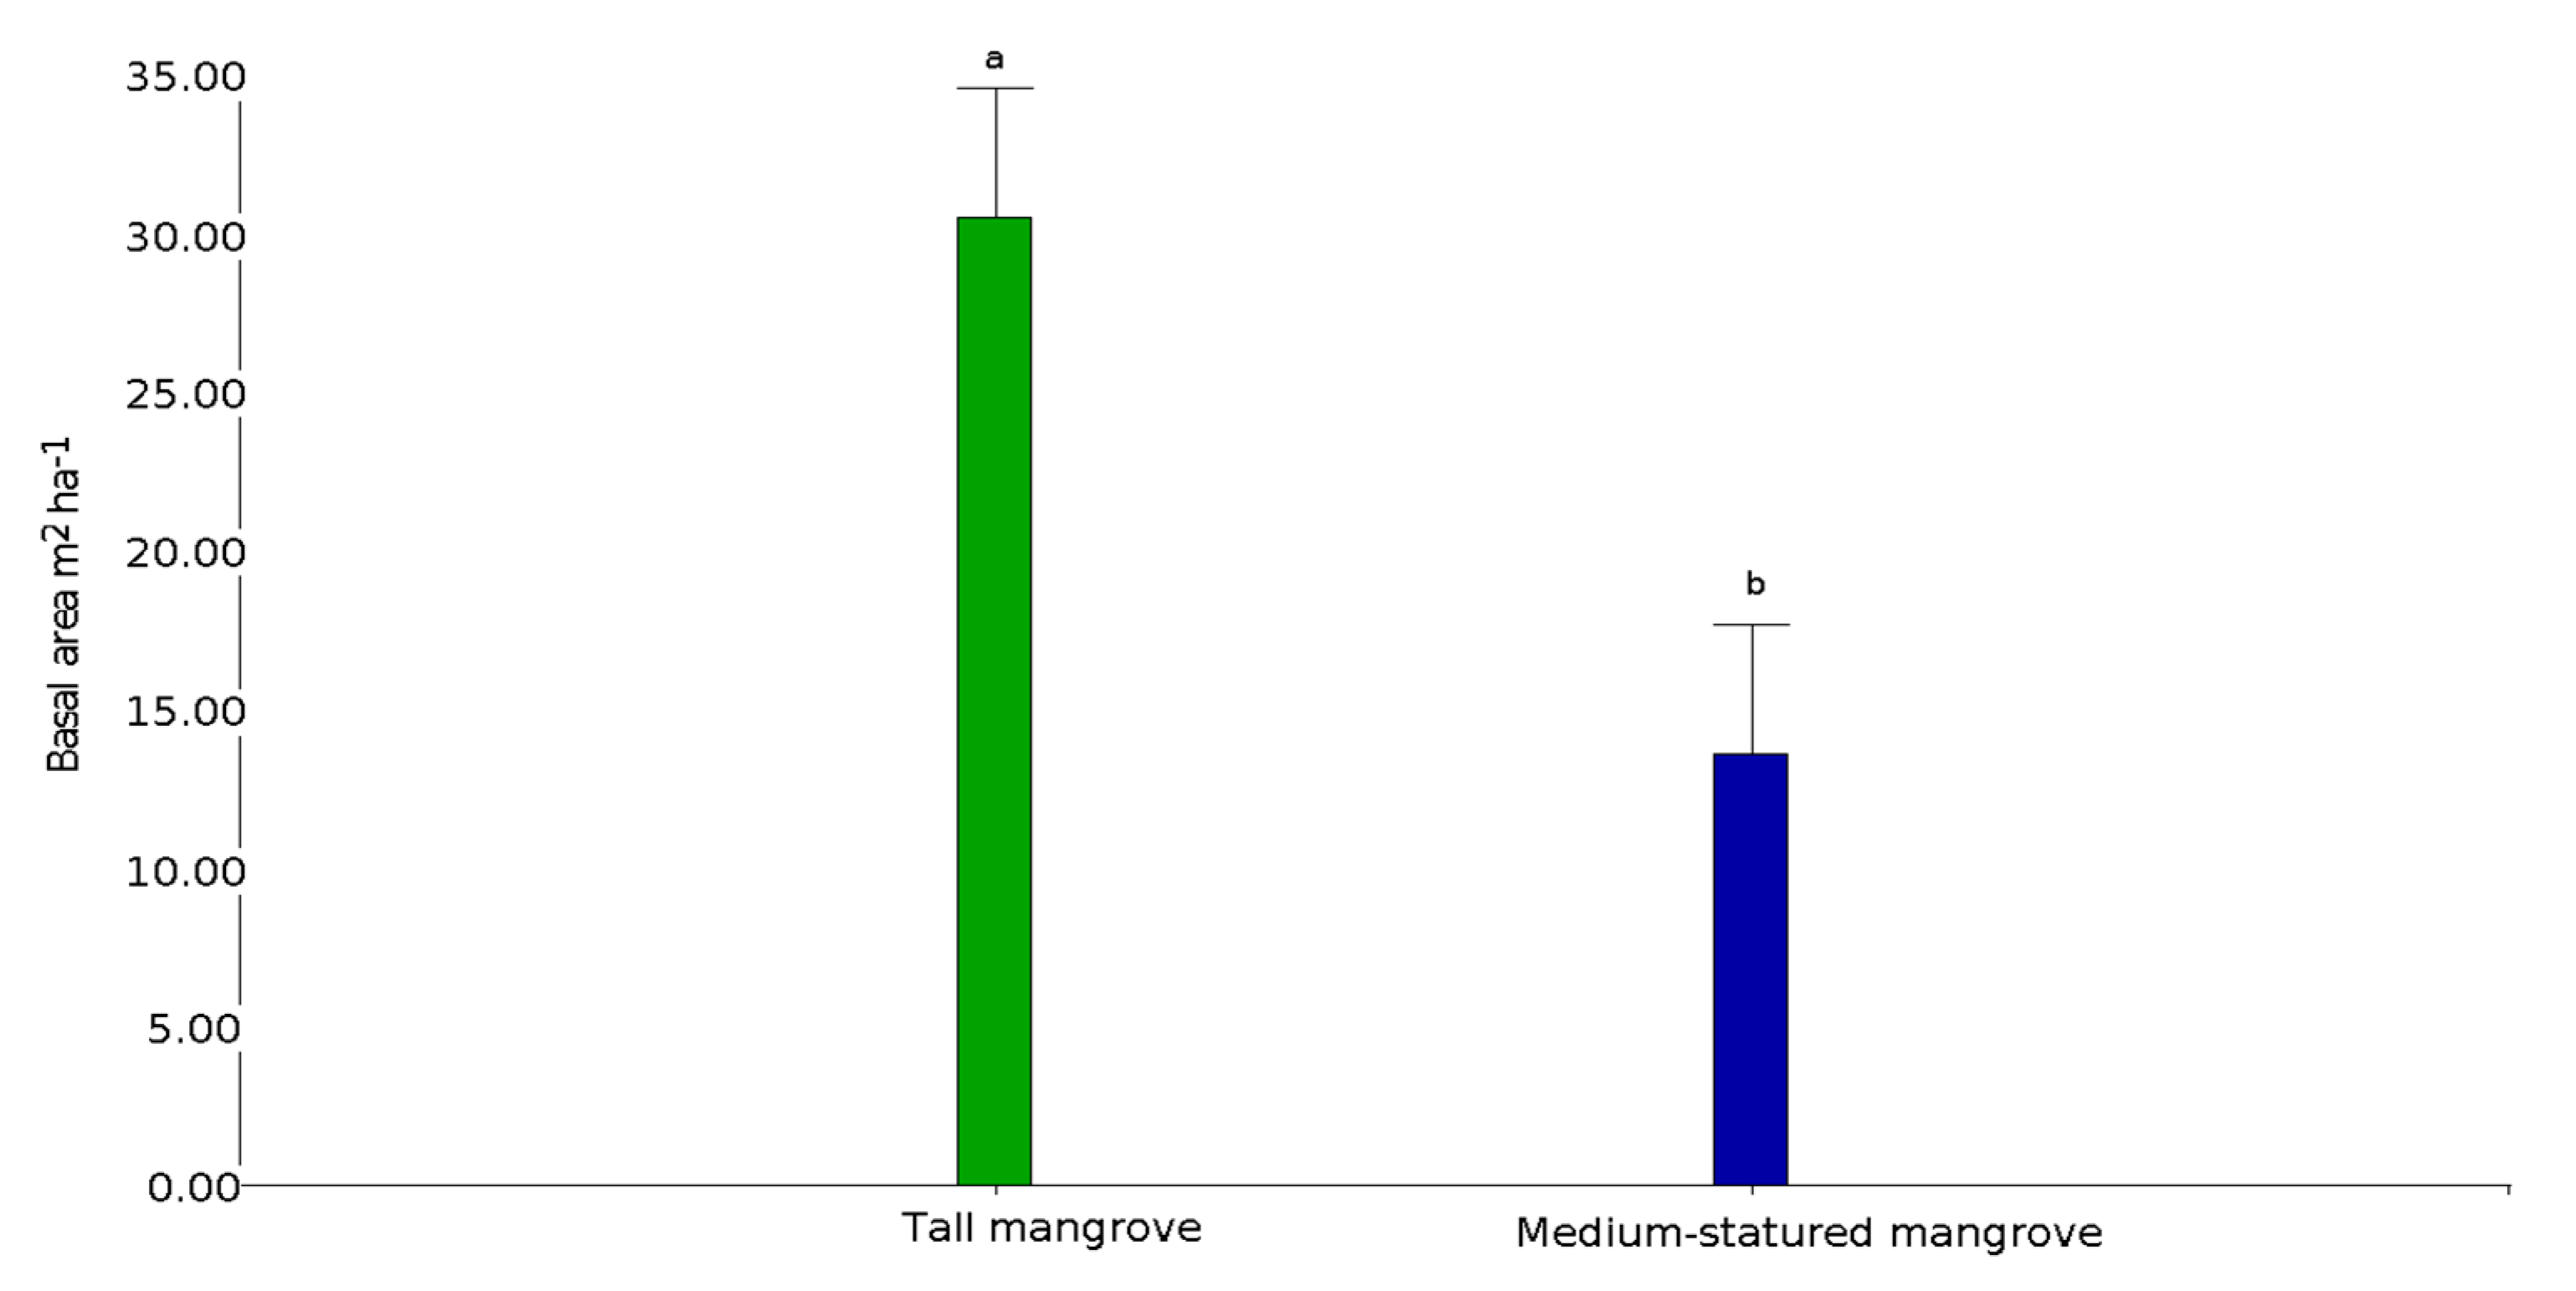
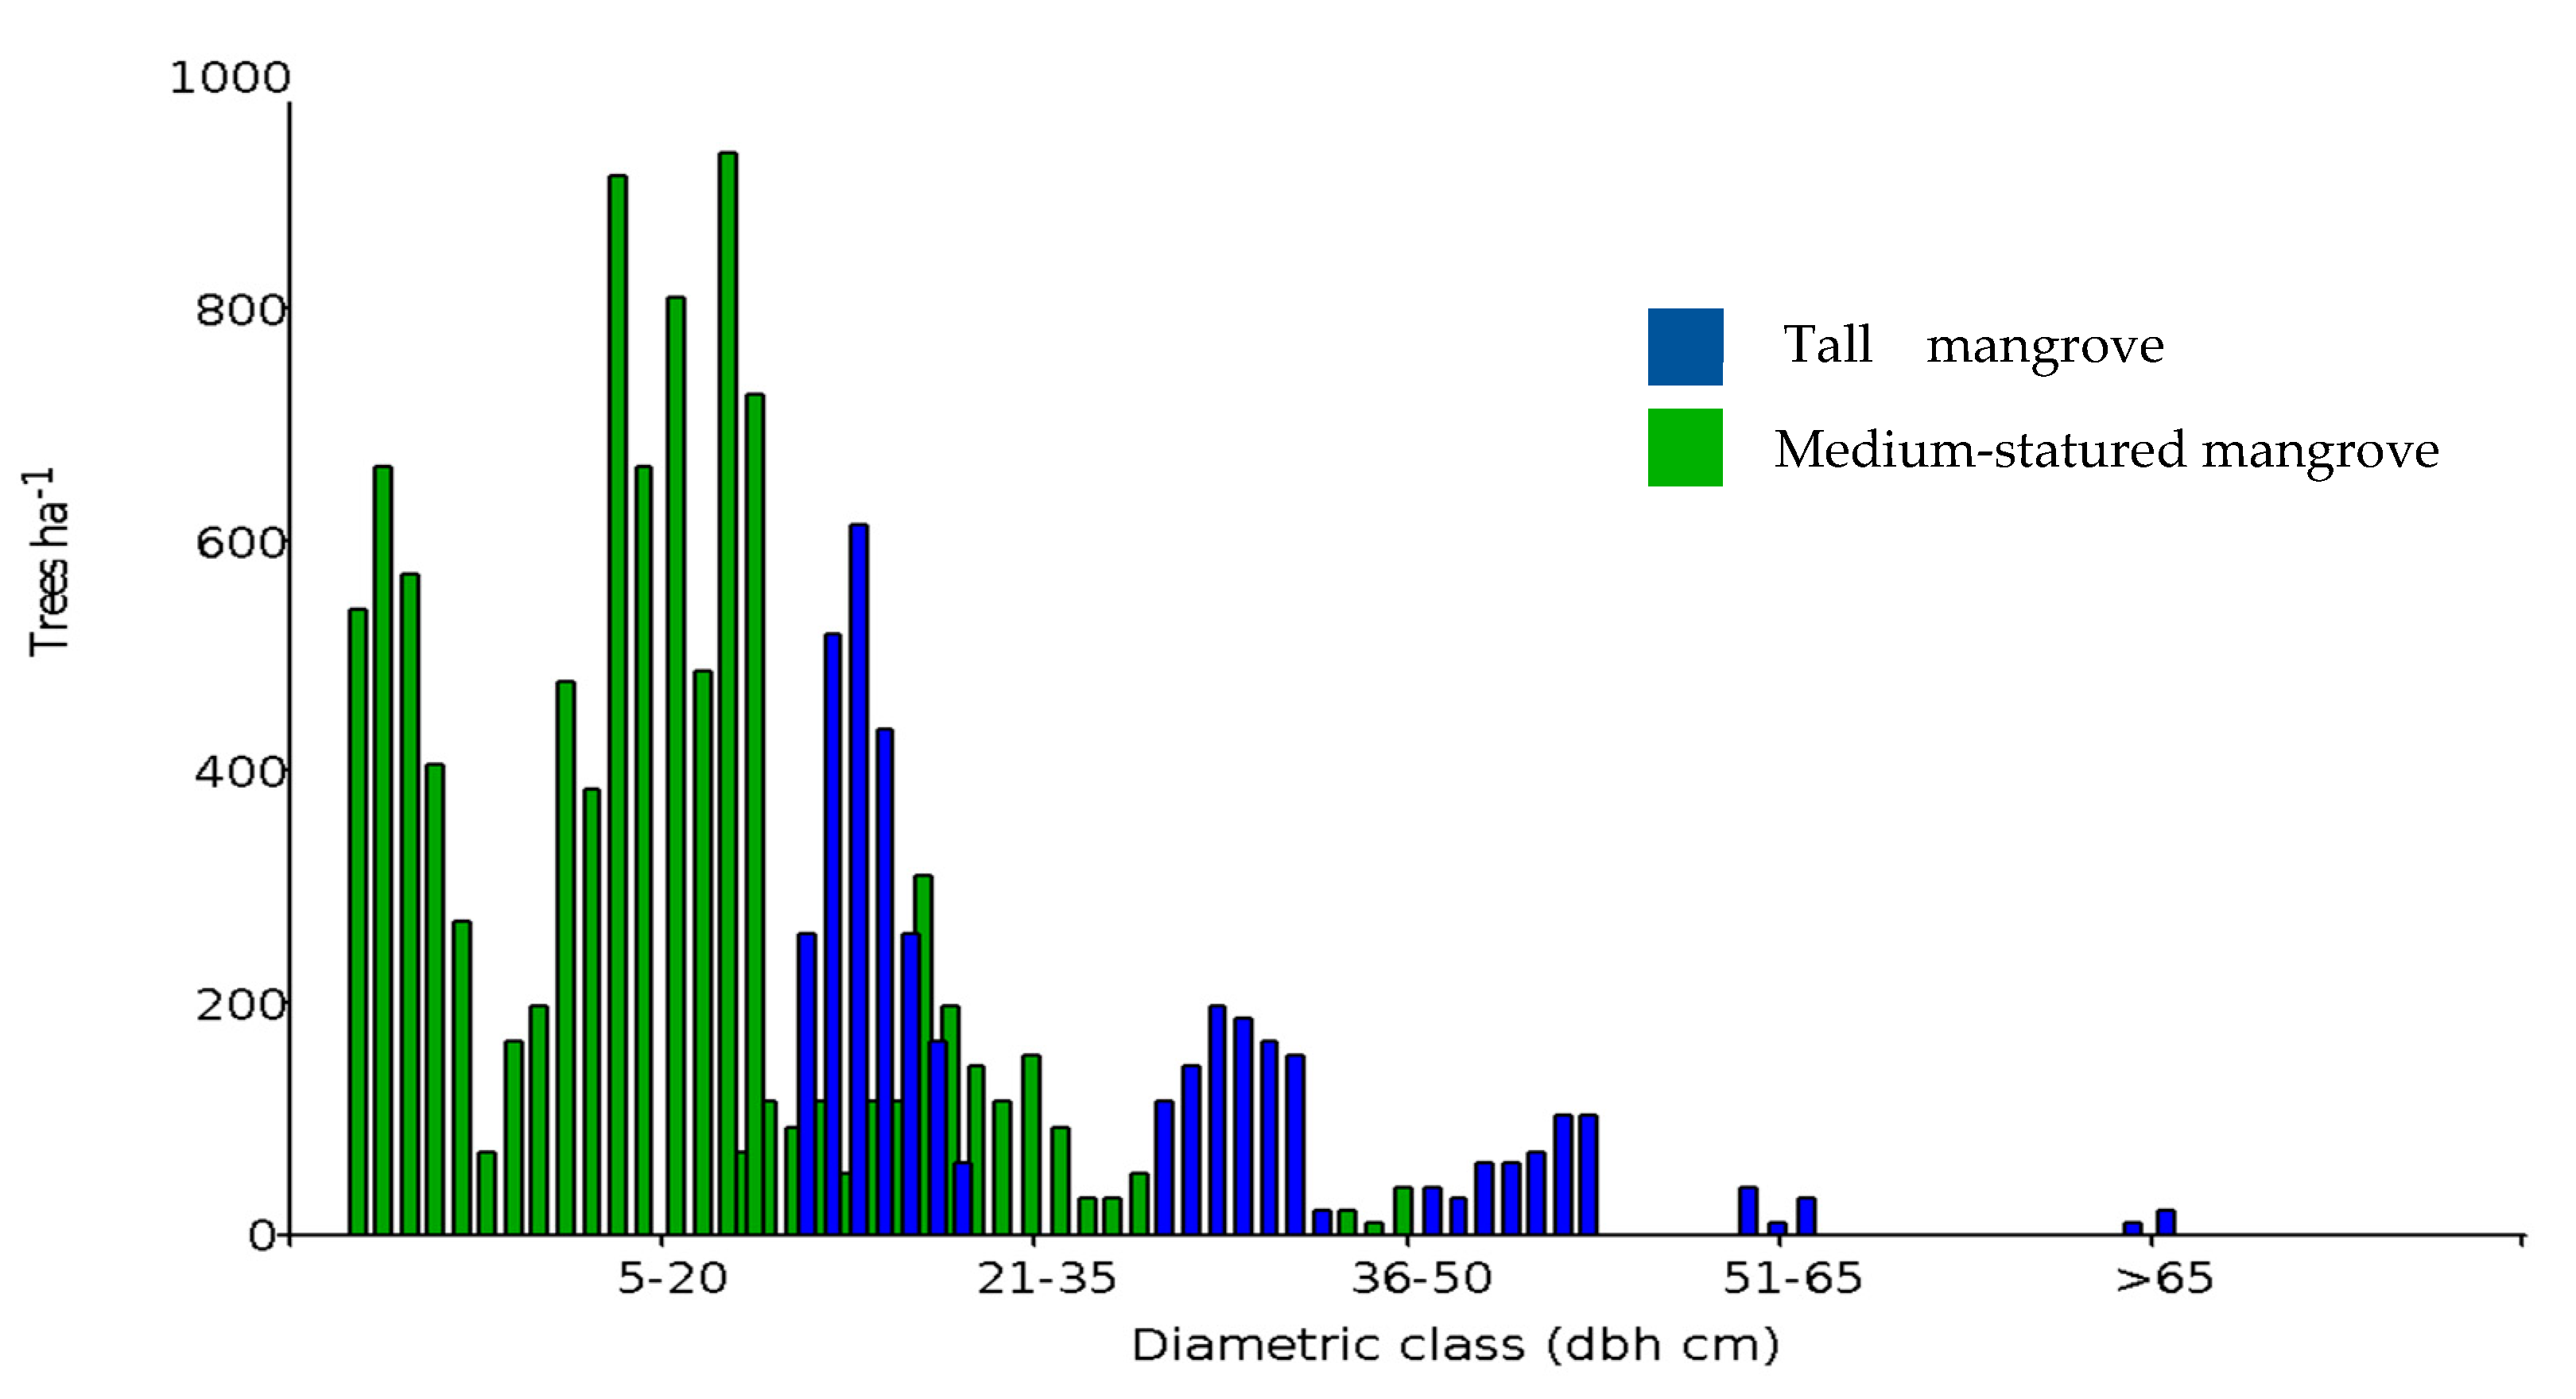
In the Gulf of Guayaquil, we identified 117,746 ha of medium-statured mangroves, 16,317 ha of tall mangroves, and 163,950 ha of shrimp farms (Figure 1). Due to the homogeneity in the composition of species present in the sampled transects, it was not possible to differentiate forest community types. However, basal area allowed us to differentiate the structure of the trees present in the two strata (Figure 3). The structure of both mangrove strata also differs, with a large presence of trees with 5–20 cm diameters and a low presence of trees of 36–50 cm in diameter in medium-statured mangrove. In contrast, tall mangroves showed a diameter distribution biased towards larger trees, exceeding the dbh > 50 cm category and reaching up to > 65 cm (Figure 4).
Rhizophora mangle (red mangrove) and Laguncularia racemosa var. glabriflora (white mangrove) were present in both mangrove strata. We found red mangrove relative abundances of 99.6% and of 0.3% for white mangroves in medium-statured mangroves, respectively, while their relative dominances were 91.1% and 8.8%, respectively. The average height for these strata was 17 ± 4 m, with a maximum height of 34 m. The average basal area was 15.4 ± 6.5 m2 ha−1, and tree density reached 834 ± 410 ha. For tall mangroves, we found relative abundances of 96.2 and 3.7% and relative dominances of 95.2% and 5% for red and white mangroves, respectively. The average tall mangrove strata height was 17.9 ± 4.1 m, with a maximum height of 38 m. The average basal area was 30.8 ± 6.7 m2 ha−1 and the tree density reached 827 ± 388 ha (Table 2). Although similar in density, tall mangroves had twice the basal area as the medium-statured mangroves.
3.2. Aboveground Carbon
Aboveground carbon ranged from 73.6 ± 8.3 Mg C ha−1 in medium-statured mangroves to 192.2 ± 29.2 Mg C ha−1 in tall mangroves. We found statistical differences in aboveground C with respect to the marine ecotone; in medium-statured mangroves only, carbon decreased beyond 100 m inside the mangrove forest (Table 3).
3.3. Soil Carbon
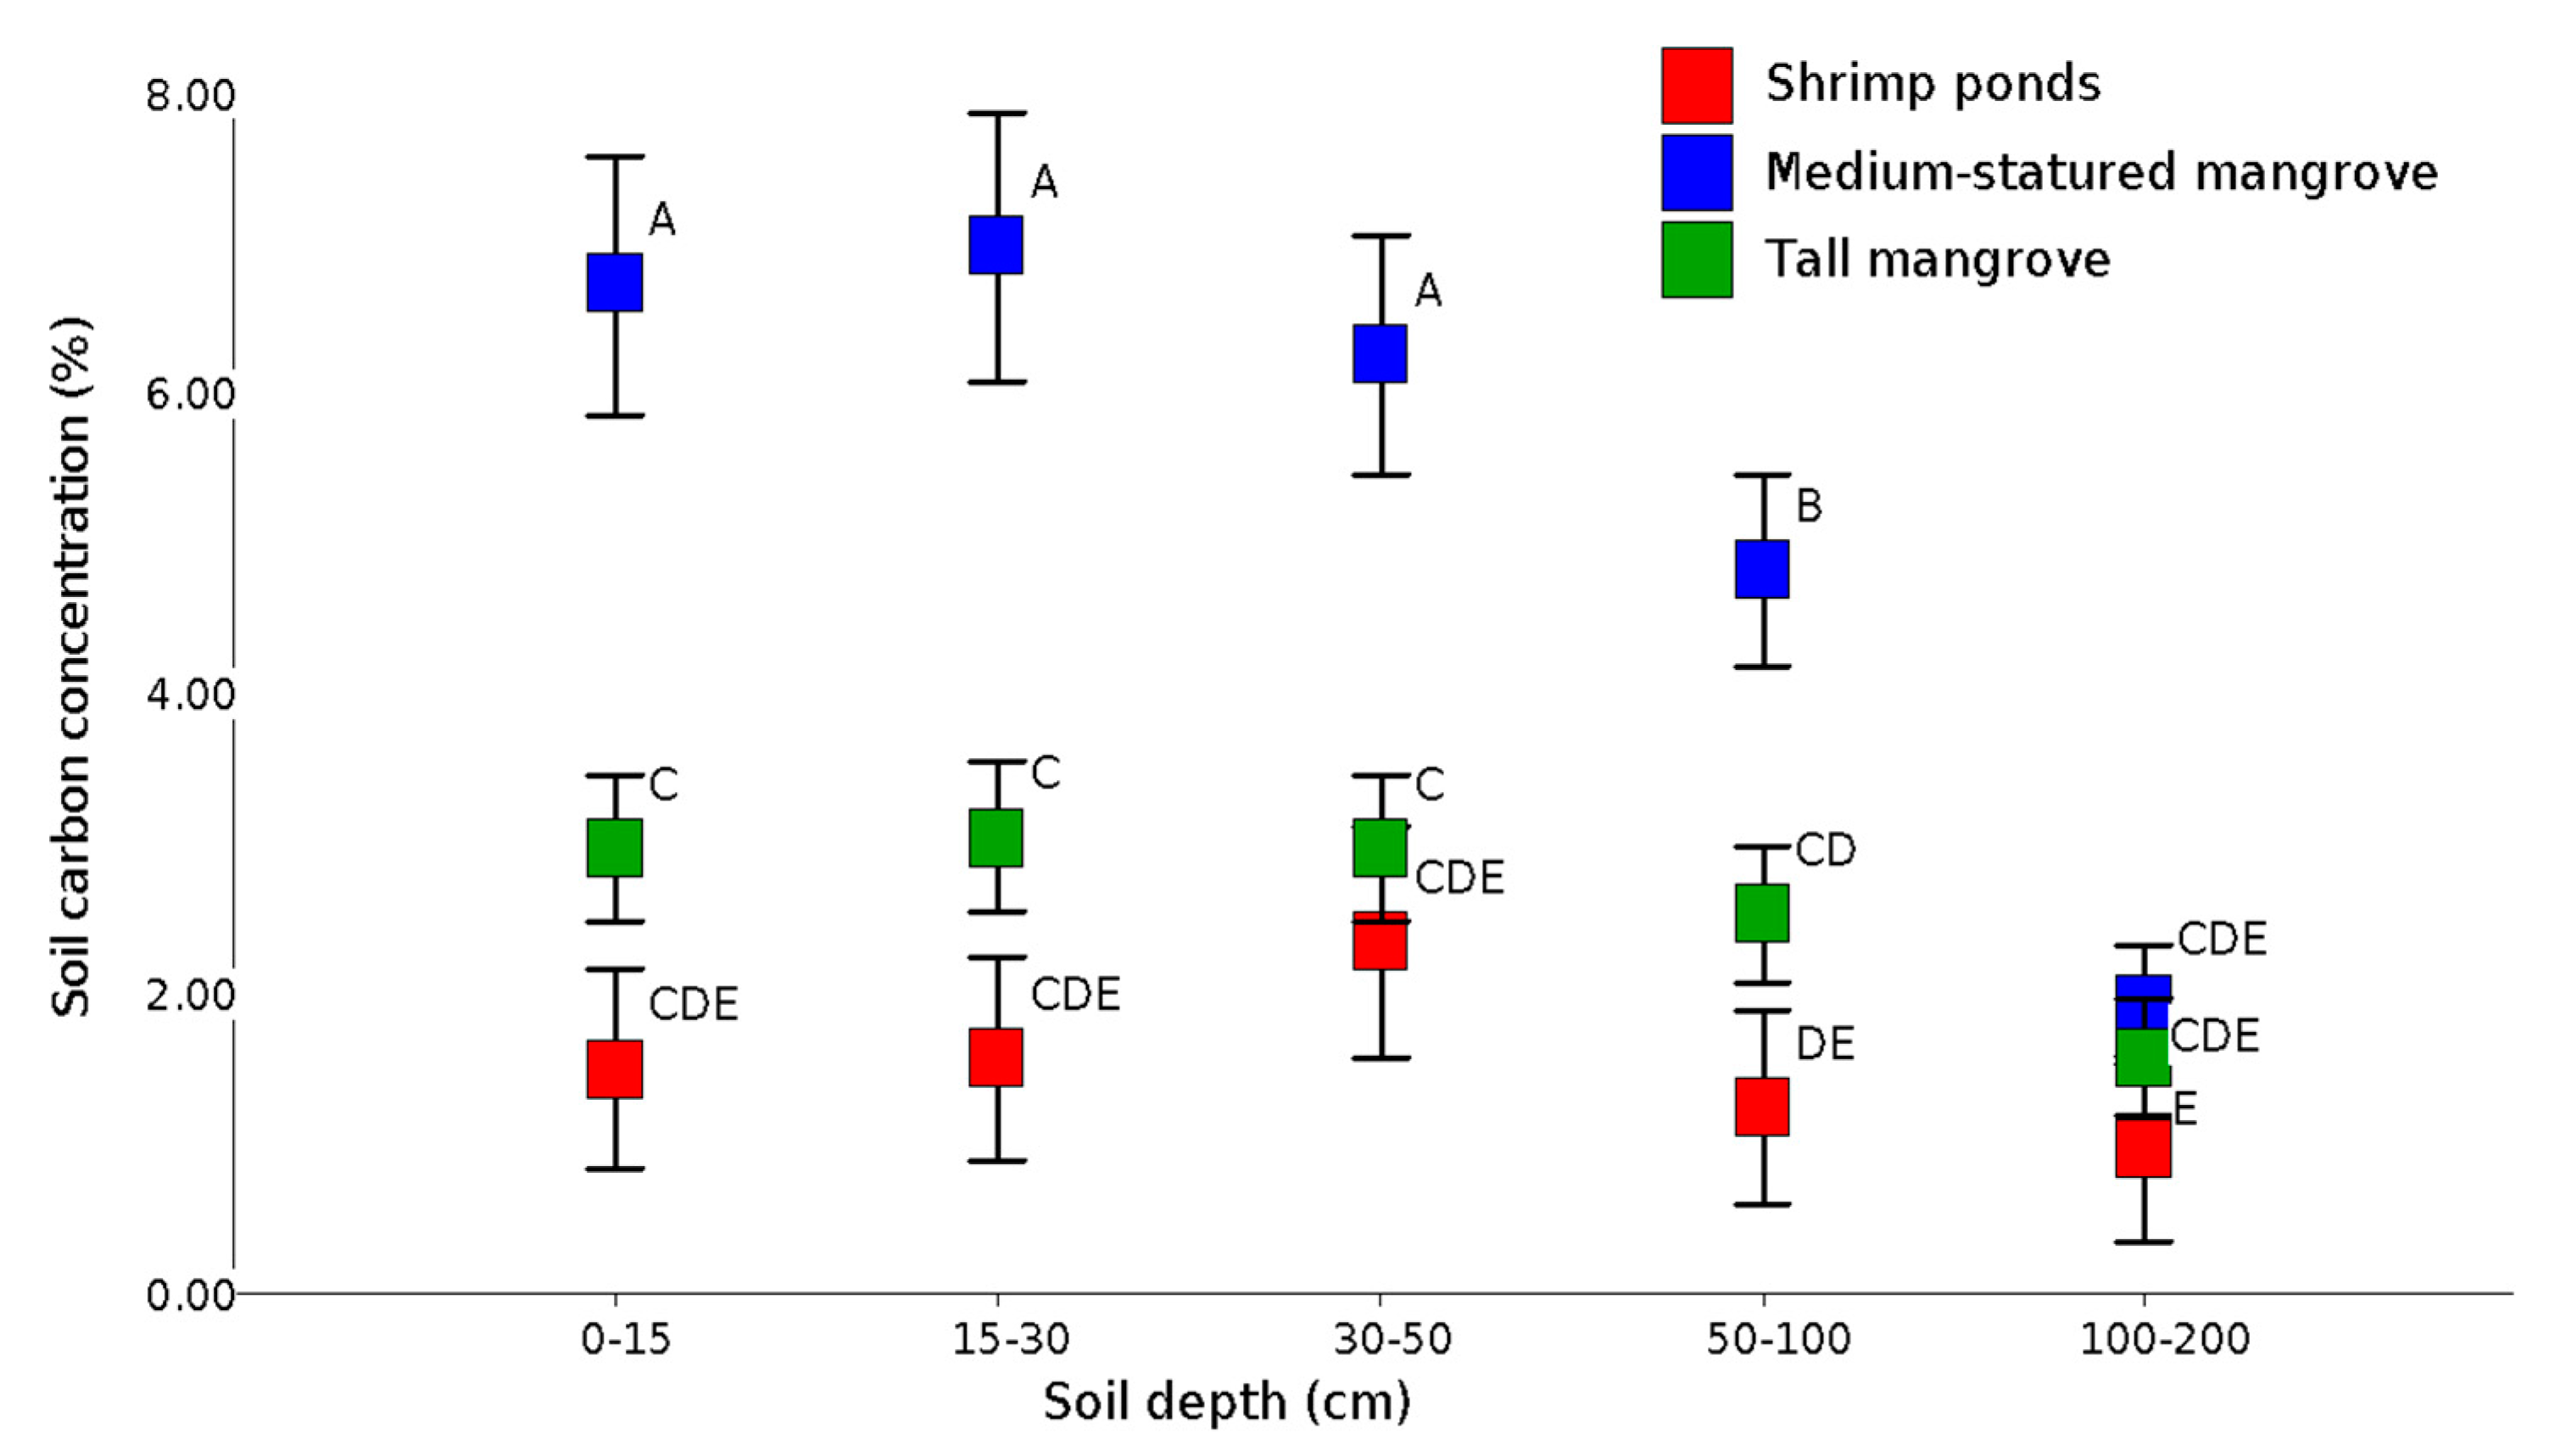
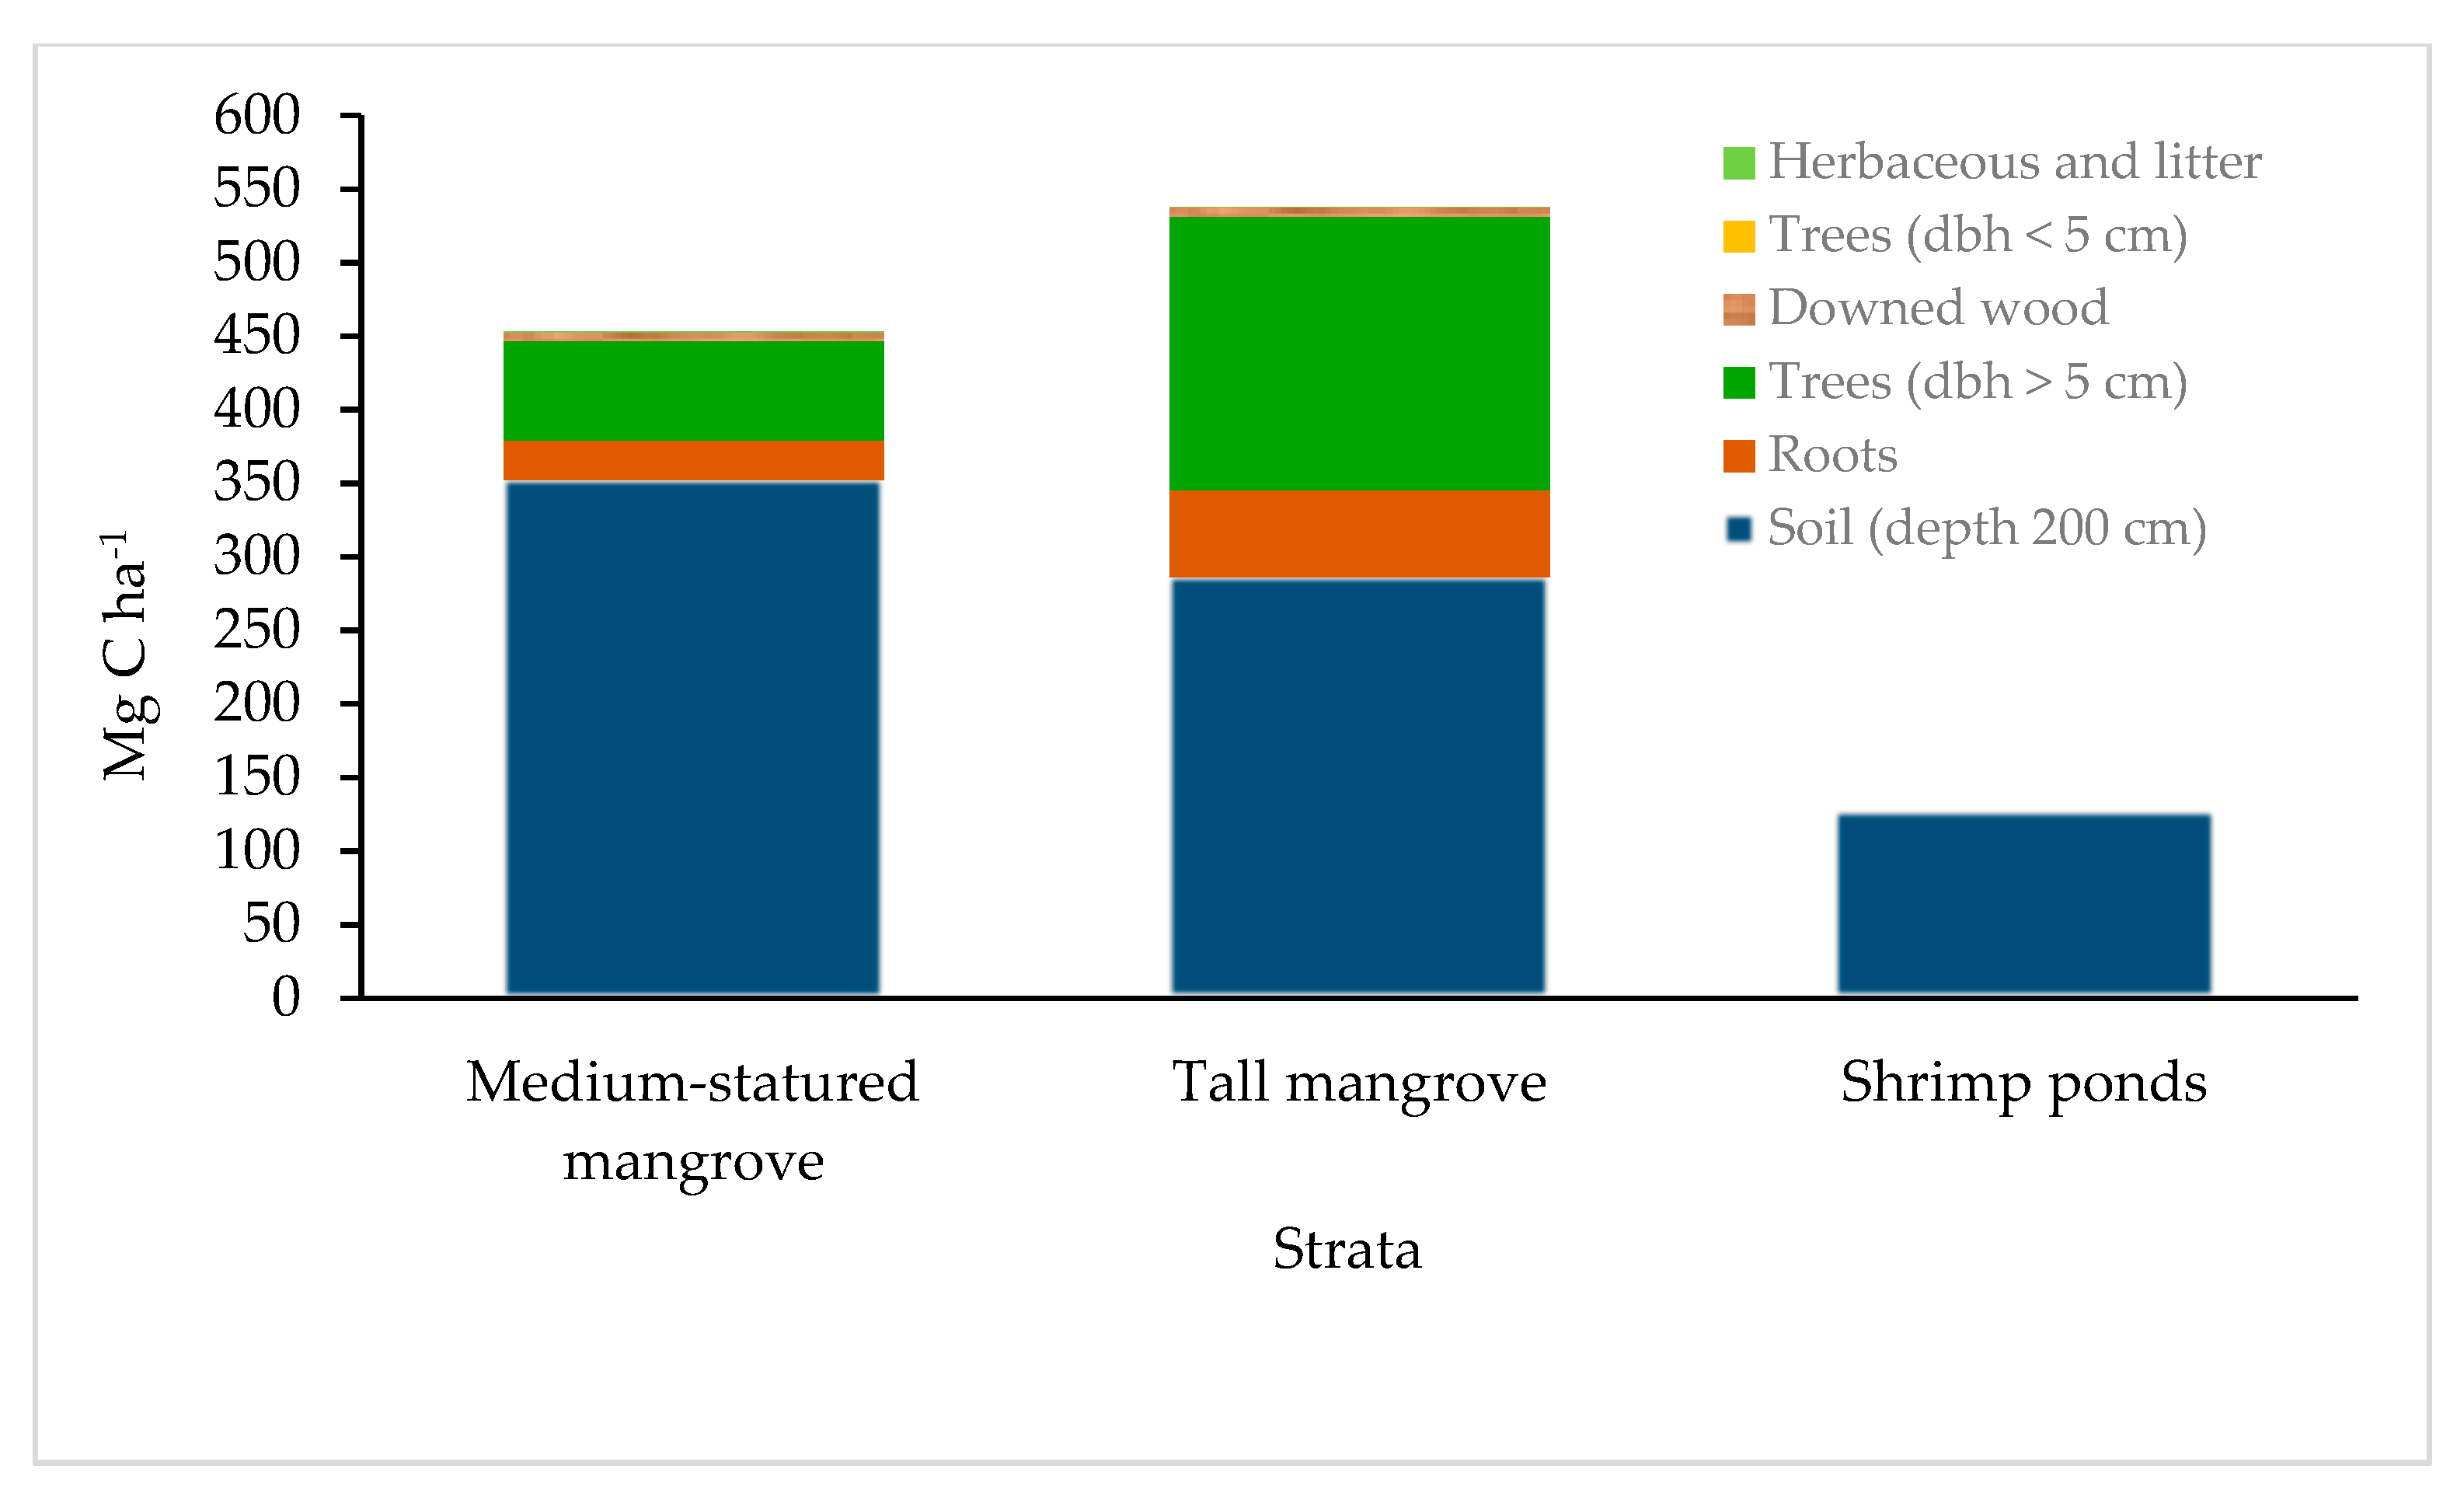
Soil C concentrations decreased with depth and are statistically different (p < 0.05) at 1 m depth, but at greater depths (Figure 5). This suggests that soil C in the surface layers is most affected by the conversion from mangroves to shrimp farms (Figure 5). Carbon stocks in roots and sediments at 1 m depth were 247.3 ± 21.8 in medium-statured mangroves and 227.2 ± 26.7 Mg C ha−1 in tall mangroves. In addition, at a depth of 2 m, we found 379.2 ± 30.3 and 345.4 Mg C ha−1, respectively. In shrimp ponds, the average stocks were 81.9 ± 13.6 Mg C ha−1 at 1 m depth and 126.9 ± 16.3 Mg C ha−1 at 2 m depth, 50% less than the soil carbon stocks under mangrove forests (Figure 6).
3.4. Total Carbon Stocks
The total carbon stock of the gulf of Guayaquil was 320.9 ± 20.8 Mg ha−1 to 1 m soil depth and 452.8 ± 28.3 Mg ha−1 to 2 m soil depth for medium-statured mangroves. For tall mangroves, those stocks were 419.4 ± 55 and 537.6 ± 72.3 Mg C ha−1 for the same respective soil depths. In sharp contrast, shrimp farms had soil stocks of 81.9 ± 13.69 Mg C ha−1 and 126.9 ± 16.3 Mg C ha−1, also at 1 and 2 m depths, respectively. Thus, we can infer that land use change caused the loss of 70% of C stored in the ecosystem (Table 4).
Carbon stocks at the landscape level add to 37,790,578.7 Mg C in medium-statured mangroves, 6,844,224.4 Mg C in tall mangroves, and only 12,610,084.0 Mg C in shrimp farms. The gulf ecosystem stores over 57 million Mg C stored, which is equivalent to more than 210 million Mg of CO2e (Table 5). Since 80% of those stocks are stored in the mangroves, their large importance as C sinks at the ecosystem and landscape levels is emphasized.
4. Discussion
4.1. Mangrove Forest Strata
The mangrove forests in the gulf of Guayaquil are mainly dominated by three species: Rhizophora mangle, Laguncularia racemose, and Avicennia germinans, with associations of R. mangle with L. racemosa in small areas [34,35]. The abundance and dominance of R. mangle reached 99%, with maximum heights of around 40 m and dbh measurements between 0.10 and 165, similar to previous reports [36]. Rhizophora′s dominance could be attributed to its greater rates of establishment and development due to its propagule dispersal strategy [34]. The opposite happens with seeds of other mangrove species, which face difficulties in germinating and becoming established [2]. Additionally, physiological tolerance of some mangrove species to a variety of geophysical factors may also explain the higher dominance of this species [37].
4.2. Aboveground Carbon
We measured carbon stocks of 73.6 Mg C ha−1 for medium-statured mangroves, similar to estimates of 92.56 Mg C ha−1 in fringe mangroves in Brazil [38] (Table 4). Our estimate of aboveground carbon in tall mangroves was 192.2 Mg C ha−1, 26% greater than in the riparian mangrove forests of Cayapas Mataje reserve in northern Ecuador [39]. Overall, our aboveground carbon estimates match those from other Latin America mangrove forests (Table 6).
Aboveground carbon differences in the two mangrove strata are closely related with overall forest structure (tree diameter and density, basal area, and height), with greater aboveground carbon increasing with diameter and height [41]. Additionally, these values might be attributed to various environmental factors, net primary productivity, and anthropogenic and natural disturbances, as well as the aggregation rates of organic allochthonous material [42].
Medium-statured forests receive scarce contribution of fresh water since the average precipitation is 400 mm, which allows a deep intrusion of saline water, it could increase stress and lower productivity of the aerial biomass [43]. Additionally, aboveground carbon could be limited by sediment inputs that limit the availability of soil nutrients [44]. In contrast, tall mangrove forests receive freshwater discharge from surrounding mountains, and precipitation exceeds 885 mm y−1, causing salinity to be lower. The more favorable environment results in greater tree height and dbh [2,45]. This suggests that larger aboveground carbon stocks in the study area are related to quality of the upstream sediment and higher soil fertility [32].
The differences we found in aboveground carbon of medium-statured mangroves relative to the distance from the shore (Table 3) coincide with other studies, which also found lower aboveground C at 110 m from the canal in Caribbean mangroves [46]. These differences are attributed to physiographic heterogeneity, tidal amplitude, and salinity intrusion, which affect mangrove tree size and forest structure, as well as species composition [45].
4.3. Soil Carbon
The soil C concentration (%) for both strata indicates there is greater carbon accumulation in the first centimeters of the soil profile (Figure 5). Our results are similar to data from mangroves in Brazil and Mozambique, which showed the highest organic carbon content in the first 60–100 cm of the profile [47,48]. These results might be attributed to high biological activity and decomposition rates near the soil surface [49]. Additionally, processes such as carbon diagenesis results in the gradual degradation of labile carbon, resulting in a decrease of organic matter with increasing soil depth [50]. In addition, this pattern is attributed to the decline in biological processes and anoxic conditions [10,51]
We found higher soil C concentrations in medium-statured mangroves than in tall mangroves. This finding might be attributed to this stratum having saturated soil conditions that promote retention of organic matter and restrict soil respiration, resulting in reduced decomposition rates of organic matter and mineralization of C [1,47,49]. These differences might also be related to the inputs of organic matter such as litter, decaying roots, exudates from roots, microbial biomass, and the activity of micro- and mesofauna [8,52,53]. These factors are directly related to the availability of oxygen, nutrients, and temperature and low availability of cations that support the formation and stability of humic substances in the soil [52]. Finally, heterogeneous spatial characteristics present in intertidal environments and differences in soil texture could also be influencing soil carbon concentration [54,55].
Soil and roots carbon stocks at depths of 0–100 cm of medium-statured mangroves reached 247.3 Mg C ha−1 and were not significantly different from that of tall mangroves (227.2 Mg C ha−1). These results are 62%–68% lower than those reported in mangrove forests in northern Ecuador [39]. However, data from our study are similar to those in Pacific mangroves of Costa Rica, with 297.7 Mg C ha−1 [45], and values between 183 and 246 Mg C ha−1 in mangrove forests of coastal Australia [56]. Further, our results are close to C estimates in Caribbean and South African mangroves (266 Mg C ha−1 and 176.9 to 262 Mg C ha−1, respectively) [40,57].
Carbon stocks for shrimp ponds were 81.9 Mg C ha−1 (soil and roots), only 26% of those in mangrove forests. Similar to other studies [40], we found that land use change from mangrove to aquaculture use represented the decrease of more than 50% of soil carbon stocks. This confirms that anthropogenic activities contribute enormously to soil carbon losses from conversion [58]. The loss of soil C stocks occurs when mangrove trees are cut down and large quantities of soil is removed for construction of ponds. This promotes oxidation of carbon, which results in CO2 emissions to the atmosphere [59,60]. The loss of carbon stocks in mangrove soils could account for 12% of total emissions from global tropical deforestation and 10% of worldwide deforestation [40,61].
4.4. Total Carbon Stocks
Our results are lower than those for Central and South America mangrove forests [40,62], ranging from only 9%–17% of total stocks in those studies in shrimp ponds to 34–89% in medium-statured and tall mangroves (Table 5). However, our carbon stock estimates for tall mangroves are similar to those made for Colombian Pacific mangroves (400 Mg C ha−1) [63]. These differences could be related to differences in tree species composition and forest structure, forest conservation status, soil depth, carbon concentration, and freshwater proximity [32,63,64].
Soil carbon stocks in both mangrove strata represented about 80% of the total ecosystem stocks in our study. These results agree with estimations by Donato [10] and Kauffman [40], who indicate that between 49 and 90% of total mangrove ecosystem carbon is stored in soil [56], and highlight the role of mangrove soil as an important carbon pool. Locally, land use change to shrimp ponds is causing the loss of more than 90% of carbon stored in undisturbed mangrove forests [65], while globally, the conversion of coastal ecosystems to other land uses contributes with 3%–19% of CO2 emissions caused by deforestation [66].
Starting in 1960 and facilitated by the lack of legal protection and enforcement, mangrove forests in Ecuador were converted to shrimp aquaculture because this became one of the most important income streams for the country. Our study estimated carbon stocks in mangrove forests and shrimp ponds to show the future potential of mangrove forests in climate change mitigation, as the areas originally lost can be restored back into mangrove forests. The results underline the importance of conservation and management measures as well as the inclusion of these ecosystems in mechanisms such as REED + for protecting stored carbon. Additionally, this article contributes to a better understanding of impacts of land use change, and it provides information for decisionmakers to support and take action for the protection of mangrove forests.
5. Conclusions
Our study describes two strata of mangrove cover (medium-statured and tall) and one of aquaculture use (shrimp farms) in the Gulf of Guayaquil. The area of shrimp production currently exceeds the area of mangrove forests because of historical mangrove forest clearing. The mangrove areas show differences in aboveground carbon stocks, attributed to environmental factors such as saline water intrusion and variability of average annual precipitation, which controls freshwater inputs into the system. Belowground C stocks triple those found in shrimp farms, and our results show that the greatest impact of land conversion is seen in the first 100 cm of the soil profile.
Currently, carbon storage in mangrove forests attracts global attention because of the climate change mitigation potential, and thus it is necessary to continue improving our knowledge of aboveground and belowground C stocks, particularly focusing on the mechanisms behind the C accumulation, which we do not directly address in our study. Determining carbon stocks at the landscape level is the first step to include these ecosystems in climate action mechanisms such as REED+, which would help ensure their conservation and enhancement of the stored carbon. This information can also be included in global C measurements or at country level and serve as an important resource for establishing mitigation and adaptation initiatives to climate change, such as that which Costa Rica and Colombia did recently by including blue carbon targets in their Nationally Determined Contributions (NDC) to the UNFCCC.
Author Contributions
Conceptualization, J.M.-G., M.C.-J. and F.C.; methodology, J.M.-G. and M.C.-J.; formal analysis, J.M.-G. and F.C.; investigation and resources, J.M.-G.; data curation, J.M.-G. and P.O.; writing—original draft preparation, J.M.-G., M.C.-J., F.C. and P.O.; writing—review and editing, J.M.-G., M.C.-J., D.D.-R., F.C. and P.O.; visualization, J.M.-G. and P.O.; supervision, F.C. and M.C.-J.; project administration, J.M.-G., M.C.-J., D.D.-R. and F.C.; funding acquisition, J.M.-G. All authors have read and agreed to the published version of the manuscript.
Funding
This research was funded by Conservation International Ecuador (CI). This article has been published by the financial support of Departmento de Investigación de la Universidad de Cuenca (DIUC).
Acknowledgments
The corresponding author express her special thanks to all professors of the Master’s degree in Management and Conservation of Tropical Forest and Biodiversity from Centro Agronómico Tropical de Investigation y Enseñanza (CATIE) for their support. Additionally, we acknowledge the local community “Cerritos de los Moreños”, “Buenavista”, and “Puerto Roma” for facilitating entry to the research sites, as well as the assistants for their contribution in data collection.
Conflicts of Interest
The authors declare no conflict of interest.
References
- Inoue, T. Carbon Sequestration in Mangroves. In Blue Carbon in Shallow Coastal Ecosystems: Carbon Dynamics, Policy, and Implementation; Kuwae, T., Hori, M., Eds.; Springer: Singapore, 2019; pp. 73–99. ISBN 9789811312953. [Google Scholar]
- Spalding, M.D.; Kainuma, M.; Collins, L. World Atlas of Mangroves; Earthscan: London, UK, 2010. [Google Scholar]
- Hamilton, S.E.; Casey, D. Creation of a high spatio-temporal resolution global database of continuous mangrove forest cover for the 21st century (CGMFC-21). Glob. Ecol. Biogeogr. 2016, 25, 729–738. [Google Scholar] [CrossRef]
- Cucalón, E. Sistemas Biofísicos y Pesca En El Golfo de Guayaquil: Componente de Oceanografía y Sstemas Físicos; Informe de Consultoría: Guayaquil, Ecuador, 1996; 103p. [Google Scholar]
- Adame, M.F.; Kauffman, J.B.; Medina, I.; Gamboa, J.N.; Torres, O.; Caamal, J.P.; Reza, M.; Herrera-Silveira, J.A. Carbon Stocks of Tropical Coastal Wetlands within the Karstic Landscape of the Mexican Caribbean. PLoS ONE 2013, 8, e56569. [Google Scholar] [CrossRef] [Green Version]
- Sanders, C.J.; Smoak, J.M.; Naidu, A.S.; Sanders, L.M.; Patchineelam, S.R. Organic carbon burial in a mangrove forest, margin and intertidal mud flat. Estuar. Coast. Shelf Sci. 2010, 90, 168–172. [Google Scholar] [CrossRef]
- Alongi, D.M. Carbon Cycling and Storage in Mangrove Forests. Annu. Rev. Mar. Sci. 2014, 6, 195–219. [Google Scholar] [CrossRef]
- Alongi, D.M. Carbon Cycling in the World’s Mangrove Ecosystems Revisited: Significance of Non-Steady State Diagenesis and Subsurface Linkages between the Forest Floor and the Coastal Ocean. Forests 2020, 11, 977. [Google Scholar] [CrossRef]
- Alongi, D.M. Mangrove Forests. In Blue Carbon: Coastal Sequestration for Climate Change Mitigation; Alongi, D.M., Ed.; Springer Briefs in Climate Studies; Springer International Publishing: Cham, Switzerland, 2018; pp. 23–36. ISBN 978-3-319-91698-9. [Google Scholar]
- Donato, D.C.; Kauffman, J.B.; Murdiyarso, D.; Kurnianto, S.; Stidham, M.; Kanninen, M. Mangroves among the most carbon-rich forests in the tropics. Nat. Geosci. 2011, 4, 293–297. [Google Scholar] [CrossRef]
- Nellemann, C.; Corcoran, E. Blue Carbon: The Role of Healthy Oceans in Binding Carbon: A Rapid Response Assessment; UNEP/Earthprint: Arendal, Norway, 2009; ISBN 978-82-7701-060-1. [Google Scholar]
- Laumonier, Y.; Edin, A.; Kanninen, M.; Munandar, A.W. Landscape-scale variation in the structure and biomass of the hill dipterocarp forest of Sumatra: Implications for carbon stock assessments. For. Ecol. Manag. 2010, 259, 505–513. [Google Scholar] [CrossRef]
- Atwood, T.B.; Connolly, R.M.; Almahasheer, H.; Carnell, P.E.; Duarte, C.M.; Ewers Lewis, C.J.; Irigoien, X.; Kelleway, J.J.; Lavery, P.S.; Macreadie, P.I.; et al. Global patterns in mangrove soil carbon stocks and losses. Nat. Clim. Chang. 2017, 7, 523–528. [Google Scholar] [CrossRef]
- Valiela, I.; Bowen, J.L.; York, J.K. Mangrove Forests: One of the World’s Threatened Major Tropical Environments: At least 35% of the area of mangrove forests has been lost in the past two decades, losses that exceed those for tropical rain forests and coral reefs, two other well-known threatened environments. BioScience 2001, 51, 807–815. [Google Scholar]
- Cebrian, J. Variability and control of carbon consumption, export, and accumulation in marine communities. Limnol. Oceanogr. 2002, 47, 11–22. [Google Scholar] [CrossRef] [Green Version]
- Lovelock, C.E.; Ruess, R.W.; Feller, I.C. CO2 Efflux from Cleared Mangrove Peat. PLoS ONE 2011, 6, e21279. [Google Scholar] [CrossRef] [PubMed] [Green Version]
- Giri, C.; Ochieng, E.; Tieszen, L.L.; Zhu, Z.; Singh, A.; Loveland, T.; Masek, J.; Duke, N. Status and distribution of mangrove forests of the world using earth observation satellite data. Glob. Ecol. Biogeogr. 2011, 20, 154–159. [Google Scholar] [CrossRef]
- van der Werf, G.R.; Morton, D.C.; DeFries, R.S.; Olivier, J.G.J.; Kasibhatla, P.S.; Jackson, R.B.; Collatz, G.J.; Randerson, J.T. CO2 emissions from forest loss. Nat. Geosci. 2009, 2, 737–738. [Google Scholar] [CrossRef]
- Centro de Levantamientos Integrados de Recursos por Sensores Remotos (CLIRSEN). Estudio Multitemporal de los Manglares, Camaroenras y Areas Salinas de la Costa Ecuatoriana; CLIRSEN: Quito, Ecuador, 1990. [Google Scholar]
- Rossel, F.; Cadier, E. El Niño and prediction of anomalous monthly rainfalls in Ecuador. Hydrol. Process. Int. J. 2009, 23, 3253–3260. [Google Scholar] [CrossRef]
- Vera, T. Manejo Ambiental Integrado de la Acuicultura del camarón en el Golfo de Guayaquil Apoyado en Sistemas de Información Geográfica. Bachelor’s Thesis, Escuela Politécnica del Litoral, Guayaquil, Ecuador, 2003. [Google Scholar]
- MAE (Ministerio del Ambiente del Ecuador); FAO (Organización de las Naciones Unidas para la Alimentación y la Agricultura). Árboles y Arbustos de los Manglares del Ecuador; Ministerio del Ambiente del Ecuador: Quito. Ecuador, 2014; 48p. [Google Scholar]
- Lugo, A.E.; Snedaker, S.C. The Ecology of Mangroves. Annu. Rev. Ecol. Syst. 1974, 5, 39–64. [Google Scholar] [CrossRef]
- Kauffman, J.B.; Donato, D.C.; Adame, M.F. Protocolo Para la Medición, Monitoreo y Reporte de la Estructura, Biomasa y Reservas de Carbono de los Manglares; Documento de trabajo 117; CIFOR: Bogor, Indonesia, 2013. [Google Scholar]
- Murdiyarso, D.; Donato, D.; Kauffman, J.B.; Kurnianto, S.; Stidham, M.; Kanninen, M. Carbon storage in mangrove and peatland ecosystems: A preliminary account from plots in Indonesia. Bogor Indonesia Cent. Int. For. Res. 2010, 35, 1–35. [Google Scholar]
- Fromard, F.; Puig, H.; Mougin, E.; Marty, G.; Betoulle, J.L.; Cadamuro, L. Structure, above-ground biomass and dynamics of mangrove ecosystems: New data from French Guiana. Oecologia 1998, 115, 39–53. [Google Scholar] [CrossRef]
- IPCC (Intergovernmental Panel on Climate Change). Good Practice Guidance for Land Use, Land-Use Change and Forestry; Institute for Global Environmental Strategies: Kanagawa, Japan, 2003. [Google Scholar]
- Brown, J.K.; Roussopoulos, P.J. Eliminating Biases in the Planar Intersect Method for Estimating Volumes of Small Fuels. Forest Sci. 1974, 20, 350–356. [Google Scholar]
- Van Wagner, C.E. The Line Intersect Method in Forest Fuel Sampling. For. Sci. 1968, 14, 20–26. [Google Scholar]
- Zanne, A.E.; López-González, G.; Coomes, D.A.; Ilic, J.; Jansen, S.; Lewis, S.L.; Miller, R.B.; Swenson, N.G.; Wiemann, M.C.; Chave, J. Data from: Towards a Worldwide Wood Economics Spectrum. 2009. Available online: https://datadryad.org/stash/dataset/doi:10.5061/dryad.234 (accessed on 4 February 2009).
- Nelson, D.W.; Sommers, L.E. Total Carbon, Organic Carbon, and Organic Matter. In Methods of Soil Analysis; John Wiley & Sons, Ltd.: Hoboken, NJ, USA, 1996; pp. 961–1010. ISBN 978-0-89118-866-7. [Google Scholar]
- Sitoe, A.A.; Mandlate, L.J.C.; Guedes, B.S. Biomass and Carbon Stocks of Sofala Bay Mangrove Forests. Forests 2014, 5, 1967–1981. [Google Scholar] [CrossRef]
- Di Rienzo, J.A.; Casanoves, F.; Balzarini, M.G.; Gonzalez, L.; Tablada, M.; Robledo, C.W. InfoStat versión 2019. Centro de Transferencia InfoStat, FCA, Universidad Nacional de Córdoba, Argentina. Available online: http://www.infostat.com.ar (accessed on 1 August 2019).
- Hamilton, S.E.; Lovette, J. Ecuador’s Mangrove Forest Carbon Stocks: A Spatiotemporal Analysis of Living Carbon Holdings and Their Depletion since the Advent of Commercial Aquaculture. PLoS ONE 2015, 10, e0118880. [Google Scholar] [CrossRef] [PubMed]
- Terchunian, A.; Klemas, V.; Segovia, A.; Alvarez, A.; Vasconez, B.; Guerrero, L. Mangrove mapping in Ecuador: The impact of shrimp pond construction. Environ. Manag. 1986, 10, 345–350. [Google Scholar] [CrossRef]
- Solis, M.A. Los Manglares Del Ecuador. Rev. Geográfica 1961, 28, 69–88. [Google Scholar] [CrossRef]
- Duke, N.; Ball, M.; Ellison, J. Factors influencing biodiversity and distributional gradients in mangroves. Glob. Ecol. Biogeogr. Lett. 1998, 7, 27–47. [Google Scholar] [CrossRef] [Green Version]
- Estrada, G.C.D.; Soares, M.L.G.; Fernadez, V.; Almeida, P.M.M. de The economic evaluation of carbon storage and sequestration as ecosystem services of mangroves: A case study from southeastern Brazil. Int. J. Biodivers. Sci. Ecosyst. Serv. Manag. 2015, 11, 29–35. [Google Scholar] [CrossRef]
- DelVecchia, A.G.; Bruno, J.F.; Benninger, L.; Alperin, M.; Banerjee, O.; Morales, J.d.D. Organic carbon inventories in natural and restored Ecuadorian mangrove forests. PeerJ 2014, 2, e388. [Google Scholar] [CrossRef] [PubMed] [Green Version]
- Boone Kauffman, J.; Arifanti, V.B.; Hernández Trejo, H.; del Carmen Jesús García, M.; Norfolk, J.; Cifuentes, M.; Hadriyanto, D.; Murdiyarso, D. The jumbo carbon footprint of a shrimp: Carbon losses from mangrove deforestation. Front. Ecol. Environ. 2017, 15, 183–188. [Google Scholar] [CrossRef]
- Chandra, I.A.; Seca, G.; Hena, M.K.A. Aboveground Biomass Production of Rhizophora apiculata Blume in Sarawak Mangrove Forest. Am. J. Agric. Biol. Sci. 2011, 6, 469–474. [Google Scholar]
- Sasmito, S.D.; Sillanpää, M.; Hayes, M.A.; Bachri, S.; Saragi-Sasmito, M.F.; Sidik, F.; Hanggara, B.B.; Mofu, W.Y.; Rumbiak, V.I.; Taberima, S.; et al. Mangrove blue carbon stocks and dynamics are controlled by hydrogeomorphic settings and land-use change. Glob. Chang. Biol. 2020, 26, 3028–3039. [Google Scholar] [CrossRef] [Green Version]
- Urquizo, R.; Carvajal, R.; Salas, J.; Bustamante, M. Biodiversidad Del Guayas: Conociendo Nuestra Verdadera Riqueza; Gobierno Provincial Del Guayas-Dirección de Medio Ambiente: Guayaquil, Ecuador, 2011. [Google Scholar]
- Chatting, M.; LeVay, L.; Walton, M.; Skov, M.W.; Kennedy, H.; Wilson, S.; Al-Maslamani, I. Mangrove carbon stocks and biomass partitioning in an extreme environment. Estuar. Coast. Shelf Sci. 2020, 244, 106940. [Google Scholar] [CrossRef]
- Cifuentes, M.; Brenes, C.; Manrow, M.; Torres, D. Dinámica de uso de la Tierra y Potencial de Mitigación de los Manglares del Golfo de Nicoya; Conservación Internacional: San José, Costa Rica, 2014. [Google Scholar]
- Manrow-Villalobos, M. Estructura, composición florística, biomasa y carbono arriba del suelo en los manglares laguna de Gandoca y estero Limón, Limón, Costa Rica. Rev. For. Mesoam. 2011, 1–18. [Google Scholar] [CrossRef] [Green Version]
- Nóbrega, G.N.; Ferreira, T.O.; Siqueira Neto, M.; Mendonça, E.D.S.; Romero, R.E.; Otero, X.L. The importance of blue carbon soil stocks in tropical semiarid mangroves: A case study in Northeastern Brazil. Environ. Earth Sci. 2019, 78, 369. [Google Scholar] [CrossRef]
- Stringer, C.E.; Trettin, C.C.; Zarnoch, S.J.; Tang, W. Carbon stocks of mangroves within the Zambezi River Delta, Mozambique. For. Ecol. Manag. 2015, 354, 139–148. [Google Scholar] [CrossRef]
- Kristensen, E.; Alongi, D.M. Control by fiddler crabs (Uca vocans) and plant roots (Avicennia marina) on carbon, iron, and sulfur biogeochemistry in mangrove sediment. Limnol. Oceanogr. 2006, 51, 1557–1571. [Google Scholar] [CrossRef] [Green Version]
- Burdige, D.J. Preservation of Organic Matter in Marine Sediments: Controls, Mechanisms, and an Imbalance in Sediment Organic Carbon Budgets? Chem. Rev. 2007, 107, 467–485. [Google Scholar] [CrossRef] [PubMed]
- Marchand, C.; Lallier-Vergès, E.; Baltzer, F. The composition of sedimentary organic matter in relation to the dynamic features of a mangrove-fringed coast in French Guiana. Estuar. Coast. Shelf Sci. 2003, 56, 119–130. [Google Scholar] [CrossRef] [Green Version]
- Lehmann, J.; Kleber, M. The contentious nature of soil organic matter. Nature 2015, 528, 60–68. [Google Scholar] [CrossRef]
- Kleber, M.; Eusterhues, K.; Keiluweit, M.; Mikutta, C.; Mikutta, R.; Nico, P.S. Chapter One—Mineral–Organic Associations: Formation, Properties, and Relevance in Soil Environments. In Advances in Agronomy; Sparks, D.L., Ed.; Academic Press: Cambridge, MA, USA, 2015; Volume 130, pp. 1–140. [Google Scholar]
- Otero, X.L.; Méndez, A.; Nóbrega, G.N.; Ferreira, T.O.; Santiso-Taboada, M.J.; Meléndez, W.; Macías, F. High fragility of the soil organic C pools in mangrove forests. Mar. Pollut. Bull. 2017, 119, 460–464. [Google Scholar] [CrossRef]
- Banerjee, K.; Bal, G.; Mitra, A. How Soil Texture Affects the Organic Carbon Load in the Mangrove Ecosystem? A Case Study from Bhitarkanika, Odisha. In Environmental Pollution. Water Science and Technology Library; Singh, V., Yadav, S., Yadava, R., Eds.; Springer: Singapore, 2018; Volume 77, pp. 329–341. [Google Scholar]
- Sippo, J.Z.; Sanders, C.J.; Santos, I.R.; Jeffrey, L.C.; Call, M.; Harada, Y.; Maguire, K.; Brown, D.; Conrad, S.R.; Maher, D.T. Coastal carbon cycle changes following mangrove loss. Limnol. Oceanogr. 2020, 65, 2642–2656. [Google Scholar] [CrossRef]
- Johnson, J.L.; Raw, J.L.; Adams, J.B. First report on carbon storage in a warm-temperate mangrove forest in South Africa. Estuar. Coast. Shelf Sci. 2020, 235, 106566. [Google Scholar] [CrossRef]
- Eid, E.M.; Arshad, M.; Shaltout, K.H.; El-Sheikh, M.A.; Alfarhan, A.H.; Picó, Y.; Barcelo, D. Effect of the conversion of mangroves into shrimp farms on carbon stock in the sediment along the southern Red Sea coast, Saudi Arabia. Environ. Res. 2019, 176, 108536. [Google Scholar] [CrossRef] [PubMed]
- Sidik, F.; Lovelock, C.E. CO2 Efflux from Shrimp Ponds in Indonesia. PLoS ONE 2013, 8, e66329. [Google Scholar] [CrossRef] [PubMed] [Green Version]
- Sidik, F.; Adame, M.F.; Lovelock, C.E. Carbon sequestration and fluxes of restored mangroves in abandoned aquaculture ponds. J. Indian Ocean Reg. 2019, 15, 177–192. [Google Scholar] [CrossRef]
- Baccini, A.; Goetz, S.J.; Walker, W.S.; Laporte, N.T.; Sun, M.; Sulla-Menashe, D.; Hackler, J.; Beck, P.S.A.; Dubayah, R.; Friedl, M.A.; et al. Estimated carbon dioxide emissions from tropical deforestation improved by carbon-density maps. Nat. Clim. Chang. 2012, 2, 182–185. [Google Scholar] [CrossRef]
- Kauffman, J.B.; Adame, M.F.; Arifanti, V.B.; Schile-Beers, L.M.; Bernardino, A.F.; Bhomia, R.K.; Donato, D.C.; Feller, I.C.; Ferreira, T.O.; Jesus Garcia, M.D.C.; et al. Total ecosystem carbon stocks of mangroves across broad global environmental and physical gradients. Ecol. Monogr. 2020, 90, e01405. [Google Scholar] [CrossRef] [Green Version]
- Palacios Peñaranda, M.L.; Cantera Kintz, J.R.; Peña Salamanca, E.J. Carbon stocks in mangrove forests of the Colombian Pacific. Estuar. Coast. Shelf Sci. 2019, 227, 106299. [Google Scholar] [CrossRef]
- Marchand, C. Soil carbon stocks and burial rates along a mangrove forest chronosequence (French Guiana). For. Ecol. Manag. 2017, 384, 92–99. [Google Scholar] [CrossRef]
- Queiroz, H.M.; Artur, A.G.; Taniguchi, C.A.K.; da Silveira, M.R.S.; do Nascimento, J.C.; Nóbrega, G.N.; Otero, X.L.; Ferreira, T.O. Hidden contribution of shrimp farming effluents to greenhouse gas emissions from mangrove soils. Estuar. Coast. Shelf Sci. 2019, 221, 8–14. [Google Scholar] [CrossRef]
- Pendleton, L.; Donato, D.C.; Murray, B.C.; Crooks, S.; Jenkins, W.A.; Sifleet, S.; Craft, C.; Fourqurean, J.W.; Kauffman, J.B.; Marbà, N.; et al. Estimating Global “Blue Carbon” Emissions from Conversion and Degradation of Vegetated Coastal Ecosystems. PLoS ONE 2012, 7, e43542. [Google Scholar] [CrossRef] [Green Version]
Figure 1.
Location of study sites in Guayaquil Gulf, Ecuador.

Figure 2.
Schematic of plot layout for mangroves sampled in the Gulf of Guayaquil Mangroves, Ecuador. This graphic has been adapted from [24].
Figure 2.
Schematic of plot layout for mangroves sampled in the Gulf of Guayaquil Mangroves, Ecuador. This graphic has been adapted from [24].

Figure 3.
Differences in basal area between medium-statured and tall mangrove forests in the gulf of Guayaquil, Ecuador (different letters denote statistically significant differences).
Figure 3.
Differences in basal area between medium-statured and tall mangrove forests in the gulf of Guayaquil, Ecuador (different letters denote statistically significant differences).

Figure 4.
Number of trees (per ha−1) by diameter class (cm) in medium-statured and tall mangrove forests in the gulf of Guayaquil, Ecuador.
Figure 4.
Number of trees (per ha−1) by diameter class (cm) in medium-statured and tall mangrove forests in the gulf of Guayaquil, Ecuador.

Figure 5.
Soil carbon concentrations in mangrove stages and shrimp ponds (different letters represent statistically significant differences (p < 0.05) in soil pools between different mangrove strata).
Figure 5.
Soil carbon concentrations in mangrove stages and shrimp ponds (different letters represent statistically significant differences (p < 0.05) in soil pools between different mangrove strata).

Figure 6.
Total carbon stocks in compartments of the mangrove forest and shrimp ponds at 200 cm of depth.
Figure 6.
Total carbon stocks in compartments of the mangrove forest and shrimp ponds at 200 cm of depth.


Table 1.
Allometric equations used for aboveground biomass estimation in Ecuadorian mangrove forests.
Table 1.
Allometric equations used for aboveground biomass estimation in Ecuadorian mangrove forests.
| Species | Aboveground Biomass | Root Biomass | n | r2 |
|---|---|---|---|---|
| Rhizophora mangle | 0.128 × (dbh) 2.6 | = 0.199 × (ρ) 0.899 × (dbh) 2.22 | 9 | 0.92 |
| Laguncularia racemosa | 0.1023 × (dbh) 2.5 | 70 | 0.97 |
Note: n: number of trees used for doing equation, r2: correlation coefficient of biomass y dbh, ρ: specific wood gravity.
Table 2.
Mangrove forest height (m), basal area (m2 ha−1), and tree density (trees ha−1) by island in the gulf of Guayaquil, Ecuador.
Table 2.
Mangrove forest height (m), basal area (m2 ha−1), and tree density (trees ha−1) by island in the gulf of Guayaquil, Ecuador.
| Mangrove Stratum | Transect | Island | Species | Height | Basal Area | Tree Density |
|---|---|---|---|---|---|---|
| Medium-statured | T11 | San Ignacio | Rhiz | 18.0 ± 2.4 | 10.5 ± 4.3 | 671 ± 281 |
| Medium-statured | T12 | Canoa | Rhiz | 18.2 ± 1.5 | 16.2 ± 6.8 | 942 ± 477 |
| Medium-statured | T13 | San Ignacio | Rhiz | 19.6 ± 3.6 | 16.8 ± 9.0 | 769 ± 271 |
| Medium-statured | T14 | San Ignacio | Rhiz | 16.1 ± 4.1 | 18.5 ± 9.8 | 693 ± 268 |
| Medium-statured | T15 | Chupadores Chico | Rhiz | 8.4 ± 0.8 | 3.2 ± 1.7 | 487 ± 99 |
| Medium-statured | T16 | Chupadores Chico | Rhiz | 13.0 ± 5.1 | 8.8 ± 5.7 | 379 ± 139 |
| Medium-statured | T17 | Chupadores Chico | Rhiz/Lag | 21.1 ± 2.9 | 13.9 ± 4.1 | 531 ± 156 |
| Medium-statured | T18 | Chupadores | Rhiz | 20.8 ± 3.6 | 14.0 ± 2.8 | 498 ± 140 |
| Medium-statured | T19 | San Ignacio | Rhiz | 22.7 ± 1.7 | 27.7 ± 9.9 | 1007 ± 158 |
| Medium-statured | T20 | Canoa | Rhiz | 23.0 ± 4.2 | 23.1 ± 13.0 | 736 ± 168 |
| Medium-statured | T21 | Bellavista | Rhiz | 17.7 ± 1.7 | 20.2 ± 7.9 | 1321 ± 853 |
| Medium-statured | T22 | Chupadores Chico | Rhiz | 12.9 ± 2.2 | 19.2 ± 11.2 | 1039 ± 344 |
| Medium-statured | T4 | Tortuga | Rhiz | 22.9 ± 1.5 | 26.6 ± 8.7 | 1180 ± 255 |
| Medium-statured | T5 | Tortuga | Rhiz/Lag | 19.8 ± 1.4 | 10.1 ± 3.4 | 693 ± 333 |
| Medium-statured | T6 | Tortuga | Rhiz | 18.4 ± 1.6 | 10.0 ± 4.5 | 1061 ± 333 |
| Medium-statured | T7 | Bocana | Rhiz | 14.4 ± 2.7 | 11.1 ± 4.2 | 888 ± 262 |
| Medium-statured | T8 | Bocana | Rhiz/Lag | 16.7 ± 2.9 | 12.0 ± 2.3 | 1288 ± 238 |
| Tall | TM1 | Mondragón | Rhiz | 22.4 ± 6.0 | 32.6 ± 17.9 | 585 ± 179 |
| Tall | TM10 | Mondragón | Rhiz/Lag | 11.8 ± 2.8 | 18.7 ± 9.5 | 985 ± 186 |
| Tall | TM11 | Mondragón | Rhiz/Lag | 14.5 ± 2.1 | 29.2 ± 11.5 | 1245 ± 289 |
| Tall | TM12 | Mondragón | Rhiz | 17.8 ± 2.4 | 34.3 ± 16.8 | 1104 ± 448 |
| Tall | TM3 | Mondragón | Rhiz | 17.3 ± 1.4 | 28.0 ± 14.4 | 660 ± 271 |
| Tall | TM8 | Mondragón | Rhiz | 17.7 ± 3.1 | 31.9 ± 10.0 | 812 ± 365 |
| Tall | TM9 | Mondragón | Rhiz | 23.5 ± 4.7 | 40.9 ± 20.0 | 401 ± 156 |
Note: T and TM = transect code, Rhiz (Rhizophora mangle), Lag (Laguncularia racemosa).
Table 3.
Carbon stocks of medium-statured mangroves varied according to distance from the estuary edge in the gulf of Guayaquil, Ecuador.
Table 3.
Carbon stocks of medium-statured mangroves varied according to distance from the estuary edge in the gulf of Guayaquil, Ecuador.
| Seaward Edge (m) | Aboveground Carbon (Mg·ha−1) | |
|---|---|---|
| 25 | 85.8 | a |
| 50 | 86.7 | a |
| 75 | 83.0 | a |
| 100 | 78.3 | a |
| 125 | 59.1 | b |
| 150 | 48.6 | b |
Different letters denote a significant difference (p < 0.05) in mangrove strata.
Table 4.
Carbon stocks (Mg ha−1) in mangrove forests and shrimp ponds in the gulf of Guayaquil, Ecuador.
Table 4.
Carbon stocks (Mg ha−1) in mangrove forests and shrimp ponds in the gulf of Guayaquil, Ecuador.
| Medium-Statured Mangroves | Tall Mangroves | Shrimp Ponds | |
|---|---|---|---|
| Transect | 17 | 7 | 5 |
| Trees > 5 cm dbh | 67.88 ± 8.39 | 186 ± 26.76 | -- |
| Trees < 5 cm dbh | 0.38 ± 0.20 | 0.06 ± 0.03 | -- |
| Woody debris | 5.36 ± 1.00 | 6.05 ± 3.61 | -- |
| Total aboveground carbon | 73.62 ± 8.39 a | 192.20 ± 29.90 b | -- |
| Roots | 26.76 ± 2.88 | 59.06 ± 6.16 | -- |
| Soil 1 m | 220.57 ± 22.89 | 168.19 ± 21.30 | 81.91 ± 13.69 |
| Soil 2 m | 352.51 ± 31.49 | 286.39 ± 38.27 | 126.98 ± 16.33 |
| Total soil and roots carbon (1 m) | 247.33 ± 21.81 a | 227.25 ± 26.57 a | 81.91 ± 13.69 b |
| Total soil and roots carbon (2 m) | 379.26 ± 30.35 a | 345.46 ± 43.57 a | 126.98 ± 16.33 b |
| Ecosystem carbon (1 m) | 320.95 ± 20.88 a | 419.4 5± 55.66 a | 81.91 ± 13.69 b |
| Ecosystem carbon (2 m) | 452.13 ± 28.32 a | 537.65 ± 66.70 a | 126.98 ± 16.33 b |
Different letters denote a statistically significant difference (p < 0.05) in ecosystem pools between mangrove stands and shrimp ponds.
Table 5.
Ecosystem carbon pools (C Mg ha−1) by land use.
| Land Use | Area (ha) | C (Mg ha−1) | Total Carbon(Mg C) | Mg CO2e |
|---|---|---|---|---|
| Medium-statured mangrove | 117,746.0 | 320.9 | 37,790,578.7 | 138,691,423.8 |
| Tall mangrove | 16,317.1 | 419.4 | 6,844,224.3 | 25,118,303.4 |
| Shrimp ponds | 153,950.4 | 81.9 | 12,610,084.6 | 46,279,010.6 |
| Total | 288,013.6 | 57,244,887.7 | 210,088,737.8 |
Table 6.
Aboveground carbon stocks in Latin American mangrove forests.
| Country | Height (m) | Species | Aboveground Carbon (Mg ha−1) | Author |
|---|---|---|---|---|
| Dominican Republic | >10 | R. mangle | 133 | [40] |
| Honduras | R. mangle–L. racemosa | 143.9 | ||
| Costa Rica | R. mangle | 151 | ||
| Mexico | R. mangle | 236 | ||
| Ecuador | R. mangle–L. racemosa | 108.2 | This study |
Publisher’s Note: MDPI stays neutral with regard to jurisdictional claims in published maps and institutional affiliations. |
© 2021 by the authors. Licensee MDPI, Basel, Switzerland. This article is an open access article distributed under the terms and conditions of the Creative Commons Attribution (CC BY) license (https://creativecommons.org/licenses/by/4.0/).
Share and Cite
MDPI and ACS Style
Merecí-Guamán, J.; Casanoves, F.; Delgado-Rodríguez, D.; Ochoa, P.; Cifuentes-Jara, M. Impact of Shrimp Ponds on Mangrove Blue Carbon Stocks in Ecuador. Forests 2021, 12, 816. https://0-doi-org.brum.beds.ac.uk/10.3390/f12070816
AMA Style
Merecí-Guamán J, Casanoves F, Delgado-Rodríguez D, Ochoa P, Cifuentes-Jara M. Impact of Shrimp Ponds on Mangrove Blue Carbon Stocks in Ecuador. Forests. 2021; 12(7):816. https://0-doi-org.brum.beds.ac.uk/10.3390/f12070816
Chicago/Turabian StyleMerecí-Guamán, Jéssica, Fernando Casanoves, Diego Delgado-Rodríguez, Pablo Ochoa, and Miguel Cifuentes-Jara. 2021. "Impact of Shrimp Ponds on Mangrove Blue Carbon Stocks in Ecuador" Forests 12, no. 7: 816. https://0-doi-org.brum.beds.ac.uk/10.3390/f12070816
Note that from the first issue of 2016, this journal uses article numbers instead of page numbers. See further details here.