
Evaluating Strategies for the Management of Douglas-Fir in Central Europe


Institut für Waldbau, Universität für Bodenkultur Wien, Peter Jordan Str. 82, 1190 Vienna, Austria
*
Author to whom correspondence should be addressed.
Forests 2021, 12(8), 1040; https://0-doi-org.brum.beds.ac.uk/10.3390/f12081040
Submission received: 2 June 2021
/
Revised: 1 August 2021
/
Accepted: 3 August 2021
/
Published: 5 August 2021
(This article belongs to the Special Issue Adaptive Forest Management to Climatic Change)
Abstract
:In view of the increasing demand for forest resources in Europe, it is an option to foster the use of non-native tree species that can keep pace with the rapidly changing environmental conditions, such as Douglas-fir (Pseudotsuga menziesii). Thus, sufficient knowledge of how to manage such introduced species is highly required. In this study, we investigate theoretical silvicultural management options of Douglas-fir for forests in central Europe. We follow a three-step approach: (i) we collect the current central European management practices based on 434 Douglas-fir stands managed by 19 forest companies in Eastern Austria and Southern Germany using a survey. (ii) We calibrate and validate a Douglas-fir parameter set for the tree growth simulator MOSES so that we are able to (iii) simulate the silvicultural management options of Douglas-fir management. Our simulation results suggest: in mixed stands, Douglas-fir should be planted in mono-species patches. This leads to about six times higher productivity compared to a random arrangement. Natural regeneration is possible but requires active management at further development since the productivity might decrease up to 86% when growing in association with the highly competitive native tree species, Common beech (Fagus sylvatica). Intensive tending, as well as thinning, yields a surplus stem volume production of more than 30% in comparison with a moderate intervention. Even if our simulation results were not validated in the field, this analysis suggests that modeling as a heuristic tool is a useful instrument for forest managers in the decision-making process.
1. Introduction
Current ecological, as well as societal developments, suggest that shortages in the wood supply will soon be present on a European level. Climate change causes an upwards shift of the elevation optimum of tree species, regarding altitudinal as well as latitudinal elevation [1]. Tree species with a principal distribution range at higher latitudes and therefore disposing of little alternative area for colonization are projected as losers. In contrast, species located primarily at lower latitudes at present are predicted to extend their distribution range and therefore are considered winners [2]. This corresponds to findings of [3,4] predicting a decline of needle-leaved tree species in the temperate zones of Europe, including a noticeable reduction of economically highly relevant tree species, such as Norway spruce (Picea abies) [5]. Moreover, there is evidence that a percentage of European forests will be put out of commercial management and attributed to non-managed reserve areas with predominantly nature conservation purposes [6,7]. At the same time, the demand for sustainable raw materials such as wood is steadily increasing, especially for pulp and paper production [8,9].
One adaptation option consists of the so-called response strategy [10], suggesting a transformation of current ecosystems by changing the present set of tree species in order to create ecosystems suitable for climate change. In this context, we might practice assisted migration of native tree species that dispose of high genetic diversity and therefore are successful in adapting to environmental changes, such as oak (Quercus spp.) [11], or we might think to introduce appropriate non-native tree species. In this study, we look at the promotion of the non-native tree species Douglas-fir (Pseudotsuga menziesii) within central European forests. Results from research as well as operation suggest that this species copes well with prolonged drought periods [12,13,14,15,16], whereas most of the native coniferous tree species require regular rainfall [17]. In addition, this tree species provides high productivity rates and thus ensures sustainable income for forest companies [18,19].
The Douglas-fir originates from the Pacific Northwest of America and has two distinct varieties, (i) the coastal or green Douglas-fir and (ii) the interior or blue Douglas-fir [20]. It covers about 830,000 ha of forest land in Europe [21,22]. Promoting Douglas-fir requires forest management tools and silvicultural experiences. Many available European studies on Douglas-fir focus on climate adaptability and provenance recommendations [23,24,25,26,27,28,29,30]. Other studies have targeted the ecological effects of introducing Douglas-fir into native forest communities, including its potential invasiveness [31,32,33,34,35,36]. A third group explores the qualitative and mechanical wood characteristics [37,38,39,40,41,42].
In Germany, Kownatzki [43] investigated Douglas-fir field trials with the result that if Douglas-fir is planted in mixtures with common beech (Fagus sylvatica), homogeneous patches are beneficial to ensure its survival. Additionally, a low initial stem number improves tree stability and promotes social differentiation. Similar findings have been reported by [44,45,46]. According to [47,48], the initial stem number is crucial for the tree’s stability, stand productivity, and timber quality. For further Douglas-fir studies from Europe, we refer to [49]. In the native range of our tree species, the Pacific Northwest, three principal treatment approaches can be discerned: no management in old-growth stands, intensive management at short rotation, and intensive management at long rotation [50,51,52]. Within the intensive-management approach, we can observe a tendency to focus on preparative measures such as advanced genetics on the one hand, and early operations such as mechanical site preparation and intensive weed control, on the other hand [53,54,55]. According to [54], the concept of commercial thinning originates from Europe and was applied there a long time before arriving in the Pacific Northwest. For the native range, guidelines for precommercial as well as commercial tinning were developed, e.g., by [56,57]. Note that Douglas-fir is non-native within European forests and management findings from North America may not be applicable to European forests.
Hence, the aim of this study is to develop guidelines for the management of Douglas-fir in central Europe. We adopt the modeling approach (not being followed by validation in the field) and apply a three-step approach. First, we want to detect the current core issues of managing Douglas-fir in the central European context. Second, we aim at developing an appropriate tool that can reproduce and analyze the growth of Douglas-fir in central Europe, based on simulation; and third, we use this tool in order to assess alternative scenarios for the detected treatment issues. Since this study is part of a large Douglas-fir project (CC Douglas see [58]) supported by 19 forest companies located in Southern Germany and Eastern Austria [59], we performed the first work step by collecting and evaluating the experiences of the involved companies with the management of Douglas-fir, based on a survey. Once the key issues for the management of Douglas-fir stands are available, the core research interest of the study will be accomplished, including two aspects:
- (i)
- The calibration of Douglas-fir for the growth simulator (MOSES) as a diagnostic tool for silvicultural scenario analysis.
- (ii)
- The analysis of the long-term impact of different Douglas-fir management variants by running scenarios with the growth simulator, MOSES.
2. Materials and Methods
2.1. Identification of the Principal Douglas-Fir Management Issues, Based on a Survey
For the collection of Douglas-fir management practices, we carried out a survey. The collected information was only used for modeling but not exemplified in field trials. The stands were located in Austria (Upper Austria, Lower Austria) and Germany (Bavaria, Baden-Wuerttemberg, Hesse, Rhineland-Palatinate), and the following topics were assessed: (i) variety/provenance, (ii) site and stand characteristics, the (iii) established species mixture, (iv) planting methods, as well as experiences with (v) natural regeneration, (vi) tending, (vii) thinning and (viii) debranching (see Table 1). In total, 19 forest companies provided management practice information from 434 different Douglas-fir stands, covering a large variety of site conditions, age classes, and species mixtures.
We grouped the information, and as a result, we defined the following main management scenarios requested by forest companies: (i) planting options, (ii) enhancing the survival of natural regeneration, and (iii) thinning strategies to fully utilize the growth potential of Douglas-fir.
2.1.1. Planting Options Considering in the Modeling
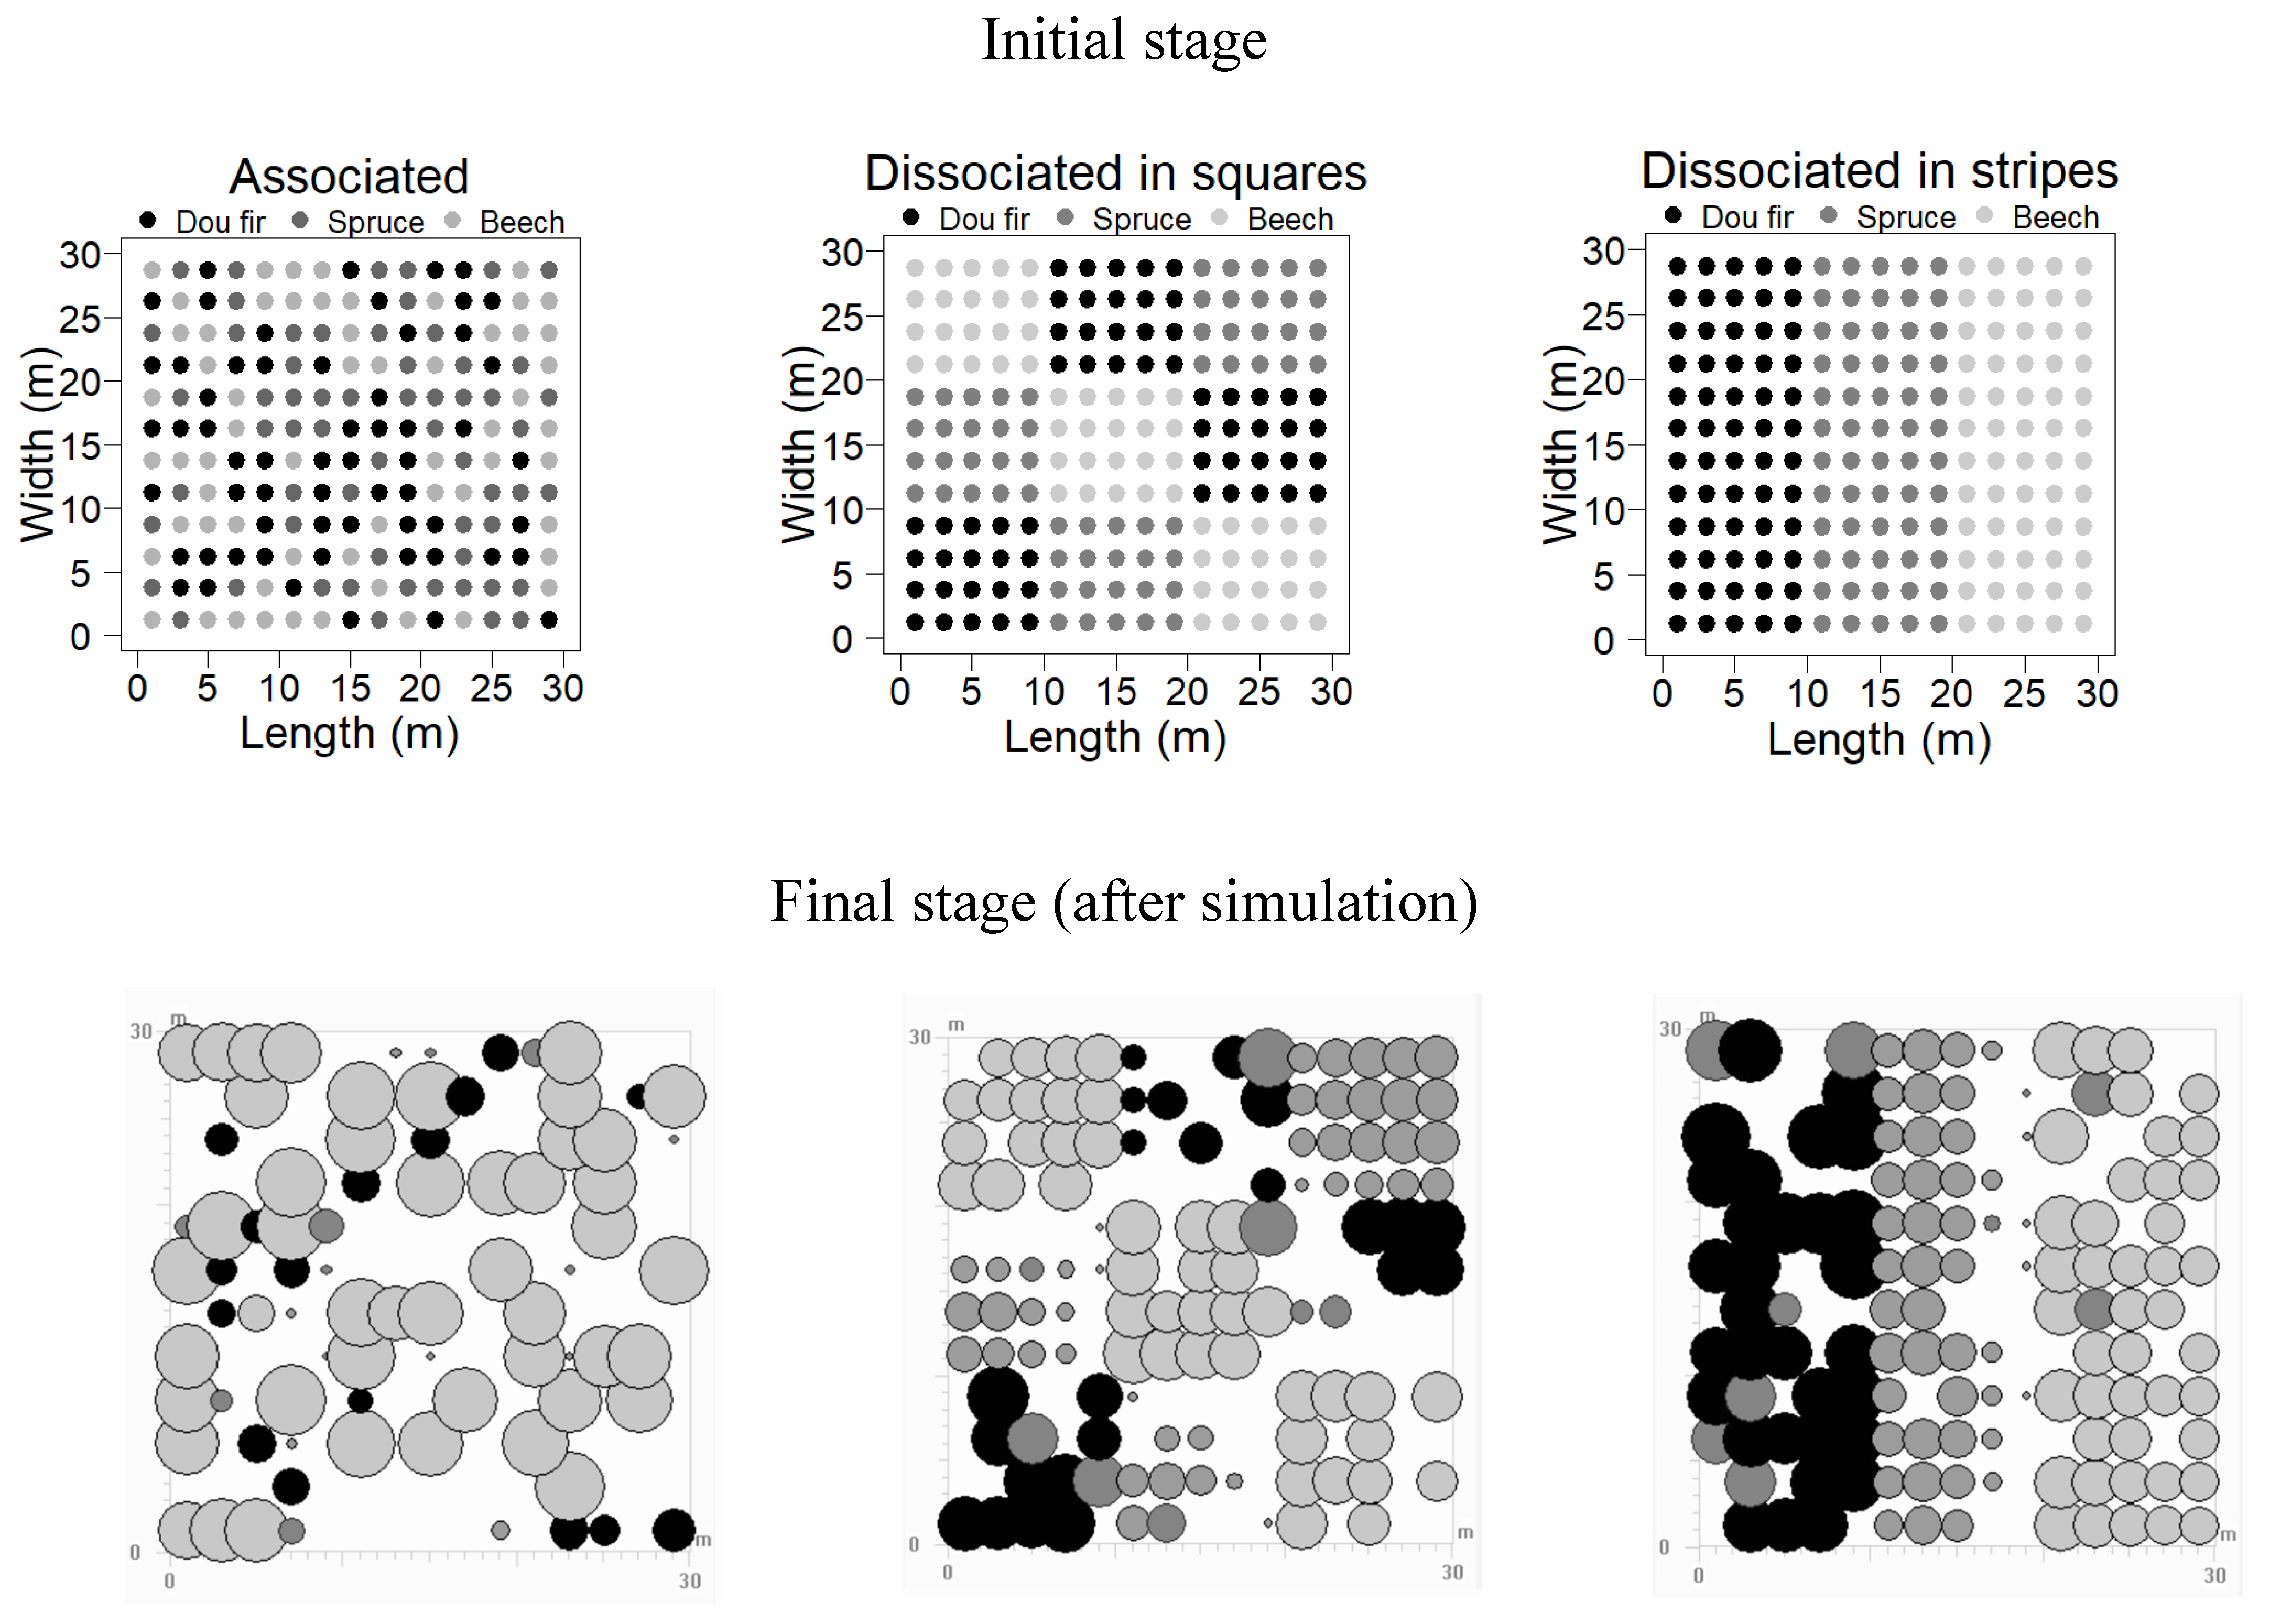
A total of 90% of our reported plantations exhibited severe problems immediately after planting, resulting in high mortality rates (up to 50%). Within these stands, Douglas-fir was planted in tree mixtures with Norway spruce and beech. Thus, the simulation exercise will investigate the effect of different species mixtures according to different planting regimes, e.g., tree by tree, smaller homogenous species groups, etc. (Exercise 1). The common silvicultural practice in planting mixed species stands is to create patches of only one species where the minimum size of these patches should be about the crown area of a fully mature tree of this species. This addresses the fact that, according to the tree species, juveniles may need different stand densities to ensure self-pruning or to survive from neighboring species competition. With this concept in mind, we assumed a plantation of 2000 juvenile trees as mixed Douglas-fir—common beech—Norway spruce stands. The plantation arrangements in MOSES cover three scenarios: (i) random, (ii) smaller patches or squares, and (iii) larger patches in the form of strips. The site index of Douglas-fir was assumed to be 45, while the site index for beech and spruce was 38, respectively (applying the site index ratios of stand 18 from Table 2, as described in the following chapter). Since we were only interested in the competitive behavior, we applied no further silvicultural measures. The simulation run is 50 years. The stand layouts are illustrated in Figure 1 (top).
2.1.2. Survival of Natural Regeneration
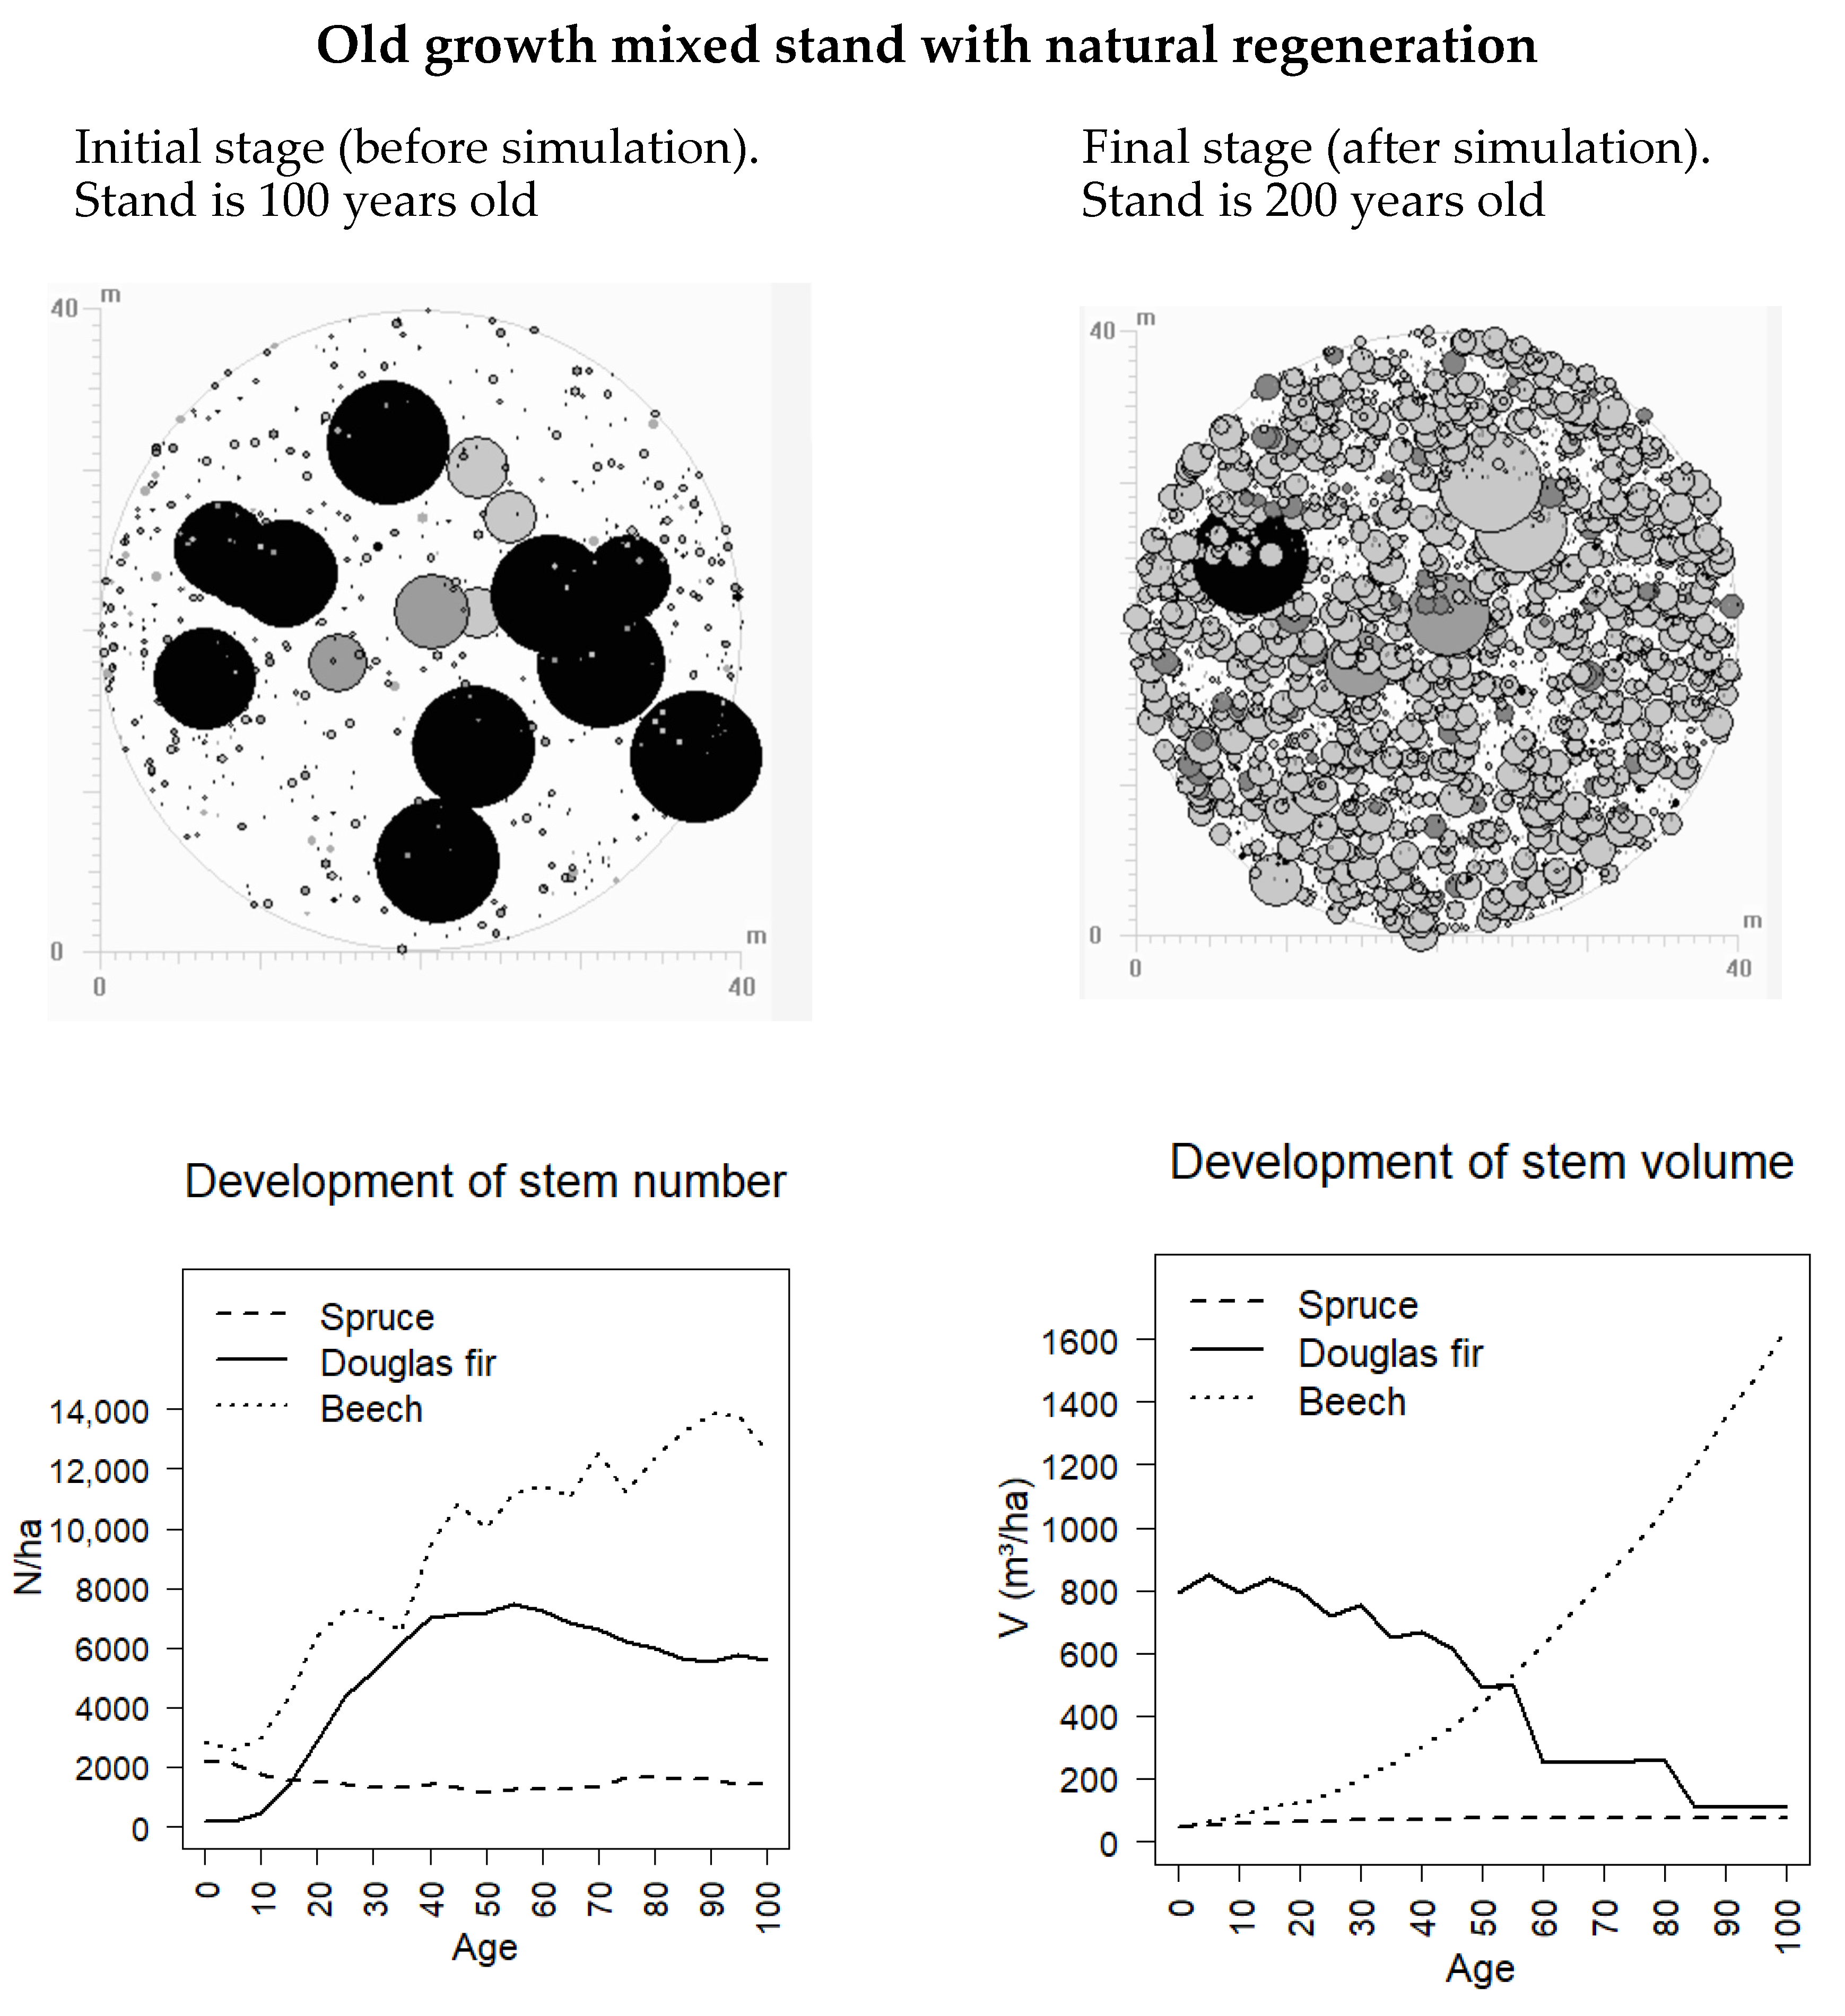
According to the survey, re-establishing Douglas-fir under the shelter of mature trees, mainly in mixtures with Norway spruce and common beech is possible. However, the reported key problems are high mortality rates of naturally regenerated Douglas-fir seedlings and juvenile trees. A simulation exercise will focus on the development of naturally regenerated juvenile Douglas-fir trees in mixtures with spruce and beech (Exercise 2). For our simulations, we selected the Douglas-fir stand number 18 (see Table 2), which represents a mature 100-years old mixed species of Douglas-fir—common beech—Norway spruce forest. The corresponding site indices by species are 45 for Douglas-fir [60], 38 for Common beech as well as Norway spruce [61]. Douglas-fir dominated in the top layer, while beech was the dominant species in the suppressed layer. The basal area by species ranges from 67% for Douglas-fir, to 19% for beech, and 14% for Norway spruce. After initializing MOSES with these data, we activated the regeneration tool for Douglas-fir and the two associated species and ran the model for a simulation period of 100 years to assess the arrival of natural regeneration and the future stand development. Again, we focused on the spontaneous performance of our tree species in competition with the associates, and so we added no silvicultural measures. An illustration of the status of this stand (before the simulation) is given in Figure 2 (top left).
2.1.3. Tending/Thinning Strategies Considering in the Modeling
From the survey, we learned that tending is done at a dominant tree height between 2 and 6 m, resulting in a stem number reduction of about 30%. Thinning starts at dominant tree heights between 8 and 10 m, harvesting 30 to 50 m3/ha of the stocking volume if the stand age is less than 30 years, and harvesting 70 m3/ha and more if the stands are older than 30 years. Since such a thinning procedure may be characterized by several small interventions, the third simulation exercise compares three different thinning strategies (Exercise 3).
Scenario 1—Questionnaire: We implemented the above-described baseline strategy taken from the survey as follows: Tending at age 15 with a reduction to 1400 stems/ha, followed by a first thinning at age 25 with a removal of 50 m3/ha, by a second thinning at age 40 with a removal of about 70 m3/ha, and by further thinning every 10 to 15 years with removals of about 70 m3/ha to 100 m3/ha.
Scenario 2—Traditional: Since existing stem number guidelines for Douglas-fir [44] as a general rule suggest very moderate stem number reductions, which is similar to scenario 1, we adopted the common thinning practice of Norway spruce stands [62], resulting in the following assumptions: Tending at age 15 leading to a reduction to 1400 stems/ha, the first thinning at age 25 with a reduction to 700 stems/ha, the second thinning at age 40 with a reduction to 400 stems/ha, and the third thinning at age 55 with a reduction to 300 stems/ha.
Scenario 3—New: Tending at age 15 with a reduction to 1400 stems/ha, first thinning at age 25 with a reduction to 600 stems/ha, second thinning at age 35 with a reduction to 275 stems per ha.
In all the scenarios, we assumed Douglas-fir monocultures with an initial stem number of 2000/ha, a site index of 45, and a final stem number of approximately 200 individuals/ha. An important part within the scenario analysis consisted of covering the variability in the thinning effects and the random nature of natural processes. Thus, we executed 10 simulations for each variant and used the mean for comparing the different variants.
2.2. The Tree Growth Model MOSES
As a silvicultural management tool, we use the growth simulator MOSES (MOdeling StandrESponse) [63,64,65]. It has been used and evaluated for assessing different management scenarios within even and uneven-aged mixed species stands.
MOSES runs on the potential-modifier principle, which implies; (i) the calculation of potential increment rates for both tree height as well as diameter at breast height, and (ii) two modifiers, crown ratio (as the percentage of the crown length in relation to the tree length), and an overstory competition index, as reduction factors addressing the competitive situation of a single tree within the stand. The update of the crown ratio is derived by the change in height to the live crown base. The overstory competition index follows the suggestion by [66]. The model operates stepwise, each growth period comprising five years.
The potential height increment depends on the specific site conditions, expressed by site index functions that describe the development of the dominant height of a stand. For our study, we considered the Douglas-fir site index data published by [67] as well as [60] and re-calibrated the data using a Richard growth function [68]. The potential breast height diameter increment is derived from the potential tree height increment, and the crown width needed for the calculation of the overstory competition index is derived from the tree height at the beginning of a growth period. Both allometric relations (height-diameter and height-crown width) are quantified by using the open-grown tree dimensions published by [69].
In total, the simulator included the following sub tools: the dominant height function, the diameter model for open-grown trees, the crown model for open-grown trees, the taper curve function for the calculation of the volume, the functions for height growth, diameter growth and crown length, the regeneration tool [70], and the mortality tool.
So far, the MOSES model has been calibrated for eight different central European tree species, as well as for Sitka spruce in Scotland. The parameter set for Douglas-fir was accomplished in this study. For this purpose, data from 30 Douglas-fir stands located in Austria and Germany, covering different ecoregions and expressed by a latitude between 47.6° N and 51.7° N, and a longitude between 8.6° E and 16.4° E, were collected. The sampling aimed at capturing Douglas-fir monocultures as defined by a share in the stem number of more than 80%. We established and firstly surveyed the plots between 2012 and 2014, and re-measured all plots between 2017 and 2019, so that, for each tree on a given plot, the five-year growth information for model calibration was available. We recorded the dbh (diameter at breast height), the tree height, the height to life crown, the tree position, and eventual ingrowth or mortality during the five-year period. The threshold for trees to be recorded was 10 cm at breast height diameter. The 17 Douglas-fir stands which were established in 2012 and re-measured in 2017, were used for model calibration, and the remaining 13 stands provided the independent data set for model validation. Summary statistics of the available plot data are given in Table 2; the collected tree characteristics (calibration and validation) by age class are shown in Table 3. Please note that this dataset differs from the 434 above-mentioned Douglas-fir stands of our survey.
The open-grown tree dimensions as mentioned above were assumed to be similar to those of silver fir, since test data from 14 open-grown Douglas-fir trees have shown that the relationship between tree height versus crown radius as well as versus dbh are similar to silver fir. The predicted values (calculated with the silver fir model) were compared with the observed values, and a Pearson’s correlation test yielded R2 = 0.72 for the crown widths, and R2 = 0.75 for the diameters.
Since no data for calibrating a mortality function were available, we modified the mortality function for Norway spruce. Based on the stands recorded for the model generation (see Table 2), we evaluated the mean stand, represented by the mean volume and mean stem number. By applying common management guidelines as derived from our survey (Table 1), we adapted the mortality model according to the depicted stem number and volume of the mean stand at age 100.
3. Results
3.1. Calibration of the Tree Growth Model
The general tree growth approach implemented in MOSES has the following form:
where inc is the actual five-year increment (height or breast height diameter) for each tree, potinc the pre-defined five-year potential increment (height or breast height diameter) according to the site conditions, CR is the crown ratio as the percentage of the crown length in relation to the tree length, COMP the competition index, a and b the parameter estimates, and ε the remaining error components. COMP consists of the competition at the beginning (ci) and at the end (cicut) of a growth period and is calculated according to [c1/(cicut × (1 + c2 × (ci − cicut)))], c1 and c2 representing coefficients. Thus, it explicitly addresses any crown release (e.g., thinning or mortality) within a given five-year growth period. ci and cicut were calculated according to [66].
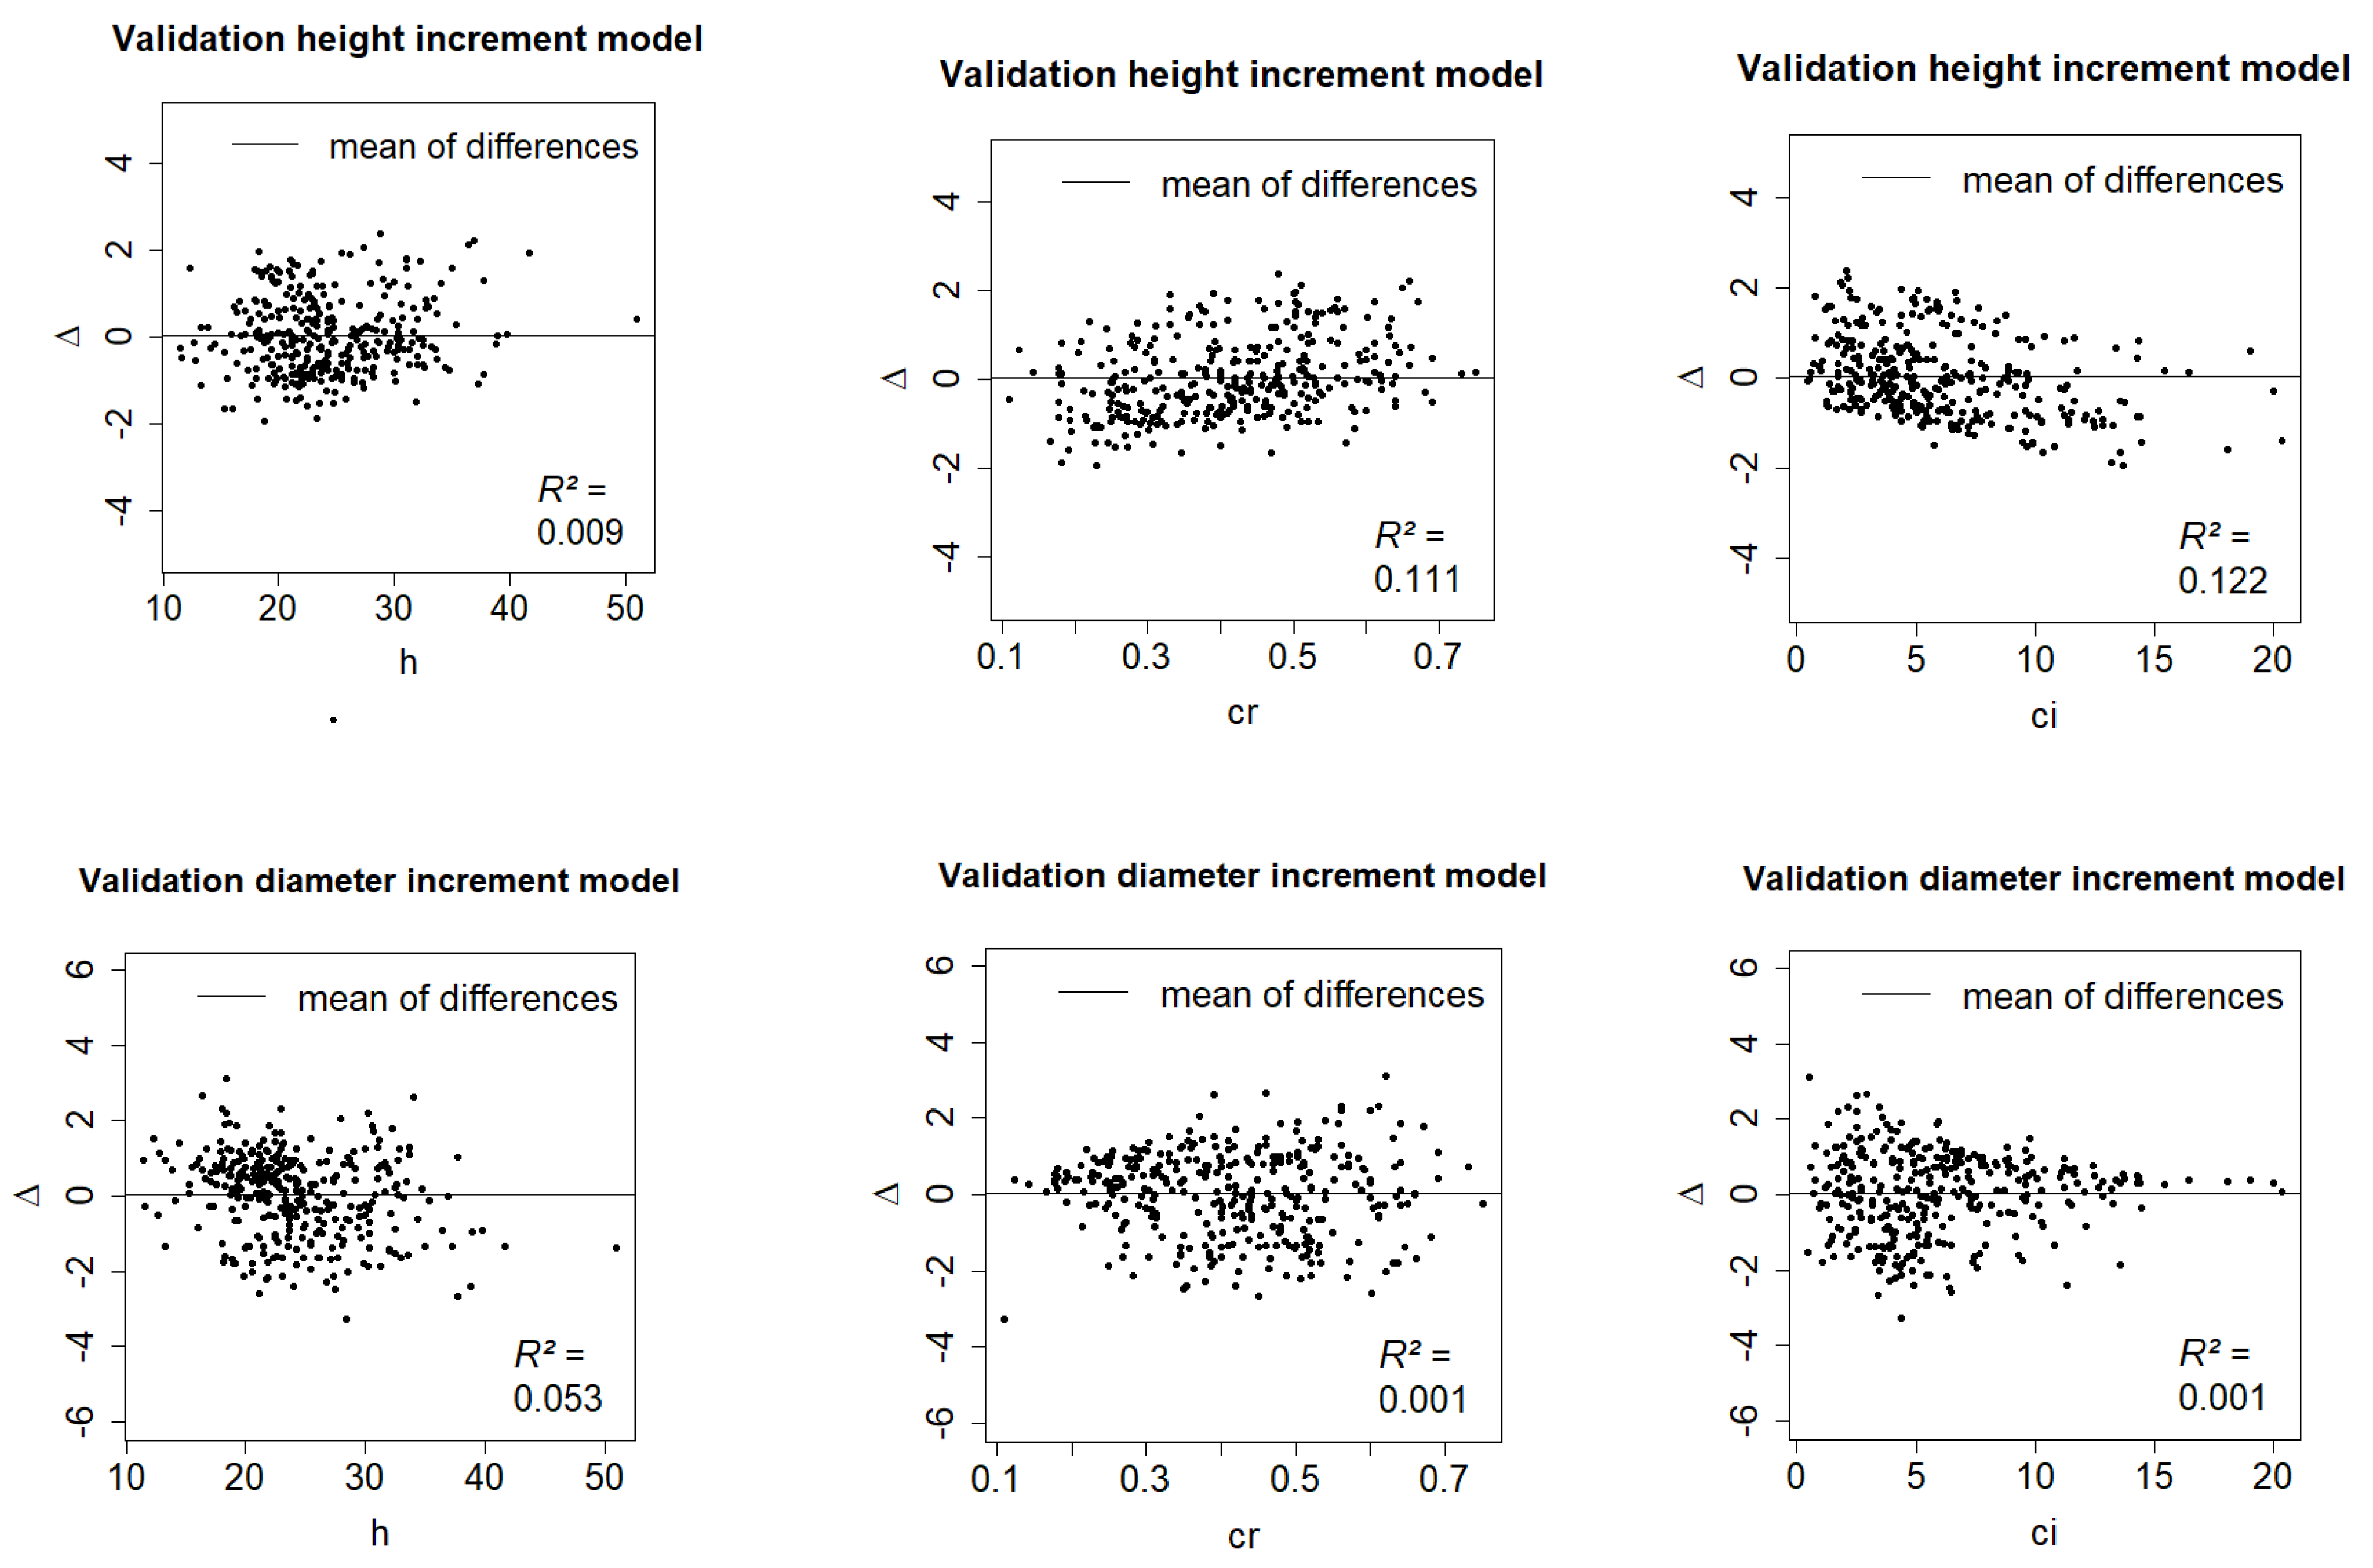
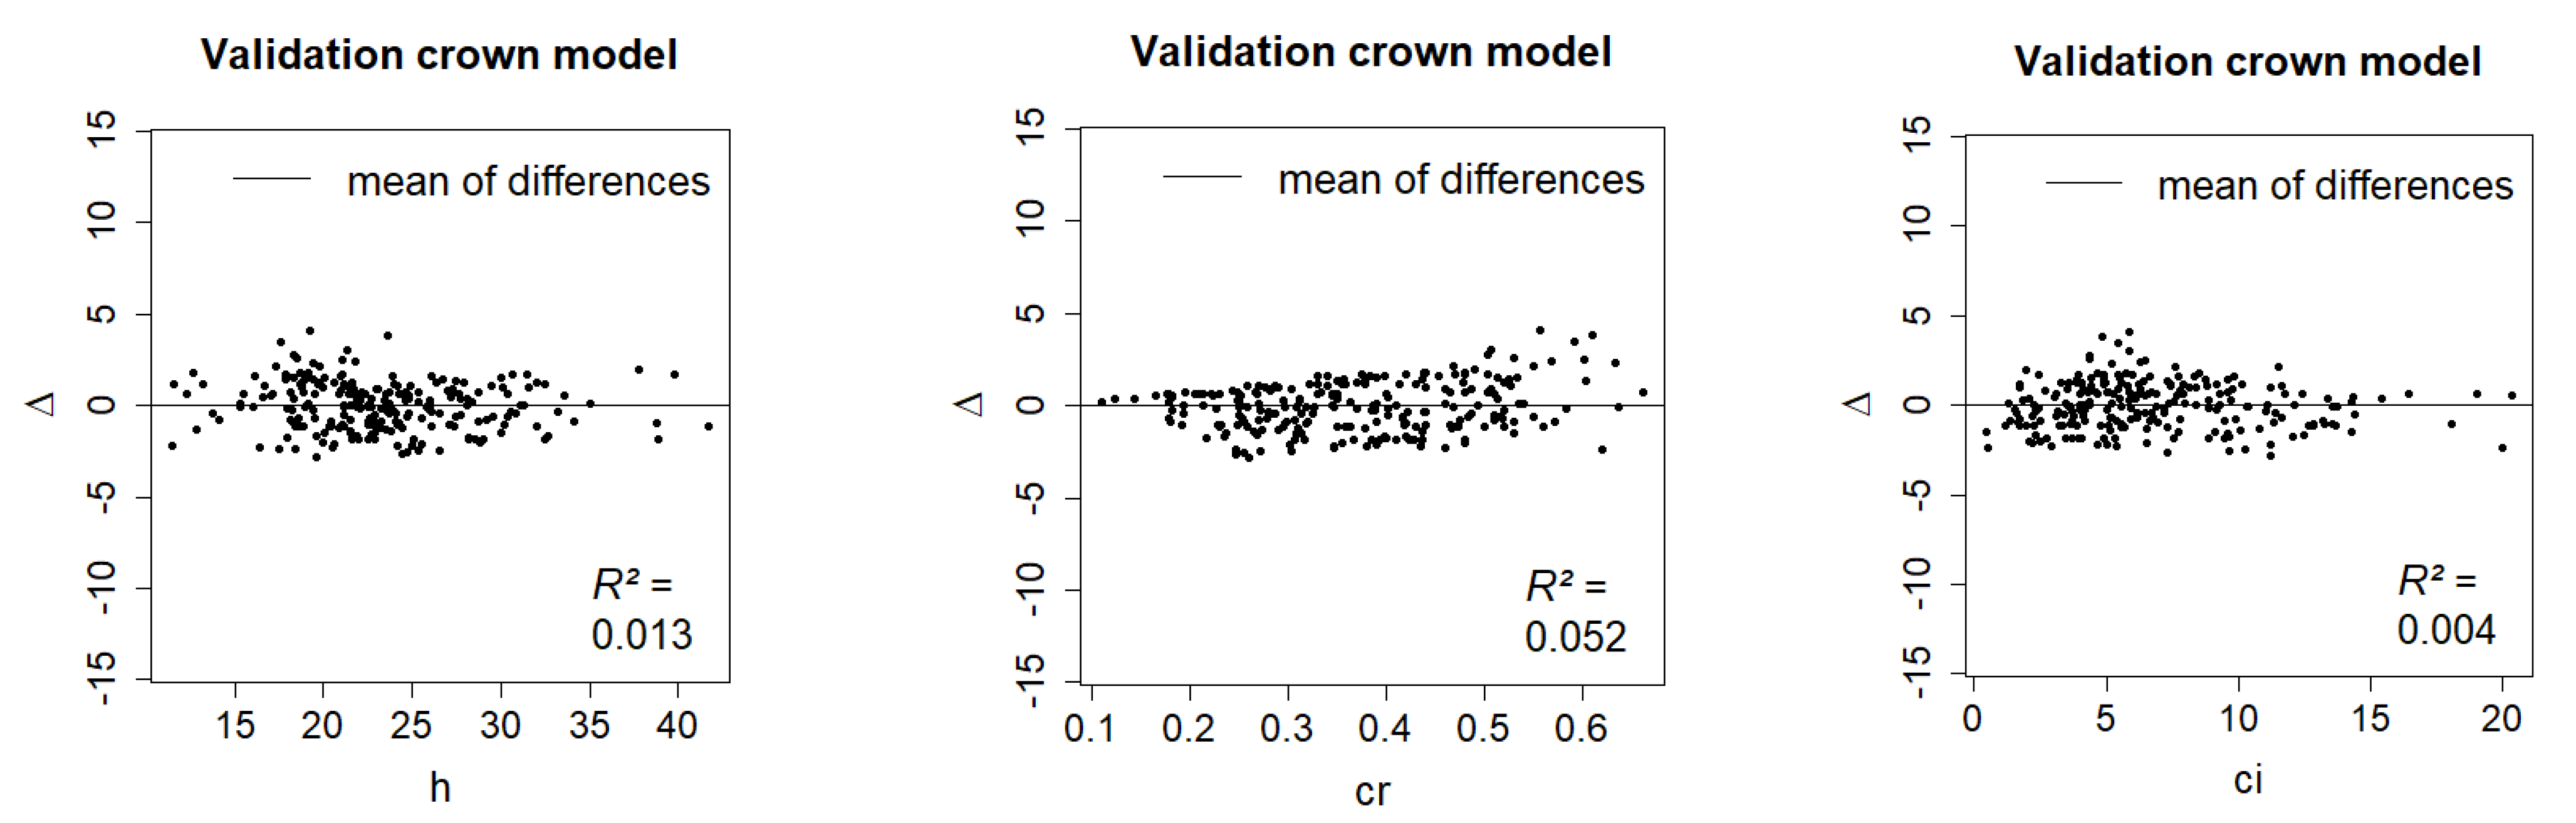
We next validated the calibrated equations with the available independent data (Table 3) by comparing predicted versus observed tree data. Figure 3 depicts the results for the five-year height and diameter increment functions and the calibrated crown model versus the three key model drivers (i) tree height, (ii) crown ratio, and (iii) competition index.
Neither regression statistics nor visual analysis of predicted versus observed values provided any information about the consistency of future model predictions. One possibility to determine the limits and range of errors in future predictions is to calculate the confidence, prediction, and tolerance intervals [71]. The confidence interval (CI) for the mean of the differences (predicted—observed) can be used to evaluate discrepancies between the expected difference and the estimator:
where D is the mean of the differences Di, sD the standard deviation of the differences, n is the sample size, and t is the 1 − α/2 quantile of the t-distribution with n − 1 degrees of freedom.
The prediction interval PI gives the range of the differences among predictions versus observations and is defined as:
Finally, the tolerance interval TI provides the limit that contains a specified portion (e.g., 95%) of the distribution of the differences when the model is used repeatedly (Reynolds 1984):
The tolerance factor (g (1 − γ, 1 − α)) for the normal distribution accounting for the probability that (1 − γ) 100% of the distribution D is within a probability of 1 − α can easily be obtained from statistical tables (e.g., [72]).
The application of Equations (2)–(4) requires that the differences Di are distributed normally. A Kolmogorov-Smirnoff test (α = 0.05) found no significant differences from normality. The resulting confidence, prediction, and tolerance interval by site index function [60,67] for deriving the corresponding potentials are listed in Table 4 and can be interpreted as follows: with a probability of 95% we are confident that bias for five-year height increment predictions (ih) using the site index functions of Eckmüllner [60] are between −0.063 m and 0.13 m and thus not significantly different from zero (=unbiased). With a probability of 95%, we can be confident that a single future difference in the five-year height increment predictions will be between−1.69 m and 1.75 m. In repeated model applications, most of the errors (95%) will be between −2.38 m and 2.44 m and suggest that no bias or systematic error is evident and that the calibrated Douglas-fir growth functions will provide consistent and unbiased MOSES simulation runs.
3.2. Management Scenarios
After implementing the calibrated growth functions into the tree growth simulator MOSES, it was used as a diagnostic tool to assess the long-term development of different scenarios for our defined exercises.
Exercise 1.
Planting Douglas-fir in mixed species stands.
By conducting simulations, we investigated if Douglas-fir should be planted in association or in dissociation with Norway spruce and common beech, and if in dissociation, we are interested in what happens in the case of enlargement of the size of the mono-species patches. Figure 1 shows the situation after planting (top) and after the simulated 50-year growth period (bottom). We observed that Douglas-fir disappeared when growing in association, and beech dominated the stand after 50 years (bottom left). When planting Douglas-fir in mono-species groups, a higher survival rate was evident (bottom middle), which lead to even higher Douglas fir tree dimensions after 50 years at an increased size of the patches (bottom right). As shown in Table 5, after 50 years, random Douglas-fir mixtures (association) resulted in stands with 244 Douglas fir stems/ha and 72 m3/ha stem volume, while dissociated stands grouped in squares exhibit similar Douglas-fir stem numbers (255 stems/ha) but with 258 m3/ha a much higher stocking Douglas-fir stem volume, which could be even increased to about 355 stems/ha and 483 m3/ha, if mixtures were planted in long strips.
Exercise 2.
Natural regeneration of Douglas-fir.
With this exercise, we explored the development of Douglas-fir’s natural regeneration within Douglas-fir dominated stands. Since these stands often grow on sites that are potentially beech and/or mixtures of spruce and beech, the competitive situation of naturally regenerated Douglas fir juveniles versus beech and spruce is of interest. Figure 2 shows the situation before (top left) and after (top right) a 100-years simulation run. Evidently, the regeneration tools of the three involved tree species were activated, so that the expected dynamics of the stand development by tree species could be investigated. As shown (Figure 2 top right), after 100 years in the canopy layer the stand was mainly dominated by beech, and Douglas-fir almost disappears. This is evident from the Douglas-fir stem volume development that dropped from 790 m3/ha to 107 m3/ha (Figure 2 bottom right), corresponding to a minus of 86%. At the same time, Douglas-fir remained present in the understory, since the stem number increased from 192 to 5570 exemplars/ha.
Exercise 3.
Tending and thinning procedures.
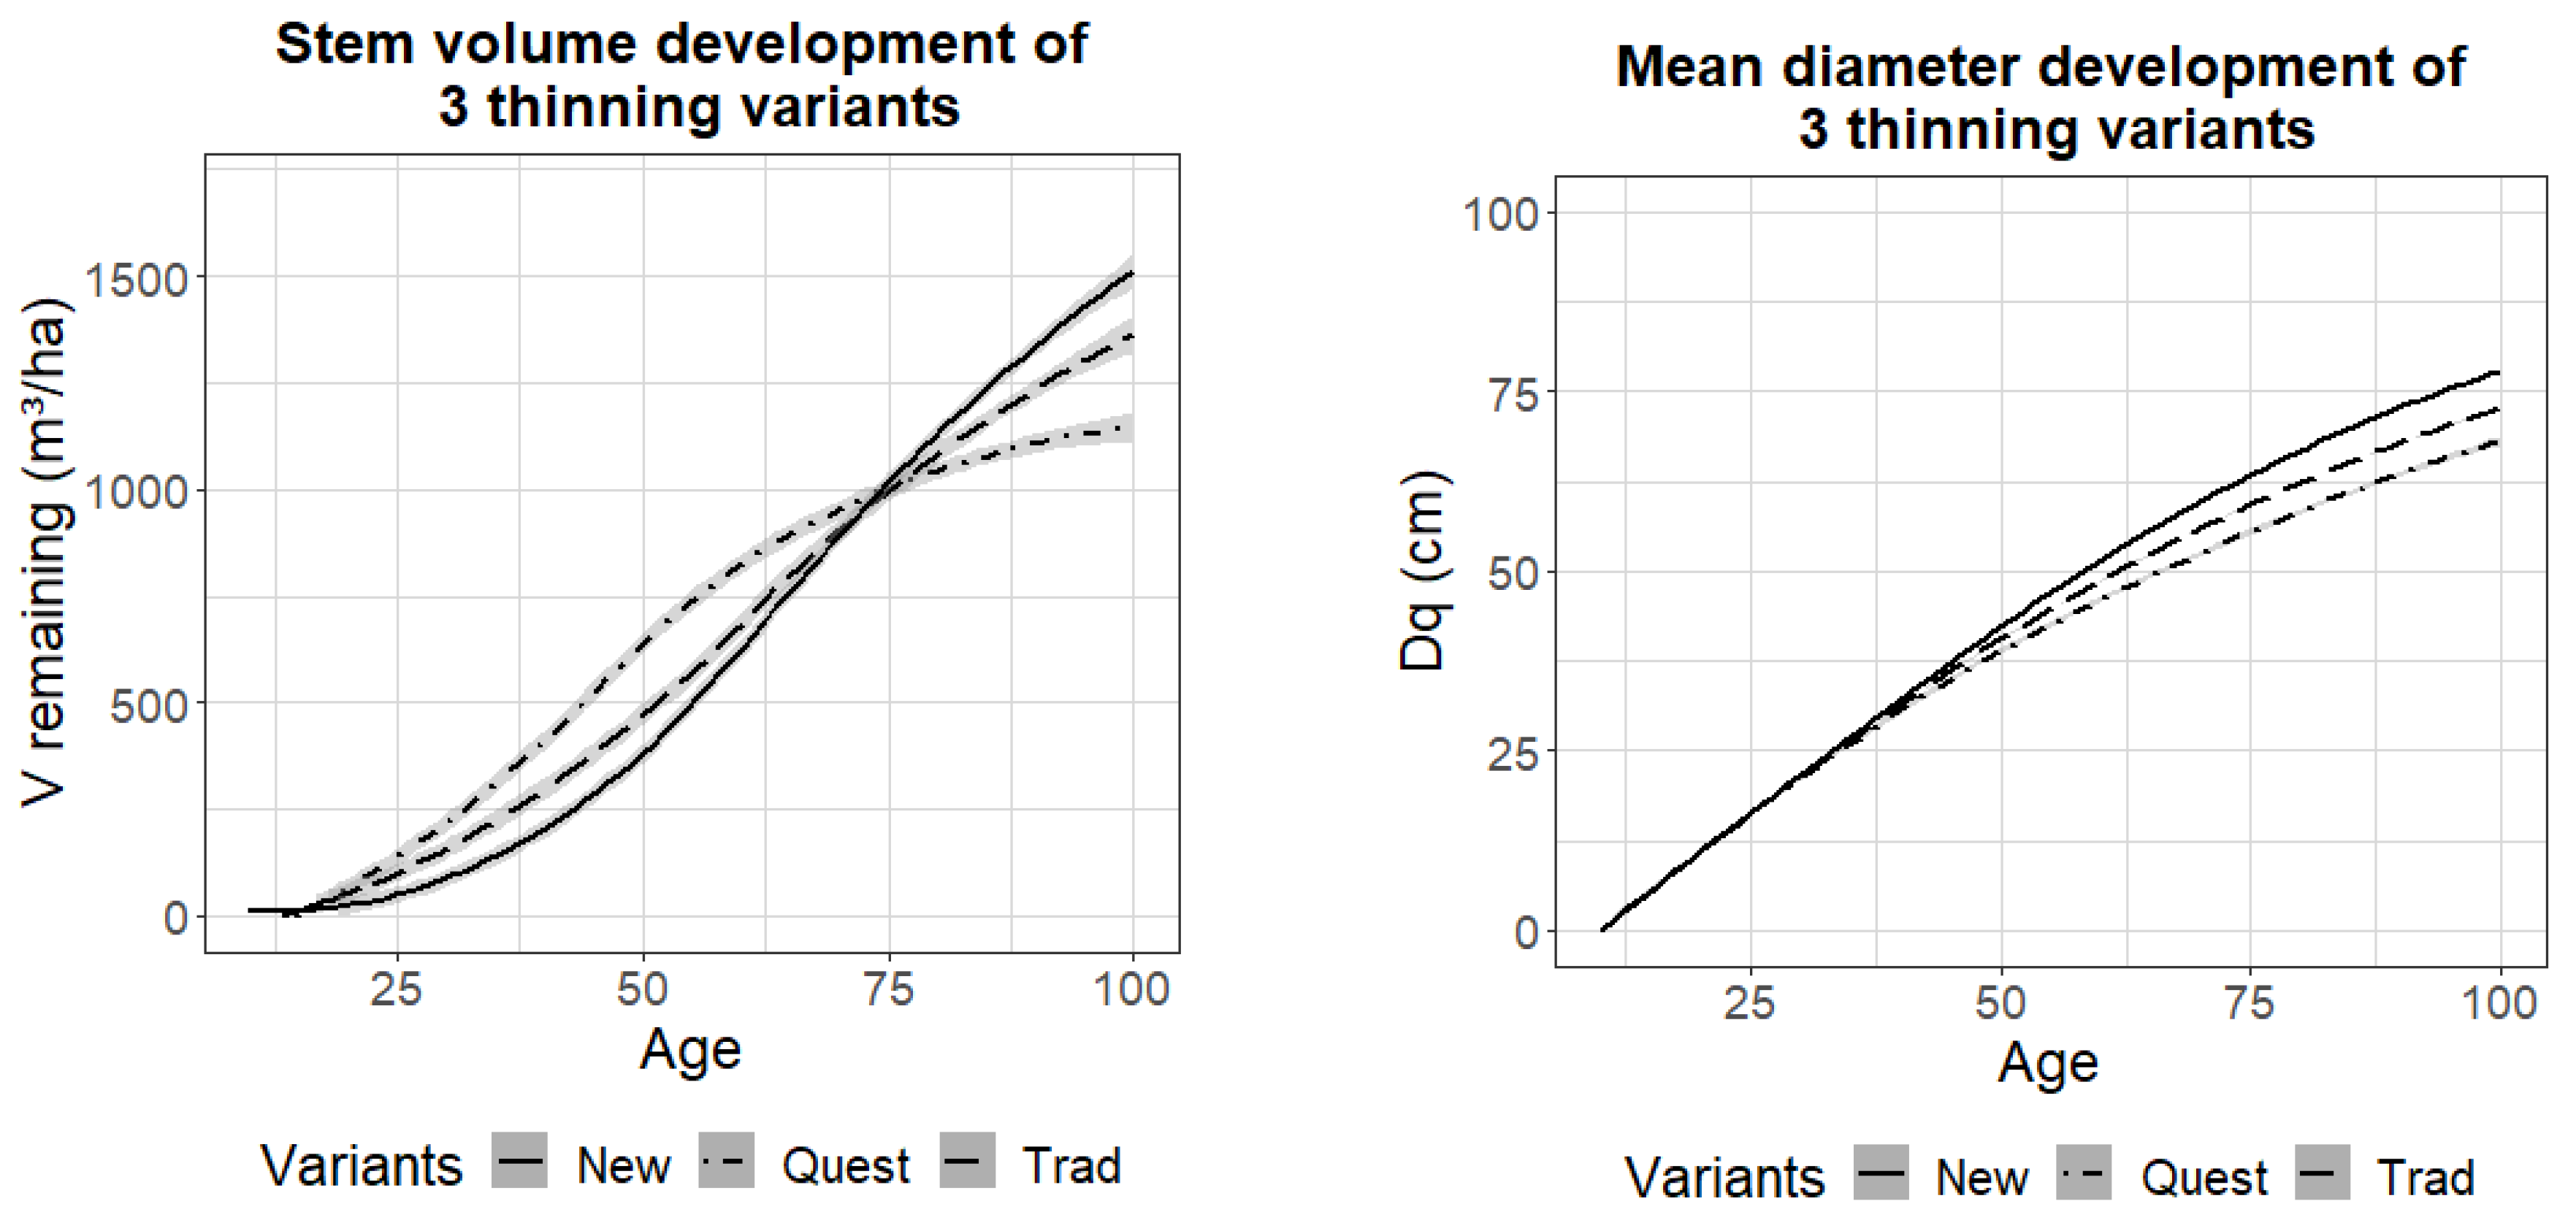
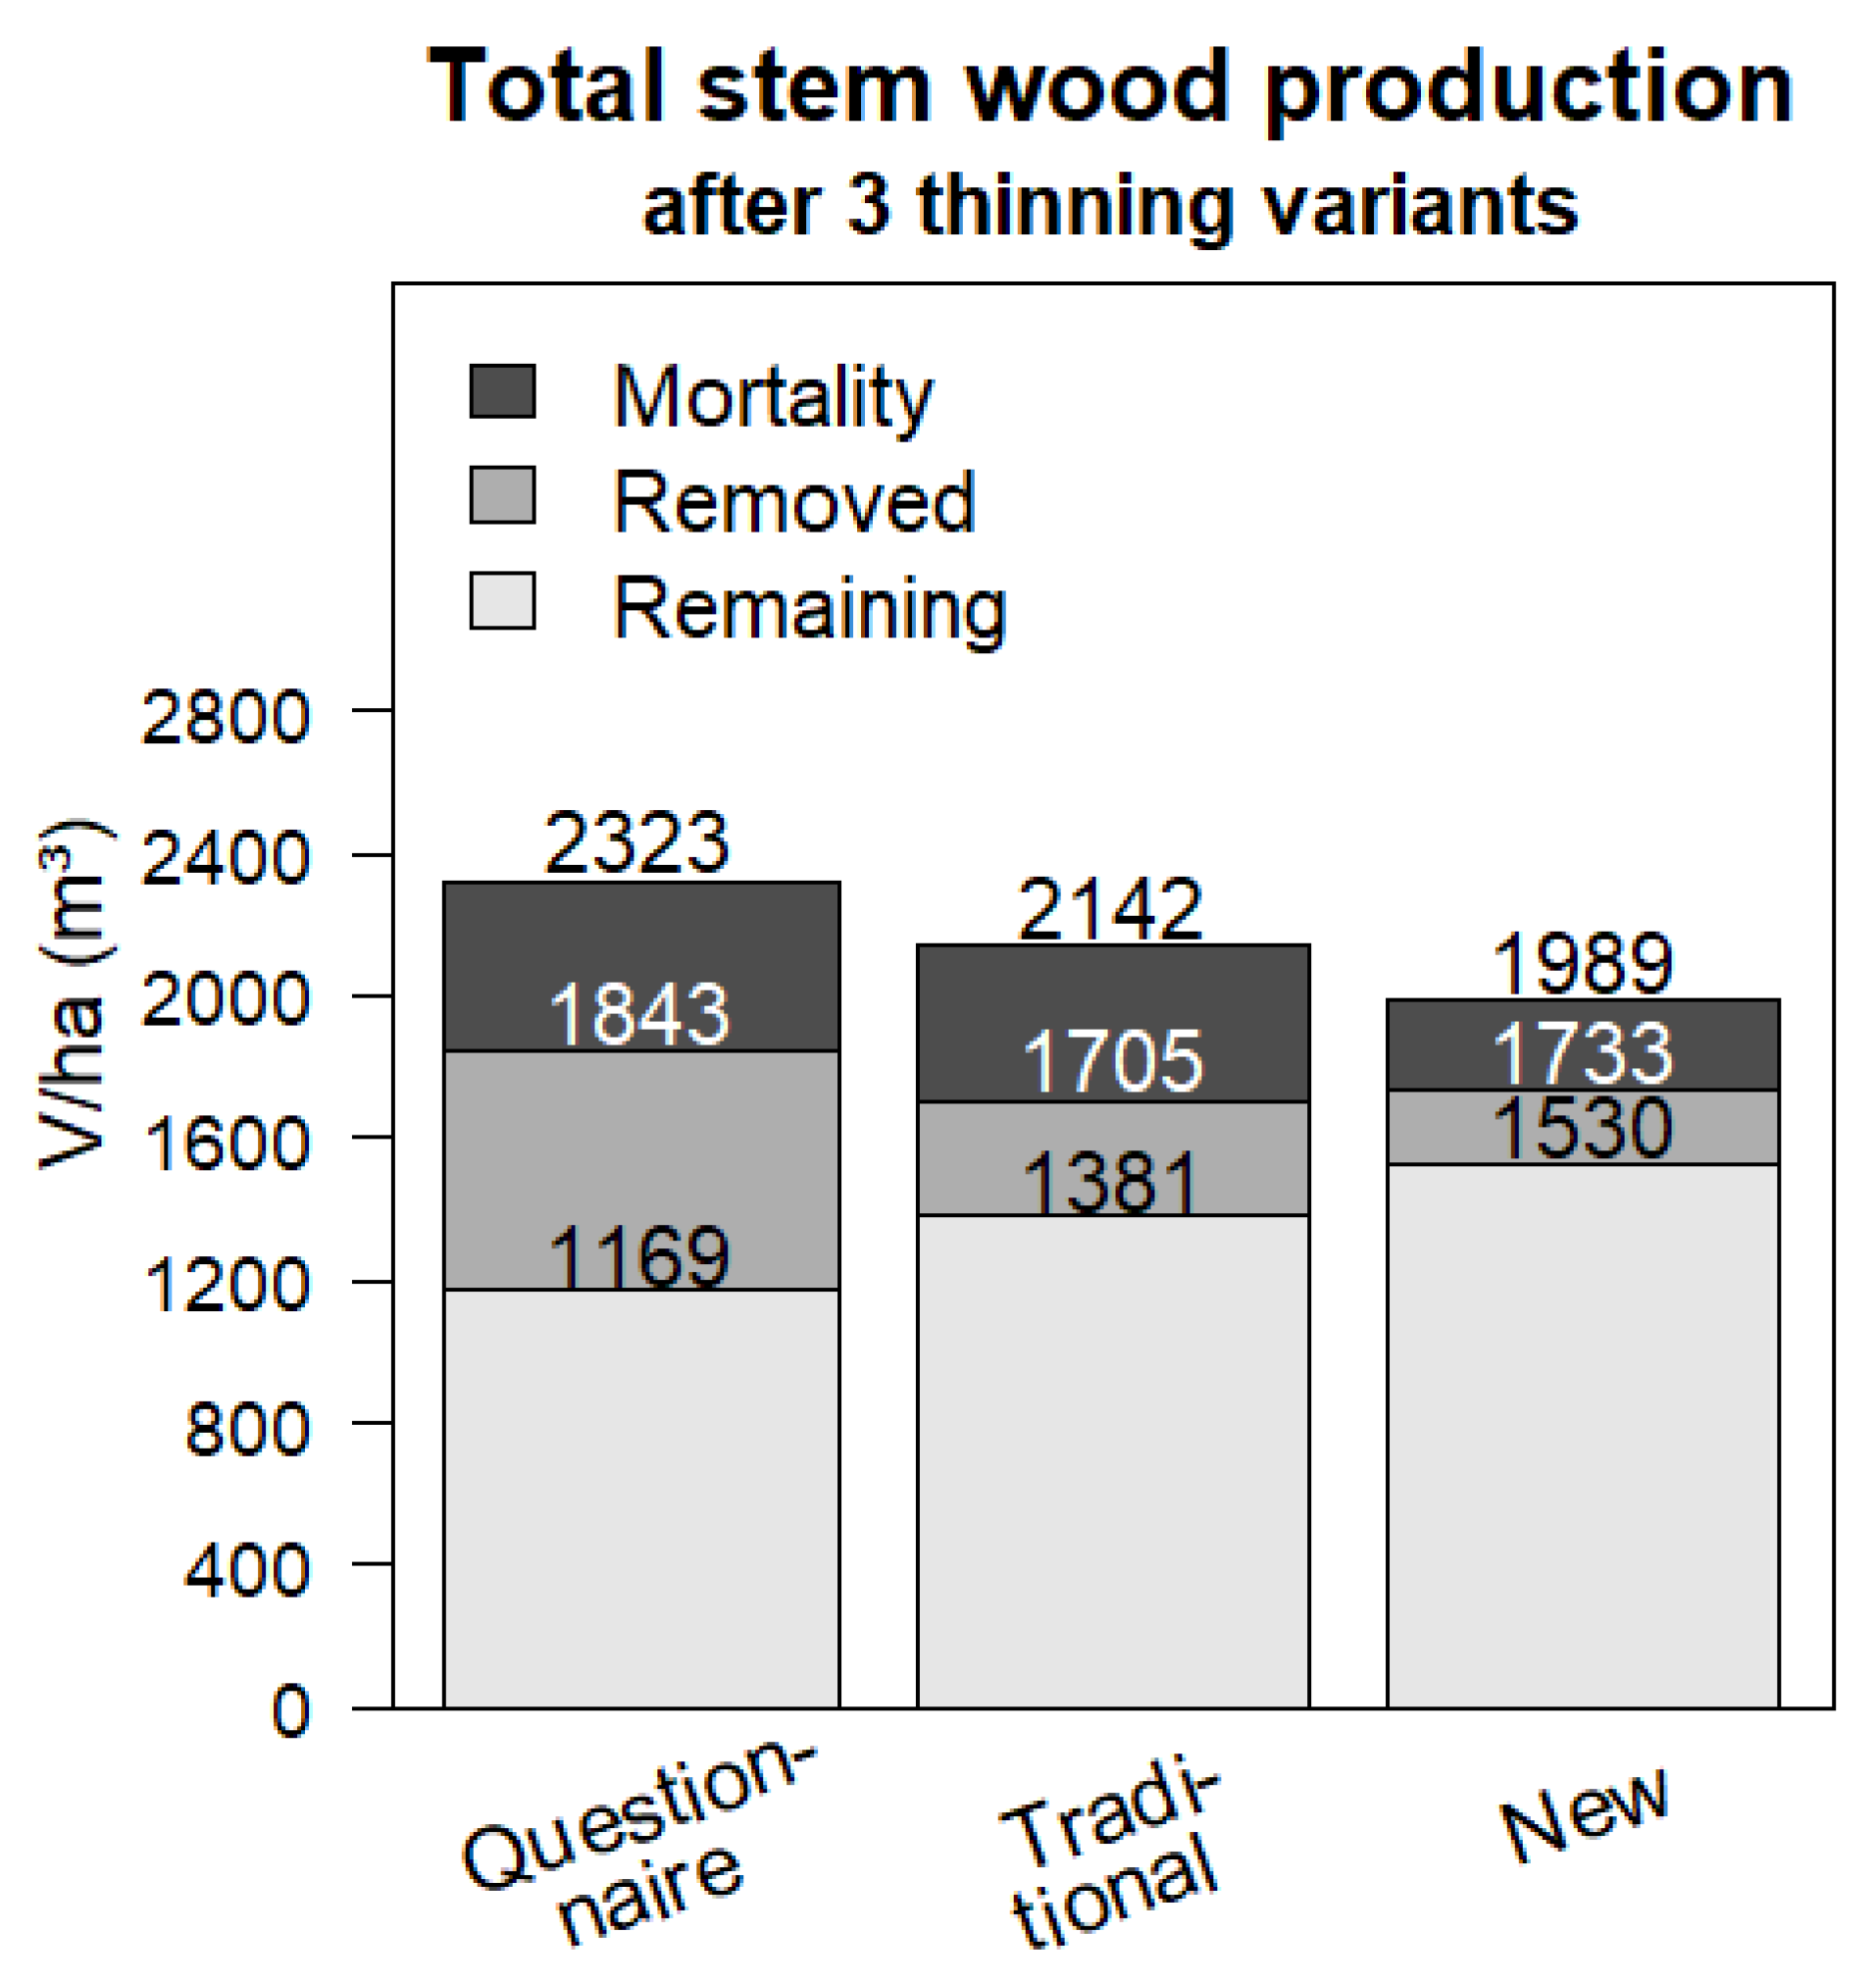
Next, we are interested in the growth response expressed by the volume and mean breast height diameter development of pure Douglas-fir stands according to different thinning variants. Figure 4 (left hand) displays the run of the stem volume of the three different thinning variants over 100 years. As shown, the variant New with the most intensive thinning after two thirds of the observation, exhibited the best results, ending up with 1530 m3/ha versus the two other tested variants, Questionnaire and Traditional. Variant Questionnaire (1169 m3/ha) assumed moderate thinning interventions with the result that the growth potential of Douglas-fir was not fully utilized. The variant Traditional (1381 m3/ha) ranged between variants Questionnaire and New. Figure 4 (right) provides the mean breast height diameter development, and Figure 5 the summed-up values for remaining volume, removed volume, and volume due to mortality by thinning variant.
4. Discussion
Introducing Douglas-fir as an additional tree species to enhance forest management of mixed species forests in central Europe requires management guidelines. Such guidelines may be derived from long-term experimental plots covering different species mixtures, age classes, and treatments, or tree growth models. In this study, we identified current management practices and developed growth parameters for Douglas-fir management in central Europe as required by the tree growth simulator MOSES (MOdelingStandrESponse) for simulating management options. Since the validation results with an independent Douglas-fir growth data set exhibited no bias in the resulting predictions (Figure 3) and the confidence, prediction, as well as the tolerance interval for the height and diameter increment and crown model were unbiased (Table 4), we are confident that MOSES provides unbiased and consistent simulation results.
Since Douglas-fir is often promoted in the lowlands of central Europe where common beech forests are the dominating potential vegetation, it is of high interest to investigate the growth of young Douglas-fir trees in association with beech. The success in planting Douglas-fir in association with beech and spruce (Exercise 1) differs according to the planting regimes. While planting Douglas-fir in random mixtures with common beech and Norway spruce (Figure 1, left) will lead to a dominating common beech stand with only some Douglas-fir trees after 50 years, planting in patches (Figure 1, middle) or larger groups of strips (Figure 1, right) leads to higher survival rates of Douglas-fir juveniles. Increasing the size of a planting gap, e.g., squares of 10 by 10 m in size, results only in intra tree competition and thus ensures a higher survival rate for Douglas-fir after 50 years. As shown in Figure 1, the larger the areas (square to strip) of planting, the higher the chance for Douglas-fir to survive competition from neighboring tree species. This corresponds to findings by [48,73]. The authors conclude that when planting Douglas-fir as an enrichment of naturally regenerated beech, Douglas-fir trees need to be planted in homogeneous patches to avoid competition among species. The different Douglas-fir growth driven by different planting layouts is also evident from the stem volume by scenario. After 50 years, a randomly planted Douglas-fir stand exhibits a stem volume of 72 m3/ha; if planted in squares, the stem volume production increases up to 258 m3/ha and reaches even more than 480 m3/ha if planted in strips (Table 5).
One of the most important silvicultural questions of Douglas-fir management is whether or not natural regeneration occurs and how this regeneration develops in mixtures with native European tree species. Previous studies have shown that Douglas-fir regenerates well [74,75] but may have difficulties surviving due to neighboring competition, mainly from beech [34,43]. This corresponds to reports included in our survey (Table 1), suggesting that natural Douglas-fir regeneration has difficulties surviving in mixtures with native tree species and especially beech, due to sparsely developed roots and crowns as well as a severe competition-induced mortality. This is fully in line with our simulation outputs (Exercise 2), illustrating the development of Douglas-fir natural regeneration in an initially Douglas-fir dominated mixed stand with beech and spruce. As depicted in Figure 2 (bottom left), our tree species has the capacity to arrive, establish and persist on the site over the tested growth period. However, after 100 years most of the dominating Douglas-fir trees disappear due to competition-induced mortality arising, especially from beech, which gradually enters the top layer (Figure 2, top right).
Comparing this situation to naturally regenerated mixed Douglas-fir stands with red alder (Alnus rubra) in the Pacific Northwest, we see a very similar eco-physiological pattern where Douglas-fir was not found beneath red alder, unless management enhanced the competitive situation [76]. Similar findings are reported for planting trials in Germany which show that the survival of Douglas-fir strongly requires planting in homogeneous patches [43]. This is a clear indication that Douglas-fir will require active management to ensure its survival and that no invasive behavior is evident [70].
Our simulations show that the early stage is decisive for Douglas-fir management. This is consistent with findings by [49], who demonstrated that the relief of juvenile mixed Douglas-fir stands is highly important for future stand development since it has a strong impact on the competition but also the root development. In its natural range, Douglas-fir is a so-called seral species, and as such, it also exhibits the properties of a pioneer [77], with a high demand for light while showing fast growth [13]. Thus, when cultivating the species in mixtures, it is important to take early supportive management actions such as accurate control of the competing vegetation, including the herbaceous stratum and the tree layer, to ensure both survival as well as high growth rates [54].
Finally, we analyzed different tending and thinning options (Exercise 3) as a powerful silvicultural instrument how to control the growth of forest stands. Our simulations showed that the variant New, including early and heavy thinning, in terms of stem volume, is superior to the two tested alternatives with moderate thinning (Figure 4 and Figure 5). A thinning regime similar to the here suggested variant New is described by [78] for the Massif central/Auvergne in France (with stem reduction to 500 stems/ha in 1st thinning and 300 stems/ha in second thinning, versus the reductions to 400 stems/ha and 275 stems/ha, respectively, suggested here). Apparently, a Douglas-fir stand, being heavily released as in the variant New, although including little stem volume initially, after a particular time-period catches up and outperforms (Figure 5, bar plot right hand) a stand that was exposed to light thinning, as effectuated by variant Questionnaire. Due to the above-mentioned characteristics of a pioneer species, the remaining young trees react sensitively to the ameliorated conditions and break out in growth. Furthermore, such a stand shows little mortality (Figure 5, bar plot right hand). This might be seen in the context that Douglas-fir reacts sensitively to changes in light availability regarding both growth as well as mortality. On the other hand, when considering the total available stem volume, including the remaining and removed volume, the variant Questionnaire with late and moderate thinning likewise represents a reasonable management option (Figure 5, bar plot left hand).
Our simulation results (Figure 4 and Figure 5) are consistent with empirical data from a 134 years-old planted Douglas-fir-forest in Lower Austria. This stand exhibits a mean dbh of 75 cm, a dominant tree height of 56 m, a stem number of 290/ha and a stocking volume of 2400 m3/ha [79]. This shows that, depending on the site conditions, the potential for Douglas-fir is very high but requires intensive management.
5. Conclusions
With this study, we investigated management measures for Douglas-fir stands in central Europe by exploring the current practices and, based on these management practices, by developing management corridors for key Douglas-fir management questions (Table 1). The three key demanded management options are (i) adequate plantation mixtures, especially in combination with beech, (ii) how to ensure the survival of natural regeneration of Douglas-fir, and (iii) appropriate tending and thinning regimes to optimize and fully utilize the growth potential of Douglas-fir in central Europe. Based on the results of our study, we suggest that Douglas-fir, when mixed with beech, should be planted in homogeneous patches to ensure its survival. Moreover, the study showed that Douglas-fir regenerates well, but the survival is strongly affected by beech, suggesting that Douglas-fir exhibits no invasive behavior. Finally, we can suggest that early and heavy thinning is an appropriate strategy to fully utilize the growth potential of Douglas fir in central Europe.
Author Contributions
Conceptualization, B.R.E., T.E. and H.H.; methodology, H.H.; software, B.R.E.; validation, B.R.E., H.H. and T.E.; formal analysis, B.R.E.; investigation, B.R.E.; resources, B.R.E.; data curation, B.R.E. and T.E.; writing—original draft preparation, B.R.E.; writing—review and editing, H.H.; visualization, B.R.E.; supervision, H.H.; project administration, H.H.; funding acquisition, H.H. All authors have read and agreed to the published version of the manuscript.
Funding
This work was supported by the Austrian Research Promotion Agency as part of the alpS project B04 AdaptAF B and CCDouglas II, and Austrian Science Fund (FWF) [Project ID: P26504].
Data Availability Statement
All data generated and analysed within this study are included in this article.
Acknowledgments
We thank the Arenberg-Schleiden GmbH, Center Forst GmbH, Erzbischöfliches Forstamt Kirchberg, Esterhazy Betriebe GmbH, Forstamt Ottenstein, Forstamt Stift Göttweig, Forstverwaltung Grafenegg, Forstverwaltung Graf zu Toerring-Jettenbach, Fürstliche Forstverwaltung Waldburg-Wolfegg, Fürst Starhemberg’sche Familienstiftung, Fürst zu Oettingen-Spielberg’sche Forstverwaltung, Gräfliche Arco-Zinneberg’sche Domänenverwaltung, Grüne Lagune BIO-EN Energy Consulting GmbH, Gutsverwaltung Bubna-Litic, Habsburg-Lothringen’sches Gut Persenbeug, Hatschek Forste, Hoyos’sche Forstverwaltung Horn, Land and Forstbetriebe Niederösterreich, Landwirtschaftskammer Niederösterreich, Landwirtschaftskammer Österreich, LIECO GmbH & Co. KG, Montecuccoli Gut Mitterau, Österreichische Bundesforste AG, Thurn und Taxis Forste GmbH & Co. KG, Unternehmensgruppe Fürst von Hohenzollern-FORST, Waldgut Pleiderer GesmbH & Co. OG, and Wittgenstein-Berleburg’sche Rentkammer for financial support (listed in alphabetic order).
Conflicts of Interest
The authors declare no conflict of interest. The funders had no role in the design of the study; in the collection, analyses, or interpretation of data; in the writing of the manuscript, or in the decision to publish the results.
References
- Fitzgerald, J.; Lindner, M. Adapting to Climate Change in European Forests-Results of the MOTIVE Project; Pensoft Publishers: Sofia, Bulgaria, 2013. [Google Scholar]
- Dyderski, M.K.; Paź, S.; Frelich, L.E.; Jagodziński, A.M. How much does climate change threaten European forest tree species distributions? Glob. Chang. Biol. 2018, 24, 1150–1163. [Google Scholar] [CrossRef]
- Schueler, S.; Falk, W.; Koskela, J.; Lefèvre, F.; Bozzano, M.; Hubert, J.; Kraigher, H.; Longauer, R.; Olrik, D.C. Vulnerability of dynamic genetic conservation units of forest trees in Europe to climate change. Glob. Chang. Biol. 2014, 20, 1498–1511. [Google Scholar] [CrossRef] [PubMed]
- Chakraborty, D.; Móricz, N.; Rasztovits, E.; Dobor, L.; Schueler, S. Provisioning forest and conservation science with high-resolution maps of potential distribution of major European tree species under climate change. Ann. For. Sci. 2021, 78, 1–18. [Google Scholar] [CrossRef]
- Hanewinkel, M.; Cullmann, D.A.; Schelhaas, M.-J.; Nabuurs, G.-J.; Zimmermann, N.E. Climate change may cause severe loss in the economic value of European forest land. Nat. Clim. Chang. 2013, 3, 203. [Google Scholar] [CrossRef]
- EU-Commission. Eu biodiversity strategy for 2030. Bringing nature back into our lives. In Communication from the Commission to the European Parliament, the Council, the European Economic and Social Committee and the Committee of the Regions; EU-Commission: Brussels, Belgium, 2020. [Google Scholar]
- Isermeyer, F.; Nieberg, H.; Banse, M.; Bolte, A.; Christoph-Schulz, I.B.; de Witte, T.; Dehler, M.; Döring, R.; Elsasser, P.; Fock, H.O.; et al. Auswirkungen Aktueller Politikstrategien (Green Deal, Farm-to-Fork, Biodiversitätsstrategie 2030; Aktionsprogramm Insektenschutz) auf Land-und Forstwirtschaft sowie Fischerei; Johann Heinrich von Thünen-Institut: Braunschweig, Germany, 2020. [Google Scholar]
- Elias, P.; Boucher, D. Planting for the future: How Demand for Wood Products Could Be Friendly to Tropical Forests; Union of Concerned Scientists: Cambridge, MA, USA, 2014. [Google Scholar]
- Buongiorno, J. Outlook to 2060 for World Forests and Forest Industries: A Technical Document Supporting Forest Service 2010 RPA Assessment; US Department of Agriculture, FOrest Service, Southern Research Station: Asheville, NC, USA, 2012; Volume 151.
- Millar, C.I.; Stephenson, N.L.; Stephens, S.L. Climate change and forests of the future: Managing in the face of uncertainty. Ecol. Appl. 2007, 17, 2145–2151. [Google Scholar] [CrossRef]
- Neophytou, C. Genetic differentiation within and among pedunculate and sessile oak stands in the Upper Rhine Valley: First results of an Interreg-project. Forstarchiv 2012, 83, 34–40. [Google Scholar]
- Bastien, J.-C.; Sanchez, L.; Michaud, D. Douglas-Fir (Pseudotsuga menziesii (Mirb.) Franco). In Forest TREE Breeding in Europe; Springer: Berlin/Heidelberg, Germany, 2013; pp. 325–369. [Google Scholar]
- Lavender, P.D.; Hermann, K.R. Douglas-Fir: The Genus Pseudotsuga; Forest Research Publications Office, Oregon State University: Corvallis, OR, USA, 2014. [Google Scholar]
- St Clair, J.B.; Mandel, N.L.; Vance-Borland, K.W. Genecology of Douglas fir in western Oregon and Washington. Ann. Bot. 2005, 96, 1199–1214. [Google Scholar] [CrossRef] [Green Version]
- Vor, T.; Spellmann, H.; Bolte, A.; Ammer, C. Potenziale und Risiken eingeführter Baumarten. Baumartenporträts mit naturschutzfachlicher Bewertung. Göttinger Forstwiss. 2015, 7, 233. [Google Scholar]
- Watts, A.; Bansal, S.; Harrington, C.; Clair, B.S. Predicting Douglas-fir’s response to a warming climate. In Science Findings 179; US Department of Agriculture, Forest Service, Pacific Northwest Research Station: Portland, OR, USA, 2015; Volume 179. [Google Scholar]
- Castaldi, C.; Marchi, M.; Vacchiano, G.; Corona, P. Douglas-fir climate sensitivity at two contrasting sites along the southern limit of the European planting range. J. For. Res. 2019, 1–12. [Google Scholar] [CrossRef] [Green Version]
- Eilmann, B.; Rigling, A. Tree-growth analyses to estimate tree species’ drought tolerance. Tree Physiol. 2012, 32, 178–187. [Google Scholar] [CrossRef] [PubMed] [Green Version]
- Knoke, T. Zu betriebswirtschaftlichen Chancen in der Forstwirtschaft. Der Bayer. Wald. 2005, 5-05, 12–15. [Google Scholar]
- Eckenwalder, J.E. Conifers of the World: The Complete Reference; Timber Press: Portland, OR, USA, 2009. [Google Scholar]
- Pötzelsberger, E. Should We Be Afraid of Non-Native Trees in Our Forests? In Stories about Successes Failures with Versatile Tree Species; Institute of Silviculture, University of Natural Resources and Life Sciences: Wien, Austria, 2018. [Google Scholar]
- Pötzelsberger, E.; Spiecker, H.; Neophytou, C.; Mohren, F.; Gazda, A.; Hasenauer, H. Growing Non-native Trees in European Forests Brings Benefits and Opportunities but Also Has Its Risks and Limits. Curr. For. Rep. 2020, 1–15. [Google Scholar] [CrossRef]
- Chakraborty, D.; Wang, T.; Andre, K.; Konnert, M.; Lexer, M.J.; Matulla, C.; Weißenbacher, L.; Schueler, S. Adapting Douglas-fir forestry in Central Europe: Evaluation, application, and uncertainty analysis of a genetically based model. Eur. J. For. Res. 2016, 135, 919–936. [Google Scholar] [CrossRef]
- Chakraborty, D.; Wang, T.; Andre, K.; Konnert, M.; Lexer, M.J.; Matulla, C.; Schueler, S. Selecting populations for non-analogous climate conditions using universal response functions: The case of Douglas-fir in central Europe. PLoS ONE 2015, 10, e0136357. [Google Scholar] [CrossRef]
- Hintsteiner, W.J.; van Loo, M.; Neophytou, C.; Schueler, S.; Hasenauer, H. The geographic origin of old Douglas fir stands growing in Central Europe. Eur. J. For. Res. 2018, 137, 447–461. [Google Scholar] [CrossRef] [Green Version]
- Kölling, C. Die Douglasie im Klimawandel: Gegenwärtige und zukünftige Anbaubedingungen in Bayern. LWF Wissen 2008, 59, 12–21. [Google Scholar]
- Konnert, M.; Ruetz, W. Genetic aspects of artificial regeneration of Douglas-fir (Pseudotsuga menziesii) in Bavaria. Eur. J. For. Res. 2006, 125, 261–270. [Google Scholar] [CrossRef]
- van Loo, M.; Hintsteiner, W.; Pötzelsberger, E.; Schüler, S.; Hasenauer, H. Intervarietal and intravarietal genetic structure in Douglas-fir: Nuclear SSRs bring novel insights into past population demographic processes, phylogeography, and intervarietal hybridization. Ecol. Evol. 2015, 5, 1802–1817. [Google Scholar] [CrossRef] [PubMed]
- Weißenbacher, L. Herkunftswahl bei Douglasie—Der Schlüssel für einen erfolgreichen Anbau. BFW Prax. 2008, 16, 3–5. [Google Scholar]
- Weller, A. Douglasien-Provenienzversuch von 1961 in Nordwestdeutschland: Ergebnisse nach 38 Jahren. Schweiz. Z. Fur Forstwes. 2012, 163, 105–114. [Google Scholar] [CrossRef]
- Goßner, M.; Ammer, U. The effects of Douglas-fir on tree-specific arthropod communities in mixed species stands with European beech and Norway spruce. Eur. J. For. Res. 2006, 125, 221–235. [Google Scholar] [CrossRef]
- Goßner, M.; Simon, U. Introduced Douglas fir (Pseudotsuga menziesii (Mirb.) Franco) affects community structure of tree-crown dwelling beetles in a managed European forest. Bioogische Invasionen-eine Herausford. Zum Handeln NEOBIOTA 2002, 1, 167–179. [Google Scholar]
- Höltermann, A.; Klingenstein, F.; Ssymank, A. Naturschutzfachliche Bewertung der Douglasie aus Sicht des Bundesamtes für Naturschutz (BfN). LWF Wissen 2008, 59, 74–81. [Google Scholar]
- Knoerzer, D. Zur Naturverjüngung der Douglasie im Schwarzwald. Inventur und Analyse von Umwelt- und Konkurrenzfaktoren sowie eine naturschutzfachliche Bewertung. Diss. Bot. 1999, 306, 283. [Google Scholar]
- Schmid, M.; Pautasso, M.; Holdenrieder, O. Ecological consequences of Douglas fir (Pseudotsuga menziesii) cultivation in Europe. Eur. J. For. Res. 2014, 133, 13–29. [Google Scholar] [CrossRef] [Green Version]
- Wohlgemuth, T.; Moser, B.; Pötzelsberger, E.; Rigling, A.; Gossner, M.M. Über die Invasivität der Douglasie und ihre Auswirkungen auf Boden und Biodiversität. Schweiz. Z. Fur Forstwes. 2021, 172, 118–127. [Google Scholar] [CrossRef]
- Hein, S.; Weiskittel, A.R.; Kohnle, U. Effect of wide spacing on tree growth, branch and sapwood properties of young Douglas-fir [Pseudotsuga menziesii (Mirb.) Franco] in south-western Germany. Eur. J. For. Res. 2008, 127, 481–493. [Google Scholar] [CrossRef]
- Rais, A.; van de Kuilen, J.-W.G.; Pretzsch, H. Growth reaction patterns of tree height, diameter, and volume of Douglas-fir (Pseudotsuga menziesii [Mirb.] Franco) under acute drought stress in Southern Germany. Eur. J. For. Res. 2014, 133, 1043–1056. [Google Scholar] [CrossRef]
- Rais, A.; Poschenrieder, W.; Pretzsch, H.; van de Kuilen, J.-W.G. Influence of initial plant density on sawn timber properties for Douglas-fir (Pseudotsuga menziesii (Mirb.) Franco). Ann. For. Sci. 2014, 71, 617–626. [Google Scholar] [CrossRef]
- Todaro, L.; Macchioni, N. Wood properties of young Douglas-fir in Southern Italy: Results over a 12-year post-thinning period. Eur. J. For. Res. 2011, 130, 251–261. [Google Scholar] [CrossRef]
- Weiskittel, A.R.; Monserud, R.A.; Rose, R.; Turnblom, E.C.; Maguire, D.A. Intensive management influence on Douglas-fir stem form, branch characteristics, and simulated product recovery. N. Z. J. For. Sci. 2006, 36, 293–312. [Google Scholar]
- Weiskittel, A.R.; Maguire, D.A.; Monserud, R.A. Response of branch growth and mortality to silvicultural treatments in coastal Douglas-fir plantations: Implications for predicting tree growth. For. Ecol. Manag. 2007, 251, 182–194. [Google Scholar] [CrossRef]
- Kownatzki, D.; Kriebitzsch, W.-U.; Bolte, A.; Liesebach, H.; Schmitt, U.; Elsasser, P. Zum Douglasienanbau in Deutschland. Johann Heinrich von Thünen-Institut: Braunschweig, Germany. Sonderheft 344 2011, 3. [Google Scholar]
- Kenk, G.; Hradetzky, J. Behandlung und Wachstum der Douglasien in Baden-Württemberg. Mitt. Der Forstl. Vers. Forsch. Baden-Württemb 1984, 113, 89. [Google Scholar]
- Pretzsch, H.; Spellmann, H. Leistung und Struktur des Douglasien-Durchforstungsversuchs Lonau 135. Forst und Holz 1994, 49, 64–69. [Google Scholar]
- Ehring, A.; Kohnle, U. Ergebnisse aus dem Douglasien-Standraumversuch. FVA-einblick 2010, 3, 15–17. [Google Scholar]
- Klädtke, J.; Kohnle, U.; Kublin, E.; Ehring, A.; Pretzsch, H.; Uhl, E.; Spellmann, H.; Weller, A. Wachstum und Wertleistung der Douglasie in Abhängigkeit von der Standraumgestaltung. Schweiz. Z. Fur Forstwes. 2012, 163, 96–104. [Google Scholar] [CrossRef]
- Kohnle, U.; Klädtke, J.; Chopard, B. Waldbau mit Douglasie in Deutschland und in Frankreich. Schweiz. Z. Fur Forstwes. 2021, 172, 66–75. [Google Scholar] [CrossRef]
- Spiecker, H.; Lindner, M.; Schuler, J.K. Douglas-fir: An Option for Europe; European Forest Institute: Joensuu, Finland, 2019. [Google Scholar]
- Hermann, R.K.; Lavender, D.P. Douglas-fir. Silvics N. Am. 1990, 1, 527–540. [Google Scholar]
- Curtis, R.O.; Carey, A.B. Timber supply in the Pacific Northwest: Managing for economic and ecological values in Douglas-fir forest. J. For. 1996, 94, 4–7, 35–37. [Google Scholar]
- Constantino, L.F.; Haley, D. Trends in wood quality for the British Columbia coast and the United States, Pacific Northwest, Westside. For. Sci. 1988, 34, 176–189. [Google Scholar]
- Briggs, D. Management Practices on Pacific Northwest West-Side Industrial Forest Lands, 1991–2005 with Projections to 2010; College of Forest Resources, University of Washington: Seattle, WA, USA, 2007. [Google Scholar]
- Curtis, R.O. Silviculture for Multiple Objectives in the Douglas-Fir Region; US Department of Agriculture, Forest Service, Pacific Northwest Research Station: Portland, OR, USA, 1998; Volume 435, 123p.
- Talbert, C.; Marshall, D. Plantation productivity in the Douglas-fir region under intensive silvicultural practices: Results from research and operations. J. For. 2005, 103, 65–70. [Google Scholar]
- Reukema, D.L. Guidelines for Precommercial Thinning of Douglas-Fir; Pacific Northwest Forest and Range Experiment Station, US Department of Agriculture, Forest Service: Portland, OR, USA, 1975; Volume 30.
- Worthington, N.P.; Staebler, G.R. Commercial Thinning of Douglas-Fir in the Pacific Northwest; No. 1230; US Department of Agriculture: Portland, OR, USA, 1961.
- Hasenauer, H. Ursprung, Waldbauliche Potentiale und Zukunft der Douglasie in Mitteleuropa; Institut für Waldbau, Universität für Bodenkultur: Wien, Austria, 2018. [Google Scholar]
- Eckhart, T.; Pötzelsberger, E.; Koeck, R.; Thom, D.; Lair, G.J.; van Loo, M.; Hasenauer, H. Forest stand productivity derived from site conditions: An assessment of old Douglas-fir stands (Pseudotsuga menziesii (Mirb.) Franco var. menziesii) in Central Europe. Ann. For. Sci. 2019, 76, 1–11. [Google Scholar] [CrossRef] [Green Version]
- Eckmüllner, O. Ertragstafel Douglasie für Systematische Oder Zufällige Entnahme; NÖ Holzwerbefonds: St. Pölten, Austria, 2015. [Google Scholar]
- Marschall, J. Hilfstafeln für die Forsteinrichtung; Österreichischer Agrarverlag: Wien, Austria, 1975. [Google Scholar]
- Abetz, P. Eine Entscheidungshilfe für die Durchforstung von Fichtenbeständen. Allg. Forstz. 1975, 30, 666–667. [Google Scholar]
- Hasenauer, H. Ein Einzelbaumwachstumssimulator für Ungleichaltrige Fichten-Kiefern- und Buchen-Fichtenmischbestände; Forstl. Schriftenreihe, Univ. f. Bodenkultur; Gesellschaft für Waldökosystemforschung und Experimentelle Baumforschung an der Universität für Bodenkultur: Wien, Austria, 1994. [Google Scholar]
- Klopf, M. Moses: A Single Tree Growth Simulator for Forest Management Planning. Ph.D. Thesis, Universität für Bodenkultur, Wien, Austria, 2014. [Google Scholar]
- Thurnher, C.; Klopf, M.; Hasenauer, H. MOSES-A tree growth simulator for modelling stand response in Central Europe. Ecol. Modell. 2017, 352, 58–76. [Google Scholar] [CrossRef]
- Ek, A.R.; Monserud, R.A. Trials with program FOREST: Growth and reproduction simulation for mixed species even-or uneven-aged forest stands. Growth Model. Tree Stand Simul. 1974, 30, 56–73. [Google Scholar]
- Bergel, D. Douglasien-Ertragstafel für Nordwestdeutschland; Fachhochsch: Hildesheim/Holzminden, Germany, 1985. [Google Scholar]
- Mitscherlich, E.A. Das Gesetz des Pflanzenwachstums. Landwirtsch. Jahrb. 1919, 53, 167–182. [Google Scholar]
- Hasenauer, H. Dimensional relationships of open-grown trees in Austria. For. Ecol. Manag. 1997, 96, 197–206. [Google Scholar] [CrossRef]
- Eberhard, B.; Hasenauer, H. Modeling Regeneration of Douglas fir forests in Central Europe. Austrian J. For. Sci. 2018, 135, 33–51. [Google Scholar]
- Reynolds, M.R. Estimating the error in model predictions. For. Sci. 1984, 30, 454–469. [Google Scholar]
- Sachs, L. Abhängigkeitsmaße: Korrelation und Regression. In Angewandte Statistik; Springer: Berlin/Heidelberg, Germany, 1999; pp. 489–578. [Google Scholar]
- Kohnle, U. Nadelbaum-Tuning für Laubbaum-Verjüngungen. AFZ-DerWald 2019, 74, 50–54. [Google Scholar]
- Angelier, A.; Bailly, A.; Romand, J.L.; Cour-Dier, J.M.; Vautier, F.; Jacquemin, B.; Couty, A.; Gautry, J.-Y. Mise au point de scénarios de régénération naturelle du douglas pour le Massif central. Rendez-vous Tech. ONF Fontainebleau 2004, 6, 64–68. [Google Scholar]
- Angelier, A. Douglasaies Françaises; Office National des Forêts: Paris, France, 2007.
- Oliver, C.D.; Larson, B.C. Brief Notice: Forest Stand Dynamics (Update Edition). For. Sci. 1996, 42, 397. [Google Scholar]
- Grime, J.P. Plant Strategies, Vegetation Processes, and Ecosystem Properties; John Wiley & Sons: Hoboken, NJ, USA, 2006. [Google Scholar]
- Bailly, A.; Dechamps, J. Le Douglas; Association Forèt Cellulose: Paris, France, 1997; 416p. [Google Scholar]
- Rössler, G. Douglasienbestand Landl/Großreifling; BFW, Institut für Waldwachstum: Wien, Austria, 2015; 5p, Available online: http://www.waldveredelung.at/images/pdf/Douglasie_Groreifling.pdf (accessed on 7 March 2021).
Figure 1.
Three different planting variants of Douglas-fir within mixed common beech and Norway spruce stands. The assumed initial stem number in all cases is 2000/ha. The regeneration tool of the MOSES simulator is not active, no tending or thinning is added, simulation period is 50 years. The figures depict the three plantation layouts; (i) random/associated, (ii) square, and (iii) strip. We see the top view on the stand before (top section of the figure) and after (bottom section of the figure) the simulation. The figures on the bottom come directly from the simulator, the dots represent the cross-sectional area of the stems, and for visibility reasons, the diameters are enlarged at 9:1.

Figure 2.
Development of the natural regeneration of Douglas-fir according to simulation with the generated growth model. The demonstrated stand corresponds to a sampled Douglas-fir—beech—spruce stand aged 100 years (stand 18, see Table 2). The simulation period was set as 100 years for the simulation when the regeneration tool was activated. No silvicultural entries were applied. On the top section of the figure, we see the top view on the stand before and after the simulation. The dots represent the cross-sectional area of the stems; for visibility reasons, the diameters are enlarged at 9:1. Black dots stand for Douglas-fir, dark grey dots for spruce, and light grey dots for beech (see also Figure 1).

Figure 3.
Differences of predicted vs. observed five-year increments using the independent validation data set (Table 3) plotted against tree height (h), crown ratio (cr), and competition index (ci).
Figure 3.
Differences of predicted vs. observed five-year increments using the independent validation data set (Table 3) plotted against tree height (h), crown ratio (cr), and competition index (ci).


Figure 4.
Simulation of three thinning variants of a pure Douglas-fir stand. The variant Questionnaire includes many small entries, Traditional executes three thinning interventions, and the variant New suggests a regime with two early and intensive thinnings. The results show the mean development of 10 simulation-runs, the grey band delineates the confidence interval at α = 0.05. The left figure shows the stem volume development, the right figure the mean diameter development vs. age.

Figure 5.
Simulated total stem wood production (remaining volume plus removed volume plus fallen timber/mortality) of the pure Douglas-fir stand after three treatment variants Traditional, Questionnaire, and New (see Figure 4). Variant New produces the highest remaining volume, but in terms of total harvested volume (remaining plus thinned), the variant Questionnaire is the best.


Table 1.
Summary of the evaluation of the survey practices of planting Douglas-fir in Central Europe. The information comes from 19 forest companies that provided management information of 434 Douglas-fir stands. These stands were only used for the evaluation of the currently practised Douglas-fir management in Central Europe and differ from the stands listed in Table 2.
| Variety/Provenance | The principal variety was coastal Douglas-fir (Pseudotsuga menziesii var. viridis), origins are Ashford Elbe, Darrington, Snoqualmie River, Trout Lake (USA), Centre Creek, Heffley Lake (Canada) [25]. |
| Site and stand characteristics | Summer warm and dry climate in the Eastern part of Austria, oceanic climate in the Alpine foreland of Austria, and low mountain range in Germany, astonished climate at the northern edge of the Alps; the majority of stands at altitudes 650 m to 850 m, on silicate bedrock with soil depth 30 cm to 120 cm, 14% on limestone with soil depth <15 cm to 30 cm; water balance on silicate sites was moderately fresh to fresh, on limestone moderately dry; 76% of stands are aged <20 years. |
| Species mixture | The principal associated species were Norway spruce, common beech, silver fir, larch, Scots pine, sessile oak, maple; with stem number of Douglas-fir smaller 0.3 (44%); greater 0.3 and smaller 0.5 (21%); greater 0.5 (14%). |
| Planting | Use of bare-rooted plants was most common (73%); planting operations performed by concave spade and whole driller (77%), or by planting ditches (18%); spacing from 1.5 × 2.5 m to 5 × 5 m, most common being 1.8 × 2 m; most common initial stem number 2700/ha; portion of Douglas-fir on average was 30%; mixture form principally was tree by tree with Douglas-fir every 5 to 10 m, planting Douglas-fir in rows or groups was rare; planting largely occurs in spring; frequently reported problem was a fail of Douglas-fir due to insufficient initial stem number. |
| Natural regeneration | Establishment of Douglas-fir under the shelter of mature trees by opening up or group removal; insufficient opening up causes inadequate rooting and poor crown development; threats come from competitive vegetation, especially native tree species, and game damages. |
| Tending | Most commonly at top height 2 to 6 m (74%), stem number reduction by 30%; sudden drop-down of young Douglas-fir after release, as result of poorly developed roots and crowns (6%); problem was the spread of blackberry (Rubus fruticosus) after release. |
| Thinning | First thinning at top height 8 to 10m (83%), with removed volume 30–50 m3/ha; subsequent interventions at intervals 5 to 10 years, with removed volume 50–120 m3/ha; thinning method was future crop tree selection (68%); mentioned problem was a degradation of the crown after thinning due to insufficient thinning and too late thinning (16%). |
| Debranching | Debranching at top height 8 to 10 m (37%), at 12 to 15 m (44%); debranched section of tree was between 5 and 10 m (77%); reported problem was the big workload. |
Table 2.
Stand and site-specific information on the recorded Douglas-fir stands, covering stand age, N, the stem number; DH, the dominant tree height; Dq, the mean breast height diameter; V, the stem volume, Elev, the elevation above sea level; Annual Temp., the mean annual temperature, and Annual Precip., the annual precipitation. The Stands 1–3, 6–8, 11–20, and 29 were established in 2012 and re-measured in 2017 and provide the calibration data (total 17 stands). The remaining 13 stands were established in 2013/14 and re-measured in 2018/19 and were used for validation. The listed stands below differ from the stands used for the survey (Table 1).
| Stand | Age | N/ha | DH (m) | Dq (cm) | V/ha (m3) | Elev (m) | Annual Temp. (°C) | Annual Precip. (mm) | Geology |
|---|---|---|---|---|---|---|---|---|---|
| 1 | 90 | 136 | 35 | 52 | 324 | 290 | 9.9 | 600 | Loess |
| 2 | 84 | 164 | 43 | 62 | 720 | 460 | 9.6 | 720 | Boulders in a sand-loam matrix |
| 3 | 82 | 211 | 43 | 57 | 721 | 560 | 9.1 | 790 | Mica schist, quartz phyllonite |
| 4 | 40 | 399 | 23 | 32 | 278 | 520 | 9.3 | 770 | Muscovite gneiss |
| 5 | 38 | 558 | 24 | 32 | 371 | 360 | 9.5 | 650 | Sand and argillaceous marl |
| 6 | 52 | 188 | 27 | 39 | 223 | 370 | 9.1 | 570 | Granulite |
| 7 | 108 | 61 | 32 | 62 | 219 | 400 | 9.0 | 580 | Granulite |
| 8 | 58 | 748 | 33 | 39 | 822 | 430 | 9.1 | 640 | Granulite |
| 9 | 43 | 306 | 31 | 39 | 474 | 440 | 8.9 | 620 | Magmatized granite-gneiss |
| 10 | 42 | 285 | 29 | 39 | 386 | 410 | 9.0 | 610 | Paragneis |
| 11 | 70 | 165 | 39 | 64 | 595 | 330 | 9.4 | 960 | Rubble |
| 12 | 121 | 247 | 39 | 59 | 863 | 530 | 7.9 | 710 | Granite |
| 13 | 110 | 160 | 53 | 81 | 1317 | 820 | 7.1 | 2100 | Carbonate-free, fine sandstone |
| 14 | 109 | 76 | 50 | 82 | 740 | 640 | 8.0 | 900 | Granite |
| 15 | 105 | 108 | 53 | 77 | 829 | 660 | 7.9 | 910 | Granite |
| 16 | 104 | 207 | 50 | 73 | 821 | 590 | 8.3 | 890 | Granite |
| 17 | 54 | 324 | 33 | 50 | 650 | 660 | 8.1 | 1110 | Gravel in sand matrix, fluvial |
| 18 | 95 | 221 | 43 | 67 | 821 | 810 | 7.7 | 1450 | Sandstone calcareous marl |
| 19 | 100 | 226 | 48 | 67 | 1199 | 480 | 8.8 | 960 | Silt, clayey-sandy, often gravelly |
| 20 | 72 | 360 | 37 | 53 | 695 | 680 | 7.3 | 900 | Biotite-granite |
| 21 | 58 | 221 | 39 | 52 | 627 | 480 | 8.6 | 780 | Impact breccia |
| 22 | 62 | 350 | 39 | 49 | 749 | 670 | 8.2 | 1120 | Glacial till, silt, sand, gravel |
| 23 | 109 | 146 | 50 | 78 | 1158 | 660 | 7.9 | 870 | Gravel, silt, clay, often stones |
| 24 | 40 | 544 | 22 | 32 | 245 | 700 | 7.7 | 900 | Limestone, dolomite |
| 25 | 41 | 612 | 23 | 32 | 391 | 700 | 7.8 | 890 | Corallian limestone |
| 26 | 60 | 298 | 37 | 51 | 673 | 890 | 7.0 | 1050 | Limestone, dolomite |
| 27 | 51 | 366 | 34 | 41 | 453 | 450 | 9.1 | 970 | Limestone, dolomite |
| 28 | 50 | 279 | 32 | 48 | 579 | 520 | 8.8 | 1010 | Dolomite |
| 29 | 53 | 594 | 32 | 30 | 465 | 290 | 9.9 | 600 | Variegated sandstone |
| 30 | 37 | 910 | 28 | 31 | 873 | 460 | 9.6 | 720 | Variegated sandstone |
Table 3.
Characteristics of the trees used for model calibration and validation. The numbers represent the mean as well as the range (minimum and maximum) values by age class. h is the tree height, ih the five-year height increment, dbh the breast height diameter, id the five-year diameter increment, hlc the height to life crown base, and ∆hlc the five-year shift upwards of the height to life crown base.
| Age Class | Trees | Characteristics of the Trees (Mean, Min, Max) | |||||
|---|---|---|---|---|---|---|---|
| h (m) | ih (m) | dbh (cm) | id (cm) | hlc (m) | ∆hlc (m) | ||
| Calibration Data | |||||||
| <30 | 22 | 17.7 | 1.52 | 15.1 | 1.61 | 8.02 | 3.14 |
| (10.8–21.1) | (0.101–2.81) | (7.12–25.4) | (0.110–4.32) | (3.11–10.5) | (0.122–6.23) | ||
| 31–50 | 24 | 18.23 | 1.10 | 15.7 | 1.31 | 8.62 | 2.93 |
| (11.1–21.6) | (0.120–2.83) | (7.91–26.4) | (0.141–4.22) | (3.13–11.6) | (0.101–7.23) | ||
| >50 | 58 | 24.0 | 1.4 | 25.3 | 1.73 | 14.9 | 1.74 |
| (12.4–47.0) | (0.143–2.92) | (9.01–56.5) | (0.132–3.93) | (5.54–26.1) | (0.143–4.92) | ||
| Validation Data | |||||||
| <30 | 106 | 22.1 | 1.55 | 22.4 | 1.38 | 14.1 | 1.10 |
| (11.6–29.9) | (0.102–2.63) | (8.32–49.5) | (0.132–5.40) | (6.62–25.4) | (0.122–3.81) | ||
| 31–50 | 103 | 22.2 | 1.80 | 25.2 | 1.70 | 11.4 | 1.70 |
| (12.3–33.7) | (0.112–3.62) | (7.71–46.2) | (0.104–4.62) | (5.73–20.0) | (0.143–4.11) | ||
| >50 | 124 | 27.4 | 1.70 | 33.5 | 1.70 | 16.3 | 1.75 |
| (11.5–51.0) | (0.140–3.52) | (9.12–97.1) | (0.144–5.02) | (5.50–28.1) | (0.133–4.15) | ||
Table 4.
Differences between predicted and observed increments within a five-year growth period. The ih denotes the height increment, id the dbh increment, Δhlc the change to life crown base, xobs the mean of the observed five-year changes in height, diameter and height to crown base, the mean difference between predicted and observed values, sD the standard deviation of the differences. CI is the confidence interval, PI the prediction interval, and TI the tolerance interval at significance level α = 0.05 (see Reynolds 1984). The values between brackets denote the minima and maxima.
| Trees | xobs (Min, Max) | sD | CI | PI | TI | |||
|---|---|---|---|---|---|---|---|---|
| Eckmüllner | ||||||||
| ih (m) | 333 | 1.68 | (0.102–3.62) | 0.032 | 0.87 | −0.063 to 0.13 | −1.69 to 1.75 | −2.38 to 2.44 |
| id (cm) | 333 | 1.6 | (0.104–5.40) | 0.031 | 1.11 | −0.089 to 0.15 | −2.15 to 2.21 | −3.02 to 3.08 |
| Δhlc (m) | 333 | 1.53 | (0.122–4.15) | −0.034 | 1.31 | −0.21 to 0.13 | −2.62 to 2.55 | −5.32 to 5.26 |
| Bergel | ||||||||
| ih (m) | 333 | 1.68 | (0.102–3.62) | 0.029 | 0.9 | −0.062 to 0.12 | −1.74 to 1.79 | −2.43 to 2.49 |
| id (cm) | 333 | 1.6 | (0.104–5.40) | −0.245 | 1.13 | −0.36 to −0.13 | −2.47 to 1.98 | −3.34 to 2.73 |
| Δhlc (m) | 333 | 1.53 | (0.122–4.15) | 0.133 | 1.29 | −0.02 to 0.286 | −2.41 to 2.68 | −3.45 to 3.71 |
Table 5.
Simulation results of the identified Douglas-fir planting variants according to different mixtures with common beech and Norway spruce: Variant 1: random planting, Variant 2: square or small patches, and Variant 3: strip or larger patches. An illustration of the assumed planting is given in Figure 1. N/ha is the stem number per ha, V/ha is the stem volume in m3 per ha, hL is the mean height in m, and Dq is the mean diameter in cm.
| Random | Square | Strip | ||||||||||
|---|---|---|---|---|---|---|---|---|---|---|---|---|
| N/ha | V/ha (m3) | hL (m) | Dq (cm) | N/ha | V/ha (m3) | hL (m) | Dq (cm) | N/ha | V/ha (m3) | hL (m) | Dq (cm) | |
| Spruce | 155 | 5 | 11 | 8 | 411 | 140 | 19 | 22 | 422 | 150 | 19 | 22 |
| Dou f | 244 | 72 | 17 | 20 | 255 | 258 | 23 | 33 | 355 | 483 | 25 | 38 |
| Beech | 455 | 747 | 25 | 44 | 488 | 487 | 24 | 34 | 444 | 330 | 23 | 30 |
| ∑ | 854 | 824 | 1154 | 885 | 1222 | 964 | ||||||
Publisher’s Note: MDPI stays neutral with regard to jurisdictional claims in published maps and institutional affiliations. |
© 2021 by the authors. Licensee MDPI, Basel, Switzerland. This article is an open access article distributed under the terms and conditions of the Creative Commons Attribution (CC BY) license (https://creativecommons.org/licenses/by/4.0/).
Share and Cite
MDPI and ACS Style
Eberhard, B.R.; Eckhart, T.; Hasenauer, H. Evaluating Strategies for the Management of Douglas-Fir in Central Europe. Forests 2021, 12, 1040. https://0-doi-org.brum.beds.ac.uk/10.3390/f12081040
AMA Style
Eberhard BR, Eckhart T, Hasenauer H. Evaluating Strategies for the Management of Douglas-Fir in Central Europe. Forests. 2021; 12(8):1040. https://0-doi-org.brum.beds.ac.uk/10.3390/f12081040
Chicago/Turabian StyleEberhard, Benno Richard, Tamara Eckhart, and Hubert Hasenauer. 2021. "Evaluating Strategies for the Management of Douglas-Fir in Central Europe" Forests 12, no. 8: 1040. https://0-doi-org.brum.beds.ac.uk/10.3390/f12081040
Note that from the first issue of 2016, this journal uses article numbers instead of page numbers. See further details here.