
Carbon and Oxygen Gas Exchange in Woody Debris: The Process and Climate-Related Drivers
by
 , ,
, ,
Victor A. Mukhin
1,2,* ,
,
Daria K. Diyarova
1,
Mikhail L. Gitarskiy
3,4 and
Dmitry G. Zamolodchikov
5 1
Institute of Plant and Animal Ecology, Ural Division of the Russian Academy of Sciences, 620144 Yekaterinburg, Russia
2
Institute of Natural Sciences and Mathematics, Ural Federal University, 620026 Yekaterinburg, Russia
3
Ecology and Environmental Management Program, Ugresha Branch, Dubna State University, 140090 Dzerzhinsky, Russia
4
Russian Energy Agency, Ministry of Energy of the Russian Federation, 129085 Moscow, Russia
5
Center for Forest Ecology and Productivity, Russian Academy of Sciences, 117234 Moscow, Russia
*
Author to whom correspondence should be addressed.
Forests 2021, 12(9), 1156; https://0-doi-org.brum.beds.ac.uk/10.3390/f12091156
Submission received: 1 July 2021
/
Revised: 20 August 2021
/
Accepted: 24 August 2021
/
Published: 26 August 2021
(This article belongs to the Special Issue Forest Soil Carbon and Climate Changes)
Abstract
:The carbon-to-oxygen relationship and gas exchange balance, organic carbon to CO2 conversion intensity and efficiency, and their relevance to climate parameters and wood decay fungi were investigated for birch woody debris (WD) in the Mid-Urals mixed pine and birch forests. It was shown that, within the range of temperatures from 10 to 40 °C and relative moisture (RM) of wood of 40% and 70%, aerobic gas exchange was observed in the WD, encompassing the physiologically entwined processes of CO2 emission and O2 uptake. Their volumetric ratio (0.9) confirmed that (1) the WD represents a globally significant CO2 source and appropriate O2 consumer and (2) the oxidative conversion of organic carbon is highly efficient in the WD, with an average ratio of CO2 released to O2 consumed equal to 90%. The balance of carbon-to-oxygen gas exchange and oxidizing conversion efficiency in the WD were not affected by either fungal species tested or by moisture or temperature. However, the intensity of gas exchange was unique for each wood decay fungi, and it could be treated as a climate-reliant parameter driven by temperature (Q10 = 2.0–2.1) and moisture (the latter induced a corresponding trend and value changes in CO2 emission and O2 uptake). Depending on the direction and degree of the change in temperature and moisture, their combined effect on the intensity of gas exchange led to its strengthening or weakening; otherwise, it was stabilized. Aerobic respiration of wood decay Basidiomycetes is an essential prerequisite and the major biotic factor in the WD gas exchange, while moisture and temperature are its climatic controllers only.
Keywords:
boreal forest; woody debris; CO2; O2; gas exchange; temperature; moisture; wood decay Basidiomycetes1. Introduction
Forests are the largest terrestrial carbon sinks and reservoirs, playing an important role in CO2 regulation in the atmosphere. Their carbon cycle is specified by a large-scale and long-lasting (from dozens to hundreds of years) woody pool. It is estimated at 30 Gt C for the forests of Russia, and 240 Mt are annually added to it. Mobilization of woody pool carbon, shown by biological decomposition of woody debris (WD), is the main process of the forest ecosystem carbon cycle. The WD reservoir is almost 5 Gt of carbon equivalent in Russia, second to soil with 214 Mt C-CO2 annual releases to the atmosphere [1]. Therefore, forest ecosystems are not only C-CO2 removers, but they also are among the largest natural sources of this greenhouse gas, whose accumulation in the atmosphere is attributed to the modern climate change [2]. That is the rationale for intensive studies of WD decomposition and gas exchange.
Although performed in numerous areas, previous research mainly focused on CO2-emission activity of WD and its relevance to climate [3,4,5,6,7,8,9,10,11,12,13,14,15,16,17,18]. The results of these studies clearly confirm that humidity and temperature are the most important climatic drivers of CO2 gas exchange in WD and climate change that are projected to increase precipitation and temperature [19], which should significantly affect WD carbon respiration. Alongside the variety of research examining WD respiration, the vast majority is lacking assessment of connectivity with (1) oxygen gas exchange and (2) the activity of certain species and groups of organisms that decompose wood. In particular, only a few works available consider the relationship between communities of wood decay fungi and CO2 emission intensity of WD [20,21,22,23,24]. The relationship and balance of carbon–oxygen gas exchange in WD under its decomposition by xylotrophic Basidiomycetes are considered only in Solovyov’s monograph [25].
WD is a biologically inactive dead mass, and its gas exchange is a consequence of the myco-bacterial community populating it. Xylotrophic Basidiomycetes (Basidiomycota, Agaricomycetes) dominate this community, being the only organisms in the modern biosphere capable of biochemical conversion of lignocellulose. Their activity provides a major contribution to gas exchange and decomposition of WDs [1,26,27,28,29,30,31,32]. Xylotrophic Basidiomycetes are accompanied by mycophilous fungi and bacteria that are capable of developing in this specific environment formed by xylotrophic fungi [1,33,34]. They include not only aerobic but also anaerobic microorganisms, so far as anaerobic conditions could locally form in timber owing to high moisture and O2 uptake by fungi uncompensated by diffusion. Such conditions promote the formation of anaerobic bacteria and archaea, as well as the anaerobic production of CO2 and CH4 as gas exchange [1,4,18,20,35]. There is evidence that methane may also be produced by xylotrophic Basidiomycetes [36,37], many of which can exist in oxygen-free environments [25,38], being de facto electively anaerobic organisms. The latter results in a complex and diverse nature of gas exchange in WD, where qualitative and quantitative features are regulated by appropriate features of xylobiont myco-bacterial communities and the environment parameters such as temperature and humidity. In view of the recent challenge of climate change, it is evident that the investigation of gas exchange in WD as a multicomponent process and its intensity and relevance to composition of wood decay agents and climate has become highly urgent.
With this, the objectives of our work comprised the investigation of (1) contingency and balance of carbon to oxygen gas exchange in the WD; (2) intensity and efficiency of organic carbon conversion into CO2; and (3) the relation of CO2 and O2 gas exchange with climate parameters and wood decay fungi.
2. Materials and Methods
The studies were carried out in pre-forest and steppe mixed pine and birch forests with Pinus sylvestris L. and Betula pendula Roth in the Sysert district of the Sverdlovsk region, 56°36′5″ N and 61°3′24″ E. The local climate is temperate continental with annual mean temperature range of +1.5 to +0.1 °C. The warmest month is July (+17 °C) and the coldest is January (−16 °C). The permanent snow cover lasts from November to April, while the growth season is from May to September. The annual precipitation is 350–400 mm, with most of it during summer and fall.
Experimental Design
The carbon and oxygen gas exchange was assessed for birch WD (B. pendula), with wood decay fungi basidiocarps of the following eight species: Daedaleopsis tricolor (Bull.) Bondartsev and Singer; Fomes fomentarius (L.) Fr.; Fomitopsis betulina (Bull.) B.K. Cui, M.L. Han and Y.C. Dai; Hapalopilus rutilans (Pers.) Murrill; Stereum hirsutum (Willd.) Pers.; Steccherinum ochraceum (Pers. ex J.F. Gmel.) Gray; Trametes pubescens (Schumach.) Pilát; and T. versicolor (L.) Lloyd. They form a wood-decay fungi complex common to Betula WD of mixed birch and pine forests of the pre-forest–steppe zone. The identification of the fungi species was carried out with the use of regular mycological methods [39,40], and the terminology is provided in accordance with MycoBank Database [41].
Gas analysis was carried out for the samples of wood (4 cm in diameter and 3 cm in length, average size; and mean volume 0.03 L) that are defined as fine, woody debris in, accordance with Enrong et al. [42]. The samples were cut with the use of a tree chain saw from sites of birch twigs and stems, close to the basidiocarps of the fungi species referred to above. Then, the samples were cleaned from remnants of leaves, needles, herbaceous plants, and fungi basidiocarps and weighed with Kern 440-45N weight (Kern & Sohn GmbH, Germany, 0.1-g precision) to determine the initial wet mass. To calculate the cubic content, the diameters and length of each sample were measured.
The thermal relationship of carbon-to-oxygen gas exchange was analyzed at 10, 20, 30, and 40 °C ± 1 °C and two wood relative moisture (RM) levels of 37–41% (average 40%), which correspond to the initial natural wood moisture, and 61–77% (average 70%) when the samples were wetted with distilled water to simulate increased humidity conditions. The wood absolute moisture (AM) for the first case was 65%, and it was 245% for the second case, accordingly. The sample moistures were controlled throughout the entire gas analysis by their wet mass. Upon completion of the experimental measurement cycles, the samples were oven dried at +105 °C for 72 h to determine their absolute dry mass and moisture. The RM and AM were correspondingly calculated with the use of Equations (1) and (2):
where RM is the relative moisture, in percent; Mw is the mass of wet sample, in g; and Md is the absolute dry weight of the sample, in g.
where AM is the absolute moisture, in percent; Mw is the mass of wet sample, in g, and Md is the absolute dry weight of the sample, in g.
RM = (Mw − Md)⁄Mw × 100%,
AM = (Mw − Md)⁄Md × 100%,
The design of the gas analysis was as follows. The open-exposure chambers with prepared samples of wood (three chambers with the same fungi species, one sample per chamber) with an average RM/AM equal to 40/65% were initially put in a thermostat for 2 h to reach the required temperature (+10 °C at the first stage). Then, the chambers were sealed and the initial CO2 and O2 concentrations were measured inside the chambers. The chambers were consequently exposed in the thermostat under the same temperature (+10 °C) for about 3 h. In due time of the exposition, the concentration of gases in the chambers decreased (O2); otherwise, it increased (CO2) by 1 to 2 volumetric percent, which enabled it to avoid the negative effects of hypoxia and hypercapnia within the gas exchange. At the end of the exposition period, the concentrations of CO2 and O2 in the chambers were measured again. After that, the chambers were opened, and the samples were removed, weighed, and, if necessary, moistened with distilled water to the initial weight, placed in the same chambers, and the above-described cycle was consequently repeated at 20, 30, and 40 °C. Similar exposure cycles and measurement procedures were performed for the same wood samples under RM/AM equal to 70/245%, as appropriate. The first moisture level corresponded to an average (42%) and the second level corresponded to the highest (68%) RM of WD of in the pre-forest and steppe mixed pine and birch forests [15].
The concentrations of O2 and CO2 were measured in volumetric percent (φ) with the use of CO2/O2 infrared electrochemical gas analyzer with built-in automated flow-type sampling controller and data processor (Micro-sensor Technique Ltd., Russian Federation, precision ± 0.2%). Carbon-to-oxygen gas exchange was estimated based on O2 and CO2 concentration differences in the chambers at the beginning and the end of the exposition period, with an account of the sample volumes (Equation (3)) and the duration of the exposition (Equation (4)):
where φv—CO2/O2 volumetric percent is calculated with a count of the sample volume; V1 is the volume of the exposure chamber (0.3 l); V2 is the sample volume, in L; and φreg is experimental chamber measurements of volumetric percent of CO2 emitted / O2 consumed.
where φvt—CO2/O2 is the volumetric percent calculated with a count of the sample volume and exposition period; φv (see Equation (3)); and Texp is the time of exposure, in min.
φv = (V1 − V2)⁄V1 × φreg,
φvt = φv⁄Texp × 60 min,
The estimates of gas exchange for WD are presented in Table A1. They were used for the analysis of the correlation between CO2 emission and O2 uptake, and the ratio of volumes of CO2 emitted and O2 consumed (CO2 to O2 ratio). The CO2 emission activity for woody debris was calculated with the use of Equation (5):
where ECO2 is emission activity, μg C-CO2 g dry wood mass−1 per hour (μg C-CO2 g−1 h−1); ∆CO2 is the CO2-specific emission from the sample within the exposition period, in ppm/h; V1 is the volume of the exposure chamber (0.3 l); V2 is the sample volume, in L; Vm is the molar volume (22.4 L/mol); M1 is the molar mass of CO2 (44 g / mol); M2 is the dry mass of the wood sample, in g; and T is the air temperature (K).
ECO2 = ∆CO2 × (V1 − V2)⁄Vm × M1⁄M2 × 0.27 × 273/T,
Similarly, the intensity of oxygen uptake was calculated by Equation (6):
where EO2 is the intensity of oxygen uptake, μg O2 g dry mass−1 of wood per hour (μg O2 g−1 h−1); ∆O2 is the O2-specific uptake by the sample within the exposition period, in ppm/h; V1 is the volume of the exposure chamber (0.3 l); V2 is the sample volume, in L; Vm is the molar volume (22.4 L/mol); M1 is the molar mass of O2 (32 g/mol); M2 is the dry mass of the wood sample, in g; and T is the air temperature (K).
EO2 = ∆O2 × (V1 − V2)⁄Vm × M1⁄M2 × 273/T,
Statistical treatment of the results was performed with the use of Statistica 8.0 software (Stat Soft Inc., Tulsa, OK, USA). Arithmetic means (m) are provided with standard error (SE). The comparison of average values and assessment of significance of environmental factors was performed with the use of the one-way ANOVA test. The significance of the relationship between the variables was estimated with the Pearson correlation factor (r) at the confidence level of (p) < 0.05.
3. Results
3.1. Relationship between the CO2 Emission and O2 Uptake in Gas Exchange of WD
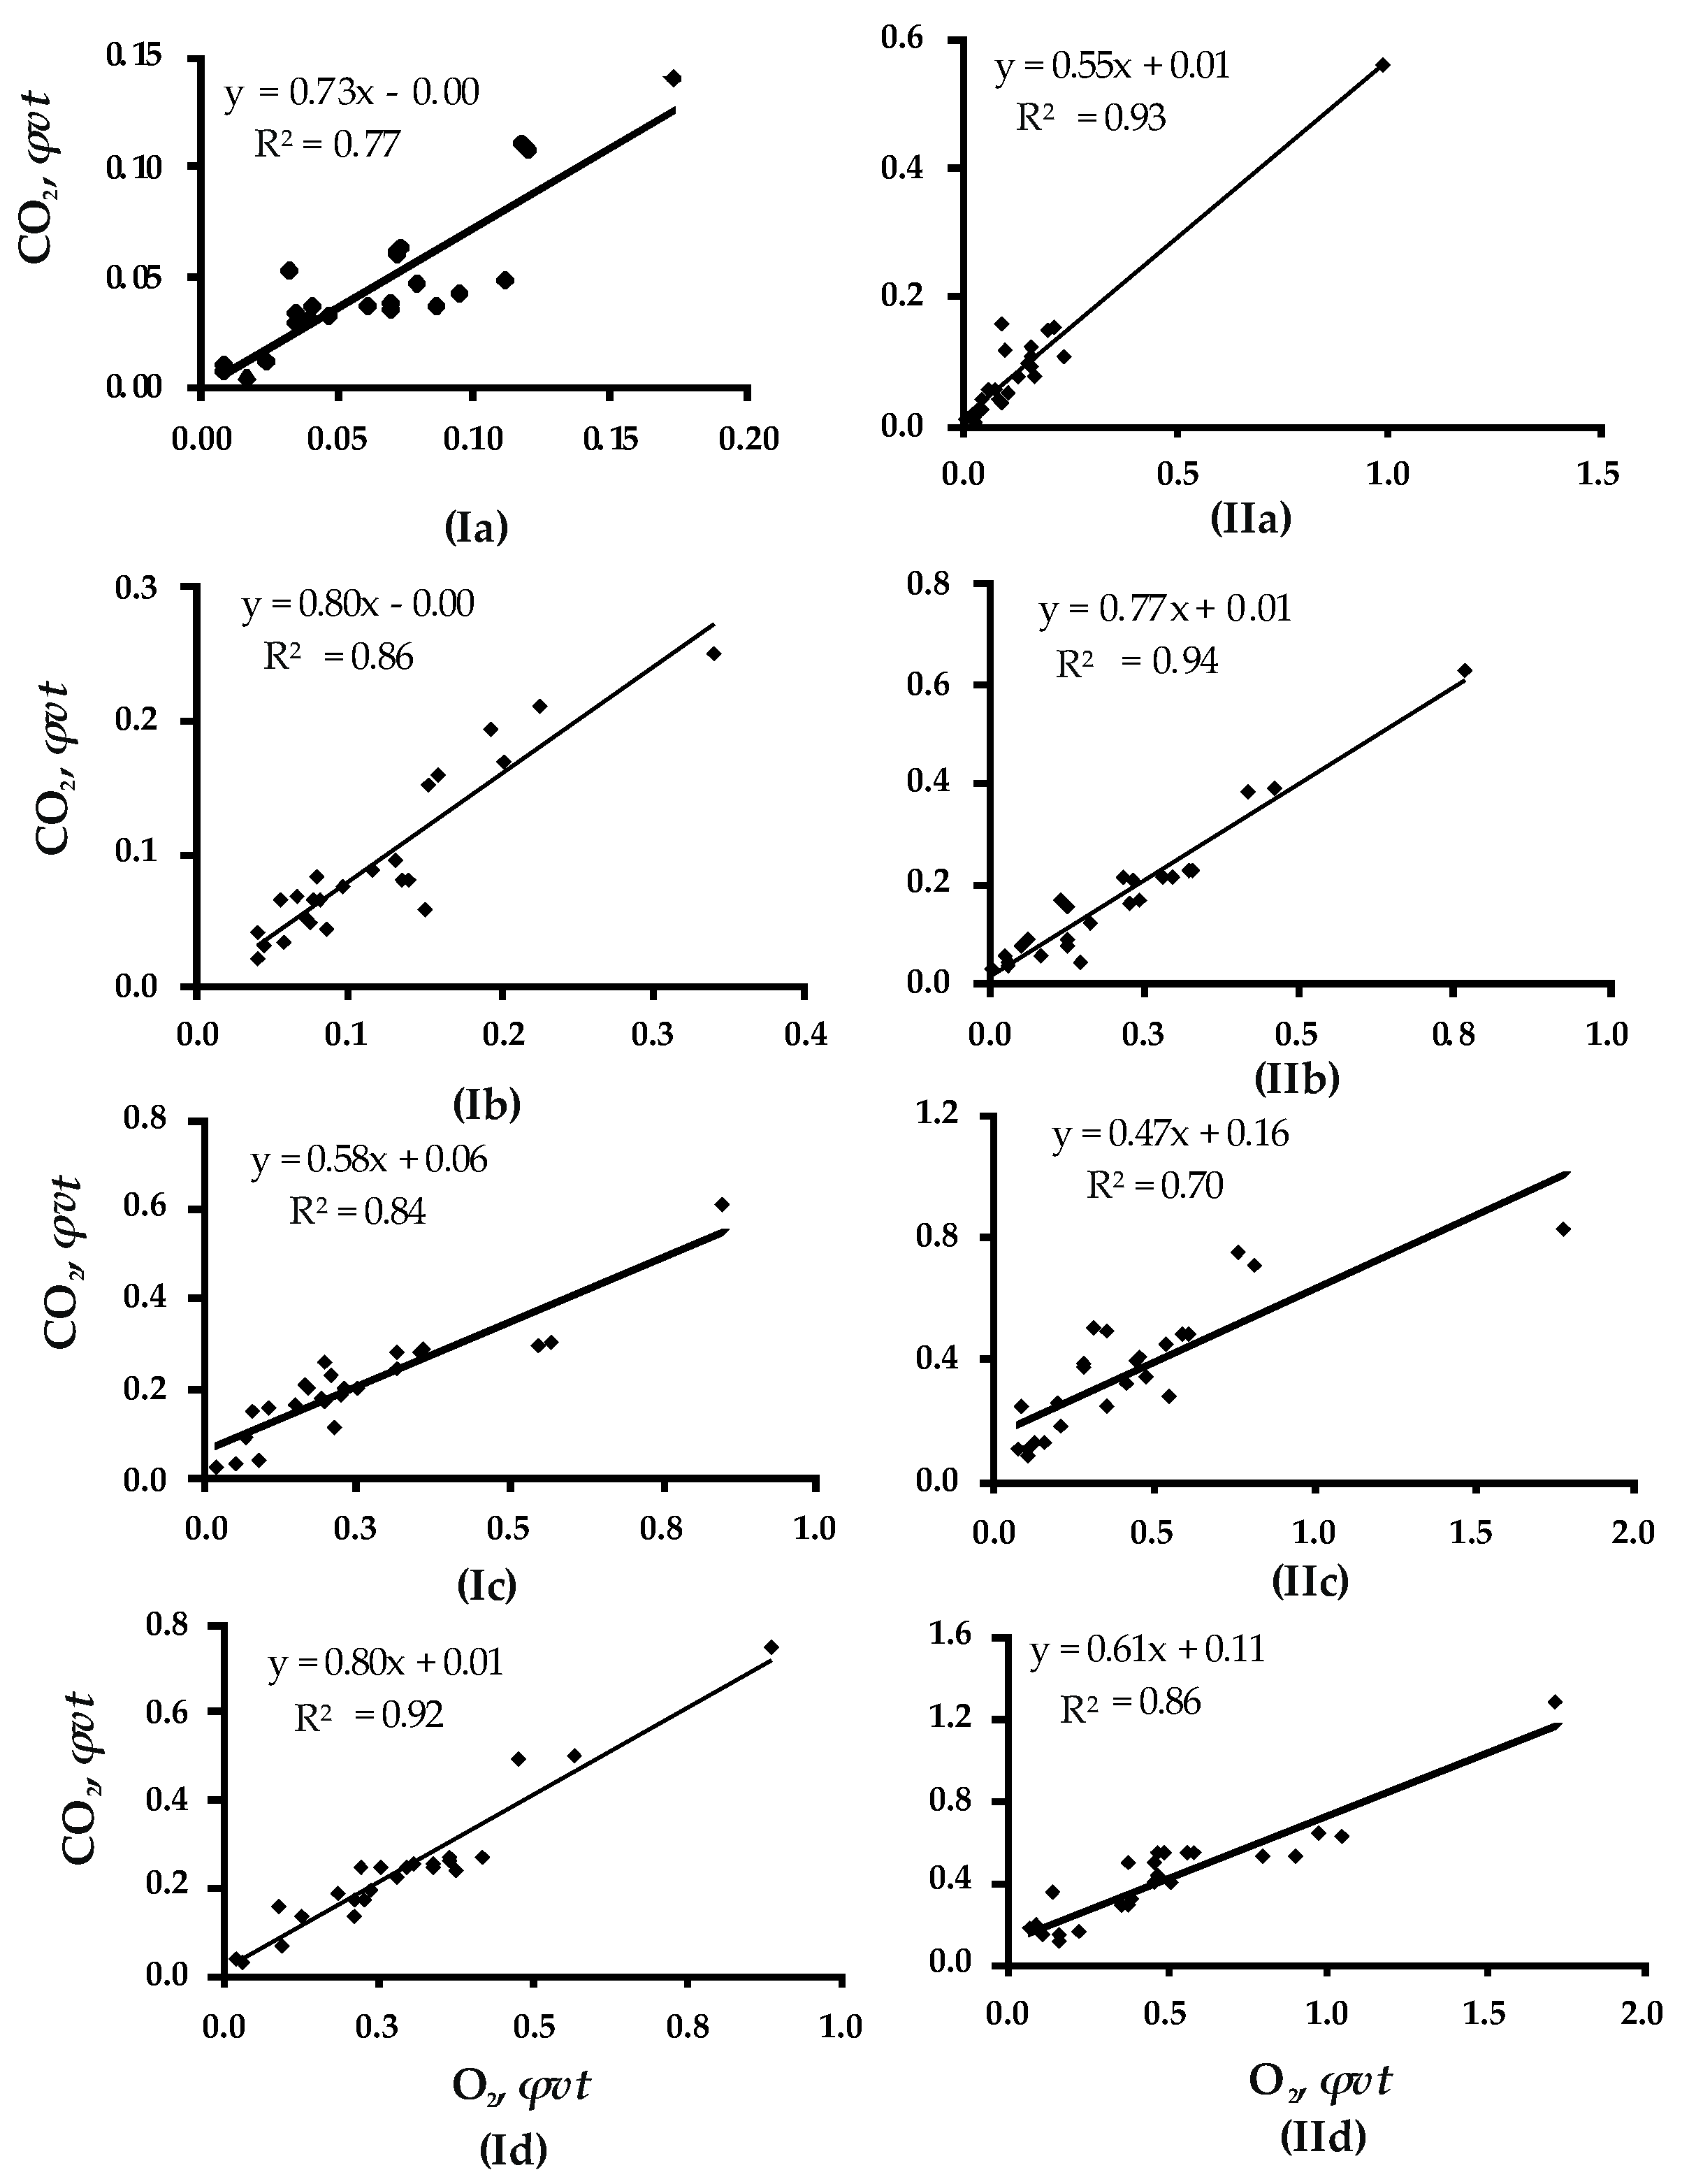
In gas exchange of WD, O2 and CO2 fluxes were positively correlated (r = 0.83–0.97) and not temperature dependent. Thus, the correlation between O2 consumed and CO2 released was 0.88 for wood RM 40% and temperature +10 °C; it was 0.93 for the temperature of 20 °C, 0.91 for 30 °C, and 0.96 for 40 °C. For wood RM 70%, the same pattern was observed: The correlation was 0.96 for the temperature +10 °C and it was 0.97 for +20 °C, 0.84 for +30 °C, and 0.93 for +40 °C (Figure 1).
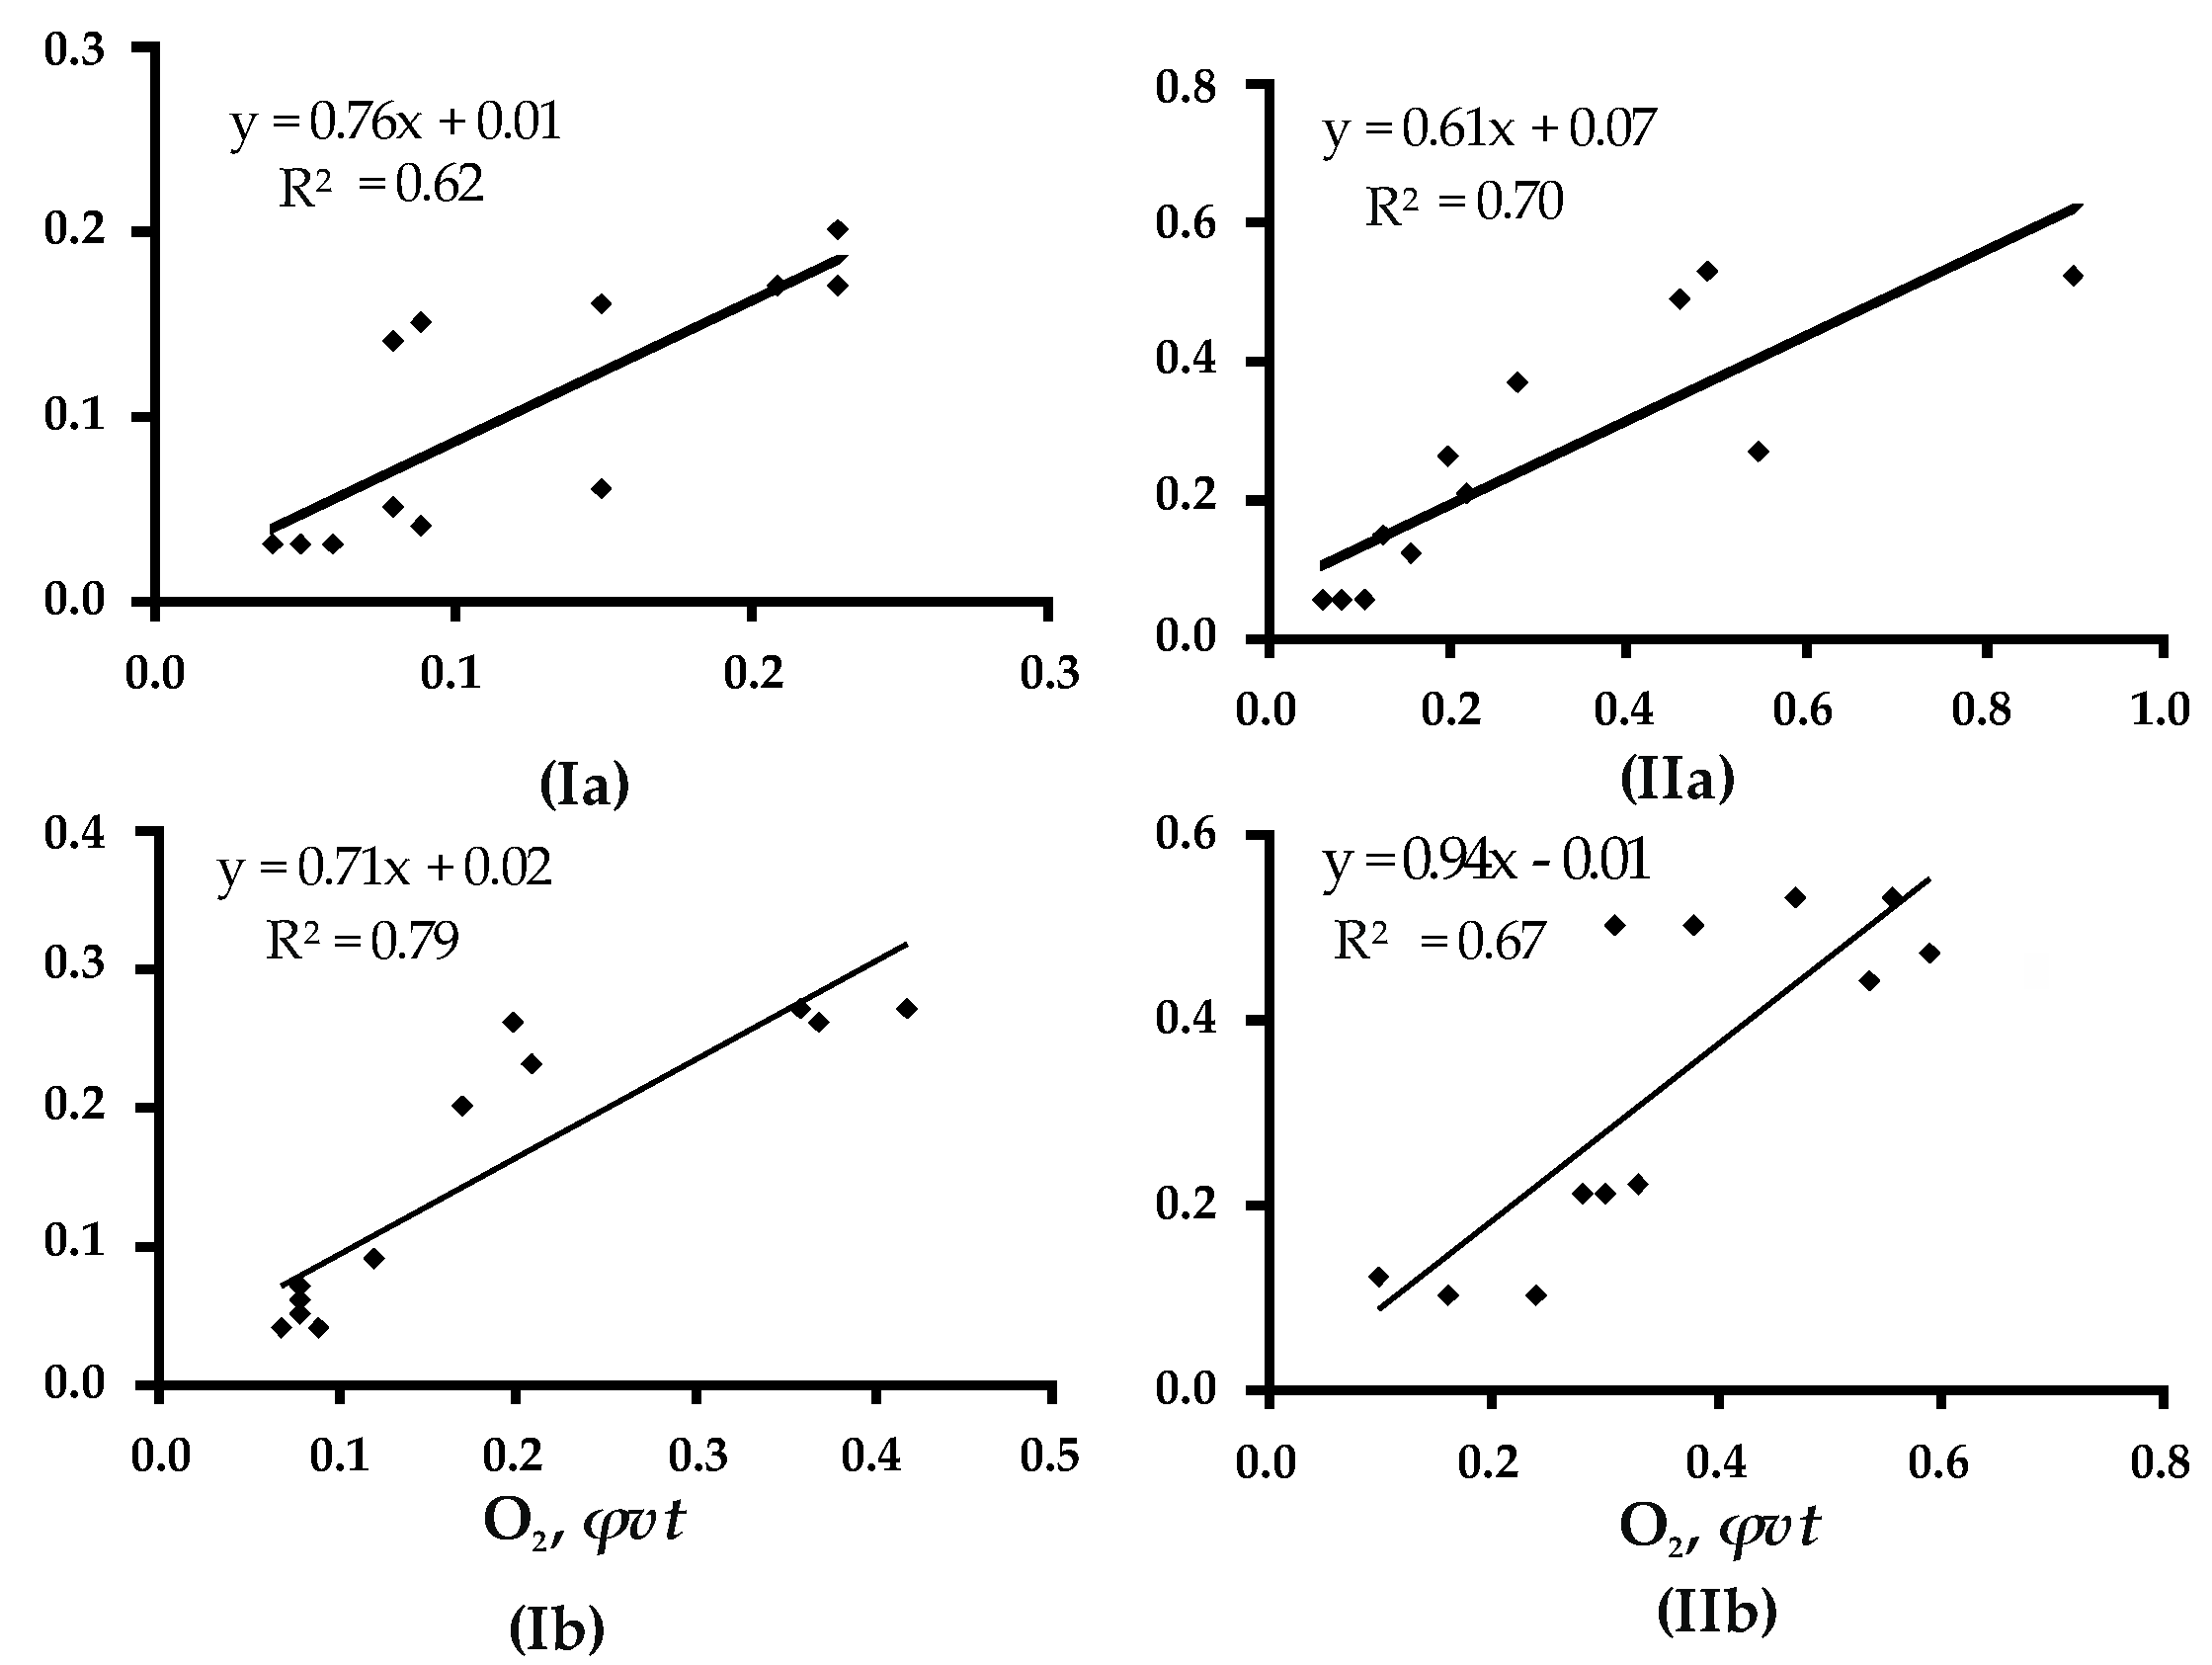
The degree of contingency between the volume of O2 consumed and CO2 emitted did not depend on wood moisture. This was confirmed by the close correlation factors derived for O2 and CO2 fluxes under similar temperatures but different RMs (40% and 70%): They were 0.88 and 0.96 for +10 °C, 0.93 and 0.97 for +20 °C, 0.91 and 0.84 for +30 °C, and 0.96 and 0.93 for +40 °C, correspondingly (Figure 1). A similar positive correlation was found for CO2 and O2 fluxes and gas exchange in wood affected by white (Fomes fomentarius) and brown (Fomitopsis betulina) rot: The values of the factors were 0.79–0.85 and 0.84–0.82 for wood with RM 40% and 70%, correspondingly (Figure A1).
3.2. Carbon-to-Oxygen Balance in WD Gas Exchange
The CO2-to-O2 ratio (CO2:O2) for gas exchange of WD decomposed by wood decay fungi varied from 0.4 to 2.1, but in the majority of cases (80%) it did not exceed 1.0. The highest values (1.4–2.1) were sporadically observed under the RM of 70% and the temperature of 20–40 °C (Table 1). The factor analysis showed no significant relationship between the CO2-to-O2 ratio and the wood decay fungi species F(7,128) = 1.8659, p = 0.08. In a view that this group included both white and brown rot fungi, this indicated the lack of a relationship between the CO2-to-O2 ratio and the WD rot type. Indeed, the CO2-to-O2 ratio for gas exchange of wood samples with white (F. fomentarius) and brown (F. betulina) rot displayed no difference for any of four temperatures under 70% wood RM. Significant differences were noted for a sole case of temperature equal to +20 °C and 40% RM of wood: F(1,4) = 9.8968, p = 0.03 (Table 1).
In some cases, the relationship between the CO2-to-O2 ratio and the moisture of woody debris was identified. For instance, the CO2-to-O2 ratio was significant for gas exchange in wood decomposed by F. fomentarius under the temperature of +20 °C and wood RM of 70% (F(1,4) = 8.1574, p = 0.04), and it was higher than for the RM of 40%. The opposite relationship was found for wood decomposed by T. versicolor: Under the temperature of +10 °C, the CO2-to-O2 ratio was significantly higher for wood with RM 40%: F(1,4) = 12.880, p = 0.02 (Table 1). However, in general, the ratio did not demonstrate any significant relationship either with moisture or with temperature for the four temperature levels (Table 2).
3.3. Gas Exchange Intensity of WD
The CO2-emission intensity of WD varied in a wide range, from 4.1 to 188 C-CO2 μg g−1 h−1, and it was found to be relevant to three driving factors (Table 3). The first driving factor comprised the wood decay fungi species, whose activity resulted in different emission intensity from birch wood under the similar temperature and moisture levels. Thus, under the temperature +20 °C and RM of 40%, the intensity varied from 12.6 to 53 C-CO2 μg g−1 h−1, with regard to a particular fungi species. However, it increased to 17.8 to 111.4 C-CO2 μg g−1 h−1 with the rise of RM to 70%. The differences in emission intensity were quite stable for a particular fungi species. Based on exchange intensity under the temperature +20 °C and the RM of 40%, the woody samples could be subdivided into two groups. The first group included the samples of wood decomposed by D. tricolor, F. betulina, F. fomentarius, and T. pubescens, whose wood decay activity resulted in emission intensity up to 20 C-CO2 μg g−1 h−1. The second group included H. rutilans, S. ochraceum, S. hirsutum, and T. versicolor, which caused the intensity above 20 C-CO2 μg g−1 h−1. The same two groups were distinguished at the temperatures +10 °C and +30 °C, with small differences (Table 3). The ANOVA analysis confirmed a significant relationship between fungi species and emission intensity in WD both for 40% and 70% of wood RM: F(7,88) = 6.8706, p = 0.001 and F(7,88) = 5.0721, p = 0.001, correspondingly.
Temperature is the second driver that showed a high and positive correlation with the gas exchange rate WD (Table A2). The reaction to change in temperature depended on the species of fungi. For example, with an increase from +10 to + 20 °C, depending on the species, the intensity emission of CO2 increased by 1.3–4.0 times for 40% RM and by 1.6–4.5 times for 70% RM (Table 3). On average, for all eight species of fungi, an increase in temperature from +10 to +20 °C caused an increase in WD gas exchange by 2.0 times, and from +20 to +30 °C by 2.1 times at 40% and 70% RM. However, the shift from +30 to +40 °C did not cause the significant enhancement of emission CO2 (Table 4).
Wood moisture is the third factor that had a strong and positive effect on the CO2 emission activity (Table 3), but it depended on the species of fungi, as in the case of temperature. The increase in RM from 40% to 70% resulted in a 2.2-times increase of gas exchange for WD affected by D. tricolor, F. fomentarius, F. betulina, T. pubescens, and T. versicolor. Meanwhile, for the other wood decay fungi (H. rutilans, S. hirsutum, S. ochraceum), no changes in emission intensity were observed (Table A3). Nevertheless, as follows from Table 4, the increase in RM of wood from 40% to 70% (1.8-fold) was followed by appropriate enhancement of CO2 emission intensity (ca. 1.8-fold) for all four temperatures. The one-way ANOVA test confirmed a significant relationship between gas exchange and moisture of WD.
In the case of a unidirectional change in temperature and humidity, their joint effect on WD gas exchange was equal to the sum of the effects of each separately. Thus, an increase in the temperature from +10 to +20 °C and in the RM of wood from 40% to 70% provided for a 3.4-times enhancement of CO2 emission: from 13.5 to 45.5 C-CO2 μg g−1 h−1. This corresponded to the sum of temperature and moisture effects that strengthened the average gas exchange intensity, compared to 1.7- and 2.0-fold enforcements provided by each driver separately (Table 4). For multidirectional and quantitatively different changes in moisture and temperature, their combined effect will be the difference between the effects of each particular driver. Thus, when the temperature dropped from +30 to +10 °C, the emission became 4.1 times lower, but the decrease was partially offset by 1.7-fold increase in RM from 40% to 70%. With this, the resulting decrease was 2.3 times only: from 54.3 to 23.3 C-CO2 μg g−1 h−1 (Table 4). Due to different directions, the changes in moisture and temperature could compensate each other’s effects on gas exchange of WD. For instance, emission intensity dropped from 26.4 to 13.5 C-CO2 μg g−1 h−1 with the decrease in temperature from +20 to +10 °C, but it increased from 13.5 to 23.3 C-CO2 μg g−1 h−1 with RM rising from 40% to 70%. As a result, the final gas exchange remained at the same level (Table 4).
3.4. Oxygen Gas Exchange Activity of WD
The oxygen gas exchange of woody debris is also closely related to temperature and moisture. Within the range of +10 to +30 °C, an increase in temperature by 10 °C provided for a 1.9-fold enhancement in oxygen uptake under the RM of 40%, and for 1.5–1.9 times under the RM of 70%. The highest oxygen uptake was observed for the temperatures of 30–40 °C, the same as for the highest CO2 emission. The increase in RM of wood from 40% to 70% (1.8 times) provided for an appropriate 1.8-fold increase in oxygen uptake for all four temperature levels. The cumulative effect of temperature and moisture was also clearly displayed, and it resulted in enhancement or weakening of oxygen gas exchange, with regard to direction of temperature and moisture trends (Table 5).
3.5. Gas Exchange of Basidiocarps of Wood Decay Fungi
The fluxes of O2 consumed and CO2 released were closely and positively mutually related in the respiratory gas exchange of basidiocarps of brown (F. betulina) and white (D. tricolor) rot fungi (r = 0.98 and 0.99, correspondingly). They showed similar regularities in terms of CO2 and O2 volumetric ratio that was independent from temperature, being 0.8–0.9 under the range +10 to +40 °C, the same as for gas exchange of WD (Table 6). The CO2 emission intensity of D. tricolor basidiocarps, on average, was lower (451.8 ± 51.5 μg g−1 h−1) than for F. betulina (991.6 ± 114.5 μg g−1 h−1), F(1,22) = 18,466, p = 0.0003. However, in both cases it was manifold higher than for WD that they decomposed (Table 3). The same as for wood. Emission intensity of basidiocarps was closely and positively related to temperature (r = 0.66–0.77): The rise of temperature by 10 °C, in the range +10 to +30 °C, increased their emission intensity by 1.5–2.3 times. The highest respiration activity of basidiocarps occurred the same as for WD temperature +30 °C, while at +40 °C, the gas exchange dropped by 25%–30% (Table 6), which was different from the exchange of WD that had the highest activity under 30–40 °C (see Table 4).
4. Discussion
Temperature and humidity are climatic factors that affect the quantitative and qualitative parameters of gas exchange in WD. In particular, as noted above, high moisture content of wood and high temperature promote anaerobic conditions [1,4,20] Thus, in WD gas exchange, both aerobic and anaerobic CO2 are represented. Therefore, our tasks included assessment of the relationship between CO2 and O2 gas exchange and carbon and oxygen balance in WD. The results showed that CO2 emission and O2 uptake are physiologically entwined, and their relationship did not change within the range of temperatures from +10 to +40 °C and the range of RM from 40% to 70%. Therefore, the gas exchange in WD decomposed by xylotrophic Basidiomycetes was aerobic within the entire range of temperatures and moisture typical for temperate climate zone.
It was confirmed by carbon-to-oxygen balance that the average CO2-to-O2 ratio was equal to 0.9, being nearly the same as the data by Solovyov [25], who reported a 1:1 CO2- to-O2 ratio for wood decomposed by xylotrophic Basidiomycetes. In case the oxygen is readily available, the CO2-to-O2 ratio mainly depends on molecular entities decomposed in the respiration, being equal to 1.0 for carbohydrates, 0.8 for proteins and 0.7 for fats [43]. The CO2-to-O2 ratio obtained in our research was within the range specific for aerobic respiration process. The presence of an anaerobic component in the gas exchange was limited, and it can be probably identified for a few cases, when the CO2-to-O2 ratio was 1.4–2.1, which is notably beyond the physiological normal for an aerobic process. These occurrences were rarely observed for gas exchange under the RM of 70% and temperature from +20 to +40 °C. These were specific conditions that depressed diffusion of gases (moisture) and enhanced respiration intensity (temperature). Consequently, the presence of anaerobic CO2 in the gas exchange of WD is more an exception, and its quantity is minor. As we showed earlier [35], occasionally and in small amounts in the gas exchange of WD decomposed by Basidiomycetes fungi CH4, a product of strictly anaerobic processes can be present.
The CO2-to-O2 ratio illustrates the type and balance of gas exchange and the output of CO2 relative to the scale of O2 uptake, i.e., the conversion of organic carbon into carbon dioxide efficiency. The average value of the ratio (0.9) indicates a high efficiency of conversion: With each unit of oxygen uptaken, 0.9 unit of CO2 is formed and released. It means that CO2 to O2 fluxes for WD decomposed by xylotrophic Basidiomycetes are closely entwined, and they are of the corresponding scale. In our view, decomposition of WD is seen as biological combustion being accompanied with O2 uptake and CO2 release, similar to the physical and chemical combustion. So far as the biological combustion entails billions of tonnes of WD, this process becomes a globally significant CO2 source and a similar scale of O2 consumer. Thus, it is necessary to reconcile the contribution WD and its decay agents make to carbon-and-oxygen gas exchange of forest ecosystems and the entire control of the composition of the atmosphere.
According to Solovyov, for xylotrophic Basidiomycetes that decompose wood, the ratio of CO2 emission to O2 uptake is irrelevant to temperature, fungus species, and its physiological type (white/brown rot fungi) [25]. Our results also showed the lack of correlation between the balance of carbon–oxygen gas exchange, the efficiency of oxidation conversion, and the species’ physiological type of wood decay fungi. Another conclusion made by Solovyov relates to the lack of a relationship of CO2-to-O2 ratio and temperature. It was made based on gas exchange analysis under +17 and +27 °C temperature levels [25]. Our data confirmed that the ratio between CO2 release and O2 uptake did not show any relevance to the temperature range from +10 and +40 °C, which is typical for the moderate latitudes. We did not see any relevance to wood moisture in the range of RM 40% to 70%. In other words, the carbon-to-oxygen balance of WD and the efficiency of their oxidation conversion are relatively stable environmental and physiological parameters that have no link to wood decay fungi species or moisture and temperature ranges, common for temperate latitudes.
Unlike carbon-and-oxygen balance and oxidation conversion efficiency, the gas exchange intensity of woody debris was closely related to climate. Both CO2 emission activity and the intensity of oxygen uptake were the processes, highly sensitive to temperature variability. The average Q10 value under the +10 to +30 °C temperature range was appropriately equal to 2.0 for carbon and 1.8 for oxygen gas exchange. The moisture of wood did not affect temperature sensitivity of gas exchange. The latter indicates the independent nature of temperature as a driver of CO2-and-O2 gas exchange activity in WD. The literature data [4,7,9,10,12,30] report on the significant variability of Q10 parameter from 1.37–3.99 [4] to 4.06 [10]. Our estimates fit well in this range.
In WD, the temperature is the driver that controls and also limits the intensity of CO2- and-O2 gas exchange. Their activity was highest at +30 and +40 °C. Chen et al. consider these temperatures optimum for gas exchange [4]. However, they are equivalent to heat shock for the boreal inhabitants, whose life mostly occurs under +15 °C [1]. In our view, the temperature maximum should not be treated as the highest acceptable, rather than the optimum, for CO2-and-O2 gas exchange for WD. With regard to moisture of Betula wood, it is equal to 60–110 C-CO2 μg g−1 h−1, being 3–5-fold higher than the actual summer temperatures (+10–+20 °C) and moisture (RM 40%) of Mid-Urals pine and birch forests. Therefore, climate warming may result in the highest 3-fold enhancement of CO2 emission intensity of WD under the current moisture level. However, if the moisture rises, the emission enhancement may be 5 times greater than the highest. The scale of O2 will increase accordingly.
The gas exchange intensity of WD is closely and positively related to its moisture. Our data showed that the RM changes within the 40–70%-range caused a 1.8-fold corresponding and directly related change in the level of CO2 intensity and O2 uptake. The result was equally pronounced at +10, +20, +30, and +40 °C. It confirms that the moisture is the environmental driver of gas exchange that is independent of temperature.
The temperature and moisture are independent but interacting drivers. Their strong interactions are noted in the moisture range of 91–320% [10] and 10–160% [44] under both low and high temperatures [5]. Our results showed that the outcome of their interaction depends on the direction of the changes. If the direction is similar, the overall effect on carbon-and-oxygen gas exchange is summarizing. In case of different directions, there is a difference of particular effects. For oppositely directed temperature and moisture trends, the joint effect can stabilize gas exchange intensity when the influence of one driver is fully or partially compensated by the other. We believe that this phenomenon can play a very important role in the control of carbon-and-oxygen exchange intensity in WD. The precipitation is the major source of moistening of wood residues, and it displays an opposite multi-year trend in relation to temperature change, for example, in the Southern Urals [45]. Being highly important for the carbon cycle of forest ecosystems, this phenomenon requires a detailed investigation, especially since there is also some evidence that temperature and moisture trends have no effect on intensity of WD gas exchange [4].
The moisture and temperature are undoubtedly the most important environmental drivers of O2 and CO2 exchange of woody debris. However, they are just the controllers of its intensity. The wood decay Basidiomycetes are the basic condition and the impact factors that enable physiological process of gas exchange. This is confirmed by proximity (identity) of exchange parameters identified for WD decomposed by Basidiomycetes and their basidiocarps. The latter represent multifunctional biostructures with intensive respiration [46], available for direct measurement, when superposition of effects from other microorganisms can be effectively avoided. The common features of gas exchange of basidiocarps and WD include strong temperature dependence (Q10 = 1.9), the highest emission intensity under similar temperature levels (+30 °C), positive physiology-level correlation between O2 and CO2 fluxes (r = 0.98–0.99), similar ratio of their scales (0.8–0.9), and independence from temperature, species, and physiological type of wood decay fungi. Solovyov also noted an identical O2-and-CO2 volumetric ratio for gas exchange of wood decomposed by xylotrophic Basidiomycetes and their basidiocarps [25].
The close relationship of gas exchange intensity with species of wood decay Basidiomycetes is a confirmation of the role of these fungi as the main prerequisite and the biotic factor of gas exchange in WD. This may be due to both the specific features of the rate of gas exchange of the mycelium and its different biomass in wood. In our opinion, under any environmental conditions, the qualitative and quantitative parameters of O2 and CO2 gas exchange WD primarily depend on composition of Basidiomycetes fungi, whose physiological activity is determined by temperature and moisture. The qualitative and quantitative parameters of O2 and CO2 exchange primarily depend on the composition of xylotrophic Basidiomycetes, whose physiological activity is determined by temperature and moisture. The relationship between the composition of these fungi and the intensity of decomposition and gas exchange of woody debris has been noted by many authors [21,22,23,24,33,47].
5. Conclusions
The gas exchange of WD under the range of temperatures and moisture parameters, typical for temperate latitudes, is of an aerobic nature. It includes two physiologically entwined and closely or equally scaled processes: CO2 emission and O2 uptake. This makes the WD not only the globally significant source of CO2, but also an appropriate scale consumer of O2. The carbon-to-oxygen balance and the efficiency of organic carbon oxidation into carbon dioxide are climate-independent features of WD gas exchange. The intensity of exchange is driven by moisture and temperature and is closely related to climatic factors. The combined effect of moisture and temperature on gas exchange intensity can be displayed in its enhancing: weakening, otherwise stabilizing. The respiration of wood decay Basidiomycetes represents the physiological means of CO2 and O2 gas exchange in WD and, in view of the importance of WD as a CO2 source and O2 consumer, they should be treated as gas-controlling organisms of biospheric significance.
Author Contributions
Conceptualization, V.A.M.; methodology, V.A.M. and D.K.D.; validation, V.A.M., M.L.G. and D.G.Z.; formal analysis, D.K.D. and V.A.M.; investigation, D.K.D. and V.A.M.; resources, V.A.M. and D.K.D.; writing—original draft preparation, V.A.M. and D.K.D.; translation into English, M.L.G.; writing—review and editing V.A.M., M.L.G. and D.K.D.; visualization D.K.D. All authors have read and agreed to the published version of the manuscript.
Funding
The research was funded by RFBR, Government of the Sverdlovsk region, project number 20-44-660012, by State Assignment of Institute of Plant and Animal Ecology UB RAS (№ AAAA-A19-119031890084-6), by Program for Improving the Competitiveness of the Ural Federal University (the decree no. 211 of the Government of the Russian Federation, contract No. 02.A03.21.0006).
Data Availability Statement
Data are contained within the article.
Acknowledgments
We thank two anonymous reviewers for their valuable comments and suggestions, which helped to improve this paper.
Conflicts of Interest
The authors declare no conflict of interest.
Appendix A
Figure A1.
The relationship between O2-and-CO2 gas exchange fluxes from WD of Betula with (a) white (Fomes fomentarius) and (b) brown (Fomitopsis betulina) rot and the RM of 40% (I) and 70% (II); R2, coefficient of determination.
Figure A1.
The relationship between O2-and-CO2 gas exchange fluxes from WD of Betula with (a) white (Fomes fomentarius) and (b) brown (Fomitopsis betulina) rot and the RM of 40% (I) and 70% (II); R2, coefficient of determination.


Table A1.
The carbon-and-oxygen gas exchange of Betula WD decomposed by xylotrophic Basidiomycetes.
| Fungi Species, Dry Mass (g)/Volume of the Samples (l) | Moisture 40/65 per Cent | Moisture 70/245 per Cent | ||||||
|---|---|---|---|---|---|---|---|---|
| Temperature, °C | Temperature, °C | |||||||
| 10 | 20 | 30 | 40 | 10 | 20 | 30 | 40 | |
| Daedaleopsis tricolor, 5.7/0.02 | 0.05/0.11 | 0.08/0.08 | 0.24/0.32 | 0.25/0.34 | 0.07/0.13 | 0.16/0.23 | 0.39/0.45 | 0.39/0.46 |
| D. tricolor, 5.0/0.02 | 0.03/0.07 | 0.06/0.06 | 0.20/0.17 | 0.24/0.34 | 0.09/0.15 | 0.22/0.32 | 0.48/0.61 | 0.53/0.81 |
| D. tricolor, 4.7/0.02 | 0.03/0.03 | 0.05/0.07 | 0.18/0.20 | 0.25/0.31 | 0.09/0.16 | 0.16/0.24 | 0.38/0.28 | 0.39/0.51 |
| Fomes fomentarius, 5.1/0.03 | 0.04/0.09 | 0.03/0.06 | 0.20/0.23 | 0.17/0.21 | 0.05/0.06 | 0.12/0.16 | 0.37/0.28 | 0.53/0.49 |
| F. fomentarius, 6.1/0.05 | 0.03/0.05 | 0.06/0.15 | 0.16/0.15 | 0.17/0.23 | 0.05/0.11 | 0.21/0.22 | 0.27/0.55 | 0.52/0.90 |
| F. fomentarius, 5.0/0.04 | 0.03/0.04 | 0.05/0.08 | 0.14/0.08 | 0.15/0.09 | 0.05/0.08 | 0.15/0.13 | 0.26/0.20 | 0.49/0.46 |
| Fomitopsis betulina, 8.0/0.03 | 0.05/0.08 | 0.06/0.08 | 0.20/0.17 | 0.26/0.37 | 0.12/0.10 | 0.22/0.33 | 0.50/0.31 | 0.53/0.47 |
| F. betulina, 7.7/0.02 | 0.04/0.09 | 0.09/0.12 | 0.26/0.20 | 0.27/0.42 | 0.10/0.24 | 0.21/0.28 | 0.44/0.54 | 0.50/0.38 |
| F. betulina, 7.6/0.02 | 0.04/0.07 | 0.07/0.08 | 0.23/0.21 | 0.27/0.36 | 0.10/0.16 | 0.21/0.30 | 0.47/0.59 | 0.53/0.56 |
| Hapalopilus rutilans, 3.6/0.02 | 0.04/0.06 | 0.09/0.13 | 0.20/0.25 | 0.24/0.25 | 0.04/0.08 | 0.21/0.24 | 0.49/0.36 | 0.54/0.59 |
| H. rutilans, 2.8/0.02 | 0.01/0.02 | 0.07/0.07 | 0.09/0.07 | 0.13/0.13 | 0.01/0.03 | 0.04/0.15 | 0.10/0.08 | 0.10/0.16 |
| H. rutilans, 3.0/0.02 | 0.05/0.03 | 0.08/0.10 | 0.11/0.22 | 0.14/0.21 | 0.04/0.09 | 0.06/0.08 | 0.12/0.16 | 0.15/0.23 |
| Steccherinum ochraceum, 3.3/0.02 | 0.03/0.03 | 0.08/0.14 | 0.17/0.20 | 0.19/0.24 | 0.02/0.04 | 0.07/0.13 | 0.18/0.21 | 0.15/0.16 |
| S. ochraceum, 3.5/0.02 | 0.04/0.04 | 0.08/0.14 | 0.18/0.23 | 0.22/0.28 | 0.04/0.04 | 0.08/0.13 | 0.24/0.09 | 0.35/0.14 |
| S. ochraceum, 3.2/0.02 | 0.03/0.05 | 0.04/0.09 | 0.16/0.11 | 0.19/0.18 | 0.05/0.08 | 0.09/0.07 | 0.24/0.35 | 0.31/0.39 |
| Stereum hirsutum, 7.3/0.02 | 0.06/0.07 | 0.16/0.16 | 0.28/0.32 | 0.24/0.22 | 0.16/0.09 | 0.08/0.06 | 0.31/0.42 | 0.28/0.38 |
| S. hirsutum, 8.5/0.02 | 0.06/0.07 | 0.15/0.15 | 0.28/0.36 | 0.25/0.30 | 0.07/0.17 | 0.05/0.03 | 0.34/0.48 | 0.28/0.36 |
| S. hirsutum, 8.4/0.02 | 0.06/0.07 | 0.17/0.20 | 0.28/0.36 | 0.24/0.38 | 0.12/0.16 | 0.16/0.12 | 0.40/0.46 | 0.43/0.47 |
| Trametes pubescens, 2.7/0.02 | 0.01/0.01 | 0.03/0.05 | 0.03/0.09 | 0.06/0.09 | 0.01/0.03 | 0.03/0.03 | 0.10/0.11 | 0.17/0.07 |
| T. pubescens, 2.2/0.02 | 0.01/0.01 | 0.02/0.04 | 0.02/0.02 | 0.03/0.03 | 0.01/0.01 | 0.03/0.01 | 0.08/0.10 | 0.14/0.11 |
| T. pubescens, 3.0/0.02 | 0.01/0.02 | 0.04/0.04 | 0.03/0.05 | 0.04/0.02 | 0.01/0.01 | 0.04/0.03 | 0.12/0.13 | 0.19/0.09 |
| Trametes versicolor, 5.7/0.03 | 0.11/0.12 | 0.19/0.20 | 0.30/0.55 | 0.49/0.48 | 0.15/0.20 | 0.39/0.46 | 0.71/0.82 | 0.63/0.98 |
| T. versicolor, 5.5/0.03 | 0.11/0.12 | 0.21/0.23 | 0.30/0.57 | 0.50/0.57 | 0.15/0.22 | 0.38/0.42 | 0.75/0.76 | 0.62/1.04 |
| T. versicolor, 7.0/0.03 | 0.14/0.17 | 0.25/0.34 | 0.60/0.85 | 0.75/0.89 | 0.56/0.99 | 0.62/0.77 | 0.82/1.78 | 1.28/1.72 |
CO2 is in the numerator and O2 is in the denominator, % l−1 h−1.
Table A2.
The correlation of CO2 emission of Betula WD decomposed by xylotrophic Basidiomycetes with temperature in the range from +10 to +30 °C at two levels of wood moisture.
Table A2.
The correlation of CO2 emission of Betula WD decomposed by xylotrophic Basidiomycetes with temperature in the range from +10 to +30 °C at two levels of wood moisture.
| Fungi Species | Moisture 40/65 Per Sent | Moisture 70/245 per Cent | ||
|---|---|---|---|---|
| r | p | r | p | |
| Daedaleopsis tricolor | 0.93 | 0.000 | 0.94 | 0.000 |
| Fomes fomentarius | 0.86 | 0.003 | 0.93 | 0.000 |
| Fomitopsis betulina | 0.91 | 0.001 | 0.97 | 0.000 |
| Hapalopilus rutilans | 0.89 | 0.001 | 0.65 | 0.060 |
| Steccherinum ochraceum | 0.94 | 0.000 | 0.93 | 0.000 |
| Stereum hirsutum | 0.99 | 0.000 | 0.78 | 0.014 |
| Trametes pubescens | 0.74 | 0.022 | 0.96 | 0.000 |
| Trametes versicolor | 0.89 | 0.001 | 0.89 | 0.001 |
r, Pearson correlation factor; p, significance level.
Table A3.
The average CO2 emission intensity of Betula WD decomposed by xylotrophic Basidiomycetes in the temperature range from +10 to +40 °C at different wood moisture levels, C-CO2 μg g−1 h−1.
Table A3.
The average CO2 emission intensity of Betula WD decomposed by xylotrophic Basidiomycetes in the temperature range from +10 to +40 °C at different wood moisture levels, C-CO2 μg g−1 h−1.
| Fungi Species | Moisture 40/65 per Cent | Moisture 70/245 per Cent | p |
|---|---|---|---|
| Daedaleopsis tricolor | 38.8 (7.40) | 78.4 (12.92) | 0.014 |
| Fomes fomentarius | 27.5 (5.14) | 67.8 (13.67) | 0.011 |
| Fomitopsis betulina | 27.9 (5.21) | 60.5 (9.22) | 0.005 |
| Hapalopilus rutilans | 46.5 (7.34) | 67.4 (19.37) | 0.325 |
| Steccherinum ochraceum | 50.2 (8.55) | 65.0 (13.21) | 0.358 |
| Stereum hirsutum | 33.3 (4.45) | 39.8 (6.45) | 0.415 |
| Trametes pubescens | 14.8 (2.35) | 41.4 (9.85) | 0.015 |
| Trametes versicolor | 76.5 (12.22) | 136.9 (17.77) | 0.010 |
Values are the mean (±SE); p, significance level (ANOVA).
References
- Zavarzin, G.A.; Zavarzina, A.G. Xylotrophic and mycophilic bacteria in formation of dystrophic waters. Microbiology 2009, 78, 523–534. [Google Scholar] [CrossRef]
- Pachauri, R.K.; Allen, M.R.; Barros, V.R.; Broome, J.; Cramer, W.; Christ, R.; Church, J.A.; Clarke, L.; Dahe, Q.; Dasgupta, P.; et al. Climate Change 2014: Synthesis Report. Contribution of Working Groups I, II and III to the Fifth Assessment Report of the Intergovernmental Panel on Climate Change; Core Writing Team, Pachauri, R.K., Meyer, L.A., Eds.; IPCC: Geneva, Switzerland, 2015; p. 151. [Google Scholar]
- Boddy, L. Carbon dioxide release from decomposing wood: Effect of water content and temperature. Soil Biol. Biochem. 1983, 15, 501–510. [Google Scholar] [CrossRef]
- Chen, H.; Harmon, M.E.; Griffiths, R.P.; Hicks, W. Effects of temperature and moisture on carbon respired from decomposing woody roots. For. Ecol. Manag. 2000, 138, 51–64. [Google Scholar] [CrossRef]
- Progar, R.A.; Schowalter, T.D.; Freitag, C.M.; Morrell, J.J. Respiration from coarse woody debris as affected by moisture and saprotroph functional diversity in Western Oregon. Oecologia 2000, 124, 426–431. [Google Scholar] [CrossRef]
- Chambers, J.Q.; Schimel, J.P.; Nobre, A.D. Respiration from Coarse Wood Litter in Central Amazon Forests. Biogeochemistry 2001, 52, 115–131. [Google Scholar] [CrossRef]
- Gough, C.M.; Vogel, C.S.; Kazanski, C.; Nagel, L.; Flower, C.E.; Curtis, P.S. Coarse woody debris and the carbon balance of a north temperate forest. For. Ecol. Manag. 2007, 244, 60–67. [Google Scholar] [CrossRef]
- Jomura, M.; Kominami, Y.; Tamai, K.; Miyama, T.; Goto, Y.; Dannoura, M.; Kanazawa, Y. The carbon budget of coarse woody debris in a temperate broad-leaved secondary forest in Japan. Tellus Ser. B Chem. Phys. Meteorol. 2007, 59, 211–222. [Google Scholar] [CrossRef]
- Wu, J.; Zhang, X.; Wang, H.; Sun, J.; Guan, D. Respiration of downed logs in an old-growth temperate forest in north-eastern China. Scand. J. For. Res. 2010, 25, 500–506. [Google Scholar] [CrossRef]
- Olajuyigbe, S.; Tobin, B.; Nieuwenhuis, M. Temperature and moisture effects on respiration rate of decomposing logs in a Sitka spruce plantation in Ireland. Forestry 2012, 85, 485–496. [Google Scholar] [CrossRef] [Green Version]
- Forrester, J.A.; Mladenoff, D.J.; Gower, S.T.; Stoffel, J.L. Interactions of temperature and moisture with respiration from coarse woody debris in experimental forest canopy gaps. For. Ecol. Manag. 2012, 265, 124–132. [Google Scholar] [CrossRef]
- Herrmann, S.; Bauhus, J. Effects of moisture, temperature and decomposition stage on respirational carbon loss from coarse woody debris (CWD) of important European tree species. Scand. J. For. Res. 2013, 28, 346–357. [Google Scholar] [CrossRef]
- Yoon, T.K.; Noh, N.J.; Kim, S.; Han, S.; Son, Y. Coarse woody debris respiration of Japanese red pine forests in Korea: Controlling factors and contribution to the ecosystem carbon cycle. Ecol. Res. 2015, 30, 723–734. [Google Scholar] [CrossRef]
- Mukhin, V.A.; Voronin, P.Y.; Sukhareva, A.V.; Kuznetsov, V.V. Wood decomposition by fungi in the boreal-humid forest zone under the conditions of climate warming. Dokl. Biol. Sci. 2010, 431, 110–112. [Google Scholar] [CrossRef] [PubMed]
- Mukhin, V.A.; Diyarova, D.K.; Veselkin, D.V. Moisture content—The factor of the CO2 emission activity of woody debris. Lesovedenie 2015, 3, 208–213. (In Russian) [Google Scholar]
- Ivanov, A.V.; Braun, M.; Zamolodchikov, D.G.; Loshakov, S.Y.; Pototskii, O.V. Carbon Emission from the Surface of Coarse Woody Debris in Korean Pine Forests of Southern Primorye. Russ. J. Ecol. 2018, 49, 275–281. [Google Scholar] [CrossRef]
- Gitarskiy, M.L.; Zamolodchikov, D.G.; Mukhin, V.A.; Grabar, V.A.; Diyarova, D.K.; Ivashchenko, A.I. Carbon fluxes from coarse woody debris in southern taiga forests of the Valdai Upland. Russ. J. Ecol. 2017, 48, 539–544. [Google Scholar] [CrossRef]
- Mukhortova, L.; Pashenova, N.; Meteleva, M.; Krivobokov, L.; Guggenberger, G. Temperature Sensitivity of CO2 and CH4 Fluxes from Coarse Woody Debris in Northern Boreal Forests. Forests 2021, 12, 624. [Google Scholar] [CrossRef]
- Christensen, J.H.; Hewitson, B.; Busuioc, A.; Chen, A.; Gao, X.; Held, I.; Jones, R.; Kolli, R.K.; Kwon, W.-T.; Laprise, R.; et al. Regional climate projections. In Climate Change 2007: The Physical Science Basis.Contribution of Working Group I to the Fourth Assessment Report of the Intergovernmental Panel on Climate Change; Solomon, S., Qin, D., Manning, M., Chen, Z., Marquis, M., Averyt, K.B., Tignor, M., Miller, H.L., Eds.; Cambridge University Press: New York, NY, USA, 2007; pp. 848–940. [Google Scholar]
- Barker, J.S. Decomposition of Douglas-fir coarse woody debris in response to differing moisture content and initial heterotrophic colonization. For. Ecol. Manag. 2008, 255, 598–604. [Google Scholar] [CrossRef]
- Forrester, J.A.; Mladenoff, D.J.; D’Amato, A.W.; Fraver, S.; Lindner, D.L.; Brazee, N.J.; Clayton, M.K.; Gower, S.T. Temporal trends and sources of variation in carbon flux from coarse woody debris in experimental forest canopy openings. Oecologia 2015, 179, 889–900. [Google Scholar] [CrossRef]
- Venugopal, P.; Junninen, K.; Linnakoski, R.; Edman, M.; Kouki, J. Climate and wood quality have decayer-specific effects on fungal wood decomposition. For. Ecol. Manag. 2016, 360, 341–351. [Google Scholar] [CrossRef]
- Venugopal, P.; Junninen, K.; Edman, M.; Kouki, J. Assemblage composition of fungal wood-decay species has a major influence on how climate and wood quality modify decomposition. FEMS Microbiol. Ecol. 2017, 93, 1–8. [Google Scholar] [CrossRef]
- Edman, M.; Hagos, S.; Carlsson, F. Warming effects on wood decomposition depend on fungal assembly history. J. Ecol. 2021, 109, 1919–1930. [Google Scholar] [CrossRef]
- Soloviev, V.A. Respiratory Gas Exchange of Wood; LGU: Leningrad, Russia, 1987; p. 300. (In Russian) [Google Scholar]
- Käärik, A.A. Decomposition of Wood. In Biology of Plant Litter Decomposition; Dickinson, C.H., Pugh, G.J.F., Eds.; Academic Press: New York, NY, USA, 1974; pp. 129–174. ISBN 978-0-12-215001-2. [Google Scholar]
- Swift, M.J. The ecology of wood decomposition. In Science Progress; Sage Publications, Ltd.: London, UK, 1977; Volume 64, pp. 175–199. [Google Scholar]
- Harmon, M.E.; Franklin, J.F.; Swanson, F.J.; Sollins, P.; Gregory, S.V.; Lattin, J.D.; Anderson, N.H.; Cline, S.P.; Aumen, N.G.; Sedell, J.R.; et al. Ecology of Coarse Woody Debris in Temperate Ecosystems. In Advanced in Ecological Research; Academic Press: London, UK, 1986; Volume 15, pp. 133–302. [Google Scholar]
- Blanchette, R.A. Delignification by wood-decay fungi. Annu. Rev. Phytopathol. 1991, 29, 381–398. [Google Scholar] [CrossRef]
- Mackensen, J.; Bauhus, J.; Webber, E. Decomposition rates of coarse woody debris—A review with particular emphasis on Australian tree species. Aust. J. Bot. 2003, 51, 27–37. [Google Scholar] [CrossRef]
- Watkinson, S.; Bebber, D.; Darrah, P.; Fricker, M.; Tlalka, M.; Boddy, L. The role of wood decay fungi in the carbon and nitrogen dynamics of the forest floor. In Fungi in Biogeochemical Cycles; Gadd, G., Ed.; Cambridge University Press: Cambridge, UK, 2006; pp. 151–181. [Google Scholar] [CrossRef] [Green Version]
- Boddy, L.; Frankland, J.; van West, P. Ecology of Saprotrophic Basidiomycetes, 1st ed.; Academic Press: New York, NY, USA, 2008; p. 386. ISBN 9780123741851. [Google Scholar]
- Hu, Z.; Xu, C.; McDowell, N.G.; Johnson, D.J.; Wang, M.; Luo, Y.; Zhou, X.; Huang, Z. Linking microbial community composition to C loss rates during wood decomposition. Soil Biol. Biochem. 2017, 104, 108–116. [Google Scholar] [CrossRef] [Green Version]
- Tláskal, V.; Brabcová, V.; Větrovský, T.; Jomura, M.; López-Mondéjar, R.; Oliveira Monteiro, L.M.; Saraiva, J.P.; Human, Z.R.; Cajthaml, T.; Nunes da Rocha, U.; et al. Complementary Roles of Wood-Inhabiting Fungi and Bacteria Facilitate Deadwood Decomposition. Msystems 2021, 6, e01078-20. [Google Scholar] [CrossRef] [PubMed]
- Mukhin, V.A.; Voronin, P.Y. Methane emission during wood fungal decomposition. Dokl. Biol. Sci. 2007, 413, 159–160. [Google Scholar] [CrossRef]
- Lenhart, K.; Bunge, M.; Ratering, S.; Neu, T.R.; Schüttmann, I.; Greule, M.; Kammann, C.; Schnell, S.; Müller, C.; Zorn, H.; et al. Evidence for methane production by saprotrophic fungi. Nat. Commun. 2012, 3, 1–8. [Google Scholar] [CrossRef] [Green Version]
- Schroll, M.; Keppler, F.; Greule, M.; Eckhardt, C.; Zorn, H.; Lenhart, K. The stable carbon isotope signature of methane produced by saprotrophic fungi. Biogeosciences 2020, 17, 3891–3901. [Google Scholar] [CrossRef]
- Scheffer, T.C. O2 requirements for growth and survival of wood-decaying and sapwood-staining fungi. Can. J. Bot. 1986, 64, 1957–1963. [Google Scholar] [CrossRef]
- Ryvarden, L.; Gilbertson, R.L. European Polypores. Part. 1 (Abortiporus−Lindtneria); Fungiflora: Oslo, Norway, 1993; pp. 1–387. [Google Scholar]
- Ryvarden, L.; Gilbertson, R.L. European Polypores. Part. 2 (Meripilus−Tyromyces); Fungiflora: Oslo, Norway, 1994; pp. 388–743. [Google Scholar]
- Mycobank Database—Fungal Databases Nomenclature & Species Banks. Available online: http://www.mycobank.org (accessed on 18 June 2021).
- Yan, E.; Wang, X.; Huang, J. Concept and classification of coarse woody debris in forest ecosystems. Front. Biol. China 2006, 1, 76–84. [Google Scholar] [CrossRef]
- Romero-Kutzner, V.; Packard, T.T.; Berdalet, E.; Roy, S.O.; Gagné, J.P.; Gómez, M. Respiration quotient variability: Bacterial evidence. Mar. Ecol. Prog. Ser. 2015, 519, 47–59. [Google Scholar] [CrossRef] [Green Version]
- Wang, C.; Bond-Lamberty, B.; Gower, S.T. Environmental controls on carbon dioxide flux from black spruce coarse woody debris. Oecologia 2002, 132, 374–381. [Google Scholar] [CrossRef] [PubMed]
- Agafonov, L.I.; Kukarskikh, V.V. Climate changes in the past century and radial increment of pine in the Southern Ural steppe. Russ. J. Ecol. 2008, 39, 160–167. [Google Scholar] [CrossRef]
- Mukhin, V.A.; Voronin, P.Y.; Ladatko, V.A.; Ivanov, A.N. The oxygenic and cooperative respiration of the wood-decaying Fungus Fomitopsis pinicola (Sw.: Fr.) Pers. Dokl. Biol. Sci. 2006, 407, 153–154. [Google Scholar] [CrossRef] [PubMed]
- Lustenhouwer, N.; Maynard, D.S.; Bradford, M.A.; Lindner, D.L.; Oberle, B.; Zanne, A.E.; Crowther, T.W. A trait-based understanding of wood decomposition by fungi. Proc. Natl. Acad. Sci. USA 2020, 117, 11551–11558. [Google Scholar] [CrossRef] [PubMed]
Figure 1.
The contingency of O2 and CO2 fluxes in gas exchange for Betula WD affected by xylotrophic Basidiomycetes under the RM levels of 40% (I) and 70% (II), the temperature +10 °C (a), +20 °C (b), +30 °C (c), and +40 °C (d); R2 is the coefficient of determination.
Figure 1.
The contingency of O2 and CO2 fluxes in gas exchange for Betula WD affected by xylotrophic Basidiomycetes under the RM levels of 40% (I) and 70% (II), the temperature +10 °C (a), +20 °C (b), +30 °C (c), and +40 °C (d); R2 is the coefficient of determination.

Table 1.
The carbon-to-oxygen balance (CO2 to O2 ratio) in gas exchange for Betula WD decomposed by xylotrophic Basidiomycetes.
Table 1.
The carbon-to-oxygen balance (CO2 to O2 ratio) in gas exchange for Betula WD decomposed by xylotrophic Basidiomycetes.
| Species | Moisture 40/65 per Cent | Moisture 70/245 per Cent | ||||||
|---|---|---|---|---|---|---|---|---|
| Temperature, °C | Temperature, °C | |||||||
| 10 | 20 | 30 | 40 | 10 | 20 | 30 | 40 | |
| 1 | 0.6 (0.12) | 1.0 (0.14) | 1.0 (0.13) | 0.8 (0.04) | 0.6 (0.01) | 0.7 (0.01) | 1.0 (0.17) | 0.8 (0.05) |
| 2 | 0.6 (0.10) | 0.5 (0.08) | 1.3 (0.29) | 1.1 (0.31) | 0.7 (0.12) | 1.0 (0.13) | 1.0 (0.27) | 0.9 (0.16) |
| 3 | 0.5 (0.05) | 0.8 (0.03) | 1.2 (0.05) | 0.7 (0.03) | 0.7 (0.21) | 0.7 (0.02) | 1.1 (0.27) | 1.1 (0.10) |
| 4 | 0.9 (0.36) | 0.8 (0.09) | 0.9 (0.22) | 0.9 (0.12) | 0.4 (0.06) | 0.6 (0.19) | 1.0 (0.20) | 0.8 (0.08) |
| 5 | 0.9 (0.11) | 0.5 (0.03) | 1.0 (0.20) | 0.9 (0.07) | 0.6 (0.09) | 0.9 (0.23) | 1.1 (0.65) | 1.4 (0.52) |
| 6 | 0.8 (0.01) | 0.9 (0.06) | 0.8 (0.03) | 0.9 (0.14) | 1.0 (0.40) | 1.5 (0.11) | 0.8 (0.05) | 0.8 (0.05) |
| 7 | 0.8 (0.25) | 0.8 (0.13) | 0.6 (0.19) | 1.1 (0.26) | 0.7 (0.29) | 2.1 (0.97) | 0.9 (0.06) | 2.0 (0.37) |
| 8 | 0.9 (0.04) | 0.9 (0.08) | 0.6 (0.06) | 0.9 (0.06) | 0.7 (0.05) | 0.9 (0.03) | 0.8 (0.16) | 0.7 (0.05) |
Values are the average from three replicates (±SE). Species: 1, Daedaleopsis tricolor; 2, Fomes fomentarius; 3, Fomitopsis betulina; 4, Hapalopilus rutilans; 5, Steccherinum ochraceum; 6, Stereum hirsutum; 7, Trametes pubescens; 8, T. versicolor.
Table 2.
The carbon-to-oxygen balance (CO2-to O2-ratio) in gas exchange for Betula WD decomposed by xylotrophic Basidiomycetes and relevance to temperature and moisture the ANOVA test.
Table 2.
The carbon-to-oxygen balance (CO2-to O2-ratio) in gas exchange for Betula WD decomposed by xylotrophic Basidiomycetes and relevance to temperature and moisture the ANOVA test.
| Moisture, % | Temperature, °C | Relevance to Temperature | |||
|---|---|---|---|---|---|
| 10 | 20 | 30 | 40 | ||
| 40/65 | 0.8 (0.06) | 0.8 (0.04) | 0.9 (0.07) | 0.9 (0.07) | F(3,92) = 1.9335, p = 0.13 |
| 70/245 | 0.7 (0.07) | 1.0 (0.14) | 1.0 (0.10) | 1.0 (0.11) | F(3,92) = 2,5285, p = 0.06 |
| Relevance to moisture | F(1,46) = 0.93269, p = 0.33 | F(1,46) = 3.5991, p = 0.06 | F(1,46) = 0.66490,p = 0.42 | F(1,46) = 0.99514,p = 0.32 | |
Values are the average from 24 replicates (±SE).
Table 3.
The CO2-emission intensity of Betula WD decomposed by xylotrophic Basidiomycetes, C-CO2 μg g−1 h−1.
Table 3.
The CO2-emission intensity of Betula WD decomposed by xylotrophic Basidiomycetes, C-CO2 μg g−1 h−1.
| Species | Moisture 40/65 per Cent | Moisture 70/245 per Cent | ||||||
|---|---|---|---|---|---|---|---|---|
| Temperature, °C | Temperature, °C | |||||||
| 10 | 20 | 30 | 40 | 10 | 20 | 30 | 40 | |
| 1 | 11.1 (1.03) | 18.8 (1.67) | 57.8 (1.99) | 67.6 (3.83) | 25.7 (3.26) | 52.7 (7.14) | 116.7 (11.10) | 118.6 (15.02) |
| 2 | 9.6 (0.94) | 12.6 (1.41) | 45.2 (5.62) | 42.5 (2.54) | 15.0 (1.19) | 43.1 (4.68) | 80.5 (11.62) | 132.7 (8.03) |
| 3 | 8.4 (0.41) | 13.7 (1.43) | 42.1 (3.69) | 47.4 (0.91) | 21.3 (0.41) | 40.5 (0.32) | 87.2 (2.50) | 93.0 (2.41) |
| 4 | 16.3 (6.16) | 37.1 (1.07) | 59.1 (10.27) | 73.6 (9.76) | 13.4 (3.84) | 44.1 (20.66) | 102.4 (46.35) | 109.5 (49.37) |
| 5 | 15.9 (0.26) | 29.7 (4.80) | 72.5 (1.21) | 82.7 (2.10) | 16.5 (3.20) | 36.5 (2.24) | 95.1 (8.31) | 111.7 (25.06) |
| 6 | 11.8 (0.43) | 29.4 (1.71) | 50.3 (2.56) | 41.9 (2.30) | 22.7 (5.71) | 17.8 (5.67) | 62.6 (3.26) | 56.3 (7.35) |
| 7 | 4.2 (1.03) | 17.1 (1.78) | 15.4 (1.60) | 22.7 (4.97) | 4.1 (0.68) | 18.3 (0.88) | 55.7 (0.75) | 87.6 (1.06) |
| 8 | 30.2 (0.31) | 53.0 (1.80) | 92.1 (15.85) | 131.3 (8.59) | 68.0 (26.95) | 111.4 (10.10) | 180.2 (7.88) | 188.0 (33.36) |
Values are the average from three replicates (±SE). Species: see Table 1.
Table 4.
The intensity of CO2 emission by Betula WD decomposed by xylotrophic Basidiomycetes (O2 μg g−1 h−1) and its relevance to temperature and moisture, one-way ANOVA test.
Table 4.
The intensity of CO2 emission by Betula WD decomposed by xylotrophic Basidiomycetes (O2 μg g−1 h−1) and its relevance to temperature and moisture, one-way ANOVA test.
| Moisture, per Cent | Temperature, °C | Relevance to Temperature | |||
|---|---|---|---|---|---|
| 10 | 20 | 30 | 40 | ||
| 40/65 | 13.5 (1.66) | 26.4 (2.77) | 54.3 (4.88) | 63.7 (6.72) | F(3,92) = 27.704, p = 0.001 |
| 70/245 | 23.3 (4.76) | 45.5 (6.29) | 97.5 (9.24) | 112.1 (10.26) | F(3,92) = 27.992, p = 0.001 |
| Relevance to moisture | F(1,46) = 3.8317, p = 0.05 | F(1,46) = 7.7144, p = 0.007 | F(1,46) = 17.124, p = 0.0001 | F(1,46) = 15.612, p = 0.0002 | |
Values are the average from 24 replicates (±SE).
Table 5.
The intensity of oxygen uptake by Betula WD decomposed by xylotrophic Basidiomycetes (O2 μg g−1 h−1) and its relevance to temperature and moisture, one-way ANOVA test.
Table 5.
The intensity of oxygen uptake by Betula WD decomposed by xylotrophic Basidiomycetes (O2 μg g−1 h−1) and its relevance to temperature and moisture, one-way ANOVA test.
| Moisture, per Cent | Temperature, °C | Relevance to Temperature | |||
|---|---|---|---|---|---|
| 10 | 20 | 30 | 40 | ||
| 40/65 | 48.9 (4.82) | 94.2 (9.43) | 181.7 (22.74) | 204.8 (21.14) | F(3,92) = 19.932, p = 0.001 |
| 70/245 | 102.9 (22.52) | 154.8 (21.68) | 297.2 (39.49) | 349.2 (44.46) | F(3,92) = 11.906, p = 0.001 |
| Relevance to moisture | F(1,46) = 5.4869, p = 0.02 | F(1,46) = 6.5547, p = 0.01 | F(1,46) = 4.4203, p = 0.01 | F(1,46) = 8.6103, p = 0.005 | |
Values are the average from 24 replicates (±SE).
Table 6.
The carbon-to-oxygen balance (CO2 to O2 ratio) and CO2 emission intensity in basidiocarps gas exchange of bracket fungi, one-way ANOVA test.
Table 6.
The carbon-to-oxygen balance (CO2 to O2 ratio) and CO2 emission intensity in basidiocarps gas exchange of bracket fungi, one-way ANOVA test.
| Temperature, °C | Daedaleopsis tricolor | Fomitopsis betulina | ||
|---|---|---|---|---|
| CO2:O2 | C-CO2 μg g−1 h−1 | CO2:O2 | C-CO2 μg g−1 h−1 | |
| 10 | 0.8 (0.03) | 191 (14.7) | 0.8 (0.09) | 445.1 (20.7) |
| 20 | 0.9 (0.01) | 445 (13.4) | 0.8 (0.01) | 996.5 (22.5) |
| 30 | 0.9 (0.03) | 659.4 (15.6) | 0.8 (0.03) | 1495.8 (91.9) |
| 40 | 0.8 (0.03) | 511.5 (20.7) | 0.8 (0.07) | 1029.0 (46.2) |
| Relevance to temperature | F(3,8) = 3.88, p = 0.05 | F(6,14) = 20,99, p = 0.001 | F(3,8) = 0.22, p = 0.87 | F(6,14) = 20,01, p = 0.001 |
Values are the average from three replicates (±SE).
Publisher’s Note: MDPI stays neutral with regard to jurisdictional claims in published maps and institutional affiliations. |
© 2021 by the authors. Licensee MDPI, Basel, Switzerland. This article is an open access article distributed under the terms and conditions of the Creative Commons Attribution (CC BY) license (https://creativecommons.org/licenses/by/4.0/).
Share and Cite
MDPI and ACS Style
Mukhin, V.A.; Diyarova, D.K.; Gitarskiy, M.L.; Zamolodchikov, D.G. Carbon and Oxygen Gas Exchange in Woody Debris: The Process and Climate-Related Drivers. Forests 2021, 12, 1156. https://0-doi-org.brum.beds.ac.uk/10.3390/f12091156
AMA Style
Mukhin VA, Diyarova DK, Gitarskiy ML, Zamolodchikov DG. Carbon and Oxygen Gas Exchange in Woody Debris: The Process and Climate-Related Drivers. Forests. 2021; 12(9):1156. https://0-doi-org.brum.beds.ac.uk/10.3390/f12091156
Chicago/Turabian StyleMukhin, Victor A., Daria K. Diyarova, Mikhail L. Gitarskiy, and Dmitry G. Zamolodchikov. 2021. "Carbon and Oxygen Gas Exchange in Woody Debris: The Process and Climate-Related Drivers" Forests 12, no. 9: 1156. https://0-doi-org.brum.beds.ac.uk/10.3390/f12091156
Note that from the first issue of 2016, this journal uses article numbers instead of page numbers. See further details here.