
Forest Resistance to Extended Drought Enhanced by Prescribed Fire in Low Elevation Forests of the Sierra Nevada


Abstract
:1. Introduction
2. Materials and Methods
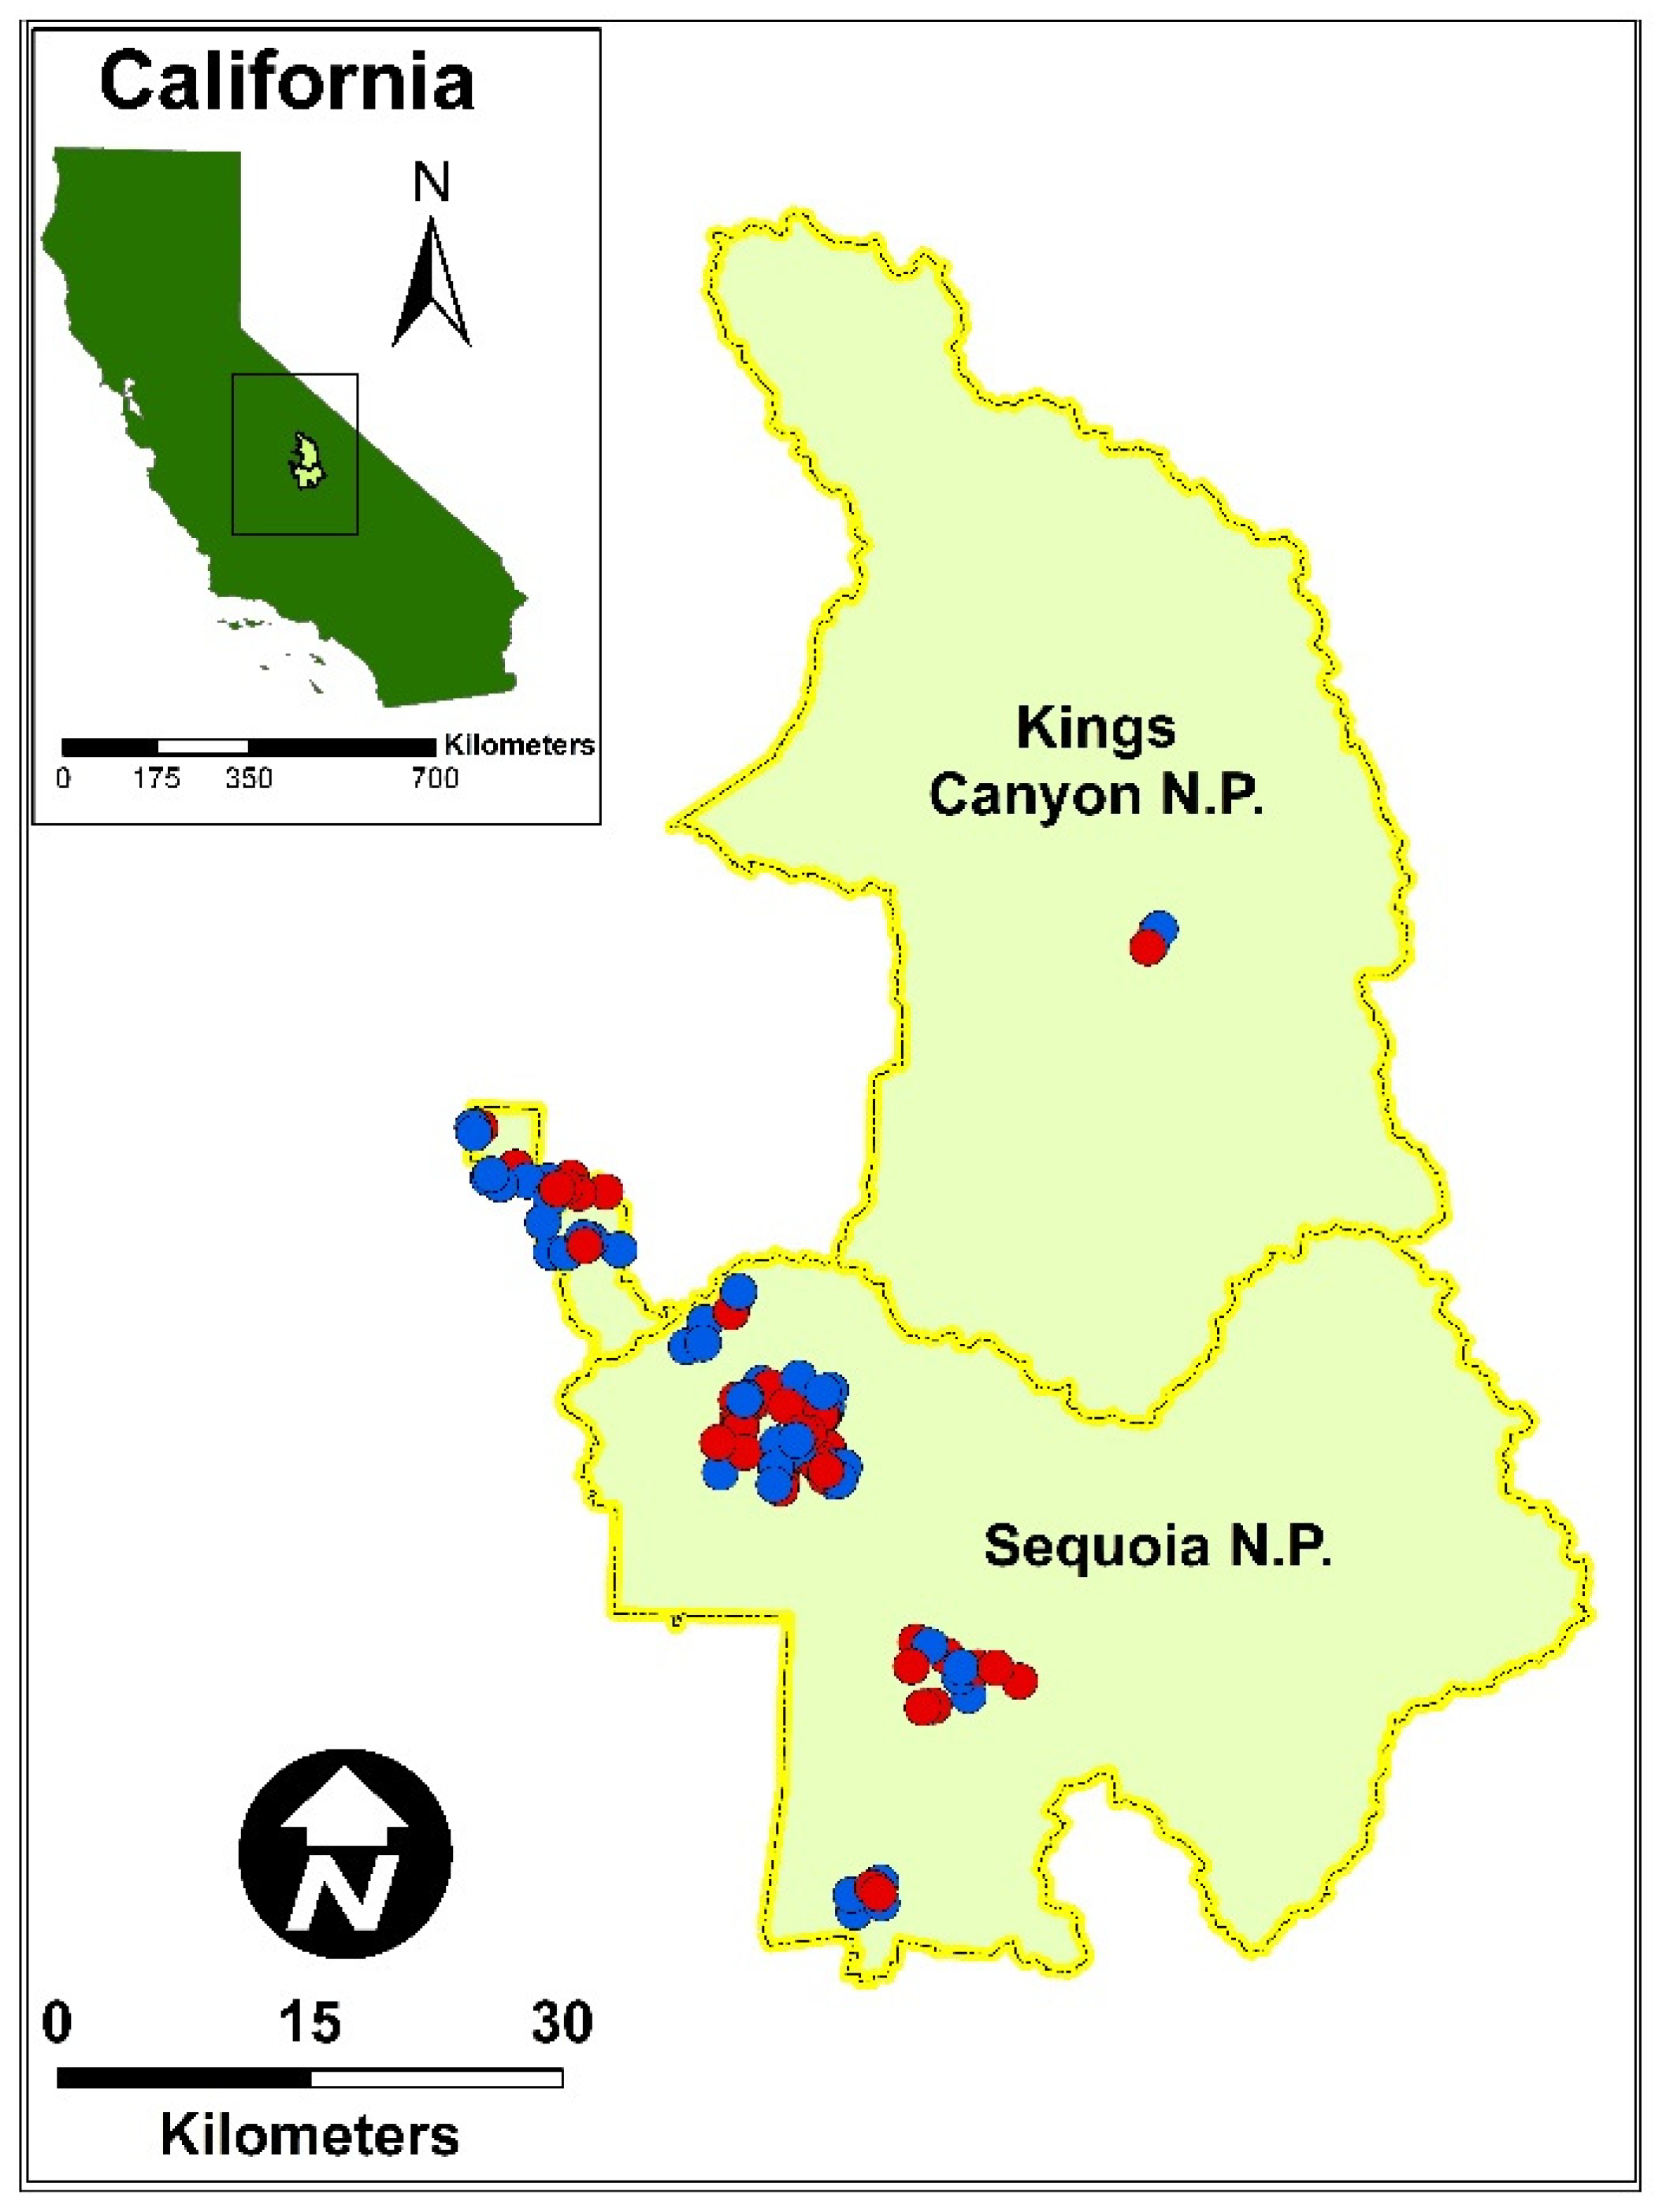
2.1. Study Site
2.2. Forest Plot Data
2.2.1. National Park Service Fire Effects Plots (FMH) and Supplemental Mortality Plots
2.2.2. Sequoia National Park Fire and Fire Surrogate Plots (FFS)
2.2.3. Sierra Nevada Forest Dynamics Plot Network (SNFDPN)
2.3. Analyses
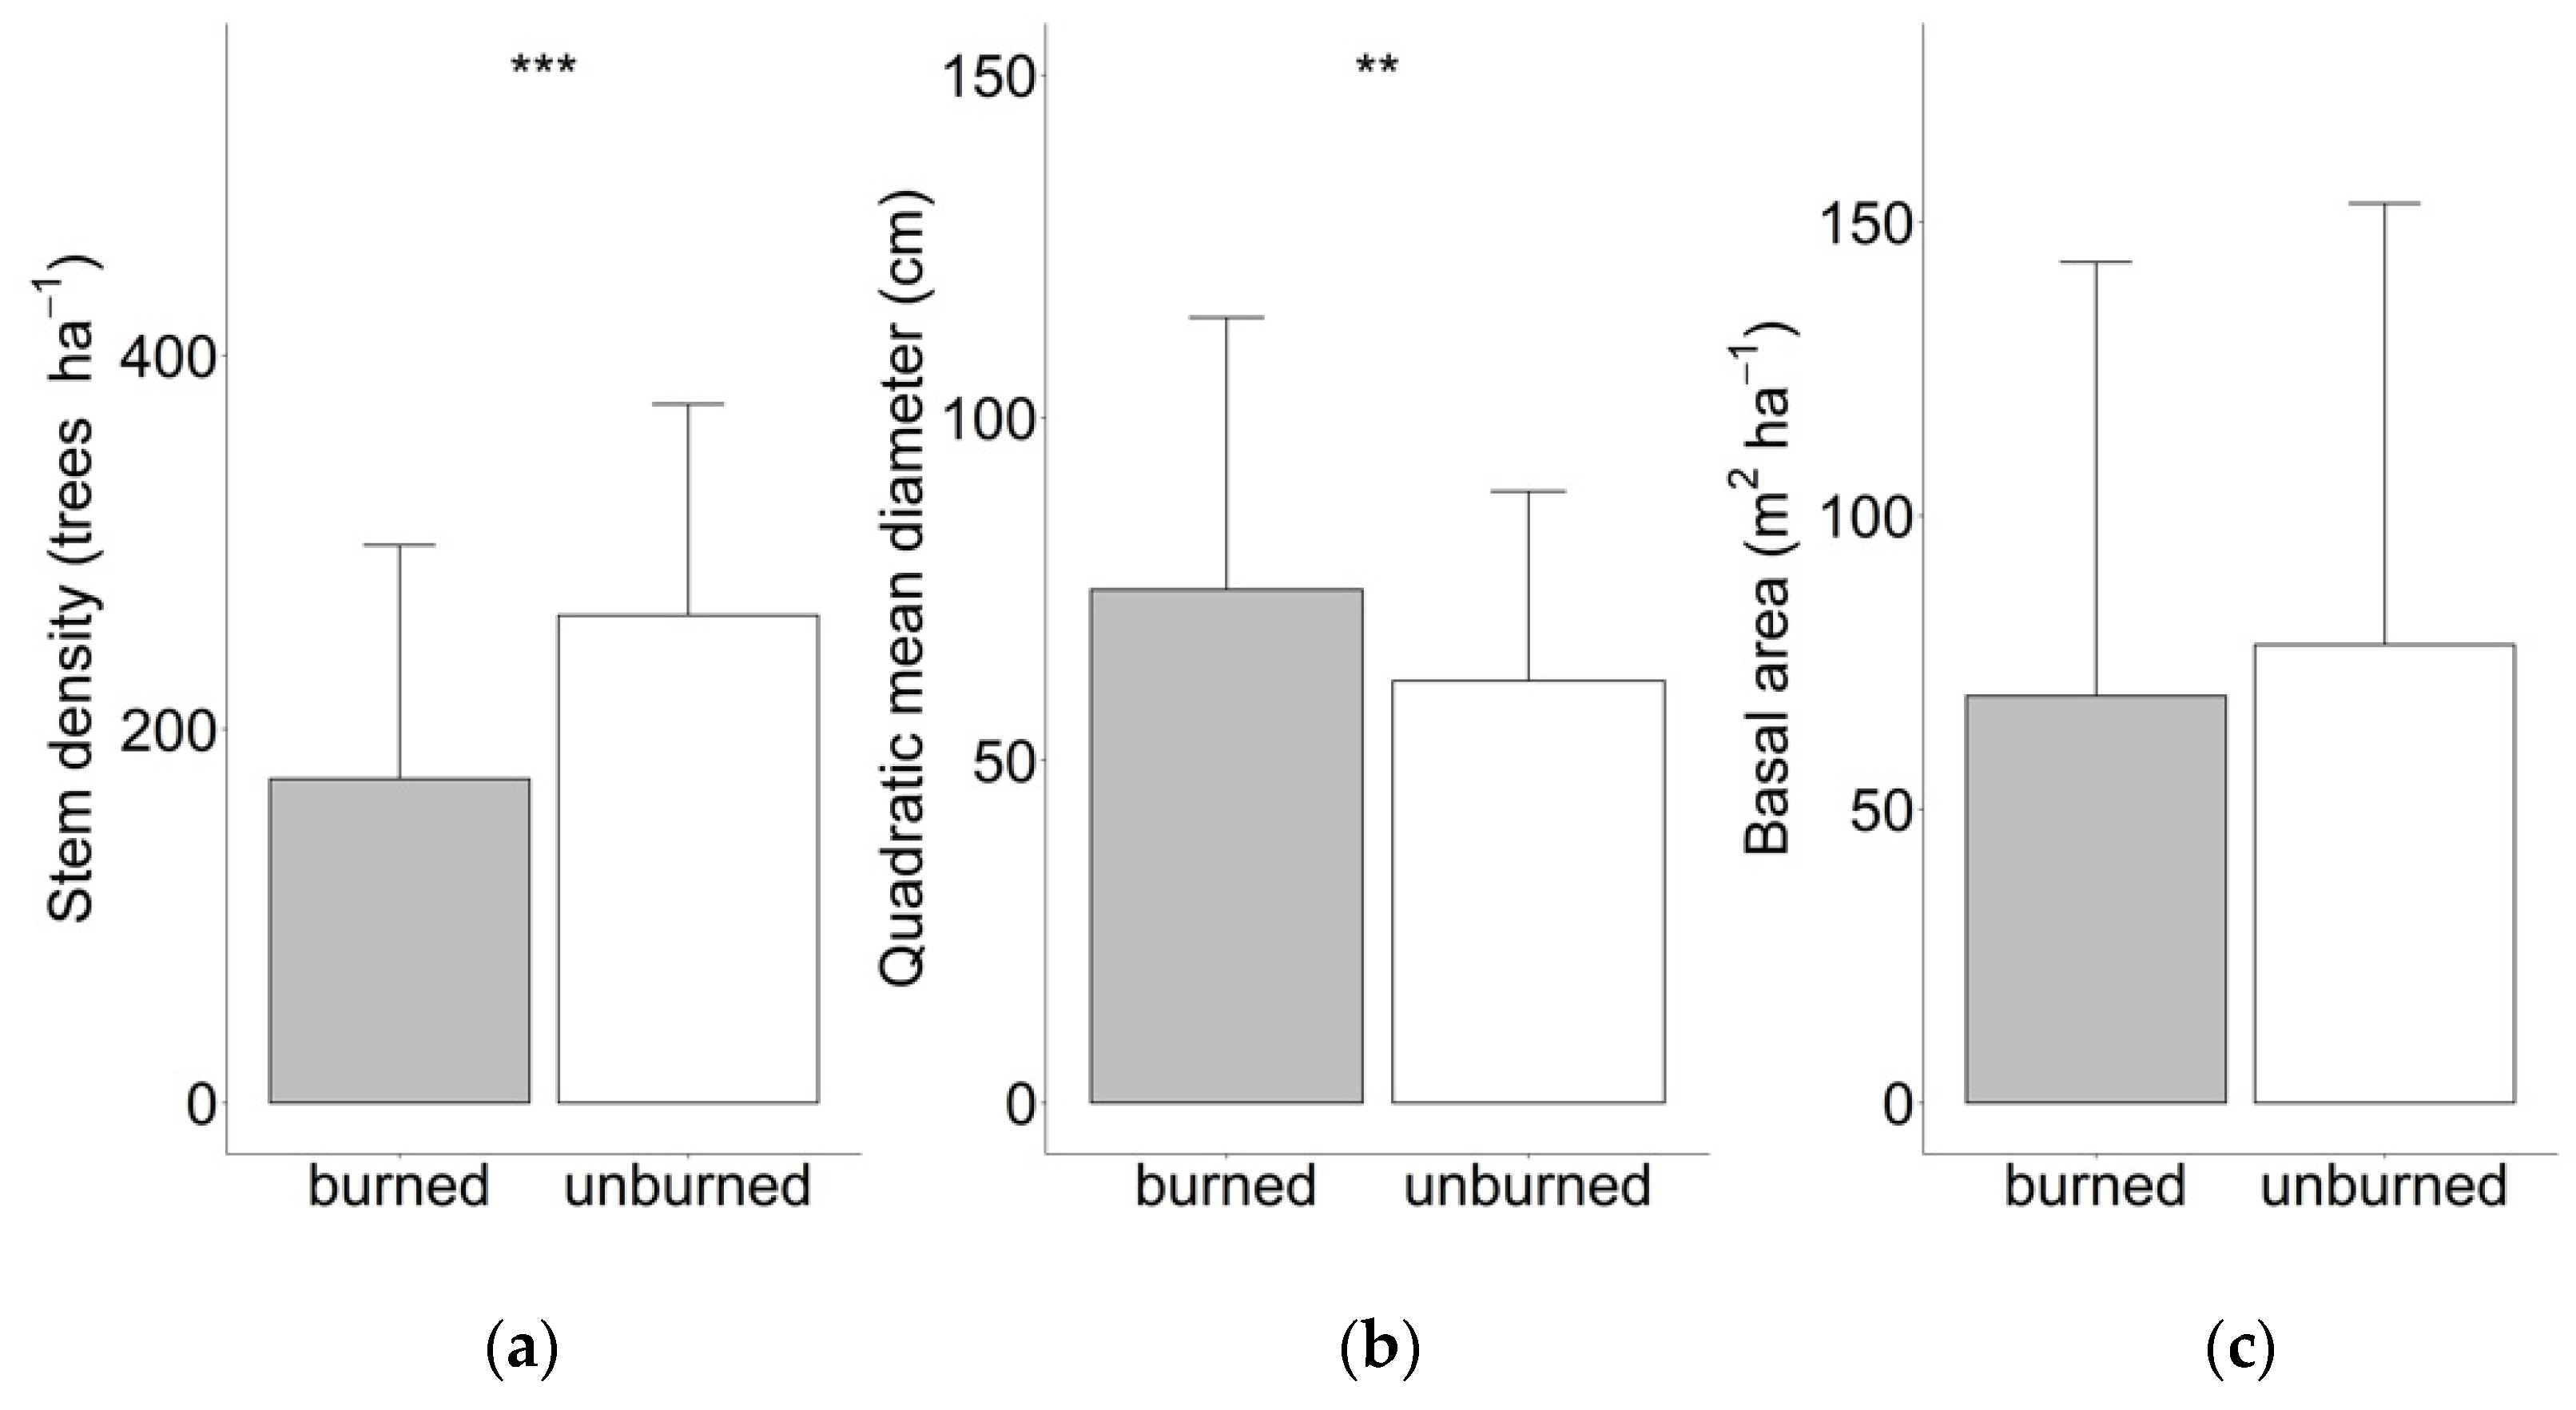
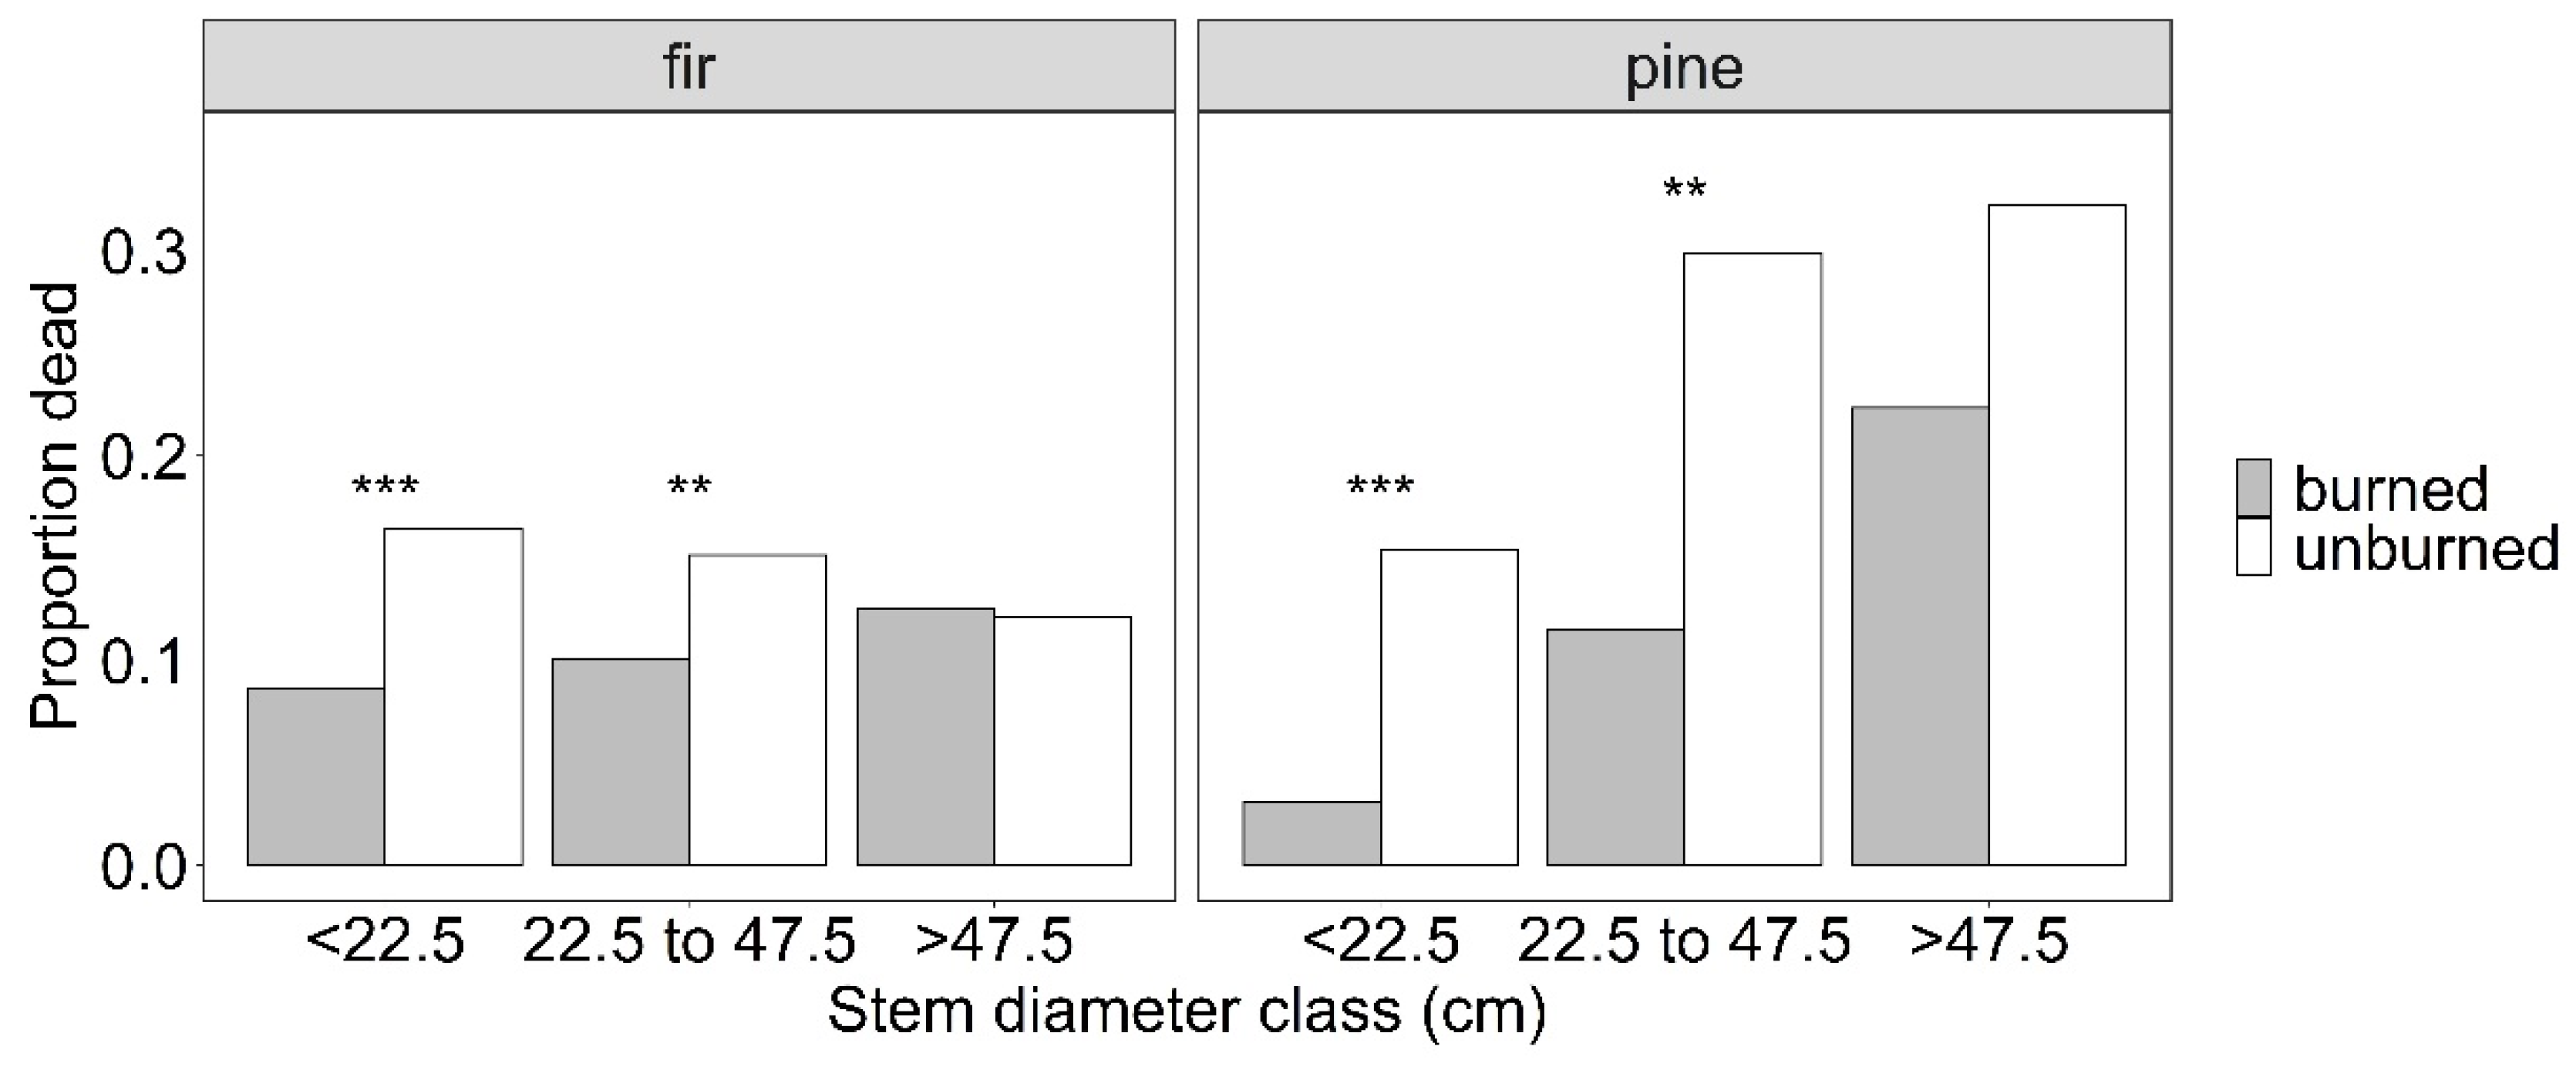
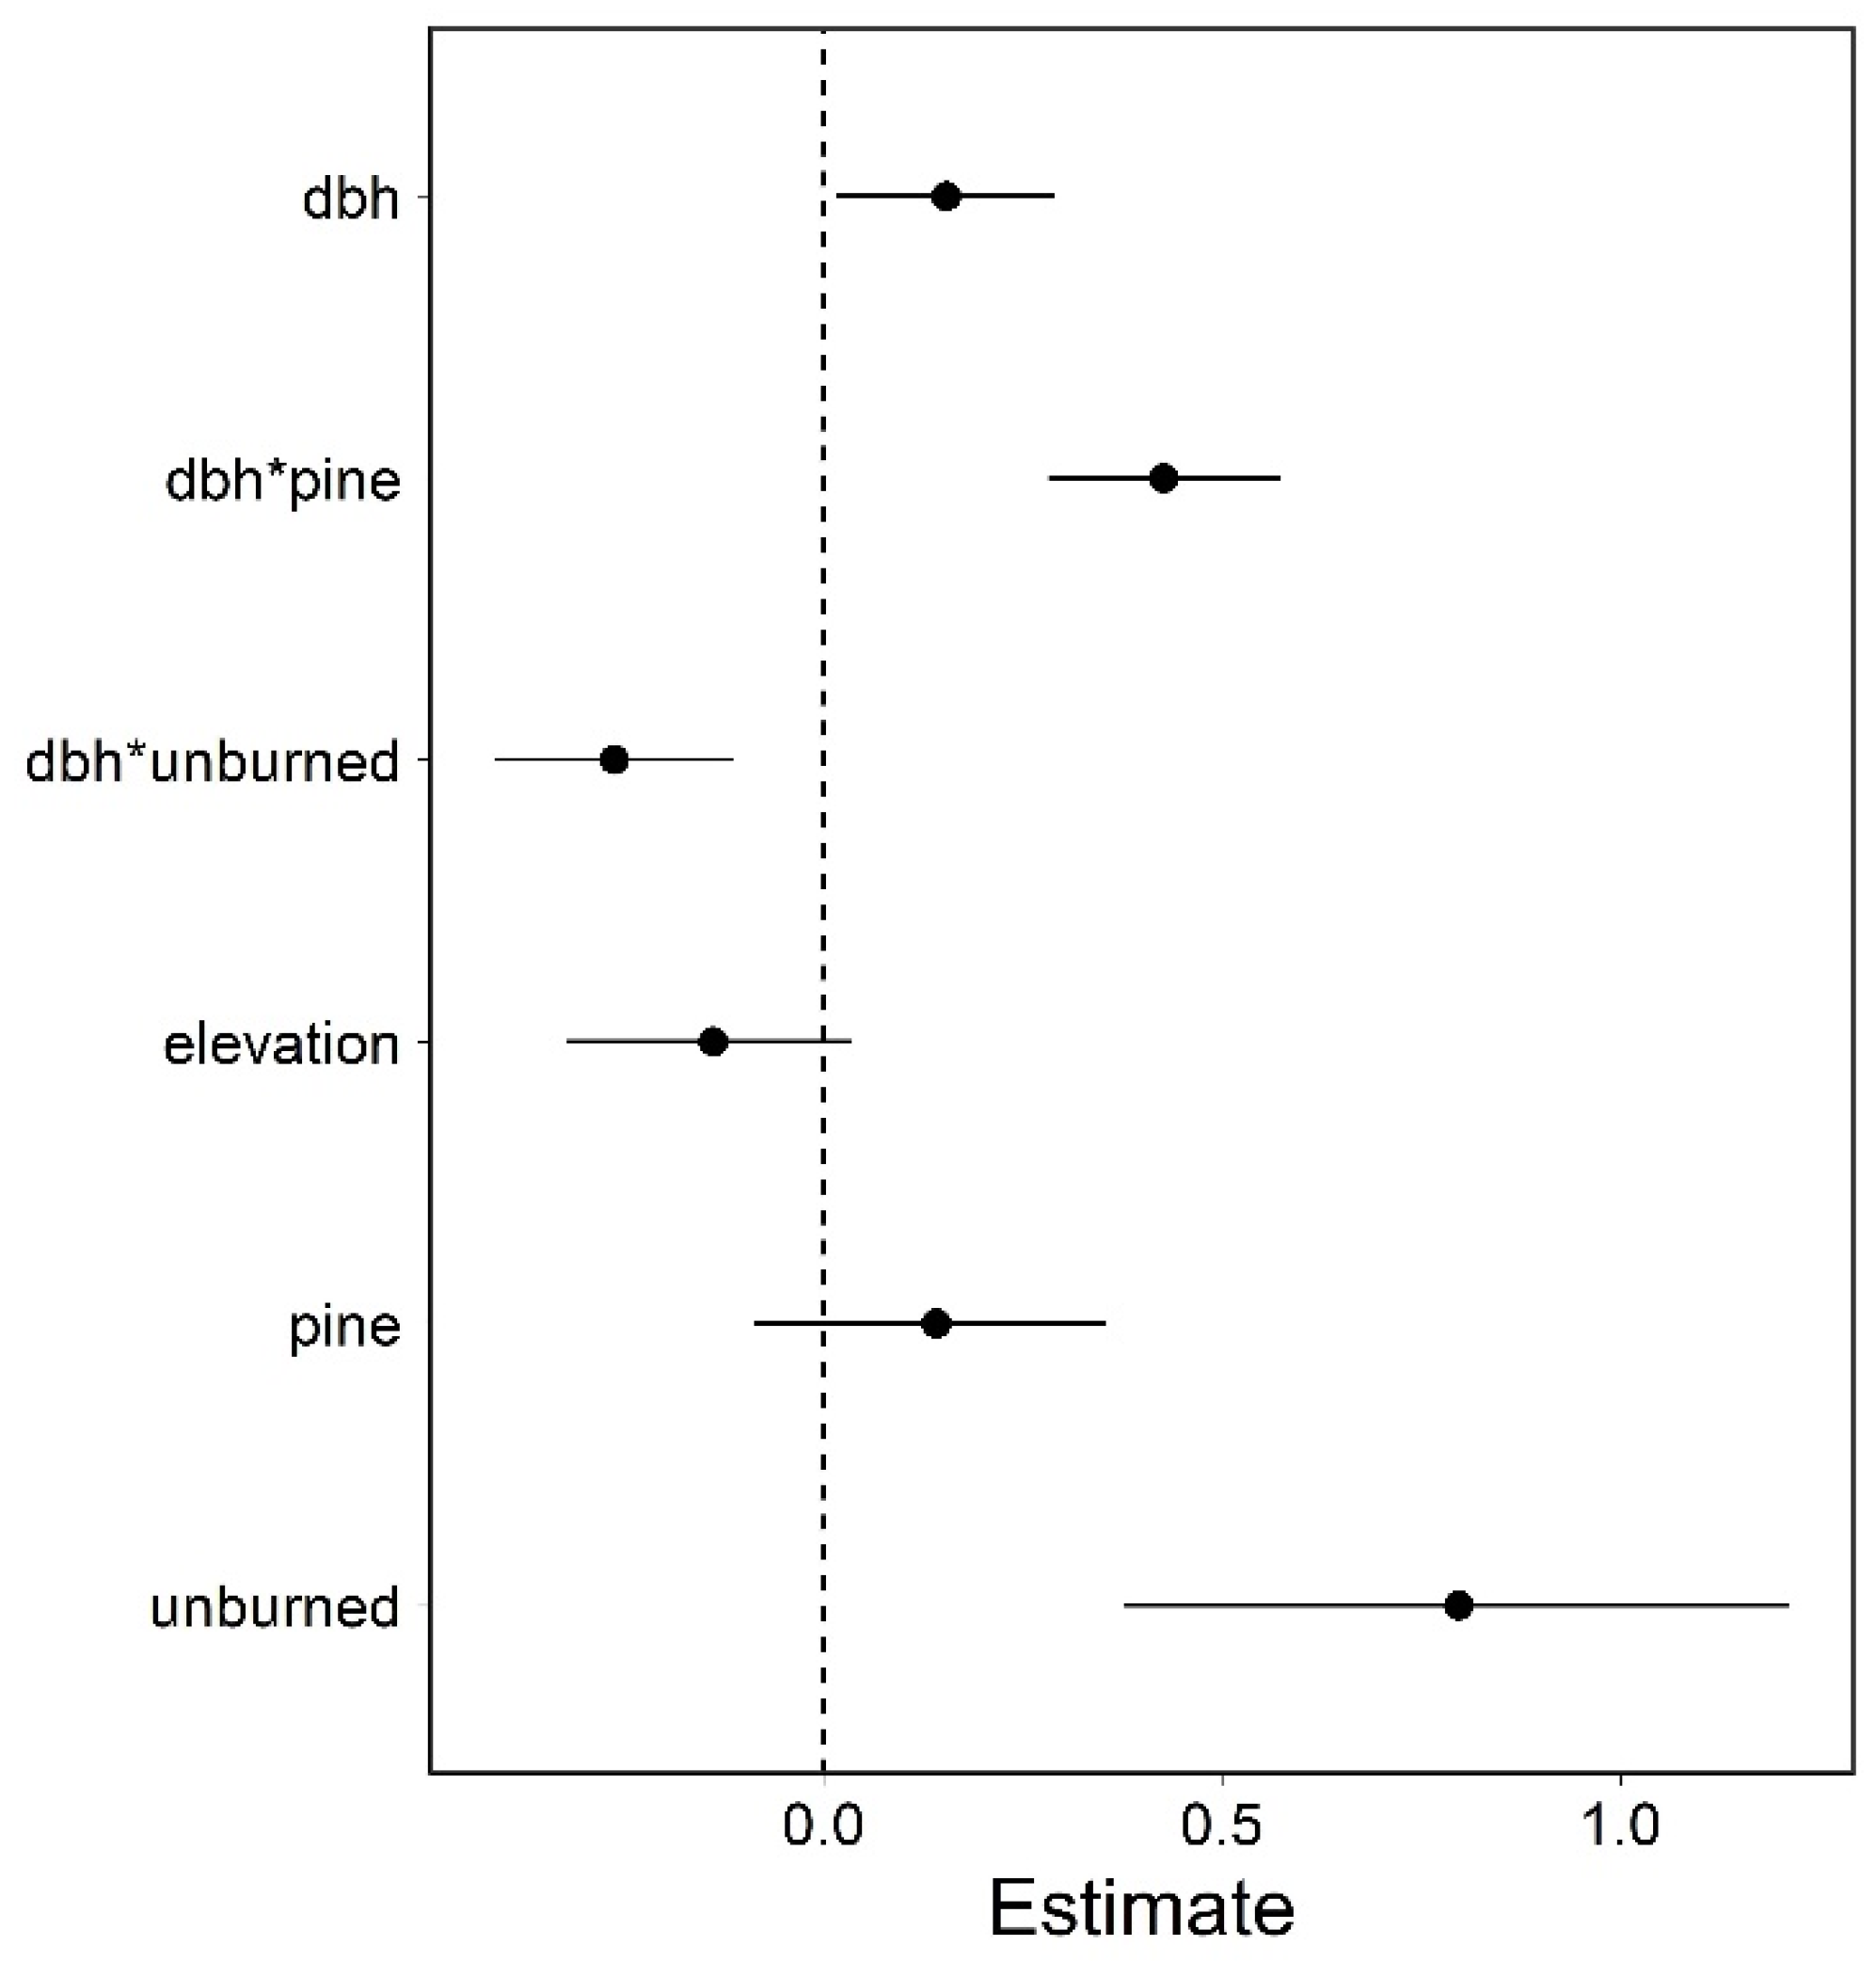
3. Results
4. Discussion
Author Contributions
Funding
Data Availability Statement
Acknowledgments
Conflicts of Interest
References
- Bradford, J.B.; Schlaepfer, D.R.; Lauenroth, W.K.; Palmquist, K.A. Robust ecological drought projections for drylands in the 21st century. Glob Chang. Biol. 2020, 26, 3906–3919. [Google Scholar] [CrossRef]
- Allen, C.D.; Breshears, D.D.; McDowell, N.G. On underestimation of global vulnerability to tree mortality and forest die-off from hotter drought in the Anthropocene. Ecosphere 2015, 6, art129. [Google Scholar] [CrossRef]
- Adams, H.D.; Zeppel, M.J.B.; Anderegg, W.R.L.; Hartmann, H.; Landhäusser, S.M.; Tissue, D.T.; Huxman, T.E.; Hudson, P.J.; Franz, T.E.; Allen, C.D.; et al. A multi-species synthesis of physiological mechanisms in drought-induced tree mortality. Nat. Ecol. Evol. 2017, 1, 1285–1291. [Google Scholar] [CrossRef]
- Stephenson, N.L.; Das, A.J.; Ampersee, N.J.; Bulaon, B.M.; Yee, J.L. Which trees die during drought? The key role of insect host-tree selection. J. Ecol. 2019, 107, 2383–2401. [Google Scholar] [CrossRef]
- Ryan, K.C.; Knapp, E.E.; Varner, J.M. Prescribed fire in North American forests and woodlands: History, current practice, and challenges. Front. Ecol. Environ. 2013, 11, e15–e24. [Google Scholar] [CrossRef]
- Young, D.J.N.; Stevens, J.T.; Earles, J.M.; Moore, J.; Ellis, A.; Jirka, A.L.; Latimer, A.M. Long-term climate and competition explain forest mortality patterns under extreme drought. Ecol. Lett. 2017, 20, 78–86. [Google Scholar] [CrossRef] [PubMed]
- Bradford, J.B.; Bell, D.M. A window of opportunity for climate-change adaptation: Easing tree mortality by reducing forest basal area. Front. Ecol. Environ. 2017, 15, 11–17. [Google Scholar] [CrossRef]
- Negrón, J.F.; McMillin, J.D.; Anhold, J.A.; Coulson, D. Bark beetle-caused mortality in a drought-affected ponderosa pine landscape in Arizona, USA. For. Ecol. Manag. 2009, 257, 1353–1362. [Google Scholar] [CrossRef]
- Fettig, C.J.; Mortenson, L.A.; Bulaon, B.M.; Foulk, P.B. Tree mortality following drought in the central and southern Sierra Nevada, California, U.S. For. Ecol. Manag. 2019, 432, 164–178. [Google Scholar] [CrossRef]
- Lechuga, V.; Carraro, V.; Viñegla, B.; Carreira, J.A.; Linares, J.C. Managing drought-sensitive forests under global change. Low competition enhances long-term growth and water uptake in Abies pinsapo. For. Ecol. Manag. 2017, 406, 72–82. [Google Scholar] [CrossRef]
- Tepley, A.J.; Hood, S.M.; Keyes, C.R.; Sala, A. Forest restoration treatments in a ponderosa pine forest enhance physiological activity and growth under climatic stress. Ecol. Appl. 2020, eap.2188. [Google Scholar] [CrossRef]
- Restaino, C.; Young, D.J.N.; Estes, B.; Gross, S.; Wuenschel, A.; Meyer, M.; Safford, H. Forest structure and climate mediate drought-induced tree mortality in forests of the Sierra Nevada, USA. Ecol. Appl. 2019, 29, e01902. [Google Scholar] [CrossRef]
- Westlind, D.J.; Kerns, B.K. Repeated fall prescribed fire in previously thinned Pinus ponderosa increases growth and resistance to other disturbances. For. Ecol. Manag. 2021, 480, 118645. [Google Scholar] [CrossRef]
- Hood, S.M.; Varner, J.M.; van Mantgem, P.; Cansler, C.A. Fire and tree death: Understanding and improving modeling of fire-induced tree mortality. Environ. Res. Lett. 2018, 13, 113004. [Google Scholar] [CrossRef]
- Battipaglia, G.; Strumia, S.; Esposito, A.; Giuditta, E.; Sirignano, C.; Altieri, S.; Rutigliano, F.A. The effects of prescribed burning on Pinus halepensis Mill. as revealed by dendrochronological and isotopic analyses. For. Ecol. Manag. 2014, 334, 201–208. [Google Scholar] [CrossRef]
- Hood, S.; Sala, A.; Heyerdahl, E.K.; Boutin, M. Low-severity fire increases tree defense against bark beetle attacks. Ecology 2015, 96, 1846–1855. [Google Scholar] [CrossRef] [Green Version]
- Schwilk, D.W.; Keeley, J.E.; Knapp, E.E.; McIver, J.; Bailey, J.D.; Fettig, C.J.; Fiedler, C.E.; Harrod, R.J.; Moghaddas, J.J.; Outcalt, K.W.; et al. The national Fire and Fire Surrogate study: Effects of fuel reduction methods on forest vegetation structure and fuels. Ecol. Appl. 2009, 19, 285–304. [Google Scholar] [CrossRef]
- Stephens, S.L.; Collins, B.M.; Roller, G. Fuel treatment longevity in a Sierra Nevada mixed conifer forest. For. Ecol. Manag. 2012, 285, 204–212. [Google Scholar] [CrossRef]
- van Mantgem, P.J.; Caprio, A.C.; Stephenson, N.L.; Das, A.J. Does prescribed fire promote resistance to drought in low elevation forests of the Sierra Nevada, California, USA? Fire Ecol. 2016, 12, 13–25. [Google Scholar] [CrossRef]
- Klos, P.Z.; Goulden, M.L.; Riebe, C.S.; Tague, C.L.; O’Geen, A.T.; Flinchum, B.A.; Safeeq, M.; Conklin, M.H.; Hart, S.C.; Berhe, A.A.; et al. Subsurface plant-accessible water in mountain ecosystems with a Mediterranean climate. WIREs Water 2018, 5, e1277. [Google Scholar] [CrossRef] [Green Version]
- Fites-Kaufman, J.A.; Rundel, P.; Stephenson, N.; Weixelman, D.A. Montane and subalpine vegetation of the Sierra Nevada and Cascade ranges. In Terrestrial Vegetation of California; Barbour, M., Keeler-Wolf, T., Schoenherr, A.A., Eds.; University of California Press: Berkeley, CA, USA, 2007; pp. 456–501. [Google Scholar]
- USDI National Park Service. Fire Monitoring Handbook; Fire Management Program Center, National Interagency Fire Center: Boise, ID, USA, 2003.
- Knapp, E.E.; Keeley, J.E. Heterogeneity in fire severity within early season and late season prescribed burns in a mixed-conifer forest. Int. J. Wildland Fire 2006, 15, 37–45. [Google Scholar] [CrossRef] [Green Version]
- Nesmith, J.C.B.; Das, A.J.; O’Hara, K.L.; van Mantgem, P.J. The influence of prefire tree growth and crown condition on postfire mortality of sugar pine following prescribed fire in Sequoia National Park. Can. J. For. Res. 2015, 45, 910–919. [Google Scholar] [CrossRef]
- Das, A.J.; Stephenson, N.L.; Davis, K.P. Why do trees die? Characterizing the drivers of background tree mortality. Ecology 2016, 97, 2616–2627. [Google Scholar] [CrossRef] [PubMed]
- R Core Team. R A Language and Environment for Statistical Computing; R Core Team: Vienna, Austria, 2020. [Google Scholar]
- Goodrich, B.; Gabry, J.; Ali, I.; Brilleman, S. Rstanarm: Bayesian Applied Regression Modeling via Stan. 2020. Available online: https://mc-stan.org/rstanarm/index.html (accessed on 13 May 2021).
- Kohl, M. MKinfer: Inferential Statistics. 2020. Available online: https://cran.r-project.org/web/packages/MKinfer/index.html (accessed on 13 May 2021).
- Vehtari, A.; Gabry, J.; Magnusson, M.; Yao, Y.; Bürkner, P.; Paananen, T.; Gelman, A. Loo: Efficient Leave-One-out Cross-Validation and WAIC for Bayesian Models. 2020. Available online: https://mc-stan.org/loo/ (accessed on 13 May 2021).
- van Mantgem, P.J.; Das, A.J.; Stephenson, N.L.; Caprio, A.C. Forest Structure Data for Burned and Unburned Sites at Sequoia and Kings Canyon National Parks: U.S. Geological Survey Data Release. Available online: https://www.sciencebase.gov/catalog/item/60f1fb92d34e93b36670ed08 (accessed on 13 May 2021).
- Buonanduci, M.S.; Morris, J.E.; Agne, M.C.; Harvey, B.J. Neighborhood context mediates probability of host tree mortality in a severe bark beetle outbreak. Ecosphere 2020, 11, e03236. [Google Scholar] [CrossRef]
- Thistle, H.W.; Peterson, H.; Allwine, G.; Lamb, B.; Strand, T.; Holsten, E.H.; Shea, P.J. Surrogate pheromone plumes in three forest trunk spaces: Composite statistics and case studies. For. Sci. 2004, 50, 610–625. [Google Scholar]
- Das, A. The effect of size and competition on tree growth rate in old-growth coniferous forests. Can. J. For. Res. 2012, 42, 1983–1995. [Google Scholar] [CrossRef]
- Furniss, T.J.; Das, A.J.; van Mantgem, P.J.; Stephenson, N.L.; Lutz, J.A. Crowding, climate, and the case for social distancing among trees. Ecol. Appl. 2021, in press. [Google Scholar]
- Knapp, E.E.; Bernal, A.A.; Kane, J.M.; Fettig, C.J.; North, M.P. Variable thinning and prescribed fire influence tree mortality and growth during and after a severe drought. For. Ecol. Manag. 2021, 479, 118595. [Google Scholar] [CrossRef]
- Steel, Z.L.; Goodwin, M.J.; Meyer, M.D.; Fricker, G.A.; Zald, H.S.J.; Hurteau, M.D.; North, M.P. Do forest fuel reduction treatments confer resistance to beetle infestation and drought mortality? Ecosphere 2021, 12, e03344. [Google Scholar] [CrossRef]
- Barth, M.A.F.; Larson, A.J.; Lutz, J.A. A forest reconstruction model to assess changes to Sierra Nevada mixed-conifer forest during the fire suppression era. For. Ecol. Manag. 2015, 354, 104–118. [Google Scholar] [CrossRef]
- Trugman, A.T.; Anderegg, L.D.L.; Anderegg, W.R.L.; Das, A.J.; Stephenson, N.L. Why is tree drought mortality so hard to predict? Trend Ecol. Evol. 2021, 36, 520–532. [Google Scholar] [CrossRef] [PubMed]


| Data Source | Plot Status | Plot Count | Year of Fire | Stem Density (ha) | QMD (cm) | BA (m2 ha−1) | Elevation (m) |
|---|---|---|---|---|---|---|---|
| FMH | Burned | 20 | 2003 (1990 to 2007) | 140 (10 to 270) | 73 (47 to 252) | 55 (9 to 478) | 2030 (1878 to 2421) |
| Unburned | 8 | - | 225 (120 to 420) | 53 (44 to 256) | 70 (26 to 619) | 2116 (1869 to 2256) | |
| FMH | Burned | 26 | 2002 (1969 to 2007) | 200 (50 to 780) | 57 (32 to 232) | 64 (21 to 362) | 2039 (1707 to 2330) |
| supplemental | Unburned | 32 | - | 335 (60 to 530) | 58 (36 to 108) | 74 (16 to 262) | 1963 (1701 to 2404) |
| FFS | Burned | 34 | 2001 (2001 to 2002) | 135 (43 to 352) | 66 (32 to 118) | 45 (7 to 100) | 2025 (1928 to 2156) |
| Unburned | 30 | - | 256 (91 to 418) | 55 (38 to 72) | 54 (22 to 89) | 1956 (1909 to 2150) | |
| SNFDPN | Burned | 5 | 2001 (2001 to 2004) | 104 (47 to 143) | 77 (58 to 93) | 48 (29 to 52) | 2128 (2018 to 2202) |
| Unburned | 10 | - | 210 (56 to 304) | 58 (49 to 115) | 58 (15 to 155) | 2117 (1941 to 2405) |
| Species Group | Plot Status | Live | Dead | dbh (cm) | Elevation (m) |
|---|---|---|---|---|---|
| Fir | Burned | 1871 | 206 | 22 (2.5 to 232.5) | 2124 (1707 to 2400) |
| Unburned | 5448 | 991 | 12 (2.5 to 177.5) | 2086 (1701 to 2405) | |
| Pine | Burned | 325 | 38 | 18 (2.5 to 152.5) | 2023 (1707 to 2256) |
| Unburned | 469 | 136 | 18 (2.5 to 237.5) | 1941 (1701 to 2405) |
Publisher’s Note: MDPI stays neutral with regard to jurisdictional claims in published maps and institutional affiliations. |
© 2021 by the authors. Licensee MDPI, Basel, Switzerland. This article is an open access article distributed under the terms and conditions of the Creative Commons Attribution (CC BY) license (https://creativecommons.org/licenses/by/4.0/).
Share and Cite
van Mantgem, P.J.; Caprio, A.C.; Stephenson, N.L.; Das, A.J. Forest Resistance to Extended Drought Enhanced by Prescribed Fire in Low Elevation Forests of the Sierra Nevada. Forests 2021, 12, 1248. https://0-doi-org.brum.beds.ac.uk/10.3390/f12091248
van Mantgem PJ, Caprio AC, Stephenson NL, Das AJ. Forest Resistance to Extended Drought Enhanced by Prescribed Fire in Low Elevation Forests of the Sierra Nevada. Forests. 2021; 12(9):1248. https://0-doi-org.brum.beds.ac.uk/10.3390/f12091248
Chicago/Turabian Stylevan Mantgem, Phillip J., Anthony C. Caprio, Nathan L. Stephenson, and Adrian J. Das. 2021. "Forest Resistance to Extended Drought Enhanced by Prescribed Fire in Low Elevation Forests of the Sierra Nevada" Forests 12, no. 9: 1248. https://0-doi-org.brum.beds.ac.uk/10.3390/f12091248