
Wildfire Risk Assessment and Zoning by Integrating Maxent and GIS in Hunan Province, China


School of Geography and Ocean Science, Nanjing University, Nanjing 210023, China
*
Author to whom correspondence should be addressed.
Forests 2021, 12(10), 1299; https://0-doi-org.brum.beds.ac.uk/10.3390/f12101299
Submission received: 9 August 2021
/
Revised: 17 September 2021
/
Accepted: 21 September 2021
/
Published: 23 September 2021
(This article belongs to the Topic The Future of Wildfires: Latest Geo-Technologies Applied to Fires and a New Perspective of Forest Resilience)
Abstract
:Forest wildfire is an important threat and disturbance facing natural forest ecosystems. Conducting wildfire risk assessments and zoning studies are of great practical significance in guiding wildfire prevention, curbing fire occurrence, and mitigating the environmental effects of wildfire. Taking Hunan Province, China as the case area, this study used remotely sensed high-temperature fire data as the wildfire sample. Twelve factors related to topography, climatic conditions, vegetation attributes, and human activities were used as environmental variables affecting wildfire occurrence. Then, a Maxent wildfire risk assessment model was constructed with GIS, which analyzed the contribution, importance, and response of environmental variables to wildfire in Hunan Province. The results show that (1) the Maxent model has high applicability and feasibility when applied to wildfire risk assessment after a test of wildfire sample sites; (2) the importance of meteorological conditions and vegetation status variables to wildfire are 54.64% and 25.40%, respectively, and their contribution to wildfire are 43.03% and 34.69%, respectively. The interaction between factors can enhance or weaken the contribution of factors on wildfire. (3) The mechanism for the effects of environmental variables on wildfire is not linear as generally believed; temperature, aridity, land use type, GDP, distance from the road, and population density have a nonlinear positive correlation with the probability of wildfire occurrence. Elevation, slope, precipitation, wind speed, and vegetation cover within the suitable interval positively contribute to the probability of wildfire, while the environmental conditions outside the suitable interval curb the occurrence of wildfire. The response of wildfire probability to forest density is U-shaped, which means either too high or too low will promote the occurrence of wildfire. (4) There is geographical variation of wildfire risk in Hunan Province. The areas at high risk and below account for 74.48% of the total area, while the areas at significantly high risk and above account for a relatively low proportion, 25.52%.
1. Introduction
Wildfires are one of the important disturbance factors in forested ecosystems and create the greatest potential for natural disaster related to natural, biological, and ecological processes globally [1,2,3]. Globally, thousands of wildfires occur annually, and more than a million hectares of forests are burned, which seriously disrupts the ecological balance and poses a great threat to socioeconomic development and human safety [4], although a wildfire may improve the soil carbon stock or soil fertility. Wildfires destroy surface vegetation and accumulated dry matter; release large amounts of greenhouse gases, particulate matter, and trace gases; alter regional microclimates, soil structure, and nutrients; destroy plant and animal habitats; and exacerbate soil erosion and air pollution [5]. Fires are important drivers of global climate change [6,7,8]. In the case of China, 2345 fires burned forested areas as large as 1.35 × 10⁴ ha, of a total forest area of 2.08 × 10⁸ km2, in 2019, with an incidence of 11.27 wildfire per 10,000 km2 throughout China. Wildfire, together with deforestation and insect infestation, are important factors related to forest environmental balance in China. Scientific forecasting and monitoring of wildfire are of great practical importance in supporting efforts to curb the occurrence of wildfire and reduce wildfire losses. As a part of wildfire risk assessment, zoning studies provide an important scientific basis for building wildfire risk defense systems, deploying fire prevention forces, and guiding wildfire prevention work. Fire risk evaluation has received an increasing amount of attention from many scholars and international organizations [9,10].
With nearly a century of unremitting efforts, research on wildfire has made great progress in wildfire monitoring, the analysis of driving factors, and the development of risk assessment models and forecasting systems. (1) In terms of wildfire detection, traditional measures such as ground-based observation towers, monitoring stations, and ground patrols have played an active role in the early detection of wildfire occurrence. With technological advances in aviation platforms and sensors, objective, efficient, and rapid remote sensing technology is widely applied to the detection and monitoring of wildfires. A large number of remote sensors have the capability of monitoring wildfire [11], such as the Moderate Resolution Imaging Spectroradiometer Airborne Simulator [12], airborne laser scanning [13], Carnegie Airborne Observatory [14], National Ecological Observatory Network-Airborne Observation Platform [15], the US National Aeronautic and Space Administration’s Goddard light detection and ranging (LiDAR) hyperspectral thermal sensor [16], and the Chinese Academy of Forestry LiDAR–CCD–Hyperspectral Sensor [17]. Thanks to recent improvements in space observation technology and computing power, wildfire signals, such as thermal infrared radiation signal, fire radiation energy, fire area, interval, fire size, and spread rate, can be effectively recorded [9,18,19]. (2) Regarding the drivers of wildfire, evidence indicates that topography, vegetation, combustible materials, meteorological factors, human activities, and fire sources are the main environmental factors determining the likelihood of a wildfire being started. The spatiotemporal resolutions of these factors have a significant impact on wildfire risk prediction, and inputting more and higher spatiotemporal resolution data related to environmental factors can effectively improve the explanatory power and confidence level of wildfire risk prediction models [20,21,22]. (3) A wealth of research results exists on wildfire risk assessment and prediction models. Scholars have established statistical models, such as logistic regression [23] (LR), geographically weighted logistic regression [24](GWLR), and gompit [25]; artificial neural network models, such as a back-propagation neural network [26]; and machine learning methods, such as the random forest model [27,28], Maxent [29], and Bayesian network [4,30], through empirical analysis of case areas. These are based on datasets, such as the number of wildfire occurrences or burnt areas, and environmental factors. (4) With recent research on wildfire forecasting, countries have developed wildfire risk weather forecasting systems and released the results of wildfire risk analysis and levels within regions in real time for guiding daily wildfire prevention work. For example, the United States and Canada developed wildfire risk ranking systems in 1972 [31,32], that include the national fire danger rating system of the US and the Canadian Wildfire Danger Rating System. In addition, the Chinese government has published a ranking of the regionalization on nationwide wildfire risk in 2008 and established a forecast system of wildfire weather ranks (http://slcyfh.mem.gov.cn/index.aspx (accessed on 1 September 2021) provides details).
As an important research element in wildfire monitoring and prediction, wildfire risk zoning is an important early warning technology that can provide a scientific basis for wildfire protection, monitoring, and fighting [23,33]. Wildfire risk zoning involves the classification of forest areas into different levels of zones of wildfire risk based on the quantitative relationship between wildfire and environmental factors. In addition to increasing the density of known wildfire samples and improving the spatiotemporal resolution of relevant environmental factors, the development of quantitative assessment models is important in making wildfire risk zones reliable. Among them, the maximum entropy (Maxent) model is a more advanced model that has been successfully applied in wildfire risk zoning research internationally in recent years. Jaynes proposed the Maxent model based on Shannon’s information entropy principle. Maxent uses environmental variables and known sample information at a single point in time to select the distribution with the highest entropy from each environmental variable as the optimal distribution. The model is constructed to predict the spatial distribution of sample events [29,34]. The Maxent model has been successfully applied to wildfire zoning studies because it is simply constructed, easy to apply, and has a low input data requirement [35,36]; this machine learning method has been initially reported in empirical case studies of wildfire risk zoning in China [29,37].
In view of this, the present study took Hunan Province as the case area, adopting remotely sensed high temperature fire locations from 2016–2020 as a sample set of wildfire after the data had been converted, screened, and validated. The study selected 12 factors from the four aspects of fire as environmental variables that control the rate and intensity of fire spread to construct a wildfire risk assessment model based on Maxent with GIS technical support. Those four aspects included topography, climatic conditions, vegetation attributes, and human activities. The model was used to analyze the contribution, importance, and response relationship of environmental variables to wildfire, and to carry out wildfire risk level assessment and zoning in Hunan Province. The main objectives of this study are: (1) to construct a model framework for wildfire risk assessment; (2) to investigate the response mechanisms of wildfire to relevant environmental factors; and (3) to quantitatively visualize the potential wildfire risk levels and develop fire risk zone mapping. It is hoped that this study will provide a basis for wildfire risk prevention and management in Hunan Province.
2. Materials and Methods
2.1. Study Area
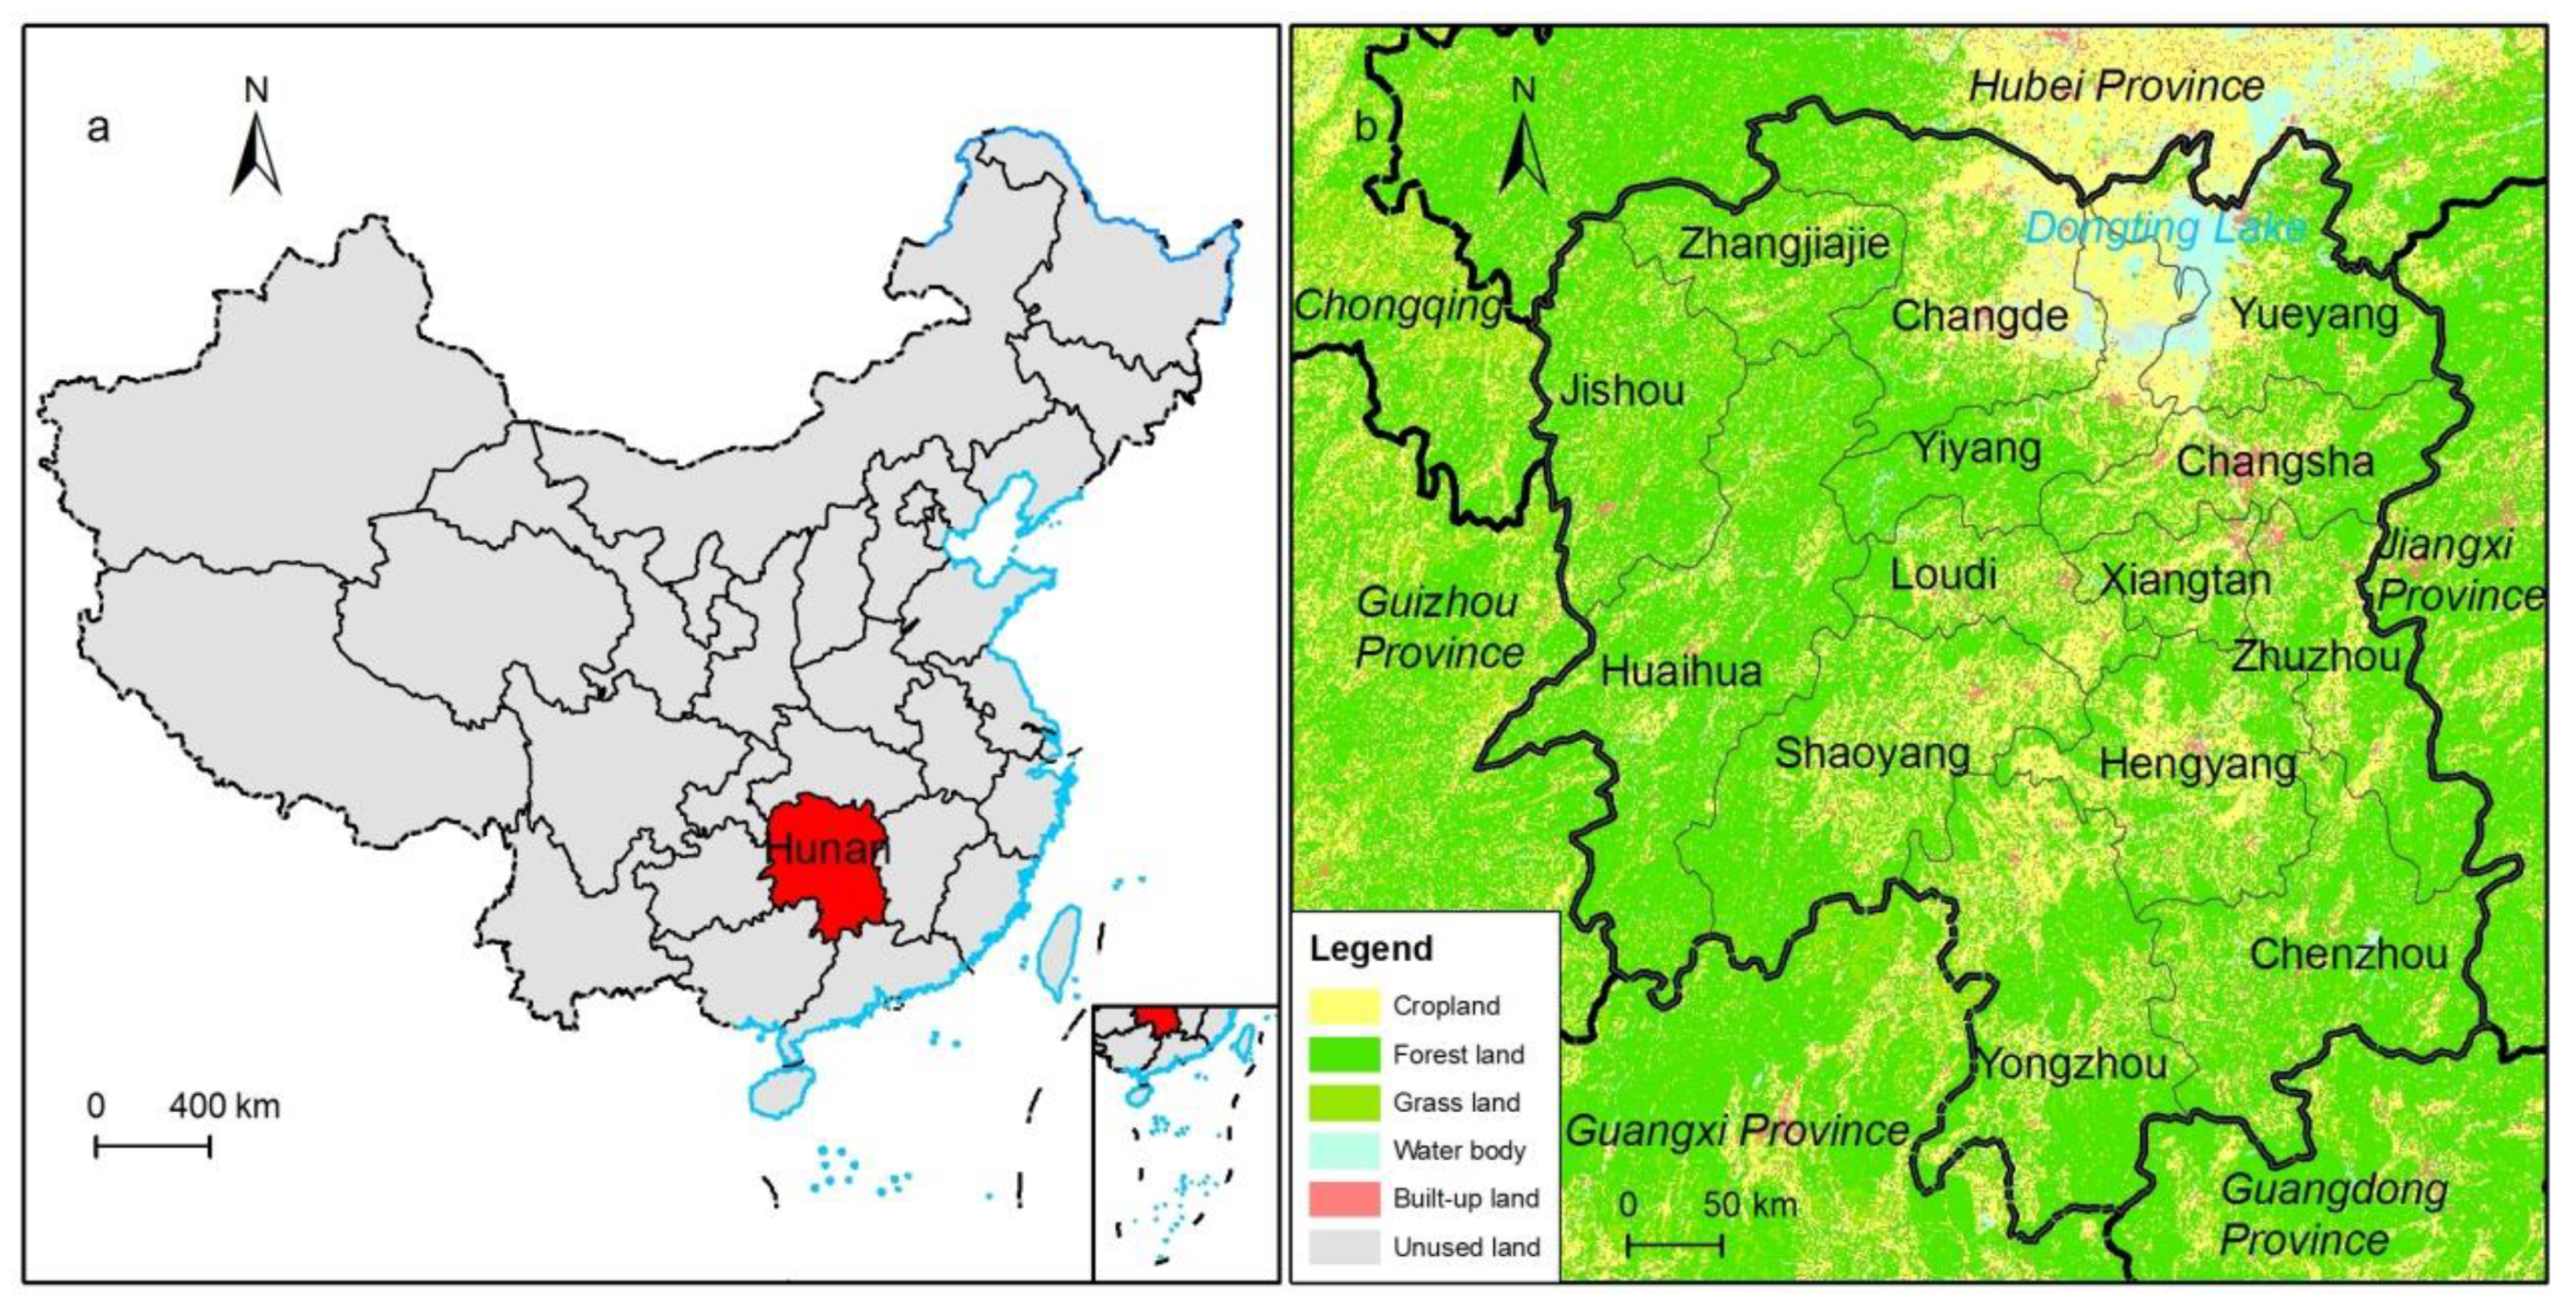
Hunan Province is located in the middle reaches of the Yangtze River in central China at 24°38′–30°08′ N and 108°47′–114°15′ E and covers an area of 21.18 × 10⁴ km2 (Figure 1a). Landform types include plains, basins, hills, and mountains. Hunan Province, located in subtropical monsoon climate zone, features an annual precipitation of 1063–1979 mm and an average annual temperature of 16–23 °C. The province’s topographical and hydrothermal conditions are suitable for forest growth. Hunan is rich in forest resources, mainly subtropical evergreen broad-leaved forest vegetation, concentrated in the areas of Huaihua, Shaoyang, Chenzhou, and Zhangjiajie. At the end of 2019, the forest area of Hunan Province reached 1300 × 104 ha or 59.90% forest coverage (Figure 1b), the province’s forestry output value reached 5029.77 × 108 RMB, and the live timber stock volume amounted to 5.95 × 10⁸ m3, accounting for 3.28% of the national live timber stock volume. Hunan Province occupies an important place in terms of the forest area and live timber stock volume. The wide distribution of forests and the intense human activities of the province have resulted in an annual forest area damage rate of wildfire in Hunan Province of 0.06‰, which makes it one of the key provinces requiring forest wildfire prevention in China.
2.2. Wildfire Disaster-Causing Mechanisms
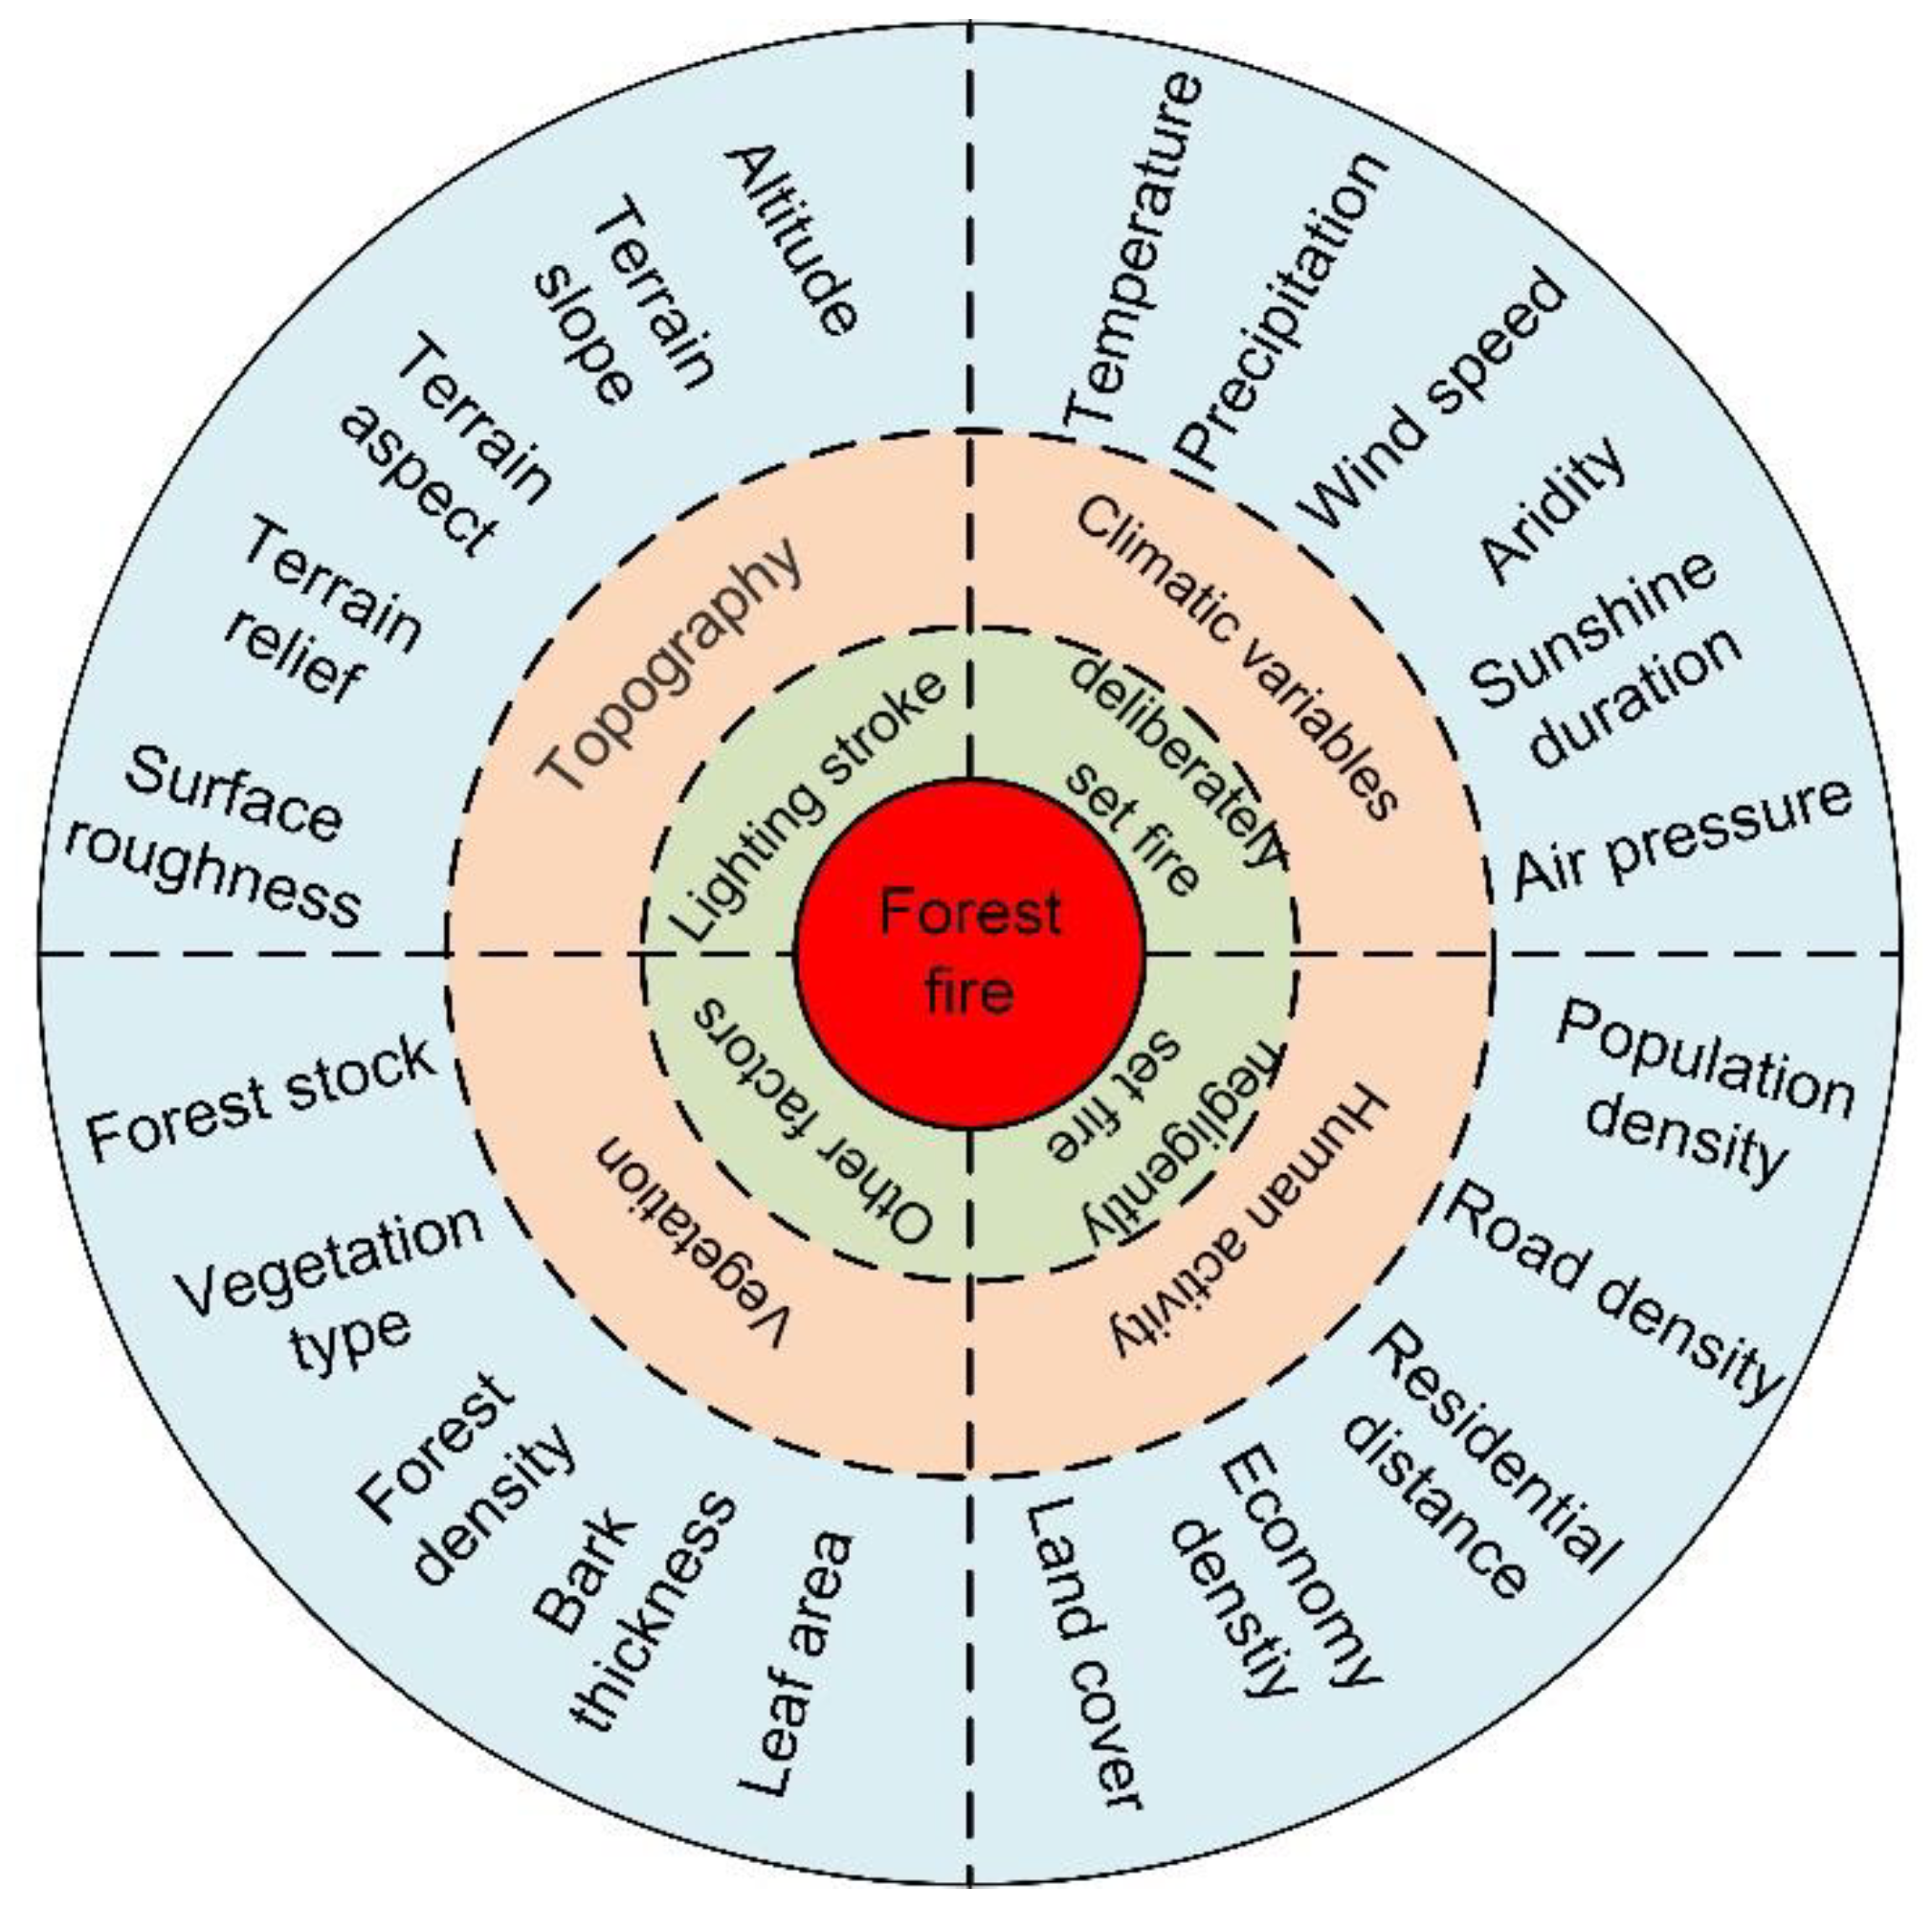
Wildfires occur very suddenly, often with unpredictable results. A review of existing studies shows that the causes of wildfire can be categorized into four aspects: natural lightning, arson, accidental fire ignition—perhaps caused by negligence—and others [6]. In terms of the mechanisms involved in wildfire, in addition to factors related to ignition, the properties of the factors creating disasters themselves and the surrounding environmental conditions are the main drivers of fires that can spread rapidly and cause significant losses. Among them, landform types, climatic conditions, vegetation attributes, and human activities are important fire risk factors that affect the intensity and rate of spread of a wildfire [7,33,38,39,40]. Specifically:
- (1)
- Topography can affect the occurrence and development of wildfire in many ways. Geographical units with different terrain, elevation, slope, aspect, and relief, by affecting the spatial distribution of climatic factors such as moisture, light, and heat will affect the vegetation cover density, moisture accumulation, as well as the aridity and humidity of surface forest vegetation. This provides different types of combustible reserves and dry matter types that affect the nature of wildfire. Furthermore, when a wildfire occurs, variations in terrain will cause different degrees of interference and difficulties when humans attempt to control and extinguish a fire. Terrain can contribute to the spread of wildfire and delay firefighting opportunities and operations.
- (2)
- Climatic conditions vary at spatiotemporal scales and are very heterogeneous spatially, but they are the important factors contributing to the nature of a wildfire. Studies have shown that temperature, humidity, wind speed, and aridity have significant effects on wildfire [33]. An increase in temperature increases the temperature of combustible materials and reduces the heat required for combustible materials to reach the ignition point, thus greatly increasing any wildfire risk index. Similarly, precipitation is positively correlated with the water content of combustible materials. An increase in precipitation increases the relative humidity of air and reduces the dryness of combustible materials, thus significantly increasing the heat required for combustible materials to reach the ignition point and therefore reduces wildfire risk. Wind speed is the main factor that determines where a fire will burn and how rapidly a wildfire will spread. Greater wind speeds will help to cause a greater number of uncontained fires, and the fire situation in a period of high winds will become more dangerous.
- (3)
- One of the three conditions needed for a wildfire to occur is the presence of combustible material, the amount and nature of which can greatly affect the occurrence and development of fires. The other two things a fire needs are an ignition source and oxygen. Forest vegetation, as the main fuel for fires, is an important environmental factor affecting the distribution of wildfire. Differences in vegetation attributes, such as vegetation type, vegetation cover, dryness of combustible materials, and types of combustible materials present have different effects on the accumulation of combustible material, the rate of wildfire spread, and the potential release of energy [41].
- (4)
- Human activities significantly influence the occurrence of wildfire, such as by influencing surface vegetation types, changing the state of combustible materials, actively producing fire sources, and fire suppression efforts. Currently, the main factors often used to characterize the impact of human activities on wildfire are population density, arable land area, gross national product per capita, livestock load, road density, and distance from roads.
Based on the above analysis, the mechanism and factors influencing the relationships involved in wildfire are shown in Figure 2.
2.3. Maxent Based Fire Risk Assessment
The Maxent model is a density estimation and event distribution prediction model based on the maximum entropy theory, which has the advantages of providing stable operation results and a short operation time. In predicting the suitable distribution interval of events, a Maxent model can still provide a simulation with reasonable results by collecting known geographical distribution information of events and relevant environmental factors, but without making assumptions and speculations related to unknown information, even if data about the events are partially missing or the sample size is small [42]. The spatial distribution of wildfire is influenced by whether a suitable distribution of environmental variables exists that would allow a fire to spread. So, the Maxent model can be used to assess and predict fire danger zones. Two types of data are required for wildfire risk assessment. One is the known actual distribution of sample points of wildfire X, which is to be predicted, expressed in latitude and longitude; the other includes various environmental variables Y within the distribution range of wildfire. The environmental variables data require the model to use the same level of resolution for each cell. Otherwise, the model will not operate properly. Suppose the wildfire X to be predicted takes the value X = (x1, x2,…, xn); then, the information entropy of X can be calculated using Equation (1):
The spatial distribution of wildfire X is influenced by the environmental variable Y. The training sample set (X|Y) consisting of environmental variable Y and wildfire X can be obtained by superimposing the environmental variable Y with the known spatial location of wildfire X. Then, after the environmental variable Y is introduced, the probability and information of Y’s influence on the spatial distribution of X will change, at which time the information entropy of X becomes the conditional probability influenced by the environmental variable Y (Equation (2)):
The Maxent model considers that the probability information entropy that satisfies all known conditions and makes no assumptions about the unknown cases is the largest, and the distribution will be the most uniform, at which time the risk of the predicted outcome is the smallest. The Maxent model is finally trained based on the input database of known samples and the objective function (Equation (3)).
The model is continuously trained by a random seed generation algorithm and obtains the parameters in the maximum entropy, making its calculated values close to the actual value data. To obtain better results, these original samples are split into two different types of samples (training samples and testing samples) to facilitate cross-validation. The probability of suitability of the model for a single training event is often subject to some level of chance, and the average of multiple trainings is more reasonable as the final result [34].
The area under the relative operating characteristics (ROC) curve (AUC) was used to determine the accuracy of the Maxent model. The AUC is the enclosed area between the ROC curve and the abscissa, with its value usually set to be 0.5 to 1.0. The larger the value, the stronger the prediction ability of the model; an AUC of 0.5 is equivalent to a completely random prediction, and an AUC of 1 is a perfect prediction. An AUC value between 0.5 and 0.6 means that the model fails, and the model itself does not have predictive power; a value between 0.6 and 0.7 indicates poor prediction. An AUC value between 0.7 and 0.9 indicates moderate prediction; a value of >0.9 indicates a model with very good predictive accuracy [43].
2.4. Influence Variables and Pre-Processing
2.4.1. Wildfire Locations
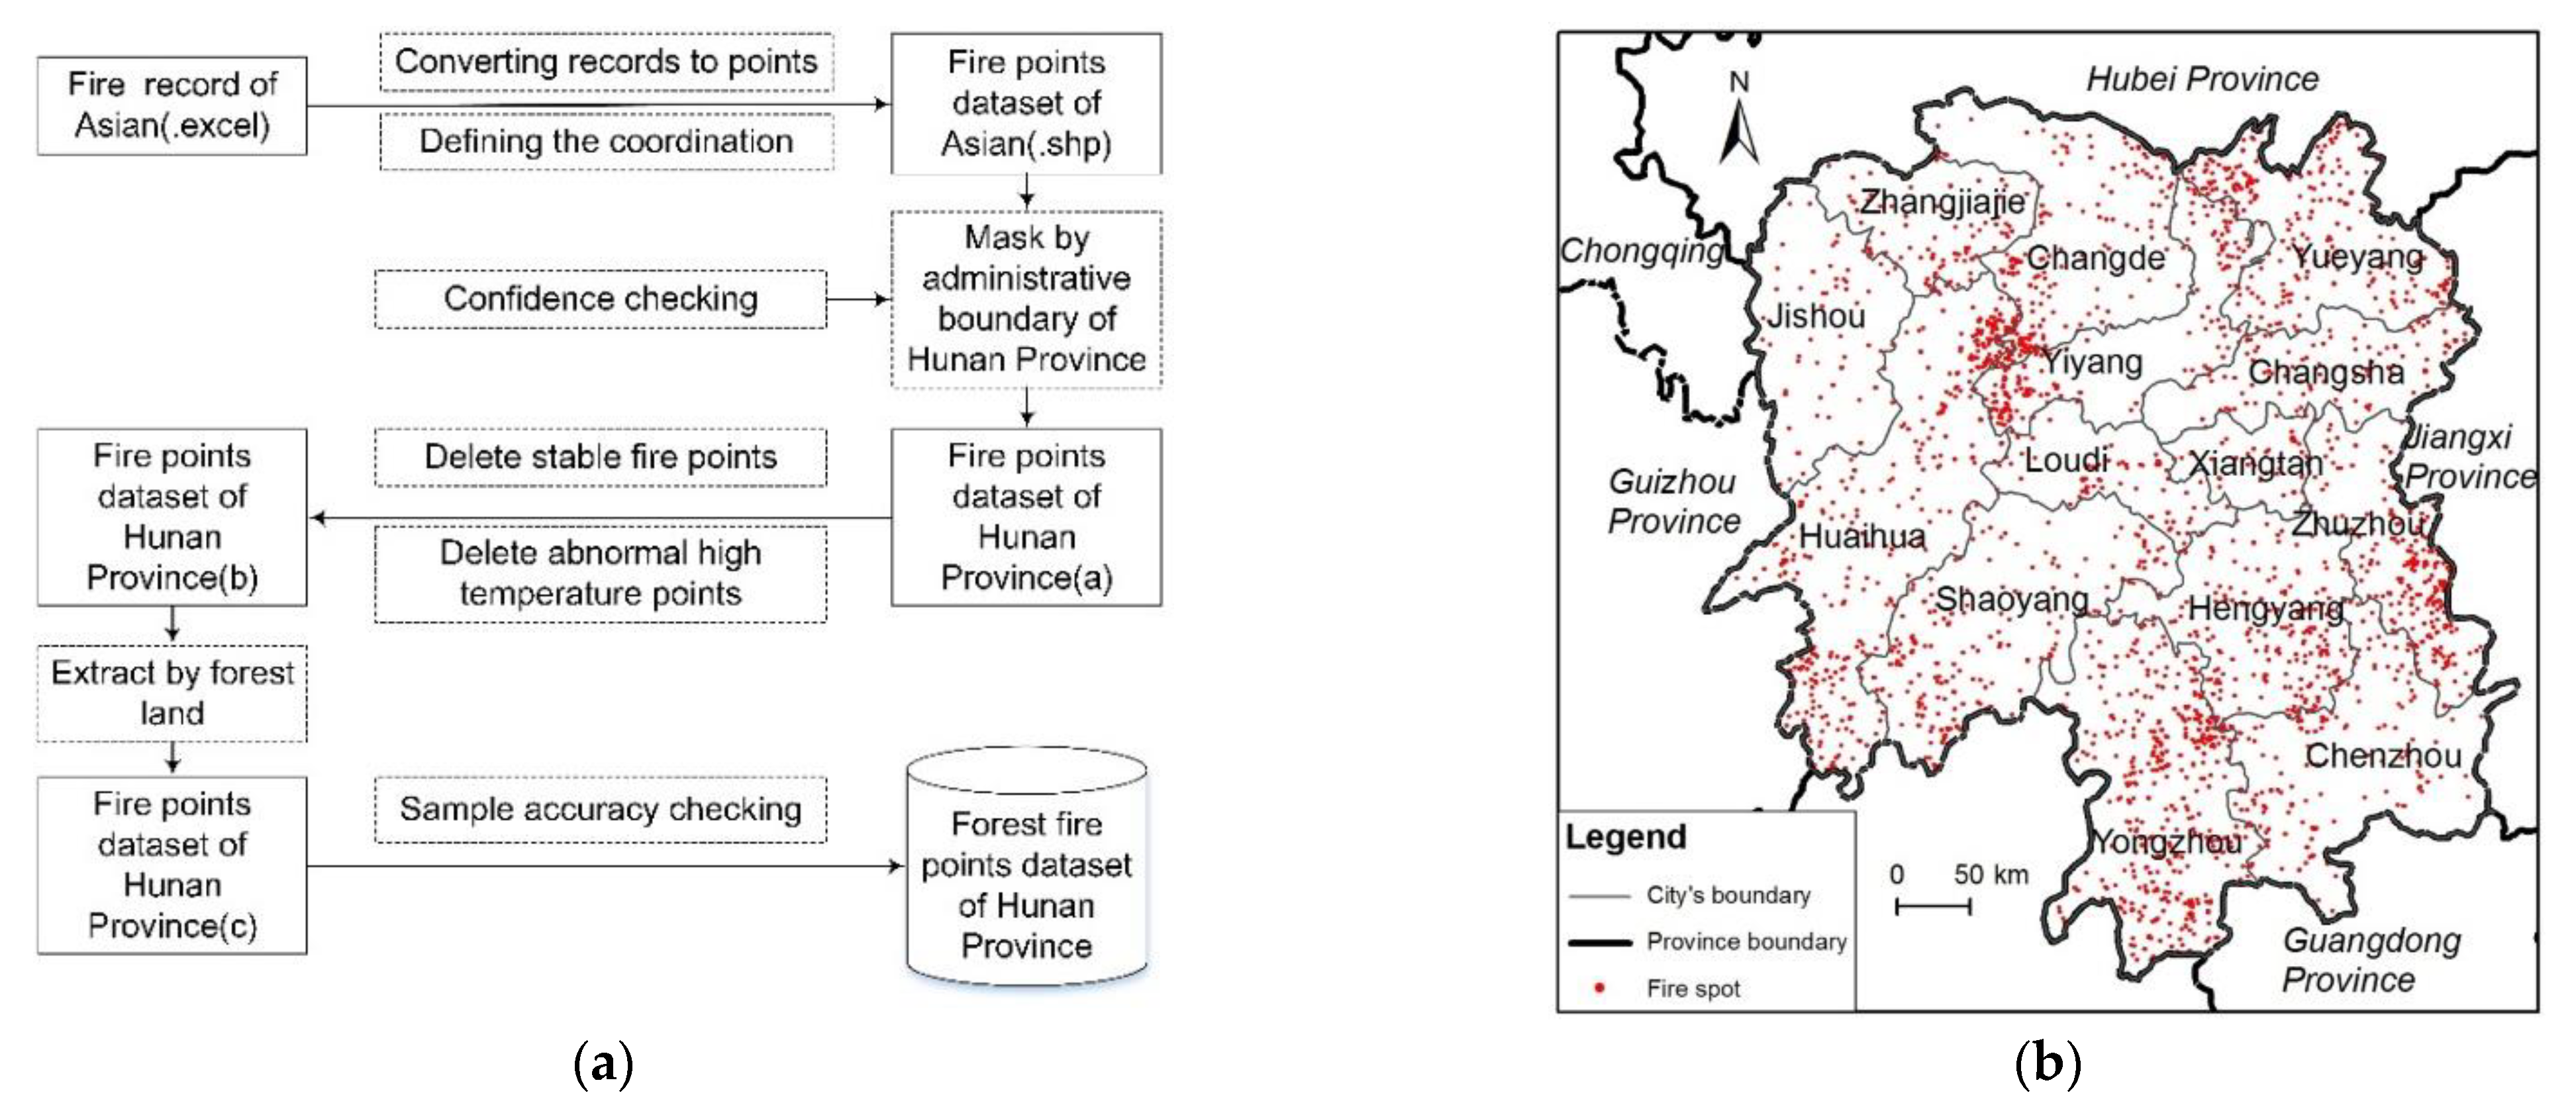
The known sample dataset used in the study, a wildfire location dataset, came from SatSee-Fire, a near real-time surface temperature anomaly location tracking system published by the Institute of Remote Sensing and Digital Earth, Chinese Academy of Sciences. Data were acquired for the period of 1 January 2014 to 31 December 2020 (December data were missing for the first 3 years); this dataset includes the anomalous high temperature locations extracted by He et al. (2016) using Landsat remote sensing observational data such as Landsat-7/8 and Sentinel-2, based on the spectral characteristics of high temperature fire locations in the near-infrared and short-wave infrared bands [44]. They used a threshold adaptively determined by the results of a normalized burning vegetation index to extract anomalous high temperature locations; the attribute information included the high temperature location ID, longitude, latitude, capture date, inversion temperature, inversion area, and confidence. The original fire location dataset contains high temperature anomalies such as wildfire, industrial chimney fires, oil field fires, field straw fires, and wildfire that occurred in the last 6 years in the Asian region and was in text format. Data pre-processing is required before extracting wildfire locations: first, the text data of anomalous high temperature locations in Asian region day by day from the above time period were transformed into vector point data, defined as Lambert projection. Next, suspected fire locations with confidence below the threshold were removed to extract any information related to anomalous high temperature locations within the land area of Hunan Province. Then, stable fire locations (i.e., multiple similar high-temperature fire locations, including chimney fire locations recorded at different sites in the same location) in the fire location dataset were eliminated using Python programming. Finally, using the forest map of fire locations of Hunan Province as a mask, the fire locations falling within the forest land were extracted, i.e., a spatial dataset of wildfire locations in Hunan Province was constructed (Figure 3a). A total of 8146 wildfire location points (not the burned area) in Hunan Province occurring over the last seven years were identified and distributed in 2501 cells (Figure 3b).
2.4.2. Environmental Variables
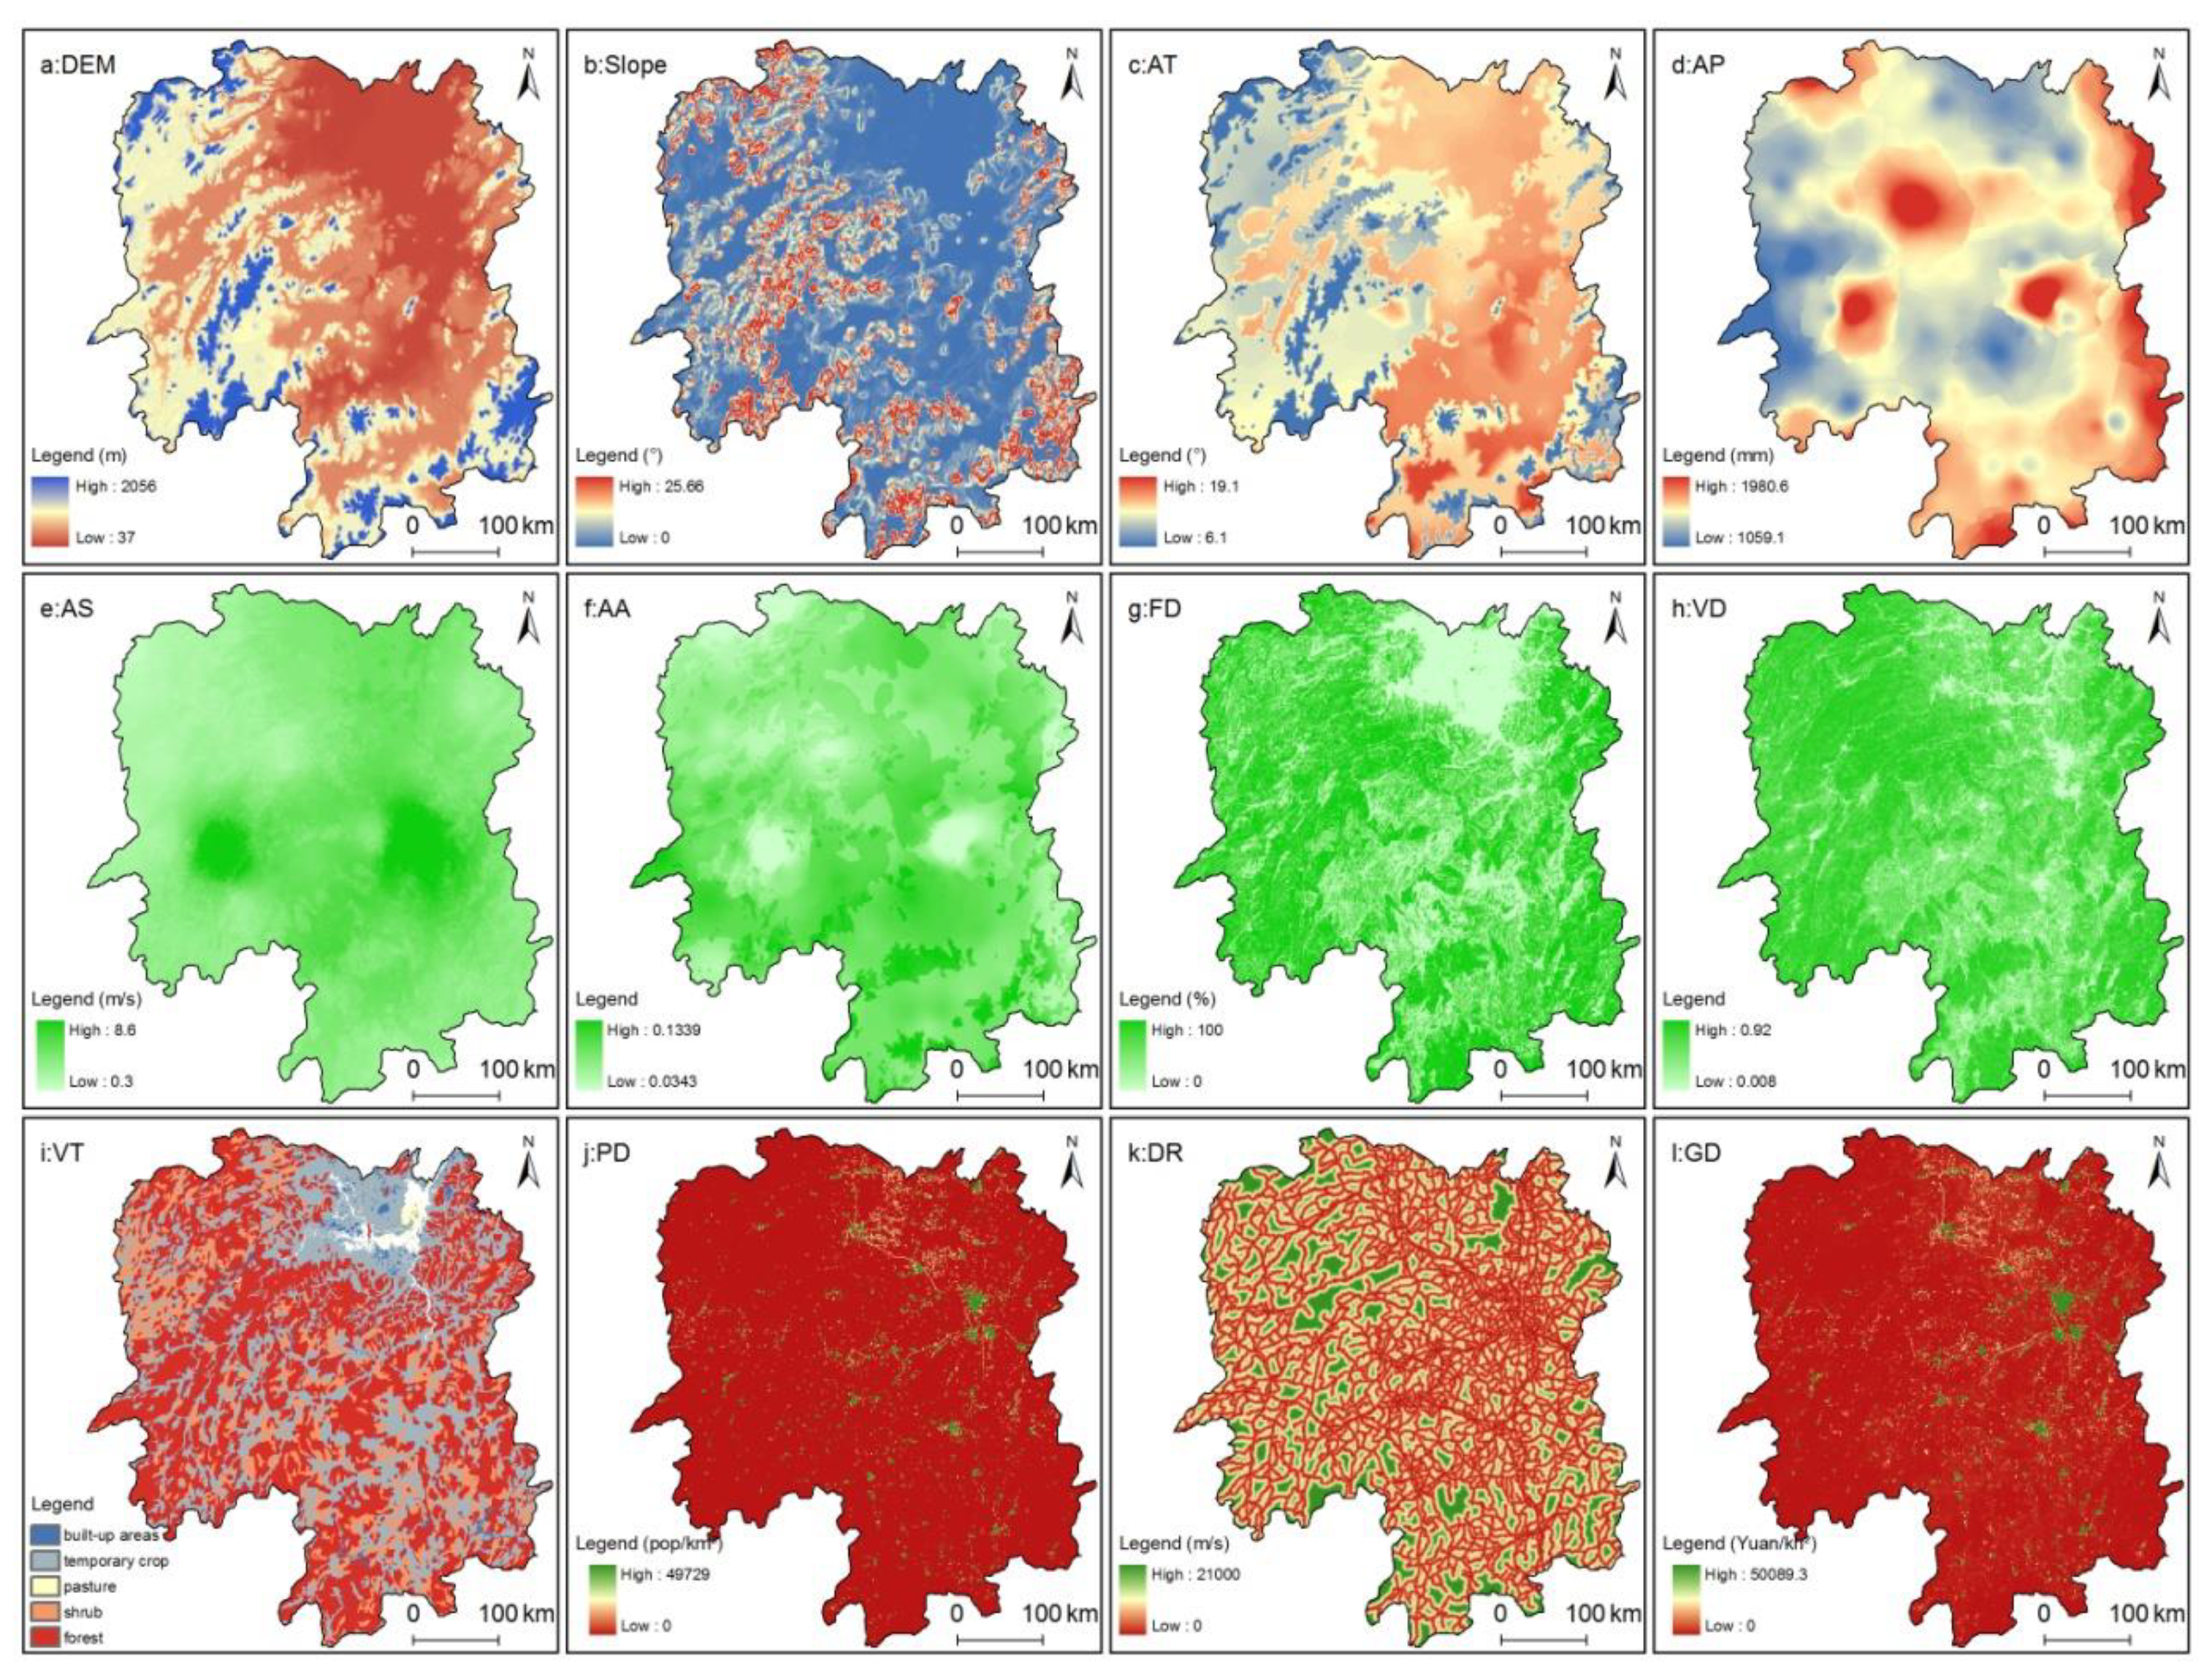
Based on the above analysis and the corresponding literature [23,37,45,46], 12 factors were selected in the present study as factors that influence wildfire risk. These included topography (elevation and slope), climatic conditions (average annual temperature, precipitation, wind speed, and aridity), vegetation attributes (proportion of forested land, vegetation cover, and vegetation type), and human activities (population density, distance from the nearest road, and GDP density). The data required were obtained from the Resource and Environment Science and Data Center (http://www.resdc.cn/ (accessed on 22 May 2021)) of China, the National Earth System Science Data Center (http://www.geodata.cn/ (accessed on 22 May 2021)) of China, and Google Map software. To avoid the influence of multiple co-linearities among the factors influencing fire behavior on the model results, all environmental variables were subjected to principal component analysis; the results show that no factors influencing fire behavior had a correlation >0.8 with any of the environmental factors [47]. The raster layers with uniform projection system and cells (1 km × 1 km) were plotted in ArcGIS 10.3 from ESRI (USA) and were spatially correlated with the previously produced wildfire data from 2014–2019 in Hunan Province (wildfire locations from 2020 were used to test model accuracy). Finally, a Maxent model was generated for the required wildfire variables (using shape files in .shp format) and environmental variables (in .csv format) required for the Maxent model. The environment variables are shown in Table 1 and Figure 4.
2.5. Running the Maxent Model
A wildfire risk assessment model based on the Maxent model was established based on the abovementioned spatial distribution of documented wildfire and related environmental factors. In this study, Maxent version 3.4.1 was used for model calculations. During the analysis, 75% of wildfire in Hunan Province were used as a training dataset for establishing model parameters, and the remaining 25% was used as test data for model testing. The setting options of the software during runtime used the system default combination of parameters; the sample data were randomly selected. The output results obtained after running the Maxent model were visually converted in ArcGIS 10.3.(ESRI, Redlands, CA, USA) The output raster pixel value was between 0 to 1, representing the wildfire risk coefficient, where a larger value indicates higher fire risk.
3. Results and Analysis
3.1. Influence of Environmental Factors on Fire Risk
The ROC curve was used to test the results from running the model. The AUC values obtained from the training and test dataset were 0.816 and 0.802, respectively. Both were higher than 0.8, indicating that the wildfire prediction model constructed based on Maxent achieved high prediction accuracy and could meet the accuracy requirements for model use. The output of the Maxent model (Table 2) shows that the contribution of environmental variables characterizes the interaction between different environmental variables, in descending order of climatic conditions (43.03%), vegetation (34.69%), topography (12.19%), and human activities (10.09%). The importance of environmental variables characterizes the degree of influence of individual environmental variables on the model results, in descending order of climatic conditions (54.64%), vegetation (25.40%), human activities (12.11%), and topography (7.86%). One can see that the importance values of climatic conditions and human activities are higher than the contribution scores of the variables, while the opposite is true for topography and vegetation factors. This indicates that the interaction of environmental factors reduces the importance of climatic conditions and human activities in the model, while on the contrary, the importance of topography and vegetation variables increased. In terms of individual factors, average annual precipitation and temperature as well as vegetation cover density ranked as the top three in importance for wildfire. This indicates that climatic factors and the accumulation of combustible materials have an important effect on the occurrence of wildfire; in addition, the contributions of elevation, average annual temperature, average annual precipitation, wind speed, and forest density were all higher than 10%, reaching a combined total of 71.60%. Only the factor importance of average annual temperature and precipitation was greater than 10%, while the contributions of elevation, wind speed, and forest density were higher than the factor importance. This indicates that the importance of these three factors was increased by the interaction of environmental factors, while the importance of annual average temperature and precipitation was weakened more obviously by the interaction of the factors.
3.2. Relationships between Environmental Factors with Wildfire
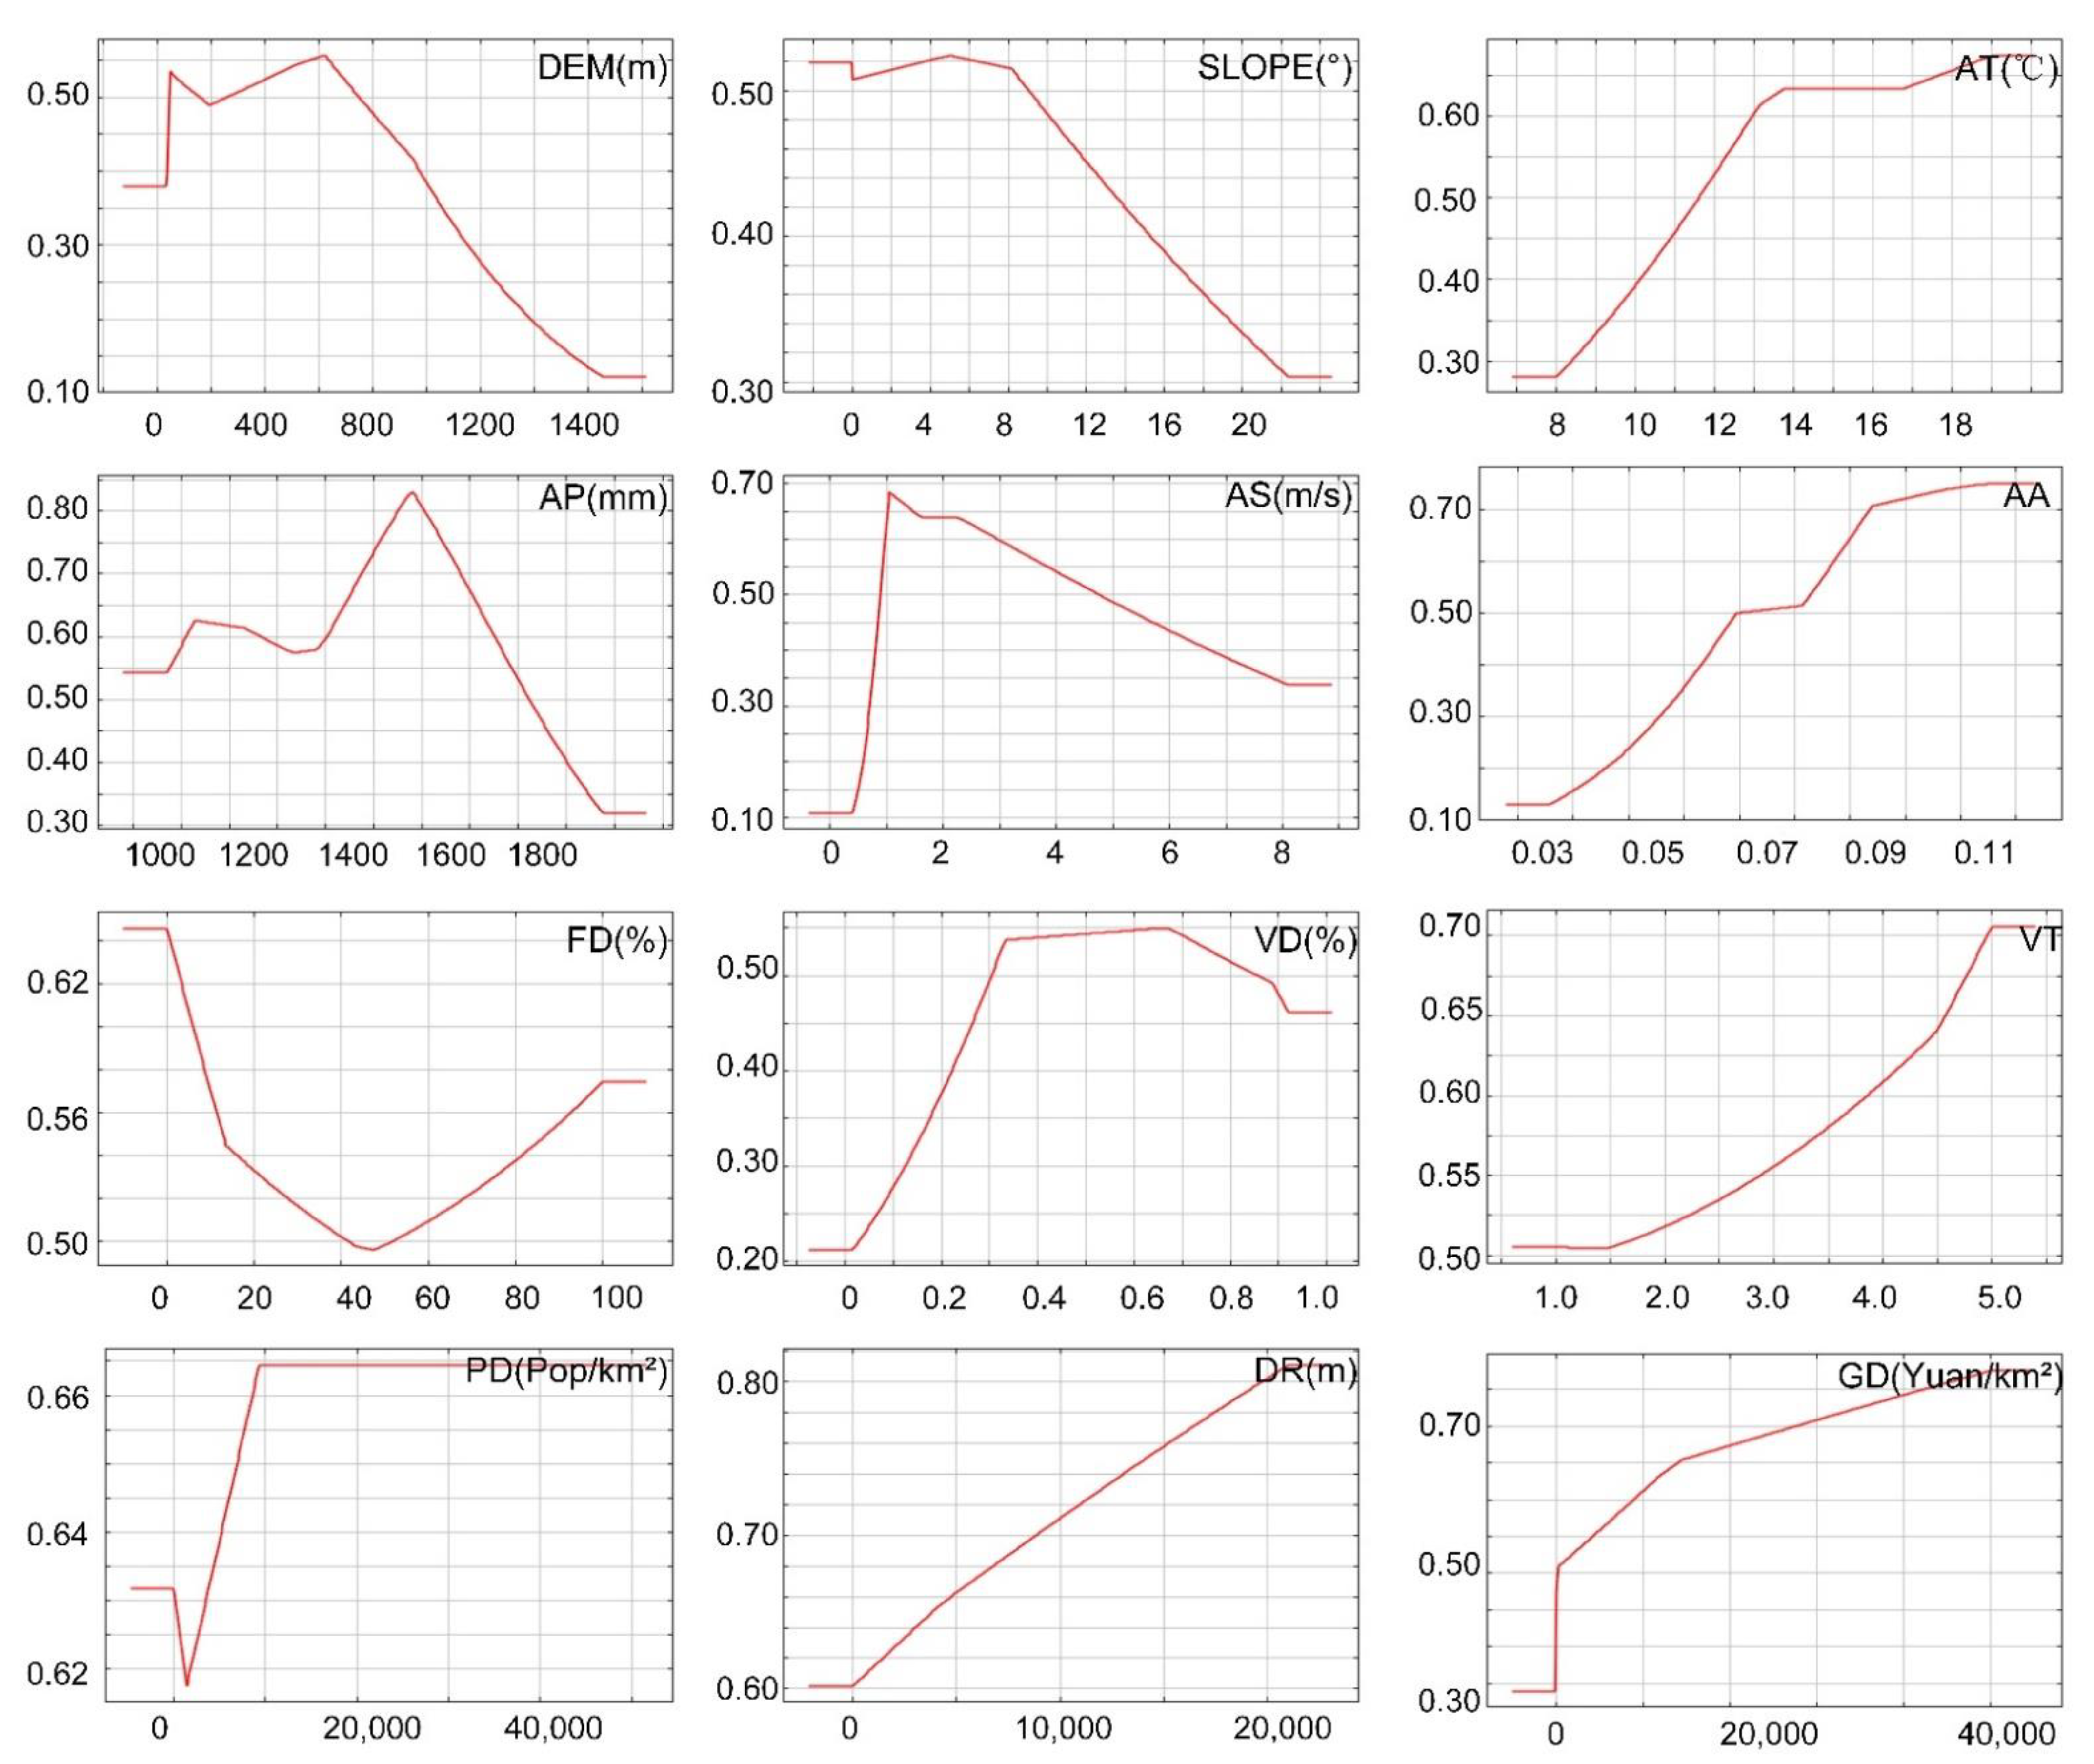
The environmental variable response curve (Figure 5) of wildfire in Hunan Province can be obtained. It can be seen from the figure that the impact mechanism of environmental variables on wildfire is complex and variable. The response curve of wildfire to all environmental variables is not linear but is a complex nonlinear relationship; the impacts of multi-year temperature, aridity, land use type, GDP density, and distance from road on wildfire are generally nonlinear and positively correlated, while the correlations of other environmental variables change significantly and differ from interval to interval. It is generally accepted that when there is a probability greater than 0.5, the value of the corresponding interval of environmental variables will contribute to the occurrence of wildfire. For individual factors, different environmental variables have their own suitable intervals related to their effects on contributing to the probability of the start and spread of wildfire.
- (1)
- The probability of wildfire increases and then decreases with increasing elevation. That is, wildfire is more likely to be distributed in low elevation areas, with the suitable interval being 40–780 m and 620 m being the most suitable elevation, which may be related to the fact that fewer human activities occur in high elevation areas. The probability of wildfire increases significantly as the slope increases from 0° to 9°, with a peak at about 5°, after which the probability of wildfire decreases sharply as the slope increases. Fires are more prone to occur on flat and gentle slopes, while the probability of wildfire on steep slopes is lower due to poor accessibility to humans who start fewer fires on steep slopes.
- (2)
- The average annual temperature plays a positive role in promoting wildfire; the probability of wildfire increases with increasing temperature. When the annual average temperature is higher than 11.7 °C, the probability of wildfire is greater than 0.5. When the annual average temperature is higher than 14 °C, the change in the probability of wildfire is not significant. Meanwhile, when the temperature is too low, the cumulative temperature of combustible materials is lower, so that more heat is needed to reach the point of ignition, so the probability of wildfire should be lower. As the temperature increases, the limiting factor that restricts the ignition of combustible materials may change from temperature to such factors as fire source, combustible material state, and precipitation.
- (3)
- The response of wildfire probability to aridity, land use type, GDP density, and distance from road is essentially similar to that of annual average temperature. The higher the aridity, the higher the probability of wildfire. When the land use type is dominated by forest, scrub, and other vegetation types, the accumulation of combustible materials is higher, and the probability of wildfire increases. Areas with a high GDP density will have more intense economic activity, creating a greater possibility of wildfire. The response mechanism of wildfire to distance from the nearest road conflicts with the past popular belief, i.e., the more distant the area from roads, the greater the possibility of fires; this may be related to the fact that an initial fire source is not easily detected or extinguished in areas farther from roads.
- (4)
- The suitable annual average precipitation interval for wildfire is from 1000 to 1830 mm, while an annual precipitation of 1580 mm is the most suitable peak for wildfire to occur. The probability of wildfire is less than 0.5 when the annual precipitation is higher than 1830 mm. Precipitation determines the rate of forest growth and the accumulation of stock volume. If the annual precipitation is too low, the site is not suitable for forest growth. If the annual precipitation is too high, the accumulated temperature of combustible materials will decline, causing an increase in the temperature required for ignition, thus reducing the probability of wildfire.
- (5)
- The response curves of the wildfire probability to wind speed and vegetation cover show a single-peak trend. When the wind speed is lower than 0.9 m/s or higher than 4.8 m/s, the wildfire probability is significantly lower than 0.5. The probability of wildfire peaks with a wind speed of 1.1 m/s. When the forest vegetation cover is between 32% and 85%, the probability of wildfire is significantly higher than 0.5 and peaks at 67%. Areas with vegetation cover greater than 85% are not suitable for wildfire. The response of the probability of wildfire to woodland density showed a U-shaped pattern. When woodland density is either too high or too low, this will promote the occurrence of wildfire. The probability of wildfire increases significantly when the density of woodland is below 41% or above 52%.
- (6)
- The response of the probability of wildfire to population density is generally consistent with popular beliefs, i.e., the higher the population density, the greater the chance of wildfire occurrence. Specifically, the probability of wildfire gradually decreases or increases when the population density is lower or higher than 100 people/km2, respectively. However, it remains unchanged when the population density reaches 9500 people/km2 or higher. This response pattern may be related to natural or man-made fire sources. When the population density is less than 100 people/km2, human activities disturb fewer areas. In this case, wildfires are more likely to be caused by natural conditions, such as lightning fires, the spontaneous combustion of peak, and sparks caused by rolling rocks. In contrast, with increasing population density, human activities are more widespread, intensifying disturbance, so that the possibility of human-caused fire increases dramatically, thus increasing the likelihood of wildfire.
3.3. Fire Risk Zoning
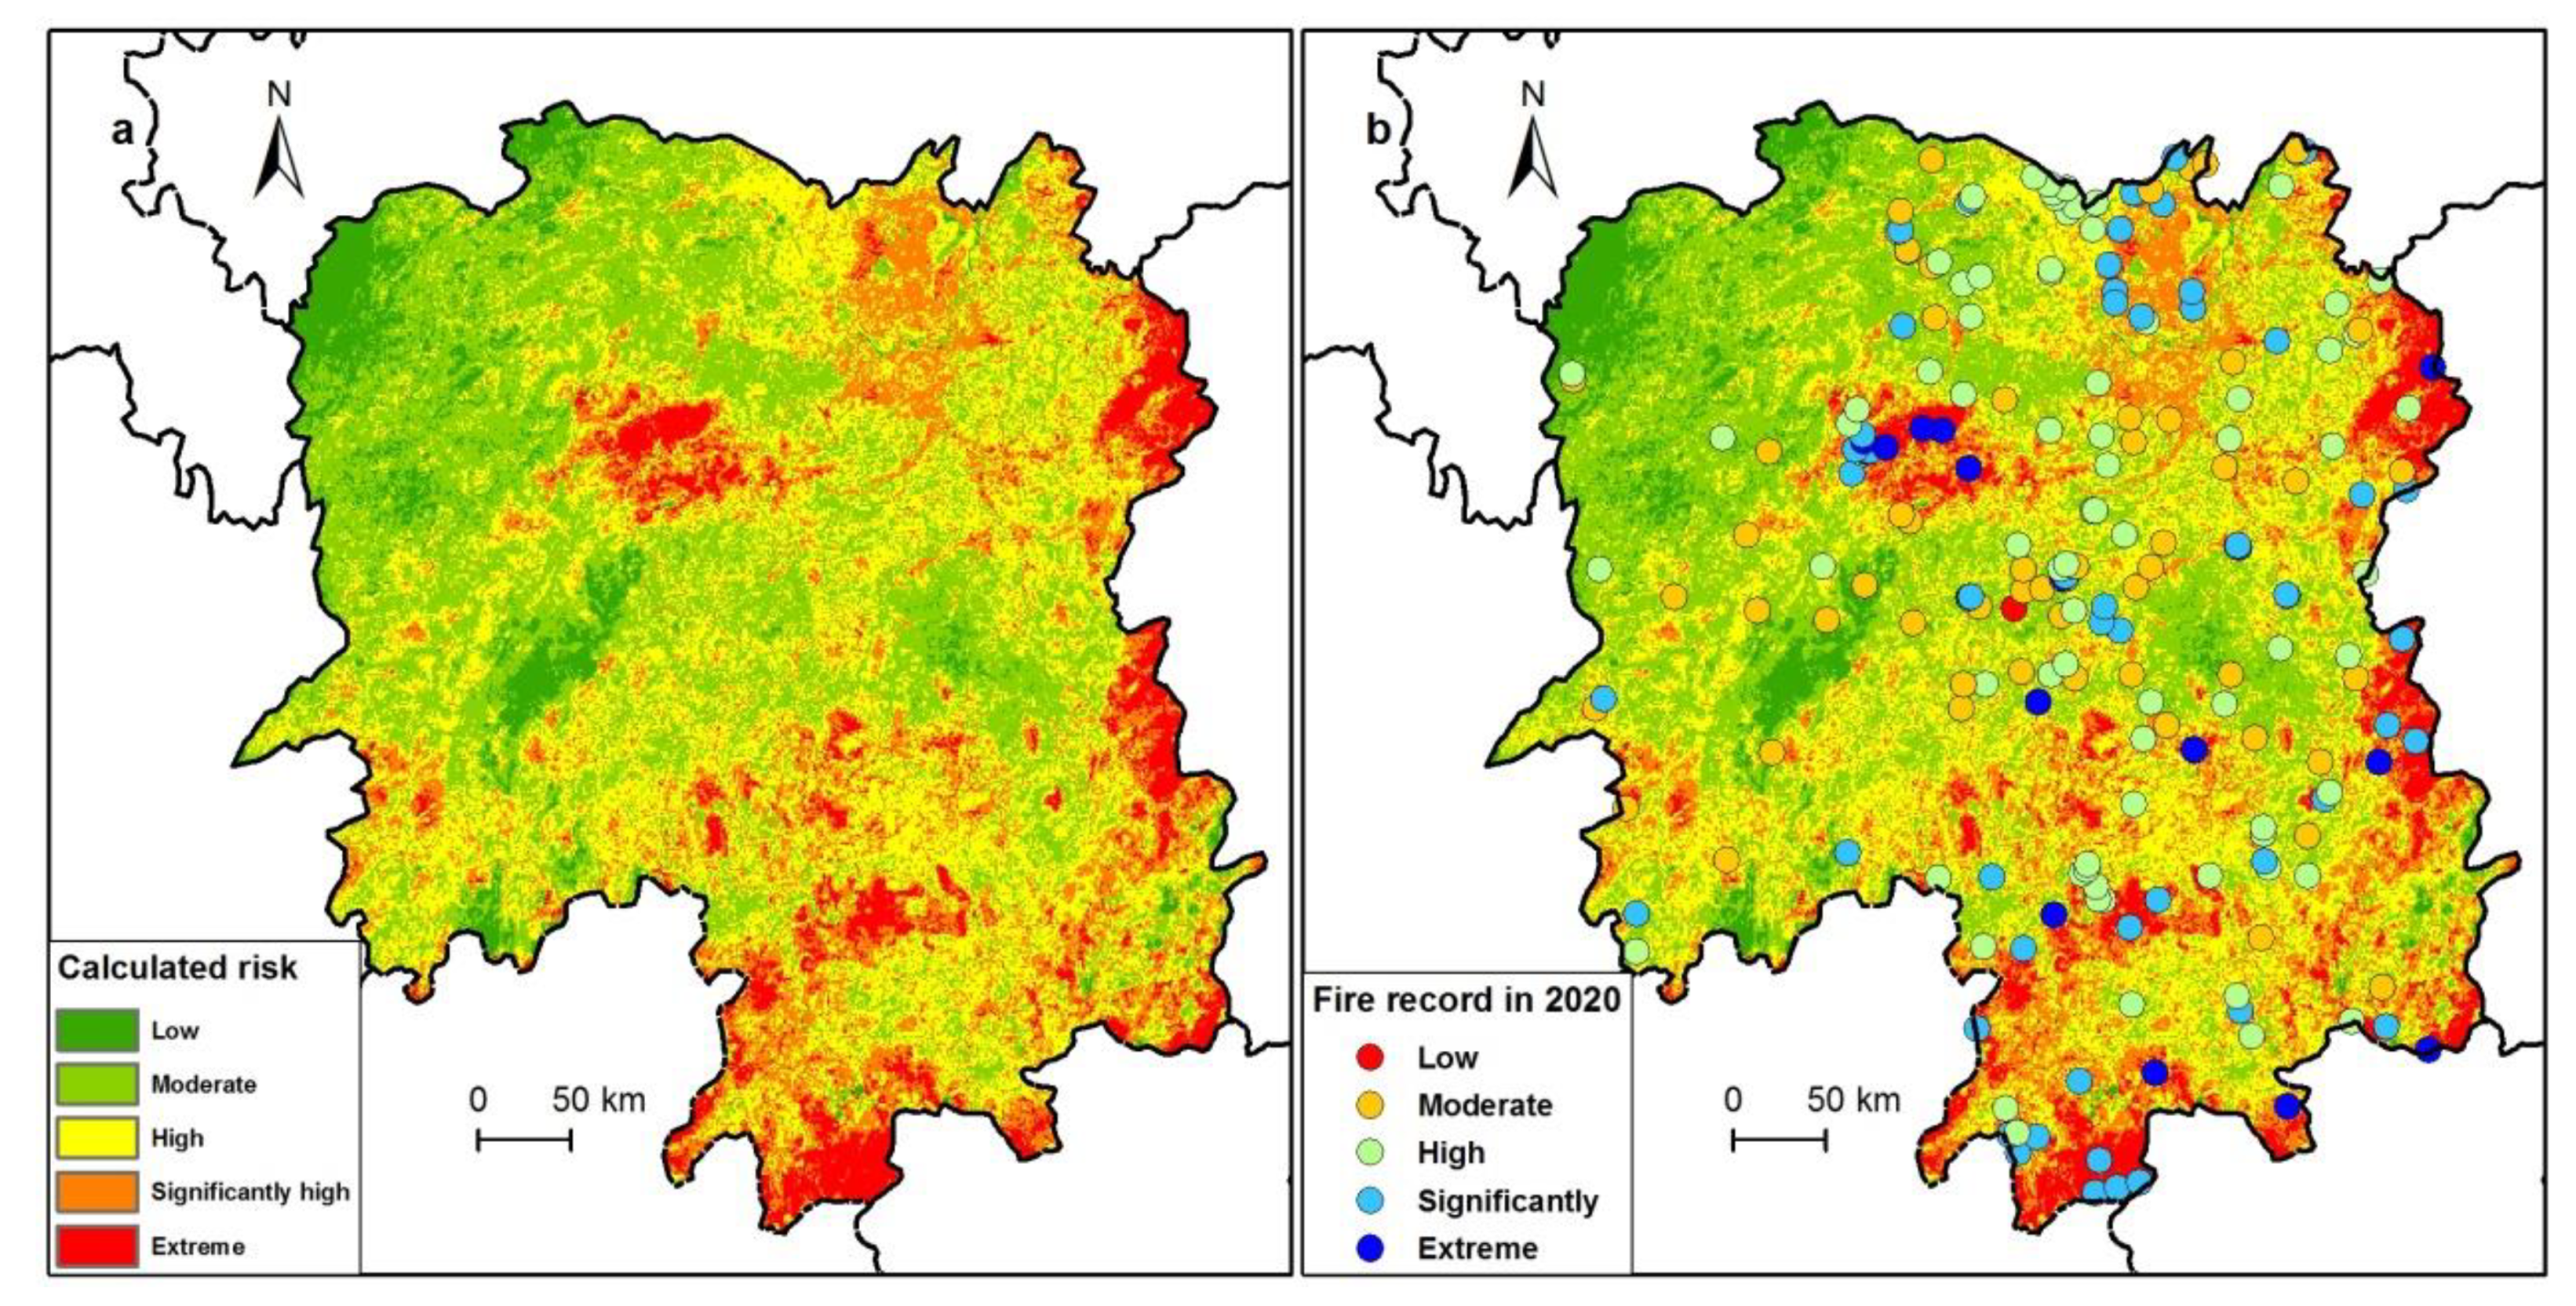
The present study used the natural breaks classification method to divide the assessed risk values of wildfire in Hunan Province into five levels. The five subdivisions with different levels of risk classified as low, moderate, high, significantly high, and extremely high risk areas account for 6.08%, 34.09%, 34.31%, 18.43%, and 7.09% of the area under the jurisdiction of Hunan Province, respectively. The areas at high risk and below accounted for 74.48% of the total area, while significantly high and extremely high risk areas accounted for 25.52%. Thus, it can be seen that the areas at and above the significantly high risk level for wildfire account for a relatively low percentage of Hunan Province. From the perspective of the spatial distribution pattern, the wildfire risk in Hunan Province has significant geographical variation. The extremely high risk areas are mainly distributed in Nanling, Yangming Mountains, Dawei Mountains, and the middle reaches of Yuanjiang River, where the topography is mainly low and medium elevation mountains and hills, with high forest cover and a large forest biomass stock volume. These areas are the dense forest areas and concentrated protection areas in Hunan Province; the significantly high risk areas are concentrated in Yiyang, Yueyang, and Changzhutan areas along Dongting Lake, with a large population, developed transportation, high economic density, and a high possibility of human-induced fires. High and moderate risk areas account for the largest proportion, but the spatial distribution of clustering is not obvious, and the areas are distributed in all administrative regions. Low risk areas are concentrated in the Wuyi and Xuefeng mountain ranges. Although these areas have a high forest density, the mountains there have high elevations with more complex topographic changes, and the population is sparsely distributed. The possibility of human-induced wildfire is relatively low, so the fire risk is low.
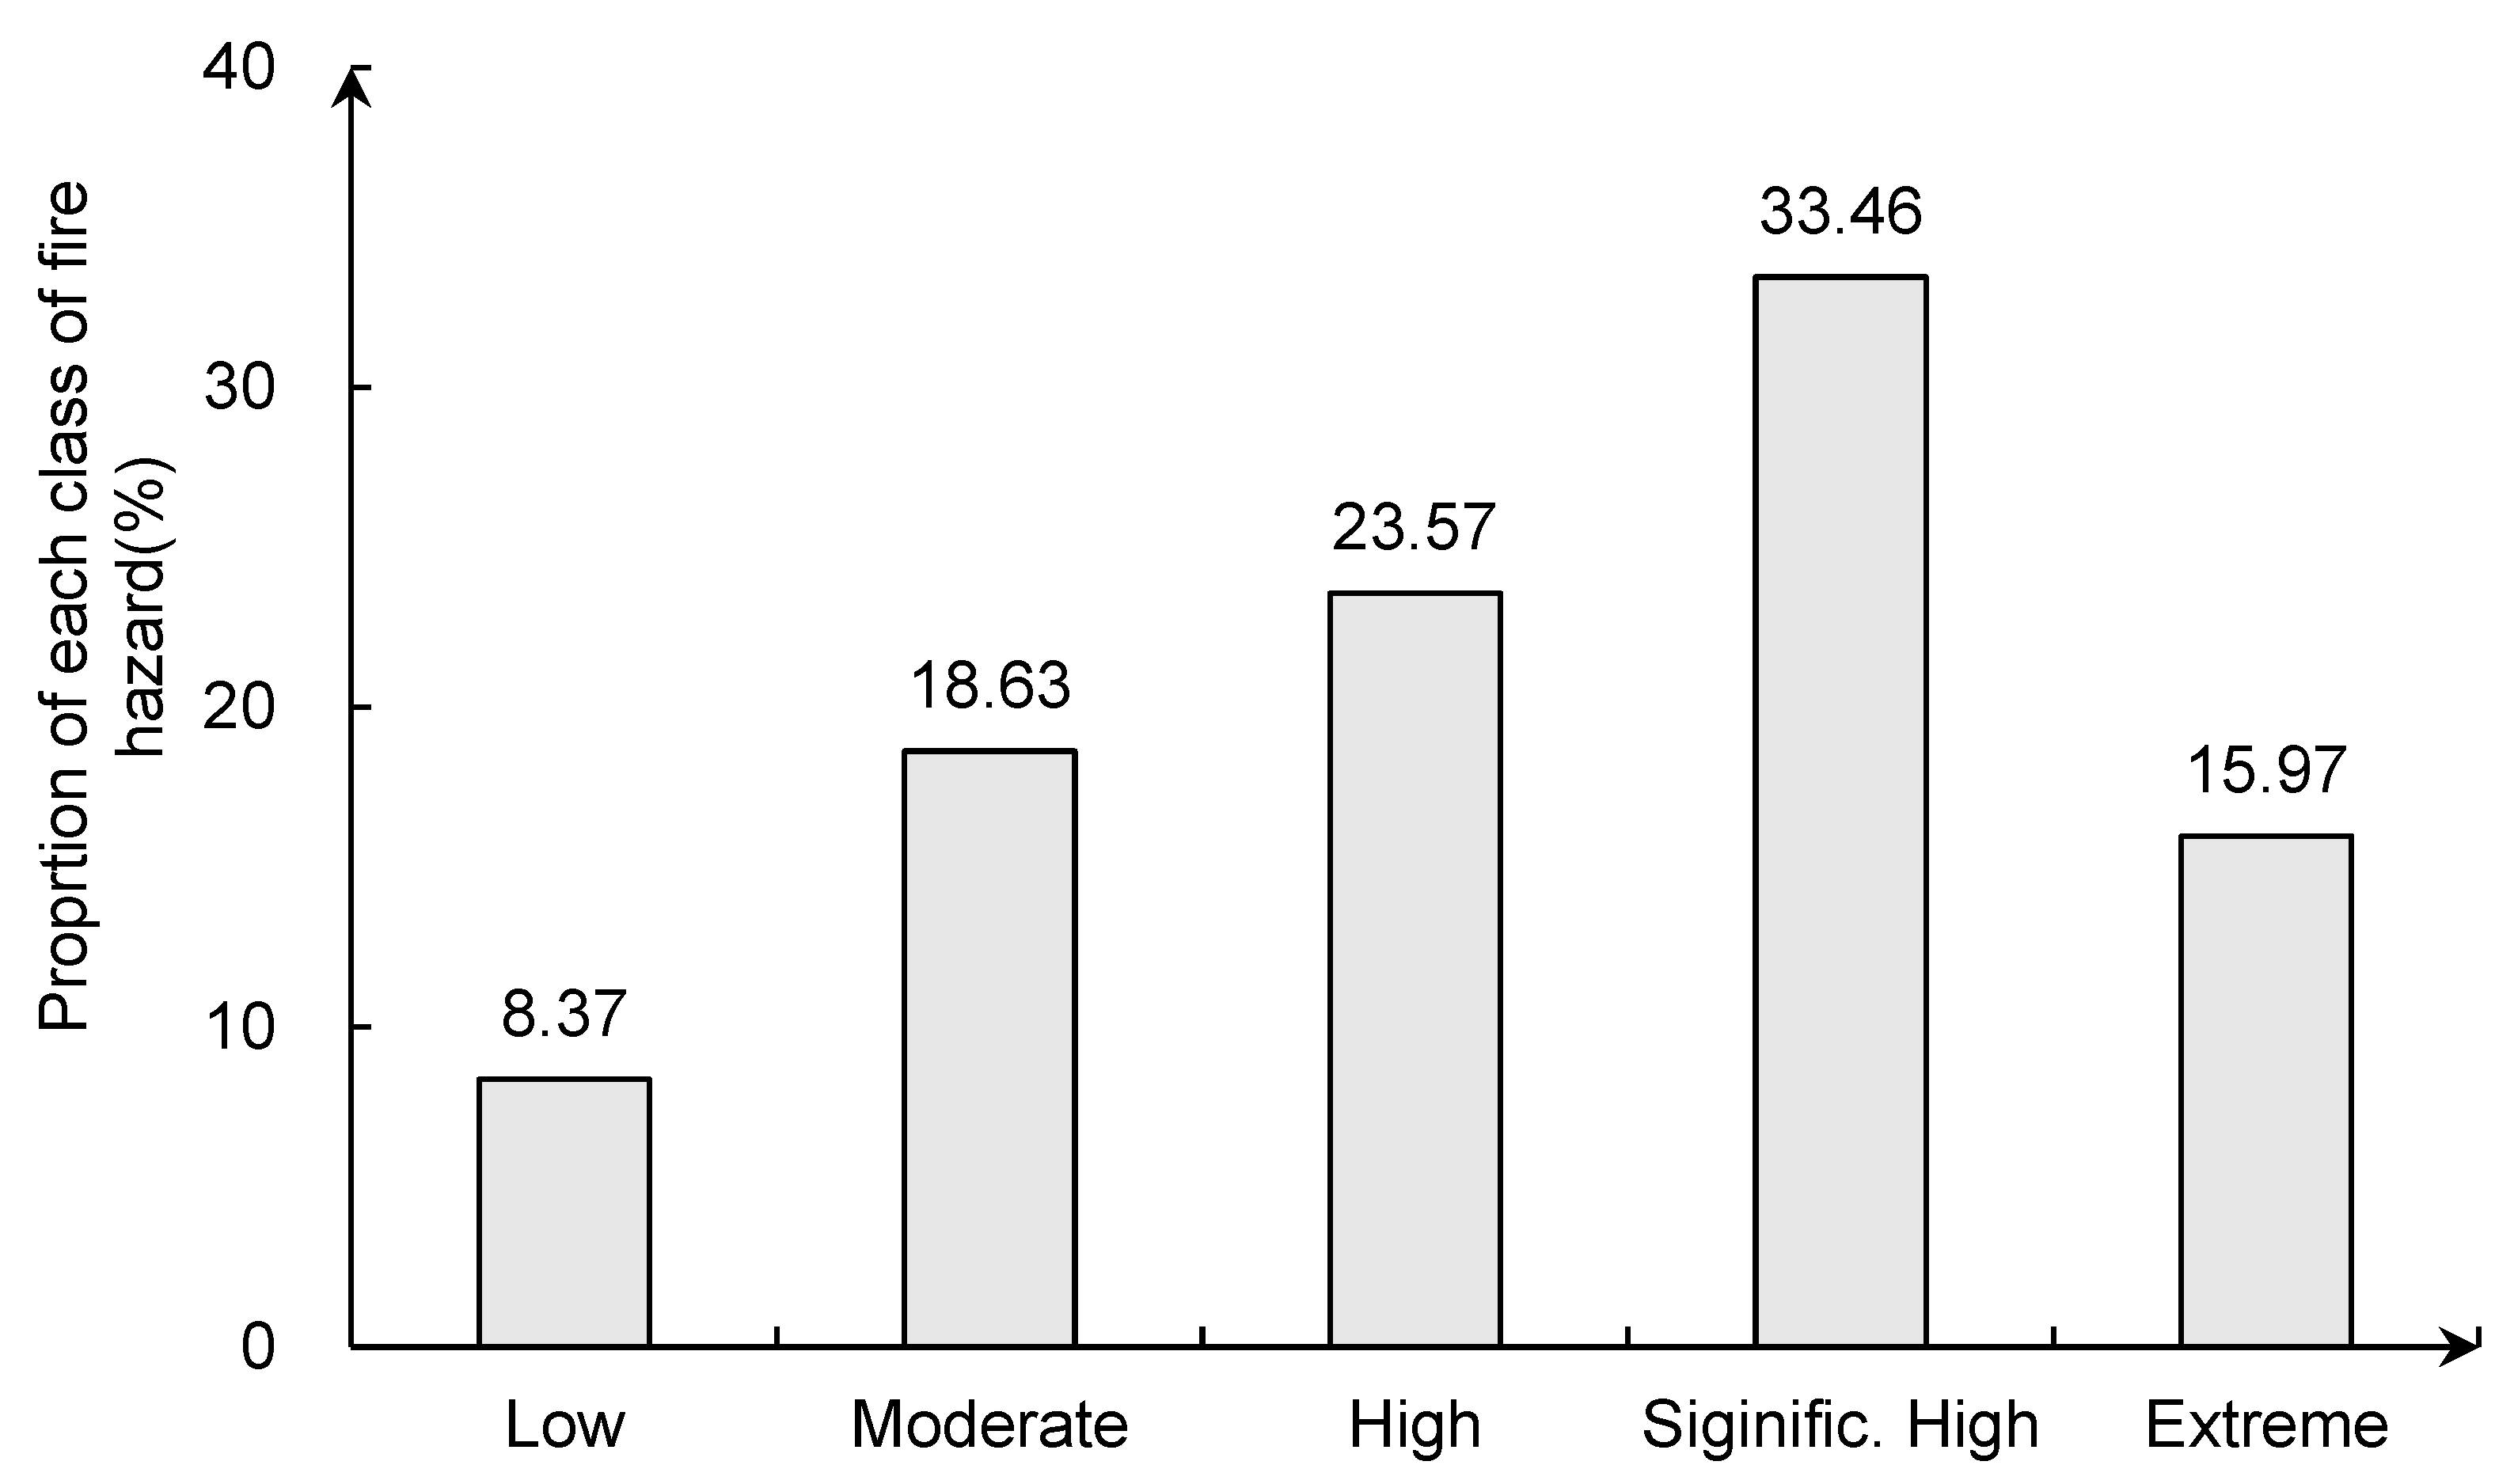
In order to verify the rationality of the results, the wildfire risk zoning results were verified using the wildfire location data for Hunan Province in 2020. This analysis found that the 263 observed wildfire locations fell into the low, moderate, high, significantly high, and extremely high risk zones with the proportions of 8.37%, 18.63%, 23.57%, 33.46%, and 15.97%, respectively. This means that nearly half of all wildfires occur in significantly and extremely high risk areas, and wildfires show a normal distribution skewed to the right in each risk area. This indicates that the Maxent model-based wildfire risk zoning can simulate the high risk and vulnerable areas of wildfire quite accurately, which, to some extent, verifies the reliability of the model’s zoning results (see Figure 6b and Figure 7).
4. Discussions and Conclusions
4.1. Discussions
4.1.1. Comparison of BLR and Maxent
A very large number of models are available for wildfire risk assessment, among which binary logistics regression (BLR) is the most widely used model. To further evaluate the rationality of using the Maxent model, this study used the aforementioned wildfire and environmental factor data as input data to assess the wildfire risk in Hunan Province using the BLR model. Here, the BLR regression model was constructed using the occurrence or nonoccurrence of wildfire as the dependent variable with values of 1 or 0 for the occurrence or nonoccurrence of wildfire, respectively. Twelve environmental factors were used that were classified in the four aspects of topography, climatic conditions, vegetation attributes, and human activities as the independent variables of wildfire risk as described previously (the extreme value standardization method was used to reduce the dimensions of some dependent variables). The extracted sample data were imported into SPSS 26 software (IBM, New York, USA) for regression processing; the regression model parameters for wildfire risk assessment were calculated as shown in Table 3.
Table 3 shows the corresponding significant values of the environmental factors influencing wildfire is below p < 0.05 level of significance, which passed the Wald test, indicating that the environmental factors have a significant impact on the development of wildfire. In this study, Exp(B) is the ratio of the frequency of occurrence of wildfire to the frequency of nonoccurrence, indicating a change in the occurrence of the dependent variable wildfire for every one unit increase in the independent variable. The higher the value, the greater the impact of the environmental variable on wildfire. It can be seen that the regression parameters of average annual precipitation, aridity, economic density, distance from the nearest road, average annual temperature, and land cover type are positive, and the Exp(B) values are greater than 1, indicating that these environmental variables have a positive contribution to the occurrence of wildfire, significantly impacting the occurrence of wildfire. By comparing the output results of Maxent model, it can be seen that the factors of average annual precipitation and temperature have a strong contribution to the occurrence of wildfire in both models, while the contributions and effects of the remaining factors vary. In addition, in the context of Figure 4, one can see that the Maxent model can further reflect the quantitative correlation between environmental factors and wildfire and can capture in detail the correspondence between environmental factors and wildfire at different levels or scores, rather than the rough positive or negative correlation derived from the BLR model.
The AUC value of the BLR model was calculated in the ROC analysis module of SPSS as 0.738, which indicates that the prediction results of the BLR model are basically reasonable. This also indirectly indicates the advantage of this model that is currently being widely used for zoning as a part of wildfire risk assessment. However, the AUC value of the Maxent model was 0.816, which is higher than that of the BLR model, indicating that the prediction accuracy of the Maxent model is slightly better than that of the BLR model, which has been shown previously in the studies of Bar et al. (2012) [48], Liu and Yang (2013) [29]. The difference between the two models for fitting wildfire and environmental variables may be related to the implementation mechanism of these two models. The BLR model does not consider the spatial correlation and heterogeneity of environmental variables, assuming in advance the existence of a linear function between the explanatory variables and their corresponding coefficients, which can only yield positive and negative correlations between the independent and dependent variables. However, overfitting occurs when the model fits any independent variables with strong spatial autocorrelation. In addition, the BLR model requires a separate collinearity test for the independent variables before fitting, and there is a risk that significant variables will be removed early. The Maxent model is a machine learning method, which can fully consider the complex nonlinear relationships between predictor variables and response variables. Meanwhile, it is simply constructed, easy to apply, and has a low input data requirement for Maxent model. However, the disadvantage of Maxent is that the quantitative relationship between wildfire and explanatory variables cannot be obtained, and the relationship can only be expressed in the form of response curves.
4.1.2. Future Research
Improving the accuracy of wildfire prediction in real-time and establishing a dynamic, high-accuracy, and high-resolution grid-scale wildfire prediction model is critical to the daily management of wildfire prevention, firefighting, and fire control command. Although static, large-scale wildfire risk assessment can scientifically guide the assessment and zoning of wildfire risk at mid-scales as well as obtain the general patterns of wildfire occurrence easily. The spatial heterogeneity, temporal dynamics, and distribution nonlinearity of environmental factors affecting wildfire occurrence, especially meteorological and combustible fuels factors, are particularly important. Using data related to multi-year average meteorological factors or to the accumulation of combustible fuels, aridity and humidity, and temperature to fit risks or levels of wildfire occurrence will make the assessment results less useful for practical guidance. In a follow-up study, the input of monthly, weekly, daily, and temporal scale meteorological factors, such as daily average temperature, daily maximum and minimum temperatures, daily precipitation, and daily wind speed into a wildfire prediction model with high precision spatial interpolation raster data will effectively improve the real-time data and reliability of wildfire risk assessment. The known fire location and burned area inputting the model may help the wildfire risk model to evaluate the higher and more reliable risk distribution. Aside from the traditional BLR, GWR, and gompit models, machine learning models, such as random forest, neural networks, Maxent, support vector machines, and Bayesian networks, have the advantages of high fault tolerance, intelligence, self-learning, and the effective avoidance of overfitting. They have become the new choices of wildfire risk prediction and assessment models. In addition, scholars should pay more attention to the environmental effect of wildfire such as improving the soil fertility and quality of habitats, reducing the forest pests, and updating the wild species.
4.2. Conclusions
Combining Maxent model and GIS to construct a wildfire risk assessment model using known wildfire locations and environmental variables can provide an intuitive, detailed, and highly accurate technical means of wildfire risk assessment and zoning. In this study, a Maxent wildfire risk assessment model was constructed with GIS technical support using a 2016–2020 dataset of wildfire locations and 12 environmental variables in Hunan Province, so that a provincial-scale wildfire risk assessment and zoning study could be conducted. The results show that:
- (1)
- For wildfire, the importance of environmental variables in descending order includes climatic conditions, vegetation, human activities, and topography, while the contribution of environmental variables in descending order includes climatic conditions, vegetation, topography, and human activities. The interaction between environmental factors reduces the importance of climatic conditions and human activities in the model, while in contrast, the importance of topography and vegetation variables increased.
- (2)
- The mechanisms by which environmental variables affect wildfire are complex and variable. The response curves of wildfire to the 12 selected environmental variables are not linear but are complex and nonlinear; the average annual temperature, aridity, land use type, GDP density, distance from roads, and population density have a nonlinear positive correlation with wildfire probability. In contrast, elevation, slope, precipitation, wind speed, and vegetation cover within a suitable interval have a positive promoting effect on wildfire probability. The environmental state outside the suitable interval will curb wildfire. The response of wildfire probability to forest density is U-shaped. When forest density is either too high or too low, density will promote the occurrence of wildfire.
- (3)
- The geographical differentiation of wildfire risk in Hunan Province is obvious. The areas at lowest to high risk accounted for 74.48% of the total area, while the areas at significantly high risk and above accounted for a relatively low 25.52%. From the spatial distribution pattern, the extremely high risk areas are mainly distributed in Nanling, and the Yangming and Dawei mountains, along with the middle reaches of Yuanjiang River. The areas of significantly high risk are concentrated in Yiyang, Yueyang, and Changzhutan areas along Dongting Lake. The high and moderate risk areas account for the largest proportion, but the spatial distribution of clustering is not obvious. The low risk areas are concentrated in the Wuyi and Xuefeng mountain ranges.
Author Contributions
Methodology, X.Y.; software, X.Y.; writing—original draft preparation, X.Y.; conceptualization, X.J.; validation, X.J.; writing—review and editing, Y.Z. All authors have read and agreed to the published version of the manuscript.
Funding
This research was funded by the National Key Research and Development Program of China (Grant No. 2019YFA0606603) and National Science Foundation of China (No. 41801065).
Institutional Review Board Statement
Not applicable.
Informed Consent Statement
Not applicable.
Data Availability Statement
Not applicable.
Conflicts of Interest
The authors declare no conflict of interest.
References
- Forkel, M.; Dorigo, W.; Lasslop, G.; Teubner, I.; Chuvieco, E.; Thonicke, K. A data-driven approach to identify controls on global fire activity from satellite and climate observations (SOFIA V1). Geosci. Model Dev. 2017, 10, 4443–4476. [Google Scholar] [CrossRef] [Green Version]
- Walker, X.J.; Baltzer, J.L.; Cumming, S.G.; Day, N.J.; Ebert, J.; Goetz, S.; Johnstone, J.F.; Potter, S.; Rogers, B.R.; Schuur, E.A.G.; et al. Increasing wildfires threaten historic carbon sink of boreal forest soils. Nature 2019, 572, 520–523. [Google Scholar] [CrossRef]
- Chuvieco, E.; Mouillot, F.; Werf, G.R.; San Miguel, J.; Tanase, M.; Koutsias, N.; García, M.; Yebra, M.; Padilla, M.; Gitas, I.; et al. Historical background, and current developments for mapping burned area from satellite Earth observation ScienceDirect. Remote Sens. Environ. 2019, 225, 45–64. [Google Scholar] [CrossRef]
- Gao, X.P.; Liao, S.Z. Design and implementation of forest fire probability prediction system based on Bayesian network. Comput. Eng. Appl. 2017, 53, 246–251. [Google Scholar]
- An, H.; Gan, J.; Cho, S.J. Assessing climate change impacts on wildfire risk in the United States. Forests 2015, 6, 3197–3211. [Google Scholar] [CrossRef] [Green Version]
- Chen, L.D.; Fu, B.J. Ecological significance characteristic and types of disturbance. Acta Ecol. Sin. 2000, 20, 581–586. [Google Scholar]
- Di, L.Y.; Sun, R.Y. Summarization of research on forest fire in China. J. Catastrophol. 2007, 22, 118–123. [Google Scholar]
- Yue, C.; Luo, C.F.; Shu, L.F.; Shen, Z.H. A review on wildfire studies in the context of global change. Acta Ecol. Sin. 2020, 40, 385–401. [Google Scholar]
- Andela, N.; Morton, D.C.; Giglio, L.; Paugam, R.; Chen, Y.; Hantson, S.; van der Werf, G.R.; Randerson, J.T. The global fire atlas of individual fire size, duration, speed and direction. Earth Syst. Sci. Data 2019, 11, 529–552. [Google Scholar] [CrossRef] [Green Version]
- Qayum, A.; Ahmad, F.; Arya, R.; Singh, R.K. Predictive modeling of forest fire using geospatial tools and strategic allocation of resources: eForestFire. Stoch. Environ. Res. Risk Assess. 2020, 34, 2259–2275. [Google Scholar] [CrossRef]
- Pang, Y.; Jia, W.; Qin, X.L.; Si, L.; Liang, X.J.; Lin, X.; Lin, Z.Y. Forest fire monitoring using airborne optical full spectrum remote sensing data. J. Remote Sens. 2020, 24, 1280–1292. [Google Scholar]
- Kaufman, Y.J.; Hobbs, P.V.; Kirchhoff, V.W.J.; Artaxo, P.; Remer, L.A.; Holben, B.N.; King, M.D.; Ward, D.E.; Prins, E.M.; Longo, K.M.; et al. Smoke, cloud and radiation-Brazil SCAR-B experiment. J. Geophys. Res. 1998, 103, 783–808. [Google Scholar] [CrossRef] [Green Version]
- McCarley, T.R.; Kolden, C.A.; Vaillant, N.M.; Hudak, A.T.; Smith, A.M.; Wing, B.M.; Kellogg, B.S.; Kreitler, J. Multi-temporal LiDAR and Landsat quantification of fire-induced changes to forest structure. Remote Sens. Environ. 2017, 191, 419–432. [Google Scholar] [CrossRef] [Green Version]
- Asner, G.P.; Knapp, D.E.; Kennedy-Bowdoin, T.; Jones, M.O.; Martin, R.E.; Boardman, J.W.; Field, C.B. Carnegie airborne observatory: In-flight fusion of hyperspectral imaging and waveform light detection and ranging (wLiDAR) for three-dimensional studies of ecosystems. J. Appl. Remote Sens. 2007, 1, 1–21. [Google Scholar] [CrossRef]
- Kampe, T.U.; Johnson, B.R.; Kuester, M.A.; Keller, M. The first continental-scale ecological observatory with airborne remote sensing of vegetation canopy biochemistry and structure. J. Appl. Remote Sens. 2010, 043510. [Google Scholar] [CrossRef] [Green Version]
- Cook, B.D.; Corp, L.A.; Nelson, R.F.; Middleton, E.M.; Morton, D.C.; McCorkel, J.T.; Masek, J.G.; Ranson, K.J.; Ly, V.; Montesano, P.M. NASA Goddard’s LiDAR, hyperspectral and thermal (GLiHT) airborne imager. Remote Sens. 2013, 5, 4045–4066. [Google Scholar] [CrossRef] [Green Version]
- Pang, Y.; Li, Z.Y.; Ju, H.B.; Lu, H.; Jia, W.; Si, L.; Guo, Y.; Liu, Q.; Li, S.; Liu, L.; et al. LiCHy: The CAF’s LiDAR, CCD and hyperspectral integrated airborne observation system. Remote Sens. 2016, 8, 398. [Google Scholar] [CrossRef] [Green Version]
- Randerson, J.T.; Chen, Y.; Van Der Werf, G.R.; Rogers, B.M.; Morton, D.C. Global burned area and biomass burning emissions from small fires. J. Geophys. Res. Biogeosci. 2012, 117, G04012. [Google Scholar] [CrossRef]
- Ying, L.X.; Han, J.; Du, Y.S.; Shen, Z.H. Forest fire characteristics in China: Spatial patterns and determinants with thresholds. For. Ecol. Manag. 2018, 424, 345–354. [Google Scholar] [CrossRef]
- You, W.; Lin, L.; Wu, L.; Ji, Z.; Yu, J.; Zhu, J.; Fan, Y.; He, D. Geographical information system-based forest fire risk assessment integrating national forest inventory data and analysis of its spatiotemporal variability. Ecol. Indic. 2017, 77, 176–184. [Google Scholar] [CrossRef]
- Santos Mota, P.H.; Soares da Rocha, S.J.S.; Martins de Castro, N.L.; Marcatti, G.E.; de Jesus França, L.C.; Said Schettini, B.L.; Villanova, P.H.; dos Santos, H.T.; Rosados Santos, A. Forest fire hazard zoning in Mato Grosso State, Brazil. Land Use Policy 2019, 88, 104206. [Google Scholar]
- Gao, C.; Lin, H.L.; Hu, H.Q.; Song, H. A review of models of forest fire occurrence prediction in China. Chin. J. Appl. Ecol. 2020, 31, 3227–3240. [Google Scholar]
- Deng, O.; Li, Y.Q.; Feng, Z.K.; Dongyu, Z. Model and zoning of forest fire risk in Heilongjiang province based on spatial Logistic. Trans. Chin. Soc. Agric. Eng. 2012, 28, 200–205. [Google Scholar]
- Liang, H.L.; Wang, W.H.; Guo, F.T.; Lin, F.; Lin, Y. Comparing the application of logistic and geographically weighted logistic regression models for Fujian Forest fire forecasting. Acta Ecol. Sin. 2017, 37, 4128–4141. [Google Scholar]
- Su, Z.W.; Zeng, A.C.; Cai, Q.J.; Hu, H.Q. Study on prediction model and driving factors of forest fire in Da Hinggan Mountains using Gompit regression method. J. For. Eng. 2019, 4, 135–142. [Google Scholar]
- Yang, J.B.; Ma, X.X. On the basis of artificial neural network to forecast the forest fire in Guangdong Province. Sci. Silvae Sin. 2005, 41, 127–132. [Google Scholar]
- Breiman, L. Random forests. Mach. Learn. 2001, 45, 5–32. [Google Scholar] [CrossRef] [Green Version]
- Pan, D.; Yu, P.Y.; Wu, Q. Application of random forest algorithm on the forest fire prediction based on meteorological factors in the Hilly area, central Henan Province. J. Northwest For. Univ. 2018, 33, 169–177. [Google Scholar]
- Liu, S.J.; Yang, J. Modeling spatial patterns of forest fire in Heilongjiang Province using Generalized Linear Model and Maximum Entropy Model. Chin. J. Ecol. 2013, 32, 1620–1628. [Google Scholar]
- Chen, W.; Zhou, Y.; Zhou, E.; Xiang, Z.; Zhou, W.; Lu, J. Wildfire risk assessment of transmission-line corridors based on naïve bayes network and remote sensing data. Sensors 2021, 21, 634. [Google Scholar] [CrossRef]
- Amiro, B.D.; Logan, K.A.; Wotton, B.M.; Flannigan, M.D.; Todd, J.B.; Stocks, B.J.; Martell, D.L. Fire weather index system components for large fires in the Canadian boreal forest. Int. J. Wildland Fire 2004, 13, 391–400. [Google Scholar] [CrossRef]
- Considine, D.M.; Considine, G.D. National fire danger rating system. In Van Nostrand’s Scientific Encyclopedia; American Cancer Society: Atlanta, GA, USA, 2006. [Google Scholar]
- Wu, Z.; He, H.S.; Yang, J.; Liang, Y. Defining fire environment zones in the boreal forests of northeastern China. Sci. Total. Environ. 2015, 518, 106–116. [Google Scholar] [CrossRef]
- Zhang, Y.; Liu, X.; Chen, G.; Hu, G. Simulation of urban expansion based on cellular automata and maximum entropy model. Sci. China Earth Sci. 2020, 63, 701–712. [Google Scholar] [CrossRef]
- Adab, H.; Atabati, A.; Oliveira, S.; Gheshlagh, A.M. Assessing fire hazard potential and its main drivers in Mazandaran province, Iran: A data-driven approach. Environ. Monit. Assess. 2018, 190, 670. [Google Scholar] [CrossRef] [PubMed]
- Martín, Y.; Zúñiga-Antón, M.; Mimbrero, M.R. Modelling temporal variation of fire-occurrence towards the dynamic prediction of human wildfire ignition danger in northeast Spain. Geomat. Nat. Hazards Risk 2019, 10, 385–411. [Google Scholar] [CrossRef]
- Chen, F.; Du, Y.; Niu, S.; Zhao, J. Modeling Forest lightning fire occurrence in the daxinganling mountains of Northeastern China with MAXENT. Forests 2015, 6, 1422–1438. [Google Scholar] [CrossRef] [Green Version]
- Wotton, B.M.; Nock, C.A.; Flannigan, M.D. Forest fire occurrence and climate change in Canada. Int. J. Wildland Fire 2010, 19, 253–271. [Google Scholar] [CrossRef]
- Oliveira, S.; Oehler, F.; San-Miguel-Ayanz, J.; Camia, A.; Pereira, J.M. Modeling spatial patterns of fire occurrence in Mediterranean Europe using Multiple Regression and Random Forest. For. Ecol. Manag. 2012, 275, 117–129. [Google Scholar] [CrossRef]
- Fu, J.J.; Wu, Z.W.; Yan, S.J.; Zhang, Y.; Gu, X.; Du, L. Effects of climate, vegetation, and topography on spatial patterns of burn severity in the Great Xing‘an Mountains. Acta Ecol. Sin. 2020, 40, 1672–1682. [Google Scholar]
- Liu, Z.H.; Yang, J.; He, H.S.; Chang, Y. Spatial point analysis of fire occurrence and its influence factor in Huzhong forest area of the Great Xing‘an Mountains in Heilongjiang Province, China. Acta Ecol. Sin. 2011, 31, 1669–1677. [Google Scholar]
- Yi, Y.J.; Cheng, X.; Yang, Z.F.; Zhang, S.H. MaxEnt modeling for predicting the potential distribution of endangered medicinal plant (H. riparia Lour) in Yunnan, China. Ecol. Eng. 2016, 92, 260–269. [Google Scholar] [CrossRef]
- McCune, B.; Grace, J. Analysis of Ecological Communities; MJM Software Design: Glenden Beach, OR, USA, 2002. [Google Scholar]
- He, Y.; Yang, J.; Ma, Y.; Liu, J.B.; Chen, P.; Li, X.P.; Yang, Y.F. A method for fire detection using Landsat 8 data. J. Infrared Millim. Waves 2016, 35, 600–608. [Google Scholar]
- Kim, S.J.; Lim, C.-H.; Kim, G.S.; Lee, J.; Geiger, T.; Rahmati, O.; Son, Y.; Lee, W.-K. Multi-Temporal Analysis of Forest Fire Probability Using Socio-Economic and Environmental Variables. Remote Sens. 2019, 11, 86. [Google Scholar] [CrossRef] [Green Version]
- Müller, M.M.; Vilà-Vilardell, L.; Vacik, H. Towards an integrated forest fire danger assessment system for the European Alps. Ecol. Inform. 2020, 60, 101151. [Google Scholar] [CrossRef]
- Jayasinghe, S.L.; Kumar, L. Modeling the climate suitability of tea [Camellia sinensis (L.) O. Kuntze] in Sri Lanka in response to current and future climate change scenarios. Agric. For. Meteorol. 2019, 272, 102–117. [Google Scholar] [CrossRef]
- Bar, M.A.; Syphard, A.D.; Stewart, S.I.; Volker, C. Radeloff Wildfire ignition-distribution modelling: A comparative study in the Huron-Manistee National Forest, Michigan, USA. Int. J. Wildland Fire 2013, 22, 174–183. [Google Scholar]
Figure 1.
The location map (a) and the land cover distribution (b) of Hunan Province.

Figure 2.
The main driving forces of wildfire.

Figure 3.
Wildfire in Hunan Province: (a) the building framework of a wildfire location dataset and (b) a spatial distribution map of wildfire locations during 2014 to 2020.
Figure 3.
Wildfire in Hunan Province: (a) the building framework of a wildfire location dataset and (b) a spatial distribution map of wildfire locations during 2014 to 2020.

Figure 4.
The factors influencing wildfire as follows: (a) a digital elevation model; (b) slope; (c) average temperature; (d) average annual precipitation; (e) average wind spends; (f) average aridity; (g) forest density; (h) vegetation cover density; (i) land cover type; (j) population density; (k) distance to the nearest road; (l) gross domestic product density.

Figure 5.
Response curves of environmental variables for wildfire.

Figure 6.
Wildfire: (a) hazard zoning, and (b) observed in 2020.

Figure 7.
Representation of each hazard class of observed wildfire (%).


Table 1.
The factors used in wildfire classification and the description of wildfire risk.
| Type | Factors | Abbreviation | Data Properties | Data Sources | |||
|---|---|---|---|---|---|---|---|
| Min | Max | Mean | Std Dev | ||||
| Terrain | Elevation (m) | DEM | 37 | 2056 | 347 | 275.68 | Resource and environment science and data center. http://www.resdc.cn/ (accessed on 22 May 2021) |
| Terrain slope (°) | Slope | 0 | 25.66 | 1.87 | 2.72 | ||
| Climatic variables | Average air temperature (°C) | AT | 6.9 | 19.1 | 15.88 | 1.45 | National earth system science data center. http://www.geodata.cn/(accessed on 22 May 2021) |
| Annual precipitation (mm) | AP | 1063 | 1979 | 1373 | 91.23 | ||
| Annual wind speed (m/s) | AS | 0.3 | 8.6 | 1.98 | 0.84 | ||
| Average aridity | AA | 0.03 | 0.13 | 0.08 | 0.01 | ||
| Vegetation | Forest land density (%) | FD | 0 | 100 | 62.56 | 22.07 | Resource and environment science and data center. http://www.resdc.cn/(accessed on 22 May 2021) |
| Vegetation cover density (%) | VD | 0.01 | 0.92 | 0.8 | 0.11 | ||
| Land cover type | VT | built-up areas/others:1, temporary crop:2, pasture:3, shrub:4, forest:5 | |||||
| Human activity | Population density (persons/km2) | PD | 0 | 49,729 | 306 | 1854 | Resource and environment science and data center. http://www.resdc.cn/, 2015 (accessed on 22 May 2021) |
| Distance from roads (km) | DR | 0 | 21 | 2.31 | 2277 | Google map, POI, 2019 | |
| Gross domestic product density (RMB/km2) | GD | 0 | 50,089 | 599 | 2896 | Resource and environment science and data center. http://www.resdc.cn/, 2015 (accessed on 22 May 2021) | |
Table 2.
Contribution and importance of major environmental variables to wildfire in Maxent modeling.
Table 2.
Contribution and importance of major environmental variables to wildfire in Maxent modeling.
| Types | Factors | Permutation Importance (%) | Contribution (%) |
|---|---|---|---|
| Terrain | DEM | 6.24 | 10.43 |
| Slope | 1.62 | 1.76 | |
| Climatic variables | AT | 16.98 | 10.57 |
| AP | 26.87 | 17.58 | |
| AS | 5.33 | 12.21 | |
| AA | 5.46 | 2.67 | |
| Vegetation | FD | 7.96 | 20.81 |
| VD | 9.37 | 6.62 | |
| VT | 8.07 | 7.26 | |
| Human activity | PD | 2.33 | 2.07 |
| DR | 4.31 | 2.17 | |
| GD | 5.47 | 5.85 |
Table 3.
Wildfire model variables and test results.
| Variable | Model Parameters | SE | Wald | Sig. | Exp(B) |
|---|---|---|---|---|---|
| DEM | −0.770 | 0.325 | 5.636 | 0.018 | 0.463 |
| SLOPE | −0.239 | 0.207 | 2.332 | 0.248 | 0.787 |
| AT | 0.673 | 0.307 | 4.797 | 0.029 | 1.961 |
| AP | 3.247 | 0.296 | 120.543 | 0.000 | 25.715 |
| AS | −1.101 | 0.273 | 16.285 | 0.000 | 0.333 |
| AA | 2.741 | 0.323 | 71.823 | 0.000 | 15.508 |
| FD | −0.196 | 0.094 | 4.352 | 0.037 | 0.822 |
| VD | −0.323 | 0.259 | 2.562 | 0.211 | 0.724 |
| VT | 0.332 | 0.072 | 21.042 | 0.000 | 1.393 |
| PD | −1.330 | 0.852 | 2.438 | 0.118 | 0.265 |
| DR | 1.091 | 0.214 | 26.097 | 0.000 | 2.978 |
| GD | 1.255 | 0.503 | 6.217 | 0.013 | 3.507 |
| Constant | −3.932 | 0.400 | 96.858 | 0.000 | 0.020 |
Note: the abbreviation meanings of variable are the same as Table 1.
Publisher’s Note: MDPI stays neutral with regard to jurisdictional claims in published maps and institutional affiliations. |
© 2021 by the authors. Licensee MDPI, Basel, Switzerland. This article is an open access article distributed under the terms and conditions of the Creative Commons Attribution (CC BY) license (https://creativecommons.org/licenses/by/4.0/).
Share and Cite
MDPI and ACS Style
Yang, X.; Jin, X.; Zhou, Y. Wildfire Risk Assessment and Zoning by Integrating Maxent and GIS in Hunan Province, China. Forests 2021, 12, 1299. https://0-doi-org.brum.beds.ac.uk/10.3390/f12101299
AMA Style
Yang X, Jin X, Zhou Y. Wildfire Risk Assessment and Zoning by Integrating Maxent and GIS in Hunan Province, China. Forests. 2021; 12(10):1299. https://0-doi-org.brum.beds.ac.uk/10.3390/f12101299
Chicago/Turabian StyleYang, Xuhong, Xiaobin Jin, and Yinkang Zhou. 2021. "Wildfire Risk Assessment and Zoning by Integrating Maxent and GIS in Hunan Province, China" Forests 12, no. 10: 1299. https://0-doi-org.brum.beds.ac.uk/10.3390/f12101299
Note that from the first issue of 2016, this journal uses article numbers instead of page numbers. See further details here.