Article

Characterisation of Moisture in Scots Pine (Pinus sylvestris L.) Sapwood Modified with Maleic Anhydride and Sodium Hypophosphite

1
Wood Science and Engineering, Luleå University of Technology, Forskargatan 1, 93177 Skellefteå, Sweden
2
Department of Geosciences and Natural Resource Management, University of Copenhagen, Rolighedsvej 23, 1958 Frederiksberg C, Denmark
3
Praha 6-Suchdol, Czech University of Life Sciences Prague, Kamýcká 1176, 16521 Prague, Czech Republic
4
Laboratory of Wood Science and Technology, Department of Forestry, Wood Sciences and Design, University of Thessaly, Griva 11, 43100 Karditsa, Greece
*
Author to whom correspondence should be addressed.
Submission received: 3 September 2021 / Revised: 25 September 2021 / Accepted: 27 September 2021 / Published: 29 September 2021
(This article belongs to the Special Issue Evaluation and Protection of Wood and Wood Products)

Abstract

:
In this study, the wood–water interactions in Scots pine sapwood modified with maleic anhydride (MA) and sodium hypophosphite (SHP) was studied in the water-saturated state. The water in wood was studied with low field nuclear magnetic resonance (LFNMR) and the hydrophilicity of cell walls was studied by infrared spectroscopy after deuteration using liquid D2O. The results of LFNMR showed that the spin–spin relaxation (T2) time of cell wall water decreased by modification, while T2 of capillary water increased. Furthermore, the moisture content and the amount of water in cell walls of modified wood were lower than for unmodified samples at the water-saturated state. Although the amount of accessible hydroxyl groups in modified wood did not show any significant difference compared with unmodified wood, the increase in T2 of capillary water indicates a decreased affinity of the wood cell wall to water. However, for the cell wall water, the physical confinement within the cell walls seemed to overrule the weaker wood–water interactions.

1. Introduction

Moisture in wood influences important characteristics such as biological degradation, dimensional stability and mechanical strength [1,2,3]. Furthermore, one of the generally accepted mechanisms explaining enhanced decay resistance and dimensional stability of wood by modification is a reduction in the moisture content of the wood [4,5,6,7,8].
The amount, state and the location of water molecules and their interaction with wood components are important in helping understand the nature of moisture in wood and its effect on wood properties. Water molecules can exist in wood in the macro-voids, e.g., lumen or pit chambers, or in the cell walls interacting with the cell wall constituents [8]. Therefore, it is important to study the characteristics of moisture in wood both qualitatively and quantitatively.
Low-field nuclear magnetic resonance (LFNMR) spectroscopy has been used to study different states of water in wood [9,10]. It can assess the spin relaxation of hydrogen nuclei in water molecules in a magnetic field after excitation by a radio frequency pulse and characterise how water is bound in wood by the spin-lattice relaxation time (T1) and the spin–spin relaxation time (T2) [11,12]. The T2 relaxation time of water depends on the degree of physical confinement and chemical attraction of a surface. Thus, the T2 for water in a porous material depends on the size of pores and the interaction between the water and the wall of pores [13,14].
Studies on softwood with LFNMR typically show three significant peaks. The peak with the shortest T2 relaxation time (below 3 ms) was assigned to the cell wall water. Later peaks, usually observed at the ranges of 9–80 ms and 30–400 ms, were assigned to the capillary water [9,11,14,15,16,17,18]. Of these two capillary water peaks, the peak with the shorter T2 relaxation time has been determined as the water in the lumen of latewood and ray cell and the peak with the longer T2 relaxation time has been determined as the water in earlywood lumen, based on size difference of lumen of earlywood and latewood [11,19]. However, Fredriksson and Thygesen [14] assigned the peak with the lower T2 relaxation to correspond with water in smaller voids such as ray cell lumens and bordered pit chambers, while the peak with higher T2 relaxation corresponded with water in the lumen of earlywood tracheid based on quantified wood anatomical details.
It is not possible to differentiate between the effects of physical confinement and chemistry of confining surfaces on the water populations in wood using only the T2 relaxation. The affinity of water for the confining surface can be estimated by combining T2 relaxation and knowledge of the chemistry of the pore wall, which enables to distinguish between two relaxation mechanisms [20]. The hygroscopicity of a wood cell wall depends on the chemical structure of wood constituents that can interact with water by forming hydrogen bonds. The main functional group interacting with water in wood is the hydroxyl group. The hydroxyl groups on microfibrillar surfaces are accessible to water, while the hydroxyl groups inside the microfibrils are not accessible [21]. A common way of studying accessibility of functional groups (e.g., alcohols) in wood polymers that can interact with water is to deuterate these accessible functional groups by exposing wood to an excess amount of deuterium oxide (D2O) [22]. The process can be quick in the liquid sample but also takes place within the solid state. The excess of D2O will favour an exchange of protons in certain accessible functional groups in the wood polymers with deuterium cations. The result of deuteration of such groups can be measured either by a change in dry mass or by a spectroscopy method [23].
Studies on deuterated wood with infrared spectroscopy showed an increase in O–D bond stretching (height wavenumber around 2510 cm−1) and a decrease in O–H bond stretching (around 3200–3600 cm−1), whilst the C–H bond stretching at around 2900 cm−1 remained the same as in the non-deuterated case [24,25,26,27,28]. The relative accessibility of hydroxyl groups can be determined using FTIR as the area under the FTIR curve, represented by the bond stretching of O–D to the sum of the area of the bond stretching of O–D and O–H [25,29,30]. The results from using this method can be influenced by exposure of fresh cut specimens to the moist air, which can lead to re-protonation of deuterated hydroxyl groups. However, reliable and reproducible results can be obtained by a careful experimental design [30].
Previous studies on modified wood showed changes in the interaction between water compared to unmodified wood [8]. Acetylated wood showed a reduced peak area of cell wall water at the water-saturated condition compared to that of unmodified wood [20], which indicated a reduction in the maximum amount of water absorbed in cell walls due to acetylation. An increased T2 relaxation time was observed for various modifications and was concluded to be due to a decreased hydrophilicity of the cell wall [9,18,20,31].
A previous study on wood modified with maleic anhydride (MA) and sodium hypophosphite (SHP) showed enhanced dimensional stability during repetitive water-soaking/drying tests, which indicate cross-linking within the cell wall [32]. The improvement of dimensional stability was also observed in other types of modified wood, e.g., acetylated or furfurylated wood [4,33]. The mechanism proposed for wood modification with MA and SHP is, nonetheless, different from acetylated or furfurylated wood. Hence, a study on the wood–water interaction of MA/SHP modified wood is required to understand the mechanisms behind the improvement of dimensional stability of such modified wood.

2. Materials and Methods

2.1. Materials

For LFNMR spectroscopy and hydroxyl accessibility measurements, Scots pine (Pinus sylvestris L.) sapwood specimens were cut into a dimension of 5 × 5 × 7 (R × T × L) mm and extracted with acetone:water (4 : 1 by volume) using a Soxhlet apparatus for 6 h and oven-dried at 103 °C for 16 h. For each treatment, 15 replicates (along with reference samples) were prepared, among them, ten were tested with LFNMR and five were tested for hydroxyl accessibility. The specimens were stored in a desiccator over silica gel prior to modification.
Maleic anhydride (MA) (CAS No. 108-31-6) and liquid deuterium oxide (D2O) (99.9 atom% D) was purchased from Sigma Aldrich and sodium hypophosphite monohydrate 98% (CAS No.7681-53-0) from Alfa Aesar. Distilled water was purchased from Brenntag Nordic AB and technical grade acetone (99%) from VWR Chemicals.

2.2. Modification

Four groups were prepared: reference (R), reference subjected to leaching (RL), modified (M), modified and subjected to leaching (ML). Specimens in group M and ML were modified according to a previous study [32], using the concentrations of MA and SHP in solution of 3.5 M and 0.5 M, respectively. The temperature and duration of reactions were 115 °C/2 h for esterification with MA and 170 °C/6 h for cross-linking with SHP. These conditions were chosen based on the previous study of Kim et al. [32] The detailed procedure was as follows:
The specimens were pressure-impregnated in MA solution in acetone (3.5 M) at 12 bar for 2 h, ensuring immersion throughout the impregnation period. The impregnated specimens were heated in the oven at 115 °C for 2 h for activating the reaction between MA and wood and was subsequently allowed to cool to room temperature for 16 h. All MA-treated specimens were extracted with acetone using Soxhlet apparatus for 6 h to remove any excess MA. The specimens were then vacuum-impregnated with aqueous solution of SHP with concentration of 0.5 M for 30 min, after which they were heated in the oven at 170 °C for 6 h to allow the reaction between MA-treated wood and SHP, before being allowed to cool at room temperature for 16 h. All treated specimens were subjected to vacuum-impregnation in water for an hour followed by submerging under water for 72 h with water exchange every 24 h to remove excess SHP. Afterwards, specimens were dried on the bench in a laboratory for 24 h, under a fume hood for 48 h, in the oven at 70 °C for 24 h and at 103 °C until equilibrium was reached (approx. 16 h). This drying process was done to avoid possible irreversible damage on specimens by rapid drying. The relative mass gain (A) of each specimen was calculated according to Equation (1):
A = m t m 0 m 0
where: m0 is the oven-dried mass of wood specimen before treatment, while mt is the oven-dried mass of the specimen after treatment.

2.3. Leaching Test (Modified EN84)

To study possible leaching of treated chemicals, the specimens in group RL and ML were leached according to modified EN84 [34] for ten days. This procedure was modified from EN 84 [34] as follows: The specimens were vacuum-impregnated with water for an hour, followed by submerging under water for ten days with water exchange every 24 h. The volume of water used were ten times the total volume of the specimens. After ten days of leaching, specimens were dried on the bench under laboratory conditions for 24 h, then under a fume hood for 48 h, in an oven at 70 °C for 24 h and then at 103 °C until equilibrium was reached (approx. 16 h). The relative mass gain (A) was calculated.

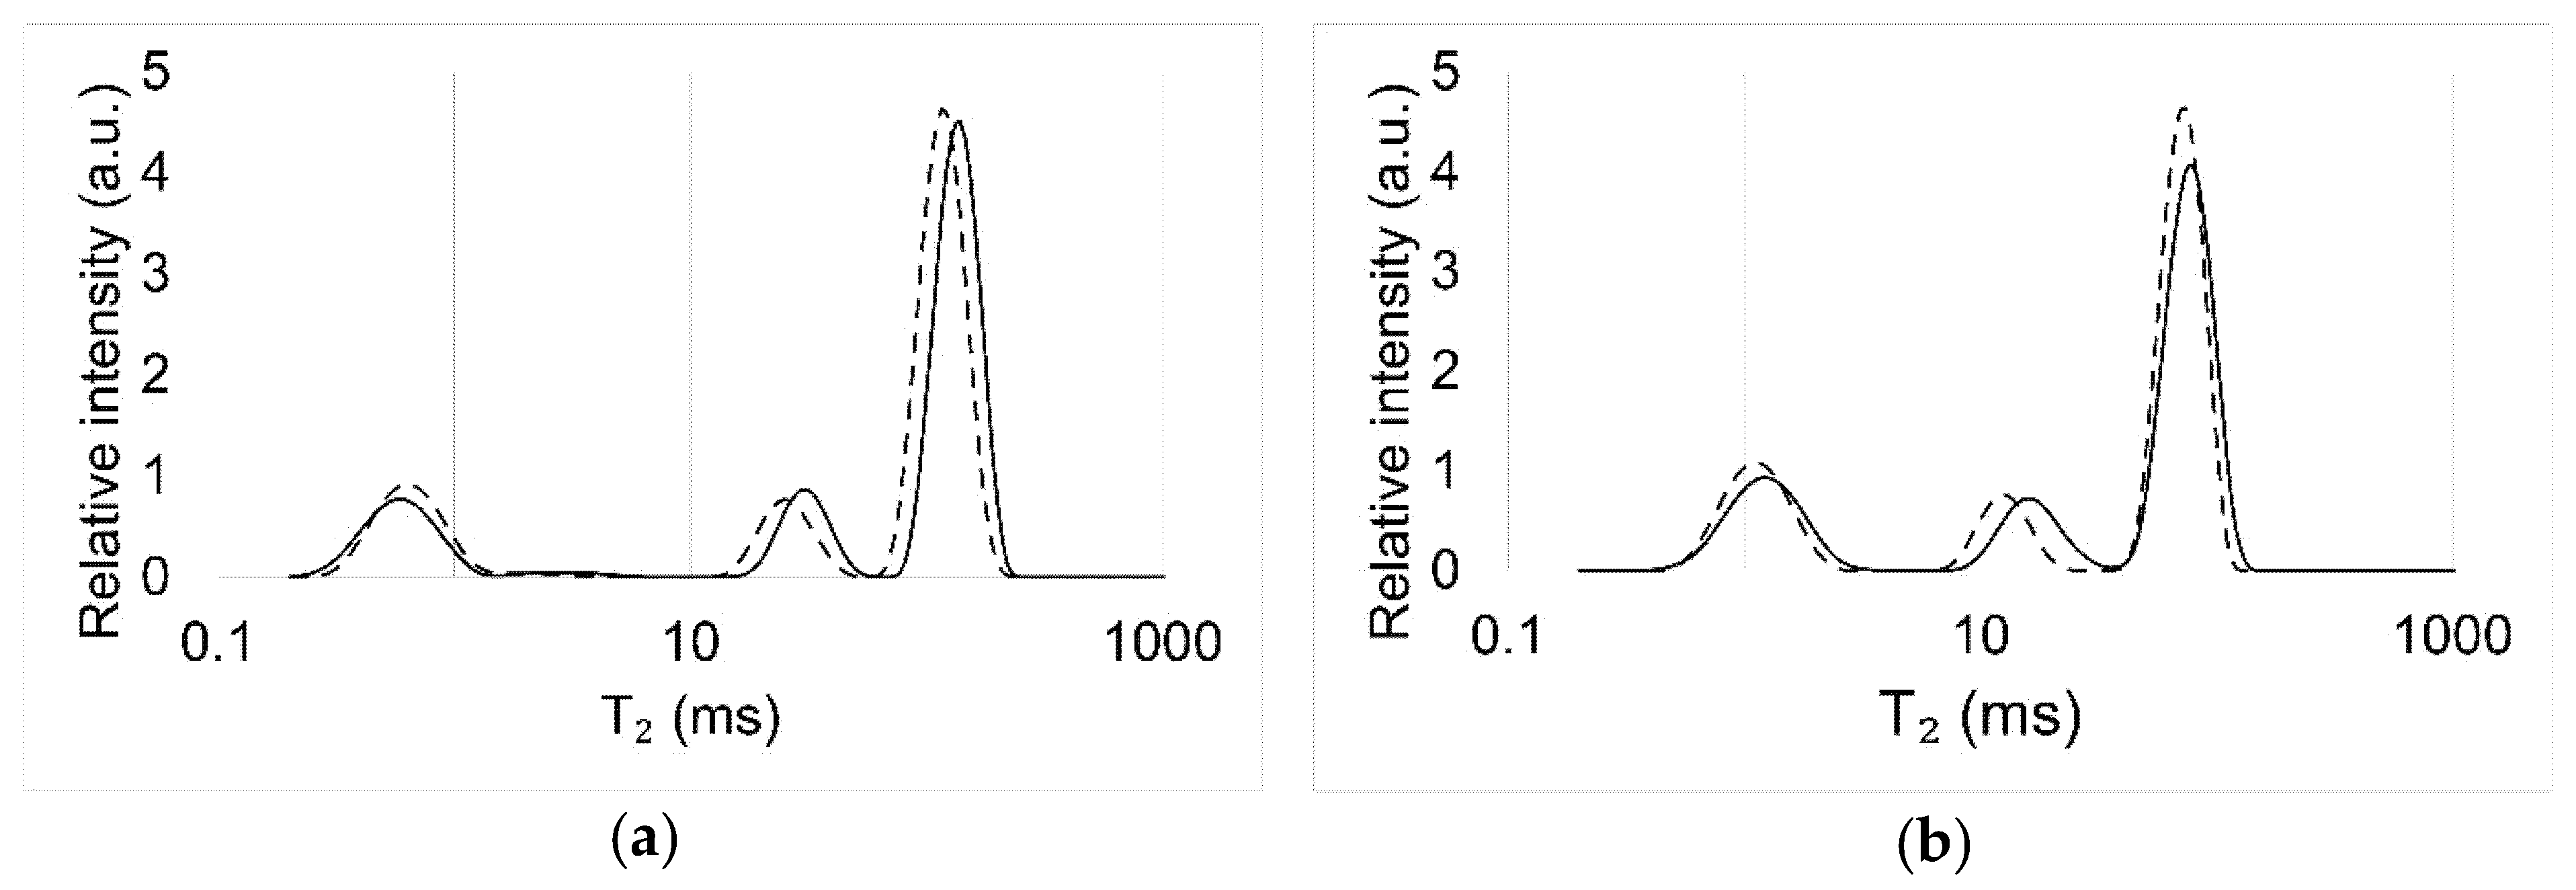
2.4. Low-Field Nuclear Magnetic Resonance (LFNMR)

From each group, ten specimens were analysed with LFNMR to distinguish between moisture in the cell walls and macro-voids, respectively. The procedure for experiment was similar to the one described by Thybring et al. [35]
Prior to the measurement, all specimens were vacuum-impregnated in water for 1 h and kept in a closed Eppendorf cup filled with water at a temperature of 20 °C until the measurement. Excess surface water from each specimen was removed with a wet cloth. A water-saturated specimen was inserted in the LFNMR probe (mq20-Minispec, Bruker, USA) and was held at constant temperature of 25 °C by a water-cooling system. The spin-spin relaxation time (T2) was determined using 1D-Carr-Purcell-Meiboom-Gill (CPMG) pulse sequence [36,37]. For each specimen, 32 scans were made with pulse separation of 0.1 ms, 8000 echoes and a recycle delay of 30 s. The measurement time was sufficient to ensure full relaxation of the signal for all specimens. The signals measured were analysed with Prospa 3.1 (Magritek, New Zealand).
The moisture content for each population of water in the wood was calculated by multiplying the total moisture content of the specimen with the ratio of the peak area to the total peak area. The amount of cell wall water in the water-saturated state, i.e., the maximum moisture content of cell wall (ωcw), is represented by the peak with shortest T2 relaxation time. Therefore, the ωcw was calculated according to Equation (2):
ω c w = ω t S c w S t
where: ωt is total moisture content in the specimen, Scw is the integral of the cell wall water peak (the peak with the shortest T2) and St is the total integral of all the peaks. The total moisture content was calculated as reduced moisture content, defined [5,38,39] as shown in Equation (3):
ω t = m s m u m u
where: ms is the mass of specimen in water-saturated state and mu is the initial oven-dried mass (103 °C, 16 h) before treatment (modification).

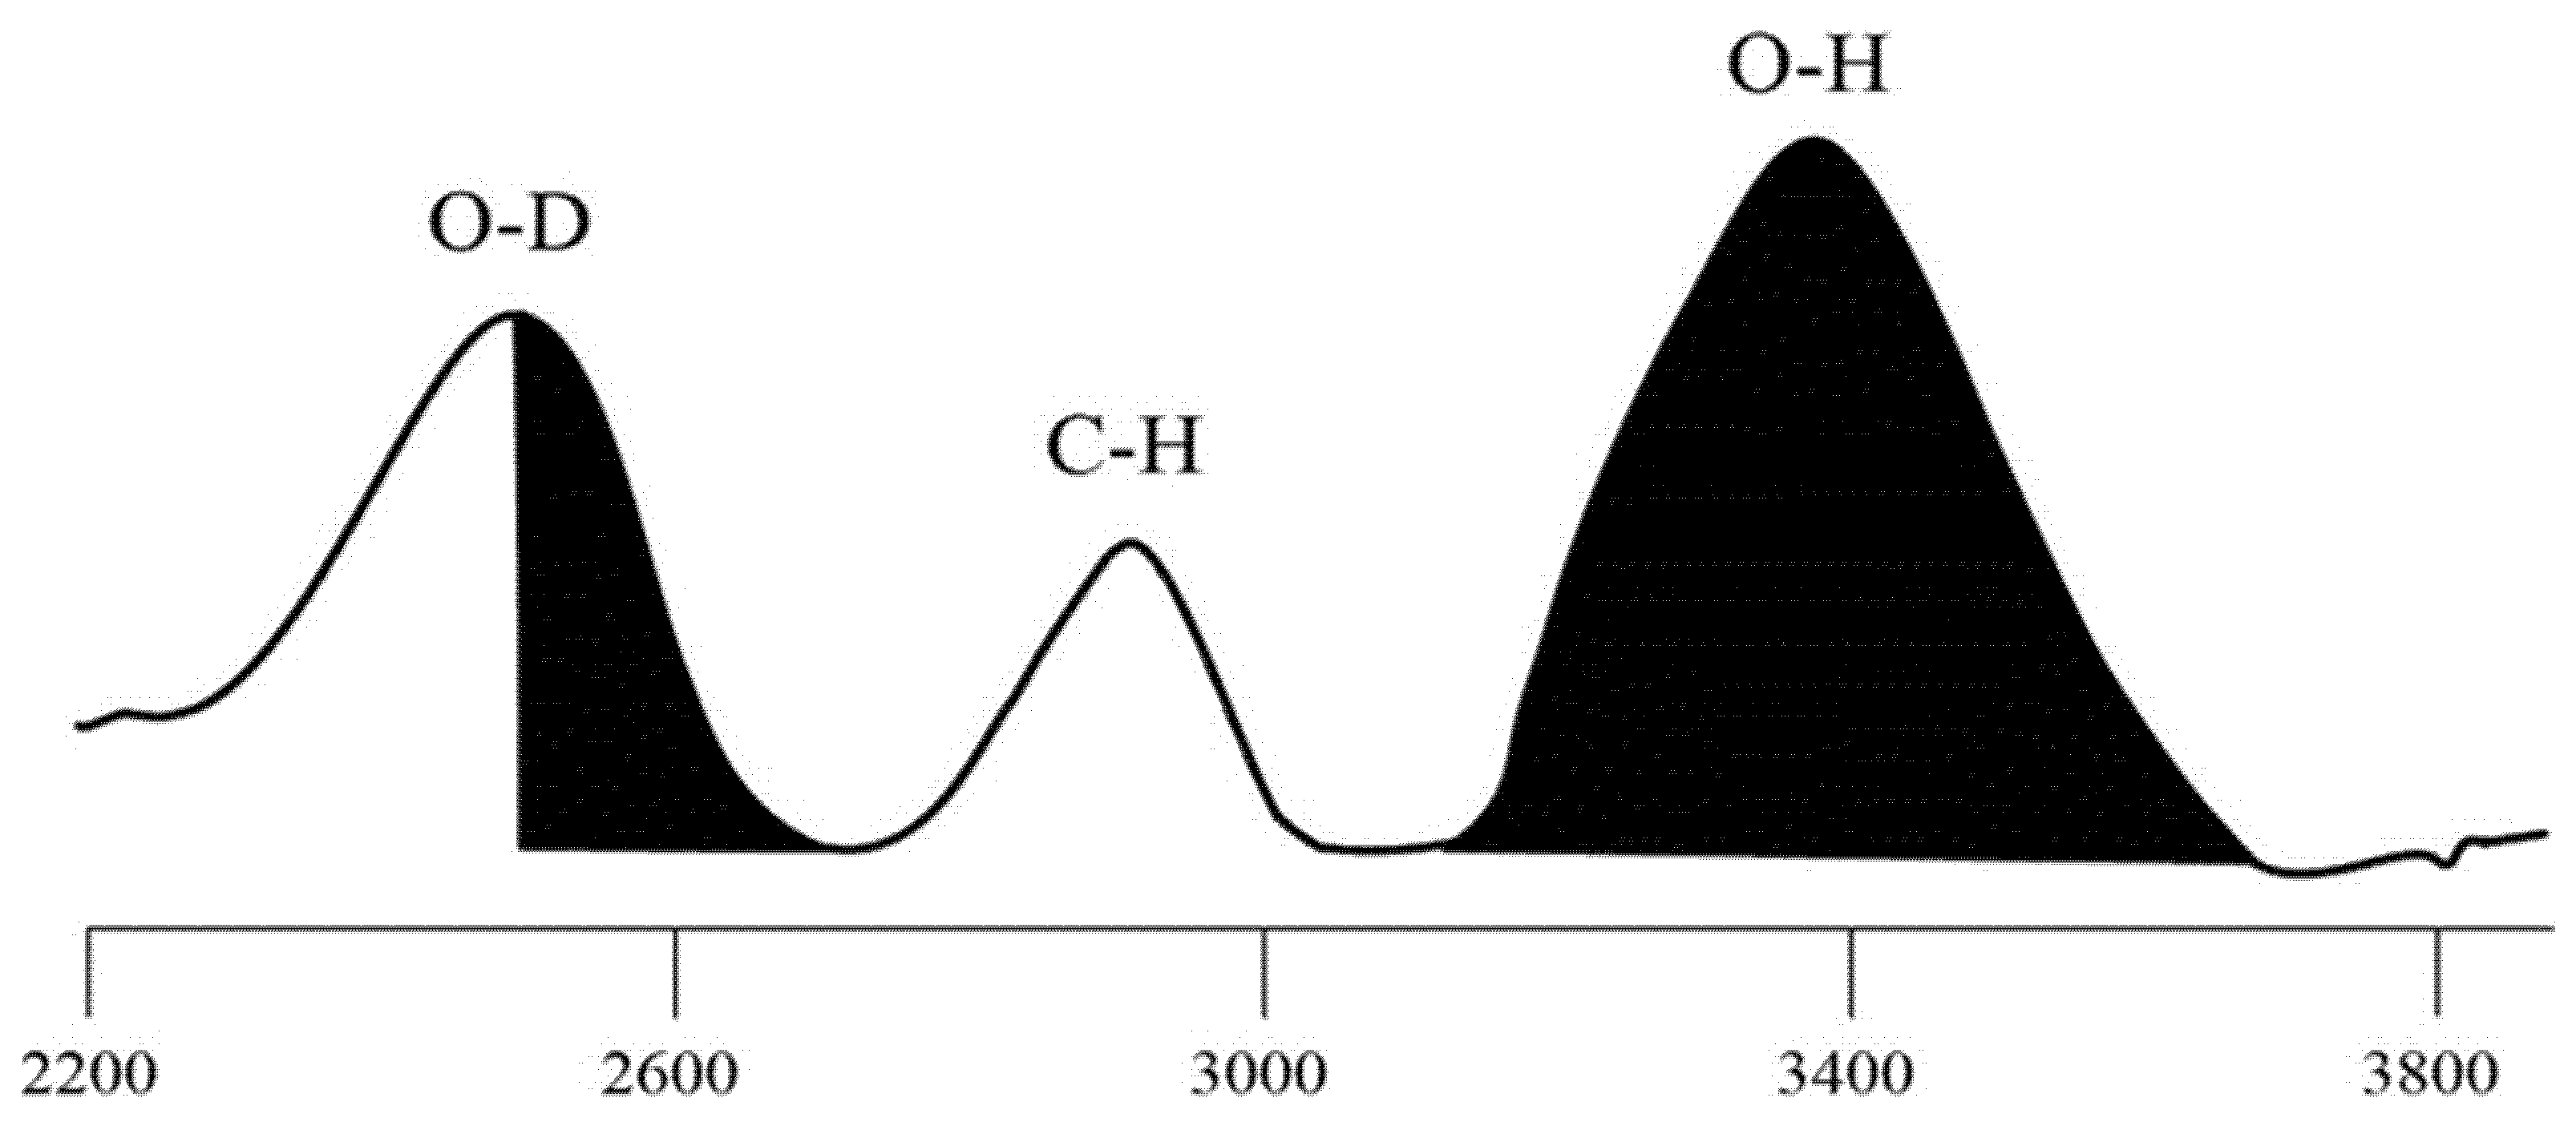
2.5. Determination of Hydroxyl Accessibility

The hydroxyl accessibility was determined by deuterium exchange for specimens using an excess of D2O in a procedure similar to Tarmian et al. [30].
Specimens were initially dried in a vacuum oven (Binder VD23, BINDER GmbH, Tuttlingen, Germany) at 60 °C under 0 mbar for 24 h. The dried specimens were then vacuum-impregnated with D2O in a reaction flask, whereby the flask containing the specimens was evacuated for 30 min and then liquid D2O was injected. The specimens were kept in fresh D2O in a glass container for 24 h. The specimens were dried in a vacuum oven at 60 °C, 0 mbar for 24 h and transferred to glass containers with molecular sieves for transport to infrared spectroscopy apparatus.
The infrared spectrum of each specimen was measured with Nicolet 6700 spectrometer with a PIKE Diamond ATR unit (Thermo Fisher Scientific, Waltham, MA, USA). For each specimen, 64 scans were made with the spectral range of 4000–400 cm−1 and resolution of 4 cm−1. Each specimen was split in the middle along the longitudinal–radial plane using a sharp razor blade immediately before the measurement. The freshly cut surface was immediately placed on the diamond ATR crystal, which was kept dry by purging with dry air in the plastic box covering the crystal and the infrared spectrum recorded. The recorded spectra were analysed with OriginPro 2021 software (OriginLab, Northampton, MA, USA).
For accessibility determination, the peak area of OH (approx. 3000–3600 cm−1) and OD stretching bands were calculated. In the spectrum, half of OD area (from around 2700 cm−1 to the peak height around 2500 cm−1) was calculated and doubled to avoid any contribution from CO2 vibration at around 2300–2400 cm−1 [32]. The accessibility was determined as the ratio of area under the OD band area to the band area of OD and OH combined.
To compare the amount of hydroxyl groups between deuterated and non-deuterated samples, the ratio of the peak amplitude of hydroxyl group (around 3300 cm−1) to the peak of lignin (around 1508 cm−1) was calculated (Figure 1).

2.6. Statistical Analysis

To determine the significant difference between groups, analysis of variances (ANOVA) was performed.

3. Results

The relative mass gain (A) and moisture content ( ω t ) are shown in Table 1. The difference in mass gain between sample groups M and ML might indicate a loss of treated chemicals by EN 84. However, the mass gain of M and ML did not show any statistically significant difference (Table 1).
Figure 2 shows average continuous T₂ relaxation time distributions for wood untreated (R), leached (RL), modified (M) and leached after modification (ML) when measured by LFNMR. Three peaks were found in the spectra. The modification with MA and SHP decreased the T2 relaxation time for the cell wall water peak but increased the T2 relaxation times of the other two peaks. This means that the behavior of not only water in the wood cell wall, but also capillary water, was influenced by the modification. The average peak maximum T2 relaxation times are shown in Table 2. Gravimetrical determination showed that ωt of modified specimens were lower than for reference specimens (Table 1).
Table 3 shows the amount of calculated deuterated and non-deuterated hydroxyl groups from analysis with FTIR, as well as accessible hydroxyl groups of the specimens. The aromatic group of lignin is believed to be unaffected by the modification treatments and the ratio of the hydroxyl group to characteristic aromatic absorption of lignin at 1509 cm−1 (OH/lignin) was found to be fairly similar between the groups in the study. The average amount of accessible OH groups calculated in unmodified samples (R) was similar to the result obtained in the study of Tarmian et al. [30] Accessible OH groups seemed not to be altered that much by the modification process. The small increase in the amount of accessible OH groups indicated after modification in the Table 2 could not be significantly confirmed in the study. ωt of modified specimens, at the water-saturated state, was found to be 24% lower than that in untreated specimens, while the maximum moisture content of the cell wall (ωcw) of modified specimens was lower by 10% (Table 1).

4. Discussion

The T2 relaxation time depends on both the effects of physical confinement and the chemical attraction of the confining surface [13]. In this study, physical confinement appeared to play the dominant role in the decrease of T2 relaxation time of the cell wall water peak by modification with MA and SHP. In the case of acetylated wood, where hydroxyl groups are substituted with acetyl groups, both a decrease in T2 relaxation time of cell wall water peak in LFNMR and a decrease in accessible OH groups by modification were observed [20]. However, in the case of wood modified with MA and SHP, the T2 relaxation time of cell wall water peak decreased (Table 2), while the amount of accessible OH groups did not show any significant difference compared to unmodified wood (Table 3). The previous study on dimensional stability indicated cross-linking can be established by modifying wood with MA and SHP, resulting in a reduced volume of modified wood at a water saturated state than the unmodified wood [32]. The applied chemical agents penetrated and occupied space in the cell wall, while at the same time, the cross-linking established as a result of modification appear to prohibit swelling of the cell walls during wetting. Therefore, the physical confinement for water in the cell wall is greater in modified wood than in untreated wood, resulting in a shorter T2 relaxation time in modified wood (Figure 2 and Table 2) and a lower ωcw of modified wood (Table 1).
The T2 relaxation time of capillary water increased as a result of the modification, indicating that the modification changed the relaxation process of excited nuclei in this water population. This tendency was also shown in other modified wood such as acetylated [21], furfurylated [9] and thermally modified wood [18,31]. The change in the two longest T2 relaxation times indicates a change in pore size and/or strength of the interaction with water. The large voids are not expected to have changed much in size by modification or may be slightly decreased as a result of heat treatment [40]. Since a potential decrease in pore size would decrease the relaxation time, the observed increase in T2 relaxation times indicate weakened wood–water interactions, which would also be expected from the cell wall water peak. The decrease in cell wall moisture content, however, may result in smaller pore sizes and this could overrule the effect of weaker interactions.
In general, the reason for the increased T2 relaxation time of capillary water in modified wood can be explained by a decrease in accessible hydroxyl groups, which can result in a decrease in hydrophilicity. The change of interaction between wood and capillary water in furfurylated and acetylated wood could be a result of a change in interaction at the surface, which is also observed as a change in contact angle [8]. It is unlikely that the hydrophilicity of cell wall components was decreased by modification with MA and SHP. When wood reacts with MA, the hydroxyl group is reacted with one carboxylic group of MA to form an ester bond while the other carboxylic group remains as the end group. The carboxylic group has both OH and C=O, which form a resonant structure and can participate in hydrogen bonding; hence, it is unlikely that the affinity of water in the cell wall will be decreased. This is also shown in the deuteration results in Table 3. The amount of accessible hydroxyl groups in modified wood did not show any statistically significant difference from untreated wood. The deuteration of the carboxylic group was observed in a study on deuteration of sugar acid by D2O [41]. Therefore, when the modified wood was treated with D2O, not only the hydroxyl group, but also the carboxylic group might be deuterated.

5. Conclusions

The use of low-field nuclear magnetic resonance (LFNMR) spectroscopy as a tool for determining the influence of moisture in wood has been further demonstrated in this study into the reaction of wood with MA and SHP. The modification that had previously been performed [32] resulted in a weak wood–water interaction using LFNMR. These values were seen as an increased T2 relaxation time of capillary water. However, the weak wood–water interaction did not seem to be related to the accessible hydroxyl groups because the modification reaction resulted in a similar number of hydroxyl groups as present in unmodified wood. The T2 relaxation time of cell wall water, on the other hand, was decreased. It seems that the physical confinement overruled the effect of weaker interactions between cell wall water and wood components.

Author Contributions

Conceptualisation, I.K., E.E.T., O.K. and D.J.; Methodology, I.K., E.E.T. and O.K.; measurements, I.K. and E.E.T.; formal analysis and writing, I.K., O.K., E.E.T. and D.J.; reviewing and editing, all; funding acquisition, D.S. All authors have read and agreed to the published version of the manuscript.

Funding

Support of the CT WOOD, a center of excellence at Luleå University of Technology supported by the Swedish wood industry is gratefully acknowledged. Financial support from the short-term scientific mission of northern European network for wood science and engineering (WSE) is also gratefully acknowledged. Emil Engelund Thybring is grateful for the support of Interreg Öresund-Kattegat-Skagerrak. Additional acknowledgement is given for the Czech Republic’s funding office for its support of “Advanced research supporting the forestry and wood-processing sector’s adaptation to global change and the 4th industrial revolution”, OP RDE (Grant No. CZ.02.1.01/0.0/0.0/16_019/0000803).

Institutional Review Board Statement

Not applicable.

Informed Consent Statement

Not applicable.

Data Availability Statement

Not applicable.

Conflicts of Interest

The authors declare no conflict of interest.

References

  1. Tiemann, H.D. Effect of Moisture upon the Strength and Stiffness of Wood; US Department of Agriculture, Forest Service: Washington, DC, USA, 1906. [Google Scholar]
  2. Rowell, R.M. Handbook of Wood Chemistry and Wood Composite; CRC Press: Boca Raton, FL, USA, 2005. [Google Scholar]
  3. Brischke, C.; Alfredsen, G. Wood-water relationships and their role for wood susceptibility to fungal decay. Appl. Microbiol. Biotechnol. 2020, 104, 3781–3795. [Google Scholar] [CrossRef]
  4. Rowell, R.M.; Ibach, R.E.; McSweeny, J.; Nilsson, T. Understanding decay resistance, dimensional stability and strength changes in heat-treated and acetylated wood. Wood Mater. Sci. Eng. 2009, 4, 14–22. [Google Scholar] [CrossRef]
  5. Thybring, E.E. The decay resistance of modified wood influenced by moisture exclusion and swelling reduction. Int. Biodeterior. Biodegrad. 2013, 82, 87–95. [Google Scholar] [CrossRef]
  6. Zelinka, S.L.; Ringman, R.; Pilgård, A.; Thybring, E.E.; Jakes, J.E.; Richter, K. The role of chemical transport in the brown-rot decay resistance of modified wood. Int. Wood Prod. J. 2016, 7, 66–70. [Google Scholar] [CrossRef]
  7. Ringman, R.; Beck, G.; Pilgård, A. The Importance of Moisture for Brown Rot Degradation of Modified Wood: A Critical Discussion. Forests 2019, 10, 522. [Google Scholar] [CrossRef] [Green Version]
  8. Thybring, E.E.; Fredriksson, M. Wood Modification as a Tool to Understand Moisture in Wood. Forests 2021, 12, 372. [Google Scholar] [CrossRef]
  9. Thygesen, L.G.; Elder, T. Moisture in untreated, acetylated, and furfurylated Norway spruce studied during drying using time domain NMR. Wood Fiber Sci. 2008, 40, 309–320. [Google Scholar]
  10. Thygesen, L.G.; Elder, T. Moisture in untreated, acetylated, and furfurylated Norway spruce monitored during drying below fiber saturation using time domain NMR. Wood Fiber Sci. 2009, 41, 194–200. [Google Scholar]
  11. Menon, R.S.; Mackay, A.L.; Hailey, J.R.T.; Bloom, M.; Burgess, A.E.; Swanson, J.S. A NMR determination of the physiological water distribution in wood during drying. J. Appl. Polym. Sci. 1987, 33, 1141–1155. [Google Scholar] [CrossRef]
  12. Labbé, N.; De Jéso, B.; Lartigue, J.C.; Daudé, G.; Pétraud, M.; Ratier, M. Moisture content and extractive materials in maritime pine wood by low field 1 H NMR. Holzforschung 2002, 56, 25–31. [Google Scholar] [CrossRef]
  13. Mitchell, J.; Stark, S.C.; Strange, J.H. Probing surface interactions by combining NMR cryoporometry and NMR relaxometry. J. Phys. D Appl. Phys. 2005, 38, 1950. [Google Scholar] [CrossRef]
  14. Fredriksson, M.; Thygesen, L.G. The states of water in Norway spruce (Picea abies (L.) Karst.) studied by low-field nuclear magnetic resonance (LFNMR) relaxometry: Assignment of free-water populations based on quantitative wood anatomy. Holzforschung 2017, 71, 77–90. [Google Scholar] [CrossRef] [Green Version]
  15. Flibotte, S.; Menon, R.S.; MacKay, A.L.; Hailey, J.R.T. Proton magnetic resonance of Western red cedar. Wood Fiber Sci. 1990, 22, 362–376. [Google Scholar]
  16. Araujo, C.D.; Mackay, A.L.; Hailey, J.R.T.; Whittall, K.P.; Le, H. Proton magnetic resonance techniques for characterization of water in wood–application to white spruce. Wood Sci. Technol. 1992, 26, 101–113. [Google Scholar] [CrossRef]
  17. Telkki, V.V.; Yliniemi, M.; Jokisaari, J. Moisture in softwoods: Fiber saturation point, hydroxyl site content, and the amount of micropores as determined from NMR relaxation time distributions. Holzforschung 2013, 67, 291–300. [Google Scholar] [CrossRef]
  18. Kekkonen, P.M.; Ylisassi, A.; Telkki, V.V. Absorption of water in thermally modified pine wood as studied by nuclear magnetic resonance. J. Phys. Chem. C 2014, 118, 2146–2153. [Google Scholar] [CrossRef]
  19. Menon, R.S.; Mackay, A.L.; Flibotte, S.; Hailey, J.R.T. Quantitative separation of NMR images of water in wood on the basis of T2. J. Magn. Reason. 1989, 82, 205–210. [Google Scholar] [CrossRef]
  20. Beck, G.; Thybring, E.E.; Thygesen, L.G.; Hill, C. Characterization of moisture in acetylated and propionylated radiata pine using low-field nuclear magnetic resonance (LFNMR) relaxometry. Holzforschung 2018, 72, 225–233. [Google Scholar] [CrossRef]
  21. Atalla, R.H.; Brady, J.W.; Matthews, J.F.; Ding, S.; Himmel, M.E. Structures of plant cell wall celluloses. In Biomass Recalcitrance: Deconstructing the Plant Cell Wall for Bioenergy; Himmel, M.E., Ed.; Blackwell Publishing: Chichester, UK, 2008; pp. 188–212. [Google Scholar]
  22. Englander, S.W.; Downer, N.W.; Teitelbaum, H. Hydrogen-exchange. Annu. Rev. Biochem. 1972, 41, 903–924. [Google Scholar] [CrossRef]
  23. Gold, V.; Satchell, D.P.N. The principles of hydrogen isotope exchange reactions in solution. Q. Rev. Chem. Soc. 1955, 9, 51–72. [Google Scholar] [CrossRef]
  24. Mann, J.; Marrinan, H.J. The reaction between cellulose and heavy water 1. A qualitative study by infra-red spectroscopy. Trans. Faraday Soc. 1956, 52, 481–487. [Google Scholar] [CrossRef]
  25. Taniguchi, T.; Harada, H.; Nakato, K. Determination of water-adsorption sites in wood by a hydrogen deuterium exchange. Nature 1978, 272, 230–231. [Google Scholar] [CrossRef]
  26. Hofstetter, K.; Hinterstoisser, B.; Salmén, L. Moisture uptake in native cellulose–the roles of different hydrogen bonds: A dynamic FT-IR study using deuterium exchange. Cellulose 2006, 13, 131–145. [Google Scholar] [CrossRef]
  27. Schmidt, M.; Gierlinger, N.; Schade, U.; Rogge, T.; Grunze, M. Polarized infrared microspectroscopy of single spruce fibers: Hydrogen bonding in wood polymers. Biopolymers 2006, 83, 546–555. [Google Scholar] [CrossRef] [PubMed]
  28. Watanabe, A.; Morita, S.; Kokot, S.; Matsubara, M.; Fukai, K.; Ozaki, Y. Drying process of microcrystalline cellulose studied by attenuated total reflection IR spectroscopy with two dimensional correlation spectroscopy and principal component analysis. J. Mol. Struct. 2006, 799, 102–110. [Google Scholar] [CrossRef]
  29. Suchy, M.; Virtanen, J.; Kontturi, E.; Vuorinen, T. Impact of drying on wood ultrastructure observed by deuterium exchange and photoacoustic FT-IR spectroscopy. Biomacromol. 2010, 11, 515–520. [Google Scholar] [CrossRef]
  30. Tarmian, A.; Burgert, I.; Thybring, E. Hydroxyl accessibility in wood by deuterium exchange and ATR-FTIR spectroscopy: Methodological uncertainties. Wood Sci. Technol. 2017, 51, 845–853. [Google Scholar] [CrossRef]
  31. Javed, M.A.; Kekkonen, P.M.; Ahola, S.; Telkki, V.V. Magnetic resonance imaging study of water absorption in thermally modified pine wood. Holzforschung 2015, 69, 899–907. [Google Scholar] [CrossRef]
  32. Kim, I.; Karlsson, O.; Jones, D.; Mantanis, G.; Sandberg, D. Dimensional stabilisation of Scots pine (Pinus sylvestris L.) sapwood by reaction with maleic anhydride and sodium hypophosphite. Eur. J. Wood Wood Prod. 2021, 79, 589–596. [Google Scholar] [CrossRef]
  33. Lande, S.; Westin, M.; Schneider, M. Properties of furfurylated wood. Scand. J. For. Res. 2004, 19 (Suppl. 5), 22–30. [Google Scholar] [CrossRef]
  34. European Committee for Standardization. EN 84 Durability of wood and wood-based products. In Accelerated Ageing of Treated Wood Prior to Biological Testing; Leaching procedure; European Committee for Standardisation: Brussels, Belgium, 2020. [Google Scholar]
  35. Thybring, E.E.; Digaitis, R.; Nord-Larsen, T.; Beck, G.; Fredriksson, M. How much water can wood cell walls hold? A triangulation approach to determine the maximum cell wall moisture content. PLoS ONE 2020, 15, e0238319. [Google Scholar] [CrossRef]
  36. Carr, H.Y.; Purcell, E.M. Effects of diffusion on free precession in nuclear magnetic resonance experiments. Phys. Rev. 1954, 94, 630–638. [Google Scholar] [CrossRef]
  37. Meiboom, S.; Gill, D. Modified spin-echo method for measuring nuclear relaxation times. Rev. Sci. Instrum. 1958, 29, 688–691. [Google Scholar] [CrossRef] [Green Version]
  38. Akitsu, H.; Norimoto, M.; Morooka, T.; Rowell, R.M. Effect of humidity on vibrational properties of chemically modified wood. Wood Fiber Sci. 1993, 25, 250–260. [Google Scholar]
  39. Hill, C.A.S. The reduction in the fibre saturation point of wood due to chemical modification using anhydride reagents: A reappraisal. Holzforschung 2008, 62, 423–428. [Google Scholar] [CrossRef]
  40. Kekkonen, P.M.; Telkki, V.V.; Jokisaari, J. Effect of thermal modification on wood cell structures observed by pulsed-field-gradient stimulated-echo NMR. J. Phys. Chem. C 2010, 114, 18693–18697. [Google Scholar] [CrossRef]
  41. Izumi, K. NMR spectra of some monosaccharides of galactopyranose series in deuterium oxide. Agric. Biol. Chem. 1971, 35, 1816–1818. [Google Scholar] [CrossRef]
Figure 1. An example ATR-FTIR spectrum in the range of 2200–3800 cm−1 of deuterated Scots pine after exposure to D2O. The surface area marked were used for calculating the accessible hydroxyl group. To avoid contribution from CO2 vibration at the range of 2300–2400 cm−1. Only the area between 2700 cm−1 and height wavenumber (approx. 2510 cm−1) was determined and doubled modified from [30].
Forests 12 01333 g001
Figure 2. Continuous T₂ distributions of Scots pine sapwood (a) modified and (b) untreated averaged over the distributions found for the ten replicates. The dashed line shows sample leached according to EN 84 while solid line shows samples without leaching.
Forests 12 01333 g002
Table 1. Relative mass gain (A), moisture content ( ω t ) determined gravimetrically and maximum moisture content of cell wall (ωcw) calculated based on the LFNMR results of Scots pine sapwood modified (M), modified and leached (ML), untreated (R) and untreated and leached (RL) at the water-saturated state. Values in parentheses are standard deviation.
Sample GroupA (%)ωt (%)ωcw (%)
M11.8 ± 1.0125.9 (7.1)23.6 (1.8)
ML9.4 ± 1.3126.5 (7.1)26.1 (2.1)
R-150.5 (8.6)34.6 (1.7)
RL−1.6 ± 0.4150.8 (7.6)35.4 (2.2)
Table 2. Peak maximum T2 relaxation time distributions of Scots pine sapwood modified (M), modified and leached (ML), untreated (R) and untreated and leached reference (RL) at the water-saturated state in LFNMR analysis. Values in parenthesis are standard deviation.
Sample GroupT2 (ms)
Peak 1Peak 2Peak 3
M0.5 (0.1)30.4 (3.4)137.7 (7.2)
ML0.6 (0.1)25.4 (4.1)118.8 (10.9)
R1.2 (0.1)16.4 (2.7)78.4 (4.7)
RL1.1 (0.1)12.7 (1.3)72.4 (2.9)
Table 3. Ratio of peak amplitude of hydroxyl group to lignin (OH/lignin) and percentage of accessible hydroxyl group (%) calculated from FTIR data. Values in parenthesis are standard deviation.
Sample GroupOH/LigninAccessible OH (%)
UndeuteratedDeuterated
M2.14 (0.81)0.99 (0.51)47.3 (5.8)
ML1.77 (0.75)0.97 (0.24)47.8 (3.5)
R2.22 (1.30)2.02 (1.00)41.5 (4.6)
RL2.42 (0.40)1.44 (0.39)42.5 (8.9)
Publisher’s Note: MDPI stays neutral with regard to jurisdictional claims in published maps and institutional affiliations.

