
Can Forest-Related Adaptive Capacity Reduce Landslide Risk Attributable to Climate Change?—Case of Republic of Korea


1
College of General Education, Kookmin University, 77 Jeongneungro, Seongbukgu, Seoul 02707, Korea
2
Institute of Forest Science, Kookmin University, 77 Jeongneungro, Seongbukgu, Seoul 02707, Korea
3
Department of Forest Resources, Chonnam National University, 77 Yongbong-ro, Bukgu, Gwangju 61186, Korea
*
Author to whom correspondence should be addressed.
Forests 2022, 13(1), 49; https://0-doi-org.brum.beds.ac.uk/10.3390/f13010049
Submission received: 17 November 2021
/
Revised: 13 December 2021
/
Accepted: 14 December 2021
/
Published: 2 January 2022
(This article belongs to the Special Issue Adaptive Forest Management to Climatic Change)
Abstract
:Recent cases of climate disasters such as the European floods in 2021 and Korea’s longest rainy season in 2020 strongly imply the importance of adaptation to climate change. In this study, we performed a numerical prediction on how much climate change adaptation factors related to forest policy can reduce climate disasters such as landslides. We focused on the landslide in Korea and applied a machine learning model reflecting adaptive indicators in the representative concentration pathway 8.5 climate scenario. The changes in the landslide probability were estimated using the Random Forest model, which estimated the landslide probability in the baseline period (2011) with excellent performance, and the spatial adaptation indicators used in this study contributed approximately 20%. The future landslide risk predicting indicated a significant increase in the Very High and High risk areas, especially in 2092. The application of the forest-related adaptation indices based on the policy scenario showed that in 2050, the effect was not pronounced, but in 2092, when the risk of landslides was much higher, the effect increased significantly. In particular, the effect was remarkable in the Seoul metropolitan and southern coastal regions. Even with the same adaptive capacity, it exerted a larger effect on the enhanced disasters. Our results suggest that the enhancement of adaptive capacity can reduce landslide risk up to 70% in a Very High risk region. In conclusion, it implies an importance to respond to the intensifying climate disasters, and abundant follow-up studies are expected to appear in the future.
1. Introduction
The global declaration of carbon neutrality and the emergence of environmental, social, and governance criteria-based management is becoming a new trend in the twenty-first century for countries and companies to take the lead in responding to the climate crisis [1,2,3]. The recent recognition of climate change as a crisis includes the mandatory obligation to reduce greenhouse gas emissions, but also because climate-induced disasters are getting worse every year [4,5]. Consequently, in response to climate change, the importance of technology to adapt to the changing climate as well as greenhouse gas reduction is increasing, and this can be confirmed in the direction and reports of the United Nations Framework Convention on Climate Change and the Intergovernmental Panel on Climate Change [6,7,8].
The recent examples of climate disasters strongly suggest the importance of adaptation. In July 2021, floods that hit Germany, Belgium, and the Netherlands caused the loss of hundreds of lives and astronomical property damage [9]. However, the precipitation that produced this flood was only 100–150 mm for two days. These developed countries suffered excessive damage, despite the amount of precipitation that can often occur during the rainy season in the monsoon climate zone, due to lack of “adaptation”. In the northwestern European countries such as Germany, the seasonality of precipitation is low, and heavy rains rarely occur throughout the year; therefore, the rivers and water supply networks are not prepared to withstand climatic disasters [10]. It is speculated that the future climate change will shift the traditional climate system and cause new types of disasters even in areas where such disasters have not occurred before.
Forests play a significant role in climate change and are valuable resources that can contribute to both mitigation and adaptation [11,12]. In particular, extreme climatic disasters such as floods and droughts are directly linked to forest disasters such as landslides and forest fires [13,14,15]. Among them, landslides are mostly caused by heavy rains, and are greatly impacted by the climate change [16]. To reduce forest disasters such as landslides, there are forest management policies and technical applications such as erosion control facilities. However, their contribution toward the reduction or prevention of forest disasters is significantly less. In other words, the prediction of forest disasters via the application of adaptation policies or forest management is severely limited.
Recently, artificial intelligence techniques have been proposed as an alternative for the spatial prediction of adaptation policies established in the form of documents or numeric value [14,17,18]. If the policies and future plans are spatialized through a rational process, then they can be learned by artificial intelligence and reflected in disaster prediction. Because machine learning techniques have an advantage in predicting disasters such as landslides, this approach has a high utility in integrated prediction with adaptation policy [19,20]. By combining artificial intelligence and spatialization techniques, it could be possible to predict the extent by which the adaptation factors can reduce climate disasters such as landslides.
In the case of Republic of Korea (hereafter, referred to as “Korea”), which belongs to the temperate monsoon zone and where the summer precipitation is concentrated, a number of landslides occurred due to the longest rainy season ever recorded in 2020. Again in 2011, hundreds of landslides occurred across the country in just a few days owing to short-term heavy rains [21,22]. In particular, the heavy rains in 2011 were similar to the form of torrential rain predicted to occur in the future, and it can be utilized to develop disaster mitigation guidelines that can prevent climate-induced forest disasters in the future [16]. This is the reason why the 2011 landslide still plays an important role in Korea’s landslide research and policy, even though it occurred 10 years ago. According to these characteristics, Korea will be effective as a case for reduction of climate disasters such as landslides, and it will be possible to simulate the impact of adaptive capacity enhancement by learning actual policies through artificial intelligence models.
This study was conducted with the aim to perform a numerical prediction of how much climate change adaptation factors such as forest policy can reduce climate disasters such as landslides in Korea, which has experienced record landslides in the past. We predicted the landslide probability using a machine learning-based model. The model learns the adaptive factors together to evaluate their landslide reduction ability of the adaptive capacity. In particular, we evaluated the extent to which climate change risks can be offset by applying future adaptation factors based on forest policies. Herein, our ultimate object is to discuss the effectiveness of policy-based adaptive capacity, and how it can be evaluated in terms of response to climate disasters such as landslides.
2. Materials and Methods
2.1. Study Area
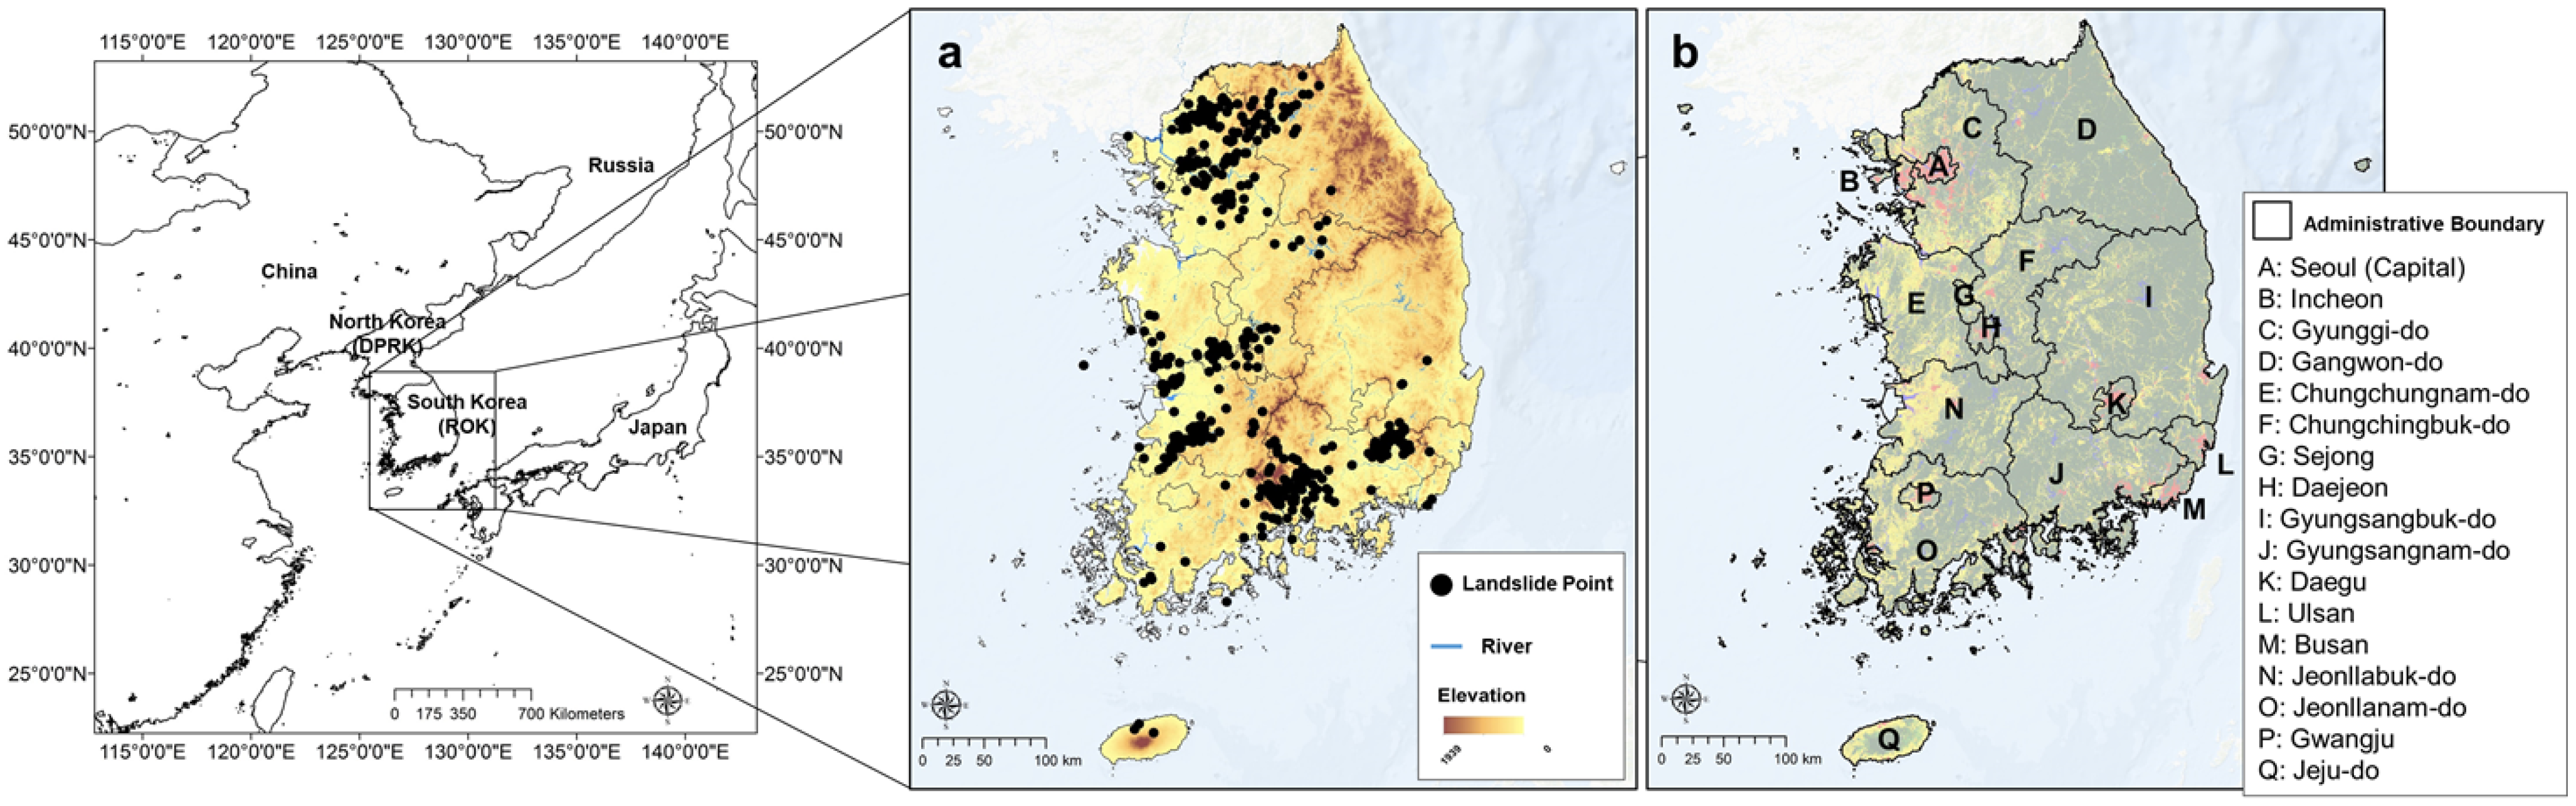
Korea is located in the mid-latitude region in East Asia and occupies half of the Korean Peninsula, covering an area of approximately 100,000 km2, with mountainous areas in the east and plains in the west and south. In Korea, approximately 63% of the land is covered by forests, followed by agricultural land with the highest percentage of land use (Figure 1b). Although the ratio of land use in cities is not high, most of them show a dense population distribution, and a high proportion of the population resides in the metropolitan area and major base cities (Busan, Daegu, Daejeon, etc.) [14]. Korea is a temperate climate region, and forests are mainly distributed as temperate forests. Some subtropical forests are found in Jeju Island and parts of the southern coast, whereas subalpine forests are present the mountainous areas centered at Baekdudaegan which is main mountain range of the Korean Peninsula. However, due to climate change, subalpine forests are significantly declining, while the subtropical forest habitats are increasing [10,23,24].
Korea has a temperate monsoon climate with high temperature and high humidity in summer and a cool and dry climate in winter [25,26]. The average annual temperature is 10–15 °C, and the average annual precipitation is 1000–1800 mm [26]. Due to these seasonal climatic characteristics, landslides and floods occur frequently in summer, and drought and forest fires occur in winter and spring. In the future projection according to the representative concentration pathways (RCP) 8.5 scenario, the temperature in the second half of the twenty-first century is predicted to increase by approximately 4.7 °C, and the precipitation is also expected to increase by approximately 13% in the long term, although there will be a large annual variation [27]. In particular, significant changes are expected in the heat waves, rainfall intensity, and drought intensity [14,28].
The number of landslides recorded in 2011 were the highest in the past 20 years, and numerous landslides occurred in the metropolitan areas and the southern slopes of Mt. Jiri (Figure 1a). In particular, the landslides in the metropolitan areas resulted in a large number of casualties and property damage. This event was used as a benchmark to increase the awareness about landslide prevention and reduction.
2.2. Data
2.2.1. Landslide Occurrence Data
For the machine learning model to learn the representative landslide occurrence information in Korea, national-scale information on landslide occurrences (in 2011), which caused the largest landslide-induced damage in the metropolitan area during the last 20 years (2000–2019), was used [29]. The landslide occurrence data was collected via field surveys conducted by the Korea Forest Service after the landslide and provided by the National Institute of Forest Science. The information on a total of 573 occurrences that occurred in 2011 was utilized, and it was confirmed that all these landslides were caused by heavy rain and typhoons. Approximately 30% of all the occurrences occurred on 27–28 July 2011, when heavy rain was recorded. In particular, the landslide occurrences were concentrated in some areas such as the metropolitan area and the southern coast, where the precipitation intensity was high. To train the model, information other than the spatial location of the landslide was excluded, and the occurrence location was processed to be the presence data.
2.2.2. Climate Indicators and Data
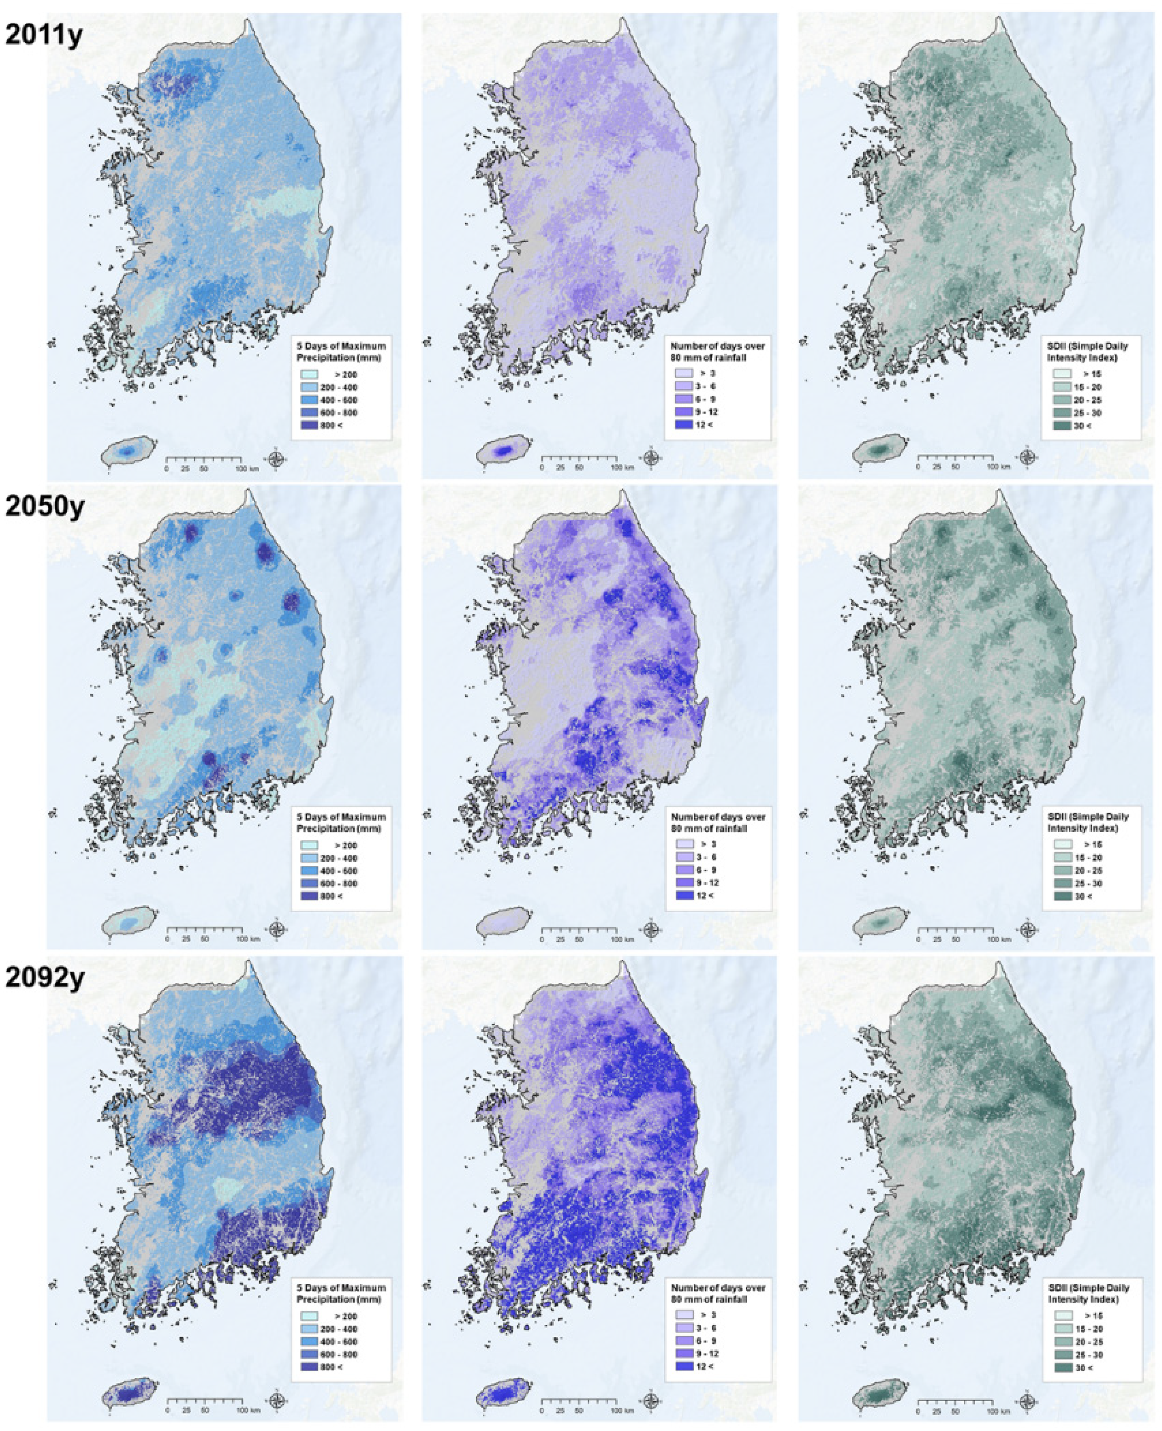
In this study, three climate indices representing precipitation intensity were selected to predict the landslide probability. These indices were the simple daily intensity index (SDII; an indicator that statistically describes the rainfall intensity), five days of maximum precipitation (MX5D; showed a high correlation with the occurrence of landslides reported in a number of studies) [30,31], and number of days with over 80 mm of precipitation (R80; the standard for heavy rain in Korea) (Table 1). SDII is calculated as the total annual precipitation divided by the number of wet days (precipitation ≥ 1 mm) in a certain year, and MX5D represents the highest five consecutive precipitation days in a year. In contrast, R80 is counted as the number of days in a year when precipitation ≥ 80 mm.
For climate indicators, data from three periods were used (Figure 2). First, to learn and evaluate the past occurrences, climate data from 2011, the same period as that when the landslide data was collected, were used. For the meteorological data of 2011, three indices were obtained through the modified Korea parameter–elevation regressions on independent slopes model (MK-PRISM) v12 data provided by the Korea Meteorological Administration (KMA). The MK-PRISMv12 data provided daily and monthly grid unit weather information by combining the national automated synoptic observing system and the automatic weather system network and downscaling the data a resolution of 1 km2 using the MK-PRISM method. The PRISM technology was developed by the Oregon State University in the US and has been used in many areas [32,33]. In Korea, this technology is being used since the late 2000s. By improving the PRISM technique, K-PRISM [34] and MK-PRISM [35] were developed. The MK-PRISM method is weighted according to altitude, slope direction, and ocean level, and is an improved methodology for analyzing and predicting the climatic situation of Korea.
The future period was selected as the years 2050 and 2092, for which the precipitation intensity has been projected to be high in the RCP8.5 scenarios. Although the precipitation intensity in 2011 in Korea was very high, even in the RCP8.5 scenarios for East Asia where the precipitation increases, it did not exceed by this much amount in many years. Therefore, a specific year with a high precipitation intensity was selected and applied. As a result of analyzing the rainfall intensity for the entire 21st century by RCP8.5 scenarios, the years that can represent the intensity of the middle and the end of the century are 2050 and 2092. Among the downscaled climate models provided by KMA, HadGEM3-RA, which enables an extreme climate simulation, was selected. HadGEM3-RA is a Korean regional climate model of HadGEM2-AO GCM, and it has been most used in modeling the impact of climate change in Korea.
2.2.3. Forest-Related Adaptive Indicators and Data
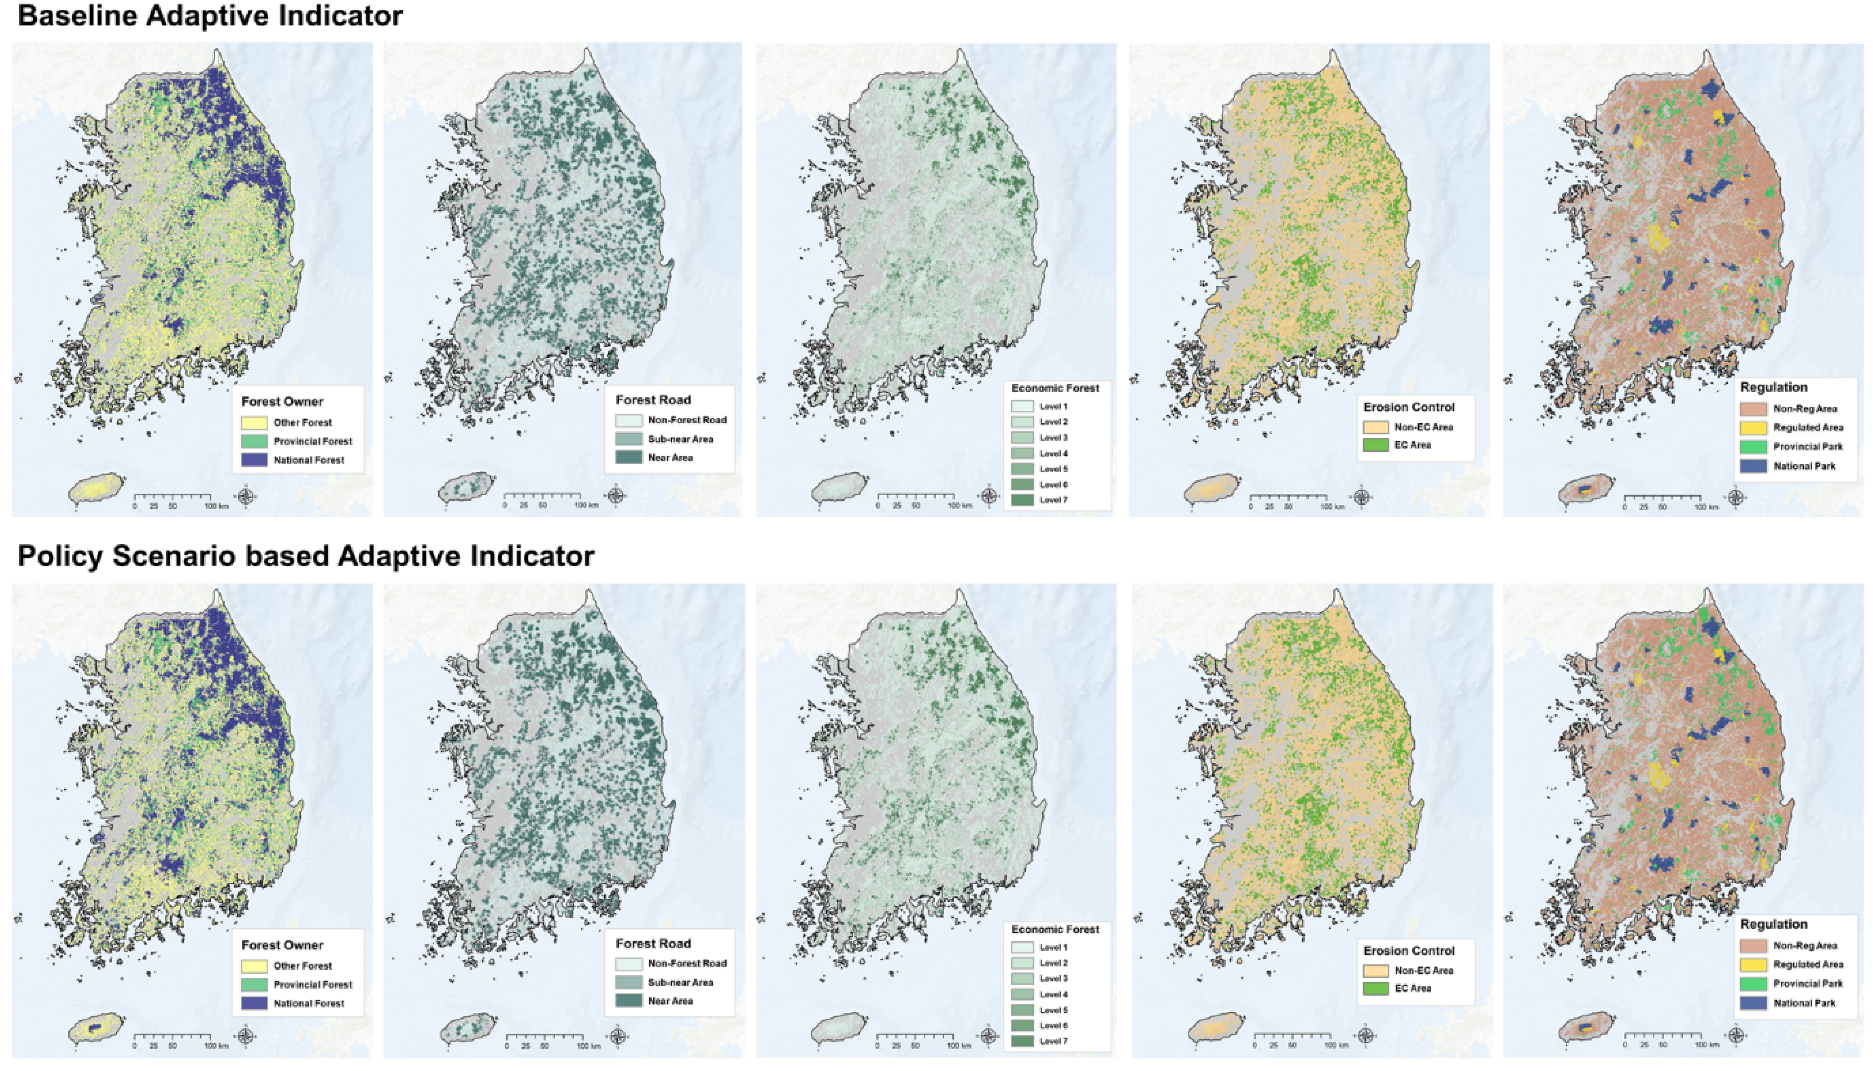
Forest-related adaptation indices can change depending on forest management and policies, and we tried to select indices that are strongly related to the occurrence of landslides. In particular, we considered indicators that can be applied to achieve the numerical plans targeted by the Korea’s sixth Basic Forest Plan (2018–2037) [36]. The five forest-related adaptation indicators were selected based on the review results of previous studies such as statistics on the decreasing number of landslides in national forests [37], the effect of forest disaster prevention according to forest management conditions (forest roads, economic forests, etc.) [38,39], the reduction of landslides the closer to the erosion control facility [40], and the forest disasters decreased in national parks or protected areas. Forest ownership, distance from forest road, economic forest utilization level, erosion control facilities, and protection area were selected as the forest-related adaptation indicators based on the results reported in previous studies (Table 1 and Table 2, Figure 3).
In the case of forest ownership, only forest areas were extracted by collecting land ownership information in Korea as spatial data, and these were classified into three classes: national forests, provincial forests, and others (private forests, etc.), and subsequently processed as input variables.
For the distance from forest road, which was extracted from the Korean forest road data, the distance from the forest road was calculated in meter using the Euclidean distance method, graded according to the distance, and finally used as an input variable. It was divided into areas within 1 and 2 km, and beyond.
The economic forest utilization level was designed in this study to spatialize the concentration rate of the economic forest area, which is an industrial forest use area in Korea. To design this indicator, the economic forest development area, forest ownership, and distance from forest road were overlapped and divided into seven sections. The class details are shown in Table 2.
The erosion control facilities indicator collected precise location information of installed erosion control facilities in Korea and classified them into forest areas with and without erosion facilities. Here, the distance from the erosion facilities was calculated in meter, and it was used as an input variable by dividing it into cases within 1 km and others. However, since the landslide occurred in 2011, only data up to that point were included, and the erosion control facilities installed after 2011 were used as the data for future scenarios.
Protection area was classified into three categories by collecting geospatial information on legally protected public areas in Korea. The “National and Provincial Park” for national parks and parks designated by the local governments, “Other protected area” for conservation green areas, forest protection areas, and urban nature parks, and “Non-protected area” for forest areas without any legal protection were used as the input variables.
2.2.4. Environmental Data
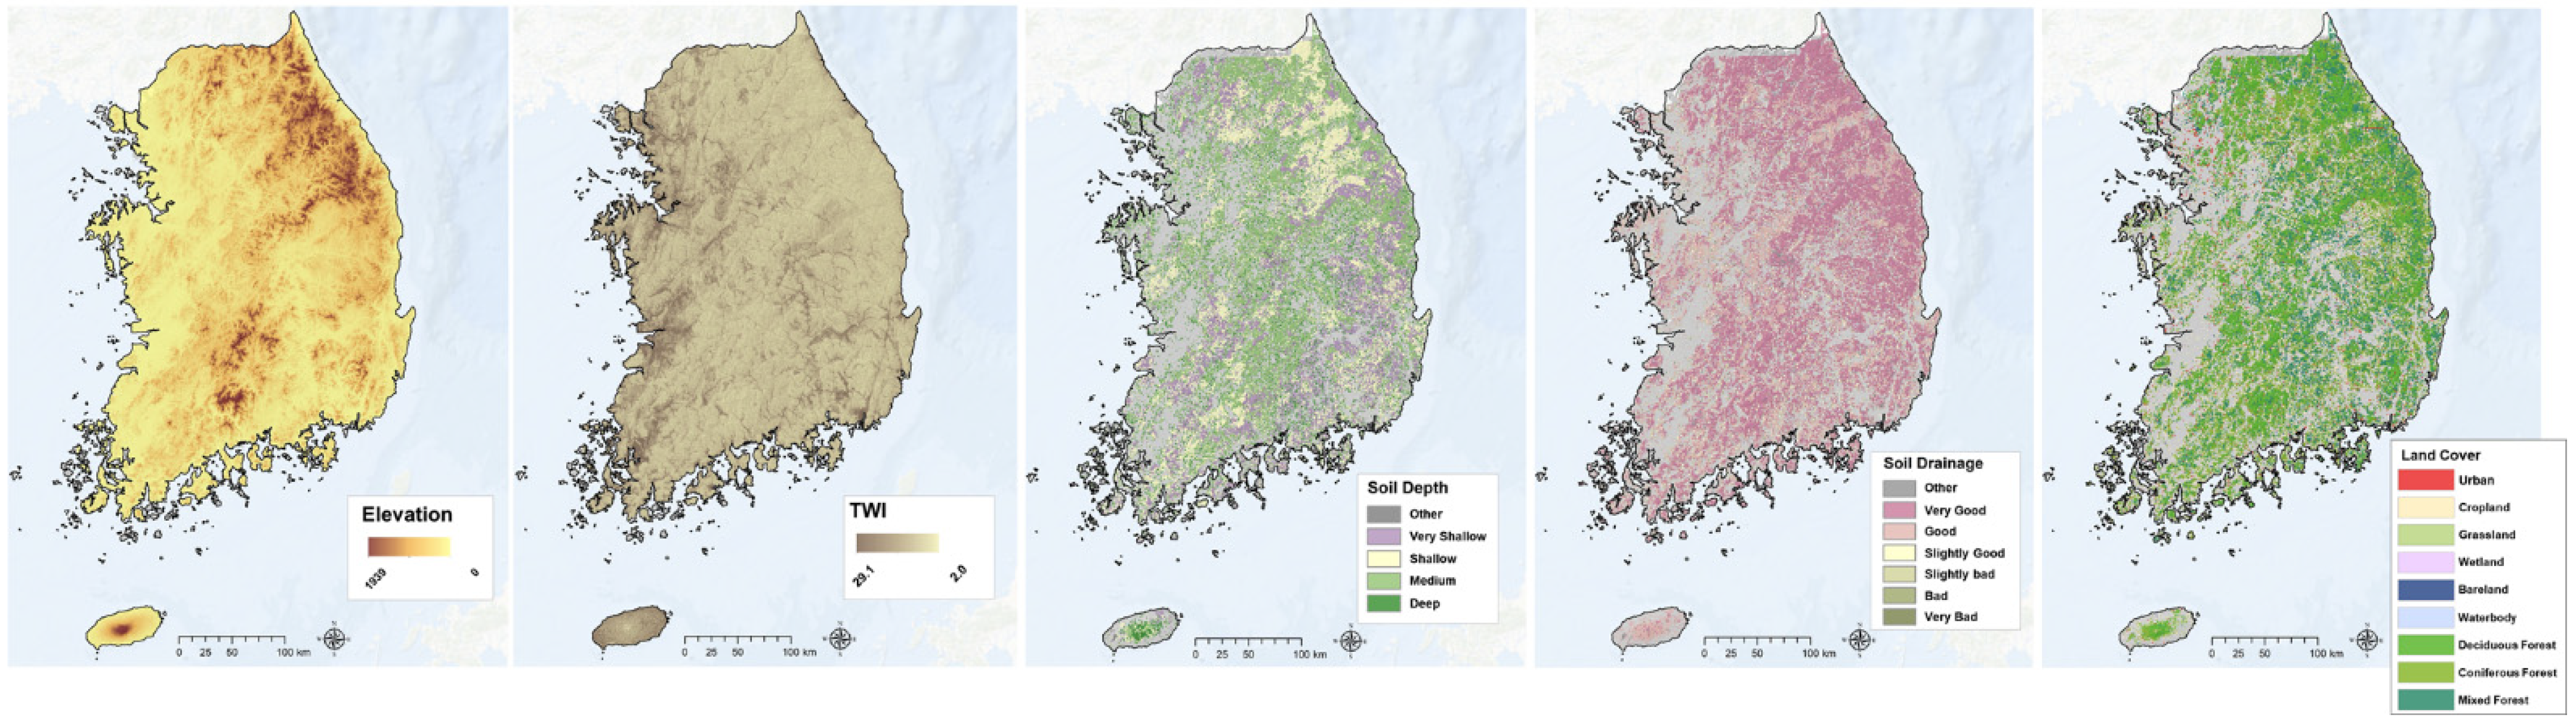
The environmental variables mainly used in existing studies on landslide occurrence and forest disasters were employed in the present investigations [30,31]. Five variables for topography, soil, and land use were used. For topography, elevation and topographic wetness indices (TWI) were used (Table 1 and Figure 4). For elevation, the digital elevation model (DEM) produced by the Korean Ministry of Land, Infrastructure and Transport was resampled to the standard spatial resolution, extracted, and then used for the forest areas. TWI is a topographical indicator of soil wetness and can be calculated using the DEM and relevant equations [41]. For soil data, effective soil depth and soil drainage class, which are strongly related to landslides, were used from the survey information obtained from the soil environment information system of the rural development administration, Korea. Land use was included according to the characteristics of landslides in Korea, where many landslides occur in urban or adjacent developed areas. The forest areas are divided into conifers, deciduous, and mixed forests, and the non-forest areas are divided into urban, cropland, and water bodies. For land use data, the mid-class land cover map of 2013, produced by the Korean Ministry of Environment, was used.
2.3. Method
2.3.1. Random Forest for Assessing Landslide Probability
The Random Forest (RF) algorithm, which is a widely used machine learning technology, was used to predict the landslide probability. The RF algorithm is based on ensemble techniques for regression and classification using various decision trees [42,43]. This model generates decision trees on several randomly selected bootstrap samples to obtain an estimation from each tree, select a subset of explanatory variables at every node [43] and yield the final result as the average of all trees [42].
In this study, the R packages (R core team, Vienna, Austria, http://www.R-project.org, accessed on 11 July 2020) of “randomForest” and “sdm” were used to run the RF algorithm [44]. The point shapefiles of the landslide occurrence data indicate the labeled data for the RF model. Our model creates decision trees for the randomly selected 1500 bootstrap samples from the labeled data of landslide probability to be predicted by each tree [45]. The selected climate, environmental, and adaptive indicators were used as independent variables, and the absence points were randomly selected individual points across the country.
For evaluating the model performance, we partitioned the combined points into two subsets: training and validation. We applied 70% of the landslide occurrence data for model training, and the other 30% was used as the testing dataset. The prediction performance of the model was evaluated by applying the most common threshold independent method, i.e., the receiver operating characteristic (ROC) curve [25]. The area under the ROC curve (AUC) is a recognized quantitative performance metric that explains the model accuracy. An AUC value closer to 1 implies a higher prediction accuracy. These concepts have been described in detail in the previously published reports [25,43,46,47].
The landslide probability value between 0 and 1 was classified into five classes of risk [30]. For the classification, the predicted landslide probability was extracted from the total landslide-occurrence location information, and 0.9095 or higher, which corresponds to the top 50%, was classified as Very High. In addition, 0.7888 or higher, i.e., the top 80% was classified as High, 0.7126 or higher meaning the upper 90% was classified as Medium, and 0.5198 or higher meaning 90–100% was classified as Low. Below 0.5198, which was the lowest value of the landslide point, was classified as Very Low.
2.3.2. Constructing an Adaptive Scenario Based on National Policy
In this study, the various goals to be achieved in the sixth Basic Forest Plan (2018–2037) established by the Korea Forest Service were constructed using detailed scenarios and applied to the machine learning model. Although this is basically a plan for forest management, it corresponds to adaptation in terms of climate change; therefore, herein, it is referred to as an adaptation scenario. We derived the future information that underwent changes according to the sixth Basic Forest Plan on the aforementioned five forest-related adaptation variables and implemented it in the spatial data (Figure 3).
First, in the case of forest ownership, a scenario was designed to convert the points that meet specific conditions into state land by considering the national forest expansion plan (1.62–2.04 million ha) of the 6th Basic Forest Plan. The Basic Forest Plan also suggests the nationalization of economic forests and protected areas. Therefore, in this study also, the scenario of converting the economic forests or protected areas (that are not currently national forests) to national forests was applied. Accordingly, the national forest area 14,074 km2, used as an input variable, was expanded to 18,022 km2. However, in the process of converting the spatial units, forest areas made of small patches were lost or merged into other owner areas, resulting in a slight deviation from the actual statistics.
In the case of distance from forest road, a scenario also was designed based on the sixth Basic Forest Plan. For forest roads, the goal is to increase the density of forest roads, within the economic forest area, from 4.8 to 12.8 m/ha. Therefore, in this study, the economic forest development area was overlaid on the distance information obtained from the previously classified forest road to minimize the area with low forest-road density within the economic forest. Accordingly, the forest road grades of 1300 (economic and national forests far from the forest road) and 800 cells (economic forests and public forests far from forest road) were upgraded.
In the case of economic forest utilization level, the increase in the concentration of forestry projects in economic forests (60% to 90%) was reflected from the sixth Basic Forest Plan. In this study, the economic forest utilization level was classified according to forest ownership and distance from forest road. Therefore, this variable was designed to increase the concentration of forestry projects with changes in the other two variables. In the adaptation scenario, the highest level, Level 7, was increased from 3089 to 6801 km2.
The erosion control facilities proposed a policy to expand the management of areas vulnerable to landslides from the current 21,000 to 90,000 locations in the sixth Basic Forest Plan. To reflect this policy directive, we designed a scenario in which the erosion protection facilities are expanded to areas where erosion protection facilities do not currently exist, even in areas vulnerable to landslides. However, since in this study, the model learning is performed using the 2011 landslide data, the erosion control facilities installed in 2011 were included into the adaptation scenario. As a result, the forest area with erosion facilities (12,181 km2) increased to 14,242 km2 after the adaptation scenario was applied.
In the sixth Basic Forest Plan, the forest protection area is set to be expanded from 427 to 500 ha. Accordingly, in this study as well, the protected areas were expanded. However, it was difficult to predict the new designation of national and provincial parks, and thus, the expansion of forest-related protected areas was applied. Based on this, among the areas that are not currently designated as protected areas, the ecological nature grade 1 in the national ecosystem and nature map, conservation forest in the forestry classified map, and national forest areas were added as forest protection areas. Overall, a total of 1224 km2 of protected areas were added.
3. Results and Discussion
3.1. Evaluation of Model Performance and Baseline Prediction
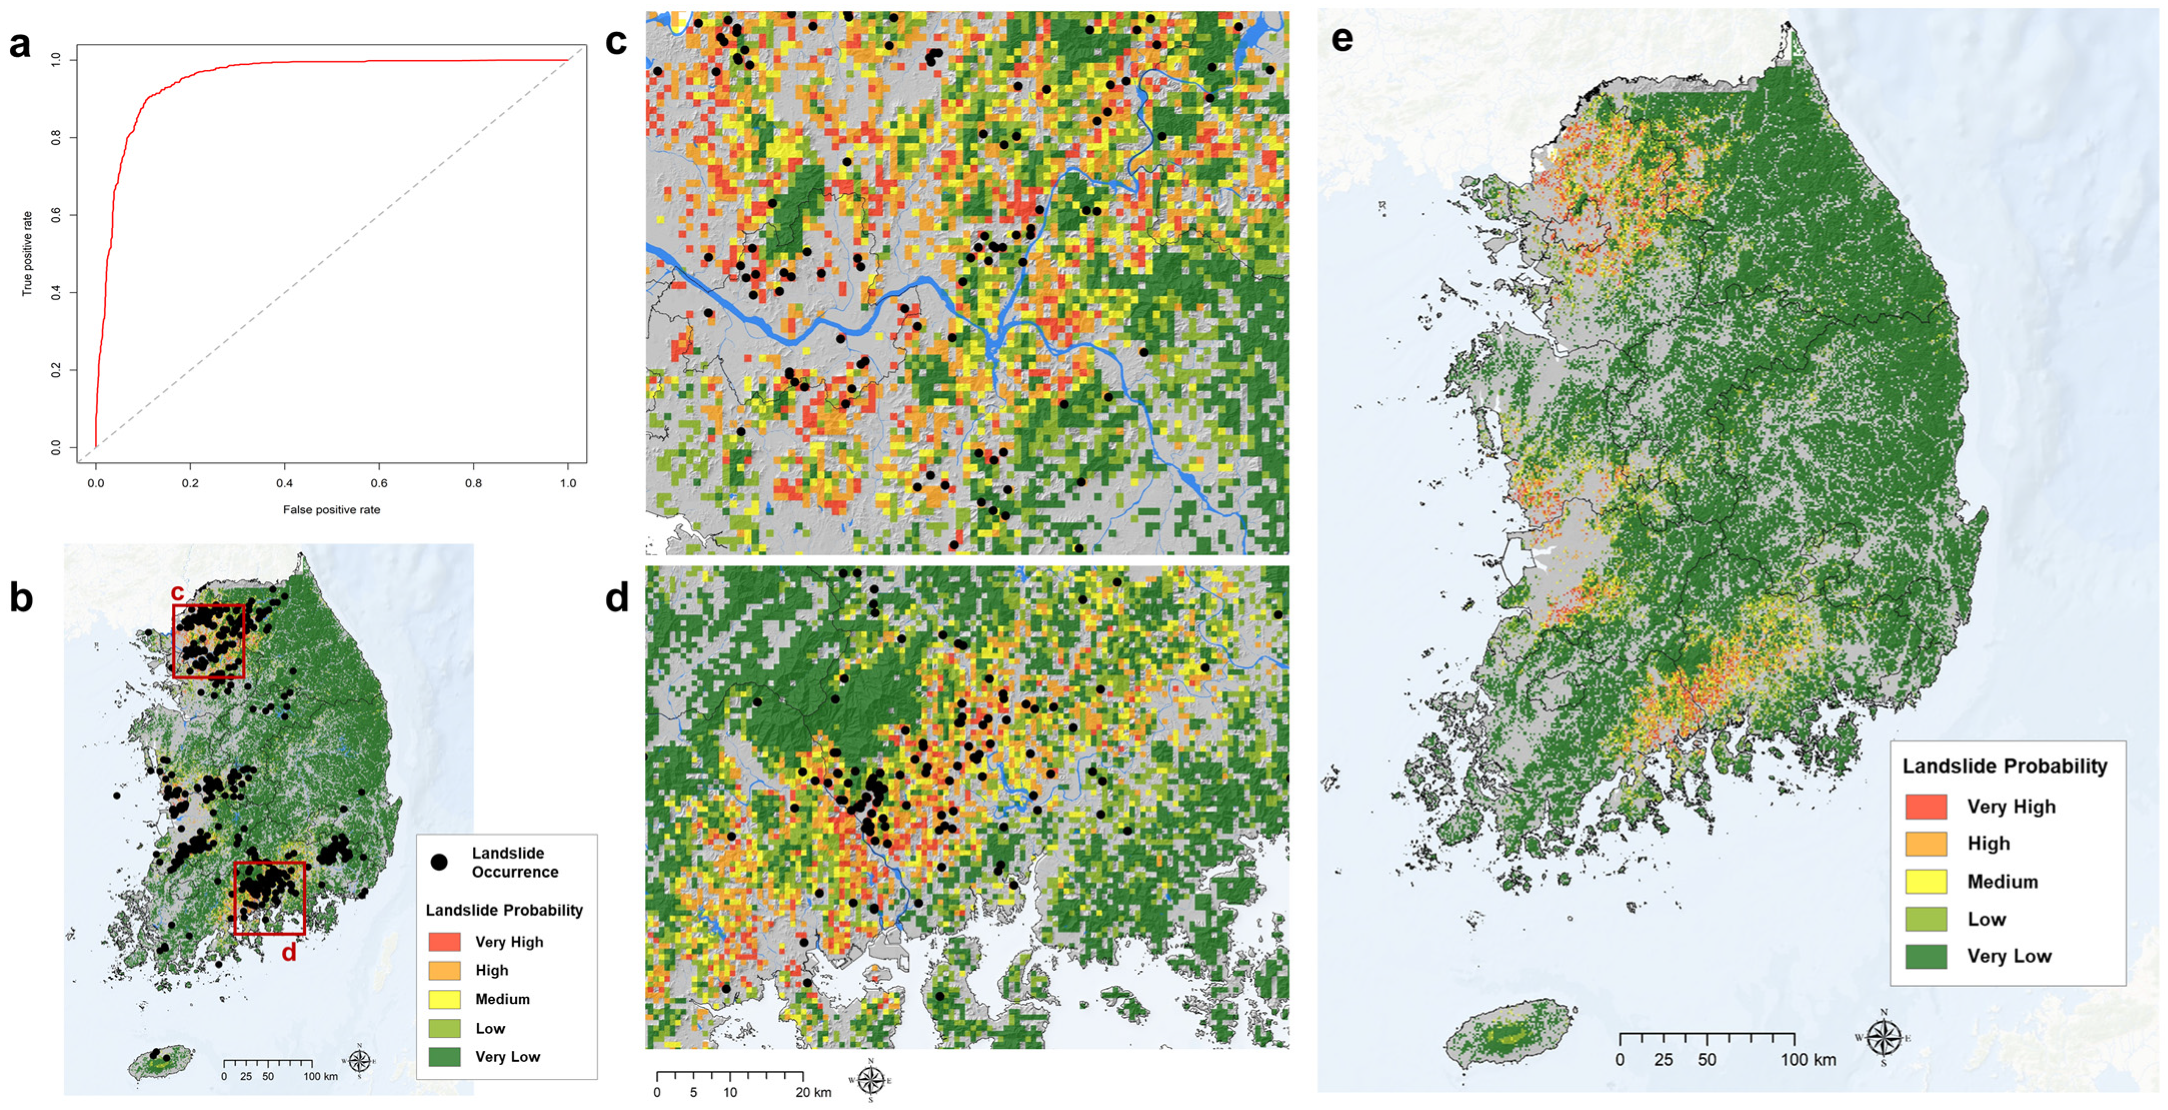
The landslide probability of the baseline period (2011) predicted using the RF model was evaluated through AUC along with a spatially qualitative evaluation. The AUC value of the landslide probability for the baseline period was 0.951. This AUC value and the ROC curve revealed a relatively high statistical accuracy, considering the adaptive indicators, and predicted at a 1 km spatial resolution on a national scale (Figure 5a). In terms of qualitative evaluation, the baseline prediction accurately simulated major landslide-concentrated areas such as Seoul and the southern coast (Figure 5c,d). In the national distribution of landslide probability, the actual risk areas were excellently simulated. However, some small-scale landslide occurrence areas were not well reflected, which can be understood as an overfitting issue that is a structural limitation of RF. Nevertheless, macroscopically, the validity of the future forecast could be confirmed by predicting the major risk areas. Considering the five stages of the landslide risks, Very Low (81.3%) was observed for a very large area, but Very High (1.8%) was also reflected for a relatively larger area (Table 4). A detailed forecast was made based on the actual landslide occurrence area.
In the analysis of the importance of the 13 variables used to predict the landslide probability, the proportion of climatic factors was very high (Table 3). In particular, MX5D showed more than 33% importance and was found to be the most influential factor. The climate factor alone showing an importance of 51% indicates that the extreme climate was the largest factor that caused the landslides in 2011. The forest-related adaptive indicators were also found to have an influence of more than 20%, implying that if forest-related adaptation is done well, then the risk can be lowered by 20%. Moreover, the geo-environmental factors such as soil and topography that do not change significantly over time contributed approximately 27% to the landslide risk.
3.2. Assessing Climate Change Impact on Landslide Risk
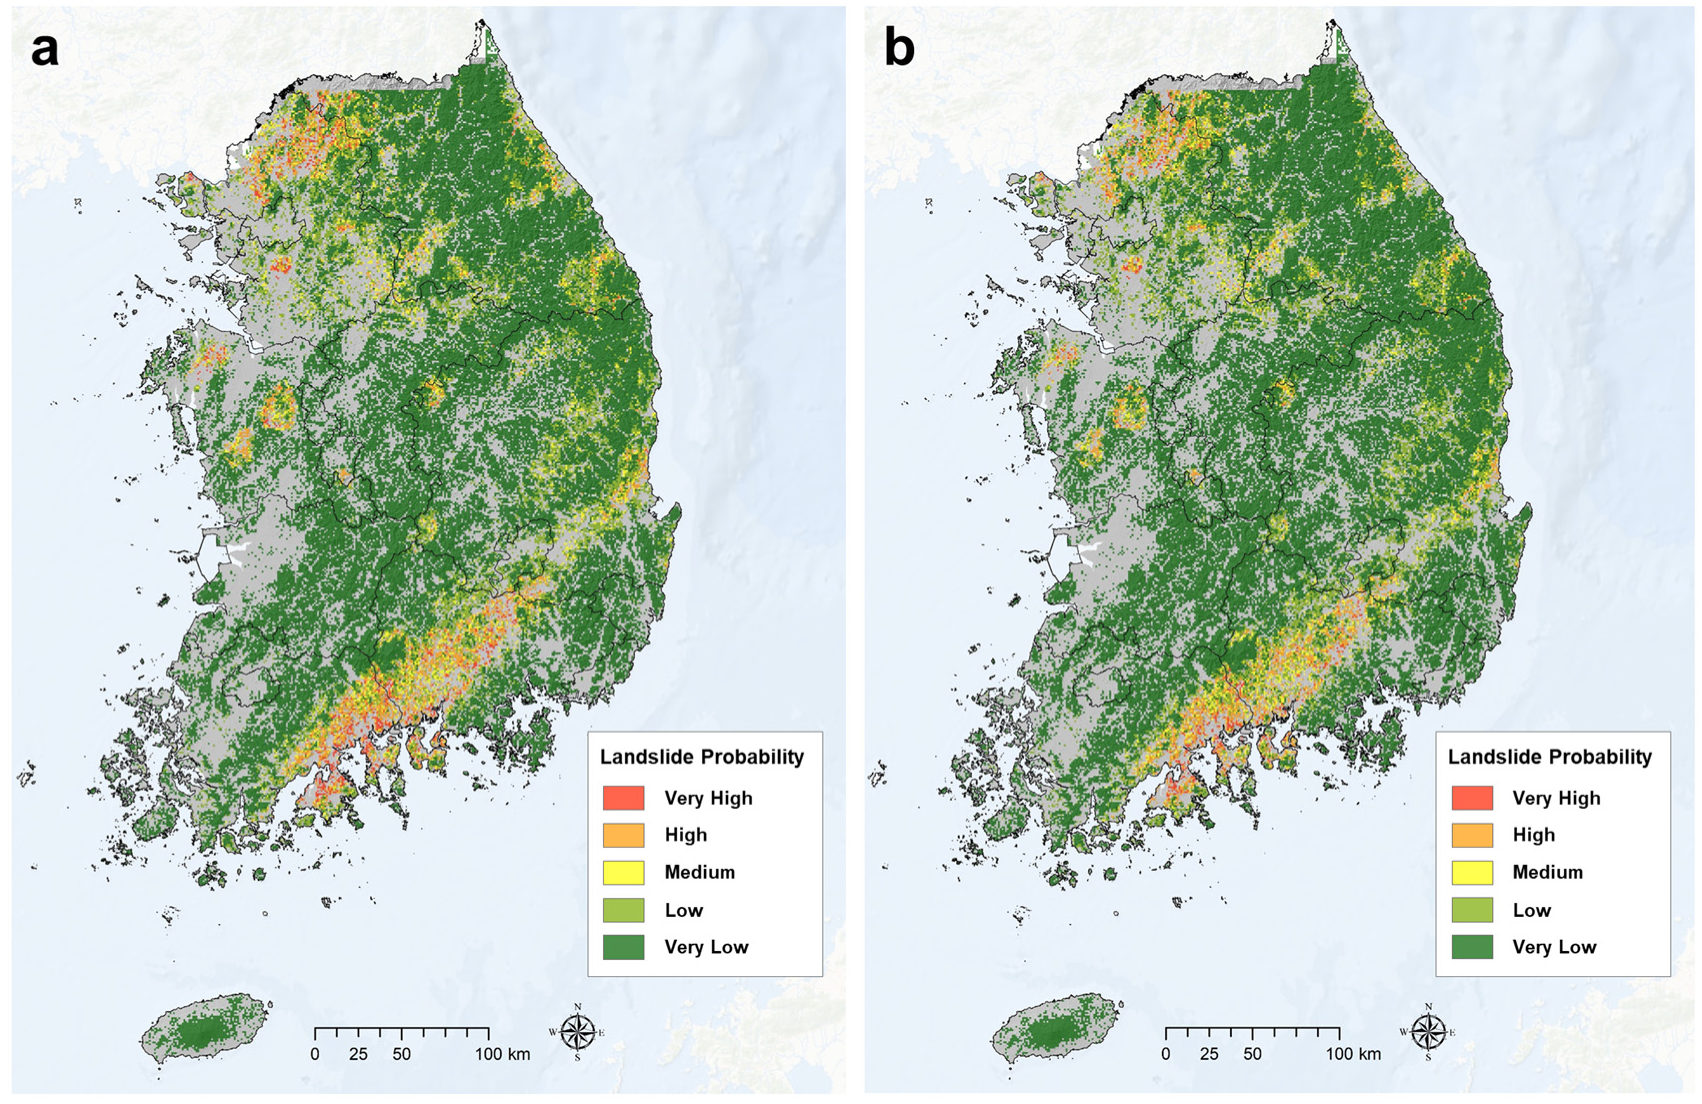
As a result of the prediction of landslides in 2050 according to the RCP8.5 scenario, it was predicted that the risk would be similar to that in 2011, i.e., the baseline period. High risk was shown in the southern coastal area and the northern part of the metropolitan area, and a high-risk area was predicted locally (Figure 6a). The Very High risk area decreased compared to that in 2011, whereas the High, Medium, and Low risk areas increased (Table 4). In the input data, R80 in 2050 increased from that in the baseline period. However, it was considered that similar levels were reflected in the regions with high SDII and MX5D (Figure 2).
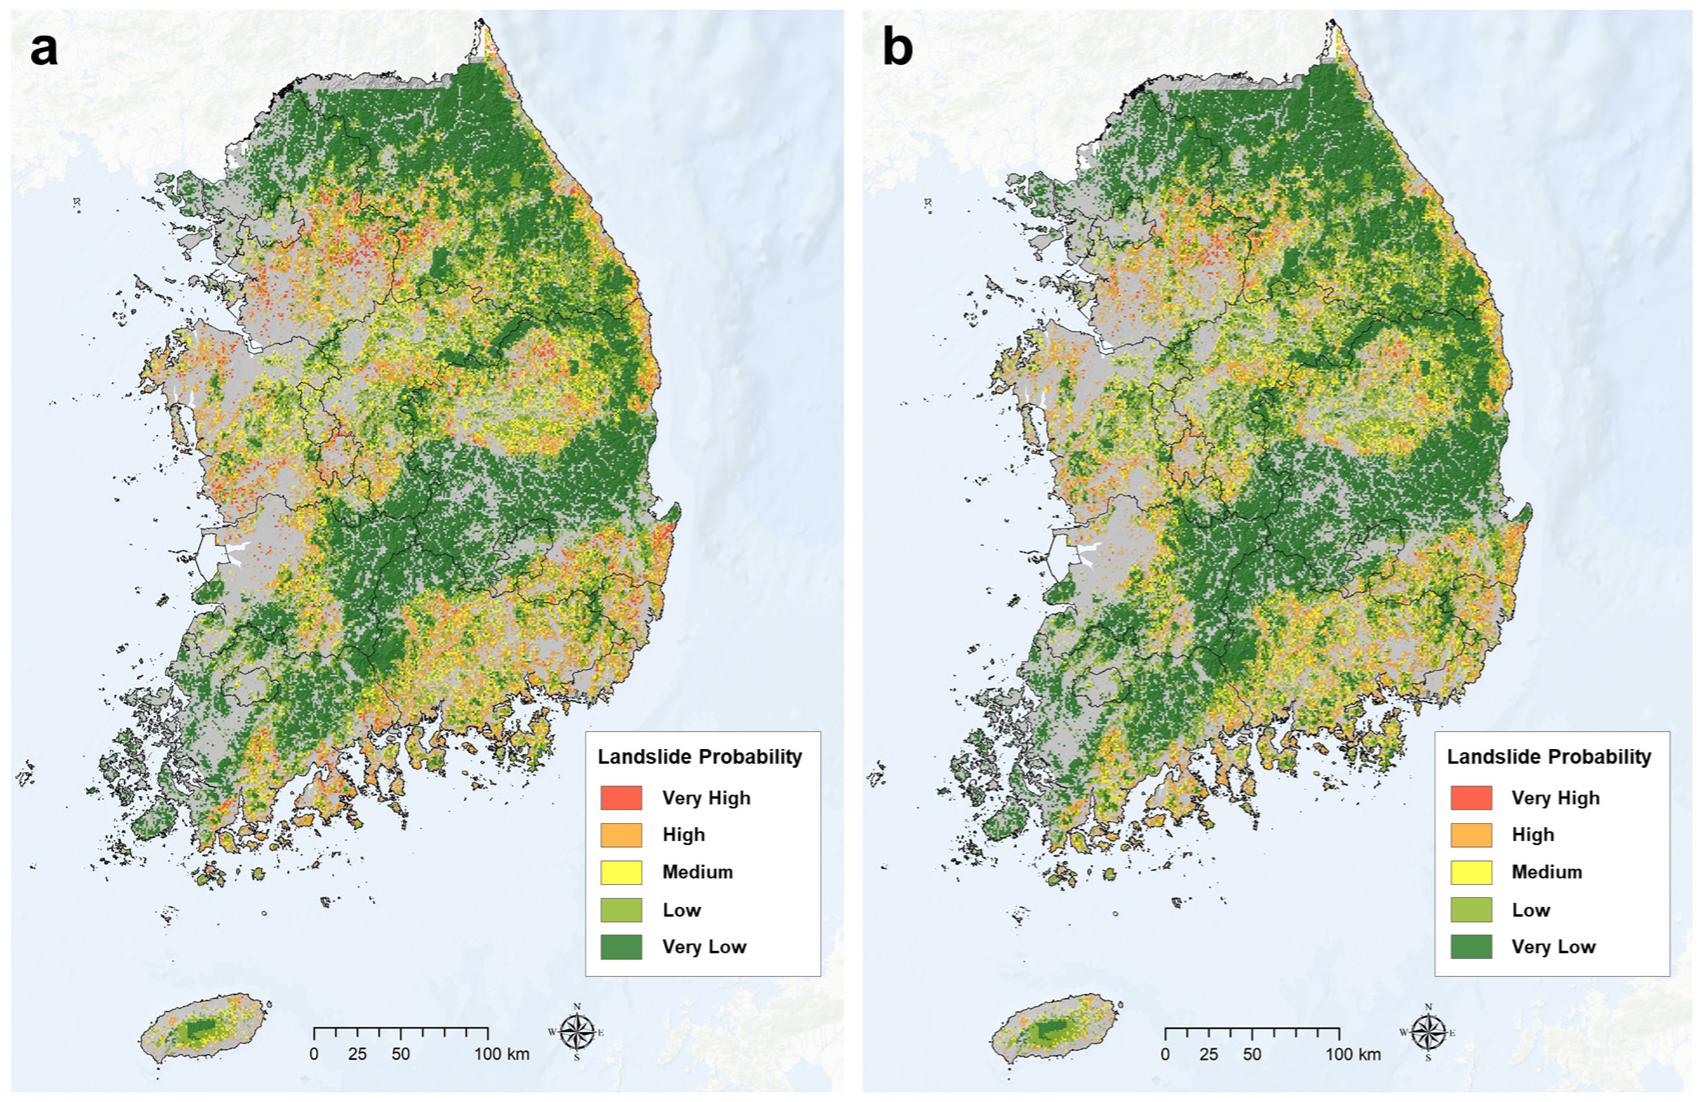
For 2092, the overall rainfall intensity increased significantly, resulting in a wide landslide risk area. Very High and High risk areas were found in various regions such as the southern coast, central mountains, metropolitan area, and east coast (Figure 7a). Compared to the baseline, the Very High risk area also increased, the High risk area increased by approximately four times, and the Medium and Low risk areas also showed an overall increase (Table 4). As a result, the Very Low risk area, which was 49,769 km2 at the baseline, was reduced by almost half to 26,997 km2. This can be seen as a change that occurred as the precipitation indices predicted for 2092 showed extreme values. R80 exhibited a significant overall increase, and MX5D also showed a very high value, indicating a wide distribution of the extreme rainfall area than that in 2050 (Figure 2). Although national disasters occurred in 2011, the current results showed that more climate disasters may occur in 2050 and 2092.
3.3. Assessing Landslide Risk under Climate and Adaptive Scenarios
As a result of predicting the landslide probability by adding the adaptation scenario to the future climate scenario, the decrease in the Very High risk area was remarkable. However, the application of the forest-related adaptive scenario in 2050 did not show any significant difference at the national scale, although a detailed regional difference was confirmed (Figure 6b). In particular, numerically by grade, the probability decreased in all the grades except Very Low and showed the largest decrease (48%) in Very High.
Even the application of the adaptation scenario to the climate change expected in 2092 showed no remarkable results at the national scale. Nevertheless, a large sub-regional difference was observed; furthermore, a significant effect was found in the areas where rainfall intensity was traditionally strong and the risk of disaster was high, such as the southern coast or metropolitan area (Figure 7b). In particular, the Very High risk area was significantly decreased, and when only climate change was applied, it became 1310 km2. Furthermore, the Very High risk area decreased by more than 70% to 390 km2 (Table 4). For 2050, the area decreased in all the grades except Very Low, and the High risk area was also reduced by 1758 km2.
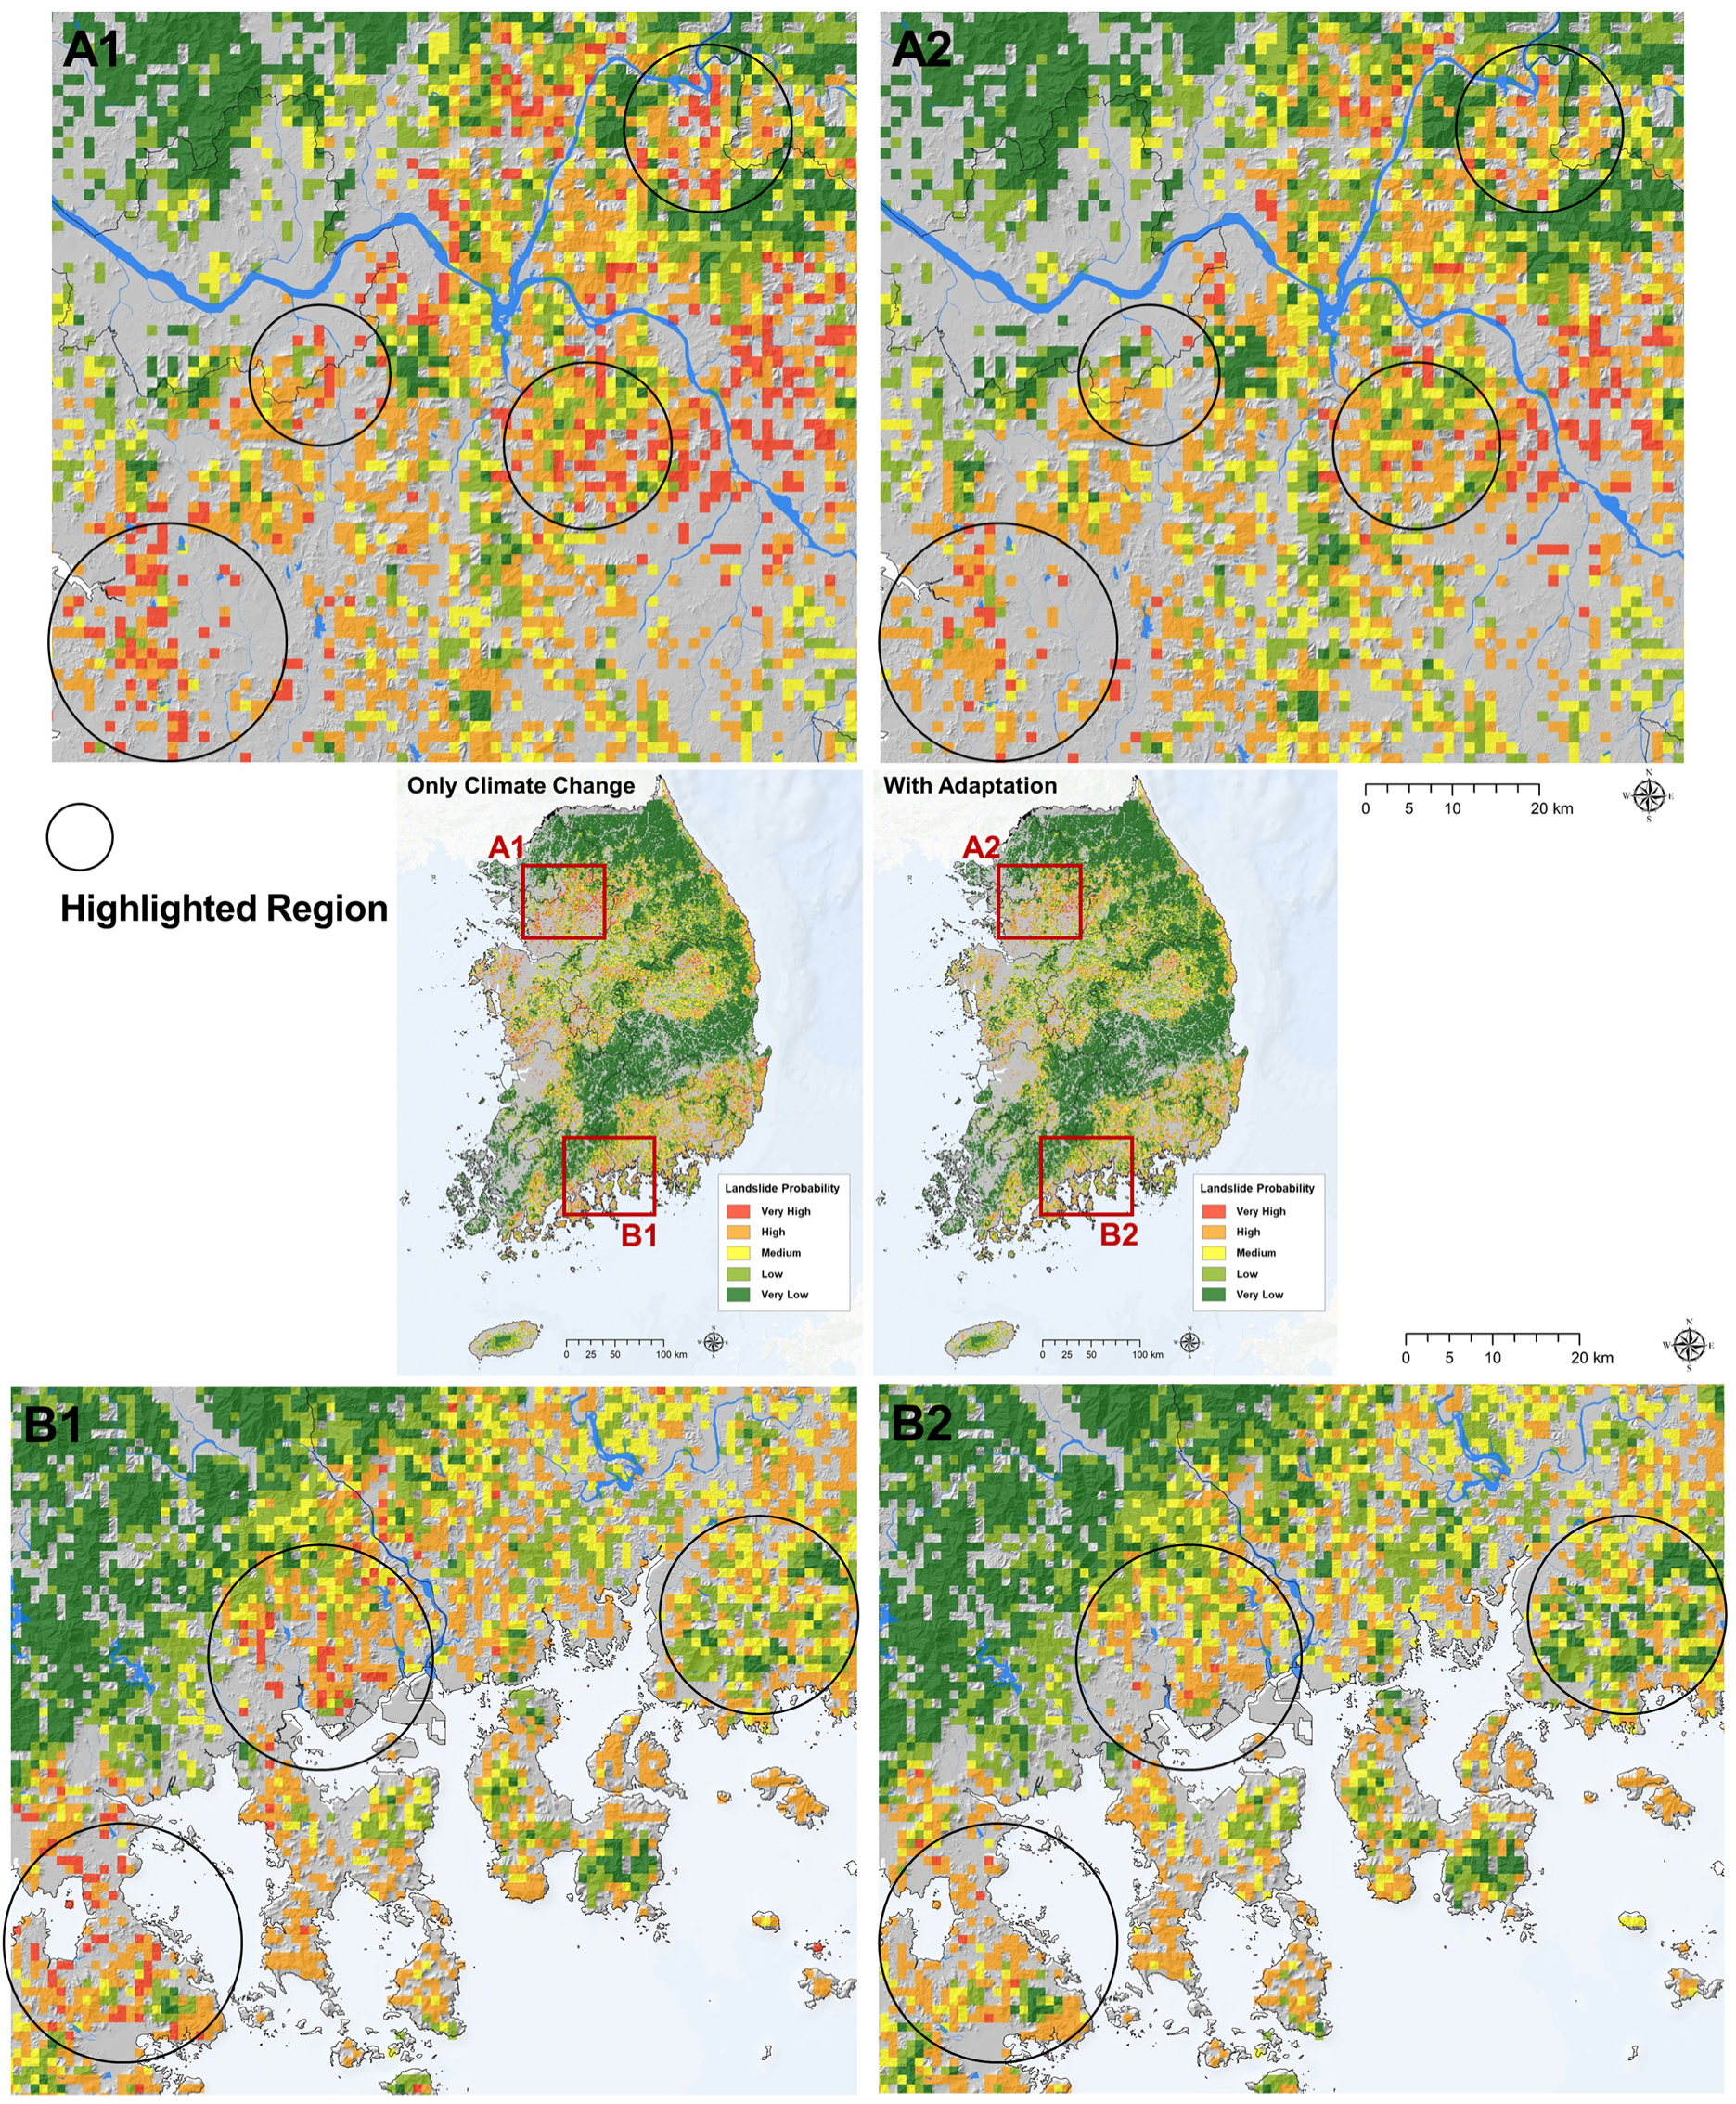
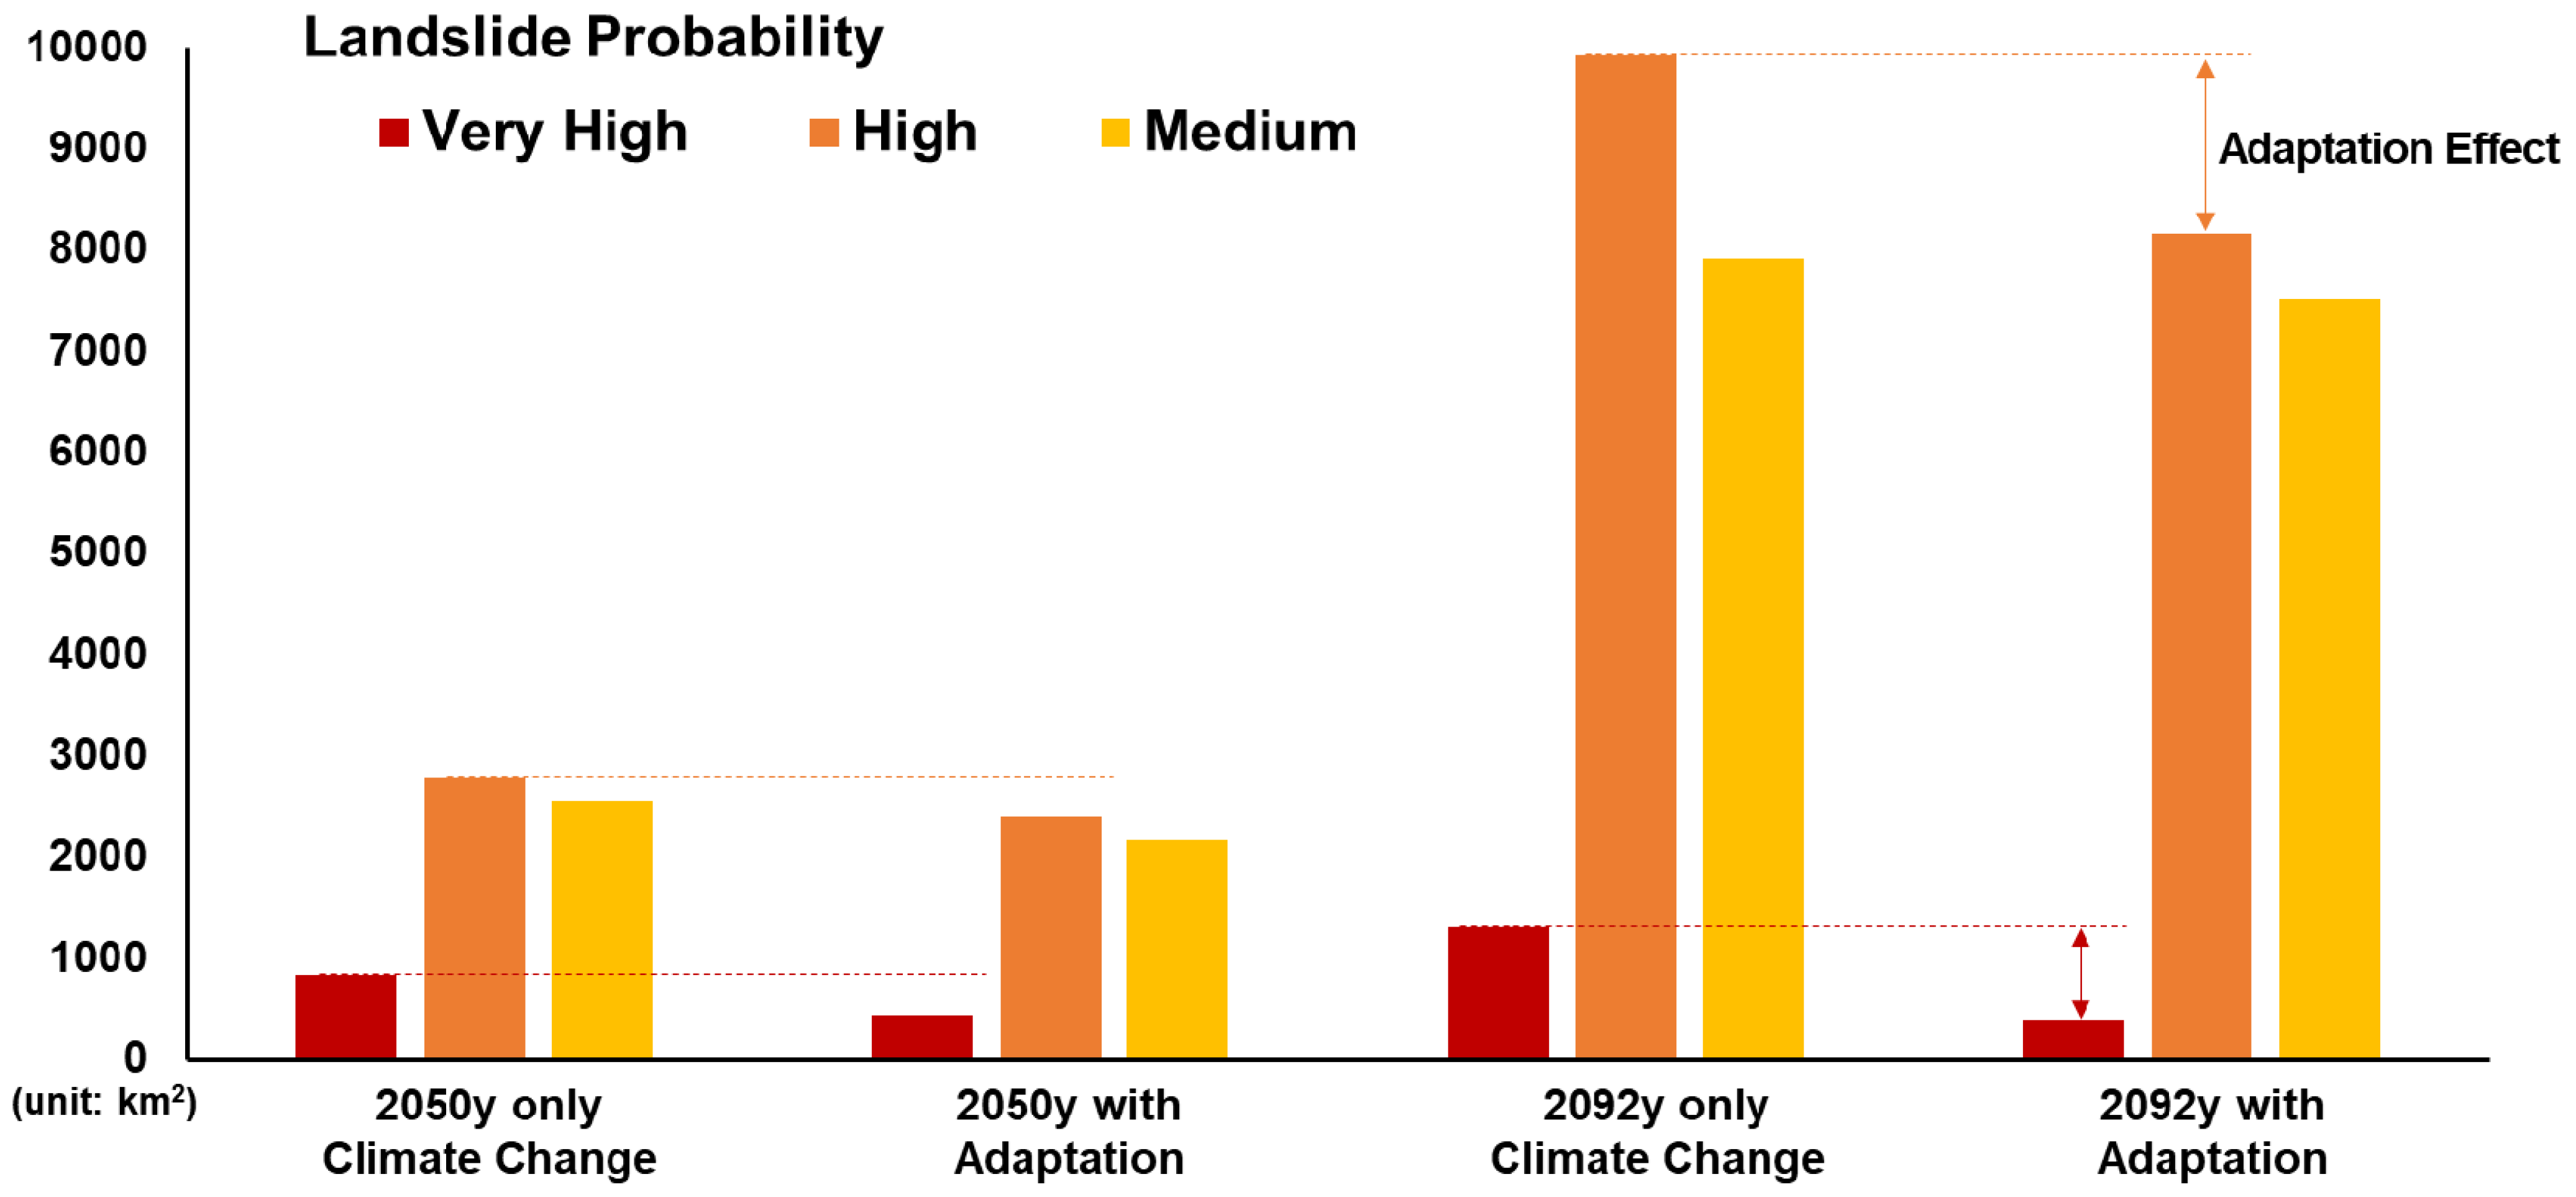
As a result of a close-up analysis of the major regions in the 2092 projected results, it was confirmed that the risk grade decreased significantly in Gangnam, Seoul, and Gyeonggi regions, which were heavily damaged by the landslides in 2011 (Figure 8(A1,A2)). In addition, it was confirmed that the Very High and High risk areas disappeared even in the southern coast, where traditionally localized heavy rains occur owing to topographical rainfall (Figure 8(B1,B2)). This implies that risk reduction was implemented in the detailed regions where forest-related adaptation was realized. When only the Very High, High, and Medium sections, indicating 90% of the landslide probability, were analyzed separately, the effect of adaptation was more pronounced (Figure 9). The adaptive effect of each period was visually confirmed through a bar plot, which showed that the adaptive effect in 2092 was more than double that in 2050. This suggests that even with the same adaptive capacity, a stronger disaster causes a significant adaptive effect. Numerical disaster reduction was confirmed in all the results reflecting adaptation. This implies the potential advantages to have significant spatial and numerical effects to respond to climate change.
Although the forest-related adaptive indicators exhibit limitations in reducing the risk of a wide range of landslides, they can effectively reduce the Very High or High risk areas by increasing the local adaptability. Even with the same adaptation scenario applied in 2050 and 2092, the significant effect in 2092 can be explained by the increase in disaster intensity, which enhanced the effect of adaptation.
3.4. Implication of Forest-Related Adaptive Capacity in Climate Change
Through this study, we could confirm the effect of adaptive capacity in response to climate change through future changes in forest-related adaptive indicators. The increase in forest-related adaptive capacity at two future time points commonly reduced the risk area and had a significant effect in the Very High risk area. Although it was not a dramatic change, it suggested that an effective response would be possible by improving the local adaptation factors centered on landslide risk areas. Thus, we quantitatively predicted that adaptation through forest management is an effective way to reduce climate disasters in the face of accelerating climate change, despite global efforts to be carbon neutral and to reduce greenhouse gases. In addition, although forest management basically contributes to the enhancement of carbon sequestration in forests, the results of this study suggest that it can also be effective in reducing disasters. Through our study, we confirmed the adaptation and mitigation co-benefits of forest management in terms of responding to climate change.
The reported landslide probability predictions were focused on environmental variables such as topography and precipitation, which have a large influence on the occurrence. However, these are uncontrollable variables, and the role of society and policy could not be confirmed [48,49]. There were difficulties in reflecting policy variables in the probabilistic model because work such as quantification and spatialization of policies must be preceded [18,50,51]. In this study, we were able to make full use of the available spatial data and converted the future policies into data through rational classification. In recent times when the importance of adaptation to climate change is increasing [52], predicting the landslide probability by reflecting forest-related adaptation indicators that can contribute to the reduction of landslide occurrence in the present time is timely and crucial.
Due to the utilization of the advantages of the machine learning model, it was possible to reflect the adaptive indicators in the probability model. The model, by learning the spatialized forest adaptation indicators together with the machine learning model that learns the location information of landslides that occurred during heavy rain as well as the geographic and environmental characteristics of the region, could simulate the adaptation effect. The grafting of spatialized adaptive variables to a machine learning model with a high degree of freedom of variables was effective [53]. This form can be used in various fields in the future, as an approach to evaluate the effectiveness of policies in reducing the risk of climate change and natural disasters.
In this study, Korea’s sixth Basic Forest Plan was treated as a major adaptation policy, and the directions and numeric values presented in the plan were spatialized and applied to the model. Compared to the established plan, the adaptive scenario applied in this study implemented a passive change. This adaptive scenario was designed in consideration of the reality that can be implemented in Korea. Since the process of changing land ownership or opening a new forest road cannot be drastic, we predicted the change from a conservative point of view. If it is applied in real society as much as the actual plan in the future, greater benefits than the adaptation effect explored in this study will be achieved. Most of the adaptive indicators applied in this study were components highly related to forest management. This was indexed from the perspectives that forest management activities can contribute to the reduction of forest disasters, and the outcomes suggested that these indicators can actually have an impact. Although forest management is mainly dealt with from the point of view of enhancing carbon sinks, this study was able to confirm again that it is effective in reducing forest disasters. According to our result, the higher forest road density and the more active forestry industries are the fewer landslides occur, therefore such synergy can greatly contribute to the promotion of policy-based forest management activities in the future. Ultimately, it is significant in the era of the climate crisis and carbon neutral that forest management can have co-benefits in the two main components of climate change, adaptation and mitigation.
3.5. Limitations and Recommendations
The future scenarios of forest-related adaptation indicators presented in in this paper have various implications as well as limitations. Similar previous reported cases in terms of variable selection are scarce; thus, a subjective selection was performed owing to the limitations of spatializable variables. In addition, a limited classification system such as the classification of some variables into 2–3 classes may influence the simulation of the adaptation effect and result in underestimation or overestimation.
Since this study was a new attempt to spatialize adaptation policies to learn and evaluate the effects using artificial intelligence, it is expected that numerous follow-up studies will complement the limitations of this study. In particular, it is necessary to deal with the process of spatialization and future scenarioization of non-spatial data such as adaptation policies and technologies from a more technical point of view. More realistic results will be possible if each element is spatially scenarioization and learned in artificial intelligence using more rational techniques such as probabilistic spatialization technology. In addition, an algorithm design that can perform more high-accuracy prediction while learning more landslide cases is also required. If the amount of learning increases, it can be advanced through deep learning techniques. Besides, if a new climate change scenario based on CMIP6 (Coupled Model Intercomparison project Phase 6) that has been recently released and used is applied, the degree of results may vary. Moreover, the development and application of adaptive scenarios including concepts such as nature-based solutions, natural climate solutions, and climate-resilient adaptation, which have been emphasized recently, are also expected in the future. In the long term, it is necessary to prepare a conceptual and technical system that can spatialize policies or plans and use them for machine learning.
4. Conclusions
A thorough spatial modeling approach for assessing landslide probability and adaptive drivers was employed to obtain an improved understanding of landslide risk in the future climate and broaden the perspective on risk reduction. In this study, we attempted to evaluate the extent to which adaptive capacity can reduce the occurrence of landslides by adding an adaptation factor to the variables that have been used to predict landslide probability. The changes in landslide probability under a past and future climate and the adaptive scenarios were estimated through an RF model, which is a representative machine learning tool. The RF model estimated the landslide probability in the baseline period with excellent prediction performance, and the spatial adaptation indicators used in this study contributed approximately 20%. The predicted future landslide risk for 2050 showed no significant difference from that observed in 2011; however, a very high level of landslide risk was predicted for the year 2092. In particular, the Very High and High risk areas increased significantly. As a result of applying the forest-related adaptation indices based on the policy scenario, the areas at risk of landslides decreased, although differences according to time and region were observed. For 2050, the effect was not pronounced, but for 2092, when the risk of landslides was predicted to be much higher, the effect increased significantly. In particular, the effect was remarkable in the Seoul metropolitan region and southern coastal region. Even with the same adaptive capacity, it exerted a greater effect on the enhanced disasters. Our results suggest that the enhancement of adaptive capacity can reduce landslide risk up to 70% in a Very High risk region. In conclusion, it implies an importance to respond to the intensifying climate disasters, and abundant follow-up studies are expected to appear in the future. In particular, we anticipate technological advances in spatialization technology and in designing adaptive scenarios. However, the forest-related adaptive capacity in this study was spatialized to a level that achieved a part of Korea’s Basic Forest Plan, and a significant effect can be expected when this plan is more actively implemented in the future.
Author Contributions
Conceptualization, methodology, investigation and writing, C.-H.L.; project administration, writing—review and editing, H.-J.K. All authors have read and agreed to the published version of the manuscript.
Funding
This research was funded by the Korea Forest Service (No. 2020183C10-2022-AA02), National Research Foundation of Korea grant provided by the Ministry of Science and ICT (No. 2021R1F1A1063809) and Kookmin University grant.
Institutional Review Board Statement
Not applicable.
Informed Consent Statement
Not applicable.
Data Availability Statement
Not applicable.
Conflicts of Interest
The authors declare no conflict of interest.
References
- Folqué, M.; Escrig-Olmedo, E.; Corzo Santamaría, T. Sustainable development and financial system: Integrating ESG risks through sustainable investment strategies in a climate change context. Sustain. Dev. 2021, 9, 1–11. [Google Scholar] [CrossRef]
- Senadheera, S.S.; Withana, P.A.; Dissanayake, P.D.; Sarkar, B.; Chopra, S.S.; Rhee, J.H.; Ok, Y.S. Scoring environment pillar in environmental, social, and governance (ESG) assessment. Sustain. Environ. 2021, 7, 1960097. [Google Scholar] [CrossRef]
- Ameray, A.; Bergeron, Y.; Valeria, O.; Girona, M.M.; Cavard, X. Forest Carbon Management: A Review of Silvicultural Practices and Management Strategies Across Boreal, Temperate and Tropical Forests. Curr. For. Rep. 2021, 15, 1–22. [Google Scholar] [CrossRef]
- Gates, B. How to Avoid a Climate Disaster: The Solutions We Have and the Breakthroughs We Need; Knopf: Eldon, MO, USA, 2021. [Google Scholar]
- Hof, A.R.; Girona, M.M.; Fortin, M.-J.; Tremblay, J.A. Editorial: Using Landscape Simulation Models to Help Balance Conflicting Goals in Changing Forests. Front. Ecol. Evol. 2021, 9, 736. [Google Scholar] [CrossRef]
- IPCC. Climate Change 2014—Impacts, Adaptation and Vulnerability: Regional Aspects. In Intergovernmental Panel on Climate Change; Cambridge University Press: Cambridge, UK, 2014. [Google Scholar]
- Achim, A.; Moreau, G.; Coops, N.C.; Axelson, J.N.; Barrette, J.; Bédard, S.; Byrne, K.; Caspersen, J.; Dick, A.R.; D’Orangeville, L.; et al. The changing culture of silviculture. Forestry 2021, 93, 47. [Google Scholar] [CrossRef]
- Möhner, A. The evolution of adaptation metrics under the UNFCCC and its Paris Agreement. Adapt. Metr. 2018, 15, 21. [Google Scholar]
- Kreienkamp, F. Rapid attribution of heavy rainfall events leading to the severe flooding in Western Europe during July 2021. World Weather Attrib. 2021, 2, 8732135. [Google Scholar]
- Liu, Y.; Chen, J.; Pan, T.; Liu, Y.; Zhang, Y.; Ge, Q.; Penuelas, J. Global socioeconomic risk of precipitation extremes under climate change. Earth’s Future 2020, 8, e2019EF001331. [Google Scholar] [CrossRef] [PubMed]
- Cui, G.; Kwak, H.; Choi, S.; Kim, M.; Lim, C.-H.; Lee, W.-K.; Kim, J.-S.; Chae, Y. Assessing vulnerability of forests to climate change in South Korea. J. For. Res. 2015, 27, 489–503. [Google Scholar] [CrossRef]
- Lim, C.-H. Water-Centric Nexus Approach for the Agriculture and Forest Sectors in Response to Climate Change in the Korean Peninsula. Agronomy 2021, 11, 1657. [Google Scholar] [CrossRef]
- Lim, C.-H.; Choi, Y.; Kim, M.; Lee, S.; Folberth, C.; Lee, W.-K. Spatially Explicit Assessment of Agricultural Water Equilibrium in the Korean Peninsula. Sustainability 2018, 10, 201. [Google Scholar] [CrossRef] [Green Version]
- Lim, C.-H.; Kim, S.H.; Chun, J.A.; Kafatos, M.C.; Lee, W.-K. Assessment of Agricultural Drought Considering the Hydrological Cycle and Crop Phenology in the Korean Peninsula. Water 2019, 11, 1105. [Google Scholar] [CrossRef] [Green Version]
- Kwon, S.; Kim, S.; Kim, J.; Kang, W.; Park, K.-H.; Kim, C.-B.; Girona, M. Predicting Post-Fire Tree Mortality in a Temperate Pine Forest, Korea. Sustainability 2021, 13, 569. [Google Scholar] [CrossRef]
- Park, S.-J.; Lee, D.-K. Predicting susceptibility to landslides under climate change impacts in metropolitan areas of South Korea using machine learning. Geomat. Nat. Hazards Risk 2021, 12, 2462–2476. [Google Scholar] [CrossRef]
- Rahmati, O.; Falah, F.; Dayal, K.; Deo, R.C.; Mohammadi, F.; Biggs, T.; Moghaddam, D.D.; Naghibi, S.A.; Bui, D.T. Machine learning approaches for spatial modeling of agricultural droughts in the south-east region of Queensland Australia. Sci. Total Environ. 2020, 699, 134230. [Google Scholar] [CrossRef] [PubMed]
- Milojevic-Dupont, N.; Creutzig, F. Machine learning for geographically differentiated climate change mitigation in urban areas. Sustain. Cities Soc. 2021, 64, 102526. [Google Scholar] [CrossRef]
- Kim, J.; Lim, C.-H.; Jo, H.-W.; Lee, W.-K. Phenological Classification Using Deep Learning and the Sentinel-2 Satellite to Identify Priority Afforestation Sites in North Korea. Remote Sens. 2021, 13, 2946. [Google Scholar] [CrossRef]
- Pourghasemi, H.R.; Kariminejad, N.; Amiri, M.; Edalat, M.; Zarafshar, M.; Blaschke, T.; Cerda, A. Assessing and mapping multi-hazard risk susceptibility using a machine learning technique. Sci. Rep. 2020, 10, 1–11. [Google Scholar] [CrossRef] [Green Version]
- Seong-eun, C.; Cheol-hee, L.; Ji-won, K.; Moon-il, K.; Cheol-ho, S.; Woo-kyun, L. Analysis of Landslide Hazard Area due to Heavy Rainfall in the Seoul Metropolitan Area. J. Korean Soc. Geospat. Inf. Syst. 2018, 26, 3–11. [Google Scholar] [CrossRef]
- Park, C.; Son, S.-W.; Kim, H.; Ham, Y.-G.; Kim, J.; Cha, D.-H.; Chang, E.-C.; Lee, G.; Kug, J.-S.; Lee, W.-S.; et al. Record-breaking summer rainfall in South Korea in 2020: Synoptic characteristics and the role of large-scale circulations. Mon. Weather Rev. 2021, 1, 3085–3100. [Google Scholar] [CrossRef]
- Lim, C.-H.; Yoo, S.; Choi, Y.; Jeon, S.W.; Son, Y.; Lee, W.-K. Assessing Climate Change Impact on Forest Habitat Suitability and Diversity in the Korean Peninsula. Forest 2018, 9, 259. [Google Scholar] [CrossRef] [Green Version]
- Lim, C.-H.; Kim, H.-J. Machine Learning Application for Identifying Habitat Suitability Changes of Indicator Tree Species against Recent Climate Change. J. Clim. Chang. Res. 2020, 11, 793–805. [Google Scholar] [CrossRef]
- Lim, C.H.; Kim, Y.S.; Won, M.; Kim, S.J.; Lee, W.K. Can satellite-based data substitute for surveyed data to predict the spatial probability of forest fire? A geostatistical approach to forest fire in the Republic of Korea. Geom. Nat. Hazards Risk. 2019, 10, 719–739. [Google Scholar] [CrossRef] [Green Version]
- Kim, G.S.; Lim, C.-H.; Kim, S.J.; Lee, J.; Son, Y.; Lee, W.-K. Effect of National-Scale Afforestation on Forest Water Supply and Soil Loss in South Korea, 1971–2010. Sustainability 2017, 9, 1017. [Google Scholar] [CrossRef] [Green Version]
- Korea Meteorological Administration (KMA). Climate Change Projection Analytics Report for Korean Peninsula; KMA: Seoul, Korea, 2018. [Google Scholar]
- Korea Meteorological Administration (KMA). Climate Change Outlook for Korean Peninsula 2020; KMA: Seoul, Korea, 2021. [Google Scholar]
- Statistics Korea. E-national Indicator, Statistics Korea: Daejeon, Korea, 2021. Available online: https://www.index.go.kr/main.do(accessed on 11 July 2021).
- Lee, S.; Won, J.-S.; Jeon, S.; Park, I.; Lee, M.J. Spatial Landslide Hazard Prediction Using Rainfall Probability and a Logistic Regression Model. Math. Geol. 2014, 47, 565–589. [Google Scholar] [CrossRef]
- Kim, H.G.; Lee, D.K.; Park, C.; Kil, S.; Son, Y.; Park, J.H. Evaluating landslide hazards using RCP 4.5 and 8.5 scenarios. Environ. Earth Sci. 2014, 73, 1385–1400. [Google Scholar] [CrossRef]
- Daly, C.; Gibson, W.; Taylor, G.; Johnson, G.; Pasteris, P. A knowledge-based approach to the statistical mapping of climate. Clim. Res. 2002, 22, 99–113. [Google Scholar] [CrossRef] [Green Version]
- Daly, C.; Helmer, E.H.; Quiñones, M. Mapping the climate of Puerto Rico, Vieques and Culebra. Int. J. Clim. 2003, 23, 1359–1381. [Google Scholar] [CrossRef]
- Shin, S.C.; Kim, M.K.; Suh, M.S.; Rha, D.K.; Jang, D.H.; Kim, C.S.; Lee, W.S.; Kim, Y.H. Estimation of High-Resolution Gridded Precipitation Using GIS and PRISM. Atmosphere 2008, 15, 1871–1881. [Google Scholar]
- Kim, M.K.; Han, M.S.; Jang, D.H.; Baek, S.G.; Lee, W.S.; Kim, Y.H.; Kim, S. Production Technique of Observation Grid Data of 1 km Resolution. J. Clim. Res. 2012, 7, 55–68, (In Korean with English Abstract). [Google Scholar]
- Korea Forest Service. 6th Basic Forest Plan for Republic of Korea; CCPR: Daejeon, Korea, 2018. [Google Scholar]
- Youn, H.J.; Woo, C.; Lee, C.W. Effects of forest tending on landslide. J. Korean For. Soc. 2011, 100, 417–422. [Google Scholar]
- Rice, R.M. Forest management to minimize landslide risk. In Guidelines for Watershed Management, FAO Conservation Guide; FAO: Rome, Italy, 1977; pp. 271–287. [Google Scholar]
- Spiekermann, R.I.; Smith, H.G.; McColl, S.; Burkitt, L.; Fuller, I.C. Quantifying effectiveness of trees for landslide erosion control. Geomorphology 2021, 396, 107993. [Google Scholar] [CrossRef]
- Andersson-Sköld, Y.; Nyberg, L. Effective and Sustainable Flood and Landslide Risk Reduction Measures: An Investigation of Two Assessment Frameworks. Int. J. Disaster Risk Sci. 2016, 7, 374–392. [Google Scholar] [CrossRef] [Green Version]
- Moore, I.D.; Grayson, R.B.; Ladson, A. Digital terrain modelling: A review of hydrological, geomorphological, and biological applications. Hydrol. Process. 1991, 5, 3–30. [Google Scholar] [CrossRef]
- Cutler, D.R.; Edwards, T.C., Jr.; Beard, K.H.; Cutler, A.; Hess, K.T.; Gibson, J.; Lawler, J.J. Random forests for classification in ecology. Ecology 2007, 88, 2783–2792. [Google Scholar] [CrossRef]
- Kim, S.J.; Lim, C.H.; Kim, G.S.; Lee, J.; Geiger, T.; Rahmati, O.; Lee, W.K. Multi-temporal analysis of forest fire probability using socio-economic and environmental variables. Remote Sens. 2019, 11, 86. [Google Scholar] [CrossRef] [Green Version]
- Liaw, A.; Wiener, M. Classification and regression by random Forest. R News 2002, 2, 18–22. [Google Scholar]
- Rahmati, O.; Pourghasemi, H.R.; Melesse, A.M. Application of GIS-based data driven random forest and maximum entropy models for groundwater potential mapping: A case study at Mehran Region. Iran. Catena 2016, 137, 360–372. [Google Scholar] [CrossRef]
- Park, S.; Lim, C.H.; Kim, S.J.; Isaev, E.; Choi, S.E.; Lee, S.D.; Lee, W.K. Assessing Climate Change Impact on Cropland Suitability in Kyrgyzstan: Where Are Potential High-Quality Cropland and the Way to the Future. Agronomy 2021, 11, 1490. [Google Scholar] [CrossRef]
- Frattini, P.; Crosta, G.; Carrara, A. Techniques for evaluating the performance of landslide susceptibility models. Eng. Geol. 2010, 111, 62–72. [Google Scholar] [CrossRef]
- Hong, M.; Kim, J.; Jeong, S. Rainfall intensity-duration thresholds for landslide prediction in South Korea by considering the effects of antecedent rainfall. Landslides 2018, 15, 523–534. [Google Scholar] [CrossRef]
- Park, S.J.; Lee, C.W.; Lee, S.; Lee, M.J. Landslide susceptibility mapping and comparison using decision tree models: A Case Study of Jumunjin Area. Korea Remote Sens. 2018, 10, 1545. [Google Scholar] [CrossRef] [Green Version]
- Yoon, E.J.; Thorne, J.H.; Park, C.; Lee, D.K.; Kim, K.S.; Yoon, H.; Song, Y.I. Modeling spatial climate change land use adaptation with multi-objective genetic algorithms to improve resilience for rice yield and species richness and to mitigate disaster risk. Environ. Res. Lett. 2019, 14, 024001. [Google Scholar] [CrossRef]
- Voiron-Canicio, C.; Garbolino, E.; Cecutti, N.; Lavalle, C.; Chávez, J.J.H. How do public policies respond to spatialized environmental issues? Feedback and perspectives. In Ecosystem and Territorial Resilience; Elsevier: Amsterdam, The Netherlands, 2021; Chapter 13; pp. 347–364. [Google Scholar]
- Wang, S.W.; Lim, C.H.; Lee, W.K. A review of forest fire and policy response for resilient adaptation under changing climate in the Eastern Himalayan region. For. Sci. Tech. 2021, 17, 1–9. [Google Scholar] [CrossRef]
- Meyer, H.; Reudenbach, C.; Wöllauer, S.; Nauss, T. Importance of spatial predictor variable selection in machine learning applications–Moving from data reproduction to spatial prediction. Ecol. Model. 2019, 411, 108815. [Google Scholar] [CrossRef] [Green Version]
Figure 1.
(a) Study area indicating the region where landslide occurred in 2011 and (b) administrative boundary.
Figure 1.
(a) Study area indicating the region where landslide occurred in 2011 and (b) administrative boundary.

Figure 2.
Maps of climate input variables for 2011, 2050, and 2092.

Figure 3.
Maps of forest-related adaptive input variables for baseline and policy scenario.

Figure 4.
Maps of environmental input variables.

Figure 5.
Model evaluation and baseline prediction of landslide probability: (a) ROC curve, (b) prediction result and overlaying occurrence data, (c) close-up view of the main hazardous region—Seoul, (d) close-up view of the main hazardous region—southern coastal region, and (e) result of landslide probability prediction.

Figure 6.
Landslide probability of 2050: (a) only climate scenario applied, and (b) both climate and adaptive scenarios applied.
Figure 6.
Landslide probability of 2050: (a) only climate scenario applied, and (b) both climate and adaptive scenarios applied.

Figure 7.
Landslide probability of 2092: (a) only climate scenario applied, and (b) both climate and adaptive scenarios applied.
Figure 7.
Landslide probability of 2092: (a) only climate scenario applied, and (b) both climate and adaptive scenarios applied.

Figure 8.
Close-up image of the highlighted region for comparing adaptation in 2092: (A1) only climate change applied in Seoul metropolitan region; (A2) applied with adaptation in Seoul metropolitan region; (B1) applied only climate change in the southern coastal region; (B2) applied with adaptation in the southern coastal region.

Figure 9.
Comparison of landslide probability for identifying the adaptation effect.


Table 1.
Input variables used to assess landslide probability.
| Input Variable Acronym | Input Variable | Unit | Source |
|---|---|---|---|
| MX5D | 5 Days of Maximum Precipitation | mm | KMA 1 |
| R80 | Number of days over 80 mm of rainfall | Days | KMA 1 |
| SDII | Simple Daily Intensity Index | - | KMA 1 |
| Owner | Forest Ownership | Class | KFS 2 |
| F-road | Distance from Forest Road | Class | KFS 2 |
| Economic-F | Economic Forest Utilization Level | Class | KFS 2 |
| Erosion-C | Erosion Control Facilities | Y/N | KFS 2 |
| Protect | Protection Area | Class | KFS 2 and MOE 3 |
| Elev | Elevation | m | MLIT 4 |
| TWI | Topographical Wetness Index | - | MLIT 4 |
| S-depth | Effective Soil Depth | Class | RDA 5 |
| S-drain | Soil Drainage Class | Class | RDA 5 |
| LC | Land Cover Class | Class | MOE 3 |
1 Korea Meteorological Administration (http://www.kma.go.kr/, accessed on 11 July 2021); 2 Korea Forest Service (http://www.forest.go.kr/, accessed on 11 July 2021); 3 Ministry of Environment (http://www.me.go.kr/, accessed on 11 July 2021); 4 Ministry of Land, Infrastructure and Transport (http://www.molit.go.kr/, accessed on 11 July 2021); 5 Rural Development Administration (http://www.rda.go.kr/, accessed on 11 July 2021).
Table 2.
Class criteria of forest-related adaptive indicators.
| Input Variable | Class Criteria | Input Variable | Class Criteria |
|---|---|---|---|
| Owner | National Forest | Economic-F | Level 7 (Economic forest, national forest, and near forest road) |
| Public Forest (Provincial and Town) | |||
| Others (Private and etc) | Level 6 (Economic forest, national forest, and far forest road) | ||
| F-road | >1 km | ||
| >2 km | Level 5 (Economic forest, public forest, and near forest road) | ||
| <2 km | |||
| Protect | National and Provincial Park | Level 4 (Economic forest, public forest, and far forest road) | |
| Forest protected area | |||
| Other protected area | Level 3 (Economic forest, other forest, and near forest road) | ||
| Non-protected area | |||
| Erosion-C | >1 km | Level 2 (Economic forest, other forest, and far forest road) | |
| Other | Level 1 (Non-economic forest) |
Table 3.
Importance of variables used in baseline prediction.
| Variables | Variable Importance (%) | |
|---|---|---|
| Climate Indicator | MX5D | 33.17 |
| R80 | 8.40 | |
| SDII | 10.31 | |
| Forest-related Adaptation Indicator | Owner | 6.70 |
| F-road | 2.40 | |
| Economic-F | 2.86 | |
| Erosion-C | 6.33 | |
| Protect | 2.44 | |
| Environmental Indicator (Uncontrollable) | Elev | 11.97 |
| TWI | 7.24 | |
| S-depth | 2.35 | |
| S-drain | 1.91 | |
| LC | 3.93 | |
Table 4.
Landslide probability distribution of each scenario.
| Landslide Probability | 2011 | 2050 Climate Scenario | 2050 Climate and Adaptation Scenario | 2092 Climate Scenario | 2092 Climate and Adaptation Scenario |
|---|---|---|---|---|---|
| Very High | 1080 | 836 | 435 | 1310 | 390 |
| High | 2507 | 2788 | 2395 | 9921 | 8163 |
| Medium | 1821 | 2550 | 2171 | 7909 | 7521 |
| Low | 6064 | 9645 | 9004 | 15,104 | 15,525 |
| Very Low | 49,769 | 45,422 | 47,237 | 26,997 | 29,642 |
Publisher’s Note: MDPI stays neutral with regard to jurisdictional claims in published maps and institutional affiliations. |
© 2022 by the authors. Licensee MDPI, Basel, Switzerland. This article is an open access article distributed under the terms and conditions of the Creative Commons Attribution (CC BY) license (https://creativecommons.org/licenses/by/4.0/).
Share and Cite
MDPI and ACS Style
Lim, C.-H.; Kim, H.-J. Can Forest-Related Adaptive Capacity Reduce Landslide Risk Attributable to Climate Change?—Case of Republic of Korea. Forests 2022, 13, 49. https://0-doi-org.brum.beds.ac.uk/10.3390/f13010049
AMA Style
Lim C-H, Kim H-J. Can Forest-Related Adaptive Capacity Reduce Landslide Risk Attributable to Climate Change?—Case of Republic of Korea. Forests. 2022; 13(1):49. https://0-doi-org.brum.beds.ac.uk/10.3390/f13010049
Chicago/Turabian StyleLim, Chul-Hee, and Hyun-Jun Kim. 2022. "Can Forest-Related Adaptive Capacity Reduce Landslide Risk Attributable to Climate Change?—Case of Republic of Korea" Forests 13, no. 1: 49. https://0-doi-org.brum.beds.ac.uk/10.3390/f13010049
Note that from the first issue of 2016, this journal uses article numbers instead of page numbers. See further details here.