Article

Predicting Potential Habitat of a Plant Species with Small Populations under Climate Change: Ostryarehderiana

1
College of Forestry, Nanjing Forestry University, Nanjing 210037, China
2
Department of Forest and Conservation Sciences, University of British Columbia, Vancouver, BC V6T 1Z4, Canada
3
Co-Innovation Center for Sustainable Forestry in Southern China, College of Biology and the Environment, Nanjing Forestry University, Nanjing 210037, China
4
School of Ecological and Environmental Sciences, East China Normal University, Shanghai 200241, China
5
School of Mathematics and Statistics, Yunnan University, Kunming 650504, China
*
Author to whom correspondence should be addressed.
Submission received: 20 November 2021 / Revised: 30 December 2021 / Accepted: 14 January 2022 / Published: 17 January 2022
(This article belongs to the Special Issue Simulation Models of the Dynamics of Forest Ecosystems)

Abstract

:
Ostrya rehderiana is a famous plant species with extremely small populations. With ongoing global climate change, the extremely small populations would face more uncertainties and risks, including the loss of genetic diversity and extirpation. Thus, assessing the impact of climate change on suitable habitat of O. rehderiana is particularly important for its conservation and restoration. Here, we built niche models with climate variables and soil and human footprint variables. Furthermore, new methods were applied to avoid confounding effects between climate and soil and human footprint variables to simulate the potential habitats of O. rehderiana in current and future climates. We found that the Hargreaves climatic moisture deficit, degree-days below 0 °C, chilling degree-days, and the temperature difference between mean warmest month temperature and mean coldest month temperature, or continentality, were the most important climate factors. The topsoil USDA texture classification, topsoil cation exchange capacity of (clay), and topsoil sodicity (ESP) were the key soil factors determining the suitable distribution of O. rehderiana. Compared with soil factors, human footprint has less influence on the suitable distribution of O. rehderiana. The niche range of this species was projected to expand and shift to north in the Representative Concentration Pathway (RCP) 4.5 scenario for the 2050s. Our study results could be referenced in further extremely small populations ecological restoration studies and provide the scientific strategies for the conservation and restoration of O. rehderiana.

1. Introduction

Climate is a key ecological factor determining species range distribution; thus, the anticipated suitable habitat shift (latitude and/or elevation) in response to climate change is imminent [1,2,3]. During the Quaternary glaciation to the Last Glacial Maximum, the global temperature dropped sharply, and most terrestrial plants migrated from north to south, occupying suitable environmental spaces [4]. By the middle Holocene, the temperature rose, and tree populations returned to higher latitudes [5]. In recent years, as affected by climate warming, the population size of plants with narrow distribution ranges are shrinking, reaching an alarming rate as some species’ were reduced to less than 10 remaining individuals and are on the verge of extinction [6]. According to China’s State Forestry Administration regulations, species are designated as “Plant Species with Extremely Small Populations (PSESP)” if their census number is less than 500 individuals [7]. Characterized by small remaining populations, restricted habitat, and extremely high risk of extinction, PSESPs have been identified as a conservation priority in the fields of conservation biology and restoration ecology [8]. Additionally, soil has been proven to play a key role in the contemporary distribution of extremely small population size endangered species [9]. Indeed, disregarding soil variables in fine-scale models has led to inaccurate predictions of species potential distribution areas under climate change [10]. Concurrently, the spatial mapping of human footprint is also significantly related to species extinction risk [11]. O. rehderiana endangerment was associated with human selective logging, field husbandry, and livestock breeding [12]. Therefore, understanding human activities related pressures is essential for the correct predicting of species distribution and determining where appropriate nature reserves should be allocated [13,14]. Considering soil and human footprint during modeling of species suitable habitats prediction produced better results to those solely based on climate variables [15] as they provide better a framework for understanding the complex impacts of environmental change on PSESPs [16,17].
Ostrya rehderiana Chun, Betulaceae, is a narrow endemic species to Zhejiang Province (Tianmu Mountain, Southeast China) and is catalogued as a PSESP [18]. The species bears a great significance and unique value in Paleo flora studies [19]. O. rehderiana wood is used for furniture and building materials; however, the number of reproductive individuals has significantly decreased and currently suffers from a lack of recruitment caused by climate change [20]. Therefore, finding suitable cultivation conditions along with determining the spatial distribution of suitable habitat for this species under the current and future climate are of an immense importance.
Species Distribution Models (SDMs) represent the main tools for predicting the spatial distribution of environmental suitability for species [21,22], yet the SDMs of PSESPs have not received much attention. The MaxEnt model is one of the best SDM techniques suitable for species with narrow distribution ranges. It can obtain good accuracy when the samples are more than five [23,24] and can predict species occurrence probability under current, past, and future climate conditions [25,26].
This study is aimed at predicting the distribution of O. rehderiana suitable habitat under current and future climates using the MaxEnt model. To enhance the reliability of model predictions, we incorporated climate, soil, and human footprint variables into predicting the species suitable habitats. Our objectives were to: (1) build climate, soil, and human footprint niche models and integrate their predictions; (2) quantify climate, soil, and human footprint variables contributions in explaining the resulting species distributions; (3) predict current areas where species distribution ranges; (4) project future areas where species suitable cultivation distribution ranges. We expected that the inclusion of soil and human footprint factors in this study would produce more accurate and realistic predictions of species distributions. Our predictions are expected to be crucial for the protection and reintroduction of potentially suitable habitats of rare endangered plants.

2. Materials and Methods

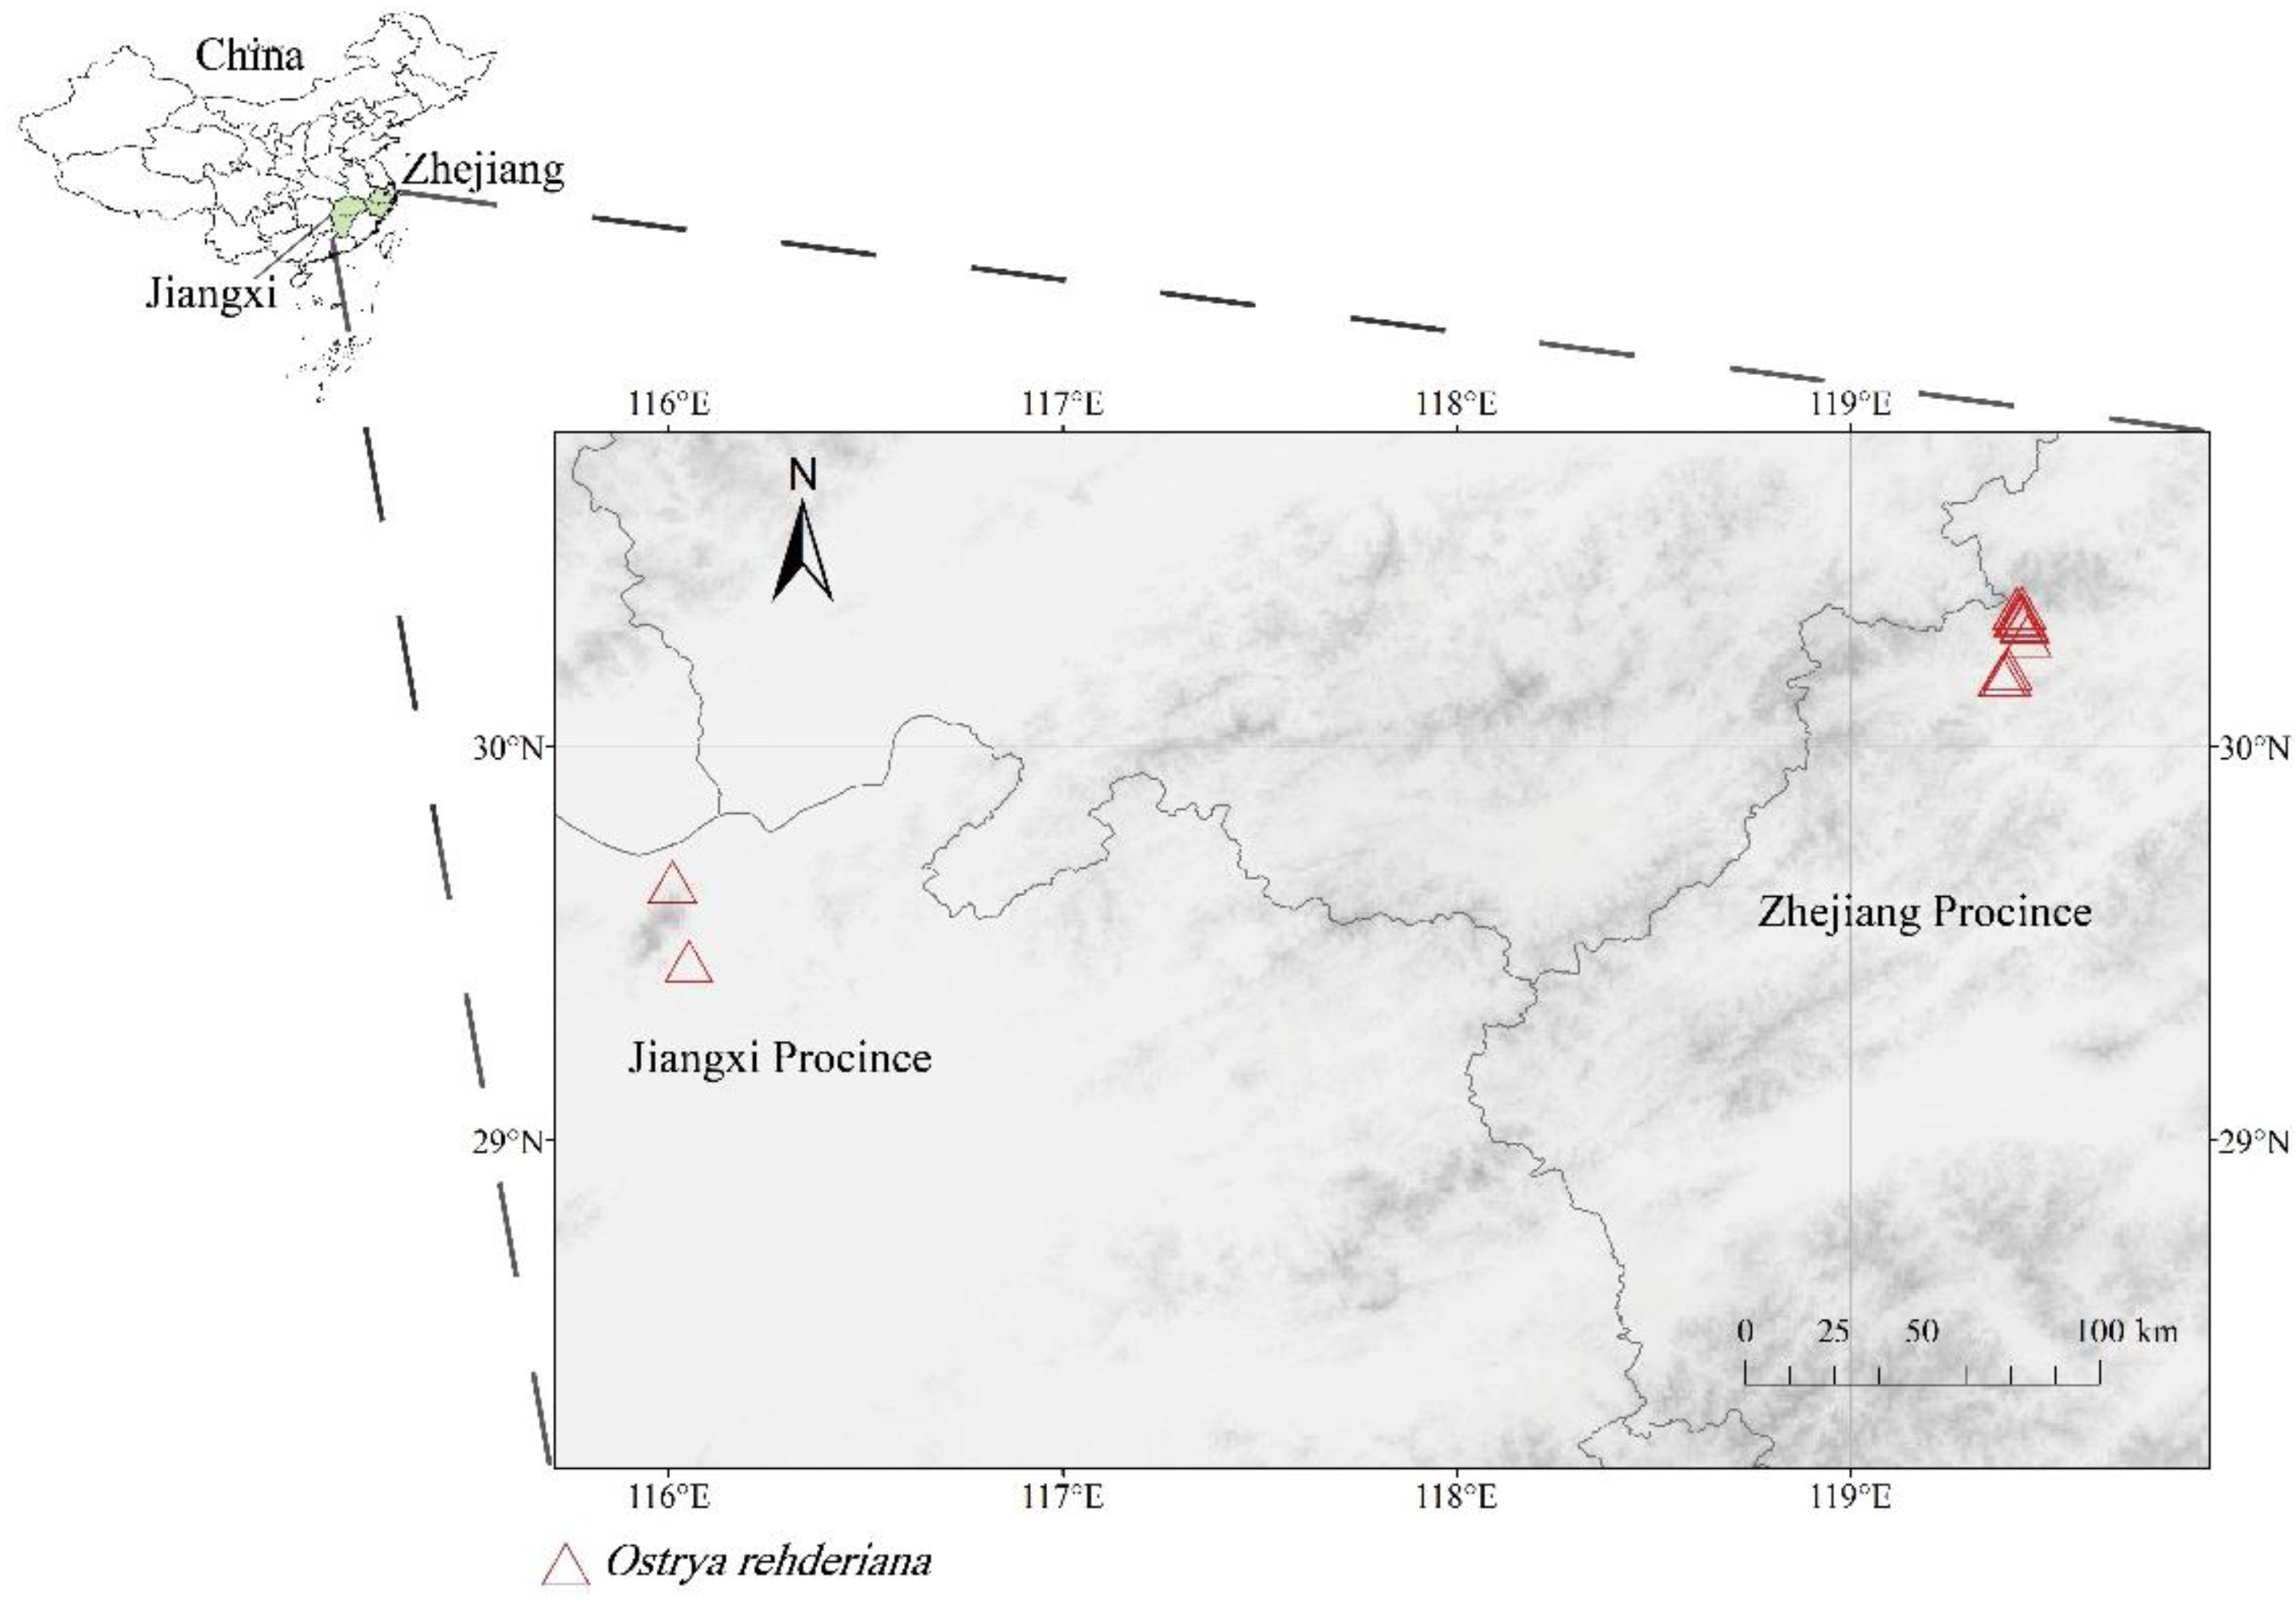
2.1. Data Collection

O. rehderiana is an endangered and rare species, and we only identified 15 O. rehderiana distribution points in this study (Figure 1). We collected them from three sources, including a global database (Global Biodiversity Information Facility, GBIF, https://0-doi-org.brum.beds.ac.uk/10.15468/dl.x777jg, accessed on 18 November 2021), the National Specimen Information Infrastructure (NSII, http://www.nsii.org.cn, accessed on 18 November 2021), and the Chinese Virtual Herbarium (CVH, http://www.cvh.ac.cn/, accessed on 18 November 2021).
We used ClimateAP software (Available online: http://ClimateAP.net/default.aspx, accessed on 18 November 2021) to obtain 16 climate predictors (Table 1). ClimateAP is a standalone MS Windows software application that extracts and downscales gridded monthly climate data for the reference normal period (1961–1990) from PRISM and WorldClim to scale-free point locations [27]. These climatic variables expressed 11 temperature and 5 precipitation metrics at about a 4 × 4 km grid resolution. We used the IPCC fifth assessment report (IPCC, 2014) based on the General Circulation Models (GCMs) of the Coupled Model Intercomparison Project (CMIP5) [28]. The reference climate (also referred to as the current climate) data were the average for 1961–1990, and future climate data were for the 2050s (2041–2070) and 2080s (2071–2100). We used the (RCP) 4.5 climate change scenario for 2050s. RCP 4.5 is a climate change scenario under government intervention regarded as an intermediate solution. Soil variables were derived from 16 basic soil indicators (HWSD, Table 1) of the Harmonized World Soil Database (HWSD, http://www.iiasa.ac.at/web/home/research/researchPrograms/water/HWSD.html, accessed on 18 November 2020), containing a soil raster data layer with 30 arc seconds spatial resolution [29]. The human footprint index was procured from the Center for International Earth Science Information Network (CIESIN, http://www.ciesin.org/, accessed on 8 October 2020), reflecting the degree of human activities (Table 1). The human footprint (HF) index data were obtained from: (1) built environments; (2) population density; (3) electric infra-structure; (4) croplands; (5) pasture lands; (6) roads; (7) railways; and (8) navigable waterways [30]. Among them, we eliminated independent variables with a variance inflation factor (VIF) less than 10, for the climatic variables, and the soil&HF variables [31].

2.2. Model Setting and Evaluation

We used the MaxEnt (version 3.4.1, Princeton University, Princeton, NJ, USA) to build niche-based models using climate variables and the combination of soil and human footprint variables, respectively. The geographical location combined with 16 climate variables, 16 soil variables, and 1 human footprint index were imported into MaxEnt. We randomly selected 75% of data points to build the model and used the remaining 25% of the data points for model validation. We used 16 climate variables to pre-build the model and ran it 3 times in a row to abandon climate variables that did not contribute to the model (<10%). We repeated the operation 15 times and took average values to reduce the uncertainty from training and validation sets splitting in the final model process [32]. We set the Max number of background points to 10,000.
The MaxEnt model ranked the importance of the environmental variables through the contributions of each variable to the overall model accuracy gain. We evaluated the models’ accuracy using the area under the receiver operating characteristic curve (AUC) [32] to measure the quality of a ranking of sites [33]. It is the probability that a randomly chosen presence site would be ranked above a randomly chosen absence site. AUC values range from 0 to 1, with values closer to 1 indicating good-performance models, stronger correlation between environmental variables, and the geographical distribution of predicted species [34].

2.3. Model Predictions

The outputs of the MaxEnt models were the cumulative probability for each pixel on the scale of 0 to 100% [35]. The logical output results generated using MaxEnt software were expressed in probability and ranged between zero and one. The modeled results were classified into 3 levels with the probability of 0.1–0.3, 0.3–0.5, and 0.5–1 being considered low-, medium-, and high-suitability, respectively, using the Reclassify tool of ArcMap 10.6 [36,37]. Due to the fragile nature of O. rehderiana and the difficulty to quantify economic costs of conservation, we integrated various relevant factors to avoid the impact of interactions among them on the prediction performance. We used Feng et al. 2020′s [21] two-step approach to consider the effects of three types of variables (climate, soil, and human footprint). First, we established a climatic model to predict the baseline of suitable habitat, then used the soil and human footprint model to predict additional restraints within the baseline (filtered the climate habitat by soil and human footprint habitat). The filtered habitat was used to represent the suitable habitat for climate, soil, and human footprint conditions. Second, because the soil type and human footprint data are imperceptible on the time scale, there are no future projections available. Thus, we considered soil and human footprint variables as constants in projecting the suitable habitat for the future period [38].

3. Results

3.1. Prediction Accuracy of O. rehderiana Suitability

The average AUC values for MaxEnt models were 0.976 and 0.841 for the climate and the soil and human footprint models, respectively, suggesting that the MaxEnt models could provide accurate predictions of habitat suitability for O. rehderiana cultivation.
The percentage contribution of six climate variables were CMD (45.3%), DD < 0 (39%), TD (14.7%), NFFD (0.6%), MWMT (0.2%), and MAP (0.1%) (Table 2). The contribution percentages of 11 soil and 1 human footprint index combinations were T_USDA_TEX_CLASS (76.1%), T-CEC-CLAY (10.3%), T-ESP (6.3%), T-SAND (2.5%), T-GRAVEL (1.1%), T-CACO3 (1%), T-OC (0.7%), HF (0.7%), T_BULK_DENSITY (0.5%), T-SILT (0.4%), T-CASO4 (0.2%), and T_REF_BULK_DENSITY (0.1%) (Table 2).
Variable response curves showed the suitable ranges of three important climatic variables were 0–50 mm for CMD, 0–50 days for DD < 0, and 3–24 °C for TD (Figure 2). Suitable ranges of the three most significant soil variables were 0–5 for T_USDA_TEX_CLASS, 0–30 for T-CEC-CLAY, and 0–4 for T-ESP (Figure 2).

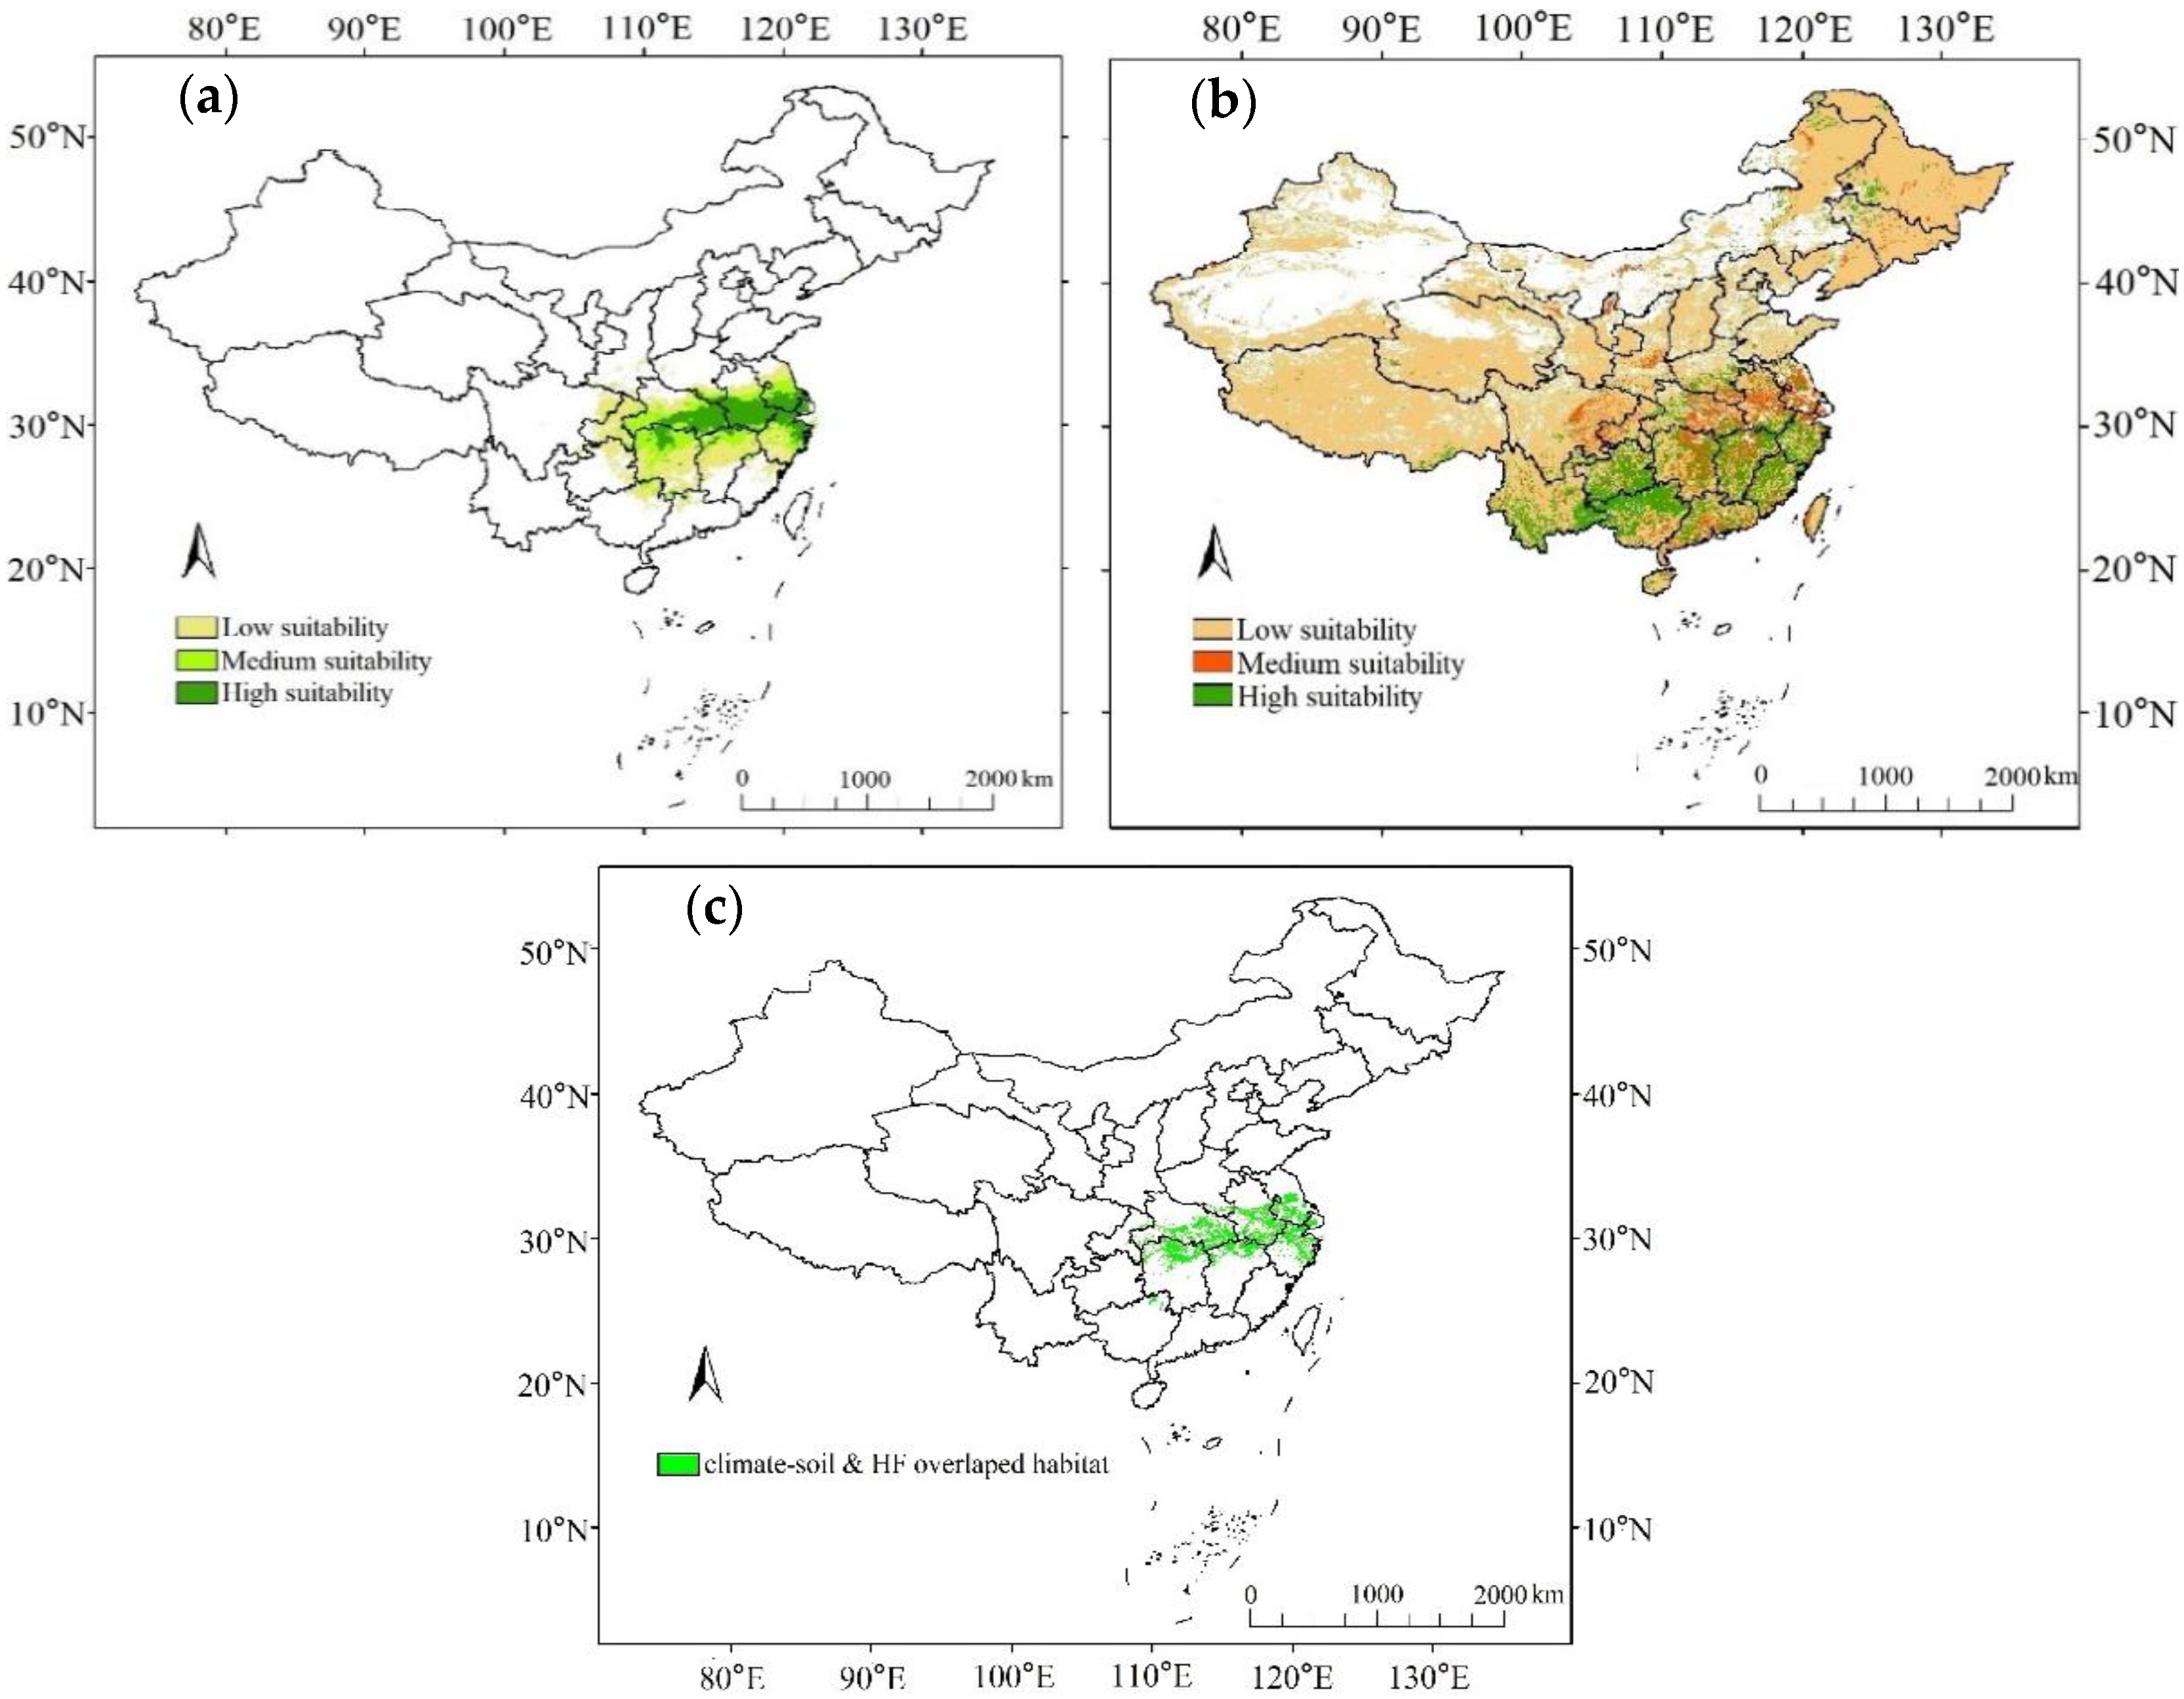
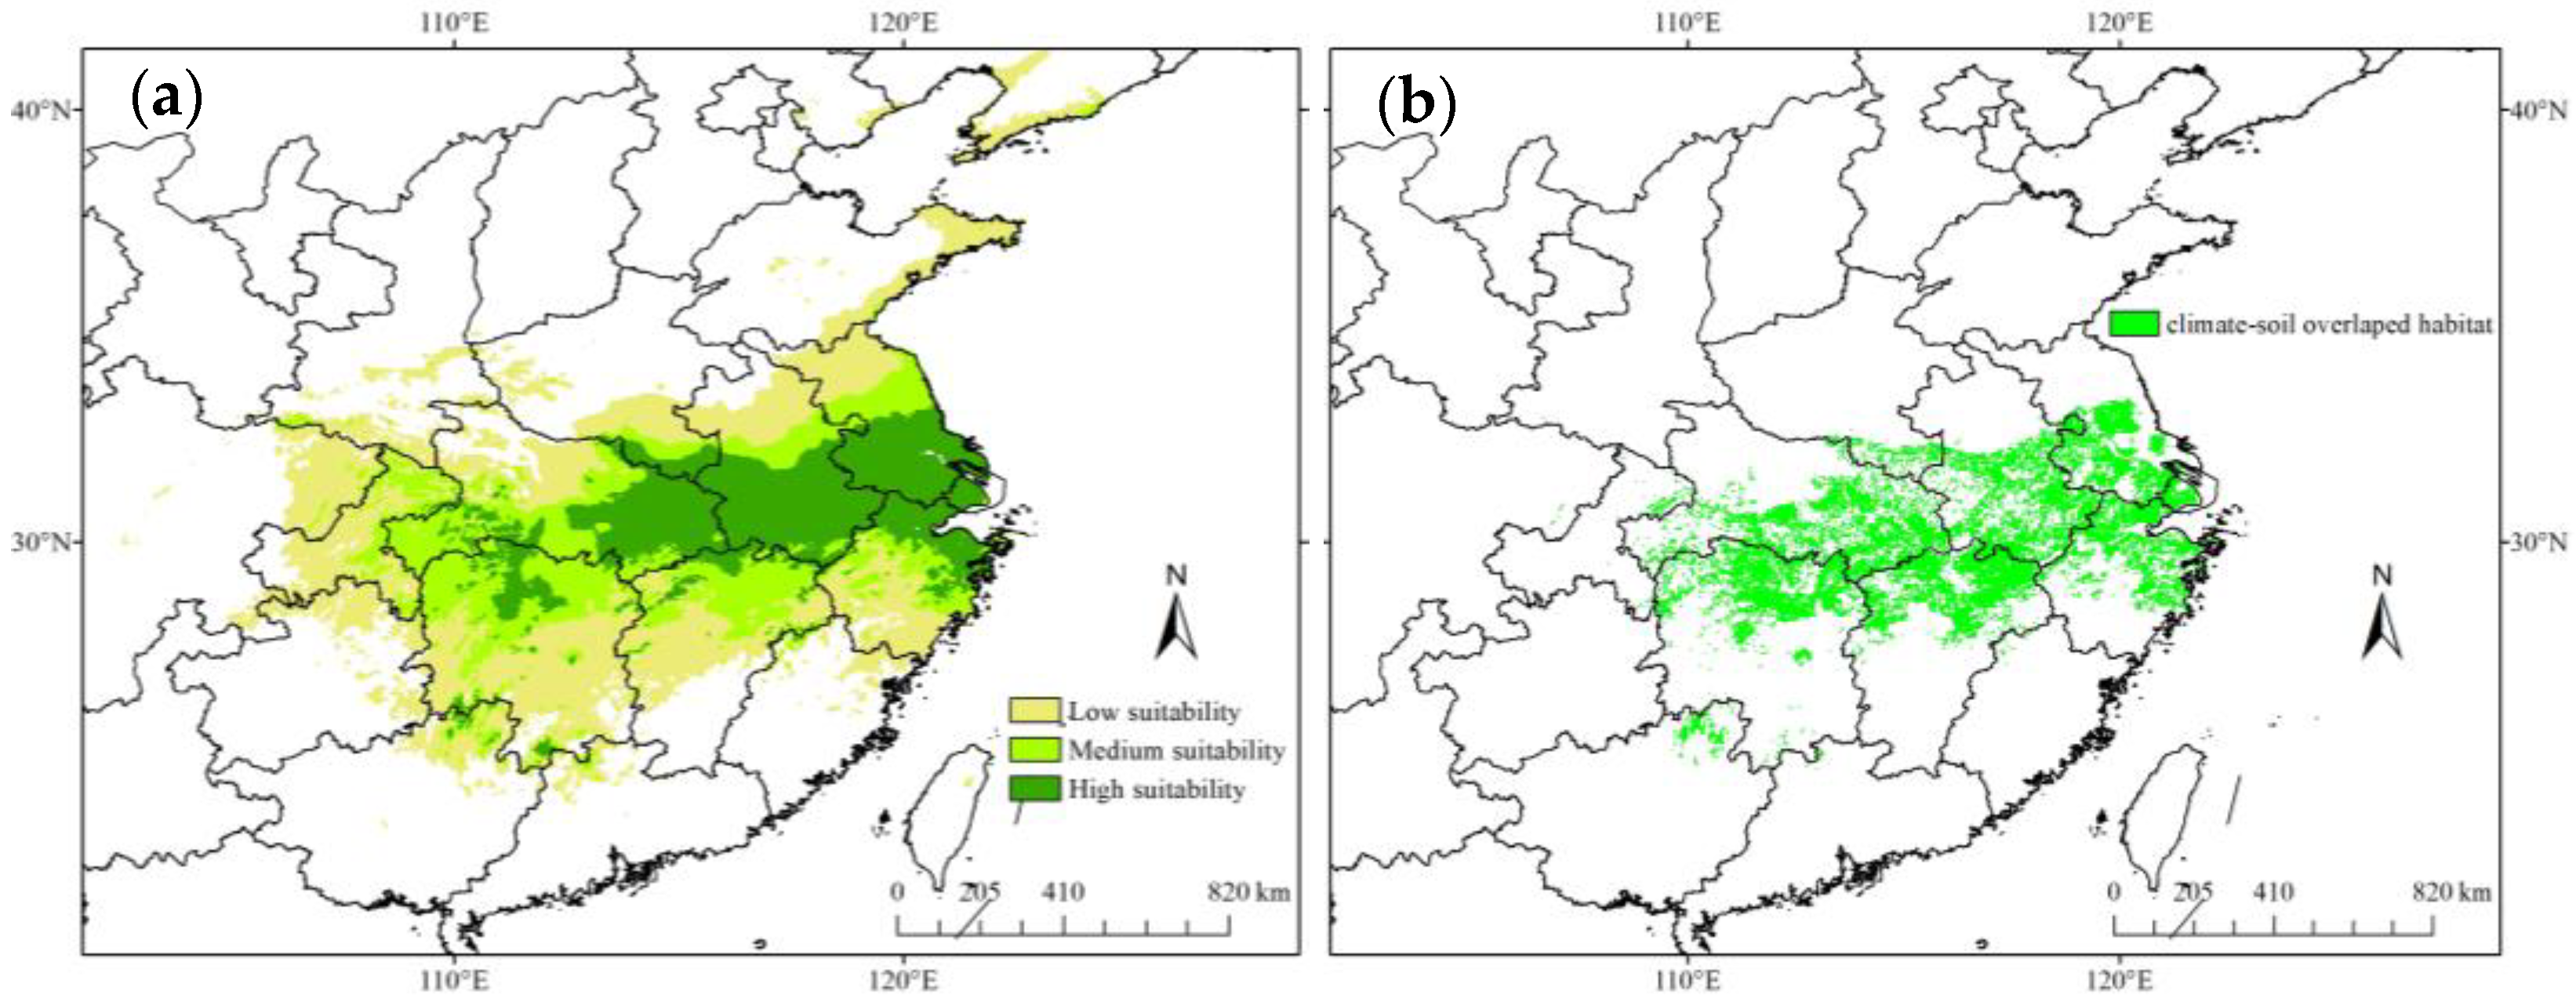
3.2. Predicted O. rehderiana Contemporary Suitable Habitats

The predicted present potential distributions of O. rehderiana under current climatic conditions showed that its suitable habitat would spread out throughout the 30° N (Figure 3a). The highly suitable habitat was mainly distributed in the border of Jiangsu and Zhejiang, the southern part of Anhui and Hubei, and the northern part of Hunan, with an area of 23.4 × 10⁵ km2. The medium- and low-suitable habitats were distributed along the high-suitable habitats, with areas of 22.5 × 10⁵ and 45.3 × 10⁵ km2, respectively (Table 3).
The soil–human footprint combination model has a wider suitable habitat than the climatic model (Figure 3b), with high- and medium-suitable habitats mostly found between 22° N and 35° N, with areas of 76.2 × 10⁵ and 47.0 × 10⁵ km2, respectively. However, the low-suitable habitat has the most widely distributed area, with 537.8 × 10⁵ km2 (Table 3).
After the climatic habitats were filtered by the soil and human footprint habitats, the climate suitable habitat was reduced by approximately 55% to 23.4 × 10⁵ km2, and only occupied 19% of the suitable habitats of soil and human footprint (Figure 3c and Table 3 and Table 4).

3.3. O. rehderiana Potential Distribution under Different Climate Change Scenarios

In the 2050s, our quantitative investigations showed that areas of high-, medium-, and low-suitable habitats under the RCP4.5 scenario were 24.3 × 10⁵, 23.5 × 10⁵, and 43.3 × 10⁵ km2, respectively (Table 4). These future suitable habitats are mainly distributed in Jiangsu, Zhejiang, Shanghai, Anhui, Jiangxi, Hunan, Hubei, and Chongqing provinces (Figure 4). Overall, the suitable habitats for the two climate scenarios presented an increasing trend over time.
In the 2050s, and after filtering for soil and human footprint habitats, the dual suitable habitat under RCP4.5 scenario was 25.3 × 10⁵ km2, accounting for 57% of the climate-suitable habitat. However, this only accounts for 21% of the soil and human footprint suitable habitat (Table 4). The double suitable habitat is mainly distributed in Jiangsu, Zhejiang, Anhui, Jiangxi, Hubei, and Hunan near 30° N (Figure 4 a,b). Overall, O. rehderiana benefited from the effects of climate change through expanding its original niche.

4. Discussion

Saving natural plants with extremely small populations is an essential endeavor for ecological, economic, and human health reasons and is gaining increased attention in international conservation biology and restoration ecology [39]. Here, we used MaxEnt model to simulate O. rehderiana potential suitable habitats distribution for this extremely small population after the concurrent integrating of both climate, and soil and human footprint variables, the first of its kind without compromising the contribution of climate variables. Our results showed that the suitability geographic distribution of O. rehderiana would expand under predicted levels of climate change. The climate niche model, and soil and human footprint combination niche model output reached an accurate level with AUC values of 0.976 and 0.841, respectively [40]. Furthermore, climate (Hargreaves climatic moisture deficit, degree-days below 0 °C (chilling degree-days), and temperature difference between MWMT and MCMT, or continentality) and soil (the topsoil USDA texture classification, topsoil cation exchange capacity (clay), and topsoil sodicity (ESP)) were the most important soil variables for the distribution areas of O. rehderiana, indicating that the species appears to prefer warm and humid climate and alkaline clay soil geographical environment. Therefore, this study advanced our understanding of the potential distribution of O. rehderiana under current and future conditions, and the factors regulating this potential. This information is expected to provide directions for the conservation and reintroduction of this extremely small endangered species populations.

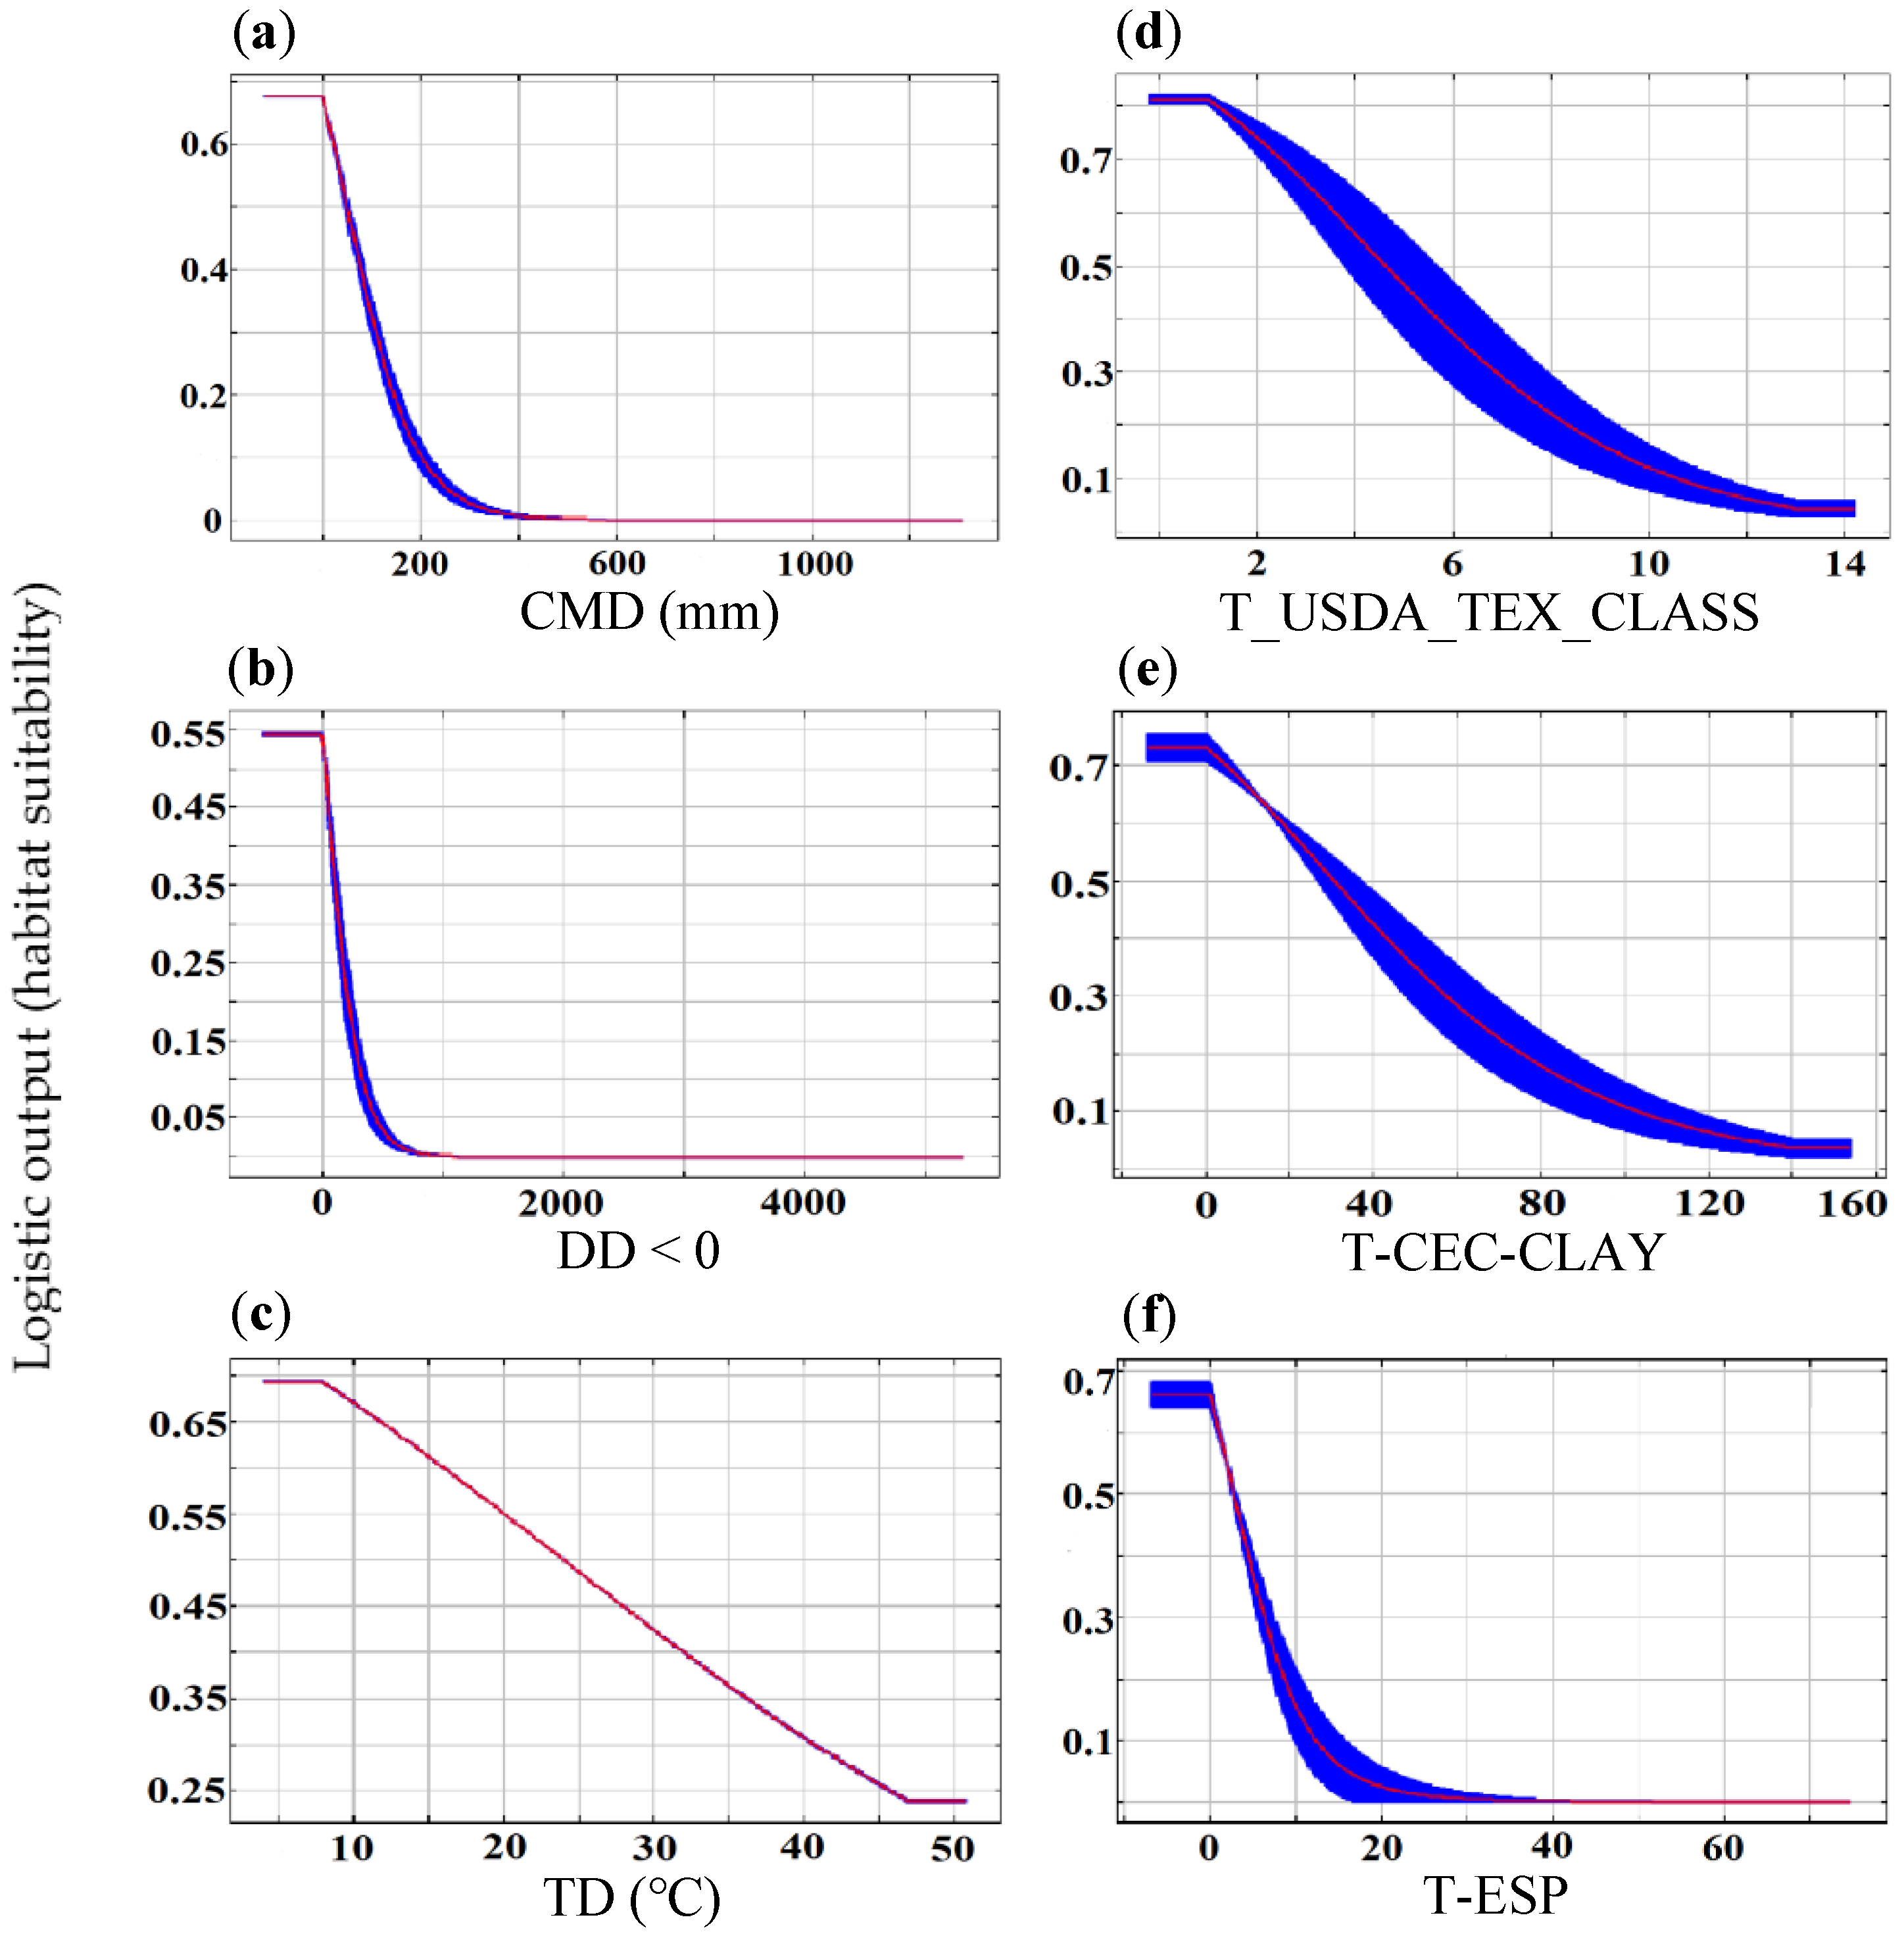
4.1. Key Environmental Factors Determining the O. rehderiana Distribution

Climate was the predominant determining factor in regulating species distributions at large spatial and temporal scales [41]. Here, climatic variables including CMD, DD < 0, and TD were greatly influenced O. rehderiana distribution. More specifically, CMD was the most important climate variable limiting O. rehderiana distribution as it effects plant growth and yield [42]. Similar to C. oblongifolia and C. tientaiensis, two endangered species, with the same niche, the distribution of O. rehderiana was limited by moisture deficit [43]. In addition, low temperatures and temperature differences are also climate factors limiting O. rehderiana distribution. Consistent with the conclusion of O. rehderiana physiological ecology study, the temperature was an important filter on trees. Low temperature influenced population renewal through its effect on seed germination [44]. Large temperature differences will create seed germination difficulty and reduced plant growth as well as increased mortality [15,45].
Meanwhile, recently it has been proposed that modeling without considering soil factors may overestimate the suitable habitat area, and soil factors might outweigh the effect of climate factors on species and ecosystem at the finer scales [21,46]. Our findings identified that O. rehderiana suitable habitat has been limited by some soil variables, including T_USDA_TEX_CLASS, T-CEC-CLAY, and T-CEC-SOIL, which were found to effectively contribute modeling the species distribution. Soil texture is the basis for physical and chemical soil processes affecting plants with dominating soil moisture and nutrient retention, the stability of soil structure, and the degree of soil erosion [47], while T-CEC-CLAY affects soil fertility, pH and structural stability, and nutrient effectiveness [44,48]. Meanwhile, T-CEC-SOIL influences soil chemistry, and a proper range of topsoil sodicity can maintain soil nutrient balance and facilitate plant development [49]. Thus, they were unquestionably important factors in our model.

4.2. O. rehderiana Predicted Changes to Climatic Suitable Habitat

Our results showed that the climate model predicted a narrower range than the combined soil and human footprint model, indicating that climatic variables are the main determinant limiting the distribution of O. rehderiana. Results, confirming previous studies demonstrating that species with narrow distribution are more sensitive to climate change [50]. The existing natural O. rehderiana are rare, suffering from low genetic diversity, and close to nonexciting regeneration ability, so the species ability to adapt to variation or track changing climatic conditions is limited [51]. Furthermore, our findings confirmed that considering only climate factors would overestimate the distribution range of O. rehderiana. In addition to dynamic climate variables, the determinants of species distribution should also include other static variables, such as soil types and human footprint, which should be considered as independent explanatory variables to improve the reliability of the derived model(s) [38].
We concluded that O. rehderiana’s future suitable habitats will benefit from climate change under RCP4.5. The suitability distribution of O. rehderiana in the RCP4.5 scenario expanded more widely and had a trend of northward migration as compared to contemporary. Future climate change is mainly reflected in the escalating temperature increase caused by greenhouse gases, which will promote the migration of warm temperate tree species to the boreal forests [52]. O. rehderiana is a subtropical species that prefers warmth and humidity, therefore, in the highest greenhouse gas emissions scenario, high-latitude regions will provide greater space for O. rehderiana distribution.

4.3. Implications for O. rehderiana Conservation

Although our results showed that future climate change would be favorable to O. rehderiana distribution, the natural distribution of O. rehderiana is currently under threat. Despite several global restoration projects attempts, including studying rates of pollen germination [53], establishing tissue culture induction and re-differentiation systems [54], developing molecular marker technology and genome sequencing technology to improve our species understanding [55,56], the species’ future remains in great danger as systematic and scientific ecological restoration planning is lacking. The distribution map of potentially suitable habitats provided by the model can be used as a reference to determine the priority of the species restoration strategy and to more effectively protect and restore its natural habitat [57].
Future projections suggested that O. rehderiana range of climate suitable habitats would expand from 35 to 40° N. Therefore, we suggest that these regions be used as the priority areas for species introduction and cultivation [58]. However, in recent years, urbanization and rapid population expansion in the Yangtze River basin has intensified the pressure on the natural environment. To avoid the conflict between protection actions and human activities leading to increased economic costs [59], we propose establishing conservation botanical gardens in priority cultivation areas or transforming O. rehderiana into urban landscape vegetation. This will protect endangered species while improving urban forest ecology [6,60]. We also identified future suitable stabilization distribution areas, such as near 30° N. We recommend adaptive measures close to the in situ conservation sites to ensure that native habitats are stable and protected, including establishing protected areas and developing pest-resistant varieties using breeding and genetic improvement technologies [61]. In summary, we advocate a combination of macro- and micro- approaches to improve O. rehderiana adaptability to climate change [62], selecting appropriate locations to develop effective protection and restoration management strategy.

5. Conclusions

Here, we used a climate niche model to predict the baseline suitable habitat and a combined soil and human footprint model to predict additional restraints with the baseline to generate O. rehderiana current and future potential distribution maps. This approach has improved our model reliability. Our conclusions showed that future suitable habitats for O. rehderiana are expected to increase, and that there would be a trend of high-latitude migration. Based on the current study and the status of O. rehderiana, we suggest that endangered species should take macroscopic influences into account in combination with ecological niche modeling techniques.

Author Contributions

Conceptualization, L.F., J.S., Y.A.E.-K. and T.W.; methodology, L.F., J.S. and T.W.; software and mapping, L.F. and J.S.; data collection, X.T. and X.Y.; editing, L.F., Y.A.E.-K. and T.W.; supervision, T.W.; project administration, T.W. All authors have read and agreed to the published version of the manuscript.

Funding

This research did not receive any specific grant from funding agencies in the public, commercial, or not-for-profit sectors.

Data Availability Statement

The data presented in this study are available on request from the corresponding author.

Conflicts of Interest

The authors declare no conflict of interest.

References

  1. Cortini, F.; Comeau, P.G.; Wang, T.; Hibbs, D.; Bluhm, A. Climate effects on red alder growth in the Pacific Northwest of North America. For. Ecol. Manag. 2012, 277, 98–106. [Google Scholar] [CrossRef] [Green Version]
  2. Lu, Y.; Coops, N.C.; Wang, T.; Wang, G. A process-based approach to estimate Chinese fir (Cunninghamia lanceolata) distribution and productivity in southern China under climate change. Forests 2015, 6, 360–379. [Google Scholar] [CrossRef] [Green Version]
  3. Wang, T.; Hamann, A.; Spittlehouse, D.; Carroll, C. Locally downscaled and spatially customizable climate data for historical and future periods for North America. PLoS ONE 2016, 11, e0156720. [Google Scholar] [CrossRef] [PubMed]
  4. Davis, M.B.; Shaw, R.G. Range shifts and adaptive responses to Quaternary climate change. Science 2001, 292, 673–679. [Google Scholar] [CrossRef] [Green Version]
  5. Provan, J.; Bennett, K.D. Phylogeographic insights into cryptic glacial refugia. Trends Ecol. Evol. 2008, 23, 564–571. [Google Scholar] [CrossRef]
  6. Li, Y.-Y.; Guan, S.-M.; Yang, S.-Z.; Luo, Y.; Chen, X.-Y. Genetic decline and inbreeding depression in an extremely rare tree. Conserv. Genet. 2012, 13, 343–347. [Google Scholar] [CrossRef]
  7. Sun, W. Words from the guest editor-in-chief. Plant Divers. 2016, 38, 207. [Google Scholar] [CrossRef] [PubMed] [Green Version]
  8. Ma, Y.; Chen, G.; Grumbine, R.E.; Dao, Z.; Sun, W.; Guo, H. Conserving plant species with extremely small populations (PSESP) in China. Biodivers. Conserv. 2013, 22, 803–809. [Google Scholar] [CrossRef]
  9. Liu, X.; He, Y.; Xiao, Y.; Wang, Y.; Jiang, Y.; Jiang, Y. Soil seed burial and competition with surrounding plants determine the emergence and development of seedling of an endangered species Horsfieldia hainanensis Merr. in China. Sci. Rep. 2019, 9, 17970. [Google Scholar] [CrossRef]
  10. Bertrand, R.; Perez, V.; Gégout, J.C. Disregarding the edaphic dimension in species distribution models leads to the omission of crucial spatial information under climate change: The case of Quercus pubescens in F rance. Glob. Chang. Biol. 2012, 18, 2648–2660. [Google Scholar] [CrossRef]
  11. Li, S.; Wu, J.; Gong, J.; Li, S. Human footprint in Tibet: Assessing the spatial layout and effectiveness of nature reserves. Sci. Total Environ. 2018, 621, 18–29. [Google Scholar] [CrossRef]
  12. Joly, C.A.; Metzger, J.P.; Tabarelli, M. Experiences from the B razilian A tlantic F orest: Ecological findings and conservation initiatives. New Phytol. 2014, 204, 459–473. [Google Scholar] [CrossRef] [PubMed] [Green Version]
  13. Chardon, N.I.; Rixen, C.; Wipf, S.; Doak, D.F. Human trampling disturbance exerts different ecological effects at contrasting elevational range limits. J. Appl. Ecol. 2019, 56, 1389–1399. [Google Scholar] [CrossRef]
  14. Di Marco, M.; Venter, O.; Possingham, H.P.; Watson, J.E. Changes in human footprint drive changes in species extinction risk. Nat. Commun. 2018, 9, 4621. [Google Scholar] [CrossRef] [PubMed]
  15. Blach Overgaard, A.; Svenning, J.C.; Dransfield, J.; Greve, M.; Balslev, H. Determinants of palm species distributions across Africa: The relative roles of climate, nonclimatic environmental factors, and spatial constraints. Ecography 2010, 33, 380–391. [Google Scholar] [CrossRef]
  16. Figueiredo, F.O.; Zuquim, G.; Tuomisto, H.; Moulatlet, G.M.; Balslev, H.; Costa, F.R. Beyond climate control on species range: The importance of soil data to predict distribution of Amazonian plant species. J. Biogeogr. 2018, 45, 190–200. [Google Scholar] [CrossRef]
  17. Zuquim, G.; Tuomisto, H.; Jones, M.M.; Prado, J.; Figueiredo, F.O.; Moulatlet, G.M.; Costa, F.R.; Quesada, C.A.; Emilio, T. Predicting environmental gradients with fern species composition in Brazilian Amazonia. J. Veg. Sci. 2014, 25, 1195–1207. [Google Scholar] [CrossRef]
  18. Deng, S.; Wu, Y.; Wu, K.; Fang, L.; Li, L.; Zeng, S. Breeding characteristics and artificial propagation of 14 species of Wild Plant with Extremely Small Populations (WPESP) in China. Biodivers. Sci. 2020, 28, 385–400. [Google Scholar] [CrossRef]
  19. Kanglin, G. Current situation and propagation of rare tree species-Ostrya rederiana. J. Zhejiang For. Coll. 1988, 1, 93–95. [Google Scholar]
  20. Yang, Y.; Ma, T.; Wang, Z.; Lu, Z.; Li, Y.; Fu, C.; Chen, X.; Zhao, M.; Olson, M.S.; Liu, J. Genomic effects of population collapse in a critically endangered ironwood tree Ostrya rehderiana. Nat. Commun. 2018, 9, 5449. [Google Scholar] [CrossRef]
  21. Feng, L.; Sun, J.; Shi, Y.; Wang, G.; Wang, T. Predicting Suitable Habitats of Camptotheca acuminata Considering Both Climatic and Soil Variables. Forests 2020, 11, 891. [Google Scholar] [CrossRef]
  22. Zhang, L.; Liu, S.; Sun, P.; Wang, T.; Wang, G.; Zhang, X.; Wang, L. Consensus forecasting of species distributions: The effects of niche model performance and niche properties. PLoS ONE 2015, 10, e0120056. [Google Scholar] [CrossRef] [Green Version]
  23. Elith, J.; Phillips, S.J.; Hastie, T.; Dudík, M.; Chee, Y.E.; Yates, C.J. A statistical explanation of MaxEnt for ecologists. Divers. Distrib. 2011, 17, 43–57. [Google Scholar] [CrossRef]
  24. Phillips, S.J.; Dudík, M. Modeling of species distributions with Maxent: New extensions and a comprehensive evaluation. Ecography 2008, 31, 161–175. [Google Scholar] [CrossRef]
  25. Di Febbraro, M.; Carotenuto, F.; Castiglione, S.; Russo, D.; Loy, A.; Maiorano, L.; Raia, P. Does the jack of all trades fare best? Survival and niche width in Late Pleistocene megafauna. J. Biogeogr. 2017, 44, 2828–2838. [Google Scholar] [CrossRef] [Green Version]
  26. Kukwa, M.; Kolanowska, M. Glacial refugia and the prediction of future habitat coverage of the South American lichen species Ochrolechia austroamericana. Sci. Rep. 2016, 6, 38779. [Google Scholar] [CrossRef] [PubMed] [Green Version]
  27. Wang, T.; Wang, G.; Innes, J.L.; Seely, B.; Chen, B. ClimateAP: An application for dynamic local downscaling of historical and future climate data in Asia Pacific. Front. Agric. Sci. Eng. 2017, 4, 448–458. [Google Scholar] [CrossRef] [Green Version]
  28. Fischedick, M.; Roy, J.; Acquaye, A.; Allwood, J.; Ceron, J.-P.; Geng, Y.; Kheshgi, H.; Lanza, A.; Perczyk, D.; Price, L. Industry In: Climate Change 2014: Mitigation of Climate Change. In Contribution of Working Group III to the Fifth Assessment Report of the Intergovernmental Panel on Climate Change; Technical Report; Gambridge University Press: Cambridge, UK; New York, NY, USA, 2014. [Google Scholar]
  29. Fischer, G.; Van Velthuizen, H.; Shah, M.; Nachtergaele, F. Global Agroecological Assessment for Agriculture in the 21st Century; Food and Agriculture Organization of the United Nations (FAO): Rome, Italy; International Institute for Applied Systems Analysis (IIASA): Laxenburg, 2002. [Google Scholar]
  30. Venter, O.; Sanderson, E.W.; Magrach, A.; Allan, J.R.; Beher, J.; Jones, K.R.; Possingham, H.P.; Laurance, W.F.; Wood, P.; Fekete, B.M. Sixteen years of change in the global terrestrial human footprint and implications for biodiversity conservation. Nat. Commun. 2016, 7, 12558. [Google Scholar] [CrossRef] [Green Version]
  31. Zhan, P.; Wang, F.; Xia, P.; Zhao, G.; Wei, M.; Wei, F.; Han, R. Assessment of suitable cultivation region for Panax notoginseng under different climatic conditions using MaxEnt model and high-performance liquid chromatography in China. Ind. Crops Prod. 2022, 176, 114416. [Google Scholar] [CrossRef]
  32. Phillips, S.J.; Anderson, R.P.; Schapire, R.E. Maximum entropy modeling of species geographic distributions. Ecol. Model. 2006, 190, 231–259. [Google Scholar] [CrossRef] [Green Version]
  33. Fielding, A.H.; Bell, J.F. A review of methods for the assessment of prediction errors in conservation presence/absence models. Environ. Conserv. 1997, 24, 38–49. [Google Scholar] [CrossRef]
  34. Elith, J.; Graham, C.H.; Anderson, R.P.; Dudík, M.; Ferrier, S.; Guisan, A.; Hijmans, R.J.; Huettmann, F.; Leathwick, J.R.; Lehmann, A. Novel methods improve prediction of species’ distributions from occurrence data. Ecography 2006, 29, 129–151. [Google Scholar] [CrossRef] [Green Version]
  35. Guo, J.; Liu, X.P.; Zhang, Q.; Zhang, D.F.; Xie, C.X.; Liu, X. Prediction for the potential distribution area of Codonopsis pilosula at global scale based on Maxent model. J. Appl. Ecol. 2017, 28, 992–1000. [Google Scholar] [CrossRef]
  36. Qin, A.; Liu, B.; Guo, Q.; Bussmann, R.W.; Ma, F.; Jian, Z.; Xu, G.; Pei, S. Maxent modeling for predicting impacts of climate change on the potential distribution of Thuja sutchuenensis Franch., an extremely endangered conifer from southwestern China. Glob. Ecol. Conserv. 2017, 10, 139–146. [Google Scholar] [CrossRef]
  37. Yi, Y.-j.; Zhou, Y.; Cai, Y.-p.; Yang, W.; Li, Z.-w.; Zhao, X. The influence of climate change on an endangered riparian plant species: The root of riparian Homonoia. Ecol. Indic. 2018, 92, 40–50. [Google Scholar] [CrossRef]
  38. Stanton, J.C.; Pearson, R.G.; Horning, N.; Ersts, P.; Reşit Akçakaya, H. Combining static and dynamic variables in species distribution models under climate change. Methods Ecol. Evol. 2012, 3, 349–357. [Google Scholar] [CrossRef]
  39. Albrecht, M.A.; Guerrant, E.O.; Maschinski, J.; Kennedy, K.L. A long-term view of rare plant reintroduction. Biol. Conserv. 2011, 11, 2557–2558. [Google Scholar] [CrossRef]
  40. Shao, H.; TIAN, J.-Q.; Guo, K.; SUN, O.J. Effects of sample size and species traits on performance of bioclim in predicting geographical distribution of tree species-a case study with 12 deciduous Quercus species indigenous to China. Chin. J. Plant Ecol. 2009, 33, 870–877. [Google Scholar] [CrossRef]
  41. Jiang, Y.; Wang, T.; De Bie, C.; Skidmore, A.; Liu, X.; Song, S.; Zhang, L.; Wang, J.; Shao, X. Satellite-derived vegetation indices contribute significantly to the prediction of epiphyllous liverworts. Ecol. Indic. 2014, 38, 72–80. [Google Scholar] [CrossRef]
  42. Bakoumé, C.; Shahbudin, N.; Yacob, S.; Siang, C.S.; Thambi, M.N.A. Improved method for estimating soil moisture deficit in oil palm (Elaeis guineensis Jacq.) areas with limited climatic data. J. Agric. Sci. 2013, 5, 57. [Google Scholar] [CrossRef] [Green Version]
  43. Sun, J.; Feng, L.; Wang, T.; Tian, X.; He, X.; Xia, H.; Wang, W. Predicting the Potential Habitat of Three Endangered Species of Carpinus Genus under Climate Change and Human Activity. Forests 2021, 12, 1216. [Google Scholar] [CrossRef]
  44. Feng, L.; Sun, J.; Wang, T.; Tian, X.; Wang, W.; Guo, J.; Feng, H.; Guo, H.; Deng, H.; Wang, G. Predicting suitable habitats of Ginkgo biloba L. fruit forests in China. Clim. Risk Manag. 2021, 100364. [Google Scholar] [CrossRef]
  45. Liu, Y.; Wang, T.; El-Kassaby, Y.A. Contributions of dynamic environmental signals during life-cycle transitions to early life-history traits in lodgepole pine (Pinus contorta Dougl.). Biogeosciences 2016, 13, 2945–2958. [Google Scholar] [CrossRef] [Green Version]
  46. Yu, F.; Wang, T.; Groen, T.A.; Skidmore, A.K.; Yang, X.; Ma, K.; Wu, Z. Climate and land use changes will degrade the distribution of Rhododendrons in China. Sci. Total Environ. 2019, 659, 515–528. [Google Scholar] [CrossRef] [PubMed]
  47. Castro Franco, M.; Domenech, M.B.; Borda, M.R.; Costa, J.L. A Spatial Dataset of Topsoil Texture for the Southern Argentine Pampas. Geoderma Regional. 2018, 12, 18–27. [Google Scholar] [CrossRef]
  48. Li, N.; Zare, E.; Huang, J.; Triantafilis, J. Mapping soil cation-exchange capacity using Bayesian modeling and proximal sensors at the field scale. Soil Sci. Soc. Am. J. 2018, 82, 1203–1216. [Google Scholar] [CrossRef]
  49. Panta, S.; Doyle, R.; Hardie, M.; Lane, P.; Flowers, T.; Haros, G.; Shabala, S. Can highly saline irrigation water improve sodicity and alkalinity in sodic clayey subsoils? J. Soils Sediments 2018, 18, 3290–3302. [Google Scholar] [CrossRef]
  50. Abolmaali, S.M.-R.; Tarkesh, M.; Bashari, H. MaxEnt modeling for predicting suitable habitats and identifying the effects of climate change on a threatened species, Daphne mucronata, in central Iran. Ecol. Inform. 2018, 43, 116–123. [Google Scholar] [CrossRef]
  51. Gallardo, B.; Aldridge, D.C. Evaluating the combined threat of climate change and biological invasions on endangered species. Biol. Conserv. 2013, 160, 225–233. [Google Scholar] [CrossRef]
  52. Boisvert-Marsh, L.; de Blois, S. Unravelling potential northward migration pathways for tree species under climate change. J. Biogeogr. 2021, 48, 1088–1100. [Google Scholar] [CrossRef]
  53. Tong, X.; Wang, K.; Chen, Z.; Wang, L.; Xiang, T. Endangerment of Ostrya rehderiana Chun and its relationship with rhizosphere soil microflora. Agron. J. 2021, 113, 746–759. [Google Scholar] [CrossRef]
  54. Gu, D.; Lu, S.; Ba, C.; Li, Y. Technique of callus induction and bud seedling of Ostrya rehderiana Chun. J. Zhejiang Univ. 2013, 40, 216–220. [Google Scholar]
  55. Li, Y.; Bi, H.; Liu, B.; Guo, X.; Hao, G.; He, Q.; Ma, T. The complete chloroplast genome of Ostrya rehderiana. Mitochondr. DNA Part A 2016, 27, 4536–4537. [Google Scholar] [CrossRef] [PubMed]
  56. Liu, J.; Jingmin, J. Germplasm and conservation of rare and endangered tree species endemic to east China. Plant Sci. Today 2014, 1, 183–187. [Google Scholar] [CrossRef] [Green Version]
  57. Carroll, C.; Roberts, D.R.; Michalak, J.L.; Lawler, J.J.; Nielsen, S.E.; Stralberg, D.; Hamann, A.; Mcrae, B.H.; Wang, T. Scale-dependent complementarity of climatic velocity and environmental diversity for identifying priority areas for conservation under climate change. Glob. Chang. Biol. 2017, 23, 4508–4520. [Google Scholar] [CrossRef]
  58. Martin, T.G.; Kehoe, L.; Mantyka-Pringle, C.; Chades, I.; Wilson, S.; Bloom, R.G.; Davis, S.K.; Fisher, R.; Keith, J.; Mehl, K. Prioritizing recovery funding to maximize conservation of endangered species. Conserv. Lett. 2018, 11, e12604. [Google Scholar] [CrossRef]
  59. Zhang, L.; Xu, W.-h.; Ouyang, Z.-y.; Zhu, C.-q. Determination of priority nature conservation areas and human disturbances in the Yangtze River Basin, China. J. Nat. Conserv. 2014, 22, 326–336. [Google Scholar] [CrossRef]
  60. Ma, B.; Li, X.; Chang, S.X. Capping material type affects rhizosphere bacteria community structure in the cover soil in oil sands reclamation. J. Soils Sediments 2017, 17, 2516–2523. [Google Scholar] [CrossRef]
  61. Ren, H.; Zhang, Q.; Lu, H.; Liu, H.; Guo, Q.; Wang, J.; Jian, S.; Bao, H.o. Wild plant species with extremely small populations require conservation and reintroduction in China. Ambio 2012, 41, 913–917. [Google Scholar] [CrossRef] [Green Version]
  62. Vandenbergh, M.P.; Ackerly, B.A.; Forster, F.E. Micro-offsets and macro-transformation: An inconvenient view of climate change justice. Harv. Environ. Law Rev. 2009, 33, 303. [Google Scholar] [CrossRef] [Green Version]
Figure 1. Distribution of observed occurrences of O. rehderiana.
Forests 13 00129 g001
Figure 2. Response curves of the three most important climate (ac) and the three most significant soil variables (df) in the MaxEnt climate model. Maximum entropy logistic output (also known as habitat suitability) is represented by the vertical Y-axis and the variable by the horizontal X-axis. When the logistics output value is greater than 0.5, the probability of species presence is higher than the ‘typical’ condition, indicating that condition is suitable for tree species. The red curves shown are the averages over 15 replicate runs; blue margins show ±1 standard deviation (SD) calculated over 15 replicates (See Table 1, for variables code).
Forests 13 00129 g002
Figure 3. Distributions of the contemporary (1970–2000) suitable habitats of O. rehderiana: (a) climatic habitats, (b) soil and HF habitats, and (c) climatic habitats filtered by the soil and HF habitats.
Forests 13 00129 g003
Figure 4. O. rehderiana climatic suitable habitats (a) under RCP4.5 in 2050s. O. rehderiana climatic suitable habitats filtered by soil and human footprint habitats (b) under RCP4.5 in the 2050s.
Forests 13 00129 g004
Table 1. Climate, soil, and human footprint index variables used for the MaxEnt model.
AbbreviationVariables DescriptionAbbreviationVariables Description
MATMean Annual TemperatureDD > 5Degree-days above 5 °C, Growing Degree-days
MWMTMean Warmest Month TemperatureDD < 0Degree-days below 0 °C, Chilling Degree-days
MCMTMean Coldest Month TemperatureNFFDThe Number of Frost-free Days
TDTemperature Difference between MWMT and MCMT, or ContinentalityPASPrecipitation as Snow (mm) between August in Previous Year and July in Current Year
MAPMean Annual PrecipitationEMTExtreme Minimum Temperature over 30 years
EXTExtreme Maximum Temperature over 30 yearsErefHargreaves reference evaporation
AHMAnnual Heat:Moisture index (MAT + 10)/(MAP/1000)CMDHargreaves Climatic Moisture Deficit
DD < 18Degree-days below 18 °CDD > 18Degree-days above 18 °C
T_USDA_TEX_CLASSTopsoil USDA Texture ClassificationT-CEC-CLAYTopsoil CEC (clay)
T-GRAVELTopsoil Gravel ContentT-CEC-SOILTopsoil CEC (soil)
T-SANDTopsoil Sand FractionT-BSTopsoil Base Saturation
T-SILTTopsoil Silt FractionT-TEBTopsoil TEB
T-CLAYTopsoil Clay FractionT-CACO3Topsoil Calcium Carbonate
T_BULK_DENSITYTopsoil Bulk DensityT-CASO4Topsoil Gypsum
T-OCTopsoil Organic CarbonT-ESPTopsoil Sodicity (ESP)
T-PH-H2OTopsoil pH (H2O)T-ECETopsoil Salinity (Elco)
T_REF_BULK_DENSITYTopsoil Reference Bulk
Density
HFHuman Footprint Index
Table 2. Contributions of the environmental variables to the MaxEnt model.
CategoryVariableContribution (%)
ClimateCMD45.3
DD < 039.0
TD14.7
NFFD0.6
MWMT0.2
MAP0.1
Soil + HFT_USDA_TEX_CLASS76.1
T-CEC-CLAY10.3
T-ESP6.3
T-SAND2.5
T-GRAVEL1.1
T-CACO31.0
T-OC0.7
HF0.7
T_BULK_DENSITY0.5
T-SILT0.4
T-CASO40.2
T_REF_BULK_DENSITY0.1
Table 3. Contemporary (1960–1990) and future habitat suitability distribution areas of O. rehderiana in China (areas in × 105 km2).
ClassesLow-SuitableMedium-SuitableHigh-Suitable
Climatic habitats45.322.523.4
Soil + HF habitats537.847.076.2
2050s—RCP4.543.323.524.3
Table 4. Predicted suitable habitat area (above 0.3) of O. rehderiana under current and different climate change scenarios.
ScenariosSoil and HF HabitatsClimate-Soil and HF Overlap HabitatsOverlap Habitats as a Percentage of ClimateOverlap Habitats as a Percentage of Soil + HF
(×105 km2)(×105 km2)(%)(%)
Current climatic habitats45.8123.15519
2050s-RCP4.547.8123.15721
Publisher’s Note: MDPI stays neutral with regard to jurisdictional claims in published maps and institutional affiliations.

