
Evaluating the Effects of Roof Greening on the Indoor Thermal Environment throughout the Year in a Chinese City (Chenzhou)


1
School of Architecture and Art, Central South University, Changsha 410083, China
2
College of Landscape and Art Design, Hunan Agricultural University, Changsha 410128, China
*
Author to whom correspondence should be addressed.
Forests 2022, 13(2), 304; https://0-doi-org.brum.beds.ac.uk/10.3390/f13020304
Submission received: 31 December 2021
/
Revised: 5 February 2022
/
Accepted: 11 February 2022
/
Published: 13 February 2022
(This article belongs to the Special Issue Advances on the Influence of Vegetation and Forest on Urban Air Quality and Thermal Comfort)
Abstract
:Indoor cooling is preferred during hot summers but unappreciated in cold winters. With this research, we aimed to clarify the cooling performances of roof greening throughout the year and identify the optimum roof greening coverage for the indoor thermal environment in Chenzhou, a city in China with hot summers and cold winters. The layout of buildings, building materials, and local climate data of Chenzhou were collected. The ENVI-met model was applied as the analytical tool after its accuracy was confirmed by a field experiment. The Kriging model was employed to interpret the annual effects of roof greening. The analytical results revealed that in Chenzhou, roof greening reduced indoor temperatures throughout the year, and the higher the coverage of roof greening, the greater the performance of indoor cooling. Moreover, hot climates enhanced the indoor cooling performances of roof greening. From the view of annual thermal perception, the increase in roof greening coverage reduced the duration of warm perceptions throughout the year and extended the perceptions of slightly warm, slightly cool, and cool. Generally, increased roof greening coverage improved the indoor thermal perception in Chenzhou throughout the year. The ENVI-met + Kriging model, an evaluation method of annual cycles, can be used to evaluate the annual performance of roof greening in terms of indoor thermal environment in other climate zones.
1. Introduction
The natural landscape has been superseded by hard facilities such as roads and buildings in the urbanization processes, causing urban heat islands (UHIs) in the built environment [1,2,3]. The UHI worsens thermal comfort, increases energy consumption, and poses threats to human health in cities [4,5]. Nowadays, architects and urban planners, professionals who are at the frontline of transforming our living environment, have different ways of approaching global warming [6]. Green infrastructures, including green roofs and vertical green walls, are commonly employed by planners to mitigate UHI [7,8,9,10]. A green roof is a building roof covered with vegetation and a growing medium [11,12], and has been adopted by many municipal agencies as an effective measure to mitigate UHIs. In Germany, the Landscaping and Landscape Development and Research Society (FLL) established the first guideline for green roof planning, called the “Guideline for the planning, Execution and Upkeep of Green-Roof Sites”, requiring newly planned buildings to implement roof greening to compensate for environmental ruin [13]. Since then, Canada, Japan, Singapore, and Hong Kong, China, have also promoted green roof planning though incentive or mandatory policies [14,15].
In addition to the promotion from the government, roof greening has also been widely explored by scholars all over the world. They have proved roof greening to be effective in cooling buildings and saving energy [16,17]. The cooling performance of roof greening has been extensively investigated. With regard to the influencing factors, the mode of roof greening [18], species of vegetation [19], leaf area index (LAI) [20], thickness of substrate [21], and water content [22] have been explored in detail in previous studies. Fewer investigations concentrate on the effects of its coverage. Except for the comparison by Morakinyo et al. that quantified the cooling demands of full-coverage roof greening, the semi coverage of roof greening, and the bare roof [18], there are no other studies that explore the impacts of roof greening coverage. Additionally, almost all the existing studies on roof greening focus on their influence on the outdoor thermal environment rather than the indoor environment [12,23,24].
For the hot summer and cold winter climate zone, the cooling effect in the summer is appreciated while undesirable in the winter. Almost all of the existing studies evaluate the cooling effects of roof greening from the view of typical summer days or winter days rather than the annual cycle [25,26,27]. Many investigations have been conducted in cold climate areas, including in the USA, Sweden, and Germany, and some others have been carried out in tropical cities, including Singapore and Hongkong, China [28,29]. However, few researchers consider the effects of roof greening in both summer and winter. Different from the cold or hot climate zones, the use of roof greening in the hot summer and cold winter climate zone must consider its performances in different seasons [30,31]. The conclusions drawn from the tropical cities or cold cities are not applicable to cities in the hot summer and cold winter climate zone.
This research aimed to clarify the thermal effects of roof greening on the indoor thermal environment throughout the year in Chenzhou, which is a city with typical hot summers and cold winters, with a resident population of approximately 870 thousand. We aimed to propose a method that can be widely used to evaluate the influence of roof greening on the indoor thermal environment in other climate zones. The method proposed is labelled “ENVI-met + Kriging”, where the ENVI-met model was employed to simulate indoor temperature [32] and the Kriging model was applied to visualize the annual distribution of indoor air temperature [33].
2. Materials and Methods
2.1. Analytical Scenarios
This study was conducted in Chenzhou, Hunan province, China. Chenzhou is located in the south of China’s hot summer and cold winter climate zone, receiving strong short-wave radiation [34]. In addition, Chenzhou is located at the northern foot of the Nanling Mountain of China, which blocks the cold air from the north in winter [35]. The unique geography endows Chenzhou with typical hot summers and cold winters, where roof greening is not always beneficial to the urban thermal environment in cold seasons.
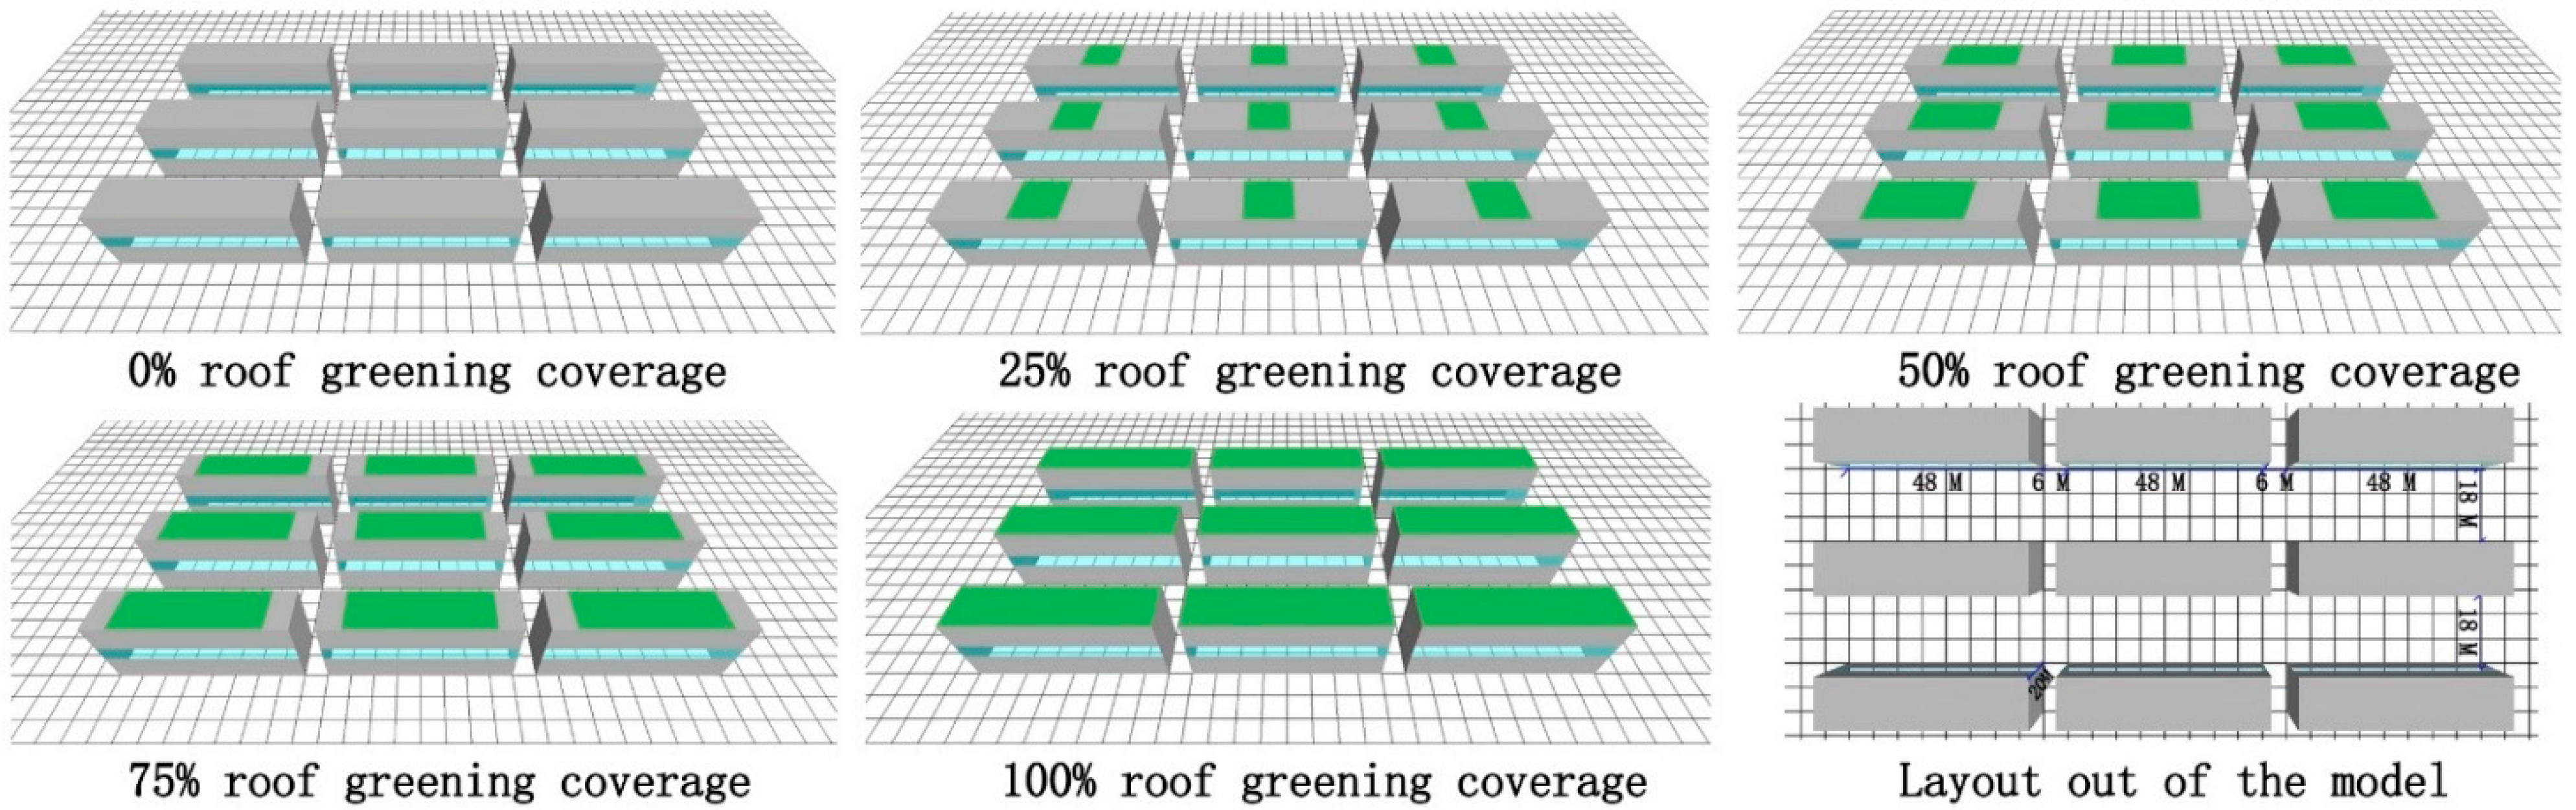
Five scenarios of roof greening were constructed with the roof greening coverage levels of 0%, 25%, 50%, 75%, and 100%, which are shown in Figure 1. The size of each model was 156 m long and 72 m wide and composed of 26 × 12 grids, with each grid being 6 × 6 m2. The height of each building was 20 m, the length was 48 m, and the width was 12 m. The east–west distance between buildings was 6 m, and the north–south distance was 18 m, which were set according to the urban management requirements of Chenzhou to ensure its fire rescue safety and building sunshine lighting [36].
The green roof consisted of a mixed substrate and Funkia (Hosta) plant. The total thickness of the substrate was 15 cm, including 10 cm of sandy loam and 5 cm of Styrofoam. The properties of the mixed substrate are shown in Table 1.

Table 1.
Properties of the mixed substrate in this research.
| Parameters | Value |
|---|---|
| Thickness (cm) | 15 |
| Emissivity of substrate | 0.95 |
| Albedo of substrate | 0.3 |
| Water coefficient of substrate for plant | 0.5 |
| Air gap between substrate and wall (m) | 0.01 |
The walls and roofs were made of concrete. The ratio of windows to walls on the north and south facades was 20%. Building materials and the window-to-wall ratio were set according to the actual situation of Chenzhou city. Clear float glass is commonly used in Chenzhou and it was employed as the glass in this simulation. The properties of the concrete and glass are shown in Table 3 [38,39].
2.2. Research Tools
Many simulation tools have been used to simulate indoor air temperatures, such as Ecotect [40], Trnsys [41,42], and Energy plus [43,44]. However, these tools are not computational fluid dynamics (CFD) models, and cannot simulate the shading effects of plants because these non-CFD models cannot simulate the translucency of leaves towards radiation [45]. Additionally, these non-CFD models cannot calculate the evaporative cooling in the leaves [45]. In this research, the ENVI-met model was used as the simulation tool as it can calculate the shading effect of plants, as well as the leaf temperature, taking into account the photosynthetic rate, water availability in the soil, and the ambient evapotranspiration [46]. Apart from simulating the thermal effects of plants, the ENVI-met model also can calculate the indoor air temperature. The indoor air temperature calculated by ENVI-met comes from the conversion of heat from the indoor surfaces and the energy transmitted through the window [47]. The indoor temperature is calculated by Equation (1) [48].
where represents the previous air temperature in zone i, V is the volume of zone i, and indicates the updated air temperature after the time dt. E is the number of façades forming zone i, and A(e) is applied to show the surface area of zone i. is the solar radiation transmitted into zone i though the façade e, and refers to the heat convection coefficient calculating the heat transfer between ambient air and the inner walls.
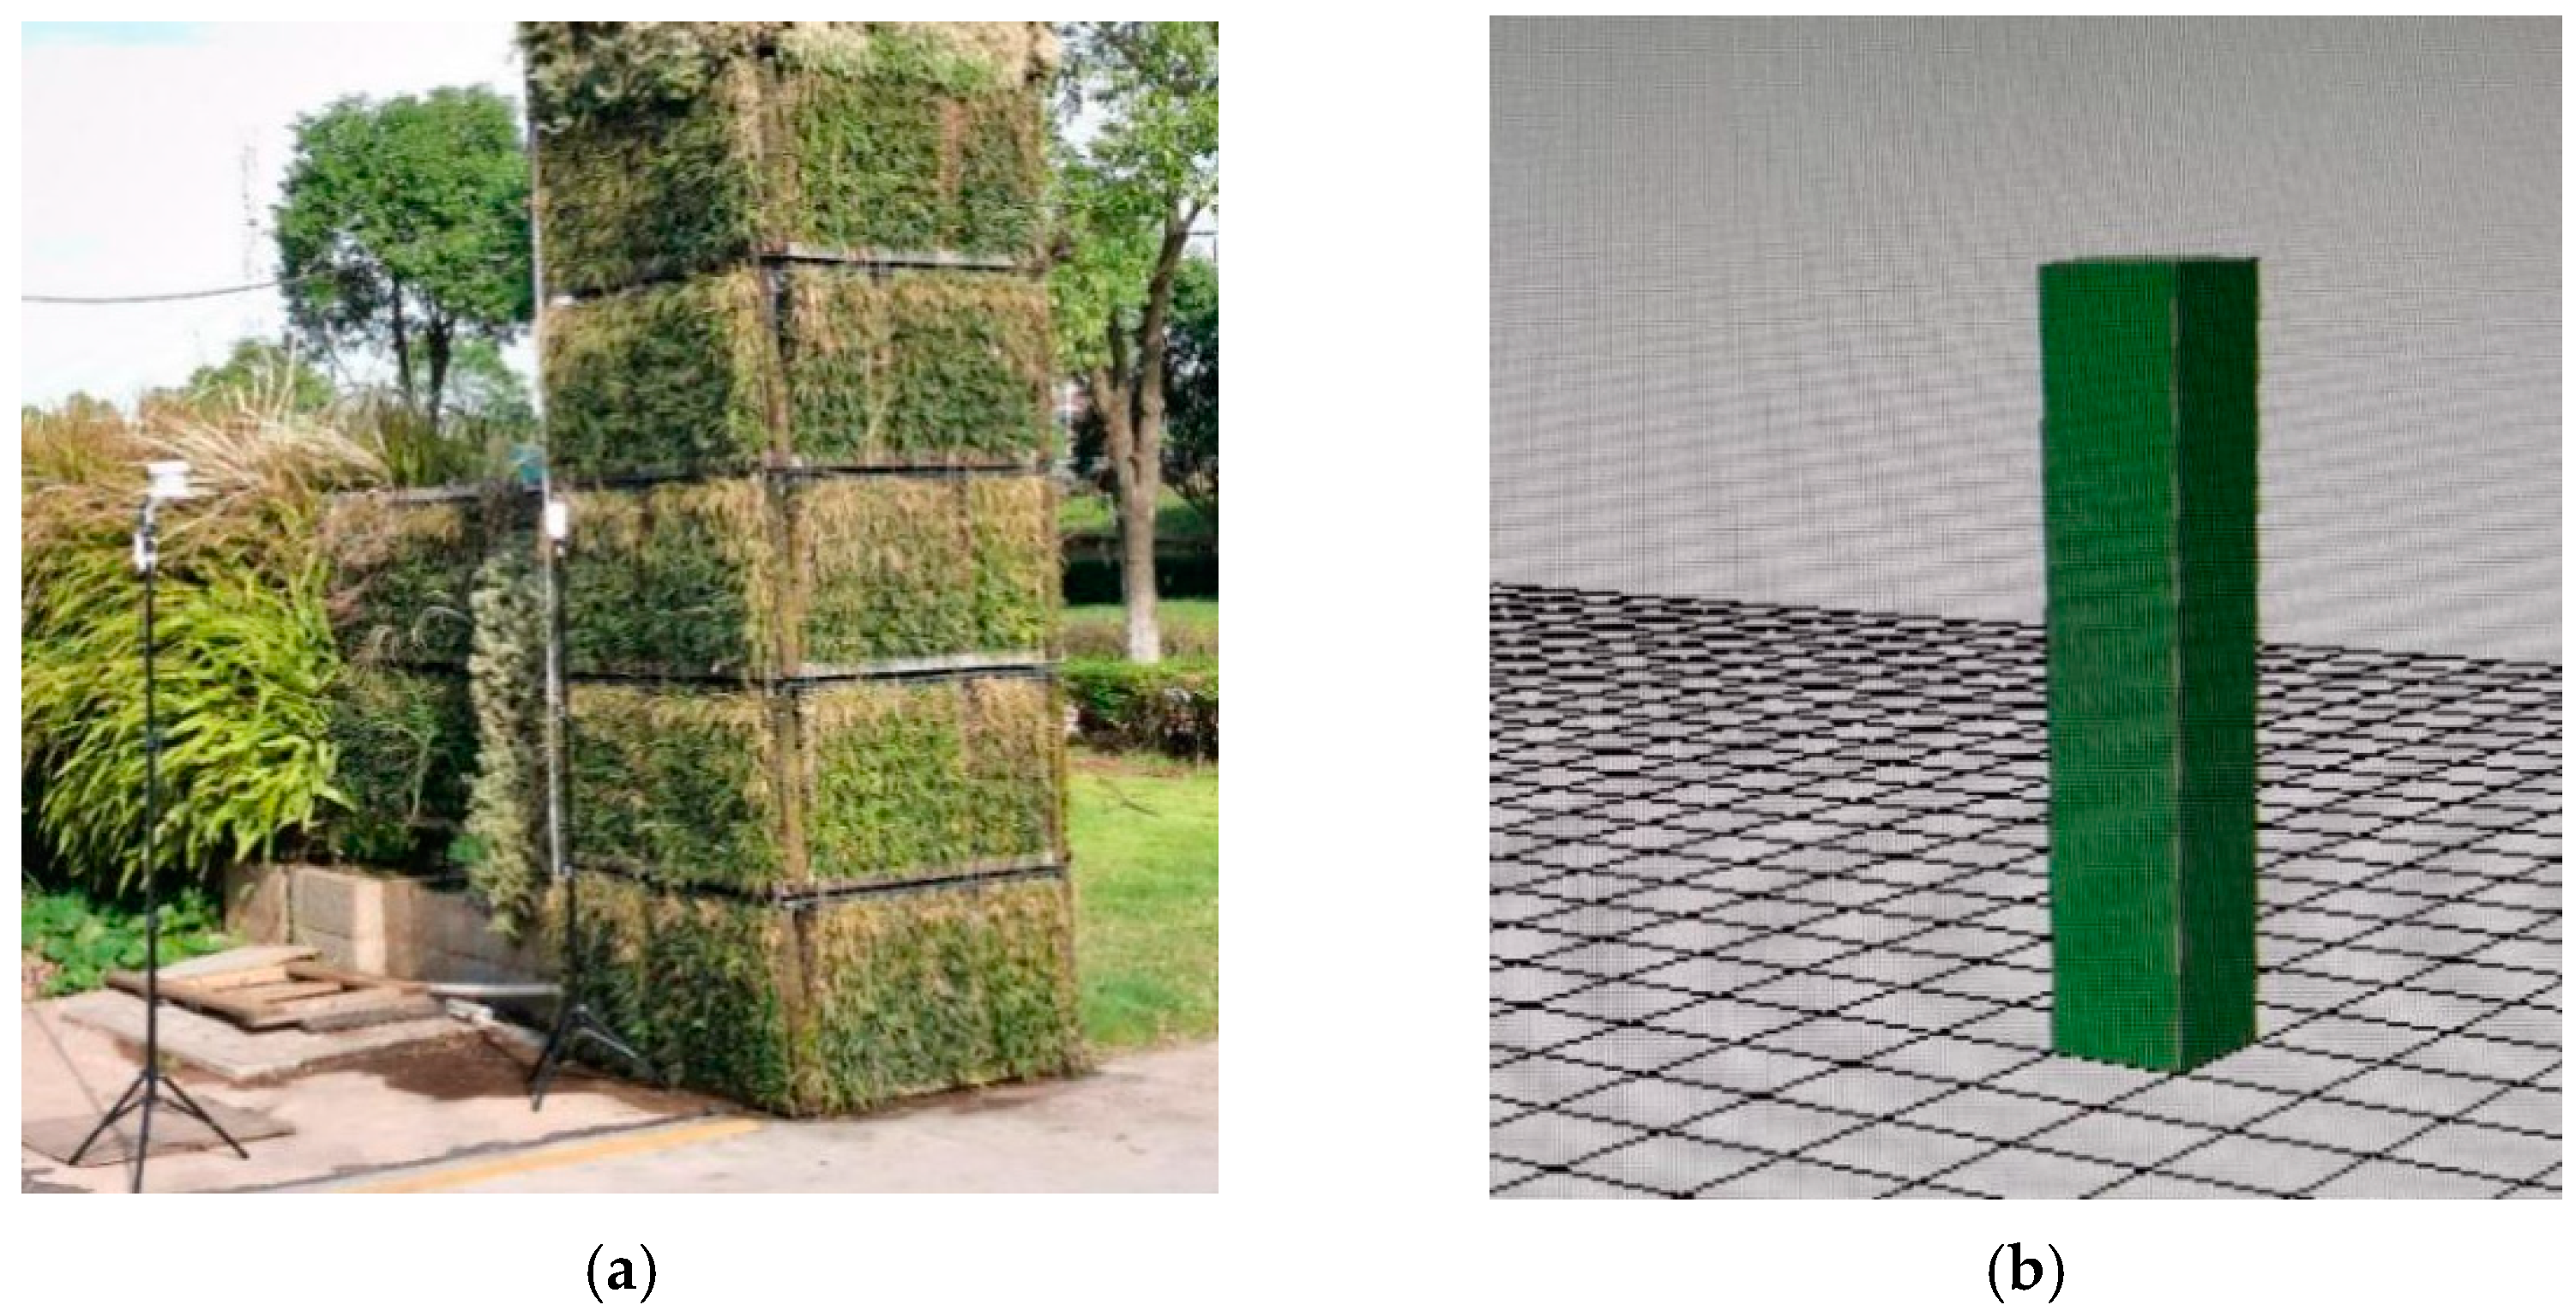
Some researchers have validated the accuracy of the ENVI-met model. We also conducted a survey in Hunan province to confirm the accuracy of the ENVI-met model in terms of the simulating plants. The field experiment was conducted in the east of Hunan (113.109° E, 28.235° N) from 10:00 on 22 August to 10:00 on 24 August with two HOBO Data Loggers (MX2302). During the 48 h, the indoor air temperatures—as well as the outdoor air temperature, relative humidity, and wind velocity—were recorded. The field experiment and the ENVI-met model of the experiment are displayed in Figure 2. One HOBO Data Logger recorded the outdoor weather conditions and the other measured the indoor air temperatures.
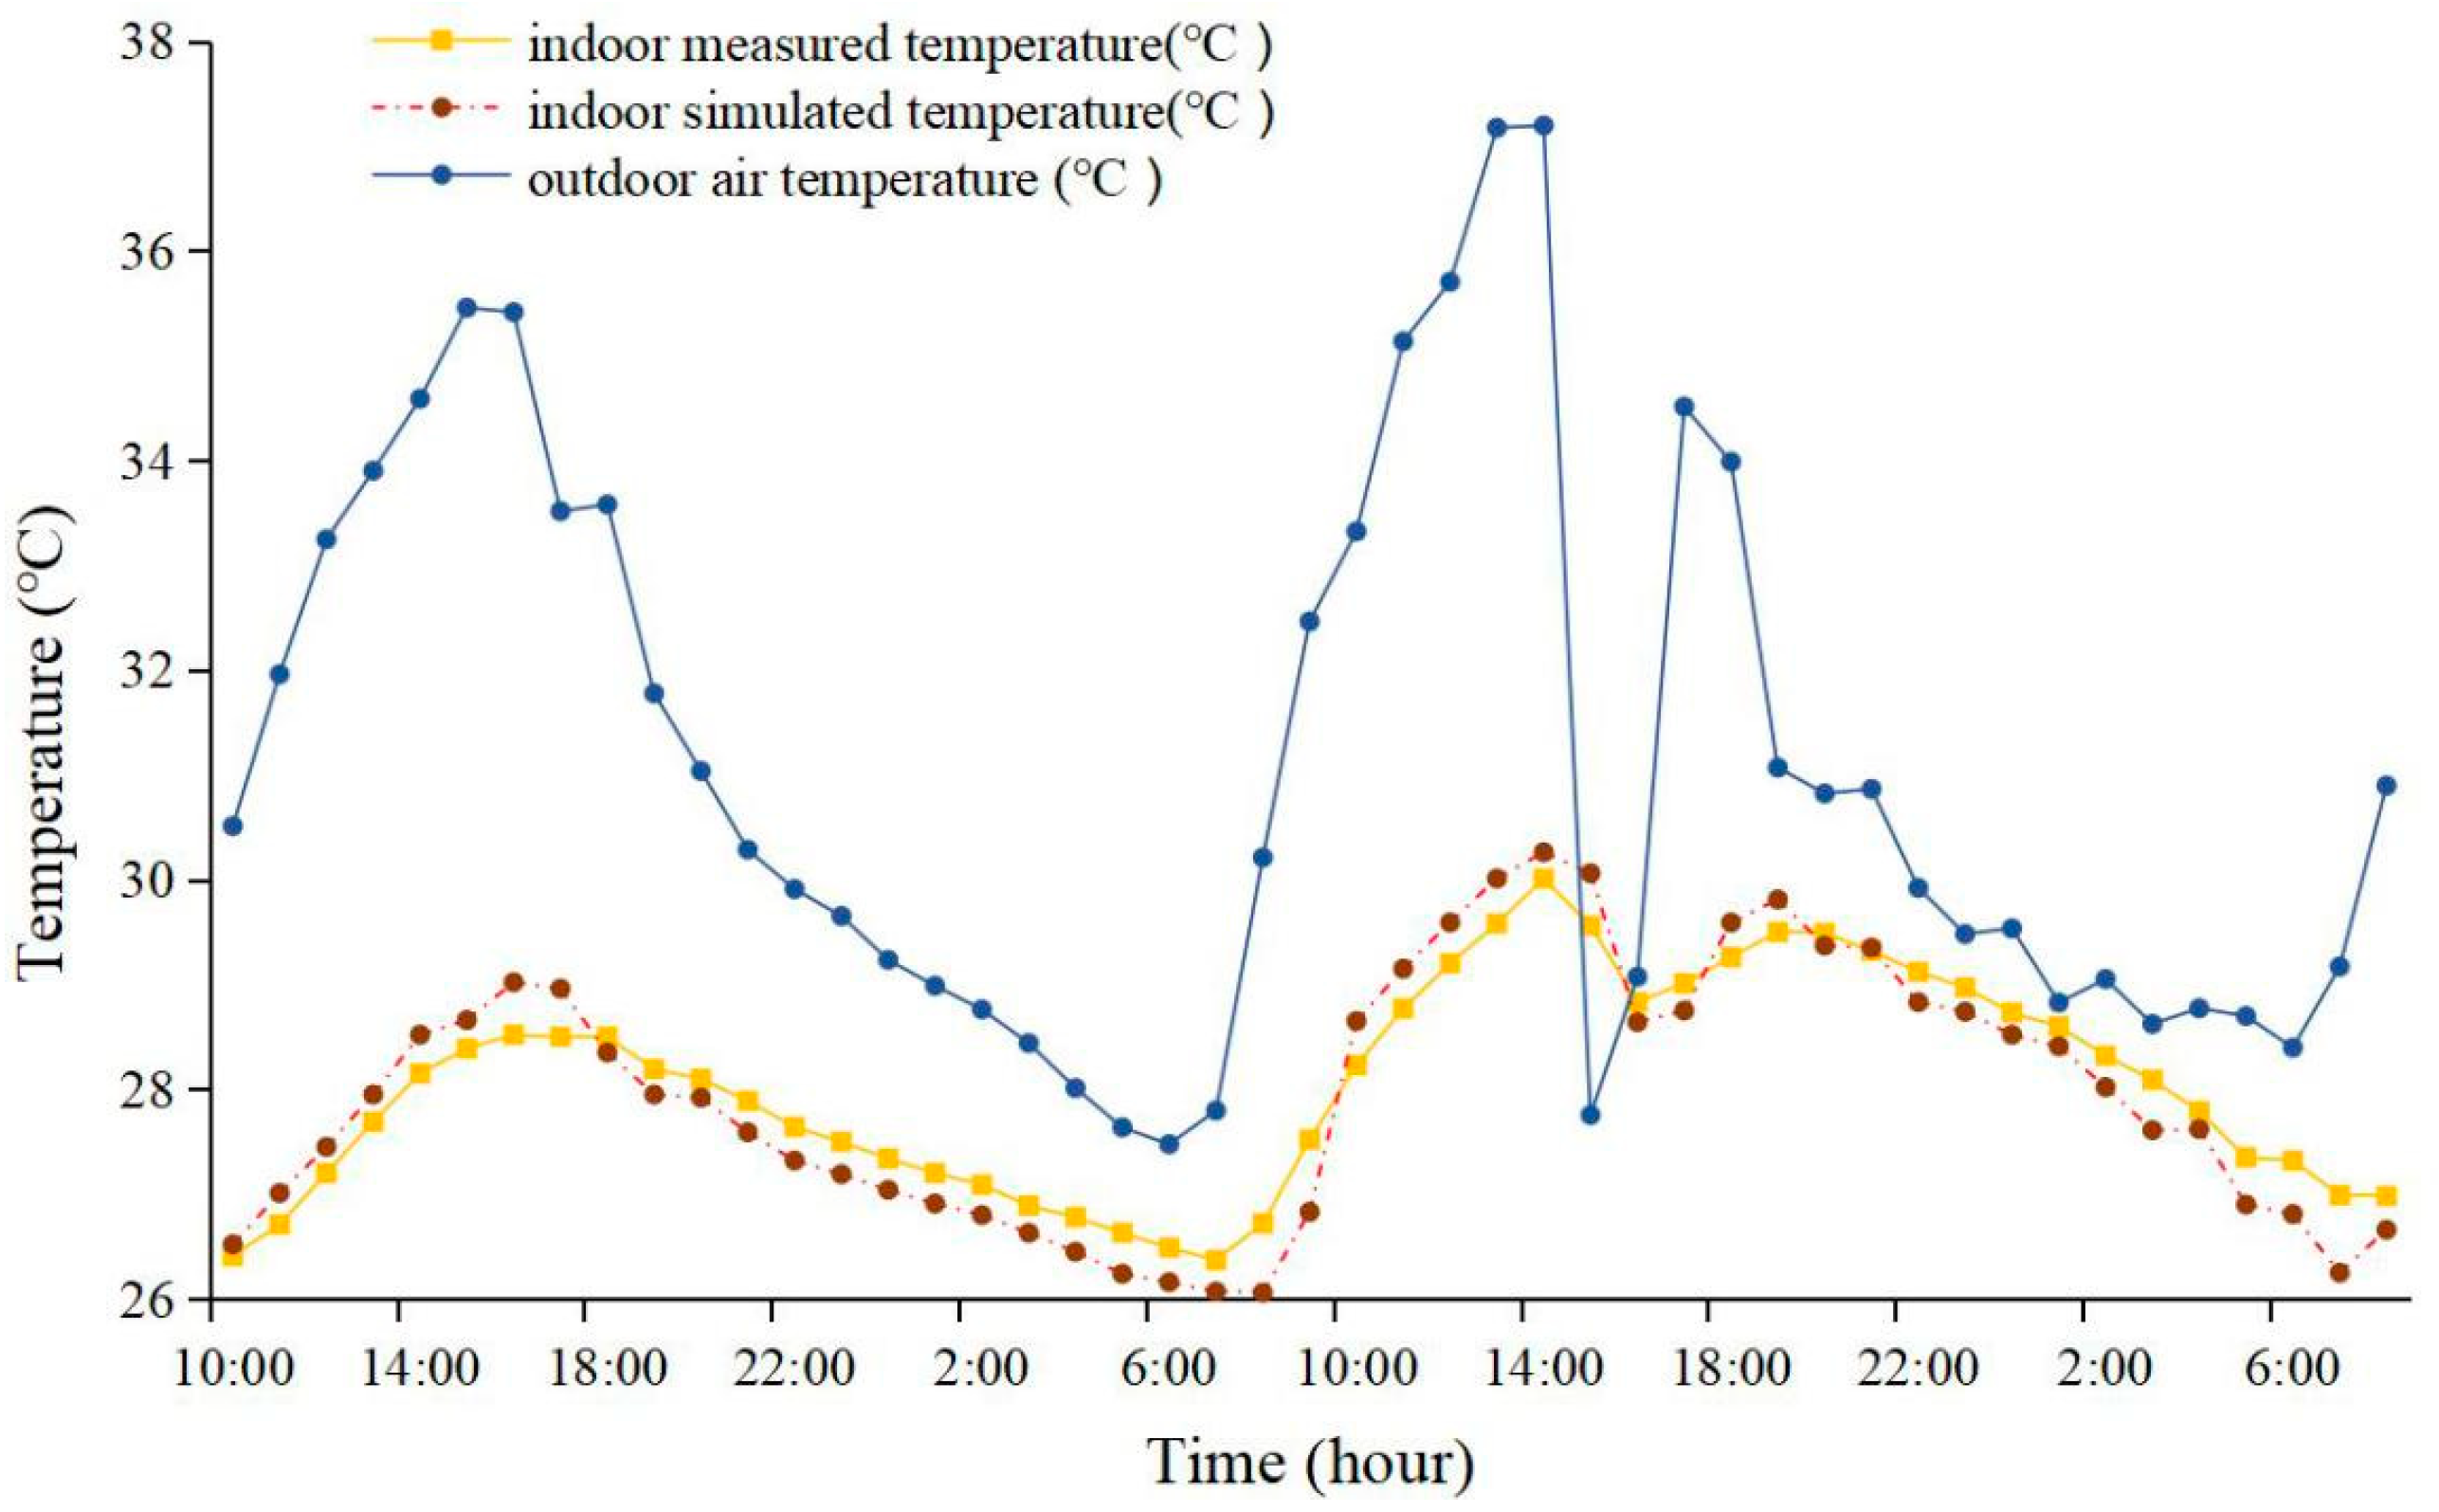
The outdoor air temperature recorded by the HOBO Data Logger is presented as the blue line in Figure 3. We simulated the indoor air temperatures with the recorded outdoor thermal index, and the simulated indoor air temperature is shown as the red line in Figure 3. The indoor air temperatures recorded by HOBO Data Logger are shown as the yellow line in Figure 3.
The red line and the yellow line had a similar trend. The Pearson coefficient of the measured data and the simulated data was 0.969 [49]. This field experiment improved confidence in the accuracy of the ENVI-met model in this study.
2.3. Data Resources
We collected meteorological data from 2007 to 2020 from the weather station of Chenzhou (https://tianqi.2345.com/wea_history/57972.htm; accessed on 11 April 2021). The average air temperature, wind velocity, and relative humidity of each month were calculated based on these data with an interval of one hour. These statistical results reflected the long-term and stable climate characteristics of Chenzhou, which were employed as the boundary conditions for the simulation. The boundary conditions for the simulation are shown in Table 4.
3. Results and Discussions
3.1. Cooling Effects of Roof Greening Coverage in Each Month
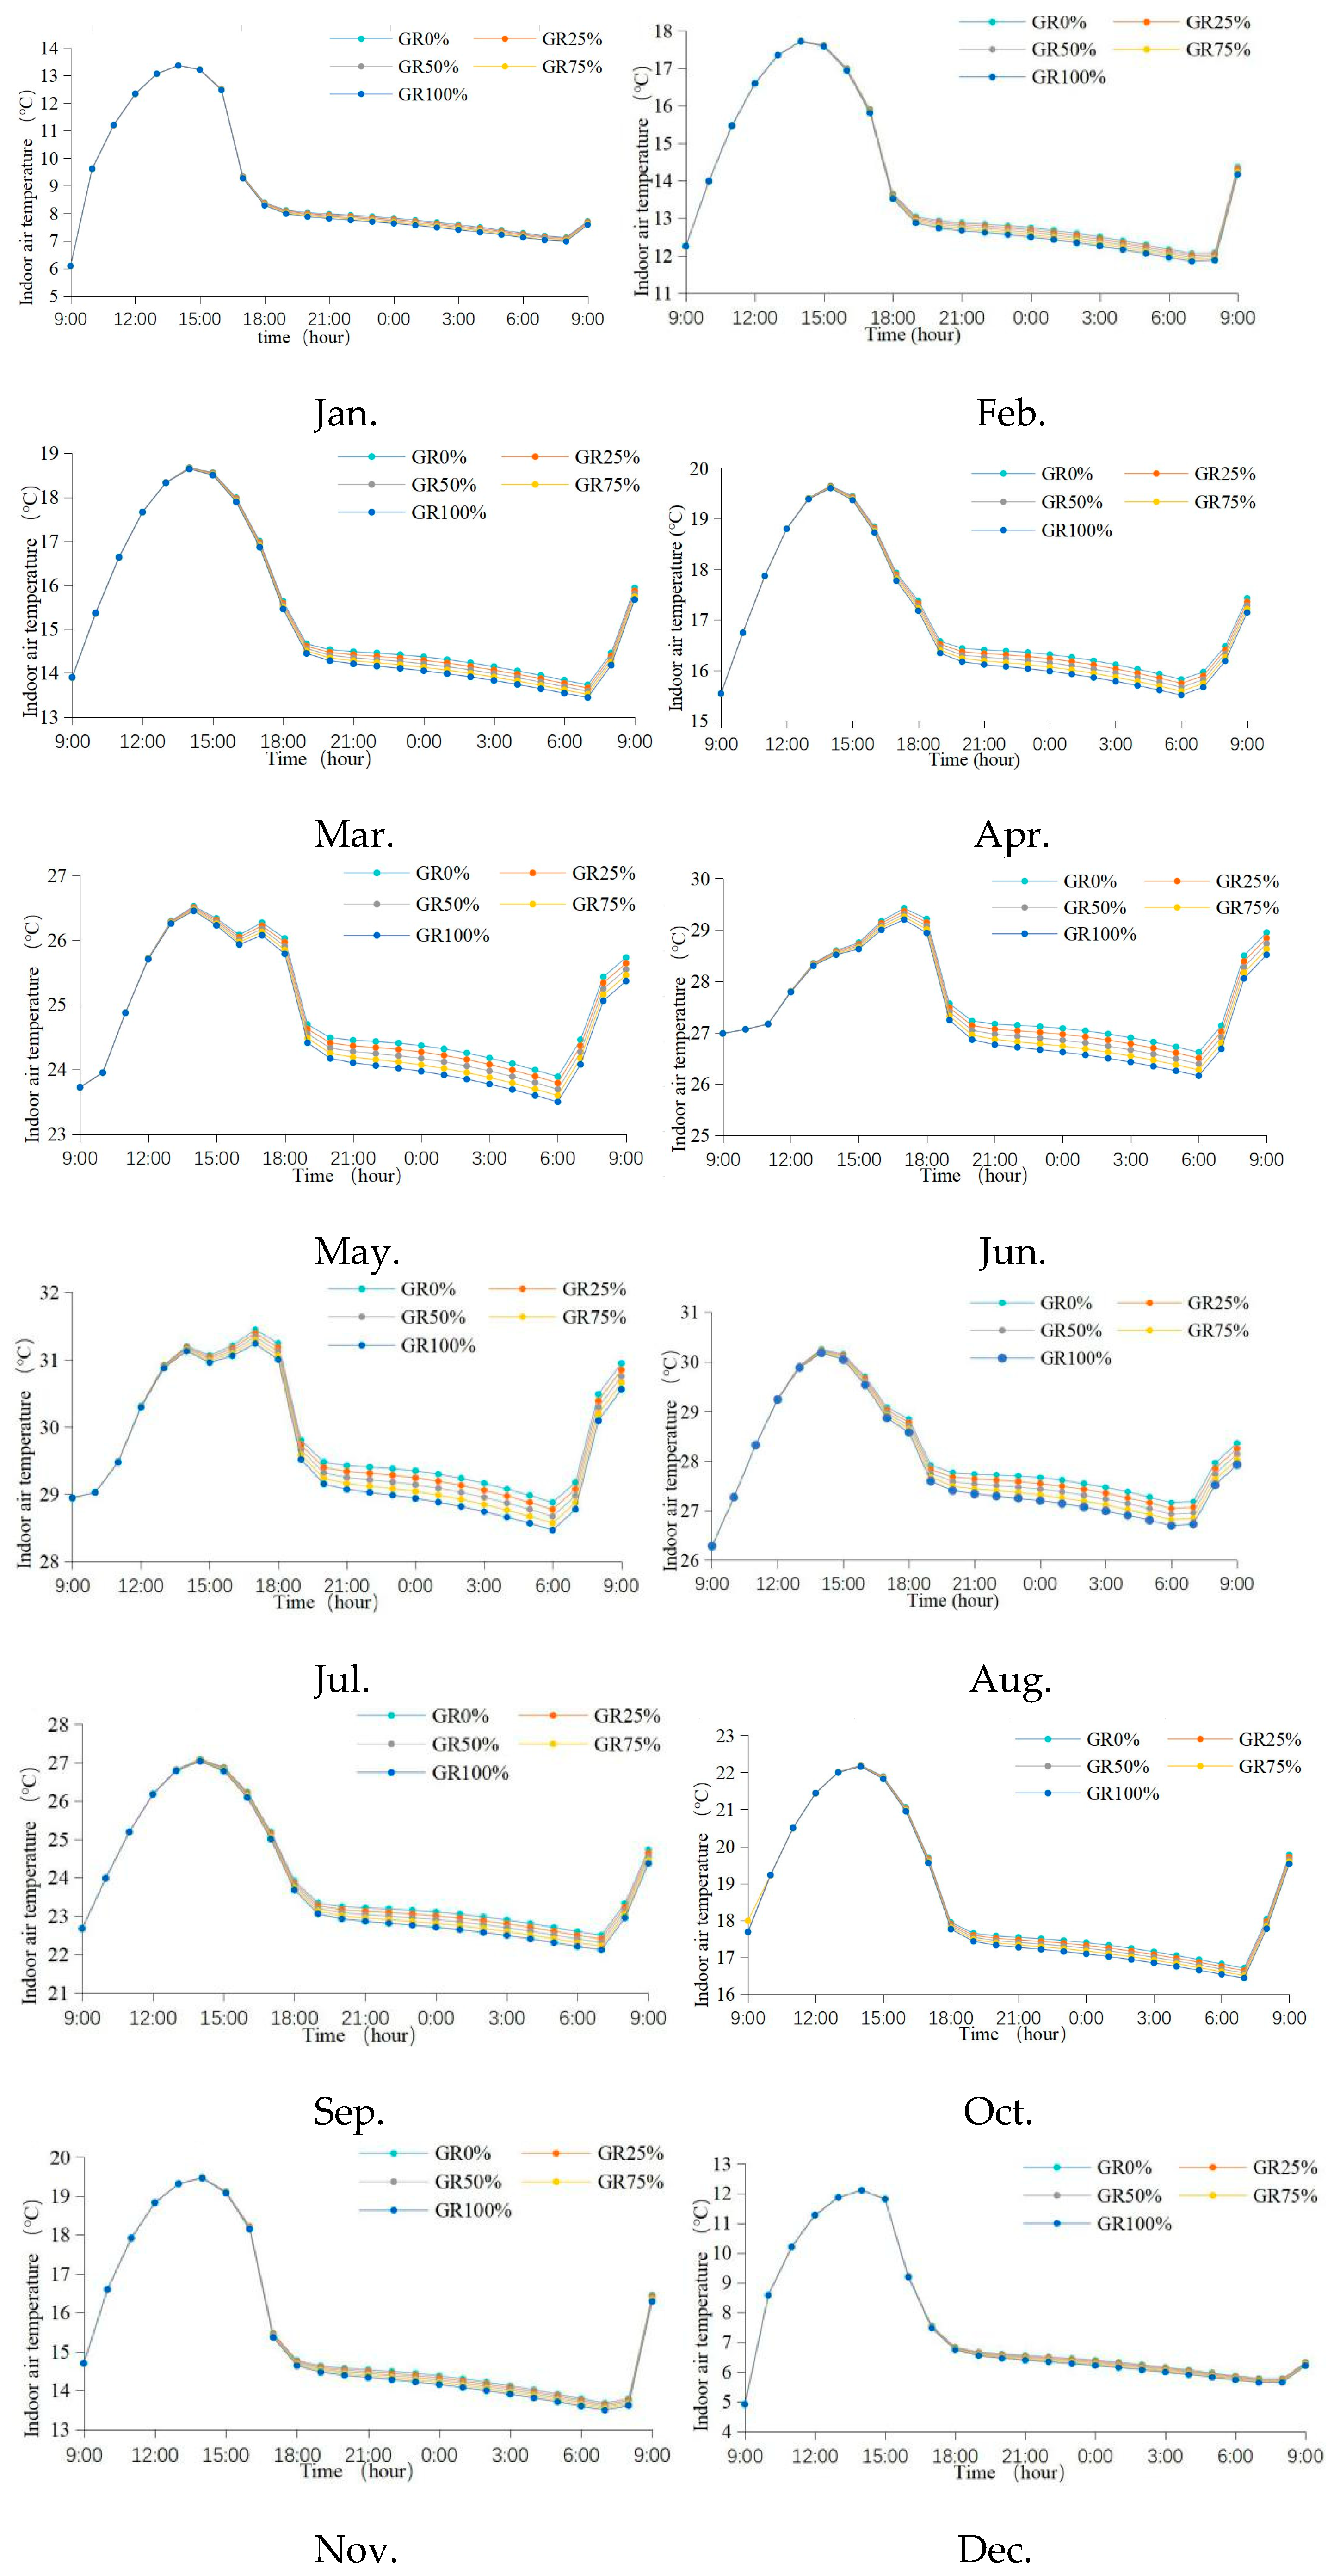
To better understand the effect of roof greening on the indoor temperature in different months, the variations in indoor air temperature of the five roof greening coverages were analyzed, which are displayed in Figure 4.
The analytical results revealed that in Chenzhou, roof greening can reduce indoor temperatures throughout the year. The indoor air temperatures of the 12 months had the same trend: the higher the roof greening coverage, the lower the indoor temperature. Many other studies also investigated the impact of greening systems on the indoor thermal environment, and proved that the indoor cooling caused by roof greening was determined by the “evapotranspiratory effect” of plants [50,51], the “shading effect” of plants [52,53], and the “thermal insulation” of the growing medium [54,55]. The other conditions, including the roof insulation and climate, also determined the performance of roof greening in terms of the indoor thermal environment [21]. On the contrary, another field experiment conducted by Xing et al. in Hunan with a room covered with greening showed an improved indoor air temperature in the winter [56]. The reason for the contradictory conclusion is that the building types were different. In Xing et al.’s research, the buildings were temporary buildings with a 2 mm thick steel sandwich structure. The thermal insulation of the sandwich structure with 2 mm thick steel plates was weaker than that of vertical greening. In our research, the buildings were constructed with 31 mm thick concrete walls that perform better than roof greening in terms of thermal insulation.
In addition, the analytical results revealed that the hot climate strengthened the indoor cooling of roof greening. The biggest cooling differences among the five roof greening coverages happened in August, the hottest month in Chenzhou. The biggest gap in indoor air temperatures between the rooms with the roof greening coverages of 0% and 100% was 0.48 °C. The smallest cooling differences among the five roof greening coverages occurred in December, when the maximum temperature difference was only 0.17 °C. Previous studies also pointed out the same conclusion that the cooling performance of roof greening is affected by the local climate [57]. In terms of the daily temperature, roof greening modified the indoor air temperature at night stronger than that during the day. The strongest modification of indoor air temperature caused by green roofs occurred at around 2:00 p.m.
3.2. Annual Distribution of Indoor Air Temperature Regulated by Roof Greening Coverage
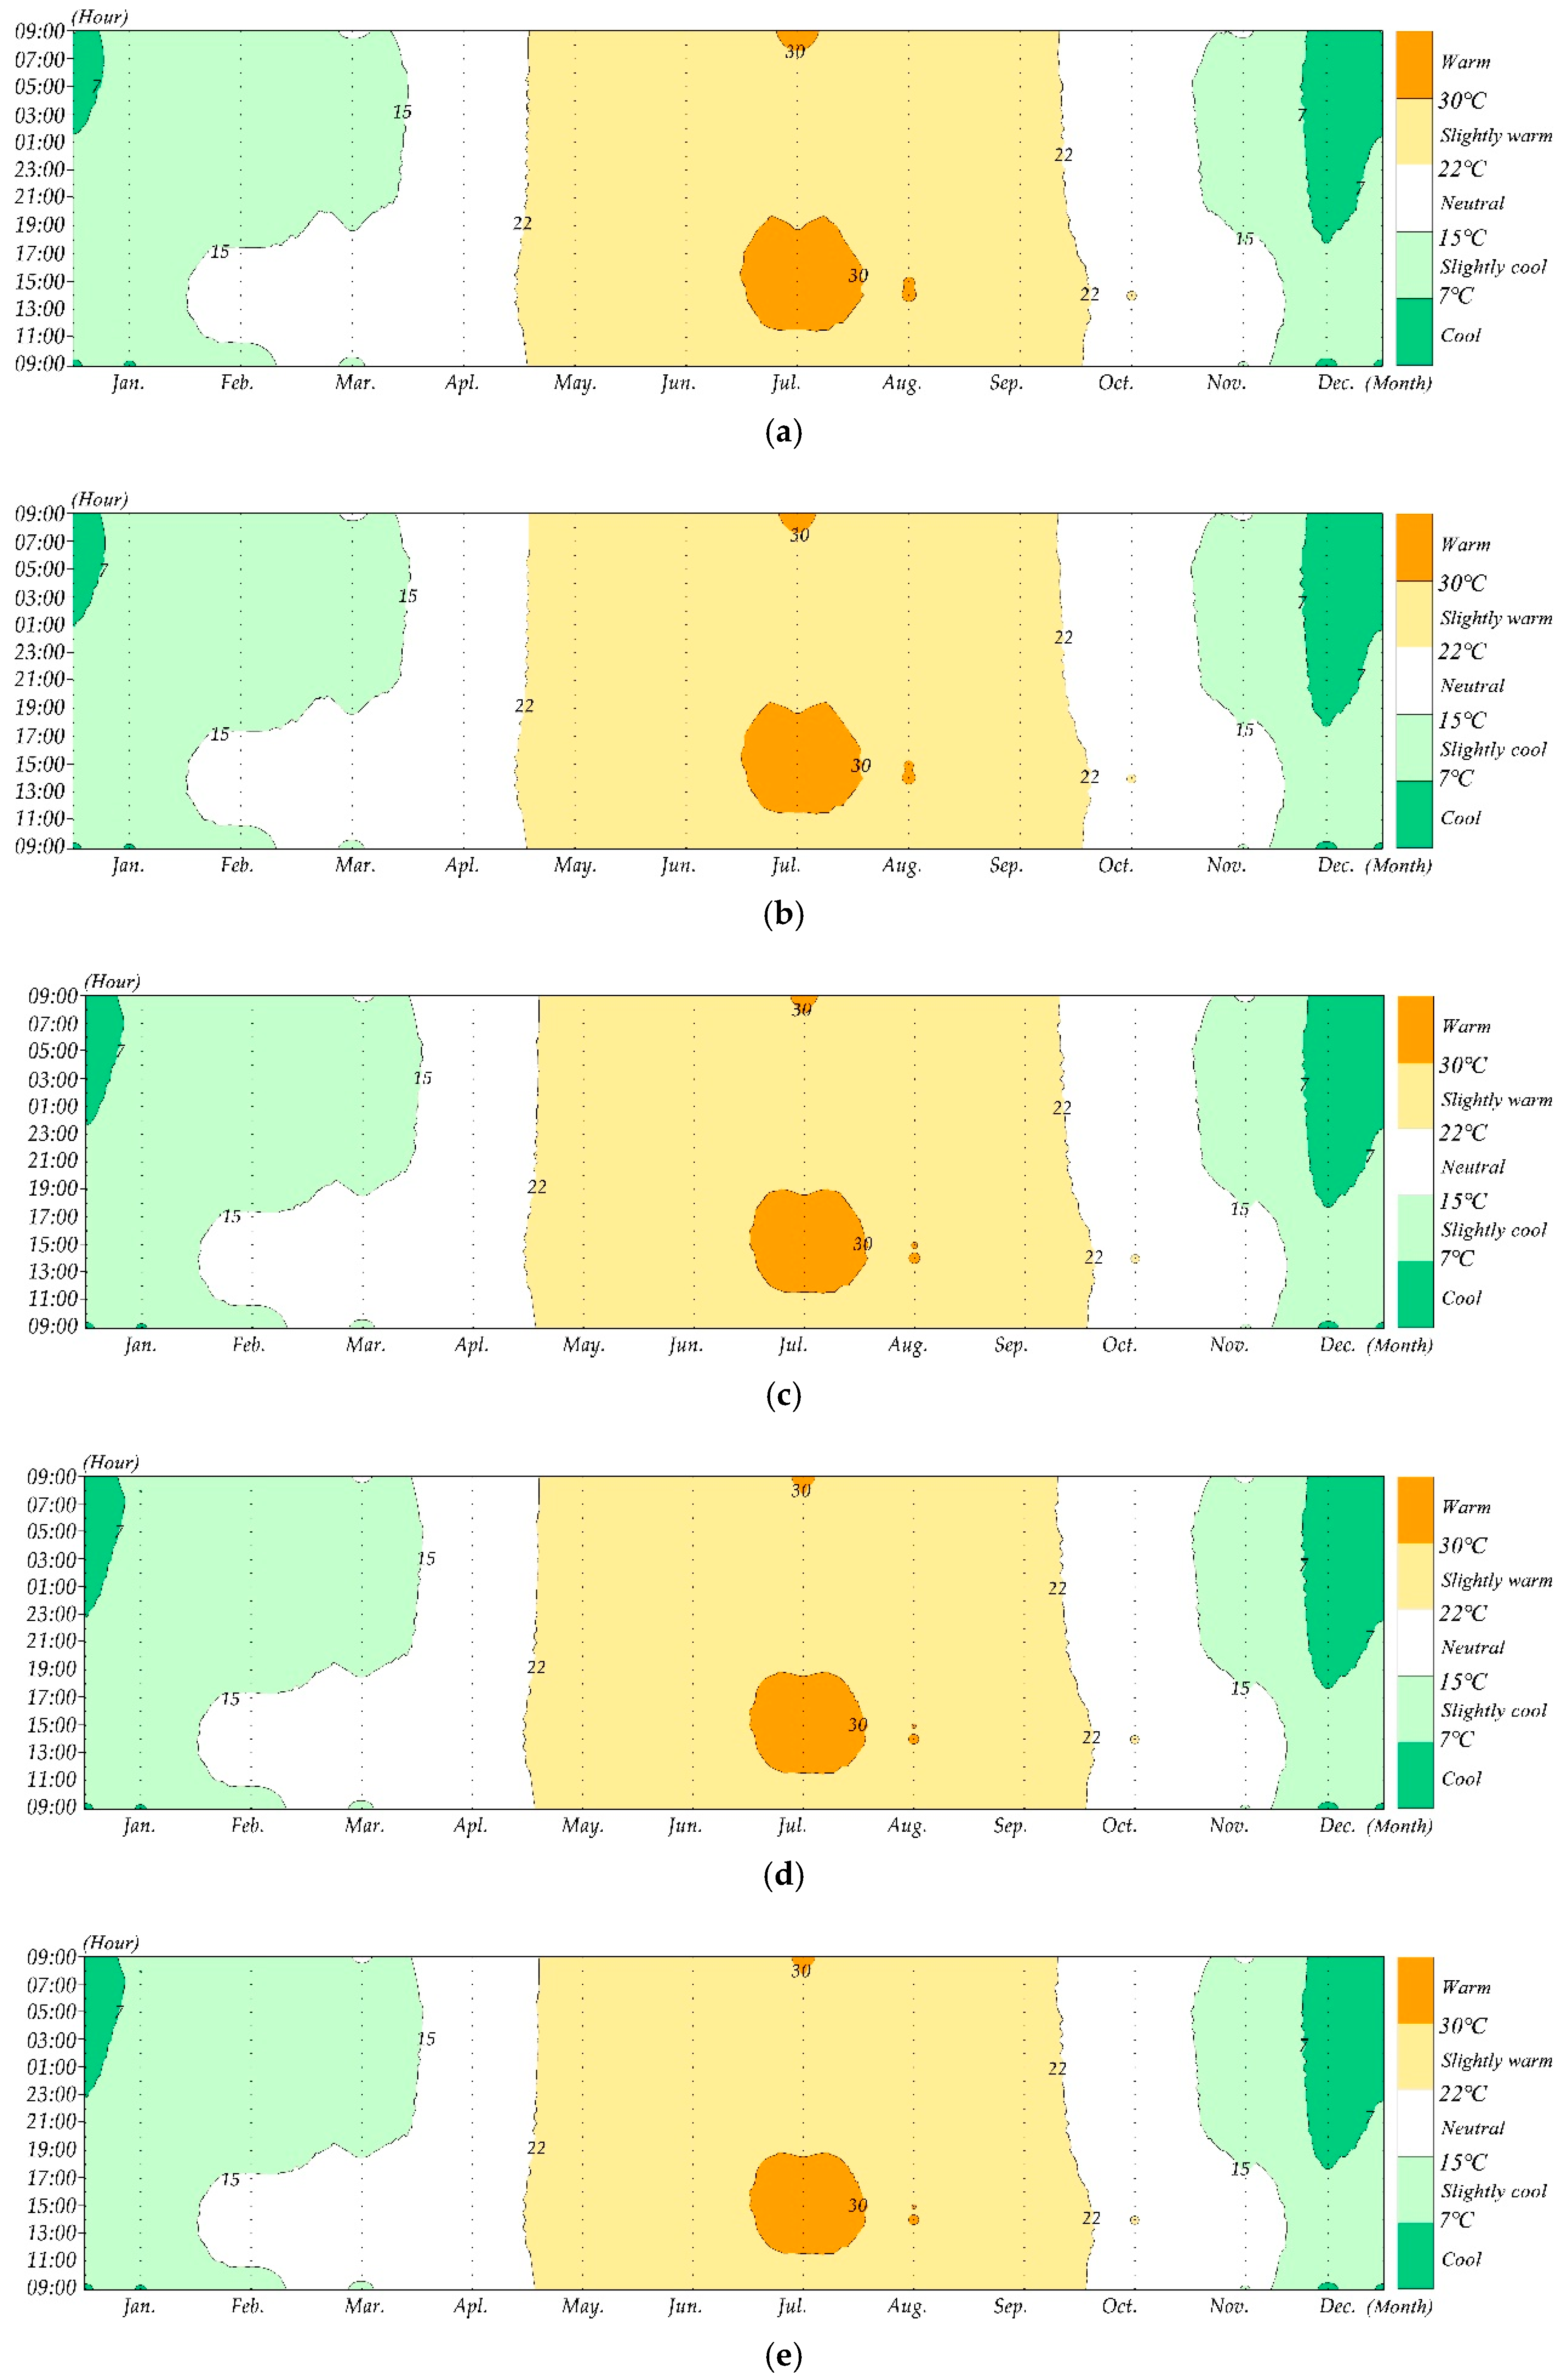
Although the statistical data and figures in the above section provide an understanding of the impacts of roof greening in different months, these data and figures hardly reflect their annual impacts on indoor air temperatures. The air cooling in summer benefits the indoor thermal perception while that in winter deteriorates the indoor thermal perception [32]. Therefore, a comprehensive evaluation throughout the year is necessary for a comprehensive understanding of the impact of roof greening on indoor air temperatures. The Kriging model has proved to be appropriate for temperature interpolation [58], and was used to translate the annual distribution of indoor air temperature caused by different roof greenings in this study [59]. Some researchers investigated the thermal sensation of citizens in Hunan, China. Yang et al. compared the human thermal sensation in Changsha, a city in Hunan province, with that of Singapore [60]. In addition, Liu et al. also investigated the thermal sensation of Changsha in summer and winter [61]. According to their research results, we employed the following standards to quantify the benefits of roof greening. The air temperatures between −1 °C and 7 °C are defined as cool, those between 7 °C and 15 °C are slightly cool, 15 °C to 22 °C are neutral, 22 °C to 30 °C are slightly warm, and 30 °C to 35 °C are warm. Because the indoor air temperatures in Chenzhou were higher than −1 °C and lower than 35 °C, the cold thermal sensation (<−1 °C) and hot thermal sensation (>35 °C) would not happen in the indoor environment. Therefore, the standard of the indoor thermal sensations in this research only contained five thermal conditions. The annual distributions of the indoor thermal sensations modified by the five roof greening coverages are shown in Figure 5. The sub-graphs of a, b, c, d, and e indicate the green roof coverages of 0%, 25%, 50%, 75%, and 100%, respectively.
Figure 5 shows that with the increase in roof greening coverage, the annual proportion of warm thermal sensations gradually decreased, and the proportion of cool sensations gradually increased. The hours of each thermal sensation in different roof greening coverages are presented in Table 5.
The analytical data revealed that the increase in roof greening coverage reduced the duration of warm perceptions throughout the year and extended the perceptions of slightly warm, slightly cool, and cool. The duration of neutral remained stable with the variations in roof greening coverage. Specifically, an additional 25% of roof greening may reduce the duration of warm perceptions by approximately 0.3%, equaling 28.5 h. An additional 25% of roof greening extended the duration of cool perceptions by about 0.2%, equaling 14.5 h. The durations of slightly warm perceptions and slightly cool perceptions only increased roughly 0.1% with an additional 25% of roof greening. The durations of neutral perceptions in the five scenarios varied from 2222.5 h to 2229.3 h, with gaps between them of less than 0.1%. Slightly warm, slightly cool, and neutral were acceptable thermal sensations, and these sensations increased with the rise in roof greening coverage. Therefore, increasing the coverage of roof greening benefited the annual indoor thermal perception in Chenzhou. From the perspective of indoor thermal perception, incentive policy towards roof greening is appropriate for Chenzhou. However, compared with the efficiency of roof greening in tropical cities such as Hong Kong, China, the annual improvement in indoor thermal comfort is relatively small [62]. Therefore, for Chenzhou, incentive measures are more appropriate for the promotion of roof greening, rather than mandatory measures.
This study clarified the annual impact of roof greening on indoor thermal perceptions in Chenzhou. However, unlike countries with a single climate zone, such as Singapore, China has multiple climate zones, posing a challenge to the standard of national guidelines for roof greening. For example, is roof greening beneficial to the year-round thermal environment of buildings in mild climate areas? This is a core issue that urban planners should consider in roof greening planning.
4. Conclusions
This research evaluated the impacts of roof greening based on an annual cycle rather than a typical summer day, which is a more suitable method for climate zones with hot summers and cold winters. Moreover, instead of the outdoor microclimate, we focused on the impact of roof greening on the indoor thermal environment, which is a problem that planners have neglected for a long time. The analytical results revealed that, in Chenzhou, roof greening reduced indoor temperatures throughout the year, and the higher the coverage of a green roof, the greater the performance of indoor cooling. Furthermore, the hot climate strengthened the indoor cooling effects of roof greening. From the view of annual thermal perception, increased roof greening coverage reduced the duration of warm perceptions and extended the perceptions of slightly warm, slightly cool, and cool throughout the year. Generally, increasing the coverage of roof greening benefited the annual indoor thermal perception in Chenzhou. The ENVI-met + Kriging model, an evaluation method of annual cycles, can be used to evaluate the annual impact of roof greening on indoor thermal environments in other climate conditions, such as in warm climate zones. In future research, we will use this method to study the annual performance of roof greening in terms of the indoor thermal environment in other climatic regions in China, which is essential to establish the national incentive policy for the development of roof greening.
Author Contributions
Conceptualization, J.L. and B.Z.; Methodology, J.L.; Software, X.C.; Validation, X.C. and X.L.; Formal analysis, B.Z.; Investigation, J.L.; Resources, J.L.; Data curation, X.L.; Writing—original draft preparation, B.Z.; Writing—review and editing, J.L.; Visualization, X.C.; Supervision, B.Z.; Project administration, J.L.; Funding acquisition, X.C. All authors have read and agreed to the published version of the manuscript.
Funding
This research was funded by Hunan Provincial Philosophy and Social Science Planning Fund Office, grant no. XSP20ZDI020; the China Scholarship Council, grant no. 202006370126; Hunan Provincial Natural Science Foundation, grant number 2021JJ40257.
Institutional Review Board Statement
Not applicable.
Data Availability Statement
The data is available on request from the corresponding author.
Acknowledgments
Thanks are given to Hunan Shangjia Green Company for the help in the field experiment.
Conflicts of Interest
The authors declare no conflict of interest.
References
- Singh, P.; Kikon, N.; Verma, P. Impact of land use change and urbanization on urban heat island in Lucknow city, Central India. A remote sensing based estimate. Sustain. Cities Soc. 2017, 32, 100–114. [Google Scholar] [CrossRef]
- Mohajerani, A.; Bakaric, J.; Jeffrey-Bailey, T. The urban heat island effect, its causes, and mitigation, with reference to the thermal properties of asphalt concrete. J. Environ. Manag. 2017, 197, 522–538. [Google Scholar] [CrossRef] [PubMed]
- Peng, J.; Liu, Q.; Xu, Z.; Lyu, D.; Du, Y.; Qiao, R.; Wu, J. How to effectively mitigate urban heat island effect? A perspective of waterbody patch size threshold. Landsc. Urban Plan. 2020, 202, 103873. [Google Scholar] [CrossRef]
- Aghamohammadi, N.; Fong, C.S.; Idrus, M.H.M.; Ramakreshnan, L.; Haque, U. Outdoor thermal comfort and somatic symptoms among students in a tropical city. Sustain. Cities Soc. 2021, 72, 103015. [Google Scholar] [CrossRef]
- Sanusi, R.; Bidin, S. Re-naturing Cities: Impact of Microclimate, Human Thermal Comfort and Recreational Participation. In Climate Change, Hazards and Adaptation Options; Springer: Berlin/Heidelberg, Germany, 2020; pp. 545–562. [Google Scholar]
- Thornbush, M.; Golubchikov, O.; Bouzarovski, S. Sustainable cities targeted by combined mitigation–adaptation efforts for future-proofing. Sustain. Cities Soc. 2013, 9, 1–9. [Google Scholar] [CrossRef]
- Herath, H.; Halwatura, R.; Jayasinghe, G. Evaluation of green infrastructure effects on tropical Sri Lankan urban context as an urban heat island adaptation strategy. Urban For. Urban Green. 2018, 29, 212–222. [Google Scholar] [CrossRef]
- Liberalesso, T.; Cruz, C.O.; Silva, C.M.; Manso, M. Green infrastructure and public policies: An international review of green roofs and green walls incentives. Land Use Policy 2020, 96, 104693. [Google Scholar] [CrossRef]
- Liao, J.; Tan, X.; Li, J. Evaluating the vertical cooling performances of urban vegetation scenarios in a residential environment. J. Build. Eng. 2021, 39, 102313. [Google Scholar] [CrossRef]
- Li, J.; Zheng, B.; Shen, W.; Xiang, Y.; Chen, X.; Qi, Z. Cooling and energy-saving performance of different green wall design: A simulation study of a block. Energies 2019, 12, 2912. [Google Scholar] [CrossRef] [Green Version]
- Zhang, G.; He, B.-J.; Dewancker, B.J. The maintenance of prefabricated green roofs for preserving cooling performance: A field measurement in the subtropical city of Hangzhou, China. Sustain. Cities Soc. 2020, 61, 102314. [Google Scholar] [CrossRef]
- Williams, N.S.; Bathgate, R.S.; Farrell, C.; Lee, K.E.; Szota, C.; Bush, J.; Johnson, K.A.; Miller, R.E.; Pianella, A.; Sargent, L.D. Ten years of greening a wide brown land: A synthesis of Australian green roof research and roadmap forward. Urban For. Urban Green. 2021, 127179. [Google Scholar] [CrossRef]
- Dvorak, B.; Volder, A. Green roof vegetation for North American ecoregions: A literature review. Landsc. Urban Plan. 2010, 96, 197–213. [Google Scholar] [CrossRef]
- Dong, J.; Zuo, J.; Luo, J. Development of a management framework for applying green roof policy in urban China: A preliminary study. Sustainability 2020, 12, 10364. [Google Scholar] [CrossRef]
- Chen, X.; Shuai, C.; Chen, Z.; Zhang, Y. What are the root causes hindering the implementation of green roofs in urban China? Sci. Total Environ. 2019, 654, 742–750. [Google Scholar] [CrossRef]
- He, Y.; Yu, H.; Ozaki, A.; Dong, N. Thermal and energy performance of green roof and cool roof: A comparison study in Shanghai area. J. Clean. Prod. 2020, 267, 122205. [Google Scholar] [CrossRef]
- Bellazzi, A.; Barozzi, B.; Pollastro, M.; Meroni, I. Thermal resistance of growing media for green roofs: To what extent does the absence of specific reference values potentially affect the global thermal resistance of the green roof? An experimental example. J. Build. Eng. 2020, 28, 101076. [Google Scholar] [CrossRef]
- Morakinyo, T.E.; Dahanayake, K.K.C.; Ng, E.; Chow, C.L. Temperature and cooling demand reduction by green-roof types in different climates and urban densities: A co-simulation parametric study. Energy Build. 2017, 145, 226–237. [Google Scholar] [CrossRef]
- Cao, J.; Hu, S.; Dong, Q.; Liu, L.; Wang, Z. Green roof cooling contributed by plant species with different photosynthetic strategies. Energy Build. 2019, 195, 45–50. [Google Scholar] [CrossRef]
- Monteiro, M.V.; Blanuša, T.; Verhoef, A.; Richardson, M.; Hadley, P.; Cameron, R. Functional green roofs: Importance of plant choice in maximising summertime environmental cooling and substrate insulation potential. Energy Build. 2017, 141, 56–68. [Google Scholar] [CrossRef]
- Raji, B.; Tenpierik, M.J.; van den Dobbelsteen, A. The impact of greening systems on building energy performance: A literature review. Renew. Sustain. Energy Rev. 2015, 45, 610–623. [Google Scholar] [CrossRef] [Green Version]
- Wolf, D.; Lundholm, J.T. Water uptake in green roof microcosms: Effects of plant species and water availability. Ecol. Eng. 2008, 33, 179–186. [Google Scholar] [CrossRef]
- Knaus, M.; Haase, D. Green roof effects on daytime heat in a prefabricated residential neighbourhood in Berlin, Germany. Urban For. Urban Green. 2020, 53, 126738. [Google Scholar] [CrossRef]
- Zheng, X.; Kong, F.; Yin, H.; Middel, A.; Liu, H.; Wang, D.; Sun, T.; Lensky, I. Outdoor thermal performance of green roofs across multiple time scales: A case study in subtropical China. Sustain. Cities Soc. 2021, 70, 102909. [Google Scholar] [CrossRef]
- Yin, H.; Kong, F.; Dronova, I.; Middel, A.; James, P. Investigation of extensive green roof outdoor spatio-temporal thermal performance during summer in a subtropical monsoon climate. Sci. Total Environ. 2019, 696, 133976. [Google Scholar] [CrossRef]
- Peng, L.L.; Jiang, Z.; Yang, X.; He, Y.; Xu, T.; Chen, S.S. Cooling effects of block-scale facade greening and their relationship with urban form. Build. Environ. 2020, 169, 106552. [Google Scholar] [CrossRef]
- Hoffmann, K.A.; Šuklje, T.; Kozamernik, J.; Nehls, T. Modelling the cooling energy saving potential of facade greening in summer for a set of building typologies in mid-latitudes. Energy Build. 2021, 238, 110816. [Google Scholar] [CrossRef]
- Blank, L.; Vasl, A.; Levy, S.; Grant, G.; Kadas, G.; Dafni, A.; Blaustein, L. Directions in green roof research: A bibliometric study. Build. Environ. 2013, 66, 23–28. [Google Scholar] [CrossRef]
- Shafique, M.; Kim, R.; Rafiq, M. Green roof benefits, opportunities and challenges—A review. Renew. Sustain. Energy Rev. 2018, 90, 757–773. [Google Scholar] [CrossRef]
- Chun, B.; Guldmann, J.-M. Impact of greening on the urban heat island: Seasonal variations and mitigation strategies. Comput. Environ. Urban Syst. 2018, 71, 165–176. [Google Scholar] [CrossRef]
- Peng, L.L.; Jim, C.Y. Seasonal and diurnal thermal performance of a subtropical extensive green roof: The impacts of background weather parameters. Sustainability 2015, 7, 11098–11113. [Google Scholar] [CrossRef] [Green Version]
- Li, J.; Zheng, B.; Chen, X.; Qi, Z.; Bedra, K.B.; Zheng, J.; Li, Z.; Liu, L. Study on a full-year improvement of indoor thermal comfort by different vertical greening patterns. J. Build. Eng. 2021, 35, 101969. [Google Scholar] [CrossRef]
- Wang, M.; He, G.; Zhang, Z.; Wang, G.; Zhang, Z.; Cao, X.; Wu, Z.; Liu, X. Comparison of spatial interpolation and regression analysis models for an estimation of monthly near surface air temperature in China. Remote Sens. 2017, 9, 1278. [Google Scholar] [CrossRef] [Green Version]
- Li, J.; Zheng, B.; Chen, X.; Zhou, Y.; Rao, J.; Bedra, K.B. Research on Annual Thermal Environment of Non-Hvac Building Regulated by Window-to-Wall Ratio in a Chinese City (Chenzhou). Sustainability 2020, 12, 6637. [Google Scholar] [CrossRef]
- Wang, Y.; Shen, J.; Wang, H.; Wu, G.; Chen, Y.; Liu, T.; Gong, D.; Ou, J.; Shi, Y.; Zhang, T. Unexpected seasonal variations and high levels of ozone observed at the summit of Nanling Mountains: Impact of Asian monsoon on southern China. Atmos. Environ. 2021, 253, 118378. [Google Scholar] [CrossRef]
- Peng, H.; He, M.; Li, M.; Huang, Y.; Wen, L. Investigation on spatial distributions and occupant schedules of typical residential districts in South China’s Pearl River Delta. Energy Build. 2020, 209, 109710. [Google Scholar] [CrossRef]
- Zhu, Z.; Zhou, D.; Wang, Y.; Ma, D.; Meng, X. Assessment of urban surface and canopy cooling strategies in high-rise residential communities. J. Clean. Prod. 2021, 288, 125599. [Google Scholar] [CrossRef]
- Ivanov, A.; Bezlyudnaya, V.; Kondrashov, V. Methods for improving optical parameters of float glass (a review). Glass Ceram. 2002, 59, 293–295. [Google Scholar] [CrossRef]
- Asadi, I.; Shafigh, P.; Hassan, Z.F.B.A.; Mahyuddin, N.B. Thermal conductivity of concrete—A review. J. Build. Eng. 2018, 20, 81–93. [Google Scholar] [CrossRef]
- Yang, L.; He, B.-J.; Ye, M. Application research of ECOTECT in residential estate planning. Energy Build. 2014, 72, 195–202. [Google Scholar] [CrossRef]
- Ahamed, M.S.; Guo, H.; Tanino, K. Modeling heating demands in a Chinese-style solar greenhouse using the transient building energy simulation model TRNSYS. J. Build. Eng. 2020, 29, 101114. [Google Scholar] [CrossRef]
- Kenai, M.-A.; Libessart, L.; Lassue, S.; Defer, D. Impact of green walls occultation on energy balance: Development of a TRNSYS model on a brick masonry house. J. Build. Eng. 2021, 44, 102634. [Google Scholar] [CrossRef]
- Duan, Z.; Zhao, X.; Liu, J.; Zhang, Q. Dynamic simulation of a hybrid dew point evaporative cooler and vapour compression refrigerated system for a building using EnergyPlus. J. Build. Eng. 2019, 21, 287–301. [Google Scholar] [CrossRef]
- Buechler, E.; Pallin, S.; Boudreaux, P.; Stockdale, M. Probabilistic modeling of the indoor climates of residential buildings using EnergyPlus. J. Build. Phys. 2017, 41, 225–246. [Google Scholar] [CrossRef]
- Perini, K.; Chokhachian, A.; Dong, S.; Auer, T. Modeling and simulating urban outdoor comfort: Coupling ENVI-Met and TRNSYS by grasshopper. Energy Build. 2017, 152, 373–384. [Google Scholar] [CrossRef]
- Simon, H.; Lindén, J.; Hoffmann, D.; Braun, P.; Bruse, M.; Esper, J. Modeling transpiration and leaf temperature of urban trees—A case study evaluating the microclimate model ENVI-met against measurement data. Landsc. Urban Plan. 2018, 174, 33–40. [Google Scholar] [CrossRef]
- Acero, J.A.; Arrizabalaga, J. Evaluating the performance of ENVI-met model in diurnal cycles for different meteorological conditions. Theor. Appl. Climatol. 2018, 131, 455–469. [Google Scholar] [CrossRef]
- Huttner, S. Further Development and Application of the 3D Microclimate Simulation ENVI-Met; Universitätsbibliothek Mainz: Mainz, Germany, 2012. [Google Scholar]
- Ding, Y.; Zhang, Q.; Yuan, T.; Yang, F. Effect of input variables on cooling load prediction accuracy of an office building. Appl. Therm. Eng. 2018, 128, 225–234. [Google Scholar] [CrossRef]
- Feng, C.; Meng, Q.; Zhang, Y. Theoretical and experimental analysis of the energy balance of extensive green roofs. Energy Build. 2010, 42, 959–965. [Google Scholar] [CrossRef]
- Lazzarin, R.M.; Castellotti, F.; Busato, F. Experimental measurements and numerical modelling of a green roof. Energy Build. 2005, 37, 1260–1267. [Google Scholar] [CrossRef]
- Wong, N.H.; Chen, Y.; Ong, C.L.; Sia, A. Investigation of thermal benefits of rooftop garden in the tropical environment. Build. Environ. 2003, 38, 261–270. [Google Scholar] [CrossRef]
- Morau, D.; Libelle, T.; Garde, F. Performance evaluation of green roof for thermal protection of buildings in Reunion Island. Energy Procedia 2012, 14, 1008–1016. [Google Scholar] [CrossRef]
- Permpituck, S.; Namprakai, P. The energy consumption performance of roof lawn gardens in Thailand. Renew. Energy 2012, 40, 98–103. [Google Scholar] [CrossRef]
- Sailor, D.J.; Elley, T.B.; Gibson, M. Exploring the building energy impacts of green roof design decisions—A modeling study of buildings in four distinct climates. J. Build. Phys. 2012, 35, 372–391. [Google Scholar] [CrossRef]
- Xing, Q.; Hao, X.; Lin, Y.; Tan, H.; Yang, K. Experimental investigation on the thermal performance of a vertical greening system with green roof in wet and cold climates during winter. Energy Build. 2019, 183, 105–117. [Google Scholar] [CrossRef]
- Jamei, E.; Chau, H.W.; Seyedmahmoudian, M.; Stojcevski, A. Review on the cooling potential of green roofs in different climates. Sci. Total Environ. 2021, 791, 148407. [Google Scholar] [CrossRef]
- Carrera-Hernández, J.; Gaskin, S. Spatio temporal analysis of daily precipitation and temperature in the Basin of Mexico. J. Hydrol. 2007, 336, 231–249. [Google Scholar] [CrossRef]
- Bogusz, J.; KłOS, A.; Grzempowski, P.; Kontny, B. Modelling the velocity field in a regular grid in the area of Poland on the basis of the velocities of European permanent stations. Pure Appl. Geophys. 2014, 171, 809–833. [Google Scholar] [CrossRef] [Green Version]
- Yang, W.; Wong, N.H.; Zhang, G. A comparative analysis of human thermal conditions in outdoor urban spaces in the summer season in Singapore and Changsha, China. Int. J. Biometeorol. 2013, 57, 895–907. [Google Scholar] [CrossRef]
- Liu, W.; Zhang, Y.; Deng, Q. The effects of urban microclimate on outdoor thermal sensation and neutral temperature in hot-summer and cold-winter climate. Energy Build. 2016, 128, 190–197. [Google Scholar] [CrossRef]
- Aflaki, A.; Mirnezhad, M.; Ghaffarianhoseini, A.; Ghaffarianhoseini, A.; Omrany, H.; Wang, Z.-H.; Akbari, H. Urban heat island mitigation strategies: A state-of-the-art review on Kuala Lumpur, Singapore and Hong Kong. Cities 2017, 62, 131–145. [Google Scholar] [CrossRef] [Green Version]
Figure 1.
Research models of this study.

Figure 2.
Validation experiment. (a) Field measurements; (b) ENVI-met model of field measurement.

Figure 3.
Field experiment data.

Figure 4.
Effects of green roof rates on indoor air temperature over the 12 months.

Figure 5.
Annual thermal sensations modified by the five roof greening rates. (a) Indoor thermal sensation of 0% green roof rate scenario; (b) Indoor thermal sensation of 25% green roof rate scenario; (c) Indoor thermal sensation of 50% green roof rate scenario; (d) Indoor thermal sensation of 75% green roof rate scenario; (e) Indoor thermal sensation of 100% green roof rate scenario.

Table 2.
Properties of Funkia (Hosta).
| Parameters | Value |
|---|---|
| Albedo | 0.2 |
| Transmittance | 0.3 |
| Plant height (m) | 0.4 |
| Root zone depth (m) | 0.5 |
| Leaf area profile | 0.15 |
| Root area profile | 0.1 |
| LAI | 1.5 |
| Leaf angle distribution | 0.5 |
Table 3.
Properties of concrete and glass.
| Parameters | Value |
|---|---|
| Concrete | |
| Thickness (m) | 0.31 |
| Absorption (Frac) | 0.5 |
| Transmission (Frac) | 0 |
| Reflection (Frac) | 0.5 |
| Emissivity (Frac) | 0.9 |
| Specific heat J/(kg·K) | 850 |
| Thermal conductivity W/(m·K) | 1.6 |
| Density (kg/m3) | 2220 |
| Clear float glass | |
| Thickness (m) | 0.02 |
| Absorption (Frac) | 0.05 |
| Transmission (Frac) | 0.9 |
| Reflection (Frac) | 0.05 |
| Emissivity (Frac) | 0.9 |
| Specific heat J/(kg·K) | 750 |
| Thermal conductivity W/(m·K) | 1.05 |
| Density (kg/m3) | 2500 |
Table 4.
Boundary conditions of the simulation.
| Month | Initial Meteorological Condition | Value | Month | Initial Meteorological Condition | Value |
|---|---|---|---|---|---|
| Jan. | Wind speed (10 m above the ground) | 2.7 m/s | Feb. | Wind speed (10 m above the ground) | 3.34 m/s |
| Wind direction | 315° | Wind direction | 135° | ||
| Max air-temperature | 9 °C | Max air-temperature | 15 °C | ||
| Min air-temperature | 5 °C | Min air-temperature | 9 °C | ||
| Max relative-humidity | 78% | Max relative-humidity | 80% | ||
| Min relative-humidity | 68% | Min relative-humidity | 70% | ||
| Mar. | Wind speed (10 m above the ground) | 3.51 m/s | Apr. | Wind speed (10 m above the ground) | 5.3 m/s |
| Wind direction | 315° | Wind direction | 315° | ||
| Max air-temperature | 16 °C | Max air-temperature | 19 °C | ||
| Min air-temperature | 11 °C | Min air-temperature | 13 °C | ||
| Max relative-humidity | 84% | Max relative-humidity | 77% | ||
| Min relative-humidity | 74% | Min relative-humidity | 67% | ||
| May. | Wind speed (10 m above the ground) | 4.59 m/s | Jun. | Wind speed (10 m above the ground) | 3.52 m/s |
| Wind direction | 315° | Wind direction | 315° | ||
| Max air-temperature | 28 °C | Max air-temperature | 30 °C | ||
| Min air-temperature | 21 °C | Min air-temperature | 24 °C | ||
| Max relative-humidity | 78% | Max relative-humidity | 77% | ||
| Min relative-humidity | 68% | Min relative-humidity | 67% | ||
| Jul. | Wind speed (10 m above the ground) | 4.72 m/s | Aug. | Wind speed (10 m above the ground) | 2.79 m/s |
| Wind direction | 270° | Wind direction | 135° | ||
| Max air-temperature | 33 °C | Max air-temperature | 32 °C | ||
| Min air-temperature | 26 °C | Min air-temperature | 24 °C | ||
| Max relative-humidity | 71% | Max relative-humidity | 74% | ||
| Min relative-humidity | 61% | Min relative-humidity | 64% | ||
| Sep. | Wind speed (10 m above the ground) | 2.77 m/s | Oct. | Wind speed (10 m above the ground) | 2.77 m/s |
| Wind direction | 0° | Wind direction | 315° | ||
| Max air-temperature | 25 °C | Max air-temperature | 19 °C | ||
| Min air-temperature | 20 °C | Min air-temperature | 14 °C | ||
| Max relative-humidity | 72% | Max relative-humidity | 79% | ||
| Min relative-humidity | 62% | Min relative-humidity | 69% | ||
| Nov. | Wind speed (10 m above the ground) | 2.53 m/s | Dec. | Wind speed (10 m above the ground) | 2.8 m/s |
| Wind direction | 0° | Wind direction | 315° | ||
| Max air-temperature | 17 °C | Max air-temperature | 7 °C | ||
| Min air-temperature | 11 °C | Min air-temperature | 4 °C | ||
| Max relative-humidity | 85% | Max relative-humidity | 78% | ||
| Min relative-humidity | 75% | Min relative-humidity | 68% |
Table 5.
Durations of indoor thermal perceptions of different roof greening coverages.
| Warm | Slightly Warm | Neutral | Slightly Cool | Cool | ||
|---|---|---|---|---|---|---|
| 0% greening roof coverage | % | 10.0% | 36.1% | 25.4% | 25.0% | 3.4% |
| hour | 879.3 | 3163.3 | 2229.3 | 2189.5 | 298.5 | |
| 25% greening roof coverage | % | 9.7% | 36.2% | 25.4% | 25.1% | 3.6% |
| hour | 849.2 | 3174.4 | 2225.4 | 2198.1 | 313.0 | |
| 50% greening roof coverage | % | 9.4% | 36.3% | 25.4% | 25.2% | 3.7% |
| hour | 821.7 | 3183.5 | 2224.4 | 2204.4 | 326.1 | |
| 75% greening roof coverage | % | 9.1% | 36.4% | 25.4% | 25.2% | 3.9% |
| hour | 793.7 | 3192.1 | 2224.0 | 2208.2 | 342.0 | |
| 100% greening roof coverage | % | 8.7% | 36.5% | 25.4% | 25.3% | 4.1% |
| hour | 765.0 | 3201.0 | 2222.5 | 2215.0 | 356.5 |
Publisher’s Note: MDPI stays neutral with regard to jurisdictional claims in published maps and institutional affiliations. |
© 2022 by the authors. Licensee MDPI, Basel, Switzerland. This article is an open access article distributed under the terms and conditions of the Creative Commons Attribution (CC BY) license (https://creativecommons.org/licenses/by/4.0/).
Share and Cite
MDPI and ACS Style
Zheng, B.; Li, J.; Chen, X.; Luo, X. Evaluating the Effects of Roof Greening on the Indoor Thermal Environment throughout the Year in a Chinese City (Chenzhou). Forests 2022, 13, 304. https://0-doi-org.brum.beds.ac.uk/10.3390/f13020304
AMA Style
Zheng B, Li J, Chen X, Luo X. Evaluating the Effects of Roof Greening on the Indoor Thermal Environment throughout the Year in a Chinese City (Chenzhou). Forests. 2022; 13(2):304. https://0-doi-org.brum.beds.ac.uk/10.3390/f13020304
Chicago/Turabian StyleZheng, Bohong, Jiayu Li, Xiao Chen, and Xi Luo. 2022. "Evaluating the Effects of Roof Greening on the Indoor Thermal Environment throughout the Year in a Chinese City (Chenzhou)" Forests 13, no. 2: 304. https://0-doi-org.brum.beds.ac.uk/10.3390/f13020304
Note that from the first issue of 2016, this journal uses article numbers instead of page numbers. See further details here.