Article

Long-Term Carbon Sequestration in Pine Forests under Different Silvicultural and Climatic Regimes in Spain

by
Rafael M. Navarro-Cerrillo
1,*,
Francisco J. Ruiz-Gómez
1,
Jesús J. Camarero
2,
Víctor Castillo
3,
Gonzalo G. Barberá
3,
Guillermo Palacios-Rodríguez
1,
Francisco B. Navarro
4,
Juan A. Blanco
5,
Juan B. Imbert
5,
Antonio M. Cachinero-Vivar
1,
Antonio J. Molina
6 and
Antonio D. del Campo
6
1
Laboratory of Dendrochronology, Silviculture and Climate Change, ERSAF, Department of Forestry, School of Agriculture and Forestry, University of Cordoba, Edif. Leonardo da Vinci, 14071 Córdoba, Spain
2
Instituto Pirenaico de Ecología (IPE-CSIC), Campus de Aula Dei, Avda. Montañana, 1005, 50059 Zaragoza, Spain
3
Centro de Edafología y Biología Aplicada del Segura (CEBAS-CSIC), Campus Universitario de Espinardo, Espinardo, 30100 Murcia, Spain
4
Area of Agriculture and Environment, Institute of Agriculture and Fisheries of Andalusia (IFAPA, Andalusian Government), IFAPA Centro Camino de Purchil, Camino Purchil s/n, 18004 Granada, Spain
5
Institute for Multidisciplinary Applied Biology (IMAB), Dep. Ciencias, Campus de Arrosadia s/n, Universidad Pública de Navarra (UPNA), 31006 Pamplona, Spain
6
Re-ForeST, Universitat Politècnica de València, Camino de Vera s/n, 46022 Valencia, Spain
*
Author to whom correspondence should be addressed.
Submission received: 30 December 2021 / Revised: 4 March 2022 / Accepted: 7 March 2022 / Published: 12 March 2022
(This article belongs to the Special Issue Adaptive Forest Management to Climatic Change)

Abstract

:
Proactive silviculture treatments (e.g., thinning) may increase C sequestration contributing to climate change mitigation, although, there are still questions about this effect in Mediterranean pine forests. The aim of this research was to quantify the storage of biomass and soil organic carbon in Pinus forests along a climatic gradient from North to South of the Iberian Peninsula. Nine experimental Pinus spp trials were selected along a latitudinal gradient from the pre-Pyrenees to southern Spain. At each location, a homogeneous area was used as the operational scale, and three thinning intensity treatments: unthinned or control (C), intermediate thinning (LT, removal of 30–40% of the initial basal area) and heavy thinning (HT, removal of 50–60%) were conducted. Growth per unit area (e.g., expressed as basal area increment-BAI), biomass, and Soil Organic Carbon (SOC) were measured as well as three sets of environmental variables (climate, soil water availability and soil chemical and physical characteristics). One-way ANOVA and Structural Equation Modelling (SEM) were used to study the effect of thinning and environmental variables on C sequestration. Biomass and growth per unit area were higher in the control than in the thinning treatments, although differences were only significant for P. halepensis. Radial growth recovered after thinning in all species, but it was faster in the HT treatments. Soil organic carbon (SOC10, 0–10 cm depth) was higher in the HT treatments for P. halepensis and P. sylvestris, but not for P. nigra. SEM showed that Pinus stands of the studied species were beneficed by HT thinning, recovering their growth quickly. The resulting model explained 72% of the variation in SOC10 content, and 89% of the variation in silvicultural condition (basal area and density) after thinning. SOC10 was better related to climate than to silvicultural treatments. On the other hand, soil chemical and physical characteristics did not show significant influence over SOC10- Soil water availability was the latent variable with the highest influence over SOC10. This work is a new contribution that shows the need for forest managers to integrate silviculture and C sequestration in Mediterranean pine plantations.

1. Introduction

The burning of fossil fuels is the primary cause of the increasing concentration of CO2 and other greenhouse gases (GHGs) in the atmosphere [1]. Only in 2019, emissions de-rived from fossil-fuel combustion and industrial processes accounted for 52.4 GtCO2 eq or 57.4 GtCO2 eq when also including those derived from land-use changes. These figures coincided with the second warmest year in the 140-year record [2]. Apart from setting emission reduction targets at the mid-term for country members, international agreements aiming at mitigating the effects of climate change (Kyoto Protocol, Paris Agreements, European Climate Policy) also promote carbon sequestration in the biosphere as a key strategy to be used to offset GHGs emissions. Forest ecosystems have an important role in C cycling at the global and regional levels, contributing to store approximately 80% and 40% of the total aboveground and belowground terrestrial carbon storage, respectively [3,4]. Within the world’s forests C stock, the soil organic matter constitutes the main pool (383 GtC or 44%, to 1-m depth), followed by the sum of the above and below ground biomass (363 GtC or 42%), deadwood (6 GtC or 8%) and litter (4.3 GtC or 5%) [5].
Forests offer two main options for increasing carbon sequestration, by planting trees in currently non-forested land (afforestation), or by allowing the existing forests to accumulate higher biomass [4,6]. In addition, the afforestation of degraded or low productive areas through woody vegetation encroachment has clearly enhanced soil organic carbon [7,8]. Afforestation has been suggested not only as an effective way to restore degraded ecosystems, but also as a way to mitigate elevated atmospheric CO2, hence contributing towards the reduction of global warming [9].
During the last 50 years, Europe has, on average, multiplied the forest biomass and carbon stock per hectare by 1.75 [10]. However, the increases in forested area alone, with 5% for conifer forests and 8% for broadleaved ones since 1950, are not enough to explain the significant increments in forest productivity [10]. Recently, the impact of summer drought on dry deposition of tropospheric ozone (O3) has been highlighted as an important factor on forest gas dynamics during severe drought period [11]. These scenarios suggest that other factors such as changes in environmental conditions [12,13], and in forest management practices are also greatly affecting the carbon sequestration rates [14]. In addition, although the objective of afforestation plans to increase carbon stocks is clear, the contribution of forest management in C sequestration is not always considered given the high site-dependency on local factors [15]. For example, it has been established that reducing tree density increases litter decomposition by allowing more radiation to reach the soil surface and higher soil moisture levels due to increased net rainfall [16]. However, these findings are not applicable to Mediterranean conditions, and in fact null or opposite effects have been reported [17,18]. This situation points out the need to better understand the effects of management practices on semiarid environments such as the Mediterranean, where limited information about ecological effects of management exists as compared to temperate forests [19].
In Spain, pine forests occupy 32.6% of the total forested area, resulting the most extended forest type in the country [20]. Given their rapid growth and high adaptability to different types of soil, Pinus species have been profusely used in afforestation, especially in areas with harsh climatic conditions and high erosion rates such as those characterized by arid and semiarid conditions [21]. Although thinning interventions are typically applied during rotation of Pinus spp. stands to stimulate the growth of the remaining trees [22,23,24], most of them are currently characterized by high tree density because of low timber profitability. Unmanaged pine forests may hold higher amounts of carbon than managed ones mainly due to the differences related to thinning on living biomass [25,26], increasing normally increase with stand age [27]. In contrast, no clear consensus has emerged regarding the influence of forest thinning on soil organic carbon (SOC) on the long-term [28,29]. SOC is more resistant to changes promoted by forest management than the living biomass [26,28] with the addition that most studies focused on quantifying its temporal dynamics are carried out under natural or unmanaged conditions [28,30].
The balance between soil organic matter input from litterfall and CO2 release during decomposition determines the amount of SOC in forest soils. The chemical nature of C molecules (labile or stable C), site conditions (climate), and soil parameters (clay content, soil moisture, pH, nutritional status) all influence carbon turnover [16]. Forest management has an impact on several of these factors, either directly or indirectly. Detailed reviews on how forest management can influence soil carbon have been published [16,28,31,32,33,34,35], and modelling estimations on how forest SOC can change over long-time frames in different biomes have been compiled [36]. All these reviews have pointed to the complex interactions between ecological and management factors, particularly in regions with multiple growth-limiting factors fluctuating along the year, such as the Mediterranean region. Thus, abiotic environmental variables (including climate and soil) and thinning intensity are the main factors influencing the primary response of managed forests in terms of C sequestration (e.g., tree growth, and SOC) [16,26]. This has led to a lack of consensus on the effect of how both abiotic variables and thinning intensity might influence C sequestration, and even how that might differ across species and locations [37,38,39]. In fact, some authors have questioned whether C sequestration by plants are widely hold because any gain in carbon storage from faster tree growth will be transitory [40].
Thinning affects SOC by altering the microclimate, water and surface energy balances, litterfall input, fine root density, nutrient budgets, and the composition and activity of soil microbial community [29]. Thinning intensity, but also time elapsed from intervention, are key aspects when analyzing carbon sequestration in a same forest type [23,25,26]. In this sense, an optimum scheme on to study the effect of silviculture in Mediterranean pine forests would address how carbon sequestration (living biomass and SOC) varies in each of the phases of the management operations along the life span of the stand [41]. Since long- term experiments addressing the role of forest management on carbon sequestration in Mediterranean Pinus spp. forests are scarce, complementary approaches combining different chrono-sequences and stands growing under different ecological gradients are needed. Here we describe the approach followed in the framework of the Silvadapt.net research network [42].
The emerging paradigm in forestry states that proactive silviculture treatments (e.g., thinning) can be used to face the emerging environmental changes by both increasing C sequestration and contributing to climate change mitigation by reducing the impacts of some stressors (e.g., drought, forest pests or wildfire), while maintaining tree growth rate and improving stand adaptation [23,43]. On the other hand, other studies contradict this argument showing that heavier thinning reduces biomass pools and C sequestration rates [37,39]. Therefore, there are still open questions about the effects of thinning on C sequestration in Mediterranean pine forests [44]. Our initial hypothesis was that despite the currently accepted site- and species-specific responses to thinning, general rules on the effect of thinning on pine plantations in semiarid sites could be developed. Hence, to test this hypothesis, the aim of our research was to quantify the storage of biomass and soil organic carbon in Pinus forests along a climatic gradient from the North to the South of the Iberian Peninsula. With this, we intended to analyze how C reserves vary according to different species and site conditions according to thinning intensities, thus establishing a pattern of C sequestration. Therefore, this type of studies will help to accurately analyze the C sequestration of natural and planted Pinus forests widely used in the Mediterranean Basin and to understand the possible relationships between thinning and C sequestration during forest management.

2. Materials and Methods
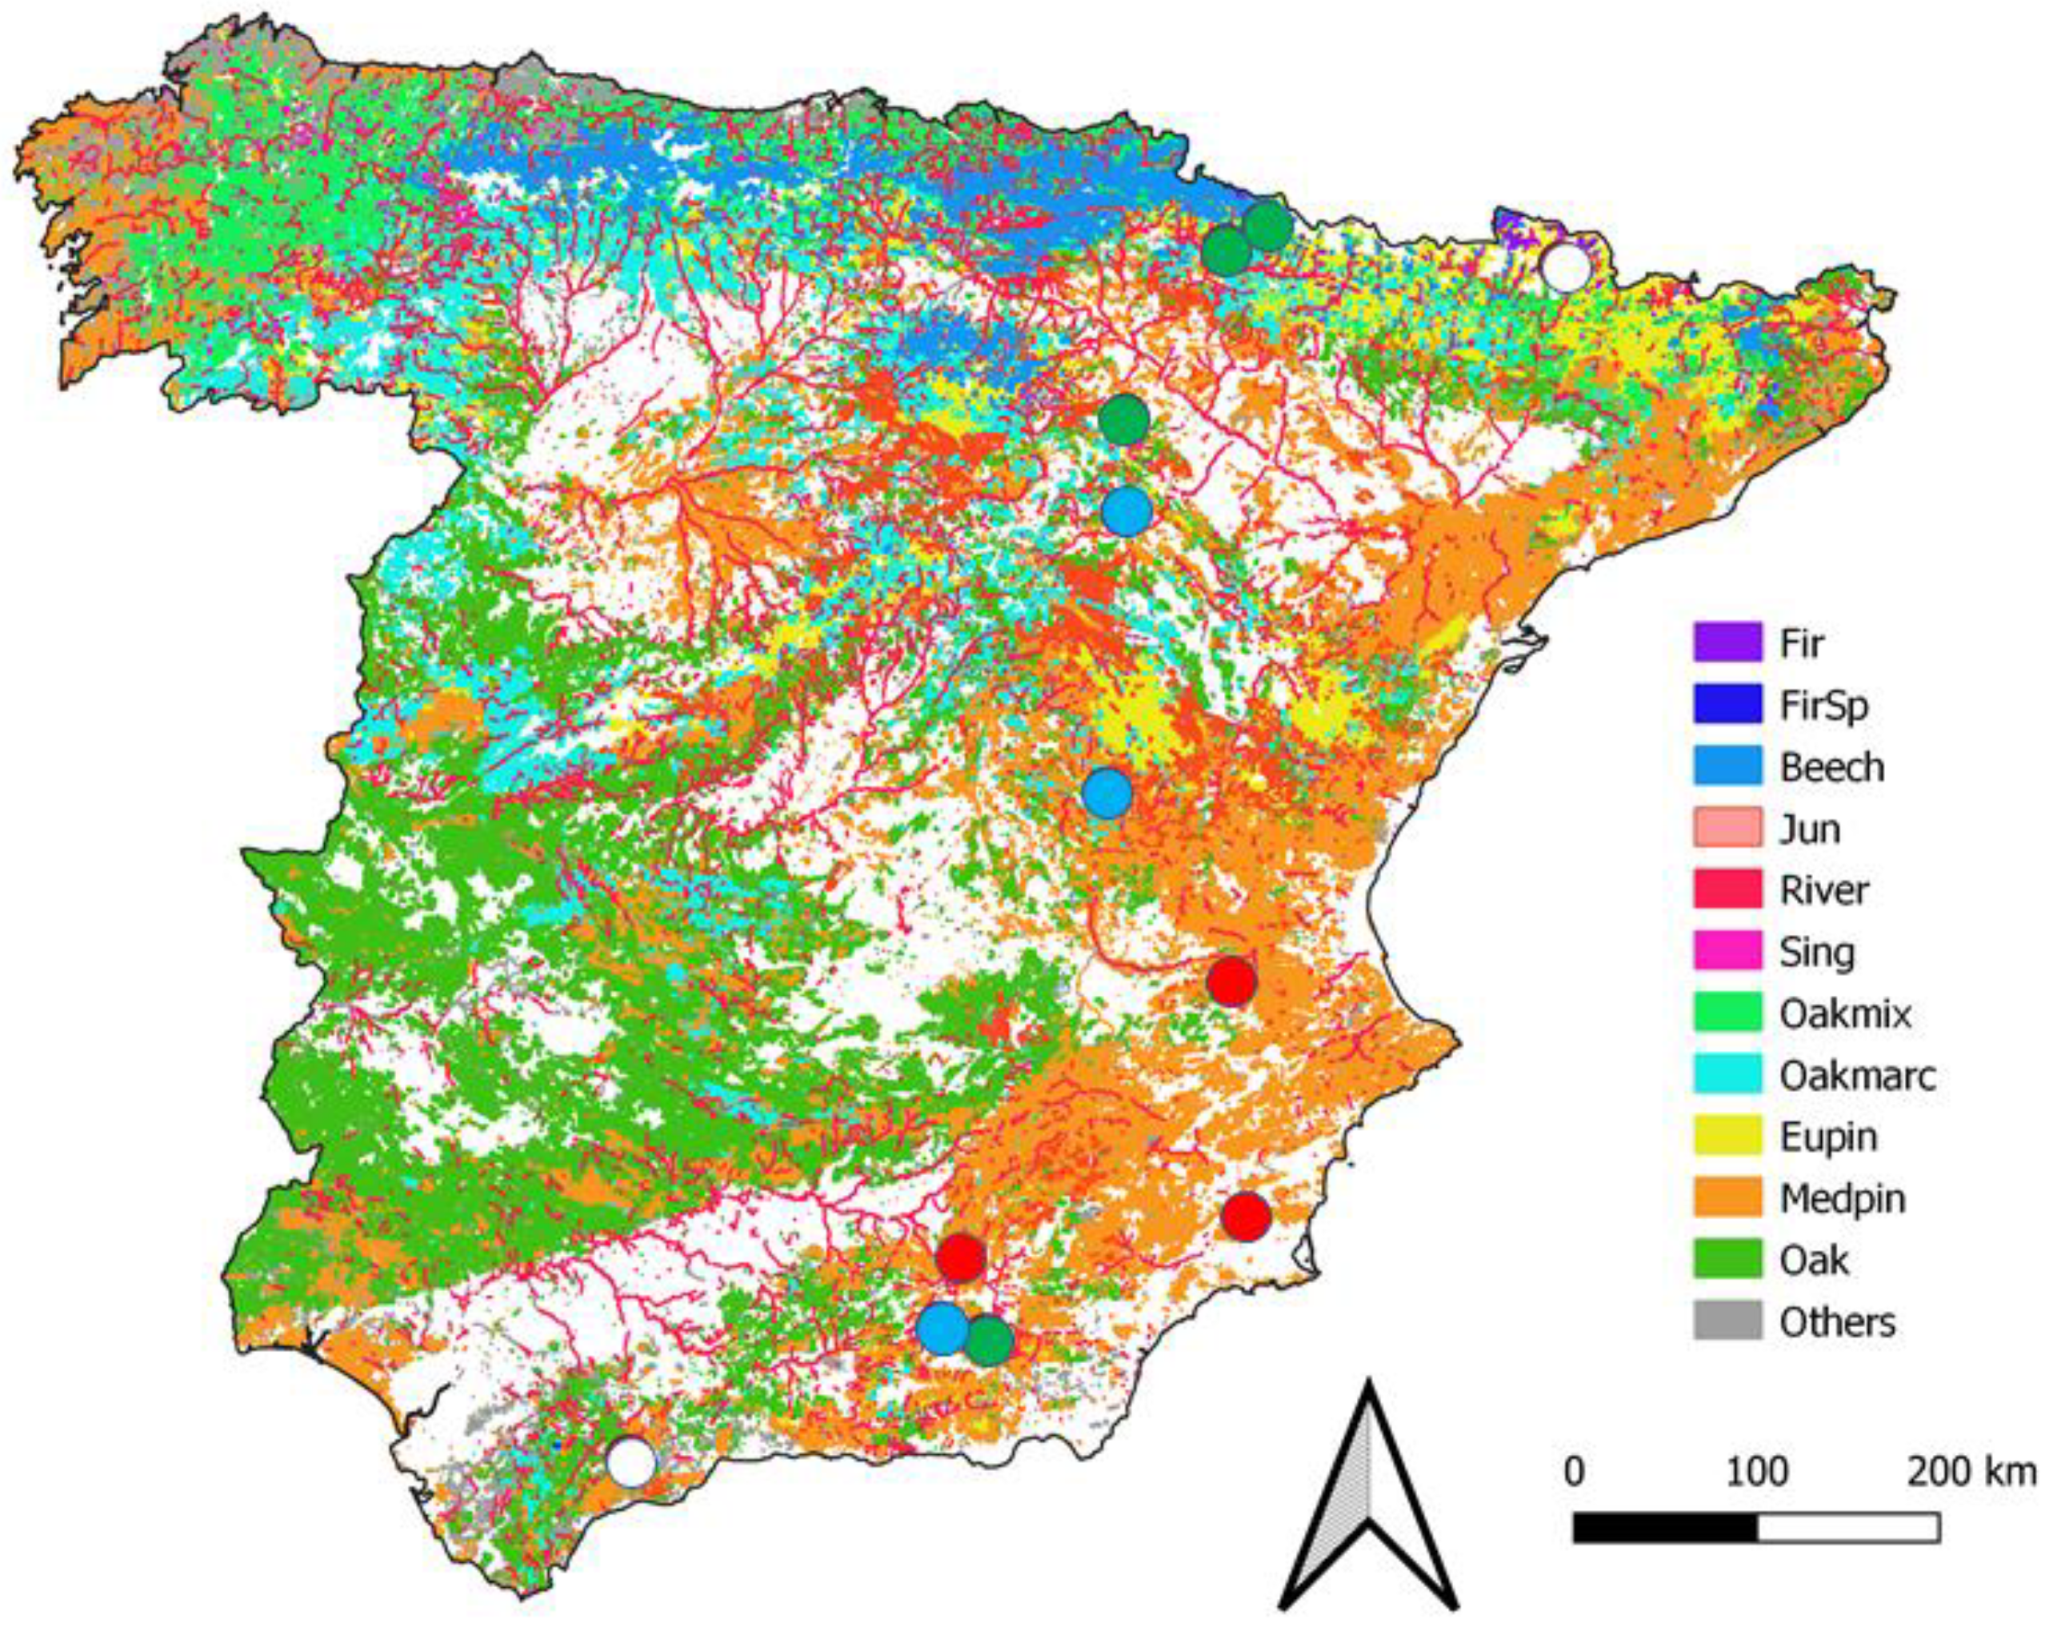
2.1. Study Area

Experimental trials were completed at nine Pinus spp. forests along a latitudinal gradient from the pre-Pyrenees to the southern mountains in Spain (Pyrenees in Navarra; Moncayo in Aragón, Cuenca in Castilla La Mancha, La Hunde in Valencia, Los Cuadros in Murcia, Guadix in Andalucía, and Sª de los Filabres in Andalucía) (Figure 1; Table S1 Supplementary Material).
The locations have elevations ranging from 693 to 1350 m.a.s.l and medium to high slopes. Forest cover at these conifer stands is dominated by either Pinus halepensis Mill., Pinus nigra Arnold., or Pinus sylvestris L. These are planted or regenerated forests, mature in most cases, and located in thermo- to supra-Mediterranean climates. Soils vary from stony to sandy and are characterized by low amount of organic carbon and nutrients (pH 6–8, organic matter content 1–3%, coarse texture and low soil water reserve). Forests have been under silvicultural treatments, and similar thinning schemes have been successfully established in all experimental sites. As a result, homogeneous structures of Mediterranean of Pinus forests have been achieved by well-established standard silvicultural treatments oriented to soil protection and valuable timber production.

2.2. Experimental Design and Field Data

Experimental sites were selected based on the presence of similar thinning schemes. In this regard, thinning intensity was the silvicultural treatment evaluated and the common factor across sites (Table 1 and Table S1 Supplementary Material). Besides site-specific attributes, thinning intensity at each site was based on the requirements of the existing Pinus forest and used for the primary aim of eliminating overtopped, small-sized, dead, or supressed trees to stimulate future growth, with uniform spacing being a secondary priority. At each selected location, a homogeneous area was used as the operational scale, and thinning treatments were randomly assigned and carried out in plots of 20 × 30 m with a 15-m-wide buffer strip around each plot, considering the similarity of the canopy structural parameters, and with analogous microclimatic and edaphic characters at each plot. This experimental design allowed a comparative analysis of three thinning intensity treatments: unthinned or control (C), light thinning (LT) with removal of 30–40% of the initial basal area, and heavy thinning (HT) with removal of 50–60% of the initial basal area in replicate blocks (Table 1). Although the timeframe of thinning differs among locations (Table S1 Supplementary Material), all measurements used in this study were always obtained after 10–12 years the thinning treatment was carried out to make the data comparable. All the biomass with commercial value was extracted (e.g., stems and large branches), but small residues (small branches and part of the crown) were left in situ, and the remaining trees were tagged. Before the thinning, diameter at breast height (dbh, cm, measured at 1.3 m above ground level, caliper Haglöf, Sweden, Table 1) and tree height (m, Vertex III hypsometer, Haglöf Sweden) were measured.

2.3. Growth and Biomass Estimation

Dendrochronological samples were also obtained for the studied sites. Tree-ring widths were calculated and mean basal area increment (BAI) series for each age class were obtained by averaging the annual values of the measured series using the equation [1]:
BAI = π (R2t − R2t−1)
where R is the radius of the tree and t is the year of tree-ring formation. We focused on BAI trends for the 20-year (BAI20, cm2) and 10-year (BAI, cm2) periods after thinning in each plot (Table 1).
Forest aboveground biomass was assessed by using allometric equations for Pinus sp. in Spain [45]. We considered that the percentage of carbon in all aboveground dry biomass for Pinus is 50.0%. These equations estimate biomass for several fractions of the tree: stem, thick branches (dbh > 7 cm), medium sized branches (2 cm < dbh < 7 cm), twigs and leaves, and roots (Table S2 Supplementary Material).

2.4. Soils Samples and SOC Estimation

For each thinning treatment tested, at least nine soil samples were obtained at each site and treatment, and soil extractions were obtained at fixed-equal intervals (0–10 and 10–20 cm depth) below the forest floor using a steel corer (8 cm diameter and 60 cm length) (Table 1) and transported undisturbed to the laboratory. In the laboratory, soil samples were carefully placed to be air-dried, and coarse (≥2 mm) and fine (<2 mm) particles were separated with a sieve. The resultant fine-earth fraction was ground to pass through a 0.5 mm mesh and stored for SOC determination. In the sieving process, all particulate organic matter (rootlets, leaves, seeds, and other plant material) was manually extracted. The gravel (>2 mm) was weighed and stored separately. All the soil samples were processed separately. Organic carbon content of the fine fraction was calculated using the Walkey-Black method via wet oxidation and bulk density (BD) layered in the soil was calculated following Equations (2)–(4) [46] (2)–(4) in g cm−3:
BD = 100/((OM)/(0.244) + (100 − OM)/1.64)
Soil organic matter percentage (OM, %) was obtained using 1.64 constant for mineral bulk density [47] and soil organic carbon stock (SOC-S) was consequently obtained in Mg ha−1 following [48]:
OM = SOC ∗ 1.724
SOC-S = SOC ∗ BD ∗ D
where D = thickness of the analyzed layer (cm) and SOC40-S = sum of the SOC in the first 40 cm from the soil surface obtained for each horizon.

2.5. Environmental Variables

We used three sets of environmental variables for building response models: annual climatic variables (temperature, precipitation, and hydric deficit), topographic variables (slope, aspect), and edaphic conditions (soil chemical, physical and water availability characteristics) (Table 2). Climatic data were downloaded from the climatic data sets developed by [49] based on Spanish Meteorological Agency (AEMET) stations. To harmonize these data sets, we interpolated them to the same 1-km resolution (30 arc-seconds, ≈1 km2 cell size) using the R package meteoland [50]. From the final dataset, we calculated annual and seasonal time series of climatic variables (Table S2 Supplementary Material). Soil data were obtained from each plot based on soil geodatabases developed within different research projects (Table S1, Supplementary Material). The soil geodatabases contain information of chemical (% organic carbon, pH and % carbonates) and physical measurements (% sand, % silt and % clay, soil depth, bulk density and % gravel volume) recorded for each soil profile. Digital Elevation Model (DEM) with a spatial resolution of 5 m was downloaded from the National Geographic Institute (IGN) website, and ‘Surface Analysis’ function (ARC GIS version 10.1, [51]) was used to generate slope and aspect values.
Prior to the analysis, we used the Pearson correlation coefficient to assess for any collinearity issues among the explanatory variables [52]. Variables with a pair-wise correlation of less than 0.6 were chosen (Figure S1, Supplementary Material). We chose the variables with the most widespread use in the literature and the clearest biological relevance in relation to silviculture response from the sets of strongly correlated variables.

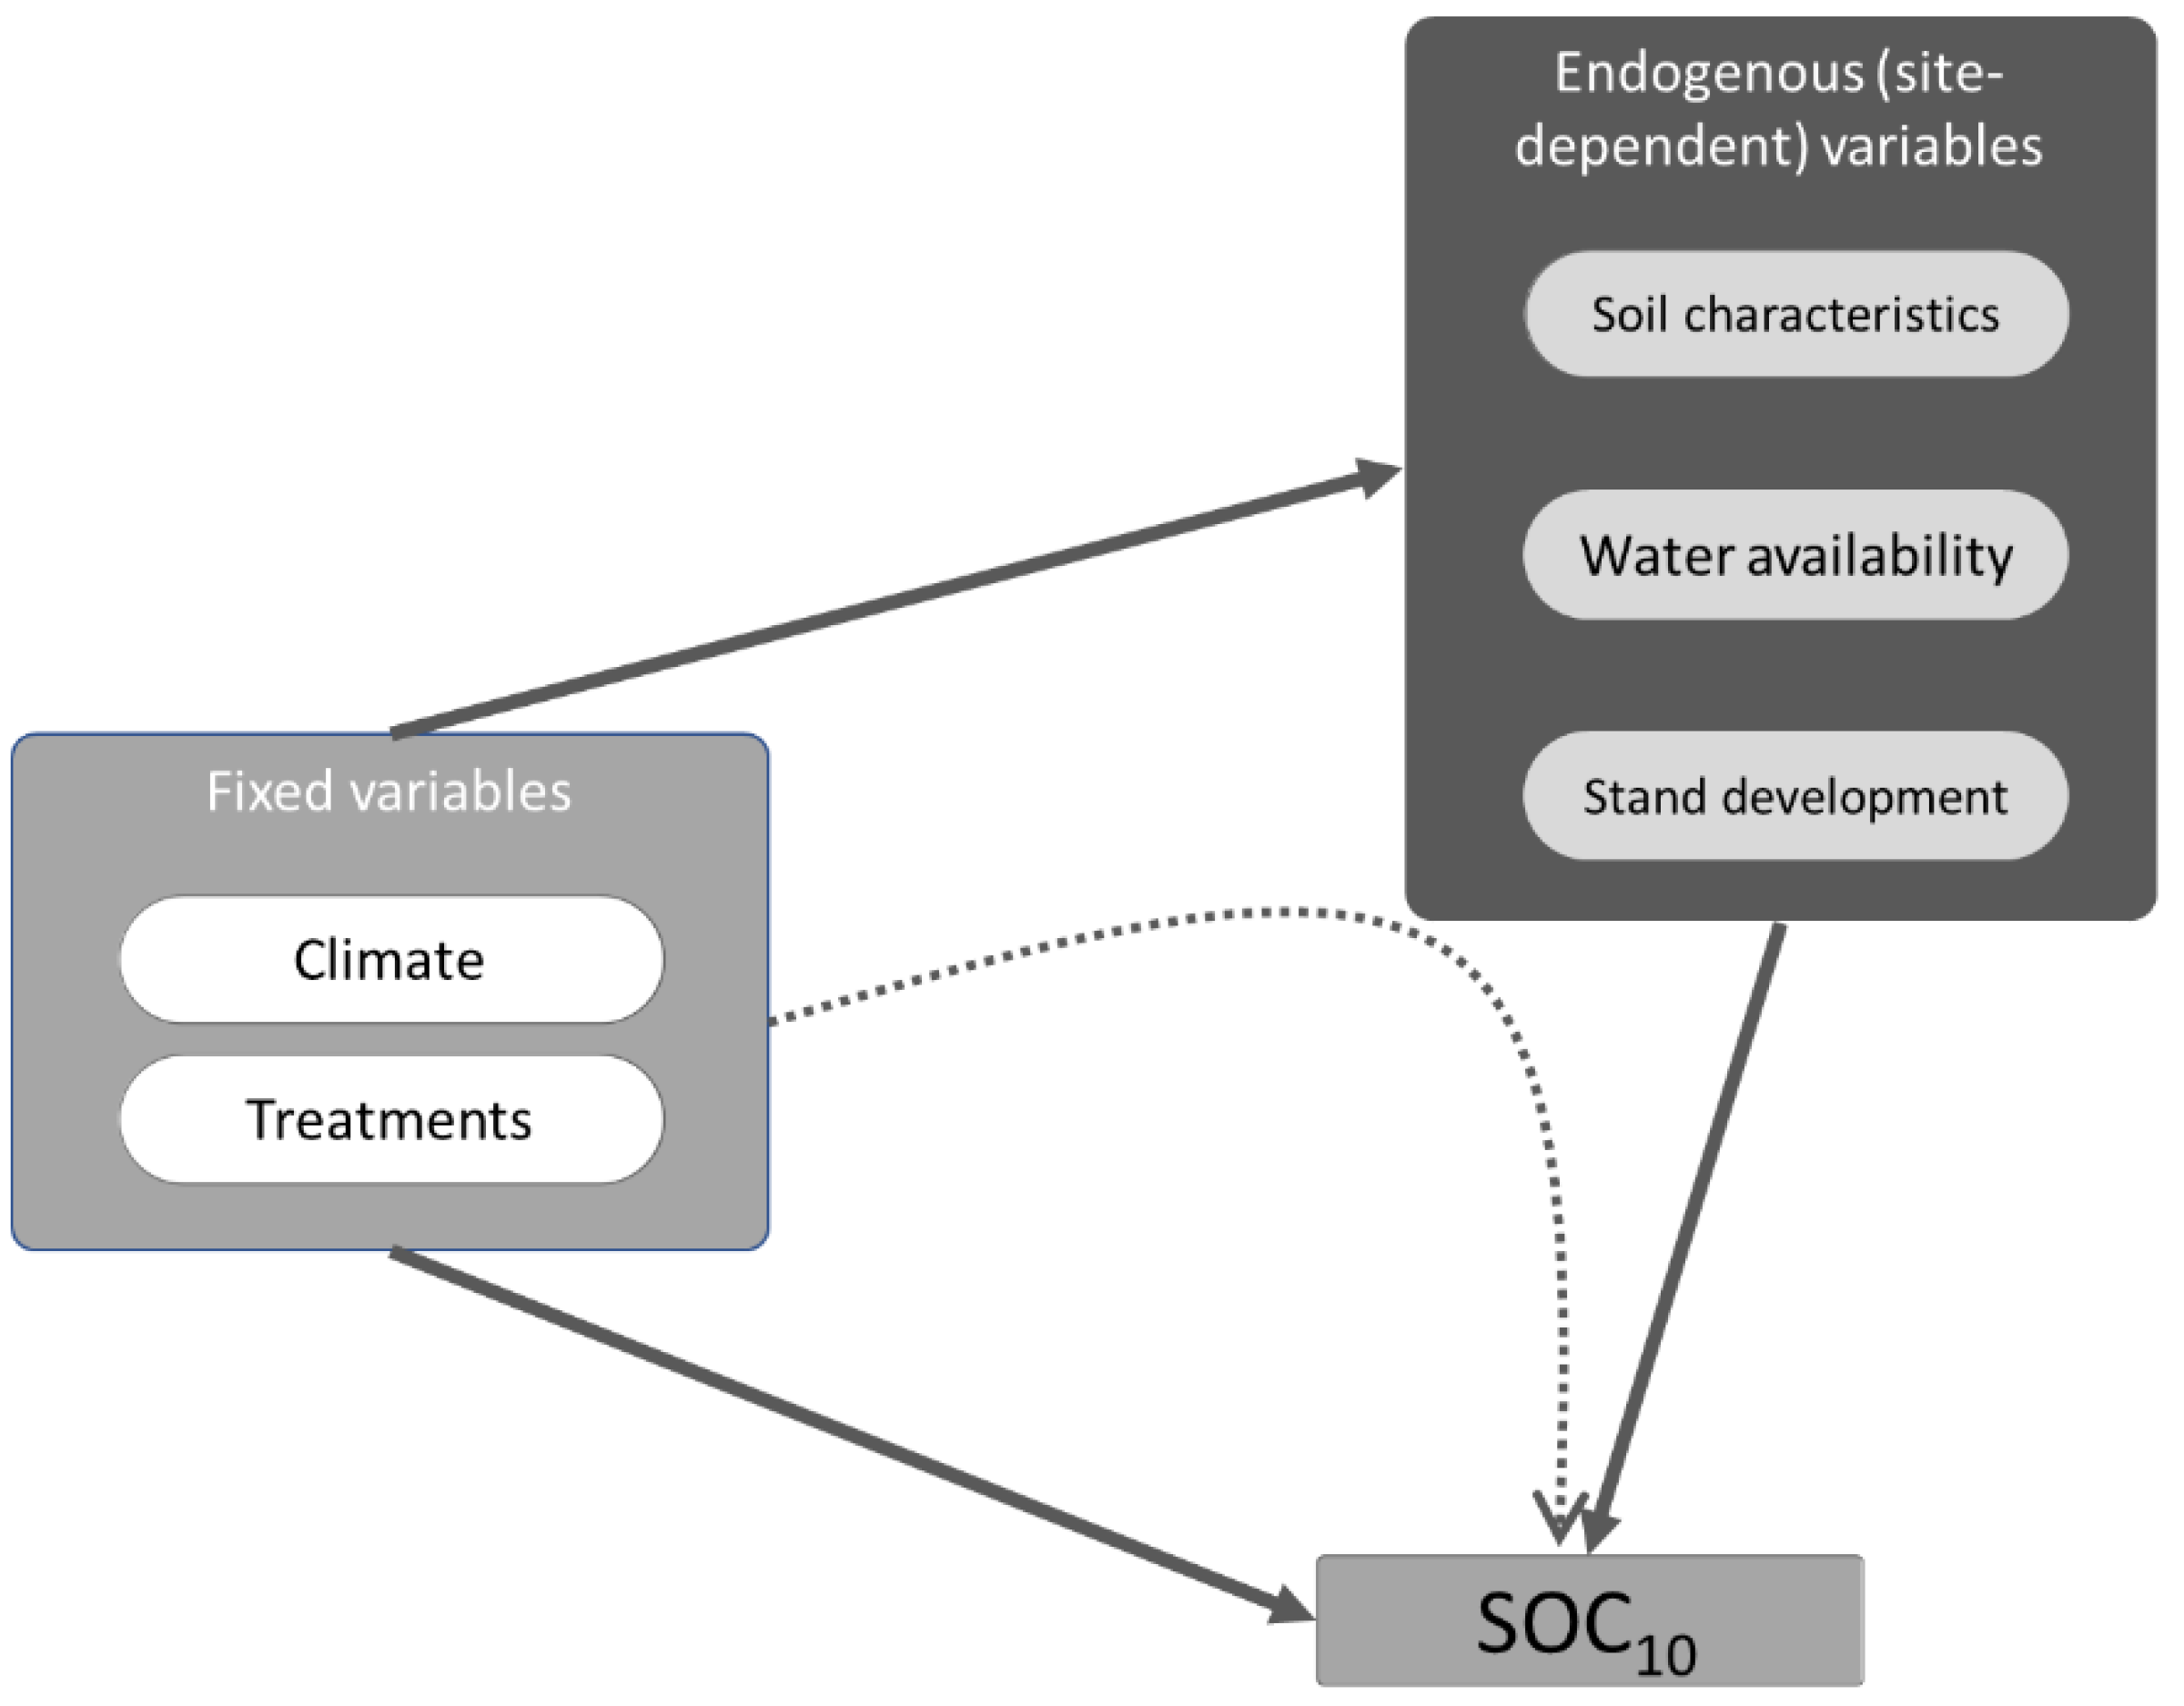
2.6. Statistical Analysis

The variables were examined for normality using the Shapiro-Wilk normality test and the homogeneity of the variances using the Levene test. The non-normal distributed variables were normalized through different types of transformation (logarithmic and exponential). The non-parametric Kruskal-Wallis’s test was applied to those variables that could not be normalized. All data are represented as means ± standard error (SE). Once the basic requirements have been met, the effects of thinning with respect to the silvicultural, SOC and growth variables were tested using 1-way ANOVA for each of the three levels of thinning intensity. A significant value of F in the ANOVA was followed by mean values comparisons using Tukey Post-hoc at p < 0.05 [53]. This procedure was also applied for the comparison between SOC with the main dasometric variables of the studied forests. A two-way ANOVA was carried out to test possible interactions between thinning intensities or treatments and species in the SOC variable.
To model multivariate relationships between response variables (e.g., biomass, SOC and growth) and latent constructs (e.g., silvicultural and environmental variables), we used Structural Equation Modeling (SEM) [54]. The full set of explanatory variables were used in previous Pearson’s correlation analyses and the selected subset of those variables without collinearity problems was used in SEM (Figure S1 Supplementary Material). Due to the high number of interpolated environmental variables used, the dataset was reduced to five different latent variables, each one describing a group of environmental characteristics with common origin, nature or influence (Soil water availability—SWAV; climatic conditions—CLIM; soil chemical and physical characteristics—SCHR; forest stand structure—silvicultural characteristics, SILV; treatment characteristics—TREAT). The working hypothesis was based on considering the climatic and treatment variables as fixed, and then evaluating the direct and indirect interactions of these two variables on the rest, identifying SOC as the endogenous (dependent) variable (Figure 2).
For each grouping, the most representative variables were selected using Principal Component Analysis (PCA), except for treatment where all the possible interactions, including a linear combination of the two variables (Treatment classification—C, LT and HT—the exact thinning intensity) was tested to represent treatments (Table 3). Only variables with communality over 0.6 for the retained Principal Components (eigenvalues over 1), and without collinearity problems were considered. To ensure representativity of latent variables they were only considered for the SEM analysis when the first component resulting of the linear combination of all the chosen variables explained over the 70% of the total variance of the subset. All correspondence analysis were used as initial hypotheses for the SEM approach.
To evaluate the variability explained by the model, R2 values were calculated for the silvicultural variables and SOC. To determine the best model, different combinations of interactions between the four latent variables and the dependent variable were tested, including the saturated model, and the best one was chosen testing differences in the Aikake Information Criteria trough ANOVA analysis [55]. The statistical analysis was carried out using the lavaan package [56] and were represented using semPlot [57] of R software version 3.4.1. [58]. In addition, the relationships between SOC and the main influential variables identified in SEM were analysed through generalized linear models to see their direct influence considering each species separately.

3. Results

3.1. Biomass and Radial Growth Responses to Thinning

Table 1 shows sylvicultural, biomass, and radial growth as a function of thinning treatments. The control treatments had considerably larger C stocks in aboveground and total biomass than the thinning treatments, although differences were only significant for P. halepensis (aboveground biomass, F = 4.241, p = 0.025). The SOC10 (0–10 cm), SOC20 (10–20 cm) and the composite soil samples (SOC10–20, 0–20 cm) values were higher in the heavy thinning treatments for P. halepensis and P. sylvestris, but not for P. nigra; although differences were only significant for P. halepensis (SOC10, F = 4.595, p = 0.020; SOC20 F = 12.816, p < 0.001; SOC10–20, F = 7.949, p = 0.002).
Growth trends of the three pine species were similar across all thinning intensities, with a notable increase in growth after thinning (Table 1). Except for P. sylvestris, the control treatments had the lowest annual growth rates (BAI20). BAI recovered after thinning at both thinning intensities, but BAI increased faster in the heavy thinning treatments. For P. halepensis, P. nigra, and P. sylvestris, BAI after heavy thinning was 4.20, 5.60, and 7.29 cm2 year−1, respectively; and higher than light thinning (3.73, 4.95, and 7.07 cm2 year−1, respectively); however, differences were not significant in any instance.

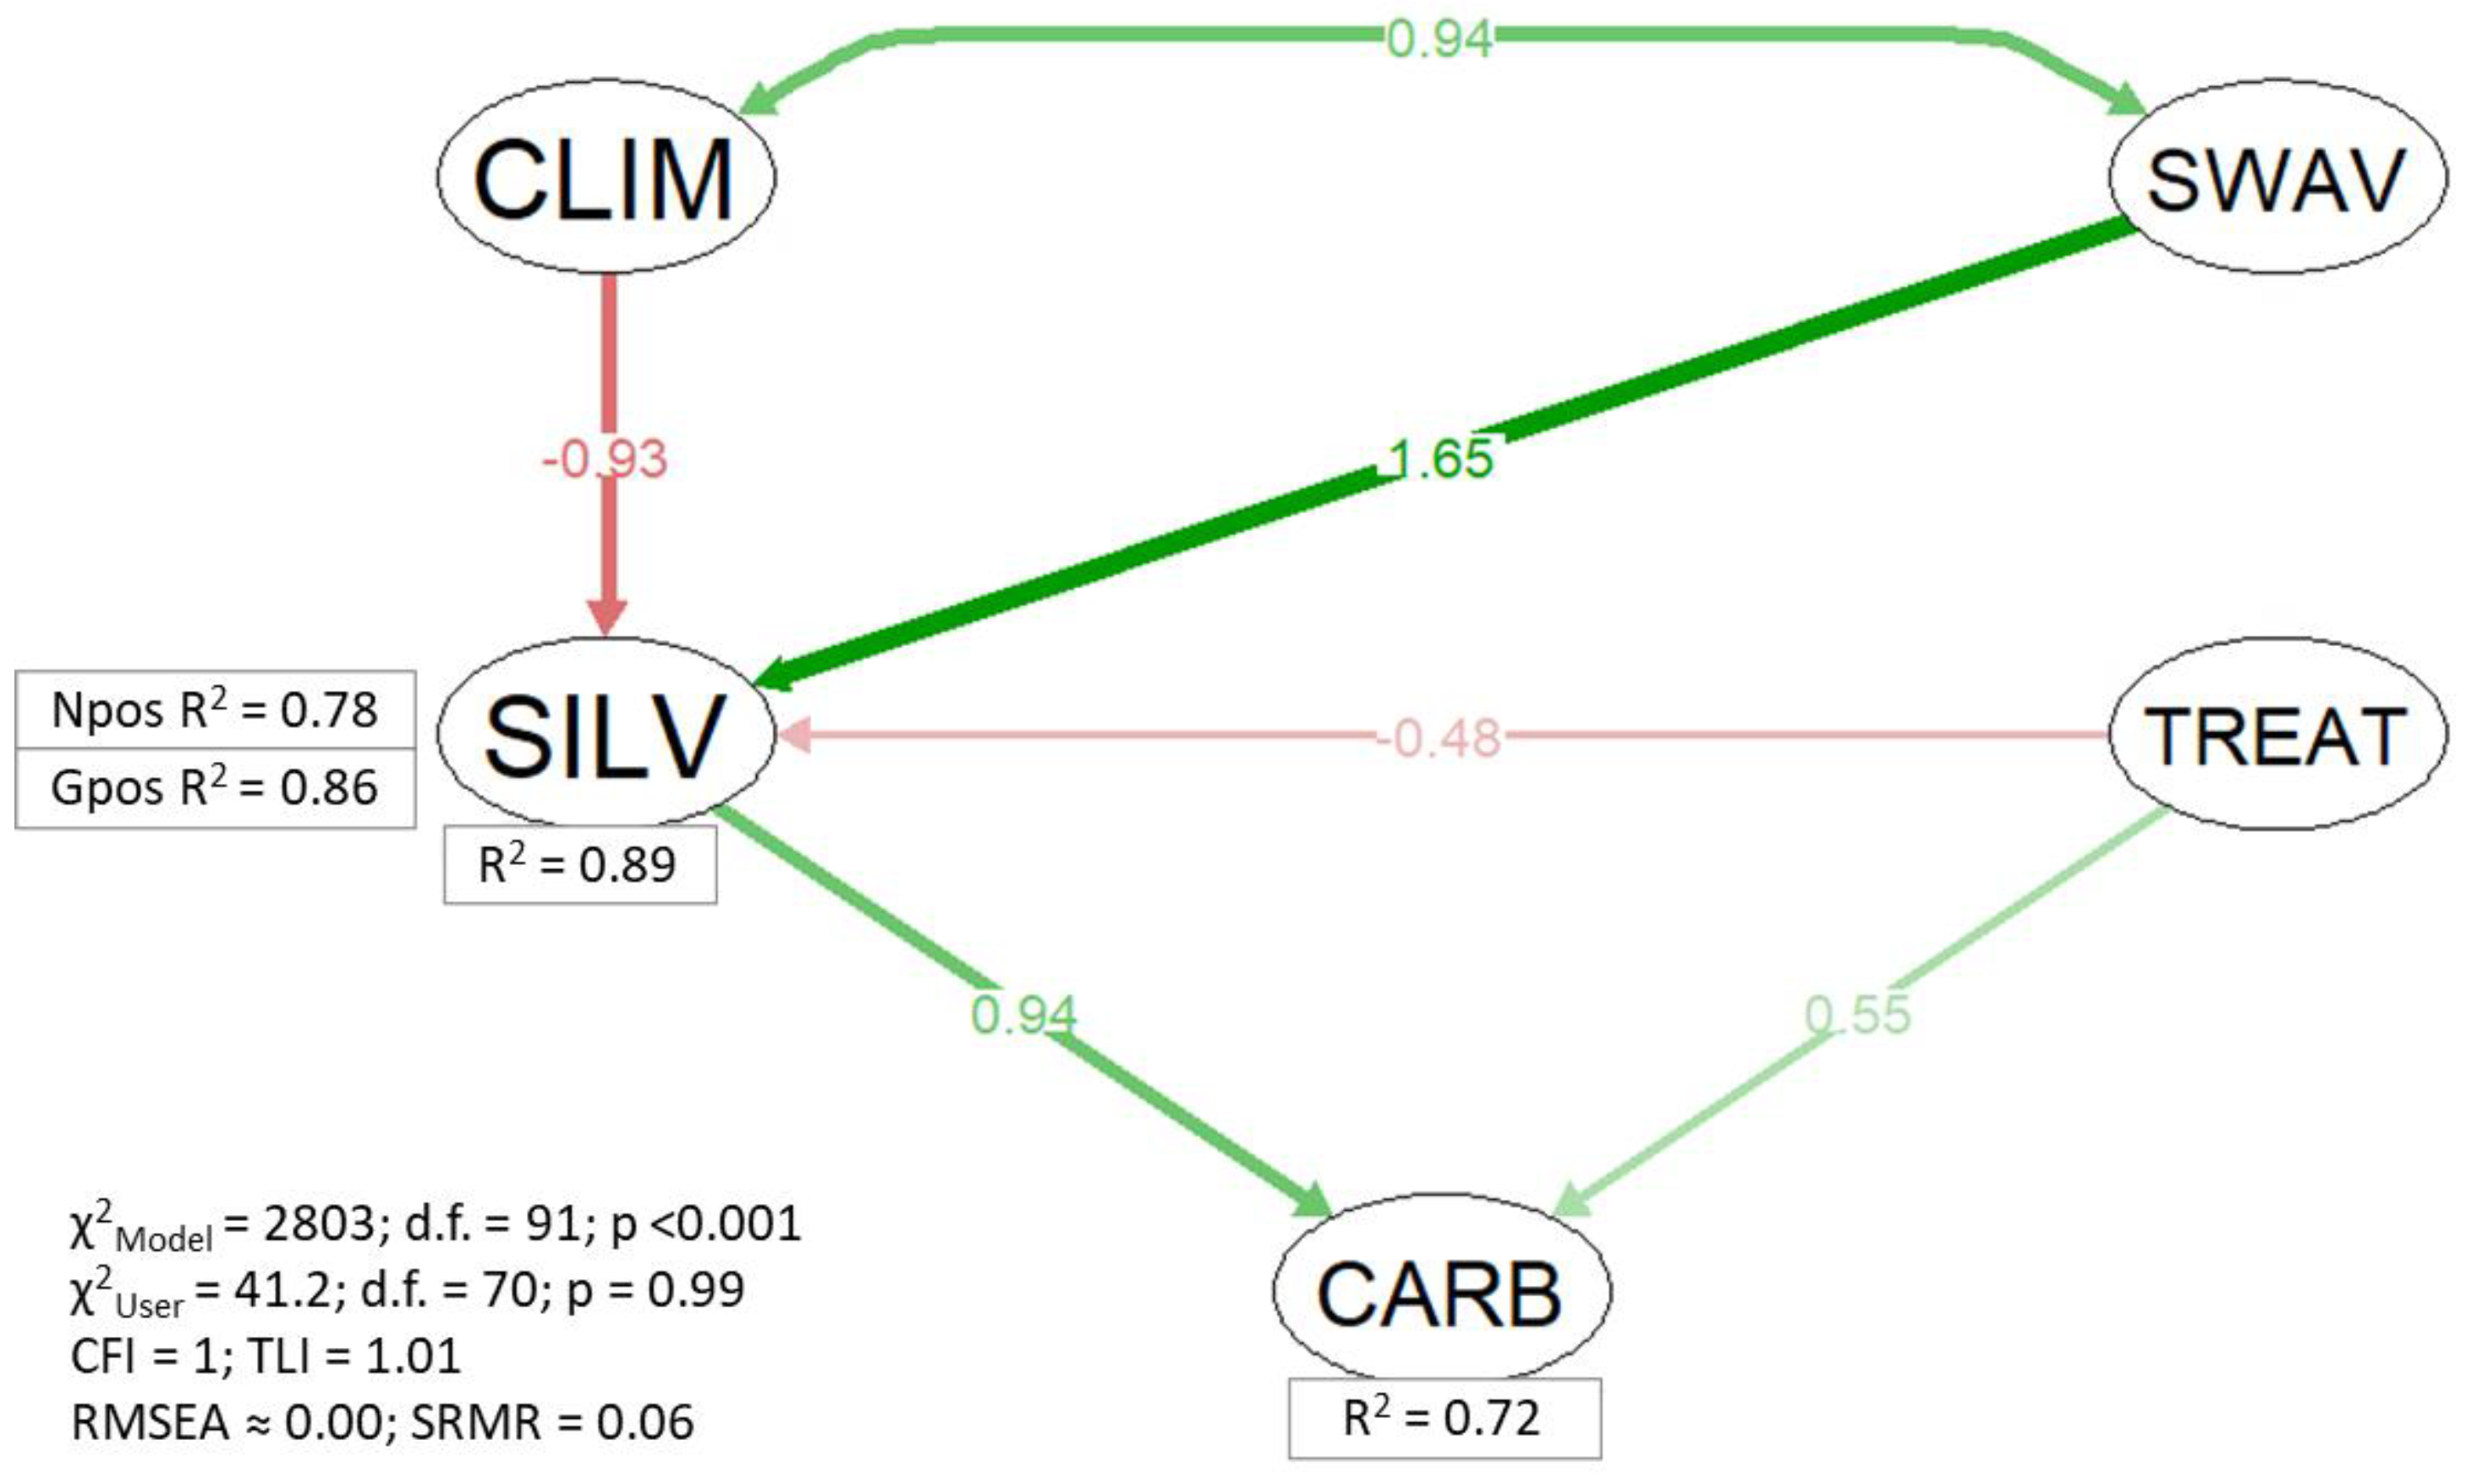
3.2. Structural Equations Model

The saturated model did not fit well data structure (χ2User = 180.5; df = 68; p < 0.001), but after eliminating interaction between soil water availability (SWAV) and treatment (TREAT), the results improved significantly (χ2User = 41.2; df = 70; p = 0.99) (Figure 2). The model showed significant convergence of predictions (χ2Model = 2803; df = 91; p < 0.01) with high values of CFI (1) and TLI (1.01), and good values of RMSEA (≈0) and SRMR (<0.06). Moreover, model user test showed significant fit of the user’s model with data structure (χ2User = 41.2; df = 70; p = 0.99). The resulting model explained 72% of the variation in SOC10 content, and 89% of the variation in silvicultural condition after thinning (Figure 3).
In the resulting function model, it is possible to notice that SILV variables were more sensitive to climate and soil water content than CARB. Among the fixed characteristics, climate (CLIM) presented high negative influence in stand silvicultural characteristics (SILV), and negative significant indirect effect over SOC10 (z = 2.27, p < 0.05) but without significant direct effect. Higher values of evapotranspiration and lower values of temperature and hydric deficit were related with low values of stand characteristics after thinning (lower Gpos and Npos) (Figure S2, Supplementary Material). Treatments (TREAT) influenced positively in SOC10, meaning that lower intensities of thinning were related with high values of SOC10 (Figure S2, Supplementary Material).
Regarding site-dependent characteristics, the latent variable soil characteristics (SCHR) did not show significant influence over SOC10 or silvicultural response of the stand in the best model. Water availability in the soil (SWAV) was the latent variable with the highest positive influence over the dependent variable SOC10. Among the parameters selected for the construction of the latent variable, all of them except the total number of days under soil moisture stress, presented similar positive influence. On the other hand, climate and soil water availability did not present direct relationship but strongly covariate in the same sense for all the studied sites.
The species was significantly determinant in the results of SOC (F = 23.92, p < 0.001) but without interaction with the treatment (Two-way ANOVA Treatment:Species interaction; p > 0.05). When SOC10 was analysed for each species regarding the most influential characteristics identified in the SEM, there were significant differences in the trend between species (Figure 4). A significant increasing logarithmic relationship was found for Pinus sylvestris between SOC10 and Npos (F = 56.4; r2 = 0.45; p < 0.001) and SOC10 and Gpos (F = 48.38; r2 = 0.65; p < 0.001). Pinus halepensis showed a significant logarithmic adjustment with Gpos (F = 7.83; r2 = 0.23, p < 0.01) and marginally significant with Npos (F = 3.83; r2 = 0.13; p < 0.1), decreasing from lower values of x-axis to higher ones, a significant positive relationship between thinning intensity and SOC10 (F = 8.74; r2 = 0.25; p < 0.01), and a significant negative differences regarding treatment (F = 4.24; p < 0.05), with lower values of SOC10 in heavy thinning respect the control. Pinus nigra did not show significant adjustment with any variable, for logarithmic or linear regressions.

4. Discussion

The study of thinning treatments across a range of pine species and site conditions aids in the implementation of forest management for pine forest adaptation to climate change. Previous research in Pinus forests in Spain has combined dendrochronology, stable isotopes and growth productivity to quantify the impacts of thinning [23,28,59,60,61,62,63,64,65]. In accordance with those studies, silvicultural treatments provide evidence that intense thinning has the effect of reducing forest biomass but increasing tree growth per unit area (e.g., expressed as BAI). However, when also considering SOC, thinning only showed a significant positive effect on C sequestration for P. halepensis, but negative for P. sylvestris and P. nigra [26,28,66]. Our data suggest that the regulation of tree density improves tree growth performance in P. halepensis, P. nigra and P. sylvestris stands, although climate variables showed to have a stronger relationship with SOC10 than silvicultural treatments.

4.1. Effects of Thinning on Radial Growth

Growth and biomass variation related to thinning treatments have been one of the silvicultural principles. Thinning has shown a positive influence on tree growth per unit area in a variety of Pinus species across Spain (e.g., [25,59,64]). Heavy thinning (HT) resulted in the highest growth rates for all species, albeit the change in post-thinning BAI was greater in P. nigra and P. sylvestris than in P. halepensis, which only showed a modest rise in BAI when compared to BAI20. Previous research focused on the thinning effects in different pine species (e.g., [59,67,68]) found growth per unit area increment in the three Pinus species. P. nigra and P. sylvestris plots were located in more mesic sites, thus a possible higher tree water availability led by thinning was translated into a greater overall assimilation capacity, agreeing with the result of the SEM analysis, which showed high influence of soil water availability after thinning. Hence the post-thinning remaining trees at these mesic sites were more able to take advantage of the reduced competition pressure for resources than those trees in more arid sites [69].
In relative values, the better response of P. halepensis and P. nigra to heavy thinning respect to P. sylvestris might be due to their higher drought tolerance capacity in high-density stands [61,63]. P. sylvestris, a more drought-sensitive species, showed the highest growth increment when using light thinning (LT) which is in concordance with previous studies [70]. Low growth rates in dense and unthinned plots, on the other hand, indicate less drought resilience in high density stands, making these forests more susceptible to drought-induced dieback and mortality [65,71].

4.2. Thinning as a Tool to Optimize C Sequestration

Previous studies have shown contradictory effects of thinning on the increase in biomass and SOC in thinned plots, and thus, this silvicultural practice does not appear to have a clear effect on C sequestration [72]. Our results show that thinning reduced aboveground biomass, but this was not translated into a significant decrease in SOC. In fact, for P. halepensis the highest value of SOC was observed in the heavy thinning for both soil depths of 10 cm and 20 cm. Previous research has found that numerous pine species respond similarly to thinning treatments in terms of C sequestration related to a more conservative growth strategy for these species at high densities [73].
SEM showed that thinning influenced positively SOC10, which was also positively affected by silvicultural condition after thinning (density and basal area). Those results are consistent with previous studies showing the positive effects of the remaining trees in thinned stands on C sequestration. It is possible that this response was linked to the presence of logging residues with increased nutrient availability for growth and leaf formation [74,75,76]. We observed that in the thinned stands, growth per unit area (e.g., BAI) was higher, implying that thinning increases resource availability [77]. This effect was stronger in P. halepensis, the most drought-tolerant species, possibly because of a hydraulic adaptation that resulted in higher total water usage efficiency than in P. nigra and P. sylvestris [78,79,80].
There was also a negative correlation between climate variables (CLIM) and post-thinning silvicultural condition (SILV), and indirectly over SOC. This relationship was, on the other hand, positive with soil water availability (SWAV). The negative relationship between SOC and climate variables through post-thinning condition suggests that increasing stress over time (higher hydric deficit and annual mean temperature) may limit growth. This could be linked to tree-level reactions to reduced competition, particularly enhanced water availability, which is the most significant constraint to forest productivity in Mediterranean ecosystems. As a result, changes in water availability induced by reduced tree competition in dense stands may have a significant influence in these managed stands’ ability to store carbon. Due to more favourable gas-exchange and photosynthetic rates, trees with limited competition are more sensitive to water availability. Reduced competition boosts soil water content, soil-to-canopy hydraulic conductance, stomatal conductance, and photosynthetic rates in the near term, although it is unclear whether these effects persist over time [63]. Thinning may also raise water demand and increase transpiration of the remaining trees due to their larger leaf area, and stimulate understory vegetation development, also limiting soil water availability due to competition [69]. These long-term implications of thinning were not completely covered in this research, although the different response between the thinned and control stands appears to extend over time, corroborating the notion that the remaining trees have more growth resources (see [74] for a review).
This work brings together the results from different types of Mediterranean pine sites and species. Thinning has shown a species-related effect on total carbon sequestration (total biomass and soil organic carbon) but thinning improves the state of the remaining trees. The results are more promising for P. halepensis plantations due to a significant increase in SOC with thinning. Although results are not conclusive, this study shows that forest management can affect the SOC, even if it is subordinate to the soil water availability. In Mediterranean sites, it is common to observe contradictory results, since there are many limitations that interact at the same time (aridity, but also high and low temperatures, poor soil due to ancient practices, etc.).

5. Conclusions

One of the most serious issues confronting Pinus forests in southern Europe and other parts of the Mediterranean Basin is the lack of silvicultural treatments that could reduce climate-related mortality processes. Thinning could assist to minimize the effects of climate change on Mediterranean drought-sensitive Pinus species by boosting the availability of nutrients and water to the remaining trees. As a result, stand structure management may be able to modify C sequestration capacity, and various authors have stressed the importance of thinning on the C cycle. We add to this subject by providing a new example on the effects of silviculture on C sequestration. Thinning had a positive effect on growth per unit area in three ecologically different pine species across a climate gradient in the Iberian Peninsula. Our findings demonstrate that high-intensity thinning helped Pinus stands to increase their growth quickly, although climate variables showed to have a stronger relationship with SOC10 than silvicultural treatments. Soil parameters, on the other hand, had no significant influence on SOC10, with the latent variable soil water availability having the greatest influence on this variable. This study is a new addition that highlight the need for forest managers to integrate silviculture with carbon sequestration practices in Mediterranean pine forests. Despite its limited effect, thinning is the most important silvicultural technique for promoting steady adaptation of forest structure to climate change, especially creating low or very low dense forests, while decreasing tree mortality processes that cause long-term damage and broad social alarm.

Supplementary Materials

The following are available online at https://0-www-mdpi-com.brum.beds.ac.uk/article/10.3390/f13030450/s1, Figure S1. Correlation matrix computing the correlation coefficients between environmental and silvicultural variables with response indicators of interest. Features with high potential are identified by color legend. See variables description in Table 2. Figure S2. Structural Equation Model path with the standardized estimators of each variable (boxes) in the nodes (circles). Arrow labels show the standardized effects. Table S1. Site descriptions and characteristics of selected stands. Values are means ± SD. Table S2. Selected biomass models from SUR fitting statistics for softwood species [45]. Table S3. Environmental data used to predict the effect of thinning on soil C sequestration (SOC10).

Author Contributions

Conceptualization, R.M.N.-C., A.D.d.C., F.J.R.-G. and A.J.M.; methodology, R.M.N.-C. and F.J.R.-G.; validation, All authors; formal analysis, R.M.N.-C., F.J.R.-G., A.M.C.-V. and G.P.-R.; investigation, All authors; resources, A.D.d.C. and A.J.M.; data curation, All authors; writing—original draft preparation, R.M.N.-C., A.D.d.C., F.J.R.-G. and A.J.M.; writing—review and editing, All authors; visualization, All authors; supervision, R.M.N.-C.; project administration, A.D.d.C. and A.J.M.; funding acquisition, A.D.d.C. and A.J.M. All authors have read and agreed to the published version of the manuscript.

Funding

This research was collaborative funded by the following projects: SilvAdapt.net (RED2018-102719-T) funded by MCIN/AEI/10.13039/501100011033, Life-FOREST CO2 (LIFE14 CCM/ES/001271), ALTERACLIM (CGL2015-69773-C2-1-P), IN-ERTIA (PID2019-111332RB-C22-BDV), CEHYRFO-MED (CGL2017-86839-C3-2-R), RESILIENTFORESTS (LIFE17 CCA/ES/000063), TRANSHYMED (CGL2016-75957-R), AGL2017-83828-C2-2-R and ESPAS (CGL2015-65569-R), caRRRascal (RTI2018-095037-B-I00), TIMENUTRIENT (AGL2016-76463-P), and ISO-Pine (UCO-1265298). F.J.R.-G. was supported by a post-doctoral fellowship of the Junta de Andalucía (Spain) and the European Social Fund 2014-2020 Program (DOC_0055). A.J. Molina is beneficiary of an “APOSTD” fellowship (APOSTD/2019/111) funded by the Generalitat Valenciana. The information included reflects only the opinion of the authors and the European Commission/Agency is not responsible for any use that may be made of the information contained in this scientific paper.

Informed Consent Statement

Informed consent was obtained from all subjects involved in the study.

Data Availability Statement

The data that support the findings of this study are available on request from the last author, R.M.N.-C. The data are not publicly available due to project restrictions.

Acknowledgments

The authors thank the Andalucía Department of Agriculture and Environment, which provided access to and background information on the field site. We are very grateful to Francisco Pereña, Emidio Silveiro and Andrés Cortés for their valuable assistance during field work and data acquisition and processing; without them, this project would not have been possible. We also thank Marta Álvarez for guidance regarding interpretation of the soil data. We also acknowledge the institutional support of the University of Cordoba-Campus de Excelencia CeiA3.

Conflicts of Interest

The authors declare no conflict of interest. The funders had no role in the design of the study; in the collection, analyses, or interpretation of data; in the writing of the manuscript, or in the decision to publish the results.

References

  1. IPCC—International Panel of Climate Change. Contribution of Working Groups I, II and III to the Fifth Assessment Report of the Intergovernmental Panel on Climate Change. In Climate Change; IPCC—International Panel of Climate Change, Pachauri, R.K., Meyer, L.A., Eds.; Synthesis Report; IPCC: Geneva, Switzerland, 2014; p. 151. [Google Scholar]
  2. Olivier, J.G.J.; Peters, J.A.H.W. Trends in Global CO2 and Total Greenhouse Gas Emissions: Report 2019; PBL Netherlands Environmental Assessment Agency: The Hague, The Netherlands, 2020; p. 70. [Google Scholar]
  3. Six, J.; Callewaert, P.; Lenders, S.; De Gryze, S.; Morris, S.J.; Gregorich, E.G.; Paustian, K. Measuring and understanding carbon storage in afforested soils by physical fractionation. Soil Sci. Soc. Am. J. 2002, 66, 1981–1987. [Google Scholar] [CrossRef] [Green Version]
  4. Alemu, B. The role of forest and soil carbon sequestrations on climate change mitigation. Res. J. Agric. Environ. Manag. 2014, 3, 492–505. [Google Scholar]
  5. Pan, L.; Oldenburg, C.M.; Pruess, K.; Wu, Y.S. Transient CO2 leakage and injection in wellbore-reservoir systems for geologic carbon sequestration. Greenh. Gases Sci. Technol. 2011, 1, 335–350. [Google Scholar] [CrossRef]
  6. Domke, G.M.; Oswalt, S.N.; Walters, B.F.; Morin, R.S. Tree planting has the potential to increase carbon sequestration capacity of forests in the United States. Proc. Natl. Acad. Sci. USA 2020, 117, 24649–24651. [Google Scholar] [CrossRef] [PubMed]
  7. Bárcena, T.G.; Gundersen, P.; Vesterdal, L. Afforestation effects on SOC in former cropland: Oak and spruce chronosequences resampled after 13 years. Glob. Change Biol. 2014, 20, 2938–2952. [Google Scholar] [CrossRef]
  8. Palmero-Iniesta, M.; Pino, J.; Pesquer, L.; Espelta, J.M. Recent forest area increases in Europe: Expanding and regenerating forests differ in their regional patterns, drivers and productivity trends. Eur. J. For. Res. 2021, 140, 793–805. [Google Scholar] [CrossRef]
  9. Paquette, A.; Messier, C. The role of plantations in managing world’s forests in the Anthropocene. Front. Ecol. Environ. 2010, 8, 27–34. [Google Scholar] [CrossRef] [Green Version]
  10. Ciais, P.; Schelhaas, M.J.; Zaehle, S.; Piao, S.L.; Cescatti, A.; Liski, J.; Nabuurs, G.J. Carbon accumulation in European forests. Nat. Geosci. 2008, 1, 425–429. [Google Scholar] [CrossRef]
  11. Agyei, T.; Juráň, S.; Ofori-Amanfo, K.K.; Šigut, L.; Urban, O.; Marek, M.V. The impact of drought on total ozone flux in a mountain Norway spruce forest. J. For. Sci. 2020, 66, 278–280. [Google Scholar] [CrossRef]
  12. Solberg, S.; Dobbertin, M.; Reinds, G.J.; Lange, H.; Andreassen, K.; Fernandez, P.G.; de Vries, W. Analyses of the impact of changes in atmospheric deposition and climate on forest growth in European monitoring plots: A stand growth approach. For. Ecol. Manag. 2009, 258, 1735–1750. [Google Scholar] [CrossRef]
  13. Devi, N.M.; Kukarskih, V.V.; Galimova, A.A.; Mazepa, V.S.; Grigoriev, A.A. Climate change evidence in tree growth and stand productivity at the upper treeline ecotone in the Polar Ural Mountains. For. Ecosyst. 2020, 7, 7. [Google Scholar] [CrossRef] [Green Version]
  14. Yan, Y. Integrate carbon dynamic models in analyzing carbon sequestration impact of forest biomass harvest. Sci. Total Environ. 2018, 615, 581–587. [Google Scholar] [CrossRef]
  15. Valade, A.; Bellassen, V.; Magand, C.; Luyssaert, S. Sustaining the sequestration efficiency of the European forest sector. For. Ecol. Manag. 2017, 405, 44–55. [Google Scholar] [CrossRef]
  16. Jandl, R.; Lindner, M.; Vesterdal, L.; Bauwens, B.; Baritz, R.; Hagedorn, F.; Johnson, D.; Minkkinen, K.; Byrne, K. How strongly can forest management influence soil carbon sequestration? Geoderma. 2007, 15, 253–268. [Google Scholar] [CrossRef]
  17. Blanco, J.A.; Imbert, J.B.; Castillo, F.J. Adaptación al Cambio Climático en Pinares Pirenaicos: Controlando la Densidad del Rodal Según el Tipo de Clima. In Los Bosques y la Biodiversidad Frente al Cambio Climático: Impactos, Vulnerabilidad y Adaptación en España; Ministerio de Medio Ambiente: Madrid, Spain, 2015; pp. 565–572. [Google Scholar]
  18. Lado-Monserrat, L.; Lidón, A.; Bautista, I. Erratum to: Litterfall, litter decomposition and associated nutrient fluxes in Pinus halepensis: Influence of tree removal intensity in a Mediterranean forest. Eur. J. For. Res. 2016, 135, 203–214. [Google Scholar] [CrossRef] [Green Version]
  19. Fares, S.; Scarasia Mugnozza, G.; Corona, P.; Palahí, M. Sustainability: Five steps for managing Europe’s forests. Nat. News 2015, 519, 407. [Google Scholar] [CrossRef] [PubMed]
  20. Bombín, R.V. El mapa forestal de España escala 1: 50.000 (MFE50) como base del tercer inventario forestal nacional. Cuad. Soc. Española Cien. For. 2005, 19, 205–210. [Google Scholar]
  21. Vadell, E.; de-Miguel, S.; Pemán, J. Large-scale reforestation and afforestation policy in Spain: A historical review of its underlying ecological, socioeconomic and political dynamics. Land Use Policy 2016, 55, 37–48. [Google Scholar] [CrossRef]
  22. Alfaro-Sánchez, R.; Camarero, J.J.; López-Serrano, F.R.; Sánchez-Salguero, R.; Moya, D.; De Las Heras, J. Positive coupling between growth and reproduction in young post-fire Aleppo pines depends on climate and site conditions. Int. J. Wildland Fire 2015, 24, 507–517. [Google Scholar] [CrossRef] [Green Version]
  23. Navarro-Cerrillo, R.M.; Sánchez-Salguero, R.; Rodríguez, C.; Lazo, J.; Moreno-Rojas, J.; Palacios-Rodríguez, G.; Camarero, J.J. Is thinning an alternative when trees could die in response to drought? The case of planted Pinus nigra and P. sylvestris stands in southern Spain. For. Ecol. Manag. 2019, 433, 313–324. [Google Scholar] [CrossRef]
  24. Manrique-Alba, À.; Beguería, S.; Molina, A.J.; González-Sanchis, M.; Tomàs-Burguera, M.; Del Campo, A.D.; Camarero, J.J. Long-term thinning effects on tree growth, drought response and water use efficiency at two Aleppo pine plantations in Spain. Sci. Total Environ. 2020, 728, 138536. [Google Scholar] [CrossRef] [PubMed]
  25. Ruiz-Peinado, R.; Bravo-Oviedo, A.; López-Senespleda, E.; Montero, G.; Río, M. Do thinning influence biomass and soil carbon stocks in Mediterranean maritime pinewoods? Eur. J. For. Res. 2013, 132, 253–262. [Google Scholar] [CrossRef]
  26. Ruiz-Peinado, R.; Bravo-Oviedo, A.; Montero, G.; Del Río, M. Carbon stocks in a Scots pine afforestation under different thinning intensities management. Mitig. Adapt. Strateg. Glob. Change 2016, 21, 1059–1072. [Google Scholar] [CrossRef]
  27. Pregitzer, K.S.; Euskirchen, E.S. Carbon cycling and storage in world forests: Biome patterns related to forest age. Glob. Change Biol. 2004, 10, 2052–2077. [Google Scholar] [CrossRef]
  28. Zhang, X.; Guan, D.; Li, W.; Sun, D.; Jin, C.; Yuan, F.; Wu, J. The effects of forest thinning on soil carbon stocks and dynamics: A meta-analysis. For. Ecol. Manag. 2018, 429, 36–43. [Google Scholar] [CrossRef]
  29. Lal, R.; Smith, P.; Jungkunst, H.F.; Mitsch, W.J.; Lehmann, J.; Nair, P.R.; Ravindranath, N.H. The carbon sequestration potential of terrestrial ecosystems. J. Soil Water Conserv. 2018, 73, 145A–152A. [Google Scholar] [CrossRef] [Green Version]
  30. Krug, J.H. How can forest management increase biomass accumulation and CO2 sequestration? A case study on beech forests in Hesse, Germany. Carbon Balance Manag. 2019, 14, 17. [Google Scholar] [CrossRef] [PubMed]
  31. Johnson, D.W.; Curtis, P.S. Effects of forest management on soil C and N storage: Meta-analysis. For. Ecol. Manag. 2001, 140, 227–238. [Google Scholar] [CrossRef]
  32. Lal, R. Forest soils and carbon sequestration. For. Ecol. Manag. 2005, 220, 242–258. [Google Scholar] [CrossRef]
  33. Lal, R. Managing soils and ecosystems for mitigating anthropogenic carbon emissions and advancing global food security. BioScience 2010, 60, 108–721. [Google Scholar] [CrossRef]
  34. Prescott, C.E. Litter decomposition: What controls it and how can we alter it to sequester more carbon in forest soils? Biogeochemistry 2010, 101, 133–149. [Google Scholar] [CrossRef]
  35. Nave, L.; Vance, E.; Swanston, C.; Curtis, P. Harvest impacts on soil carbon storage in temperate forests. For. Ecol. Manag. 2010, 259, 857–866. [Google Scholar] [CrossRef]
  36. Blanco, J.A. Managing Forest soils for carbon sequestration: Insights from modeling forests around the globe. In Soil Management and Climate Change; Muñoz, M.Á., Zornoza, R., Eds.; Elsevier Inc.: Amsterdam, The Netherlands, 2018; pp. 237–252. [Google Scholar]
  37. Noormets, A.; Epron, D.; Domec, J.C.; McNulty, S.G.; Fox, T.; Sun, G.; King, J.S. Effects of forest management on productivity and carbon sequestration: A review and hypothesis. For. Ecol. Manag. 2015, 355, 124–140. [Google Scholar] [CrossRef] [Green Version]
  38. Ontl, T.A.; Janowiak, M.K.; Swanston, C.W.; Daley, J.; Handler, S.; Cornett, M.; Patch, N. Forest management for carbon sequestration and climate adaptation. J. For. 2020, 118, 86–101. [Google Scholar] [CrossRef] [Green Version]
  39. Tong, X.; Brandt, M.; Yue, Y.; Ciais, P.; Jepsen, M.R.; Penuelas, J.; Fensholt, R. Forest management in southern China generates short term extensive carbon sequestration. Nat. Commun. 2020, 11, 129. [Google Scholar] [CrossRef] [PubMed]
  40. Körner, C. A matter of tree longevity. Science 2017, 355, 130–131. [Google Scholar] [CrossRef] [PubMed]
  41. Serrada, R. (Ed.) Compendio de Selvicultura Aplicada en España; Instituto Nacional de Investigación y Tecnología Agraria y Alimentaria, Ministerio de Educación y Ciencia: Madrid, Spain, 2008.
  42. Molina, A.J.; Navarro-Cerrillo, R.M.; Pérez-Romero, J.; Alejano, R.; Bellot, J.F.; Blanco, J.A.; Camarero, J.J.; Carrara, A.; Castillo, V.M.; Cervera, T.; et al. SilvAdapt. Net: A Site-Based Network of Adaptive Forest Management Related to Climate Change in Spain. Forests 2021, 12, 1807. [Google Scholar] [CrossRef]
  43. Collalti, A.; Trotta, C.; Keenan, T.F.; Ibrom, A.; Bond-Lamberty, B.; Grote, R.; Vicca, S.; Reyer, C.P.O.; Migliavacca, M.; Veroustraete, F.; et al. Thinning can reduce losses in carbon use efficiency and carbon stocks in managed forests under warmer climate. J. Adv. Model. Earth Syst. 2018, 10, 2427–2452. [Google Scholar] [CrossRef] [PubMed] [Green Version]
  44. Ruiz-Peinado, R.; Oviedo, J.A.B.; Senespleda, E.L.; Oviedo, F.B.; del Río Gaztelurrutia, M. Forest management and carbon sequestration in the Mediterranean region: A review. For. Syst. 2017, 26, 10. [Google Scholar] [CrossRef]
  45. Ruiz-Peinado, R.; del Rio, M. New models for estimating the carbon sink capacity of Spanish softwood species. For. Syst. 2011, 20, 176–188. [Google Scholar] [CrossRef] [Green Version]
  46. Nelson, D.W.; Sommers, L.E. Total Carbon, Organic Carbon, and Organic Matter. Methods Soil Anal. Part 3 Chem. Methods 1996, 3, 961–1010. [Google Scholar]
  47. Post, W.M.; Kwon, K.C. Soil Carbon Sequestration and Land-Use Change: Processes and Potential. Glob. Change Boil. 2000, 6, 317–327. [Google Scholar] [CrossRef] [Green Version]
  48. Farina, R.; Marchetti, A.; Francaviglia, R.; Napoli, R.; di Bene, C. Modeling Regional Soil C Stocks and CO2 Emissions under Mediterranean Cropping Systems and Soil Types. Agric. Ecosyst. Environ. 2017, 238, 128–141. [Google Scholar] [CrossRef]
  49. Felicísimo, A.M. Impactos, Vulnerabilidad y Adaptación al Cambio Climático de la Biodiversidad Española. 1. Flora y Vegetación; Oficina Española de Cambio Climático, Ministerio de Medio Ambiente y Medio Rural y Marino: Madrid, Spain, 2011.
  50. De Cáceres, M.; Martin, N.; Granda, V.; Cabon, A. Meteoland: Landscape Meteorology Tools. R package Version 0.7.1. 2018. Available online: https://cran.r-project.org/web/packages/meteoland/meteoland.pdf (accessed on 21 September 2021).
  51. Esri ArcGIS Resources Online. Geoprocessing Tool Reference 2011. Available online: https://desktop.arcgis.com/es/arcmap/latest/tools/main/a-quick-tour-of-geoprocessing-tool-references.htm (accessed on 21 September 2021).
  52. Zuur, A.; Ieno, E.; Walker, N.; Saveliev, A.; Smith, G. Mixed Effects Models and Extensions in Ecology with R; Springer: New York, NY, USA, 2009; pp. 246–250. [Google Scholar]
  53. Sokal, R.R.; Rohlf, F.J. Biometry: The Principles and Practices of Statistics in Biological Research; W. H. Freeman and Company: New York, NY, USA, 1995. [Google Scholar]
  54. Mueller, R.O.; Hancock, G.R. Structural Equation Modeling; Routledge: New York, NY, USA; Taylor & Francis Group: Abingdon, UK, 2019. [Google Scholar]
  55. Finch, W.H.; French, B.F. Latent Variable Modeling with R; Routledge: New York, NY, USA, 2015. [Google Scholar]
  56. Rosseel, Y. Lavaan: An R package for structural equation modeling and more. Version 0.5–12 (BETA). J. Stat. Softw. 2012, 48, 1–36. [Google Scholar] [CrossRef] [Green Version]
  57. Epskamp, S.; Epskamp, M.S. MplusAutomation, Package ‘semPlot’. R Package Version, 1. 2019. Available online: https://www.scirp.org/(S(i43dyn45teexjx455qlt3d2q))/reference/referencespapers.aspx?referenceid=3012616 (accessed on 21 September 2021).
  58. R Core Team. R: A Language and Environment for Statistical Computing; R Foundation for Statistical Computing: Vienna, Austria, 2020. [Google Scholar]
  59. Martín-Benito, D.; Del Río, M.; Heinrich, I.; Helle, G.; Cañellas, I. Response of climate-growth relationships and water use efficiency to thinning in a Pinus nigra afforestation. For. Ecol. Manag. 2010, 259, 967–975. [Google Scholar] [CrossRef]
  60. Pérez-de-Lis, G.; García-González, I.; Rozas, V.; Arévalo, J.R. Effects of thinning intensity on radial growth patterns and temperature sensitivity in Pinus canariensis afforestations on Tenerife Island, Spain. Ann. For. Sci. 2011, 68, 1093–1104. [Google Scholar] [CrossRef] [Green Version]
  61. Moreno-Gutiérrez, C.; Dawson, T.E.; Nicolás, E.; Querejeta, J.I. Isotopes reveal contrasting water use strategies among coexisting plant species in a Mediterranean ecosystem. New Phytol. 2012, 196, 489–496. [Google Scholar] [CrossRef] [PubMed]
  62. Navarro-Cerrillo, R.M.; Duque-Lazo, J.; Rodríguez-Vallejo, C.; Varo-Martínez, M.; Palacios-Rodríguez, G. Airborne laser scanning cartography of on-site carbon stocks as a basis for the silviculture of Pinus halepensis plantations. Remote Sens. 2018, 10, 1660. [Google Scholar] [CrossRef] [Green Version]
  63. Fernandes, T.J.; Del Campo, A.D.; Herrera, R.; Molina, A.J. Simultaneous assessment, through sap flow and stable isotopes, of water use efficiency (WUE) in thinned pines shows improvement in growth, tree-climate sensitivity and WUE, but not in WUEi. For. Ecol. Manag. 2016, 361, 298–308. [Google Scholar] [CrossRef]
  64. del Río, M.; Barbeito, I.; Bravo-Oviedo, A.; Calama, R.; Cañellas, I.; Herrero, C.; Bravo, F. Mediterranean pine forests: Management effects on carbon stocks. In Managing Forest Ecosystems: The Challenge of Climate Change; Springer: Cham, Switzerland, 2017; pp. 301–327. [Google Scholar]
  65. Jiménez, M.N.; Navarro, F.B.; Sánchez-Miranda, A.; Ripoll, M.A. Using stem diameter variations to detect and quantify growth and relationships with climatic variables on a gradient of thinned Aleppo pines. For. Ecol. Manag. 2019, 442, 53–62. [Google Scholar] [CrossRef]
  66. Alvarez, S.; Ortiz, C.; Díaz-Pinés, E.; Rubio, A. Influence of tree species composition, thinning intensity and climate change on carbon sequestration in Mediterranean mountain forests: A case study using the CO2Fix model. Mitig. Adapt. Strateg. Glob. Change 2016, 21, 1045–1058. [Google Scholar] [CrossRef]
  67. Mäkinen, H.; Isomäki, A. Thinning intensity and growth of Norway spruce stands in Finland. Forestry 2004, 77, 349–364. [Google Scholar] [CrossRef] [Green Version]
  68. Del Campo, A.D.; González-Sanchis, M.; Molina, A.J.; García-Prats, A.; Ceacero, C.J.; Bautista, I. Effectiveness of water-oriented thinning in two semiarid forests: The redistribution of increased net rainfall into soil water, drainage and runoff. For. Ecol. Manag. 2019, 438, 163–175. [Google Scholar] [CrossRef]
  69. Sohn, J.A.; Saha, S.; Bauhus, J. Potential of forest thinning to mitigate drought stress: A meta-analysis. For. Ecol. Manag. 2016, 380, 261–273. [Google Scholar] [CrossRef]
  70. González de Andrés, E.; Camarero, J.J.; Blanco, J.A.; Imbert, J.B.; Lo, Y.H.; Sangüesa-Barreda, G.; Castillo, F.J. Tree-to-tree competition in mixed European beech-Scots pine forests has different impacts on growth and water-use efficiency depending on site condition. J. Ecol. 2018, 106, 59–75. [Google Scholar] [CrossRef] [Green Version]
  71. Sánchez-Salguero, R.; Navarro-Cerrillo, R.M.; Swetnam, T.W.; Zavala, M.A. Is drought the main decline factor at the rear edge of Europe? The case of southern Iberian pine plantations. For. Ecol. Manag. 2012, 271, 158–169. [Google Scholar] [CrossRef]
  72. Kaarakka, L.; Cornett, M.; Domke, G.; Ontl, T.; Dee, L.E. Improved forest management as a natural climate solution: A review. Ecol. Solut. Evid. 2021, 2, e12090. [Google Scholar] [CrossRef]
  73. Navarro-Cerrillo, R.M.; Rodriguez-Vallejo, C.; Silveiro, E.; Hortal, A.; Palacios-Rodríguez, G.; Duque-Lazo, J.; Camarero, J.J. Cumulative drought stress leads to a loss of growth resilience and explains higher mortality in planted than in naturally regenerated Pinus pinaster stands. Forests 2018, 9, 358. [Google Scholar] [CrossRef] [Green Version]
  74. Bradley, R.L.; Kimmins, J.P.; Martin, W.L. Post-clearcutting chronosequences in the B.C. Coastal Western Hemlock Zone: II. Tracking the assart flush. J. Sustain. For. 2002, 14, 23–43. [Google Scholar] [CrossRef]
  75. Matsushima, M.; Chang, S.X. Effects of understory removal, N fertilization, and litter layer removal on soil N cycling in a 13-year-old white spruce plantation infested with Canada bluejoint grass. Plant Soil 2007, 292, 243–258. [Google Scholar] [CrossRef]
  76. Hedo de Santiago, J.; Lucas-Borja, M.E.; Wic-Baena, C.; Andrés-Abellán, M.; de las Heras, J. Effects of thinning and induced drought on microbiological soil properties and plant species diversity at dry and semiarid locations. Land Degrad. Dev. 2016, 27, 1151–1162. [Google Scholar] [CrossRef]
  77. Seibt, U.; Rajabi, A.; Griffiths, H.; Berry, J.A. Carbon isotopes and water use efficiency: Sense and sensitivity. Oecologia 2008, 155, 441–454. [Google Scholar] [CrossRef] [PubMed]
  78. Vayreda, J.; Martinez-Vilalta, J.; Gracia, M.; Retana, J. Recent climate changes interact with stand structure and management to determine changes in tree carbon stocks in Spanish forests. Glob. Change Biol. 2012, 18, 1028–1041. [Google Scholar] [CrossRef]
  79. Fernandez-de-Una, L.; Cañellas, I.; Gea-Izquierdo, G. Stand competition determines how different tree species will cope with a warming climate. PLoS ONE 2015, 10, e0122255. [Google Scholar] [CrossRef] [Green Version]
  80. del Castillo, J.; Comas, C.; Voltas, J.; Ferrio, J.P. Dynamics of competition over water in a mixed oak-pine Mediterranean forest: Spatio-temporal and physiological components. For. Ecol. Manag. 2016, 382, 214–224. [Google Scholar] [CrossRef] [Green Version]
Figure 1. Distribution of Pinus thinning plots over the vegetation map of Spain over the layout of forest types presented in [38]. European beech forests (Beech), Oak and mixed broad-leaved species forests (Oakmix), Silver fir forests (Fir), Eurosiberian pine forests (Eupin), Marcescent oak forests (Oakmarc), Oak and cork oak forests (Oak), Mediterranean pine forests (Medpin), Juniper forests (Jun), Spanish fir forests (FirSp), River forests (River), Forests of birch, hollies, hazel, linden and aspen trees (Sing) and other forests non included in the other categories (Others). Pinus halepensis (n = 3 plots, red), P. nigra (n = 3 plots, blue) and P. sylvestris (n = 4 plots, green), other lots of SilvaAdapt non included on this study (n = 2, white).
Forests 13 00450 g001
Figure 2. Conceptual model for relationships between environmental variables, site variables and carbon content. Regular arrows show direct effects, and dashed line indicates indirect effects.
Forests 13 00450 g002
Figure 3. Structural Equation Model path describing the effects of multiple predictors in carbon stock and dasometric variables after treatments. Only significant effects or covariances were showed. Nodes represent different categories of predictors and endogenous variables: CLIM = Climatic variables; SWAV = Soil water availability; TREAT = Treatment variables; SILV = Silvicultural status of forest after treatment; CARB = SOC10. The ellipsoid of CARB does not represent a latent variable. Boxes represent the R2 values for the explained variance of dependent variables. Red arrows mean negative effect. Green arrows mean positive effect. Double-headed pivot arrows mean covariance between groups of variables. Arrow labels show standardized effects magnitude. χ2 Model represents the parameters for the model fit, and χ2 User represents the parameters for the comparison between variances of the model and the dataset.
Forests 13 00450 g003
Figure 4. Soil Organic Carbon (SOC10, 0–10 cm) relationships with dasometric variables after treatments (a,b) (Npos = density tree ha−1, Gpos = basal area, m2 ha−1), thinning intensity (% of basal area removed) c) and treatment (CT = unthinned, LT = light thinning, HT = heavy thinning) (d). PH = Pinus halepensis; PN = Pinus nigra; PSI = Pinus sylvestris. Smoothed areas around regression lines show Standard Error interval. (a,b) shows regression of SOC10 for log2(Npos) and log2(Gpos) respectively. (d) shows linear regression of SOC10 for thinning intensity.
Forests 13 00450 g004
Table 1. Silvicultural characteristics, biomass, soil organic carbon stocks and Basal Area Index (BAI, cm2) of Pinus halepensis (n = 3 plots), P. nigra (n = 3 plots) and P. sylvestris (n = 4 plots) plantations according to the thinning intensity (CT, Control or unthinned plots; LT, light thinning, 30–40% basal area removed; HT, heavy thinning, 50–60% of basal area removed) at several locations along a latitudinal gradient in Spain. Post thinning variables and abbreviations: stem density (D, trees ha−1); diameter at breast height (dbh, cm); basal area (G, m2 ha−1), post-thinning dbh increment (Δdbh, cm), aboveground (Wa) and total biomass C stock (Wt, Mg C ha−1), Soil Organic Carbon stock (SOCdepth–S, Mg C ha−1) and Basal Area Index (BAI, cm2) and in the last 20 years (BAI20, cm2). Values are means ± SE. Different letters indicate significant post-hoc differences between thinning treatments at p = 0.05 based on Tukey test for comparison of multiple means.
SpecieThinningDDbhGWaWtSOC10SOC20SOC10–20BAI20BAI
P. halepensisCT1477.30(102.59)14.44(1.63)24.90(3.92) a68.45(8.52) a94.54(22.86)11.79(1.02) c12.72(0.71) c24.52(1.33) c2.10(0.59)2.40(0.88)
LT754.30(40.63)16.63(1.90)16.07(2.80) ab46.21(9.98) b64.11(16.82)17.86(1.16) b18.10(1.88) b35.96(2.86) b3.60(0.92)3.73(0.98)
HT557.30(47.66)17.44(2.08)12.03(1.94) b35.95(9.69) b49.99(12.52)27.30(3.63) a23.42(4.28) a50.72(7.85) a3.75(1.03)4.20(1.06)
P. nigraCT698.50(77.25)15.16(0.83)18.26(5.24)74.65(24.32)87.10(26.78)6.40(0.90)5.97(0.70)12.69(1.78)3.42(0.43)
LT475.75(38.58)15.28(1.05)13.66(4.18)48.51(13.47)56.98(14.90)5.38(0.66)6.79(1.01)12.41(1.80)4.35(0.96)4.95(1.03)
HT401.00(20.74)16.78(0.56)8.66(0.16)47.39(16.02)56.12(17.43)5.51(1.46)6.10(0.42)11.62(1.78)4.93(1.22)5.60(0.97)
P. sylvestrisCT2666.11(498.38)16.06(1.02)46.21(9.13)171.48(31.00)192.40(17.54)31.75(5.13)15.52(5.83)29.89(9.19)6.04(0.90)
LT1474.33(244.18)18.09(1.01)34.84(6.72)143.79(26.07)160.43(20.92)33.28(6.38)7.59(1.86)16.17(3.99)6.83(0.86)7.07(0.83)
HT1053.89(168.48)17.81(1.02)25.92(5.95)112.18(22.24)143.51(20.55)30.83(5.02)17.09(7.42)31.01(12.65)6.55(0.60)7.29(0.66)
Table 2. Environmental data used to predict the effect of thinning on soil C sequestration (SOC10) after the PCA selection for the construction of latent variables.
VariableDescriptionUnits
Soil water availability (SWAV)
wnmean annual soil moisturemm
SM90max. annual soil volumetric water content calculated as the 90 quantile of daily% vol.
SM50wiegthed mean soil volumetric water content calculated as the 50 quantile of daily% vol.
theta_ssaturated soil volumetric water content% vol.
theta_rsaturated soil volumetric water content% vol.
doy_stresstotal number of days under soil moisture stressdays
Climatic characteristics (CLIM)
ea_nannual actual evapotranspirationmm
tairMean annual temperature (air)°C
deficitHydric deficitmm
Soil chemical and physical characteristics (SCHR)
pH Unitless
Bulk_densityBulk soil densityg cm−3
CEC
Silvicultural characteristics (SILV)
NposDensity of the plot 10 years after thinning?Trees ha−1
GPosBasal area of the plot 10 years after thinningm2 ha−1
Thinning (TREAT)
TRThinning factor (intensity)Unitless
IntensityPercentage of trees%
Table 3. Selection of exogenous variables for the SEM analysis, carried out through Principal Component Analysis (PCA). # comp.: Number of components retained for the PCA optimum solution without rotation (eigenvalue above 1). Cum. Var.: Percentage of the variance of the dataset explained by the retained components (eigenvalue above 1). SWAV = Soil water availability; CLIM = Climatic characteristics; SCHR = Soil characteristics, SILV = Silvicultural characteristics after treatment. See Table 2 for variables description.
Selected Variables# Comp.Cum. Var.
SWAV =~ wn + SM90 + SM50 + theta_s + theta_r + doy_stress190.61%
CLIM =~ ea_n + tair + déficit179.07%
SCHR =~ pH + Bulk_density + CEC189.72%
SILV =~ Npos + Gpos 191.31%
TREAT =~ TR + IntensityN/A
Publisher’s Note: MDPI stays neutral with regard to jurisdictional claims in published maps and institutional affiliations.

