Article

Effect of Two Exogenous Organic Acids on the Excitation Effect of Soil Organic Carbon in Beijing, China

1
The Key Laboratory for Silviculture and Conservation of Ministry of Education, College of Forestry, Beijing Forestry University, Beijing 100083, China
2
Ordos Branch Station, Inner Mongolia Autonomous Region Environmental Monitoring General Station, Ordos 017000, China
*
Author to whom correspondence should be addressed.
Submission received: 6 December 2021 / Revised: 12 January 2022 / Accepted: 14 January 2022 / Published: 21 March 2022
(This article belongs to the Special Issue Forest Soil Carbon and Climate Changes)

Abstract

:
Significance: The study of the effects and pathways of catechol and pyrogallic acid on soil organic carbon mineralization has a positive effect on mastering soil carbon transformation. Methods and objectives: In this study, we took 0–20 cm soil from Pinus tabulaeformis forest as an object to investigate the effects of catechol and pyrogallic acid with different concentrations on soil organic carbon mineralization through a 60-day mineralization incubation test. The soil active carbon content and changes in soil microbial diversity and community composition were analyzed by using single exponential fitting, quantitative PCR, and high-throughput sequencing to explore the influencing mechanisms of catechol and pyrogallic acid on soil organic carbon excitation. Results: Catechol and pyrogallic acid had the effect of enhancing the soil organic carbon mineralization and soil active carbon content, and the higher the concentration, the stronger the enhancement effect. Catechol reduced the Ace index, Chao1 index, and Shannon index of bacteria and fungi, and further changed the relative abundance of two dominant groups (Proteobacteria and Acidobacteriota) in bacteria and Basidiomycota in fungi at high concentrations. There was no obvious regularity in the effects of pyrogallic acid on bacteria and fungi, but the Ace index and Chao1 index of bacteria underwent drastic and disordered changes. Conclusions: Catechol and pyrogallic acid can trigger positive excitation of the soil organic carbon through two pathways: increasing the soil active carbon content and modulating soil microorganisms, but the way they modulate soil microorganisms are different. Catechol regulates soil microorganisms by reducing the number, richness, and evenness of the bacteria and fungi species, as well as the community composition, while the way pyrogallic acid regulates only closely relates to the changes in the number, richness, and evenness of bacteria species.

1. Introduction

Soil is the largest pool of organic carbon in terrestrial ecosystems. The research on the input and output of soil organic carbon plays a positive role in understanding and grasping the carbon balance and carbon cycle of ecosystems. Soil organic carbon mineralization is an important method of carbon output of the soil organic carbon pool, and also an important factor affecting regional carbon balance and the carbon cycle. Therefore, some researchers have carried out in-depth studies on this issue in various aspects and have made good progress [1,2,3,4], among which the excitation effect of soil organic carbon is one of the important research results.
It has been found that organic acids are important control factors for soil organic carbon excitation. Some organic acids can regulate soil organic matter decomposition through abiotic pathways, such as complexation, solubilization of organic carbon in the activated mineral-bound state, promotion of cellulose depolymerization, and participation in structural rearrangement of humic materials [5,6,7], but few studies have been conducted. Many studies have focused on biotic pathway regulation, exploring the interrelationship between organic acid–soil microbial–soil organic matter excitation. For example, a study found that a phenolic acid mixture of protocatechuic acid, p-coumaric acid, p-hydroxybenzoic acid, ferulic acid, and catechol as additional carbon sources can activate microorganisms to trigger positive excitation [8]. Low concentrations of 2,4-di-tert-butylphenol and coumaric acid as exogenous carbon sources can produce selective stimulatory effects on fungi, altering the structural diversity of fungal communities and causing positive excitation effects [9]. However, high concentrations can inhibit microbial activity and growth, leading to negative excitation [9]. High concentrations of benzoic acid, ferulic acid, vanillin, and p-hydroxybenzoic acid mixtures may inhibit soil microbial activity and reduce soil organic carbon mineralization processes due to their own biotoxicity or by causing a low soil pH [10].
It has been proven that organic acids can induce excitation effects and control the direction and intensity of excitation by affecting soil microorganisms [11,12,13,14,15], but some findings lack deeper explanations. One study argued that low concentrations of 2,4-di-tert-butylphenol and vanillic acid can alter the structural diversity of fungal communities, but have little effect on the relative abundance of bacteria [9], but another study suggested that the addition of oxalic acid can alter the community composition of bacterial flora [5]. Bengtson et al. [16] and Rouatt et al. [13] argued that root exudates containing high levels of organic acids induce excitation effects by altering microbial populations, inducing an excitation effect. In contrast, Graaff et al. [17] and Cheng et al. [18] suggested that root exudates only enhance soil organic carbon turnover by stimulating microbial activity. Therefore, more extensive research is needed regarding the effect of organic acids on the excitation effect and the pathways regulating microorganisms.
Pinus tabulaeformis is one of the main tree species for afforestation in northern China, with an area of 161 × 104 hm2. Its soil organic carbon content and dynamics are important factors affecting the soil carbon cycle. Catecheol and pyrogallic acid are the main components of root exudates of Pinus tabulaeformis. However, the influencing mechanism, regulation pathway, and action intensity of catecheolic acid and pyrogallic acid on soil organic carbon excitation in Pinus tabulaeformis forests are still unclear, which restricts the understanding and grasp of the soil organic carbon cycle in the Pinus tabulaeformis forest. Thus, in this study, we took 0–20 cm soil from Pinus tabulaeformis forest as an object to investigate the effects of catechol and pyrogallic acid, with different concentrations on the soil organic carbon excitation through indoor culture and a single index fitting method, and analyzed the changes in soil microbial quantity, abundance, and community structure, as well as the association between excitation effects and soil microorganisms by high-throughput sequencing to provide a basis for exploring the mechanisms driving the evolution of soil organic carbon in Pinus tabulaeformis forests.

2. Materials and Methods

2.1. Soil Sample Collection and Processing

Three 20 m × 20 m standard plots were set in an artificial pine forest in Beijing Songshan National Nature Reserve, and 0–20 cm mixed soil samples were collected according to the “S” sampling method. After air-drying, the samples were sieved through 2 mm sieve and used for an organic carbon mineralization culture experiment.

2.2. Indoor Analysis

2.2.1. Soil CO2 Cumulative Release Amount Determination Method

First, 10 mL of 0 mol/L, 0.005 mol/L, 0.01 mol/L, 0.1 mol/L, 0.5, and 1 mol/L catechol and pyrogallic acid solutions were added into a culture flask containing 100 g soil, respectively, and the soil CO2 cumulative release amount was determined by the soil indoor culture method and alkali absorption method [19].

2.2.2. Soil Microbial Diversity Determination Method

Soil samples were collected from mineralization bottles on the 30th and 60th day of the mineralization culture to determine the soil microbial diversity and community composition.
Soil microbial DNA samples were extracted by the Fast DNA SPIN (MP Biomedicals, Santa Ana, CA, USA) method, the DNA mass was extracted using 2% agarose gel electrophoresis, and the DNA was quantified by NanoDrop 2000 ultra-micro spectrophotometer (Themo Fisher Scientific, Inc., Waltham, MA, USA). Quantification was performed. The bacterial genome V3-V4 region was amplified using primer 338F (5′-ACTCCTACGGGAGGCAGCAG-3′) and reverse primer 806R (5′-GGACTACHVGGGTWTCTAAT-3′) was amplified, and the fungal ITS1F region was amplified using the forward primer (5′-CTTGGTCATTTAGAGGAAGTAA-3′) and the reverse primer ITS2R (5′-GCTGCGTTCTTCATCGATGC-3′), which were processed for amplification, and the amplification products were recovered and purified, fluorescently quantified, and sequenced on the Illumina MiSeq platform. QIIME3 (v1.9.1, http://qiime.org/install/index.html (accessed on 21 December 2020)) was applied to determine the valid sequences for identification. The most abundant sequences in OTU were selected as representative sequences, and BLAST was applied to classify the representative sequences. Bacteria and fungi were identified using the GreenGenes database (v135, http://greengenes.secondgenome.com/ (accessed on 21 December 2020)) and UNITE database (v8.0, https://unite.ut.ee/ (accessed on 21 December 2020)), respectively. Community diversity indicators of bacteria and fungi included the Ace index, Chao1 index, and Shannon index.

2.3. Fitting the Equations for the Soil Organic Carbon Mineralization Process

The process of soil organic carbon mineralization was fitted using Stanford and Smith’s first-order kinetic equation [20]:
Cmin = C0 (1 − e−kt)
where Cmin means the cumulative release of soil CO2 after t time (g/kg), C0 means the soil active carbon content (g/kg), and k means the active carbon turnover rate (d−1).

2.4. Data Analysis

Excel 2007 and SPSS 17.0 were used for the statistical analysis of the data. Pearson correlation coefficient was used to evaluate the correlation between CO2 cumulative release and the soil microbial diversity index. The process of soil organic carbon mineralization was fitted by Origin 8.6 software.

3. Results

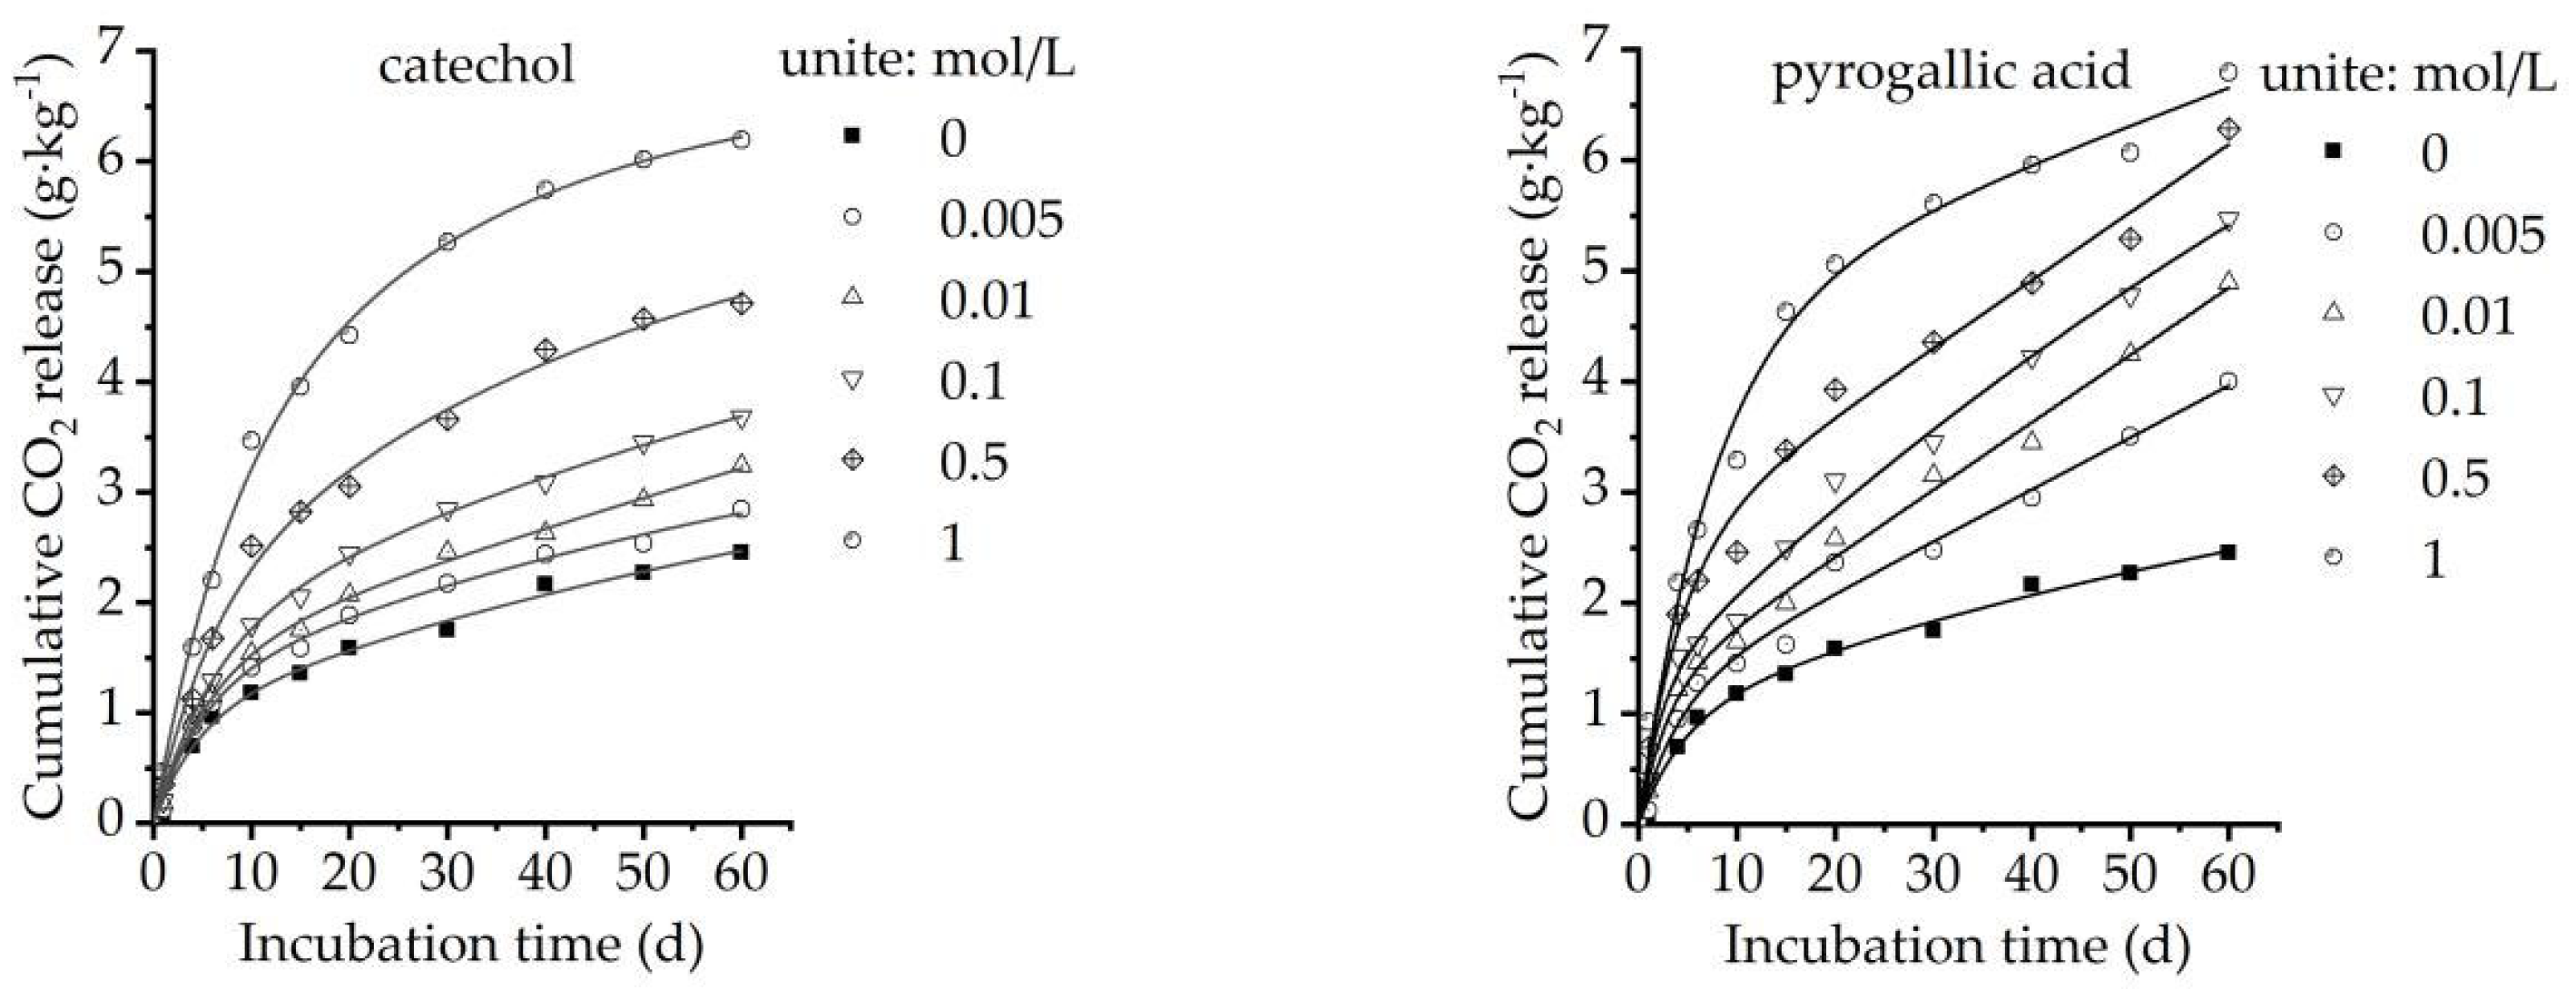
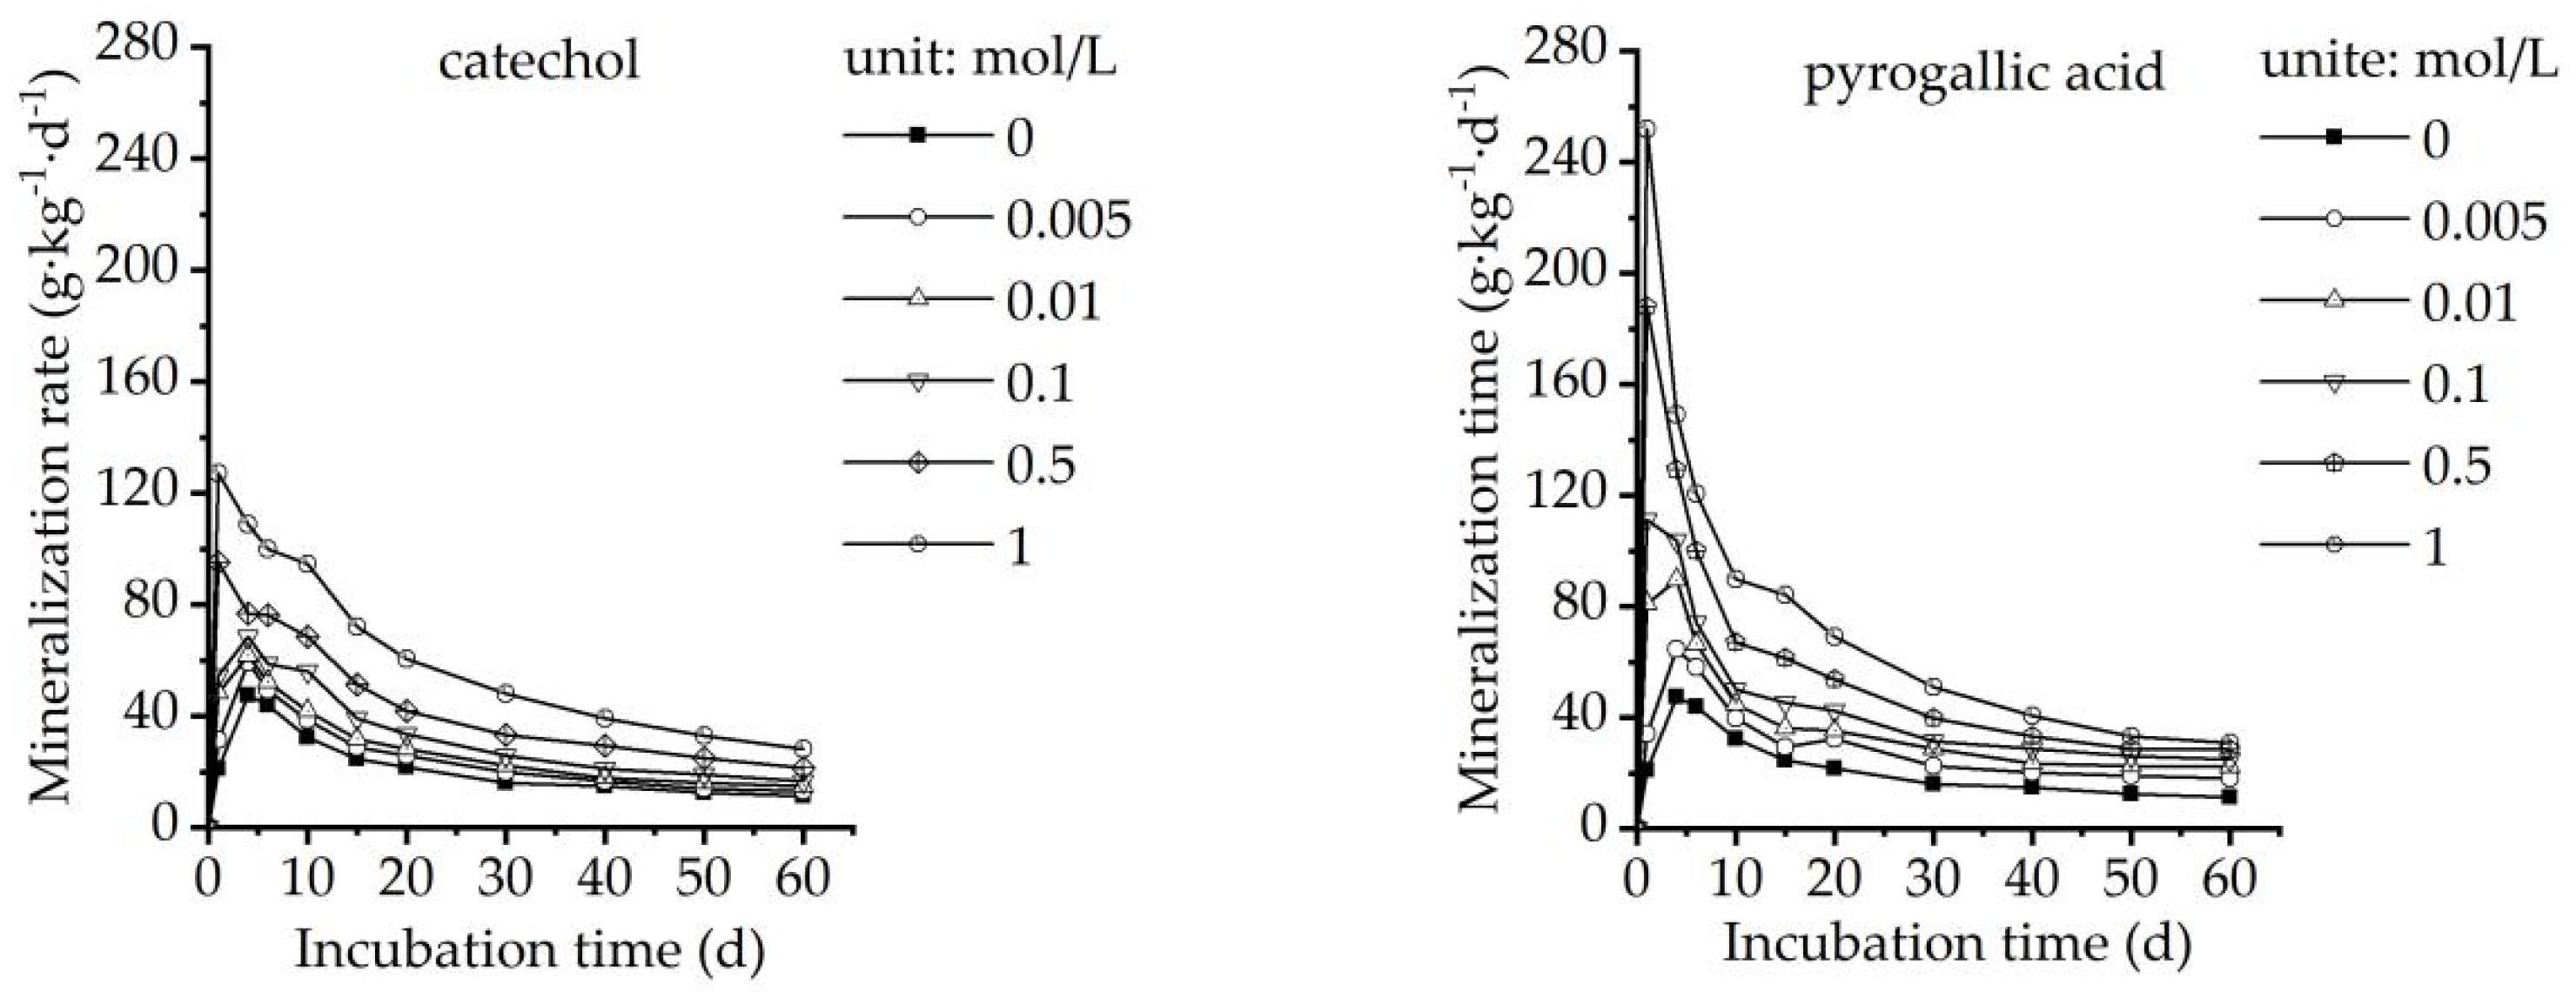
3.1. Effect of Organic Acids on Soil Organic Carbon Mineralization

The mono-exponential model fit the mineralization curve of the soil organic carbon well and was used to calculate the soil active carbon content [21,22,23,24]. The R2 of the fitting results in this study reached 0.969–0.995, which was a good fit (Figure 1).
The cumulative CO2 release of both organic acids showed a trend of rapid increase at the early stage and a moderate change at the later stage, and an increase with the increasing concentration and incubation time. At the early stage of mineralization incubation (1–6 days), the cumulative CO2 release at low concentrations (0.005–0.01 mol/L) showed an increasing trend, but the increase was not significant, and thereafter, there was a significant concentration change. However, at the early stage of mineralization at high concentrations (0.1–1.0 mol/L), the cumulative CO2 release was already significantly higher than that of the no-addition and low concentration treatments.
The cumulative CO2 release of pyrogallic acid was greater than that of catechol at the same concentration for the same incubation time. The cumulative CO2 release of pyrogallic acid was 3.26 g/kg, 4.08 g/kg, 4.85 g/kg, 5.99 g/kg, and 6.80 g/kg for each concentration after 60 days of incubation, all higher than that of catechol at the same concentration (Figure 1).
The mineralization rates of the two organic acids showed the same trend. The peak was reached rapidly around 1–5 days of incubation and decreased thereafter. The mineralization rate tended to be the same for all concentrations on day 60, and the mineralization rate increased with the concentration. The effect of pyrogallic acid on the mineralization rate was greater than that of catechol at the same concentration, with peak mineralization rates of 64.60–252.00 g/(kg × d) for pyrogallic acid in the range of 0.005–1.0 mol/L, higher than that of catechol at 59.38–127.20 g/(kg × d) (Figure 2), especially at high concentrations, which could reach more than twice that of catechol.

3.2. Effect of Organic Acids on the Active Carbon Content of the Soil

The active carbon content of soil increased with the increasing concentration. The active carbon content of catechol and pyrogallic acid soil increased from 2.35 g/kg (no addition) to 6.12 g/kg and 6.43 g/kg, and both organic acids served to increase the soil active carbon content.
At day 60 of incubation, the ratios of soil active carbon content to cumulative CO2 release were 0.93–0.99 (catechol) and 0.95–1.11 (pyrogallic acid), respectively, and the active carbon in the soil was basically consumed completely, and microorganisms were forced to start decomposing the refractory organic carbon, the decomposition rate decreased [25], and the mineralization process began to enter a slow decomposition stage (Table 1 and Figure 2).

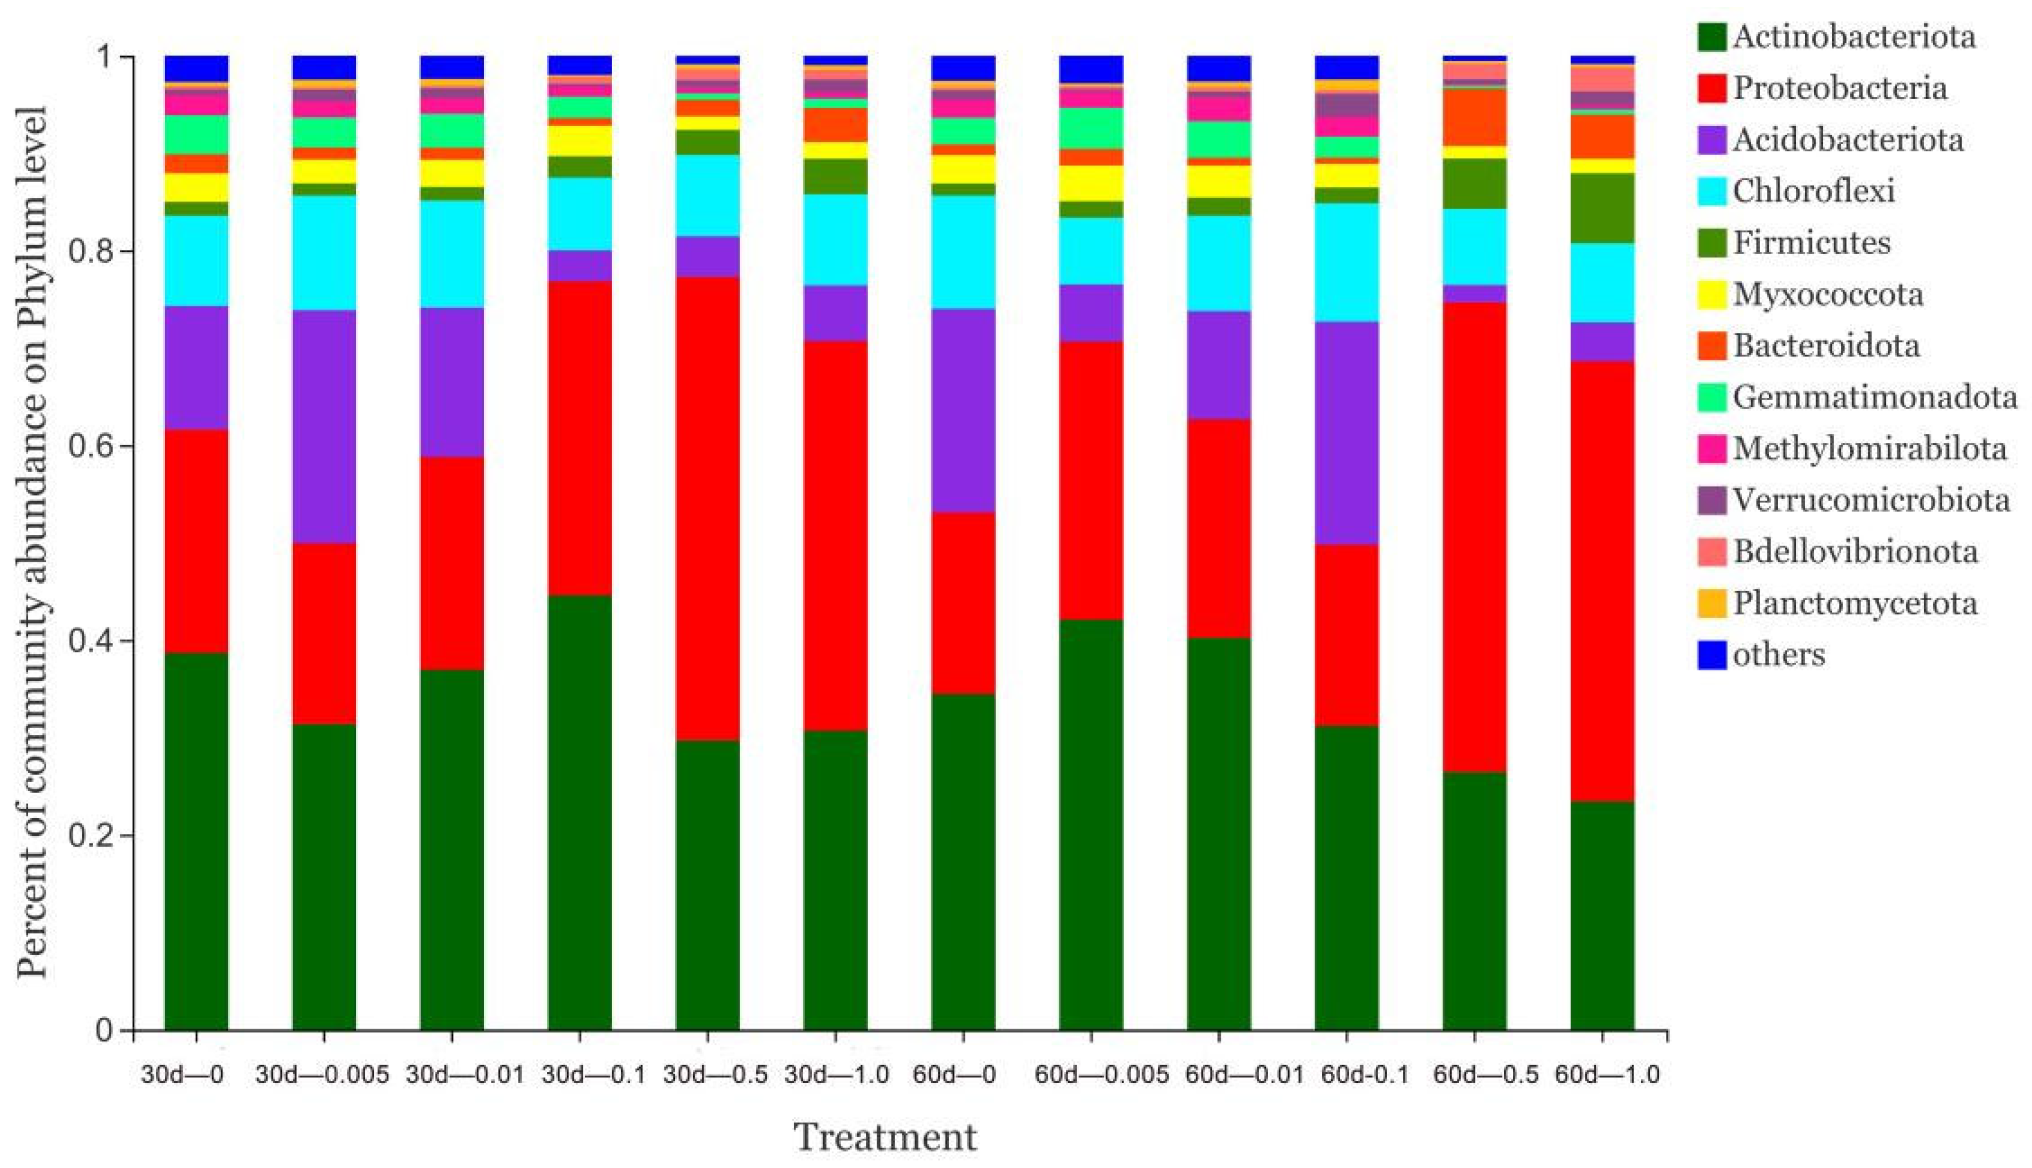
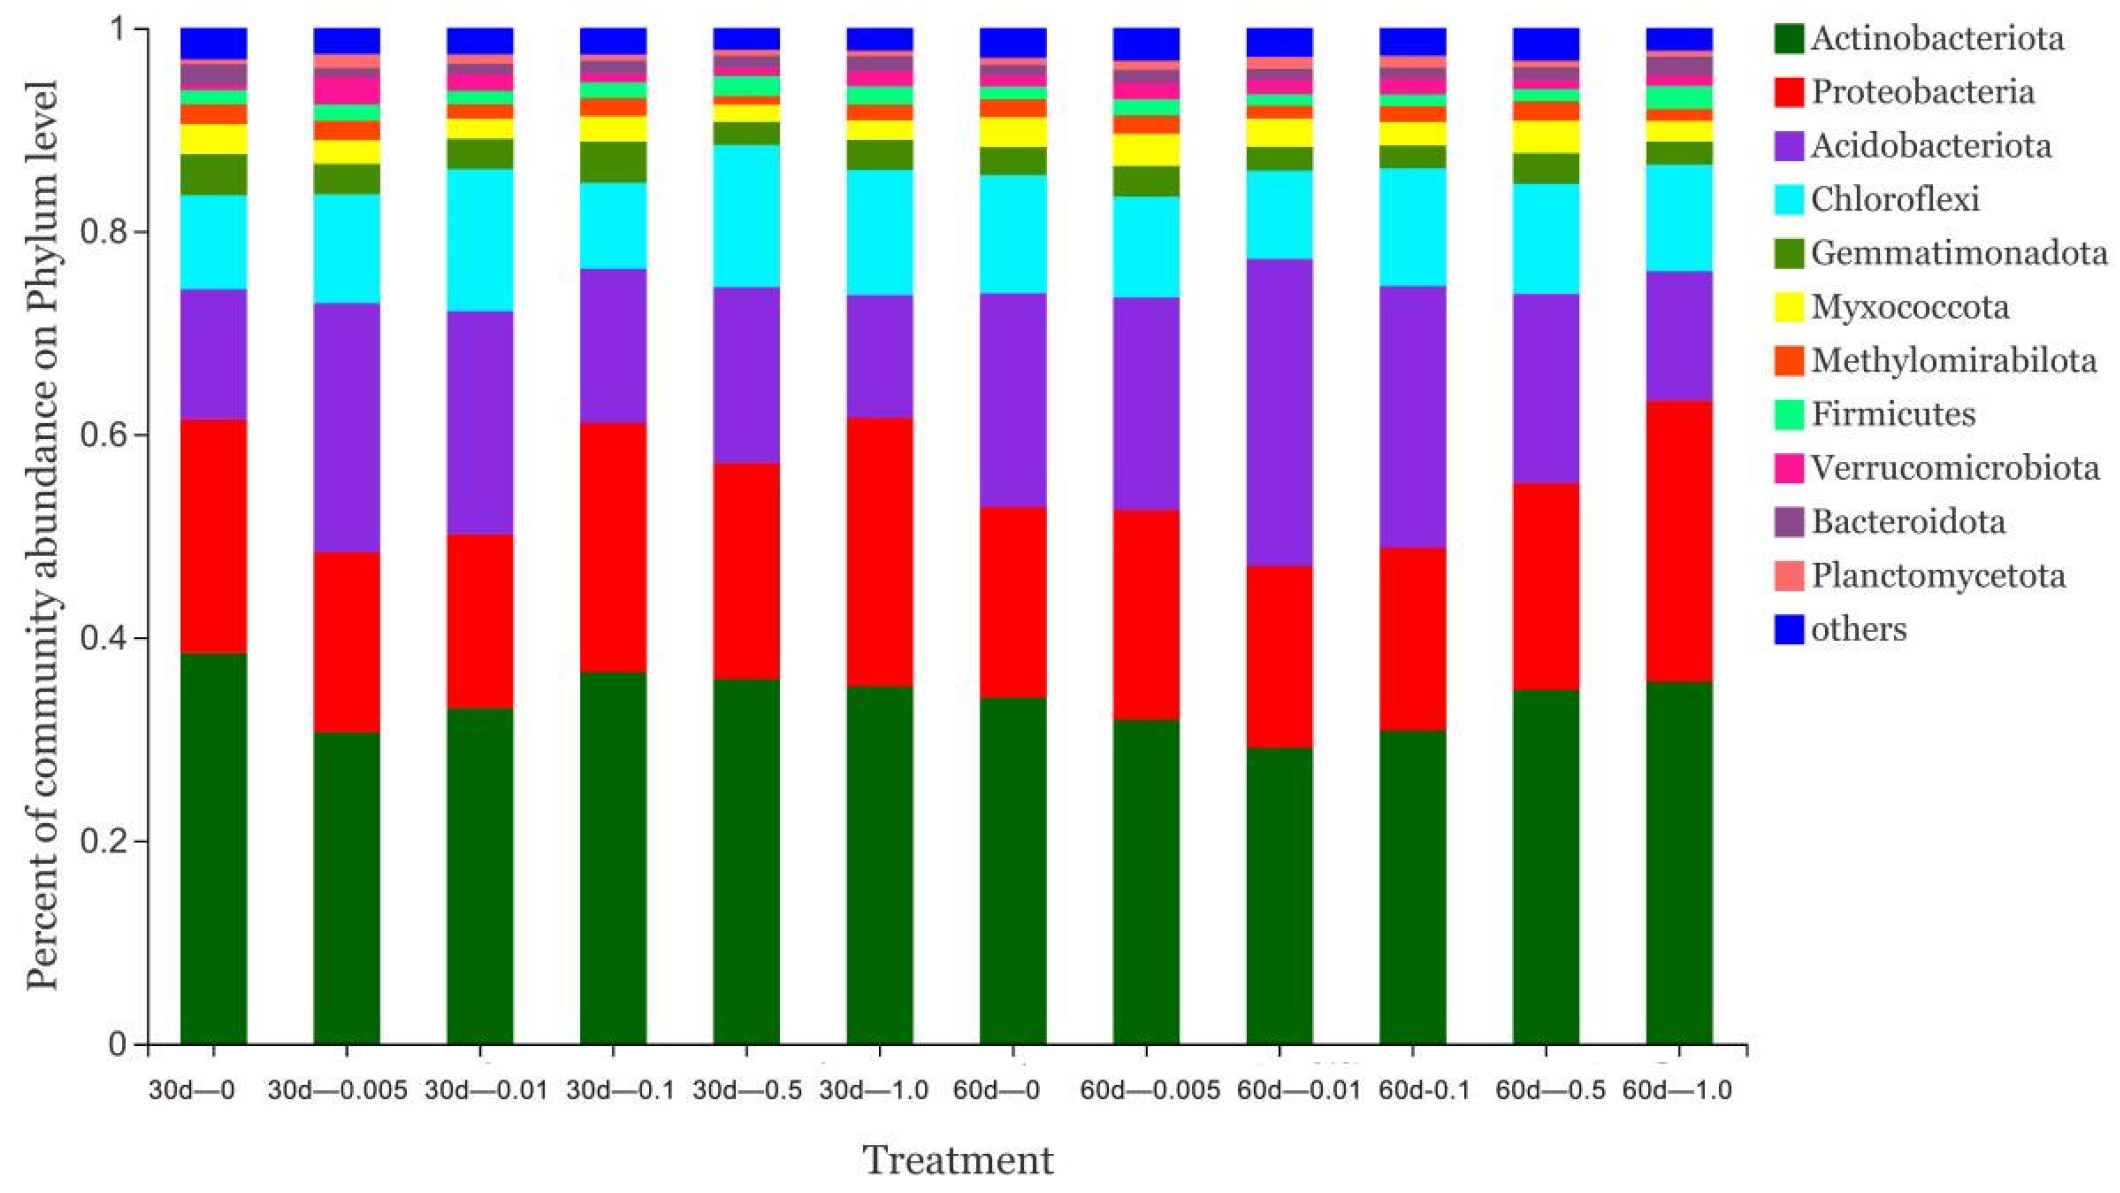
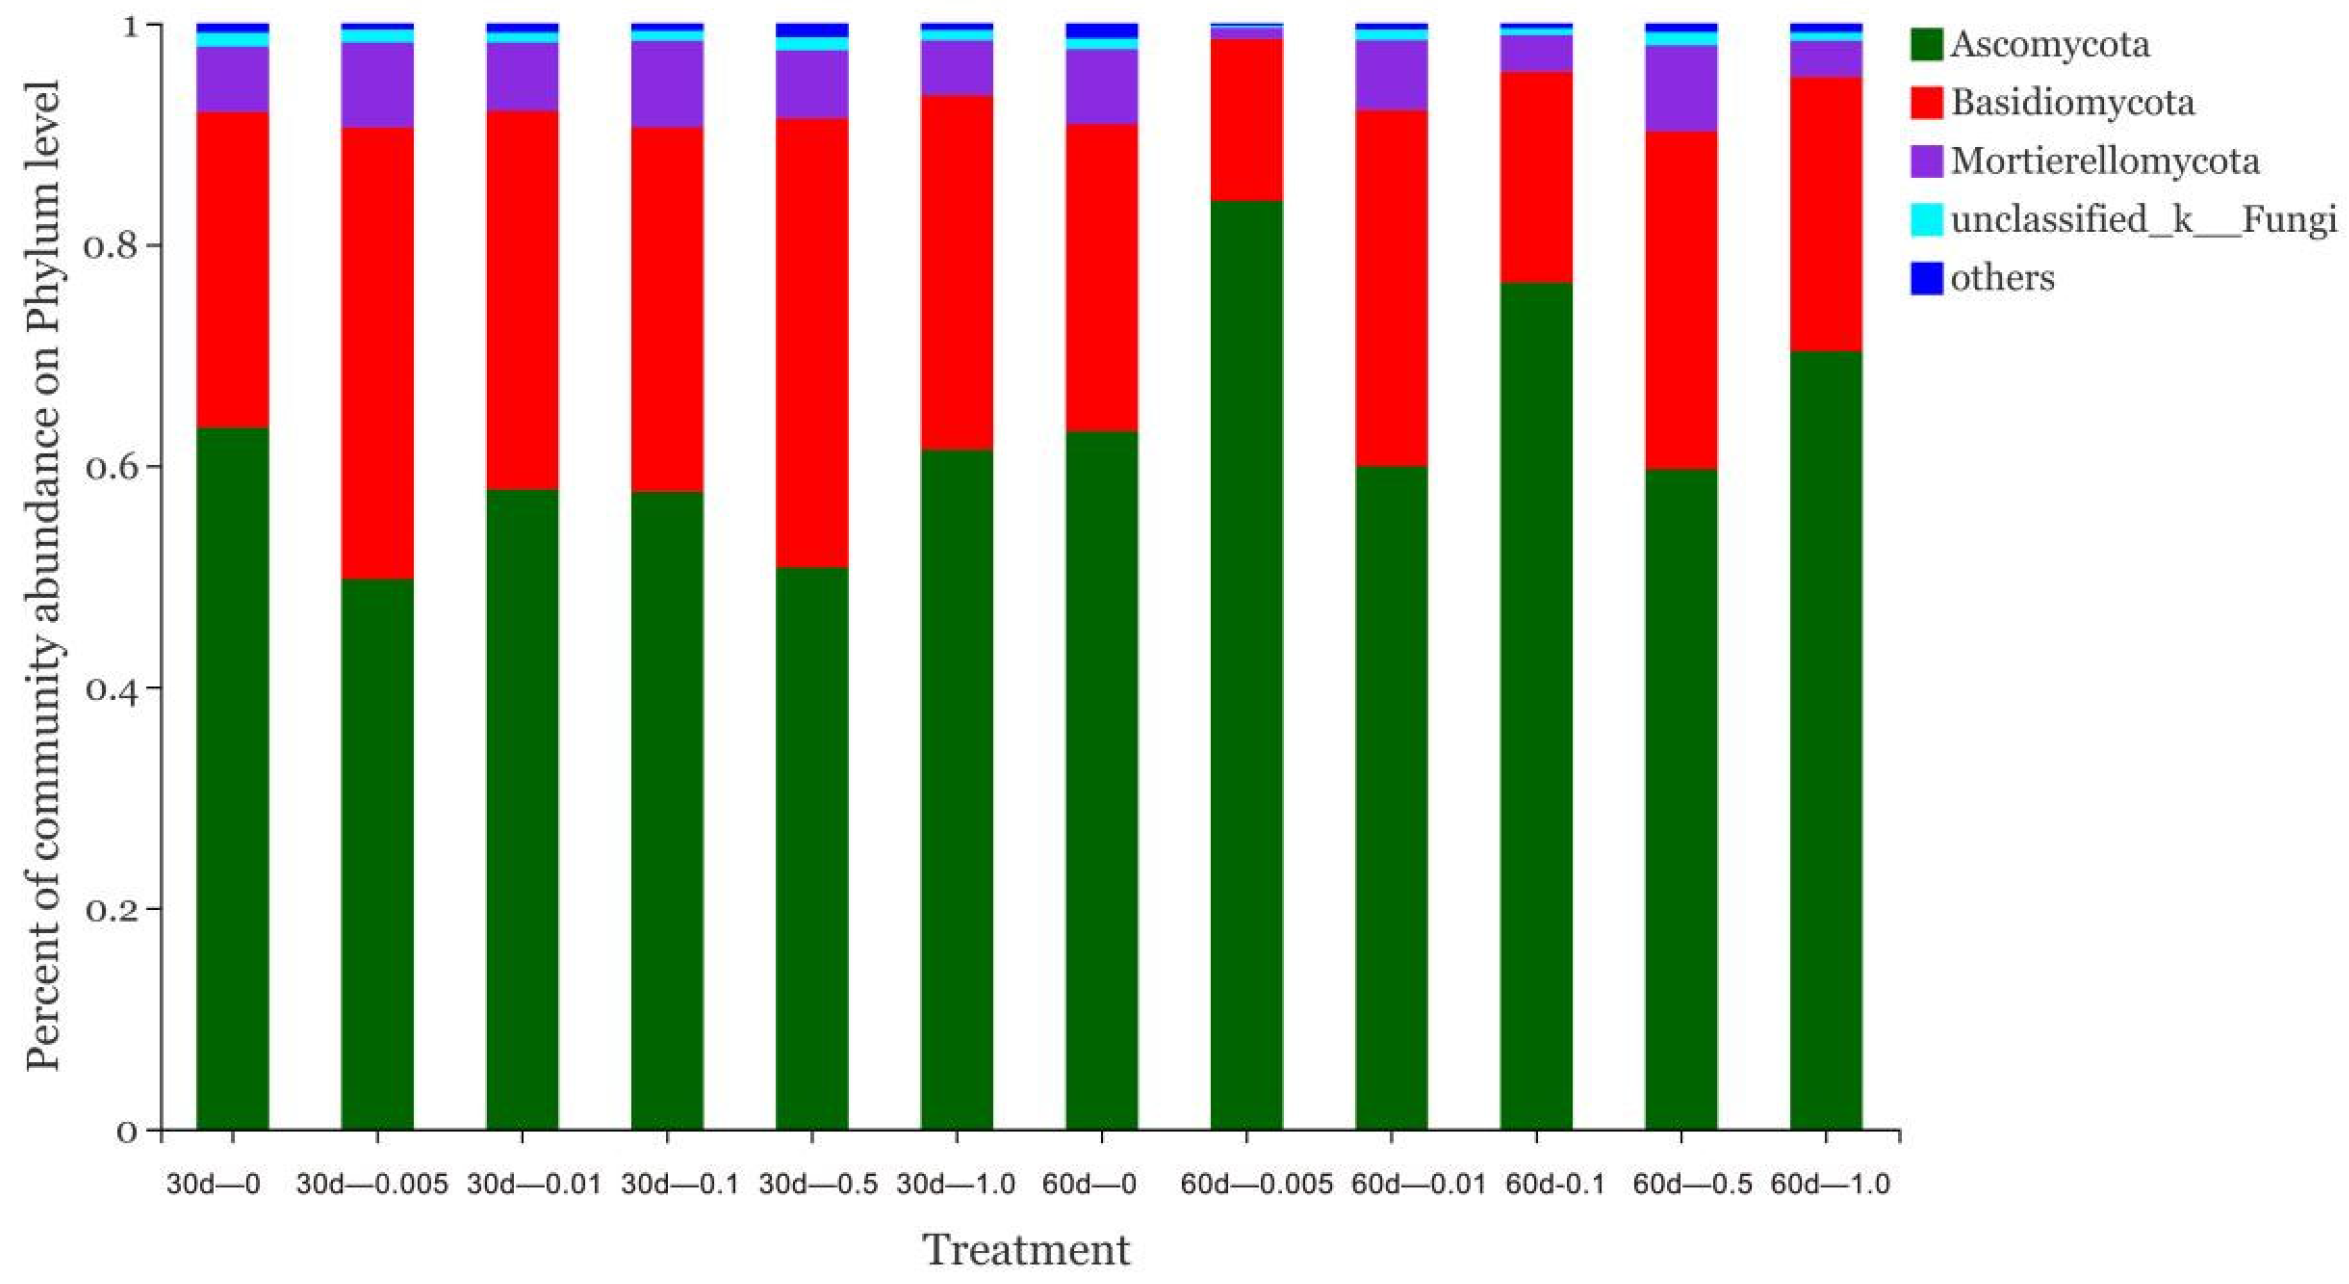
3.3. Effect of Catechol on Soil Microorganisms

The Ace index and Chao1 index of bacteria showed similar trends with the increasing concentration and incubation time. It was shown that, firstly, both indices decreased with increasing concentrations at the same incubation time. The decrease was not significant in the concentration range of 0–0.1 mol/L, but in the range of 0.5–1 mol/L, the decrease was obvious. Secondly, the Ace and Chao1 indices also showed different degrees of decrease with the increasing mineralization time for each concentration, which is 0 mol/L < 0.005–0.1 mol/L < 0.5–1 mol/L. The Shannon index also showed a decreasing trend with increasing concentration, but the effect of mineralization time was not strong (Table 2).
With the increasing concentration and incubation time, the Ace index and Chao1 index of the fungus showed the same changing trend. The changes of Ace index and Chao1 index were not obvious in the concentration range of 0–0.1 mol/L for the same incubation time, but after increasing to 0.5–1 mol/L, a more significant decrease occurred. With the prolongation of mineralization time, both the Ace index and Chao1 index showed a decrease, but the decrease was different for different concentrations: 0–0.1 mol/L < 0.5–1 mol/L. The Shannon index showed a trend of decreasing with increasing concentration, but the pattern of time change was not obvious (Table 3).
A total of 12 bacterial communities were detected (Figure 3 and Figure 4), among which Actinobacteriota, Proteobacteria, Acidobacteriota, and Chloroflexi were the dominant groups, with a combined relative abundance of more than 80%. Gemmatimonadota, Myxococcota, Firmicutes, Bacteroidota, Methylomirabilota, Verrucomicrobiota, Bdellovibrionota, and Planctomycetota, as well as other communities, accounted for about 20%. The relative abundance of Proteobacteria was significantly higher at high concentrations than at low concentrations (0–0.1 mol/L), while Acidobacteriota showed a decrease at high concentrations (Figure 3 and Figure 4).
Three dominant groups of fungi were detected, namely, Ascomycota, Basidiomycota, and Mortierellomycota, as well as unclassified_k__Fungi, which accounted for only about 1%. Among them, the relative abundance of Basidiomycota showed a significant increase at high concentrations.

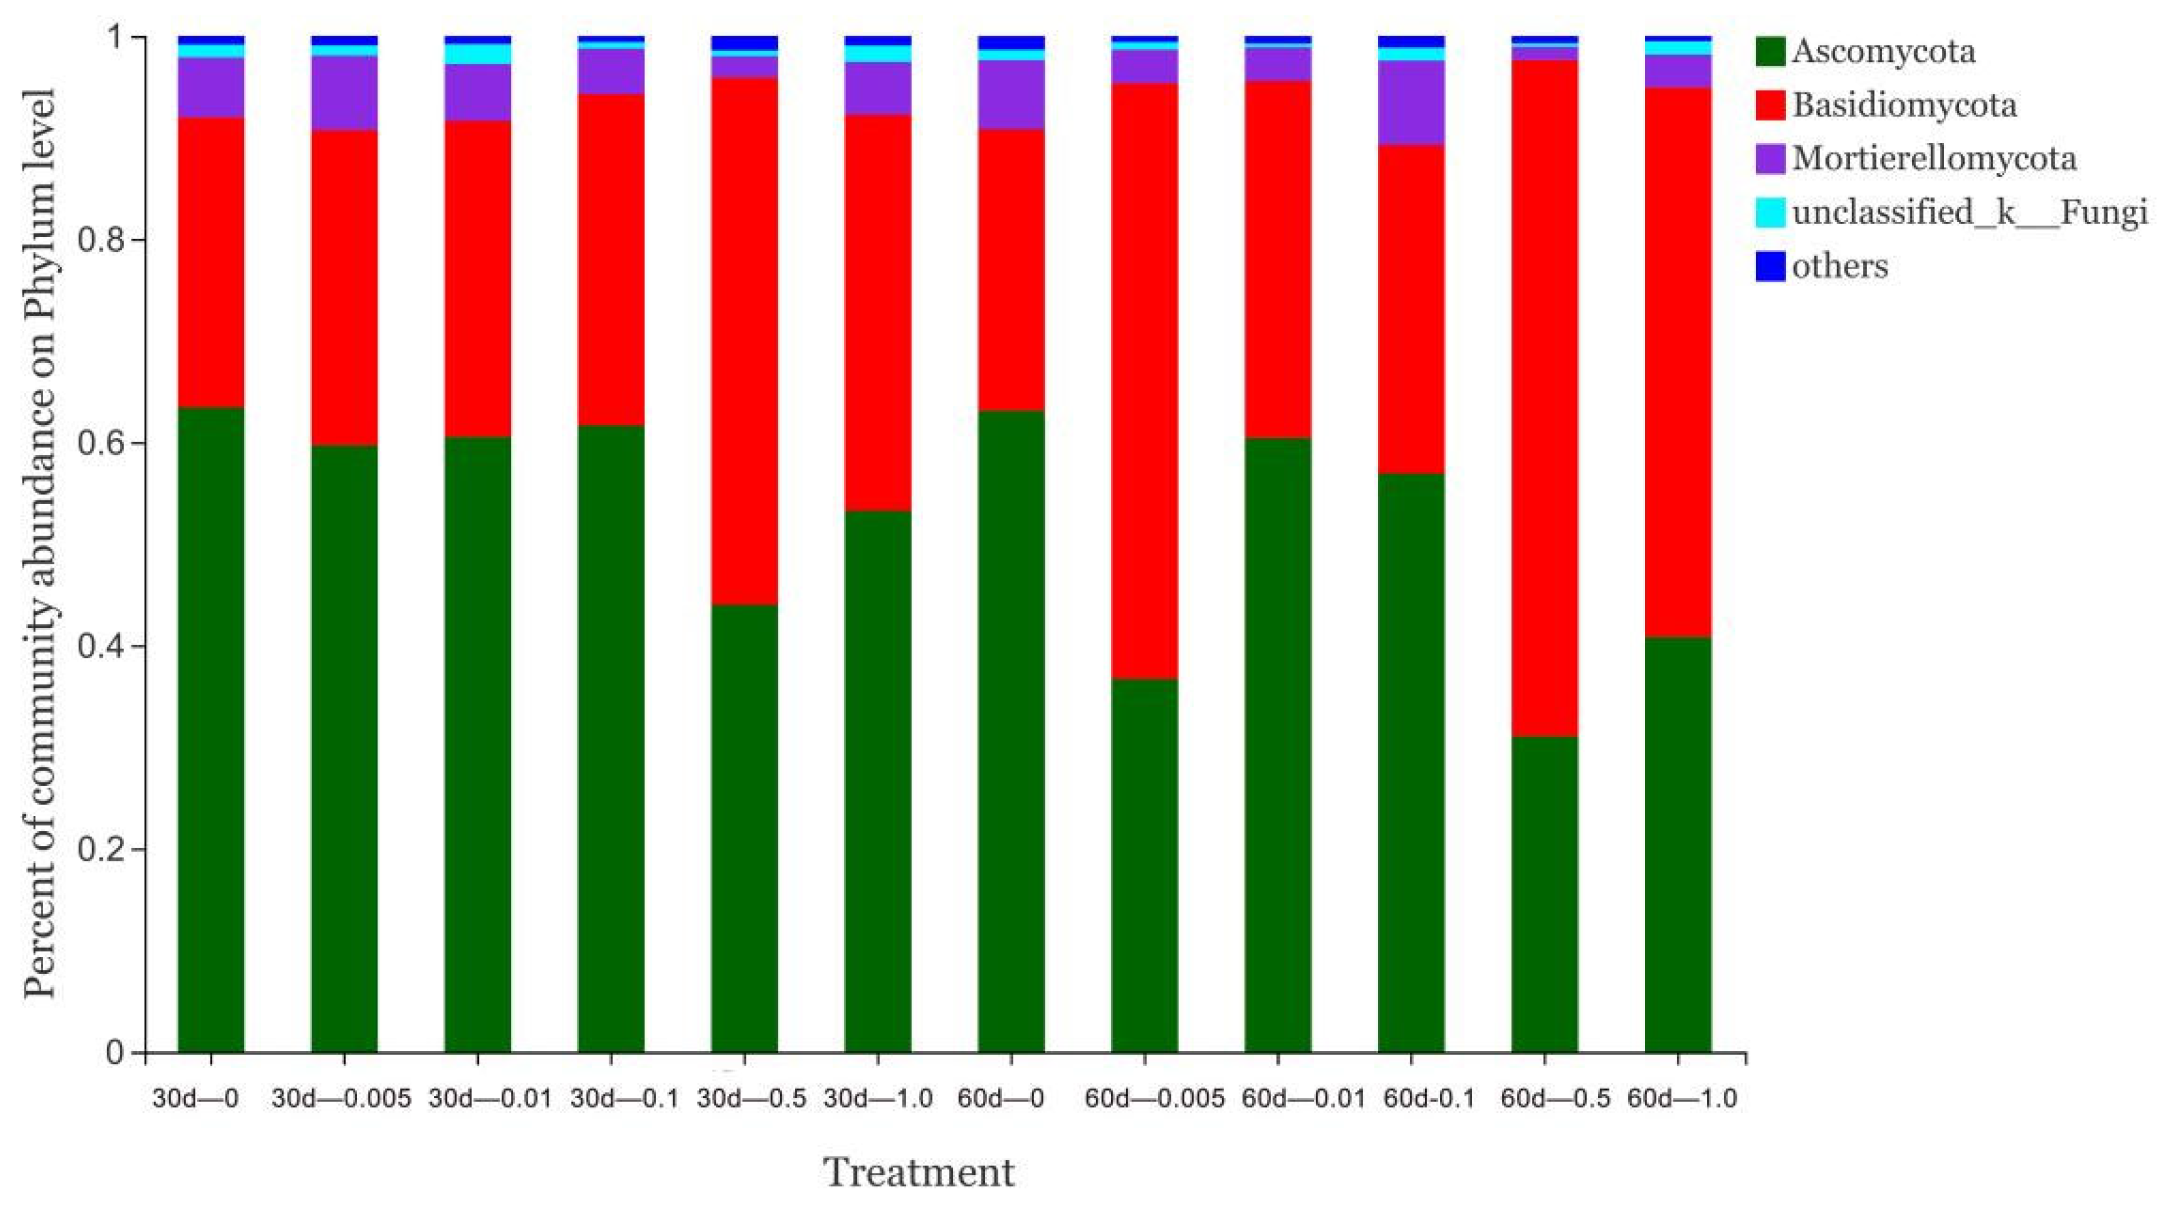
3.4. Effect of Pyrogallic Acid on Soil Microorganisms

The Ace, Chao1, and Shannon indices of the bacteria did not show temporal and concentration variation patterns, but the difference in Ace and Chao1 indices for all five concentrations changed dramatically and disorderly on days 30 and 60 of mineralization compared to no addition (Table 4). The temporal and concentration variations of the three fungal indices were not strong and did not show a clear pattern (Table 5).
Here, 12 and 4 communities of bacterial and fungal were detected (Figure 5 and Figure 6), respectively. Four dominant bacterial communities accounted for more than 83% in total and three dominant fungal communities accounted for more than 98%. The comparison revealed that there was no obvious regular variation in the relative abundance of both bacteria and fungi at different concentrations and different mineralization times.

3.5. Correlation Analysis between Cumulative CO2 Release and Microbial Diversity

Cumulative CO2 release of catechol soil showed a significant negative correlation with the Ace index, Chao1 index, and Shannon index of bacteria and fungi. Cumulative CO2 release of pyrogallic acid soil did not reach a significant level with each index of bacteria and fungi, although it showed some correlations (Table 6 and Table 7).

4. Discussion

The two main pathways of soil organic carbon producing positive excitation include the additional input of exogenous substances to the soil carbon source and the regulation of soil microorganisms [26,27,28]. Both simple and complex carbon compound inputs can increase soil active carbon content directly or indirectly [29,30,31,32,33,34]. Both catechol and pyrogallic acid exhibited an increase in soil active carbon content from 2.35 g/kg (without addition) to 6.12 g/kg and 6.43 g/kg with increasing concentrations, one of the important factors triggering the organic carbon excitation (Table 1 and Figure 1). However, there was no significant difference in the increase of active carbon content between the two organic acids at the same concentration (Table 1). The molecular structure of the two organic acids was very similar, with only one hydroxyl difference, and the amount of carbon input was very similar at the same concentration and volume. For example, adding 10 mL pyrogallic acid and catechol at a concentration of 0.005 mol/L can input 0.034 gC and 0.037 gC for 1 kg soil, respectively. Due to the similar structural stability and carbon input between the two, there was no significant change in soil active carbon content at the same concentration. Therefore, it could be further inferred that the difference in excitation intensity between the two was mainly caused by the different regulatory pathways of the soil microorganisms.
The overall trends of soil mineralization rates after inputting both organic acids were the same, but the difference in peak value was obvious, especially at high concentrations, where the peak value of pyrogallic acid were more than twice that of catechol (Figure 2). As they had the same effect on the soil active carbon content, the differences in peak mineralization rates reflected the variability of the soil microbial characteristics. The soil pH value had important effects on microbial diversity, activity, and biomass [35,36]; bacteria are suitable to grow in neutral-alkaline soil environments [37]; and soil acidification can be stressful to bacteria, inhibiting its growth and reproduction [38]. The testing soil was slightly acidic, with pH values of 6.96–7.12, and the pH value of catechol and pyrogallic acid aqueous solutions were 6 and 4, respectively. The difference in the effect of the two organic acids on soil pH, causing different responses in soil microorganisms, should be the main reason for the difference in peak mineralization rates.
Catechol with low concentrations exerted regular effects on both bacteria and fungi, promoting soil organic carbon mineralization by reducing the number of species, the richness and evenness of species composition, and community diversity (Table 2, Table 3 and Table 6). In addition to the above effects, organic acids at high concentrations could significantly increase or decrease the relative abundance of some bacterial groups, as shown by an increase in the relative abundance of Proteobacterias and Basidiomycota of fungi and a decrease in the relative abundance of Acidobacteriota (Figure 3 and Figure 4). After 60 days, the Proteobacteria and Basidiomycete relative soil richness increased by about 26%, and Acidobacteria decreased by about 17%. Keiluweit et al. found that oxalic acid addition changed the composition of the bacterial community, with a significant increase in the relative abundance of Proteobacteria and Bacteroid, and a decrease in the relative abundance of Acidobacteria, Firmicutes, and Verrucomicrobia [5], and the same change was shown in this study for Proteobacteria and Acidobacteriota. Proteobacteria are eutrophic bacteria that can grow rapidly under environmental conditions with a high soil organic matter and nutrient elements [39]. Here, 0.5–1 mol/L catechol resulted in a 2–3 times increase in soil active carbon content compared to no-addition soil, which, combined with the fact that the testing soil was 0–20 cm forest soil and was rich in nutrients, triggered the rapid growth of Proteobacteria, leading to rapid carbon mineralization [28]. Proteobacteria are nutrient-poor bacteria that are enriched in environments with a low nutrient content and mainly degrade complex organic matter [40], and good soil nutrient conditions and high concentrations of catechol trigger an increase in active carbon content, which becomes a limiting factor for the growth of Proteobacteria.
There were no significant regular changes in the effects of pyrogallic acid at different concentrations on the number of species, the richness and evenness of species composition, community diversity, and community composition of bacteria and fungi (Table 4 and Table 5, Figure 5 and Figure 6), and no significant correlations with cumulative CO2 release (Table 7), but there were dramatic and disorderly changes in the Ace and Chao1 indices of bacteria compared to the no-addition treatment (Table 4). Although the changing mechanism is still unclear, pyrogallic acid may promote the mineralization process by altering the soil pH and strongly affecting the number of bacterial species, the richness, and homogeneity of species composition (Figure 2). However, the correlation needs further study.
It has been suggested that some high concentrations of organic acids, which are both carbon sources and biotoxic, such as benzoic acid, ferulic acid, vanillin, and p-hydroxy benzoic acid mixtures, for the promotion of soil organic matter decomposition and inhibition mechanisms may exist at the same time, however, their biological toxicity or low soil pH value, the influence of suppress the soil microbial activity, the inhibition of organic carbon decomposition masked the promoting effect of carbon sources, and the mineralization intensity of soil organic carbon decreased [10]. However, in this study, the two high concentrations of organic acids did not show inhibition of the biological toxicity. Although the low pH value of pyrogallic acid may be an important reason for the drastic and disorderly change of bacteria, it did not change the direction of the soil organic carbon mineralization, and the promoting effect was strong.

5. Conclusions

Both catechol and pyrogallic acid can increase the soil active carbon content and modulate the positive excitation effect of the soil microorganisms producing soil organic carbon. The excitation intensity of pyrogallic acid at the same concentration was greater than that of catechol at the same concentration, and the mineralization rate at a high concentration was more than two times that of catechol. The difference in excitation intensity between pyrogallic acid and catechol was mainly caused by the different regulation pathways of the soil microorganisms.
Catechol mainly regulates soil microorganisms by reducing the number of species, the richness and evenness of species composition, and even the community composition of bacteria and fungi. However, the pyrogallic acid regulating pathways are unrelated to fungi, but may be closely related to the changes in the number of species and richness, and in the evenness of species composition of bacteria.
At high concentrations, neither of the two organic acids showed their own biological toxicity or the inhibition induced by reducing the soil pH, and the soil organic carbon mineralization promoted strongly.
According to the results of this research, we think that the influence of root exudates must be fully considered when researching the dynamic process of soil organic carbon in the future, which will also help guide us to discover a new research idea for forest soil rhizosphere carbon turnover.

Author Contributions

Conceptualization, Y.X., Y.Y., X.W. and Y.W. (Yue Wang); methodology, Y.X. and Y.Y.; software, Y.X. and Y.W. (Yuanyuan Wang); formal analysis, Y.X., X.W. and Y.Y.; investigation, Y.X., Y.W. (Yue Wang) and W.D.; resources, W.D.; writing—original draft preparation, Y.X. and W.D.; project administration, X.W., W.D. and Y.L.; funding acquisition, Y.L. and W.D. All authors have read and agreed to the published version of the manuscript.

Funding

This study was funded by the Ordos City Science and Technology Cooperation Major Special Project (Grant No. 2021EEDSCXQDFZ012).

Institutional Review Board Statement

Not applicable.

Informed Consent Statement

Not applicable.

Data Availability Statement

The data presented in this study are available upon request from the corresponding author.

Acknowledgments

We are greatly thankful to all who helped in field work.

Conflicts of Interest

The authors declare no conflict of interest.

References

  1. Lal, R. Sequestering carbon in soils of agro-ecosystems—ScienceDirect. Food Policy 2011, 36, S33–S39. [Google Scholar] [CrossRef]
  2. Zhang, Z.; Cai, X.Z.; Tang, C.D.; Guo, J.F. Priming effect of dissolved organic matter in the surface soil of a Cunninghamia lanceolata plantation. Acta Ecol. Sin. 2017, 37, 7660–7667. [Google Scholar]
  3. Arunrat, N.; Kongsurakan, P.; Sereenonchai, S.; Hatano, R. Soil Organic Carbon in Sandy Paddy Fields of Northeast Thailand: A Review. Agronomy 2020, 10, 1061. [Google Scholar] [CrossRef]
  4. Arunrat, N.; Pumijumnong, N.; Sereenonchai, S.; Hatano, R. Factors Controlling Soil Organic Carbon Sequestration of Highland Agricultural Areas in the Mae Chaem Basin, Northern Thailand. Agronomy 2020, 10, 305. [Google Scholar] [CrossRef] [Green Version]
  5. Keiluweit, M.; Bougoure, J.J.; Nico, P.S.; Pett-Ridge, J.; Kleber, M. Mineral protection of soil carbon counteracted by root exudates. Nat. Clim. Chang. 2015, 5, 588–595. [Google Scholar] [CrossRef]
  6. Hamer, U.; Marschner, B. Priming effects of sugars, amino acids, organic acids and catechol on the mineralization of lignin and peat. J. Plant Nutr. Soil Sci. 2002, 165, 261–268. [Google Scholar] [CrossRef]
  7. Hamer, U.; Marschner, B. Priming effects in different soil types induced by fructose, alanine, oxalic acid and catechol additions. Soil Biol. Biochem. 2005, 37, 445–454. [Google Scholar] [CrossRef]
  8. Mallik, A.U. Effect of phenolic compounds on selected soil properties. For. Ecol. Manag. 1997, 92, 11–18. [Google Scholar]
  9. Qu, X.H.; Wang, J.G. Effect of amendments with different phenolic acids on soil microbial biomass, activity, and community diversity. Appl. Soil Ecol. 2008, 39, 172–179. [Google Scholar] [CrossRef]
  10. Ma, Y.H.; Wang, X.F.; Wei, M. Accumulation of phenolic acids in continuously cropped cucumber soil and their effects on soil microbes and enzyme activities. Chin. J. Appl. Ecol. 2005, 16, 2149–2153. [Google Scholar]
  11. Hu, K.; Tao, J.P.; Huang, K.; Hu, J.; Wang, W. Effects of simulated root exudate carbon inputs on the dynamics of microbial communities during litter decomposition. Chin. J. Appl. Environ. Biol. 2020, 26, 417–424. [Google Scholar]
  12. Bodelier, P.L.E.; Wijlhuizen, A.G.; Blom, C.W.; Laanbroek, H.J. Effects of photoperiod on growth of and denitrification by Pseudomonas chlororaphis in the root zone of Glyceria maxima, studied in a gnotobiotic microcosm. Plant Soil 1997, 190, 91–103. [Google Scholar] [CrossRef]
  13. Rouatt, J.W.; Katznelson, H.; Payne, T.M.B. Statistical Evaluation of the Rhizosphere Effect. Soil Sci. Soc. 1960, 24, 271–273. [Google Scholar] [CrossRef]
  14. Song, J.F.; Cui, X.Y. Advanc in Study of Low Molecular Mass Organic Acids in Forest Soils. Sci. Silvae Sin. 2008, 6, 121–127. [Google Scholar]
  15. Sun, Y.; Xu, X.L.; Yakov, K. Mechanisms of rhizosphere priming effects and their ecological significance. Chin. J. Plant Ecol. 2014, 38, 62–75. [Google Scholar]
  16. Bengtson, P.; Barker, J.; Grayston, S.J. Evidence of a strong coupling between root exudation, C and N availability, and stimulated SOM decomposition caused by rhizosphere priming effects. Ecol. Evol. 2012, 2, 1843–1852. [Google Scholar] [CrossRef]
  17. Graaff, M.A.D.; Classen, A.T.; Castro, H.F.; Schadt, C.W. Labile soil carbon inputs mediate the soil microbial community composition and plant residue decomposition rates. New Phytol. 2010, 188, 1055–1064. [Google Scholar] [CrossRef] [Green Version]
  18. Cheng, W.; Johnson, D.W.; Fu, S. Rhizosphere Effects on Decomposition. Soil Sci. Soc. Am. J. 2003, 67, 1418. [Google Scholar] [CrossRef]
  19. Mondini, C.; Sinicco, T.; Cayuela, M.L.; Sanchez, M.M.A. A simple automated system for measuring soil respiration by gas chromatography. Talanta 2010, 81, 849–855. [Google Scholar] [CrossRef]
  20. Updegraff, K.; Pastor, J.; Bridgham, S.D.; Johnston, C.A. Environmental and substrate controls over carbon and nitrogen mineralization in northern wetlands. Ecol. Appl. 1995, 5, 151–163. [Google Scholar] [CrossRef]
  21. Wedin, D.A.; Pastor, J. Nitrogen mineralization dynamics in grass monocultures. Oecologia 1993, 96, 186–192. [Google Scholar] [CrossRef] [PubMed]
  22. Murwira, H.K.; Kirchmann, H.; Swift, M.J. The effect of moisture on the decomposition rate of cattle manure. Plant Soil 1990, 122, 197–199. [Google Scholar] [CrossRef]
  23. Cordovil, C.M.D.S.; Coutinho, J.; Goss, M.; Cabral, F. Potentially mineralisable nitrogen from organic materials applied to a sandy soil: Fitting the one-pool exponential model. Soil Use Manag. 2010, 21, 65–72. [Google Scholar] [CrossRef]
  24. Ribeiro, H.M.; Fangueiro, D.; Alves, F.; Vasconcelos, E.; Coutinho, J.; Bol, R.; Cabral, F. Carbon-mineralization kinetics in an organically managed Cambic Arenosol amended with organic fertilizers. J. Plant Nutr. Soil Sci. 2010, 173, 39–45. [Google Scholar] [CrossRef]
  25. Kuzyakov, Y.; Bol, R. Sources and mechanisms of priming effect induced in two grassland soils amended with slurry and sugar. Soil Biol. Biochem. 2006, 38, 747–758. [Google Scholar] [CrossRef]
  26. Fontaine, S.; Bardoux, G.; Abbadie, L.; Mariotti, A. Carbon input to soil may decrease soil carbon content. Ecol. Lett. 2004, 7, 314–320. [Google Scholar] [CrossRef]
  27. Nottingham, A.T.; Griffiths, H.; Chamberlain, P.M.; Stott, A.W.; Tanner, E.V.J. Soil priming by sugar and leaf-litter substrates: A link to microbial groups. Appl. Soil Ecol. 2009, 42, 183–190. [Google Scholar] [CrossRef]
  28. Collins, H.P.; Rasmussen, P.E.; Douglas, C.L. Crop rotation and residue management effects on soil carbon and microbialdynamics. Soil Sci. Soc. Am. J. 1992, 56, 783–788. [Google Scholar] [CrossRef]
  29. Duong, T.T.T.; Baumann, K.; Marschner, P. Frequent addition of wheat straw residues to soil enhances carbon mineralization rate. Soil Biol. Biochem. 2009, 41, 1475–1482. [Google Scholar] [CrossRef]
  30. Zhang, P.; Li, H.; Jia, Z.K.; Lu, W.T.; Zhang, H.; Yang, B.P. Effects of Straw Returning on Soil Organic Carbon and Carbon Mineralization in Semi-arid Areas of Southern Ningxia, China. J. Agro-Environ. Sci. 2011, 30, 2518–2525. [Google Scholar]
  31. Lu, W.T.; Jia, Z.K.; Zhang, P.; Wang, W.; Hou, X.Q.; Yang, B.P. Effects of Straw Returning on Soil Labile Organic Carbon and Enzyme Activity in Semi-arid Areas of Southern Ningxia, China. J. Agro-Environ. Sci. 2011, 30, 522–528. [Google Scholar]
  32. Qiao, N.; Schaefer, D.; Blagodatskaya, E.; Zou, X.M.; Xu, X.L.; Kuzyakov, Y. Labile carbon retention compensates for CO2 released by priming in forest soils. Glob. Chang. Biol. 2014, 20, 1943–1954. [Google Scholar] [CrossRef]
  33. Yan, D.Z.; Wang, D.J.; Yang, L.Z. Long-term effect of chemical fertilizer, straw, and manure on labile organic matter fractions in a paddy soil. Biol. Fertil. Soils 2007, 44, 93–101. [Google Scholar] [CrossRef]
  34. Nadelhoffer, K.J.; Boone, R.D.; Bowden, R.D.; Canary, J.D.; Kaye, J.; Micks, P.; Ricca, A.; Aitkenhead, J.A.; Lajtha, K.; Mcdowell, W.H. The DIRT Experiment: Litter and Root influences on Forest Soil Organic Matter Stocks and Function. In Forests in Time: The Environmental Consequences of 1000 Years of Change in New England; Foster, D.R., Aber, J.D., Eds.; Yale University Press: New Haven, CT, USA, 2004; pp. 300–315. [Google Scholar]
  35. Baath, E.; Anderson, T.H. Comparison of soil fungal /bacterial ratios in a pH gradient using physiological and PLFA-based techniques. Soil Biol. Biochem. 2003, 35, 955–963. [Google Scholar] [CrossRef]
  36. Deng, H.; Li, X.F.; Cheng, W.D.; Zhu, Y.G. Resistance and resilience of Cu-polluted soil after Cu perturbation, tested by a wide range of soil microbial parameters. FEMS Microbiol. Ecol. 2009, 70, 293–304. [Google Scholar] [CrossRef] [Green Version]
  37. Wang, H.; Yang, J.P.; Yang, S.H.; Yang, Z.C.; Lv, Y.M. Effect of a 10 °C-elevated temperature under different water contents on the microbial community in a tea orchard soil. Eur. J. Soil Biol. 2014, 62, 113–120. [Google Scholar] [CrossRef]
  38. Zheng, Y.X.; Cao, J.L.; Yang, Z.J.; Lin, Y.F.; Huang, M.Q.; Yang, Y.S. Seasonal Variation of Soil Microbial Community Structure in Castanopsis Carlesii Natural Forest and Orange Orchard. Ecol. Environ. Sci. 2019, 28, 1991–1998. [Google Scholar]
  39. Fierer, N.; Lauber, C.L.; Ramirez, K.S.; Zaneveld, J.; Bradford, M.A.; Knight, R. Comparative metagenomic, phylogenetic and physiological analyses of soil microbial communities across nitrogen gradients. ISME J. 2012, 6, 1007–1017. [Google Scholar] [CrossRef] [Green Version]
  40. Liu, J.J.; Sui, Y.Y.; Yu, Z.H.; Shi, Y.; Chu, H.Y.; Jin, J.; Liu, X.B.; Wang, G.H. High throughput sequencing analysis of biogeographical distribution of bacterial communities in the black soils of northeast China. Soil Biol. Biochem. 2014, 70, 113–122. [Google Scholar] [CrossRef]
Figure 1. Effect of organic acids on soil organic carbon mineralization.
Forests 13 00487 g001
Figure 2. Effect of organic acids on the mineralization rate of the soil organic carbon.
Forests 13 00487 g002
Figure 3. Effect of catechol on bacterial community composition. Note: In the figure, 30 d and 60 d indicate 30 days and 60 days of culture, respectively. 0, 0.005, 0.01, 0.1, 0.5, and 1.0 respectively, indicate the concentration of exogenous acid (in mol/L). The same below.
Forests 13 00487 g003
Figure 4. Effect of catechol on fungal community composition.
Forests 13 00487 g004
Figure 5. Effect of pyrogallic acid on bacterial community composition.
Forests 13 00487 g005
Figure 6. Effect of pyrogallic acid on fungal community composition.
Forests 13 00487 g006
Table 1. Single exponential fitting equation for the soil mineralization process.
CatecholPyrogallic Acid
Concentrations (mol/L)EquationsC0 (g/kg)k0R2EquationsC0 (g/kg)k0R2
0Y = 2.35 (1 − e−0.063x)2.350.0630.969Y = 2.35 (1 − e−0.063x)2.350.0630.969
0.005Y = 2.66 (1 − e−0.069x)2.660.0690.975Y = 3.62 (1 − e−0.039x)3.620.0390.984
0.01Y = 3.05 (1 − e−0.063x)3.050.0630.977Y = 4.47 (1 − e−0.041x)4.470.0410.983
0.1Y = 3.58 (1 − e−0.063x)3.580.0630.982Y = 4.99 (1 − e−0.050x)4.990.0500.973
0.5Y = 4.65 (1 − e−0.064x)4.650.0640.985Y = 5.89 (1 − e−0.062x)5.890.0620.977
1.0Y = 6.12 (1 − e−0.072x)6.120.0720.995Y = 6.43 (1 − e−0.082x)6.430.0820.985
Table 2. Effect of catechol on bacterial diversity.
Concentrations
(mol/L)
AceChao1Shannon
30 d60 dDifferences30 d60 dDifferences30 d60 dDifferences
03014.882980.23−34.652966.152950.20−15.966.396.38−0.02
0.0053018.222873.40−144.823009.062839.56−169.506.346.18−0.16
0.012936.622751.88−184.742931.712754.11−177.606.316.24−0.07
0.12819.872671.37−148.502884.992636.00−158.995.995.66−0.13
0.52264.412039.64−224.782657.182092.78−564.405.325.20−0.11
12476.232209.31−266.922610.062200.85−409.215.705.56−0.15
Note: The difference is the difference between the indices on day 60 and day 30 of incubation at the same concentration. The same below.
Table 3. Effect of catechol on fungal diversity.
Concentrations
(mol/L)
AceChao1Shannon
30 d60 dDifferences30 d60 dDifferences30 d60 dDifferences
0537.61508.54−29.07526.86505.93−20.933.283.17−0.11
0.005562.19498.95−63.24542.97490.12−52.853.142.42−0.72
0.01570.56539.98−30.58565.63485.41−80.223.302.98−0.32
0.1527.94493.98−33.96522.01471.69−50.322.862.61−0.25
0.5436.42264.28−172.14441.62242.29−199.342.821.97−0.85
1401.75243.61−158.14498.88305.04−193.832.772.53−0.24
Table 4. Effect of pyrogallic acid on bacterial diversity.
Concentrations
(mol/L)
AceChao1Shannon
30 d60 dDifferences30 d60 dDifferences30 d60 dDifferences
03174.113173.50−0.613074.973125.7250.746.4426.426−0.016
0.005562.19498.95−63.24542.97490.12−52.853.142.42−0.72
0.013141.123416.40275.273143.803462.27318.476.3116.4590.148
0.13225.593105.74−119.853230.443082.39−148.056.3616.3650.005
0.52801.833331.09529.262779.223331.06551.846.1016.4760.375
13259.092963.23−295.863252.483045.26−207.236.2766.169−0.106
Table 5. Effect of pyrogallic acid on fungal diversity.
Concentrations
(mol/L)
AceChao1Shannon
30 d60 dDifferences30 d60 dDifferences30 d60 dDifferences
0537.71504.10−33.61531.35512.40−18.953.2873.181−0.106
0.005493.03471.99−21.04479.00501.1122.112.9711.344−1.627
0.01534.50524.47−10.03522.92556.3333.413.0383.0430.006
0.1511.95536.2824.32514.74492.69−22.042.9992.672−0.327
0.5416.10477.5261.42453.25506.7153.462.8143.2370.423
1449.74478.4628.72430.74475.0644.322.9652.9800.015
Table 6. Correlation analysis between cumulative CO2 release and soil microbial diversity after catechol addition.
BacteriaAce IndicesChao1 IndicesShannon Indices
CO2 accumulative delivery amount (g/kg)−0.857 **−0.880 **−0.772 **
FungiAce IndicesChao1 IndicesShannon Indices
CO2 accumulative delivery amount (g/kg)−0.889 **−0.743 **−0.660 **
Note: ** p < 0.01.
Table 7. Correlation analysis between cumulative CO2 release and soil microbial diversity after pyrogallic acid addition.
BacteriaAce IndicesChao1 IndicesShannon Indices
CO2 accumulative delivery amount (g/kg)−0.0620.095−0.281
FungiAce IndicesChao1 IndicesShannon Indices
CO2 accumulative delivery amount (g/kg)−0.370−0.362−0.073
Publisher’s Note: MDPI stays neutral with regard to jurisdictional claims in published maps and institutional affiliations.

