Article

Effect of Simulated Combined N and P on Soil Acidity within Soil Aggregates in Natural and Planted Korean Pine Forest in Northeast China

1
School of Forestry, Northeast Forestry University, Harbin 150040, China
2
Key Laboratory of Sustainable Forest Ecosystem Management-Ministry of Education, Northeast Forestry University, Harbin 150040, China
3
Department of Natural Resource Management (NRM), National Agriculture Research Center (NARC), Islamabad 44000, Pakistan
*
Author to whom correspondence should be addressed.
These authors contributed equally to this work.
Submission received: 13 February 2022 / Revised: 23 March 2022 / Accepted: 24 March 2022 / Published: 29 March 2022
(This article belongs to the Special Issue Soil Organic Matter and Nutrient Cycling in Forests)

Abstract

:
Globally, atmospheric nitrogen (N) deposition is rising, adversely impacting soil health, i.e., increasing soil acidity. While phosphorus (P) is the limiting element in the temperate environment and plays a key role in making the ecosystem more vulnerable to N-derived acidification. The impact of elevated N and P inputs on soil acidity and exchangeable base cations have been extensively studied; however, few studies have focused on these parameters, especially within various soil aggregate fractions in the temperate forest. In 2017, a field experiment was conducted under N and P additions with four soil aggregate fractions (>5 mm, 2–5 mm, 0.25–2 mm, and <0.25 mm) in two forests, i.e., the broad leave Korean pine forest (BKPF) and Korean pine plantation (KPP) in the Liangshui National Natural Reserves in Northeast China. Results showed that high NP addition decreases pH, base cations, Mg2+ Ca2+, and BS% and increases in Fe3+, Al3+, and E.A (effective acidity) in all four aggregate fractions, in descending order; overall concentration of the base cations is ranked as BKPF > KPP. Thus, soil acidification is primarily caused by a decrease in base cations, such as Ca2+ and Mg2+, and increase in exchangeable Fe3+ and Al3+ ions in large macro-aggregates and macro-aggregates, which leads to the depletion of soil nutrients. The initial pH value (5.69) in >5 mm soil aggregate was decreased to (5.4) under high fertilizer application, while a minimum value of 5.36 was observed in 0.25–2 mm aggregates under high fertilizer application. The same trend was observed in all aggregates because of decrease in base cations, which, in turn, affects the vitality and health of the forests.

1. Introduction

Nitrogen (N) and phosphorus (P), two essential macronutrients, constrain the primary productivity across the terrestrial ecosystem [1,2]. External N inputs to the terrestrial ecosystem are controlled by nitrogen fixation and atmospheric deposition. P availability is controlled by mineral weathering and atmospheric deposition [2]. The demand for mineral nutrients by trees may be brought about by all of the biogeochemical processes above, leading to a soil nutrient imbalance [3]. Phosphorus (P) remains an important, yet ubiquitous, nutrient limitation in different ecosystems [4] and is a necessary ingredient for growth and development in organisms [5]. The P cycling of soil in diverse ecosystems is, thus, considered an essential factor [2]. In general, N is regarded as a nutrient that limits forest development [6], particularly in temperate forests where soil is relatively young [7]. The acidification of forest soil is a natural process and one of the most severe environmental issues in Europe, Asia, and other parts of the globe; in many temperate and boreal regions, soil acidification is regarded as a significant ecological issue [8]. Soil acidity occurs for two main reasons: first, natural weathering, plant nutrient uptakes, or microorganism activities; second, and most important, is anthropogenic activities, such as fertilization, especially nitrogen, which play a vital role, along with different bases cations and phosphorus [9]. The N inputs promote soil acidification and cause the loss of base cations [10], and bioavailability of micronutrients may increase under soil acidification [11]. The N addition causes exchangeable Ca2+ and Mg leaching, and that activates available Fe3+ and Mn2+. As a result, soil acidification occurs, which leads to the imbalance of nutrients in the soil [10]. On the other hand, increasing N deposition may enhance forest development, while limiting other nutrients, such as phosphorus (P) and base cations [12]. The loss of nutrients (K+, Ca2+, Mn2+, and Mg2+), due to canopy leaching [13,14], which is due to precipitation and throughfall, may change the chemical characteristics of the soil water, modifying soil acidity, Ca:Al ratio, alkalinity, acid neutralizing capacity, and saturation of base cations [13,15,16].
Tree species composition may influence soil acidity and exchangeable cations concentration in soil development [17,18]. Plant communities are intimately related to the ground and below-ground processes [19]. Global changes may substantially affect the diversity and composition of plants [20], and large areas of mixed broad-leaved Korean pine (Pinus koraiensis) forest have been harvested and converted into secondary forest and plantations during the past several decades [21]. The worldwide data show that, by 2050, the rate of N deposition will be twice that of 1995, which was 100 Tg N a−1 to 200 Tg N a−1, respectively [22]. Similarly, from 1990 to 2000, China’s averages wet-N deposition rate rose to 25% [23] and is anticipated to grow dramatically in the future. Northern China was discovered to be one of the deposition sites for N in Asia, with a range from 28.5 to 100.4 N ha−1 a−1 [24].
The biogeochemical cycles of N and P are strongly linked [25,26], and the processes of N and P are closely connected. In some cases, N was shown to have expanded the limits of P [27]. In others, N addition has performed the P dynamics and increased P cycling [28,29]. Researchers worldwide have been paying great attention to carbon (C) cycling with increased deposition of N [30,31,32]. However, the P dynamics, base cations, Al:Ca ratio, and microbial and enzyme activity, under increasing N exposures, have received less attention because these are excellent eco-chemical markers for the health of the soil and damages occurred by soil acidification [33]. The fundamental unit of soil structure is the aggregates, which provide an important indicator of soil health by predicting the characteristics and distribution of microbes and enzymatic communities and other soil nutrients, such as phosphorus, sulfur, and nitrogen, among others [34]. Soil aggregates are formed by repeated polymerization of organic and inorganic colloid, which determines the distribution of microbial community and nutrients. Soil aggregate stability serves as an important indicator of soil health [35,36]. Aggregation of soil is physical protection connected with soil organic matter (SOM) stabilization. Water diffusion and oxygen rate are generally similar with soil aggregate sizes and determined by pore spaces [37]. As a result, N and P are more likely to distribute in aggregates of larger sizes because of favorable microbial activity [38]. High mineral content and more microbial-processed SOM with micro aggregates [39].
This study provides the effect of simulated N and P deposition/fertilization on soil acidification and base cation depletion in different aggregate sizes in the temperate ecosystems. We hypothesized that different levels of combined N and P fertilization would: (1) increase acidification and changes in base cation concentration within soil aggregates; and (2) affect eco-chemical indexes, such as effective acidity (EA), base saturation, Al:Ca ratio, and soil pH in different soil aggregates.

2. Materials and Methods

2.1. Study Site

The study site is located at the Liangshui National Nature Reserve, at position (47°6′49″–47°16′10″ N, 128°47′8″–128°57′19″ E) of the Mountains Xiao Xing′an, in the Heilongjiang Province of northeastern China. The region is characterized by a temperate climate with a mean annual temperature of −0.3 °C (i.e., min. −31 °C in Jan and max. 32 °C in July). The total mean annual precipitation in the region was recorded as 676 mm, and 60% of the annual precipitation occurs during the growing season from June to August. The frost-free period is from 100 to 120 days, and the accumulated snow period is from 130 to 150 days. The reserve covers 12,133 hm2, with an approximate growing stock of 1.88 million m3 and average canopy coverage of 98%. The study area is one of the prime areas in China that have a huge natural forest. Among these forests, 2375 hm2 area is covered with natural Korean pine forests. The climate is a continental monsoon with a strong monsoon windy spring, warm and humid summer, and dry and cold winter. The ambient N deposition in the region is 12.93 kg N hm2 a−1. The study site is dark brown forest soil classified as Inceptisols (USDA Soil Taxonomy) and Bori-Udic Cambosol (Chinese Soil Taxonomy). Bori-Udic Cambosols mainly distribute in China’s northeast areas, including the Greater Khingan, Lesser Khingan, Wanda, and Changbai Mountains. Parent materials are diversified, including the weathered materials derived from granite, gneiss, sandstone, shale, and limestone, as well as loess. The main tree species is the Korean pine (Pinus koraiensis), accompanied by temperate deciduous tree species, (Table 1) such as Betula costata, Tilia amurensis, Acer ukurunduense Abies nephrolepis, Ulmus laciniata, Acer tegmentosum, and Fraxinus mandshurica. See Table 2 for soil characteristics before fertilizer application.

2.2. Experimental Design

In October 2017, three sample plot of 20 × 20 m was set up in each of the two representative forest types, i.e., broad-leaved Korean pine forest (BKPF) and Korean pine plantation (KPP), with similar site conditions. Then, each sample plot was subdivided in to twelve (2 × 2 m) subplots, and an additional 20 m buffer zone was established between two adjacent sample plots, as well as around the edges of the plots, in order to reduce mutual interference. Thus, a total of 72 subplots were established in both forest types. In 2018 and 2019, the following four levels of fertilization were implemented: control (CK, 0 g N m−2 a−1, and 0 g P m−2 a−1), low fertilization (N1P1, 5 g N m−2 a−1, and 5 g P m−2 a−1), medium fertilization (N2P2, 15 g N m−2 a−1, and 10 g P m−2 a−1), and high fertilization (N3P3, 30 g N m−2 a−1, and 20 g P m−2 a−1). Ammonium sulphate ((NH4)2SO4) was used as a nitrogen source, while ammonium phosphate ((NH4)2HPO4) was used as a phosphorus source; both N and P were dissolved in water, and a 2 L sprinkler was used to simulate nitrogen and phosphorus deposition and sprayed by artificial sprayer. The rate of nitrogen and phosphorus treatment were set on the basis of local summer rainfall records and determination of natural NP settlement in the region (i.e., 12.93 kg ha−1 a−1), based on the background values of natural nitrogen and phosphorus settlement and reference to similar international research methods [39,40].

2.3. Soil Sampling and Processing

Soil samples were collected in October 2019, at 0–20 cm soil depth, three randomly selected sampling points from each subplot were mixed into a composite sample, packed in the plastic bags, and transported to the laboratory. In the lab, all the soil samples were is air-dried and roots and stones are removed by hand. After that, the different soil aggregates sizes >5 mm, 2–5 mm, 0.25–2 mm, and <0.25 mm were separated via wet sieving procedure and put in the oven at 105 ˚C for further chemical analysis.

2.4. Chemical Analysis

Exchangeable cations (H+, K+, Na+, Ca2+, Mg2+, Al3+, and Fe3+) were extracted with 0.1 mol L−1 BaCl2 (50:1, solution: soil). After centrifugation and filtration through 0.45 μm cellulose–acetate filters, the filtrates were analyzed for cations. Exchangeable H+ and Al3+ were determined by NaOH neutralization titration after BaCl2 extraction. The soil organic carbon and total nitrogen were determined using the dry combustion method, using the Vario EL III elemental analyzer (Elementar analyzer system GmbH, Hanau, Germany). The NH4+-N (ammonium) and NO3–N (nitrate) were obtained using 2 M KCl as determined by auto analyzer III Bran + Luebbe GmbH, Germany. Aluminum (Al) and iron (Fe) were taken out, using the method of [41], and the sample was examined through a machine, identified as coupled plasma mass spectrometry (Agilent Technologies Co. Ltd, CA, USA). For the determination of soil pH, 1 g soil was mixed with distilled water, in the ratio (1:2.5), and shaken on a mechanical shaker (30 min); the soil pH was measured using the calibrated pH meter (Mettler Toledo Seven Compact, Tokyo Japan).

2.5. Effective Cation Exchange Capacity, Base Saturation%, Al:Ca Ratio, and Effective Acidity Calculated by the Following Formula

The soil effective cation exchange capacity (ECEC) was calculated by adding all the exchangeable base cations on an equivalent basis. The fractions of base cations, such as K+, Na+, Ca2+, and Mg2+, in ECEC were calculated as the base saturation, while the effective acidity was measured by combining exchangeable aluminum and hydrogen ions [42]. The calculations are as given below:
ECEC (cmolkg−1) = K+ + Na+ + Mg2+ + Ca2+ + Mn2+ + Fe3+ + Al3+ + H+ (add on equivalent basis).
BS% = (K+ + Na+ + Mg2+ + Ca2+)/CEC × 100
Al:Ca = Al3+/Ca2+
E.A (cmolkg−1) = Al3+ + H+

3. Statistical Analysis

ANOVA of factorial design for forest types, fertilization, soil aggregates, and their interactions were carried out to examine whether the N and P fertilizers affected the exchangeable cations or otherwise. The Shapiro–Wilk test was used to check the normality, while the post-hoc Tukey honest significant difference (HSD) test was applied to compare treatments (Table 3). The heatmap for Pearson’s correlation coefficients was performed, in order to determine positive or negative correlations within soil chemical properties. Pearson’s correlation analysis was performed with the “corrplot” package in “R”, v. 3.6.1 [40]. A redundancy analysis (RDA) was used to identify the soil properties (i.e., soil acidity) that predicted the variations in the base cations. The RDA was performed with the “rda” function by using the “vegan” package in R, v. 3.6.1 [41,42,43]. All statistical analyses were performed in the program R, v. 3.6.1 [42]. SigmaPlot v. 12.5 (Systat Software Inc., San Jose, CA, USA) was used for graphical representations. Mean data were displayed as mean ± SE. If not noted otherwise, a significance level was reported at 0.05.

4. Results

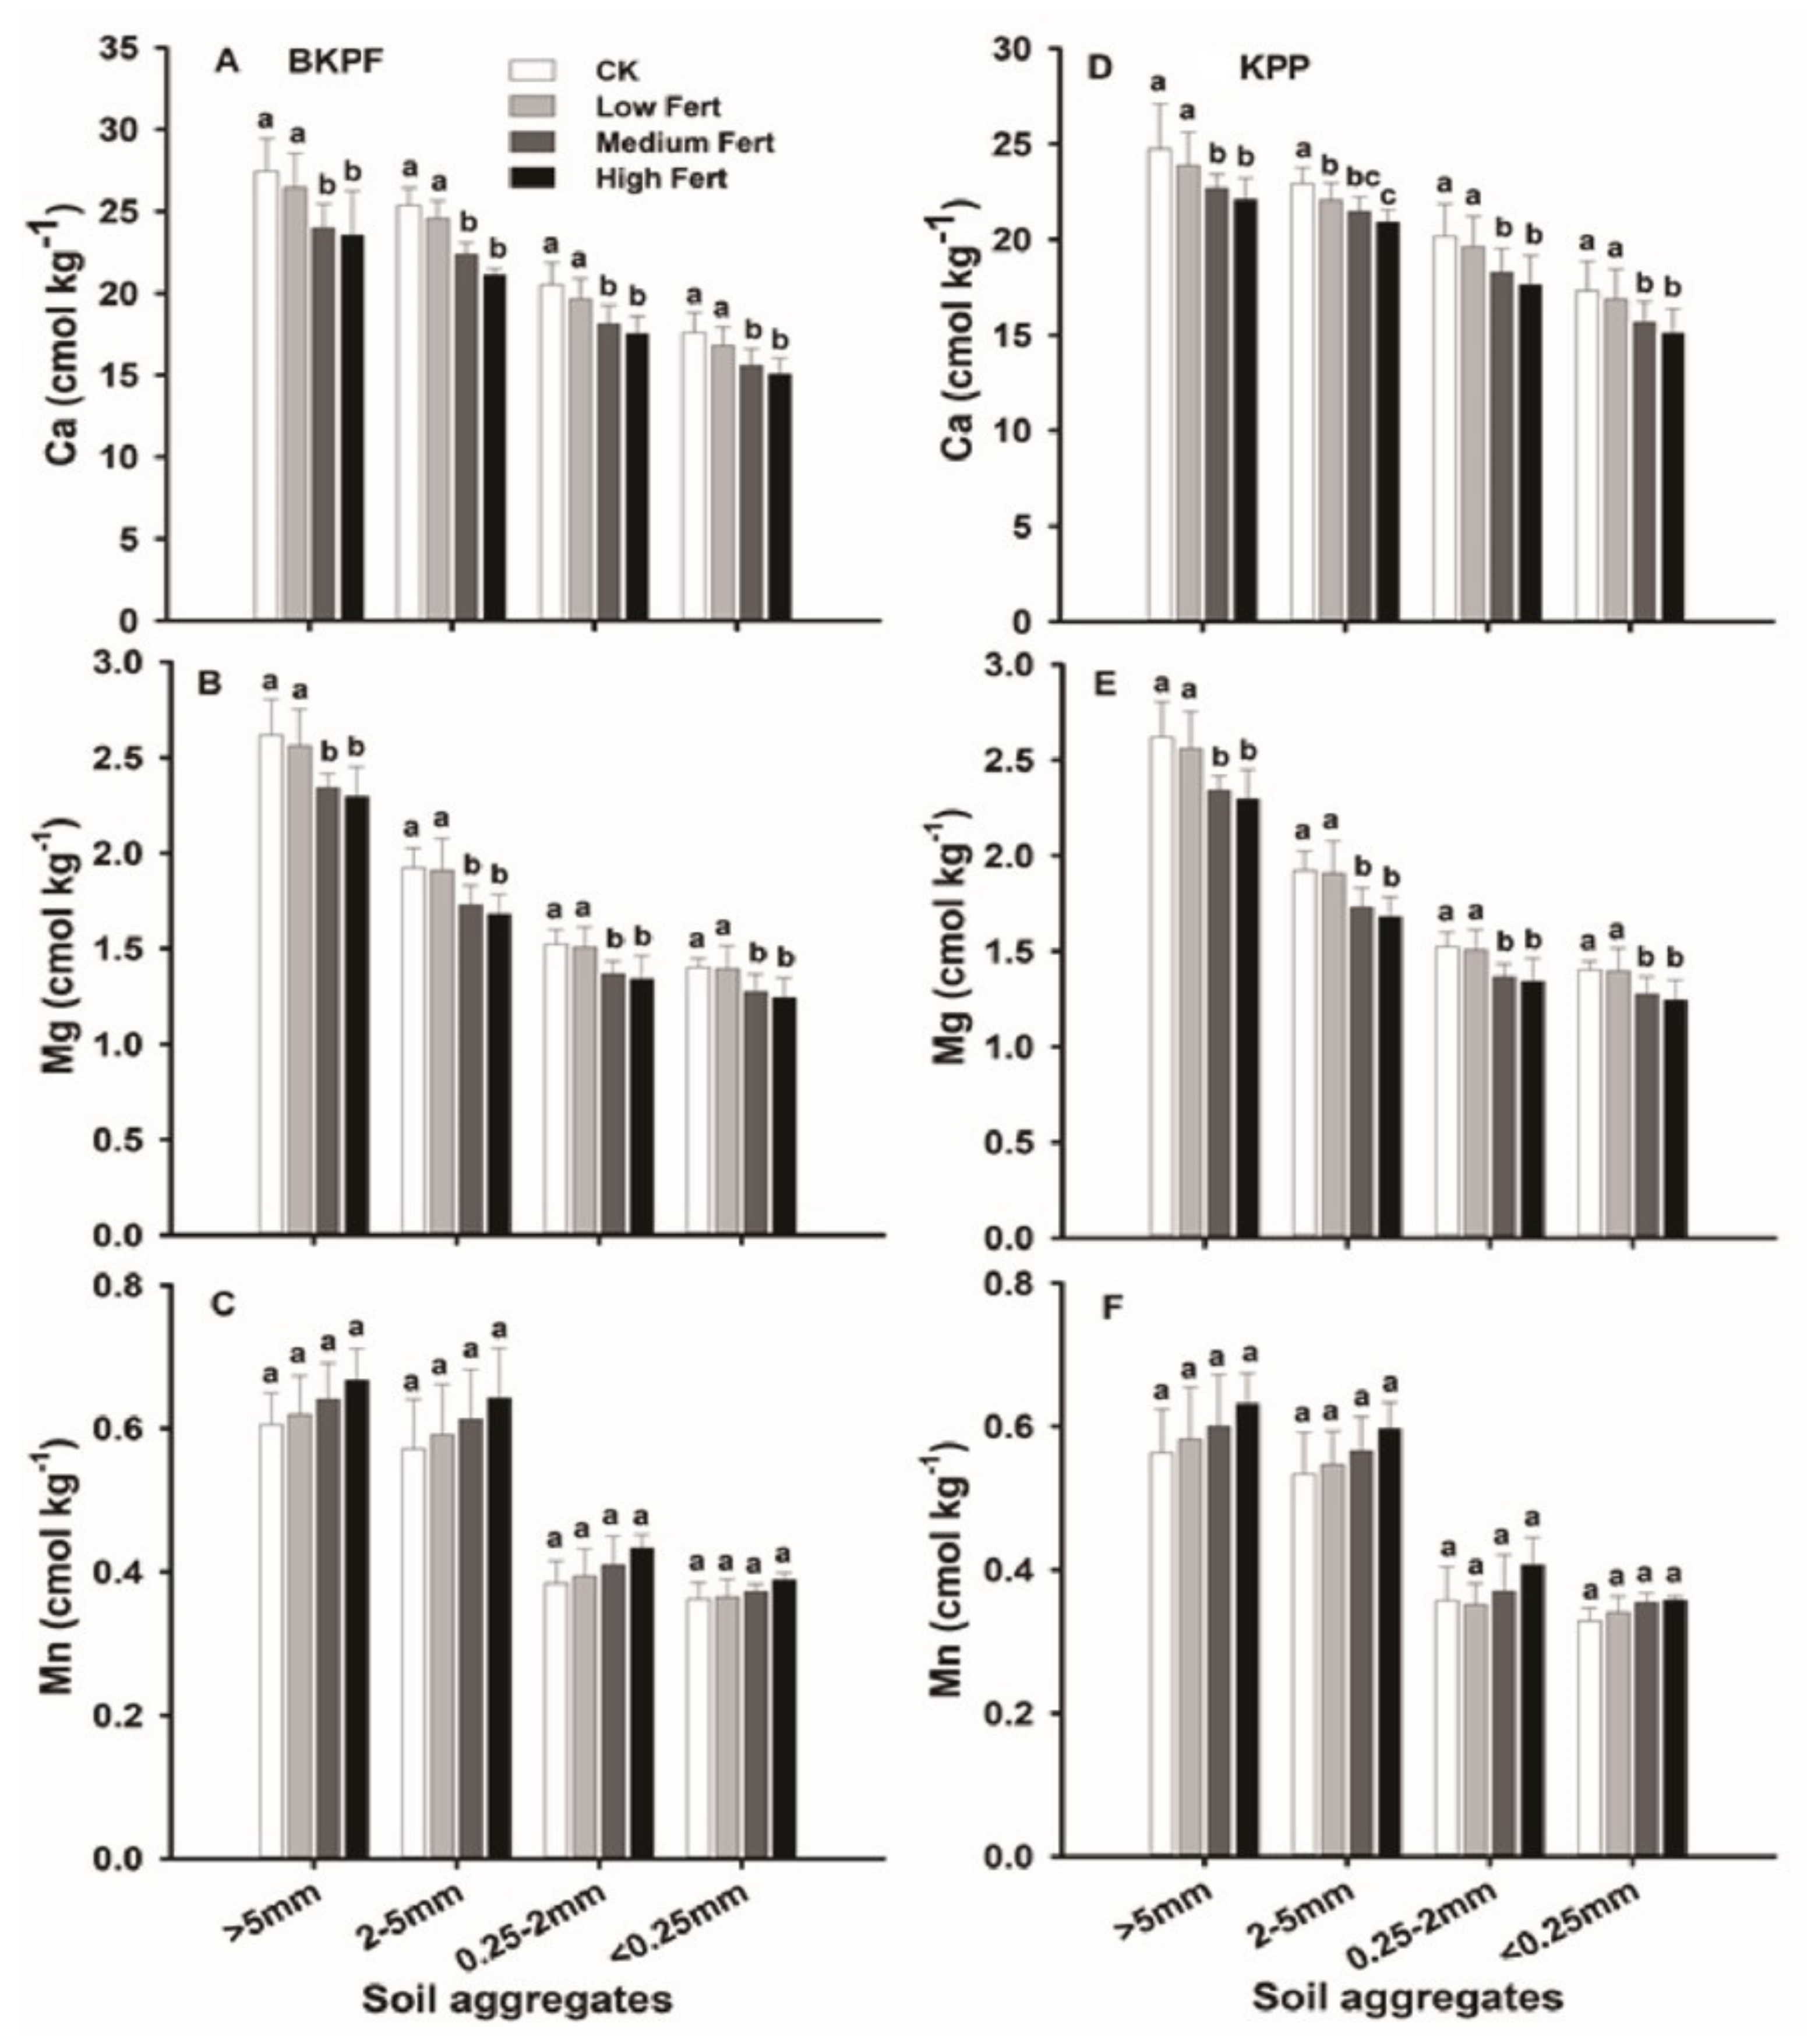
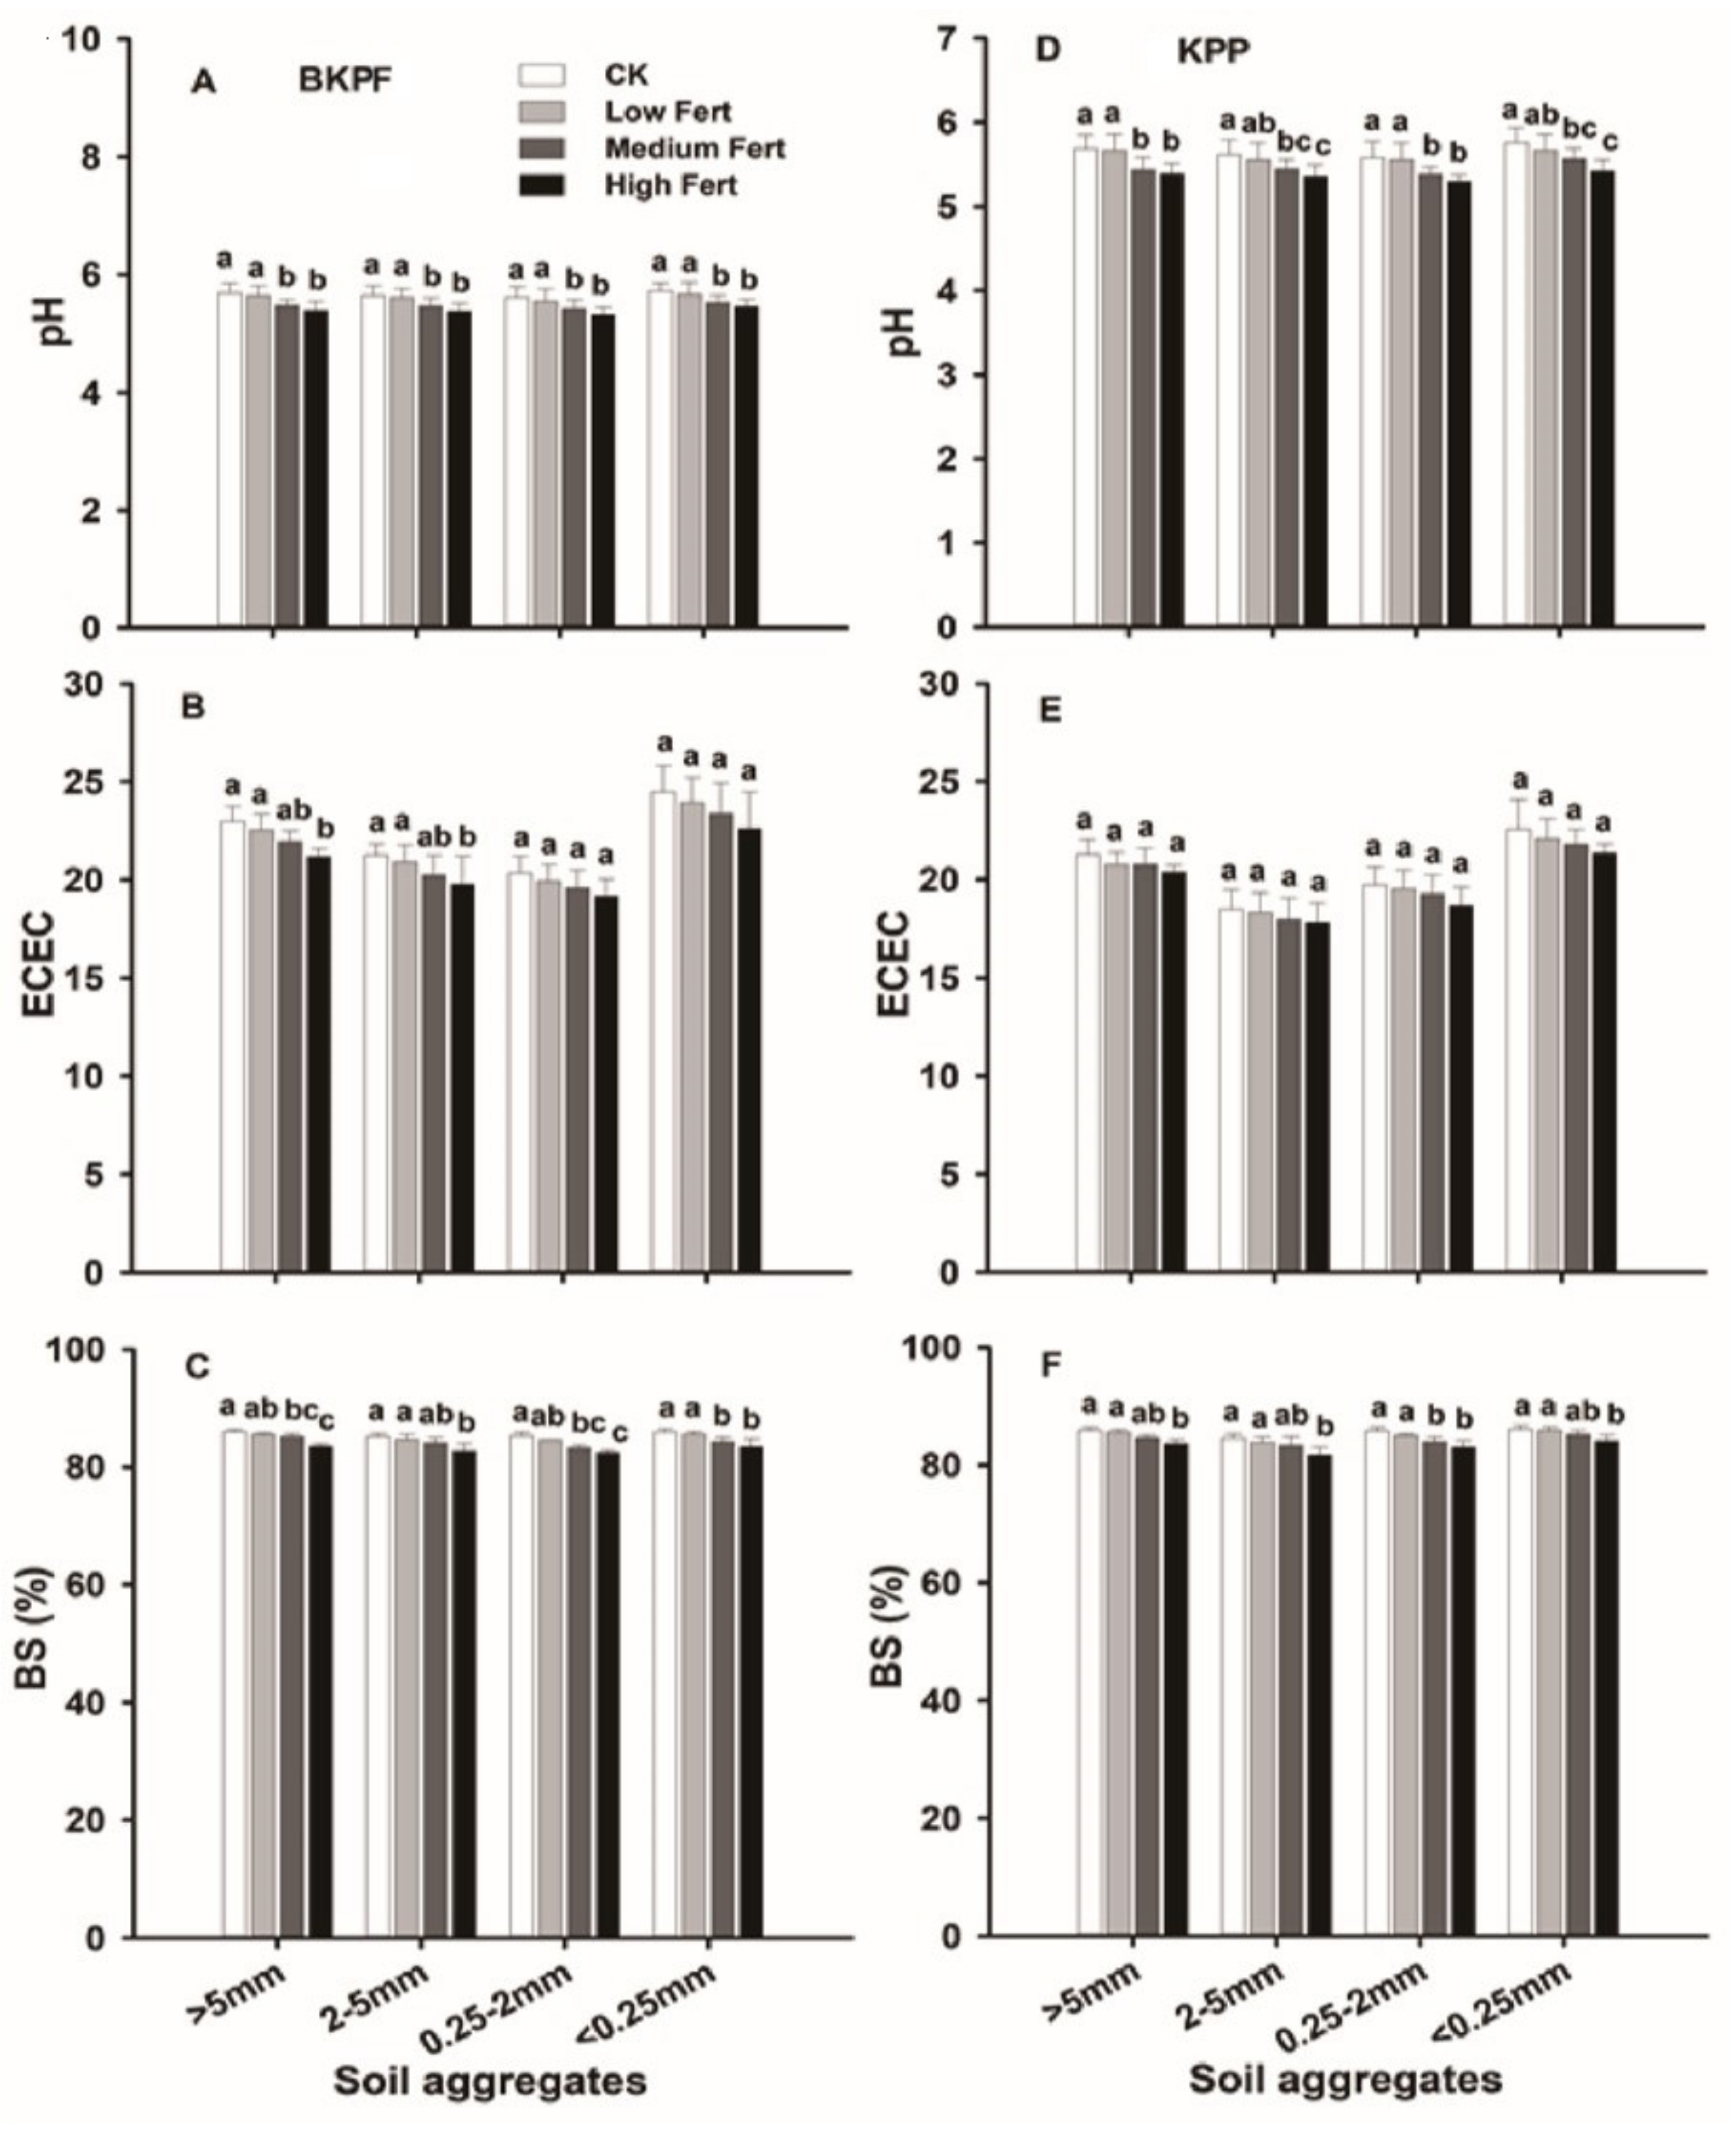
4.1. Impact of Simulated Nitrogen and Phosphorus Deposition on Soil Properties

Soil chemical properties were significantly affected by fertilization levels and soil aggregates across both forest types. The base cations, i.e., the Ca2+ and Mg2+ ions, were significantly decreased with the increase in fertilizer levels. Ca2+ ions decreased from 25 to 22 (>5 mm), 22 to 19 (2–5 mm), 20 to 18 (0.25–2 mm), and 27 to 23 (<0.25 mm) in BKPF. The overall observed amounts of Ca2+ ions in KPP were comparatively less to BKPF; however, the decreasing trend under high fertilization was similar. The overall results are depicted in Figure 1. Similarly, Mg2+ ions decreased with the increase in NP application quantities. The highest value was observed in the control plot, as 2.62 (<0.25 mm), which was decreased to 2.42 under high fertilization in BKPF, while the minimum value of 2.17 (>5 mm) was observed in the high fertilization treatment in KPP. The overall detailed results are depicted in Figure 1, while Mn2+ Na+ and K+ remained constant under medium and high fertilization, across all soil aggregates and both forests. In contrast, the effective acidity (Al3+ and H+) and Fe3+ significantly increased under medium and high fertilization, across all soil aggregates, relative to control and low fertilization. Al3+ ions were initially observed as 4.99 in the control plots, which increased to 5.72 in macro-aggregates, while its value increased from 5.09 in the control to 5.48 in (<0.25 mm) under high fertilization in KPP.
The similar increasing trend was present in KPP as depicted in Figure 2. Soil pH significantly decreased by medium and high fertilization in all soil aggregates across both forest types. The initial pH and other ions were determined, and the results are depicted in Figure 2. After fertilizer application the soil pH decreased, i.e., a value of 5.69 was observed initially in >5 mm aggregate, which decreased to 54 under high fertilizer in BKPF.
The same decreasing trend was observed in all aggregates. In KPP soil, pH was observed as 5.42 under high dose (>5 mm), while a value of 5.36 (5.2 mm) was observed in high dose. The detailed values are depicted in Figure 2. In contrast, soil was not significantly affected by soil aggregates and forest types. We observed that BKPF forest type performed better than KPP forest (BKPF > KPP) (Figure 1). NO3–N and soil organic C significantly increased, while AP significantly decreased with fertilization across both forests. In contrast, total N, ammonium N (Figure 3), total phosphorus, and C:N did not significantly affect fertilization across all soil aggregates across both forests. While the effects of low fertilization remained stable.

4.2. Impact of Soil Aggregates on Soil Properties

While Ca2+, Mg2+, Mn2+, Al3+, H+, and Fe3+ were significantly varied across all soil aggregates, and the greatest concentrations were observed in large macro-aggregates (i.e., >5 mm) as 25.4, 2.53, 0.61, 4.99, 0.60, and 2.8, respectively, under control plots. Ca2+ ion decreased with decrease in soil aggregate size. The similar situation was observed for Mg2+ (Figure 1) the least concentrations were observed in small micro-aggregates (i.e., <0.25 mm). In contrast, the Na+, Mg+, and soil pH remained constant, while Al3+ decreased (but not significant) across all soil aggregates in both forests (Table 4). Soil organic C, NH4–N, TP, and C:N significantly decreased, while AP significantly increased by soil aggregates. However, the impact of soil aggregates on total N and NO3–N remained constant (Figure 3). The Al: Ca ratio and proportion percentage significantly decreased by soil aggregates. While impact of soil aggregates on ECEC was not consistent, ECEC significantly decreased in aggregates >5 mm to <0.25–2 mm and increased in <0.25 mm.

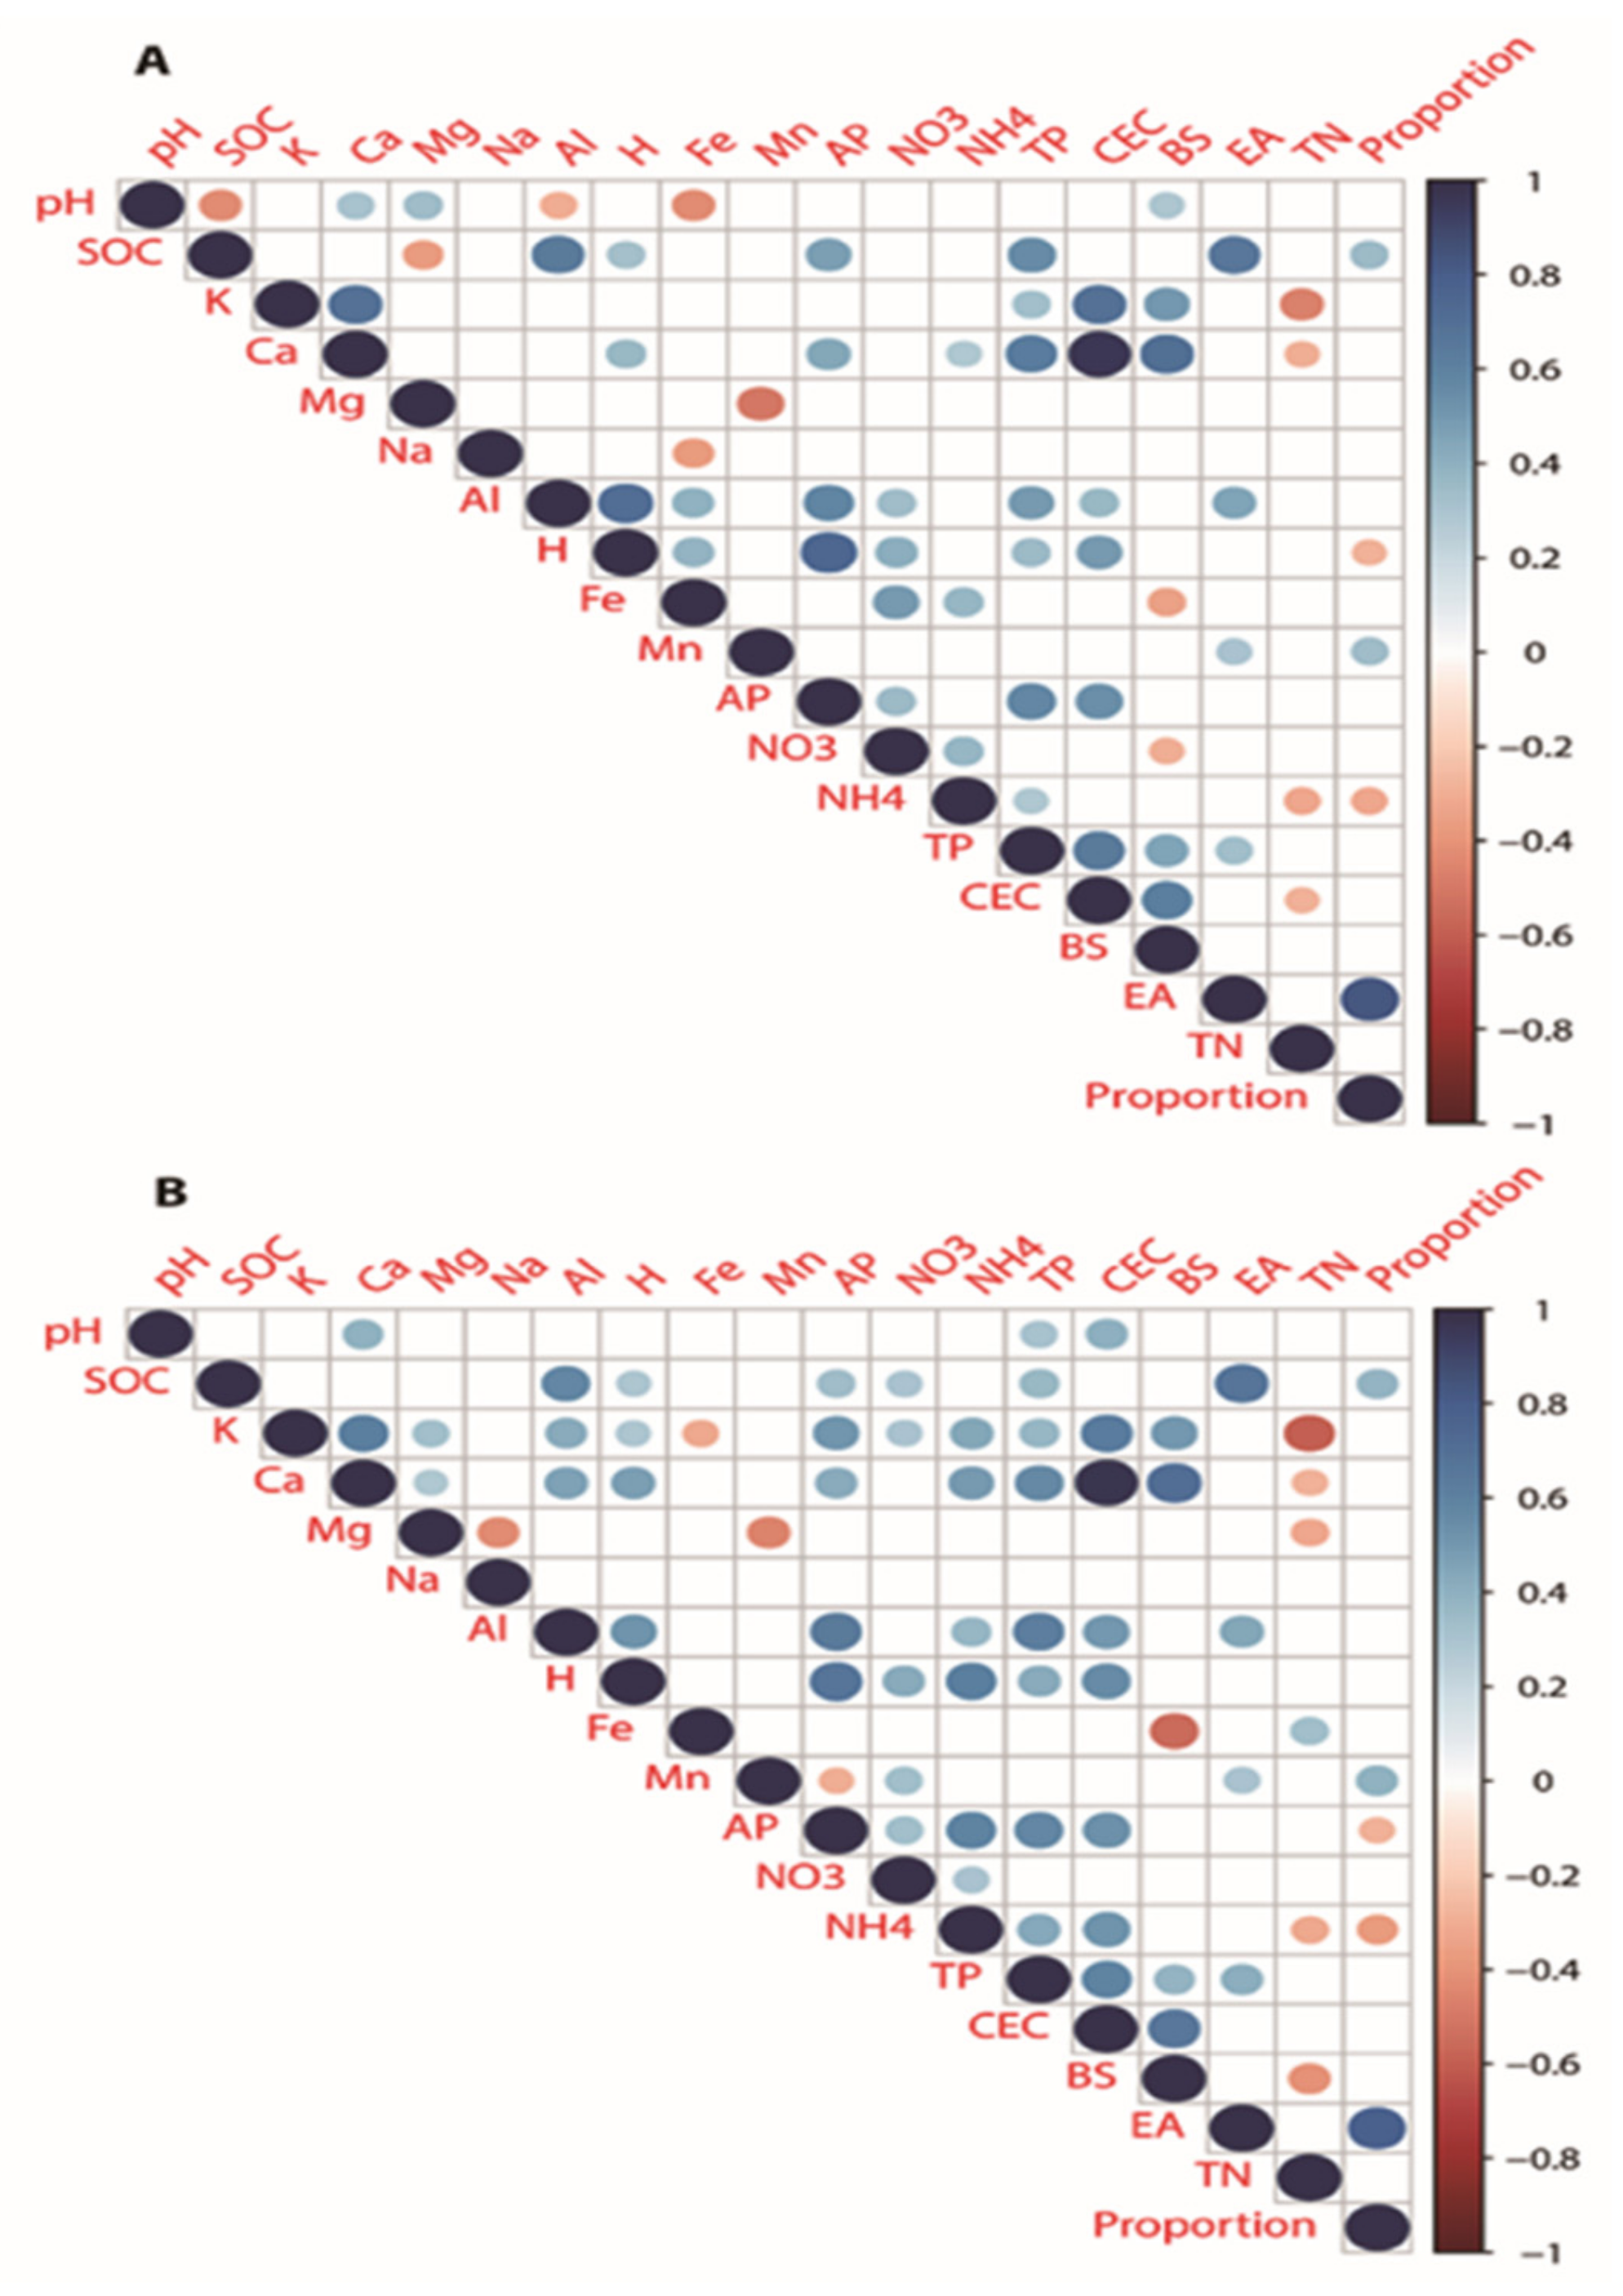
4.3. Correlation of Soil Properties

The trait interrelations, across forest types, i.e., BKPF (A) and KPP (B); soil pH was found to be significantly negatively correlated to SOC, Al, and Fe, while significantly positively correlated to Mg2+ and BS% in BKPF, as well as significantly positively correlated to TP and ECEC in KPP (Figure 4B). SOC was significantly negatively correlated to Mg in BKPF and significantly positively correlated to NO3 in KPP. K was significantly positively correlated to Al3+, H+, AP, NO3–N, and NH4–N, while significantly negatively correlated to Fe in KPP. Ca2+ was significantly positively correlated to Mg2+ and Al3+ in KPP. Mg was significantly negatively correlated to Na+ and TN in KPP. Na+ was significantly negatively correlated to Fe in BKPF. Al3+ was significantly positively correlated to Fe3+ and NO3–N in BKPF, while significantly positively correlated to NH4–N in KPP. H+ was significantly positively correlated to Fe in BKPF, while significantly positively correlated to NH4–N in KPP. Fe was significantly positively correlated to NO3–N and NH4–N in BKPF, while significantly positively correlated to TN in KPP. Mn2+ was significantly negatively correlated to AP, while significantly positively correlated to NO3–N in KPP. AP was significantly positively correlated to NH4–N in KPP. NO3–N was significantly negatively correlated to BS in BKPF. NH4–N was significantly positively correlated to ECEC in KPP. ECEC was significantly negatively correlated to TN in BKPF. BS was significantly negatively correlated to TN in KPP (Figure 4B).

4.4. Interrelation of Soil Properties with the Soil Related Environmental Parameters

The redundancy analysis (RDA) revealed the interrelations between soil properties and soil related environmental parameters (soil pH, EA, BS%, ECEC, H+, Fe3+, and Al3+) (Figure 5). The first and second axis of RDA accounted for 47.2% and 15.3% of the total variations, respectively. Al3+, H+, and ECEC have a strong positive effect on TP, NO3, AP K+, Ca2+, and NH4–N, with a strong negative effect on the proportion % and TN (Figure 5). Similarly, E.A has a strong positive impact on SOC, Mn2+, and proportion %, with a weak correlation with AP, TP, NO3–N, Ca2+, and K+. However, Fe3+, BS, and pH weakly correlated to either parameter (Figure 5).

5. Discussion

The results of this study showed that pH significantly decreased in medium and high doses of NP, across all the soil aggregates in (BKPF) broadleaf Korean pine and (KPP) artificial Korean pine forests. In our results, the soil PH was generally observed in the range of 5.4–5.72 for BKPF, while it varied between 5.54–5.76 initially; however, the addition of NP significantly decreased the value, especially under high fertilization rates. The same was stated by Mao et al. [43], who revealed that NP addition significantly decreased soil pH, and a significant increase was observed in soil exchange Al/Ca ratio; however, they also studied the impact of N and P as a single treatment, as well as in the form of combination, and the phosphorus-treated plot does not implicate significant effects on the soil PH and Al/Ca ratio. The cause of the increase in effective acidity (E.A) across large macro-aggregates remains stable in meso and micro-aggregates. These findings are in line with the previous study of Zarif et al. [44], wherein they reported that the addition of fertilizer causes acidification, decreases pH, and increases effective acidity—a significant increase in E.A in medium and high NP additional plots showed an increase of nitrification process and Al and Fe’s solubilization was responsible for decreasing P binding considerably [12,45].
Our results are in line with the previous study of Wang et al. [39], who reported that BS% and pH decreased significantly by N addition in two different temperate forests [46,47]. This proves that the addition of P causes a buffering effect and keeps pH stable [12,43,44]. The cation pool’s composition trend also shows that the targeted forests are probably approaching Al buffering stage. This indicates that the significant increase in Al/Ca ratios and decrease in BS% may cause the trees at a high risk of Al stress [13,43,46]. These results also confirm the previous study conducted in mono and mixed plantations in the temperate zone of northeast China, where a significant increase in Al/Ca ratio was observed in N additional plots [44]. In addition to that, a similar kind of pattern was also observed after long-term fertilization addition in tropical forests, where it was proposed that N saturation was a major cause of N-induced soil acidification [43]. This may attribute to the base cation depletion within soil aggregates, which accelerate a reduction in the buffering capacity of the soil and increase soil acidification [38]. However, Mori et al. [47] found that exchangeable cations and base saturation percentages remain stable under P addition. In another study, it was revealed that an increase in exchangeable base cations, in a two-year of P fertilization experiment, increased Fe3+ and Al3+ ions, which could be responsible for the decline in base cations, such as Ca2+ and Mg2+. Which may be responsible for nutrient degradation and acidification, all of which have a negative impact on forest health and fertility [11,48].
Interestingly, we observed no significant effect of fertilization on Na+ and K+ concentration. This might be because of the selective weathering and depletion of particular base cations, such as Ca2+ and Mg2+ [49]. Our study is in line with Lu et al. [50], who reported that selective weathering of base cations, such as Ca > Na > Mg > K, causes a decrease in base cation budgets and the imbalance of metal ions in the soil. Studies also suggest that the source of nitrogen fertilization may also affect the displacement of the cations. For example, Lucas et al. [51] stated that the use of NH4NO3 decreased Ca2+, Mg2+, and K from bulk soils, while the use of ammonium sulphate [(NH4)2SO4] decreased Ca2+ ions. In our study, the nitrogen source was also ammonium sulphate; however, an increase in both Ca2+ and Mg2+ was observed. Such differences from fertilizer sources needs to be cleared up in the future studies. Previously, Katou et al. [52] stated the influence of NH4–N to displace base cations (Ca2+, Mg2+, K+, and Na+). They further stated that base cations are displaced and bind to the soil surface, which is easily leached down, thus reducing the buffering against acidification [53]. Our study observed a significant increase of NO3–N, with high NP application within large macro-aggregates across BKPF and KPP. At the same time, NH4 remains stable with NP fertilizer application. The non-significant effect of NH4–N indicates an increase in nitrification and decrease in ammonification, suggesting that the forest is going toward the saturation of N [54]. N inputs can create a balance between the production and consumption of the H+ ion and play a significant role in N mineralization. Furthermore, Al3+ is hydrolyzed and H+ is released into the soil solution, lowering the pH [55]; our findings support the argument, demonstrating that exchangeable acid cations (H+ and Al+3), predominated in soil cation pools, with both amounts considerably higher than any base cation at the equivalent base. These cation composition trends often indicate that the forest soils are heading to the Al buffering stage [13].
Our study observed a significant decrease in Ca2+ and Mg2+ in medium and high NP additional plots across all aggregates and forests. Previously, many scientists have stated that N fertilization over scale can alter the base cation pool size, both in terrestrial and aquatic ecosystems [56,57,58,59]. Mao et al. [43] also claimed a decrease in soil exchangeable Ca2+, but other cations remained unaffected. The result obtained in our study stated increase in Ca2+ and mg ions while other cations (Mn2+, Na+, and K+ remained constant). Our results are in accordance with the previous study, conducted by Lu et al. [60]; they reported an increase in Al3+ and H+, with a decrease in Ca2+ and Mg2+, in three contrasting tropical forests forest. High concentrations of Al oxides and low BS have also been found in many other tropical ecosystems. In addition to that, we also observed that there was no significant effect of fertilization on soil total P, which attributes that there is a balance between net litter input and net nutrients output of the plant uptake. Carbon rise may be attributed to lower litter decomposition under medium- and high-nitrogen additives, as well as N inhibition of lignin-degrading microbial enzymes [54,61,62]. This also indicates that the addition results in a surplus of surface nitrogen and reduction in litter decomposer demand for nitrogen [54,61]. Generally, soil C concentration processes under N additions are influenced by the original N concentration in the soil, plant types, forest form, and site conditions [63]. Interestingly, we observed no significant impact of low dose fertilization on soil acidity across the two forest types in all soil aggregates. Our results revealed that soil conditions, among the two studied forests, were significantly affected by the applied fertilizers. The response of N and P towards soil conditions is based on many factors. Among them, site conditions and environmental factors influence the acidification resultant of N application. A high amount of organic matter in soil can suppress acidification because a greater cation exchange capacity is present, as compared to mineral soils [64,65]. Our results are similar to that of Gundersen et al. [66] they stated that soils with N saturation are likely to be more prone to soil acidification. Tree species also play an important role in the determination of factors contributing in soil acidification, generally conifer tree species acidify soils more, as compared to non-conifers type species [67,68]. Conifers tend to secrete organic acids by mycorrhizal rots and absorb base cations [69]. All such biotic and abiotic factors are indicators of the N response to acidification in various ecosystems. Hence, we can say that only addition of NP in soil does not determine the level of acidification caused through them; however, the studies related to interaction between environmental factors, soil microorganisms, and their mode of action need to be studied in detail. The initial/control soil plots are actual representatives of soil environment that influence the end results of the experiment.

6. Conclusions

Our study revealed that, with medium and high doses of combined N and P fertilizer pH, Ca2+ Mg2+ BS% decreased within large macro-aggregate sizes across forests. Similarly, E.A, Al:Ca, exchangeable Al3+, Fe3+, and H+ increased with medium and high doses of fertilizer. This suggests that the addition of nitrogen reduces Ca2+ and Mg2+, and the depletion of Ca2+ and Mg2+ causes an increase in Al3+ and H+ inside large-macro aggregates, which causes soil acidification, which eventually has an effect on forest fertility and health. Overall, the concentration of base cations is ranked as BKPF > KPP. A significant increase in the Al/Ca ratio indicates that forests are under Al stress and approaching Al buffering. The addition of P had a buffering impact, but it did not help to reduce soil acidity. Nutrient imbalances will result from changes in the availability elements among soil fractions, which are responsible for different nutrient retention and cycling processes. This research provided in-depth knowledge of the factors that will influence soil acidification in a temperate ecosystem.

Author Contributions

Conceptualization, M.A.J., W.D. and L.C.; methodology, M.A.J., W.D. and L.C.; software, N.Z., A.K. and K.A.; formal analysis, A.H., M.A.J., C.L., Q.G., M.Q. and K.K.; investigation and resources, C.L., Q.G., M.Q. and Y.W.; writing—original draft preparation, M.A.J.; writing—review and editing, M.A.J., A.H., A.K., N.Z., K.A. and K.K.; visualization, M.A.J. and K.A.; supervision, W.D. and L.C.; project administration, W.D. and L.C.; funding acquisition, W.D. and L.C. All authors have read and agreed to the published version of the manuscript.

Funding

This research was financially supported by the Fundamental Research Funds for the Central Universities (2572021DT04) and National Natural Science Foundation of China (31770656, 31670627).

Institutional Review Board Statement

Not applicable.

Informed Consent Statement

Not applicable.

Data Availability Statement

The data that support the findings of this study are available from the corresponding author upon reasonable request.

Acknowledgments

We are thankful to Ali Abid, Saif Ullah, and Waqar, Zhao Xifeng for their valuable suggestions, as well as laboratory fellow Wang Mei Li for helping and sharing her experiences.

Conflicts of Interest

The authors declared no conflict of interest.

References

  1. Elser, J.J.; Bracken, M.E.; Cleland, E.E.; Gruner, D.S.; Harpole, W.S.; Hillebrand, H.; Ngai, J.T.; Seabloom, E.W.; Shurin, J.B.; Smith, J.E. Global analysis of nitrogen and phosphorus limitation of primary producers in freshwater, marine and terrestrial ecosystems. Ecol. Lett. 2007, 10, 1135–1142. [Google Scholar] [CrossRef] [PubMed] [Green Version]
  2. Vitousek, P.M.; Porder, S.; Houlton, B.Z.; Chadwick, O.A. Terrestrial phosphorus limitation: Mechanisms, implications, and nitrogen–phosphorus interactions. Ecol. Appl. 2010, 20, 5–15. [Google Scholar] [CrossRef] [PubMed] [Green Version]
  3. Cape, J.N.; Freer-Smith, P.H.; Paterson, I.S.; Parkinson, J.A.; Wolfenden, J.J.T. The nutritional status of Picea abies (L.) Karst. across Europe, and implications for ‘forest decline’. Trees 1990, 4, 211–224. [Google Scholar] [CrossRef]
  4. Vadas, P.; Sims, J. Soil Fertility: Phosphorus in Soils. J. Environ. Qual. 2014, 28, 1870–1877. [Google Scholar] [CrossRef]
  5. Hou, E.; Luo, Y.; Kuang, Y.; Chen, C.; Lu, X.; Jiang, L.; Luo, X.; Wen, D. Global meta-analysis shows pervasive phosphorus limitation of aboveground plant production in natural terrestrial ecosystems. Nat. Commun. 2020, 11, 637. [Google Scholar] [CrossRef] [PubMed] [Green Version]
  6. LeBauer, D.S.; Treseder, K.K. Nitrogen limitation of net primary productivity in terrestrial ecosystems is globally distributed. Ecology 2008, 89, 371–379. [Google Scholar] [CrossRef] [Green Version]
  7. Vitousek, P.M.; Howarth, R.W. Nitrogen limitation on land and in the sea: How can it occur? Biogeochemistry 1991, 13, 87–115. [Google Scholar] [CrossRef]
  8. Yang, Y.; Ji, C.; Ma, W.; Wang, S.; Wang, S.; Han, W.; Mohammat, A.; Robinson, D.; Smith, P. Significant soil acidification across northern China’s grasslands during 1980s–2000s. Glob. Change Biol. 2012, 18, 2292–2300. [Google Scholar] [CrossRef]
  9. Bowman, W.D.; Cleveland, C.C.; Halada, Ĺ.; Hreško, J.; Baron, J.S.J.N.G. Negative impact of nitrogen deposition on soil buffering capacity. Nat. Geosci. 2008, 1, 767–770. [Google Scholar] [CrossRef]
  10. Wang, R.; Dungait, J.A.; Buss, H.L.; Yang, S.; Zhang, Y.; Xu, Z.; Jiang, Y.J. Base cations and micronutrients in soil aggregates as affected by enhanced nitrogen and water inputs in a semi-arid steppe grassland. Sci. Total Environ. 2017, 575, 564–572. [Google Scholar] [CrossRef] [Green Version]
  11. Malhi, S.; Nyborg, M.; Harapiak, J.T. Effects of long-term N fertilizer-induced acidification and liming on micronutrients in soil and in bromegrass hay. Soil Tillage Res. 1998, 48, 91–101. [Google Scholar] [CrossRef]
  12. Yang, K.; Zhu, J.; Gu, J.; Yu, L.; Wang, Z. Changes in soil phosphorus fractions after 9 years of continuous nitrogen addition in a Larix gmelinii plantation. Ann. For. Sci. 2015, 72, 435–442. [Google Scholar] [CrossRef]
  13. Ulrich, B. Natural and anthropogenic components of soil acidification. Z. Pflanz. Bodenkd. 1986, 149, 702–717. [Google Scholar] [CrossRef]
  14. Małek, S.; Astel, A. The effect of stand age on throughfall chemistry in spruce stands in the Potok Dupniański Catchment in the Silesian Beskid Mountains, Southern Poland. Sci. World J. 2007, 7, 181. [Google Scholar] [CrossRef] [PubMed] [Green Version]
  15. Małek, S.; Astel, A. Throughfall chemistry in a spruce chronosequence in southern Poland. Environ. Pollut. 2008, 155, 517–527. [Google Scholar] [CrossRef] [PubMed]
  16. Reuss, J.O.; Johnson, D.W. Acid Deposition and the Acidification of Soils and Waters; Springer Science & Business Media: Berlin/Heidelberg, Germany, 2012; Volume 59. [Google Scholar]
  17. Rhoades, C.C. Single-tree influences on soil properties in agroforestry: Lessons from natural forest and savanna ecosystems. Agrofor. Syst. 1996, 35, 71–94. [Google Scholar] [CrossRef]
  18. Binkley, D.; Giardina, C. Why do tree species affect soils? The warp and woof of tree-soil interactions. In Plant-Induced Soil Changes: Processes and Feedbacks; Springer: Berlin/Heidelberg, Germany, 1998; pp. 89–106. [Google Scholar]
  19. Bardgett, R.D.; Bowman, W.D.; Kaufmann, R.; Schmidt, S.K. A temporal approach to linking aboveground and belowground ecology. Trends Ecol. Evol. 2005, 20, 634–641. [Google Scholar] [CrossRef] [PubMed]
  20. West, J.B.; Hobbie, S.E.; Reich, P.B. Effects of plant species diversity, atmospheric [CO2], and N addition on gross rates of inorganic N release from soil organic matter. Glob. Change Biol. 2006, 12, 1400–1408. [Google Scholar] [CrossRef]
  21. Shi, B.; Jin, G. Variability of soil respiration at different spatial scales in temperate forests. Biol. Fertil. Soils 2016, 52, 561–571. [Google Scholar] [CrossRef]
  22. Penuelas, J.; Janssens, I.A.; Ciais, P.; Obersteiner, M.; Sardans, J. Anthropogenic global shifts in biospheric N and P concentrations and ratios and their impacts on biodiversity, ecosystem productivity, food security, and human health. Glob. Change Biol. 2020, 26, 1962–1985. [Google Scholar] [CrossRef] [Green Version]
  23. Jia, Y.; Yu, G.; He, N.; Zhan, X.; Fang, H.; Sheng, W.; Zuo, Y.; Zhang, D.; Wang, Q. Spatial and decadal variations in inorganic nitrogen wet deposition in China induced by human activity. Sci. Rep. 2014, 4, 3763. [Google Scholar] [CrossRef] [Green Version]
  24. Pan, Y.; Wang, Y.; Tang, G.; Wu, D. Wet and dry deposition of atmospheric nitrogen at ten sites in Northern China. Atmos. Chem. Phys. 2012, 12, 6515–6535. [Google Scholar] [CrossRef] [Green Version]
  25. Harris, G. Ecological Stoichiometry: Biology of Elements from Molecules to the Biosphere; $29.95; Sterner, R.W., Elser, J.J., Eds.; Princeton University Press: Princeton, NJ, USA, 2002; Oxford University Press: Oxford, UK, 2003; ISSN 0-691-07491-7. [Google Scholar]
  26. Goll, D.S. Coupled Cycling of Carbon, Nitrogen, and Phosphorus; CRC Press: Boca Raton, FL, USA, 2016; Available online: https://opus.bibliothek.uni-augsburg.de/opus4/frontdoor/index/index/docId/67024 (accessed on 12 February 2022).
  27. Gress, S.E.; Nichols, T.D.; Northcraft, C.C.; Peterjohn, W.T. Nutrient limitation in soils exhibiting differing nitrogen availabilities: What lies beyond nitrogen saturation? Ecology 2007, 88, 119–130. [Google Scholar] [CrossRef] [Green Version]
  28. Marklein, A.R.; Houlton, B.Z. Nitrogen inputs accelerate phosphorus cycling rates across a wide variety of terrestrial ecosystems. New Phytol. 2012, 193, 696–704. [Google Scholar] [CrossRef]
  29. Weand, M.P.; Arthur, M.A.; Lovett, G.M.; McCulley, R.L.; Weathers, K.C. Effects of tree species and N additions on forest floor microbial communities and extracellular enzyme activities. Soil Biol. Biochem. 2010, 42, 2161–2173. [Google Scholar] [CrossRef]
  30. Sinsabaugh, R.L.; Gallo, M.E.; Lauber, C.; Waldrop, M.P.; Zak, D.R. Extracellular enzyme activities and soil organic matter dynamics for northern hardwood forests receiving simulated nitrogen deposition. Biogeochemistry 2005, 75, 201–215. [Google Scholar] [CrossRef] [Green Version]
  31. Nave, L.; Vance, E.; Swanston, C.; Curtis, P. Impacts of elevated N inputs on north temperate forest soil C storage, C/N, and net N-mineralization. Geoderma 2009, 153, 231–240. [Google Scholar] [CrossRef]
  32. Cusack, D.F.; Silver, W.L.; Torn, M.S.; Burton, S.D.; Firestone, M.K. Changes in microbial community characteristics and soil organic matter with nitrogen additions in two tropical forests. Ecology 2011, 92, 621–632. [Google Scholar] [CrossRef] [PubMed] [Green Version]
  33. Futa, B.; Mocek-Płóciniak, A. The influence of uncontrolled grass burning on biochemical qualities of soil. J. Res. Appl. Agric. Eng. 2016, 61, 98–100. [Google Scholar]
  34. Wei, C.; Gao, M.; Shao, J.; Xie, D.; Pan, G. Soil aggregate and its response to land management practices. China Particuology 2006, 4, 211–219. [Google Scholar] [CrossRef]
  35. Ranatunga, T.D.; Reddy, S.S.; Taylor, R.W. Phosphorus distribution in soil aggregate size fractions in a poultry litter applied soil and potential environmental impacts. Geoderma 2013, 192, 446–452. [Google Scholar] [CrossRef]
  36. Wei, K.; Chen, Z.; Zhu, A.; Zhang, J.; Chen, L.J.S.; Research, T. Application of 31P NMR spectroscopy in determining phosphatase activities and P composition in soil aggregates influenced by tillage and residue management practices. Soil Tillage Res. 2014, 138, 35–43. [Google Scholar] [CrossRef]
  37. Zhang, S.; Li, Q.; Lü, Y.; Zhang, X.; Liang, W. Contributions of soil biota to C sequestration varied with aggregate fractions under different tillage systems. Soil Biol. Biochem. 2013, 62, 147–156. [Google Scholar] [CrossRef]
  38. Wang, R.; Dungait, J.A.; Creamer, C.A.; Cai, J.; Li, B.; Xu, Z.; Zhang, Y.; Ma, Y.; Jiang, Y. Carbon and Nitrogen Dynamics in Soil Aggregates under Long-Term Nitrogen and Water Addition in a Temperate Steppe. Soil Sci. Soc. Am. J. 2015, 79, 527–535. [Google Scholar] [CrossRef]
  39. Wang, R.; Creamer, C.A.; Wang, X.; He, P.; Xu, Z.; Jiang, Y. The effects of a 9-year nitrogen and water addition on soil aggregate phosphorus and sulfur availability in a semi-arid grassland. Ecol. Indic. 2016, 61, 806–814. [Google Scholar] [CrossRef] [Green Version]
  40. Wei, T.; Simko, V.; Levy, M.; Xie, Y.; Jin, Y.; Zemla, J. Package ‘corrplot’. Statistician 2017, 56, e24. [Google Scholar]
  41. Oksanen, J.; Blanchet, F.G.; Kindt, R.; Legendre, P.; Minchin, P.R.; O’hara, R.; Simpson, G.L.; Solymos, P.; Stevens, M.H.H.; Wagner, H. Package ‘vegan’. Community Ecol. Package Version 2013, 2, 1–295. [Google Scholar]
  42. R Core Team. R: A Language and Environment for Statistical Computing. 2013. Available online: https://www.scirp.org/(S(i43dyn45teexjx455qlt3d2q))/reference/ReferencesPapers.aspx?ReferenceID=1787696 (accessed on 12 February 2022).
  43. Mao, Q.; Lu, X.; Zhou, K.; Chen, H.; Zhu, X.; Mori, T.; Mo, J. Effects of long-term nitrogen and phosphorus additions on soil acidification in an N-rich tropical forest. Geoderma 2017, 285, 57–63. [Google Scholar] [CrossRef]
  44. Zarif, N.; Khan, A.; Wang, Q. Linking Soil Acidity to P Fractions and Exchangeable Base Cations under Increased N and P Fertilization of Mono and Mixed Plantations in Northeast China. Forests 2020, 11, 1274. [Google Scholar] [CrossRef]
  45. Dossa, E.; Khouma, M.; Diedhiou, I.; Sene, M.; Kizito, F.; Badiane, A.; Samba, S.; Dick, R. Carbon, nitrogen and phosphorus mineralization potential of semiarid Sahelian soils amended with native shrub residues. Geoderma 2009, 148, 251–260. [Google Scholar] [CrossRef]
  46. Cronan, C.S.; Grigal, D.F. Use of calcium/aluminum ratios as indicators of stress in forest ecosystems. J. Environ. Qual. 1995, 24, 209–226. [Google Scholar] [CrossRef]
  47. Mori, T.; Ohta, S.; Ishizuka, S.; Konda, R.; Wicaksono, A.; Heriyanto, J.; Hardjono, A.J.S.S.; Nutrition, P. Effects of phosphorus addition on N2O and NO emissions from soils of an Acacia mangium plantation. Soil Sci. Plant Nutr. 2010, 56, 782–788. [Google Scholar] [CrossRef] [Green Version]
  48. Katou, H. A pH-dependence implicit formulation of cation-and anion-exchange capacities of variable-charge soils. Soil Sci. Soc. Am. J. 2002, 66, 1218–1224. [Google Scholar] [CrossRef]
  49. Yin, J.; Wang, R.; Liu, H.; Feng, X.; Xu, Z.; Jiang, Y. Nitrogen addition alters elemental stoichiometry within soil aggregates in a temperate steppe. Solid Earth 2016, 7, 1565–1575. [Google Scholar] [CrossRef]
  50. Lu, X.; Mao, Q.; Gilliam, F.S.; Luo, Y.; Mo, J. Nitrogen deposition contributes to soil acidification in tropical ecosystems. Glob. Change Biol. 2014, 20, 3790–3801. [Google Scholar] [CrossRef]
  51. Lucas, R.; Klaminder, J.; Futter, M.; Bishop, K.H.; Egnell, G.; Laudon, H.; Högberg, P. A meta-analysis of the effects of nitrogen additions on base cations: Implications for plants, soils, and streams. For. Ecol. Manag. 2011, 262, 95–104. [Google Scholar] [CrossRef]
  52. Matschonat, G.; Matzner, E. Soil chemical properties affecting NH4+ sorption in forest soils. Z. Pflanz. Bodenkd. 1996, 159, 505–511. [Google Scholar] [CrossRef]
  53. Smith, S.; Read, D. Mycorrhizal Symbiosis, 3rd ed.; Academic Press: London, UK, 2008. [Google Scholar]
  54. Tafazoli, M.; Hojjati, S.M.; Jalilvand, H.; Lamersdorf, N. Simulated Nitrogen Deposition Reduces the Concentration of Soil Base Cations in Acer velutinum Bioss. Plantation, North of Iran. J. Soil Sci. Plant Nutr. 2019, 19, 440–449. [Google Scholar] [CrossRef]
  55. Uehara, G.; Gillman, G. The Mineralogy, Chemistry, and Physics of Tropical Soils with Variable Charge Clays; Westview Press, Inc.: Boulder, CO, USA, 1981. [Google Scholar]
  56. Sverdrup, H.; Rosen, K. Long-term base cation mass balances for Swedish forests and the concept of sustainability. For. Ecol. Manag. 1998, 110, 221–236. [Google Scholar] [CrossRef]
  57. Watmough, S.A.; Dillon, P. Base cation and nitrogen budgets for a mixed hardwood catchment in south-central Ontario. Ecosystems 2003, 6, 675–693. [Google Scholar] [CrossRef]
  58. Huntington, T.G. Assessment of calcium status in Maine forests: Review and future projection. Can. J. For. Res. 2005, 35, 1109–1121. [Google Scholar] [CrossRef]
  59. Horswill, P.; O’Sullivan, O.; Phoenix, G.K.; Lee, J.A.; Leake, J.R. Base cation depletion, eutrophication and acidification of species-rich grasslands in response to long-term simulated nitrogen deposition. Environ. Pollut. 2008, 155, 336–349. [Google Scholar] [CrossRef] [PubMed]
  60. Lu, X.; Mao, Q.; Mo, J.; Gilliam, F.S.; Zhou, G.; Luo, Y.; Zhang, W.; Huang, J. Divergent responses of soil buffering capacity to long-term N deposition in three typical tropical forests with different land-use history. Environ. Sci. Technol. 2015, 49, 4072–4080. [Google Scholar] [CrossRef] [PubMed]
  61. Mo, J.; Zhang, W.; Zhu, W.; Gundersen, P.; Fang, Y.; Li, D.; Wang, H. Nitrogen addition reduces soil respiration in a mature tropical forest in southern China. Glob. Change Biol. 2008, 14, 403–412. [Google Scholar] [CrossRef]
  62. Lovett, G.M.; Arthur, M.A.; Weathers, K.C.; Fitzhugh, R.D.; Templer, P.H. Nitrogen addition increases carbon storage in soils, but not in trees, in an eastern US deciduous forest. Ecosystems 2013, 16, 980–1001. [Google Scholar] [CrossRef]
  63. Xian-Kai, L.; Jiang-Ming, M.; Gundersern, P.; Wei-Xing, Z.; Guo-Yi, Z.; De-Jun, L.; Zhang, X. Effect of simulated N deposition on soil exchangeable cations in three forest types of subtropical China. Pedosphere 2009, 19, 189–198. [Google Scholar]
  64. Parfitt, R.L.; Giltrap, D.J.; Whitton, J.S. Contribution of organic matter and clay minerals to the cation exchange capacity of soils. Commun. Soil Sci. Plant Anal. 1995, 26, 1343–1355. [Google Scholar] [CrossRef]
  65. Šimanský, V.; Polláková, N. Soil organic matter and sorption capacity under different soil management practices in a productive vineyard. Arch. Agron. Soil Sci. 2014, 60, 1145–1154. [Google Scholar] [CrossRef]
  66. Gundersen, P.; Schmidt, I.K.; Raulund-Rasmussen, K. Leaching of nitrate from temperate forests effects of air pollution and forest management. Environ. Rev. 2006, 14, 1–57. [Google Scholar] [CrossRef]
  67. Finzi, A.C.; Canham, C.D.; Van Breemen, N. Canopy tree–soil interactions within temperate forests: Species effects on pH and cations. Ecol. Appl. 1998, 8, 447–454. [Google Scholar]
  68. Rigueiro-Rodríguez, A.; Mosquera-Losada, M.; Fernández-Núñez, E. Afforestation of agricultural land with Pinus radiata D. Don and Betula alba L. in nw Spain: Effects on soil pH, understorey production and floristic diversity eleven years after establishment. Land Degrad. Dev. 2012, 23, 227–241. [Google Scholar] [CrossRef]
  69. Sollins, P.; McCorison, F. Nitrogen and carbon solution chemistry of an old growth coniferous forest watershed before and after cutting. Water Resour. Res. 1981, 17, 1409–1418. [Google Scholar] [CrossRef]
Figure 1. Calcium (Ca2+) (cmol kg−1) (A,D), magnesium (Mg2+) (cmol kg−1) (B,E), and manganese ion (Mn2+) (cmol kg−1) (C,F) at the control (C: no additional deposition; white bars) and after low NP: 05-g N m−2 a−1 + 05-g N m−2 a−1; light grey, medium NP: 15-g N m−2 a−1 + 10-g N m−2 a−1; dark grey, and high NP: 30-g N m−2 a−1 + 20-g N m−2 a−1; black fertilization in respective soil aggregates >5 mm, 2–5 mm, 0.25–2 mm, and <0.25 in three replications at 0–20 cm soil depth of broad-leaved Korean pine forest (BKPF) and Korean pine forest (KPP) in Northeast (NE) China. Significant differences between treatments are indicated by different lower-case letters (Tukey’s HSD post hoc; p < 0.05; mean ± SE).
Forests 13 00529 g001
Figure 2. Soil pH (pH) (A,D), effective cation exchange capacity (ECEC) (B,E), and base saturation percentage (BS%) (C,F) at the control (C: no additional deposition; white bars) and after low NP: 05-g N m−2 a−1 + 05-g N m−2 a−1; light grey, medium NP: 15-g N m−2 a−1 + 10-g N m−2 a−1; dark grey, and high NP: 30-g N m−2 a−1 + 20-g N m−2 a−1; black fertilization in respective soil aggregates >5 mm, 2–5 mm, 0.25–2 mm, and <0.25 in three replications at 0–20 cm soil depth of mixed broad-leaved Korean pine forest (BKPF) and artificial Korean pine forest (KPP) in Northeast (NE) China. Significant differences between treatments are indicated by different lower-case letters (Tukey’s HSD post hoc; p < 0.05; mean ± SE).
Forests 13 00529 g002
Figure 3. Total nitrogen (A,D), NH4-N (mg kg−1)(B,E), and NO3-N (mg kg−1) (C,F) at the control (C: no additional deposition; white bars) and after low NP: 05-g N m−2 a−1 + 05-g N m−2 a−1; light grey, medium NP: 15-g N m−2 a−1 + 10-g N m−2 a−1; dark grey, and high NP: 30-g N m−2 a−1 + 20-g N m−2 a−1; black fertilization in respective soil aggregates >5 mm, 2–5 mm, 0.25–2 mm, and <0.25 in three replications at 0–20 cm soil depth of mixed broad-leaved Korean pine forest (BKPF) and artificial Korean pine forest (KPP) in Northeast (NE) China. Significant differences between treatments are indicated by different lower-case letters (Tukey’s HSD post hoc; p < 0.05; mean ± SE).
Forests 13 00529 g003
Figure 4. Heat map for Pearson’s correlation coefficients of soil aggregates and soil chemical properties mixed broad-leaved Korean pine forest (BKPF) (A) and artificial Korean pine forest (KPP) (B) in Northeast (NE) China. The chemical properties were identified in each sample by circle size and colors deduced from −1.0 to +1.0. Abbreviations: hydrogen ions (H+); potassium ions (K+); magnesium ions (Mg2+); manganese ions (Mn2+); sodium ions (Na+); calcium ions (Ca2+); aluminum ions (Al3+); iron ions (Fe3+); effective cation exchange capacity (ECEC); base saturation percentage (BS%); effective acidity (EA); ammonium (NH4+-N); nitrate (NO3+-N); total nitrogen (TN); soil organic carbon (SOC); soil pH.
Forests 13 00529 g004
Figure 5. The redundancy analysis (RDA) for soil properties from 0–20 cm soil depths in three replications at mixed broad-leaved Korean pine forest (BKPF) and artificial Korean pine forest (KPP), at four combined (NP) levels of fertilization (CK, 0 g N, and P), i.e., low (5 g N m−2 a−1; 5 g P m−2 a−1), medium (15 g N m−2 a−1 + 10 g P m−2 a−1), and high fertilization (30 g N m−2 a−1; 20 g P g m−2 a−1). Hydrogen ions (H); potassium ions (K); magnesium ions (Mg); manganese ions (Mn); sodium ions (Na); calcium ions (Ca); aluminum ions (Al); iron ions (Fe); effective cation exchange capacity (ECEC); base saturation percentage (BS); effective acidity (EA); ammonium (NH4+-N); nitrate (NO3-N); total nitrogen (TN); soil organic carbon (SOC); and total phosphorus (TP).
Forests 13 00529 g005
Table 1. Summary of the mixed broad-leaved Korean pine forest (BKPF) and planted Korean pine plantation (KPP).
Site Characteristics of Forest Stands
Forest StandMain Species CompositionLand Use HistoryAgeStand DensityMean DBHCanopy ClosureSoil Density
Forest Type(Year)(Trees/hm−2)(cm)(g/m−3)
Broad-leaved
Korean pine forest (BKPF)
Pinus koraiensis, Betula costata,
Tilia amurensis, Acer ukurunduense,
Abies nephrolepis, Ulmus laciniata,
Acer tegmentosum, and Fraxinus
Mandshurica
Natural forest>230117521.10.750.99
Planted Korean pine
plantation
(KPP)
Pinus koraiensisReforestation in 1954 after clear-cutting of primary mixed broad-leaved
Korean pine forest
65147526.40.70.80
Table 2. Summary of soil chemical properties in different soil aggregates before applying fertilizers.
Soil Aggregates (mm)
Bulk Soil>5 mm2–5 mm0.25–2 mm>0.25 mm
BKPKPPBKPFKPPBKPFKPPBKPFKPPBKPFKPP
pH5.705.655.655.615.575.605.605.585.725.61
SOC (g kg−1)63.260.359.2357.355.452.5448.446.544.442.3
AP (mg kg−1)40.236.224.2021.522.320.1015.214.113.513.0
TN (g kg−1)4.704.103.503.302.902.502.502.301.901.80
TP (g kg−1)3.102.902.101.901.601.451.761.351.201.05
C:N (ratio)13.414.716.917.319.121.0119.320.223.323.5
NH4–N (mg kg−1)40.638.236.834.234.133.0624.523.124.322.4
NO3–N (mg kg−1)6.405.307.436.206.506.104.203.903.803.60
Table 3. Two-way ANOVA results of forest types, soil aggregates, fertilization, and their interactions on the soil chemical properties, in three replications of the broad-leaved Korean pine forest and Korean pine plantations at four combined (NP) levels of fertilization (CK, 0 g N, and P.), low (5 g N m−2 a−1 1; 5 g P m−2 a−1), medium (15 g N m−2 a−1 + 10 g P m−2 a−1), and high (30 g N m−2 a−1; 20 g P g m−2 a−1) in Northeast China.
Source of VariationsdfpHSOCC/NK+Ca2+Mg2+Na+Al3+H+Fe3+Mn2+
Forest types (FT)10.7990.2040.1530.0090.0010.1270.1840.0010.0010.3160.027
Soil aggregates (SA)30.3850.0010.0660.0100.0010.4220.5090.2030.0010.0040.001
Fertilization (Fert)30.0010.0010.2950.1370.0010.0080.8960.0020.0010.0010.081
FT × SA30.9970.9980.9920.9660.1310.9071.0000.9970.5080.9440.997
FT × Fert31.0000.9981.0001.0000.7780.8931.0000.8450.9650.9001.000
SA × Fert91.0001.0001.0001.0001.0001.0001.0001.0000.9991.0001.000
FT × SA × Fert91.0001.0001.0001.0001.0001.0001.0001.0001.0001.0001.000
Source of variationsdfApNO3NH4TPAl:CaECECBS %E.ATN Proportion %
Forest types (FT)10.9330.0010.1080.0390.0010.0010.8330.0010.1960.397
Soil aggregates (SA)30.0180.1690.0010.0030.0010.0010.0020.0010.5290.001
Fertilization (Fert)30.0390.0010.4490.1630.0010.0850.0010.0010.9110.956
FT × SA30.9660.9430.9280.9940.7910.2880.2550.5611.0000.105
FT × Fert30.9350.8811.0001.0000.2810.9180.9980.8411.0000.955
SA × Fert91.0000.9981.0001.0000.991.0000.9990.9901.0000.826
FT × SA × Fert91.0001.0001.0001.0000.9991.0001.0001.0001.0000.976
Table 4. Aluminium ion (Al3+) (cmol kg−1) hydrogen ion (H+) (cmol kg−1) and iron ion (Fe3+) (cmol kg−1) at the control (C), low NP: 05-g N m−2 a−1 + 05-g N m−2 a−1; medium NP: 15-g N m−2 a−1 + 10-g N m−2 a−1; and high NP: 30-g N m−2 a−1 + 20-g N m−2 a−1; fertilization in respective soil aggregates >5 mm, 2–5 mm, 0.25–2 mm, and <0.25 in three replications at 0–20 cm soil depth of mixed broad-leaved Korean pine forest (BKPF) and Korean pine forest (KPP) in Northeast (NE) China.
Aggregate SizeAl3+ (cmol kg−1)H+ (cmol kg−1)Fe3+ (cmol kg−1)
CLow NPMedium NPHigh NPCLow NPMedium NPHigh NPCLow NPMedium NPHigh NP
BKFP
>5 mm4.995.115.515.720.640.660.680.722.913.013.263.37
2–5 mm4.724.785.435.600.530.560.580.612.772.703.193.32
0.25–2 mm3.393.433.623.650.380.400.420.452.352.302.572.67
<0.25 mm3.023.183.523.580.320.330.350.382.142.092.332.43
KPP
>5 mm4.364.474.734.880.590.600.610.642.82.93.13.2
2–5 mm4.154.194.584.640.480.480.520.552.72.83.03.1
0.25–2 mm2.952.973.133.210.360.370.390.412.32.42.62.7
<0.25 mm2.752.772.973.020.300.310.320.342.12.22.42.5
Publisher’s Note: MDPI stays neutral with regard to jurisdictional claims in published maps and institutional affiliations.

