
Effects of Climate and Drought on Stem Diameter Growth of Urban Tree Species
by
 , , and
Vjosa Dervishi
1,* ,
,
Werner Poschenrieder
2,
Thomas Rötzer
1,
Astrid Moser-Reischl
1 and
Hans Pretzsch
1 1
TUM School of Life Sciences, Chair of Forest Growth and Yield Science, Technical University of Munich, Hans Carl-von-Carlowitz-Platz 2, 85354 Freising, Germany
2
Bavarian Forest Institute (LWF), Hans-Carl-von-Carlowitz-Platz 2, 85354 Freising, Germany
*
Author to whom correspondence should be addressed.
Forests 2022, 13(5), 641; https://0-doi-org.brum.beds.ac.uk/10.3390/f13050641
Submission received: 1 April 2022
/
Revised: 18 April 2022
/
Accepted: 20 April 2022
/
Published: 21 April 2022
(This article belongs to the Special Issue Urban Forest and Urban Microclimate)
Abstract
:Urbanization and climate change are two inevitable megatrends of this century. Knowledge about the growth responses of urban trees to climate is of utmost importance towards future management of green infrastructure with the aim of a sustainable provision of the environmental ecosystem services. Using tree-ring records, this study analyzed growth response to climate by stem diameter at breast height (DBH) of 1178 trees in seven large cities worldwide, including Aesculus hippocastanum L. in Munich; Platanus × hispanica Münchh. in Paris; Quercus nigra L. in Houston; Quercus robur L. in Cape Town; Robinia pseudoacacia L. in Santiago de Chile, Munich, and Würzburg; and Tilia cordata Mill. in Berlin, Munich, and Würzburg. Climate was characterized following the de Martonne aridity index (DMI). Overall, trees showed an 8.3% lower DBH under arid than humid climate at the age of 100. Drought-tolerant tree species were overall not affected by climate. However, R. pseudoacacia showed a lower diameter when growing in semi-dry than humid climate. In contrast, drought-sensitive tree species were negatively affected by arid climate. Moreover, the effect of drought years on annual diameter increment was assessed. P. × hispanica and R. pseudoacacia appeared as the most drought-resistant species. The highest sensitivity to drought was detected in T. cordata and Q. robur. A. hippocastanum and Q. nigra showed a lower diameter growth during drought events, followed by a fast recovery. This study’s findings may contribute to a better understanding of urban tree growth reactions to climate, aiming for sustainable planning and management of urban trees.
1. Introduction
While currently 55% of the world’s population lives in urban areas, it is projected that by 2050, almost 70% of the global population will live in urban environments. At the same time, urban settings are frequently exposed to extreme climatic events like dry spells or extreme rainfall events caused by global change [1]. Urban trees, as a crucial part of the green infrastructure in cities, have gained increasing awareness in recent decades. This is mainly due to their role in providing a wide array of environmental ecosystem services [2,3,4,5]. Carbon storage, mitigation of heat island effect [6], cooling by transpiration and shading [7,8,9], reduction of rainwater runoff [10], supporting the biodiversity in urban areas [11], and others are positive environmental impacts of trees. In that sense, due to policy changes and efforts that have been made recently [1], vegetation coverage has increased in many cities worldwide [12]. A recent study [13] showed that more than 10% of built-up areas in 325 large cities globally increased the urban green proportion significantly in the last two decades. However, the quantity of the environmental ecosystem services provided is highly dependent on the species, size, and vitality of trees [6,14].
High impervious ground surface and a higher water loss due to increased evapotranspiration [15,16] may lead to increased water stress in urban areas compared to natural environments. Further, recent studies have shown that drought is the main inciting factor impacting urban trees’ health and survival [17,18], and climatic predictions forecast rising temperatures and more frequent heat and drought events. Therefore, there is a need for urban tree management to select tree species according to their future drought response [19]. In order to guarantee a good water supply for vital trees with high environmental ecosystem provision, the requirements of the individual tree species must be known.
As tree species growing in urban areas undergo specific environmental conditions, these conditions may affect the resilience of urban trees [17]. Thus, the growth response in such environments is not guaranteed to correspond to generally expected growth patterns of trees. To improve the strategic management of urban green vegetation, the growth–climate relationship needs to be analyzed in detail. Dendrochronology is a valuable tool to study the relationship between tree growth and climatic factors [20]. Previous studies address how climate change modifies the ecosystem services provided by urban trees [4,11,21]. These studies were based on model predictions and investigated various adaptation actions [22], such as selecting drought-resistant species and various environmental provenances [23,24]. However, less is known about how climate conditions affect the growth of urban trees on a large spatial scale. This study aimed to analyze urban trees’ stem diameter growth response depending on the species, their drought tolerance, and urban climate conditions (air temperature, precipitation). The diameter of a tree is a straightforward measurement and can be used as a proxy for calculating other tree parameters, such as tree crown dimension [25,26,27]. Thus, tree diameter allows one to predict environmental ecosystem services like cooling of urban environments [27,28].
Poschenrieder et al. [29] claimed that tree growth, ecosystem service provision, and stand management strongly depend on a site’s climatic conditions, especially precipitation and temperature. Urban tree growth models are proper tools for quantifying environmental ecosystem services depending on tree growth dynamics and changing environments. Prominent models such as UFORE [30,31], i-Tree [32], CITYgreen [33,34], CityTree [6] and UrbTree [35] provide fundamental knowledge for sustainable and future-oriented planning of green infrastructure in cities [28,36]. However, these models do not include tree-related parameters such as mortality, vitality, or nutrient supply, which are important for sustainable planning and management of urban trees [37]. To account for this, Pretzsch et al. [28] recently introduced an urban tree dynamic management model (UTDyn), which was further developed by Poschenrieder et al. [29]. This dynamic model represents an approach of age class balancing and sustainable planning, transferring forest management aspects to urban tree management while including tree growth, mortality, and ecosystem service provision. Pretzsch et al. [28] suggested improving the dynamic model by adding additional parameters.
This study aims to contribute and give additional value to the UTDyn model using tree-ring records of 1178 individual, mature broadleaf trees of six different tree species, distributed across seven cities worldwide as follows: Aesculus hippocastanum L. in Munich; Platanus × hispanica Münchh. in Paris; Quercus nigra L. in Houston; Quercus robur L. in Cape Town; Robinia pseudoacacia L. in Santiago de Chile, Munich, Würzburg; and Tilia cordata Mill. in Berlin, Munich, and Würzburg. Climatic conditions (annual precipitation, mean air temperature) were represented using the de Martonne Index (DMI, [38]). The stem diameter growth reaction to climatic conditions and the annual diameter growth reaction to drought events were based on the following research questions:
(Q1) How is the general stem diameter growth reaction of trees depending on climate in urban environments?
(Q2) How does the climate of a city defined by its relative aridity (DMI) affect stem diameter growth of drought-tolerant and drought-sensitive tree species within urban environments?
(Q3) How do Robinia pseudoacacia and Tilia cordata react to climate within different climates in their stem diameter growth?
(Q4) How do individual drought years affect the annual stem diameter increment of urban tree species?
2. Materials and Methods
2.1. Study Sites and Climate
Seven cities worldwide, in which tree cores of six tree species were recorded [20,39], form the base of this study. Table 1 gives an overview of the selected cities, geography, and climate conditions. The climate dataset consists of total annual precipitation data and long-term mean temperature data for the period of 1981–2010 for each city. Annual precipitation data for the cities Cape Town, Houston, and Paris were provided by the National Climatic Data Center (NOAA NCEI, [40]). For the German cities Berlin, Munich, and Würzburg, data was provided by the Open Data Server of the German Metrological Service (DWD, [41]). A historical climate dataset, as described by González-Reyes [42], was used for Santiago de Chile.
The cities within this study are distributed across several climate zones (Table 1). According to the climate classification by Köppen-Geiger [43], the cities Berlin, Munich, Würzburg, and Paris are located in the temperate zones of Central Europe. They are characterized by an oceanic climate (Cfb), featuring mild summers and cool winters. However, the amount of precipitation and mean temperature differs between the sites. While Berlin and Würzburg show similar climatic patterns with an annual precipitation sum of around 600 mm and a mean temperature of around 9 °C, Paris is characterized by a higher mean temperature of 12.3 °C and a higher precipitation sum of 632 mm. Compared to other European cities within this study, precipitation is highest in Munich (948 mm). Santiago de Chile and Cape Town are characterized by Mediterranean climate (Csb) with hot, dry summers and mild, wet winters. However, the long-term mean temperature and the amount of precipitation in Cape Town are higher (16.7 °C, 544 mm) compared to Santiago de Chile (14.7 °C, 325 mm). Houston has a humid, subtropical climate (Cfa). The annual precipitation sums up to 1091 mm and is ample throughout the year. The temperature average in Houston is 21 °C.
2.2. Aridity Index according to de Martonne
Aridity is a long-term, climate phenomenon characterized by a shortage of water supply/precipitation. In this study, the aridity at a given location was quantified using the de Martonne aridity index (DMI). This index was developed by de Martonne in 1926 [38] and describes the combined effect of temperature and precipitation as follows:
In this analysis, Prec is described as total annual precipitation (mm) and Temp (°C) as the long-term mean temperature (1981–2010) per city. DMI shows the annual value for the climate, while DMI avg presents the mean DMI value for each tree, which was calculated for the entire lifespan of a given tree. Higher DMI values indicate cool and moist climatic conditions, while lower values express warm and dry climatic conditions. According to Baltas [44] classification, the DMI index of the seven cities represents a range from semi-dry climatic conditions (Santiago de Chile, DMI = 15) to very humid conditions (Munich, DMI = 53) (see Table 1). Due to restricted data availability, growth comparisons for single tree species across different climatic conditions were only possible for the tree species R. pseudoacacia and T. cordata. Thus, tree species within this study were categorized into drought sensitivity classes (drought-sensitive, drought-tolerant) following the study of Niinemets and Valladares [45]. Figure A1 shows the climatic conditions for each city throughout the years.
2.3. Selection of Tree Species and Tree Individuals
The analyzed trees within this study represent medium-sized to large, long-lived deciduous tree species. Table 2 lists information on the tree species regarding drought tolerance, wood anatomy, and maximal height. Most of the species—A. hippocastanum, P. × hispanica, Q. robur, R. pseudoacacia, T. cordata—are widely present in the urban landscapes of Central Europe [46,47,48,49]. Q. nigra and R. pseudoacacia are native to North America [50]. However, due to its invasiveness, R. pseudoacacia is now widespread across Europe and partially across Asia, South America, Africa, Canada, and Australia [51].
2.4. Tree Data Collection
The recorded tree data includes dendrochronological information taken from increment cores of 1178 individual trees worldwide. Trees were selected along transects from the city center to the four cardinal directions, thus covering an urbanization gradient from highly paved urban areas to more open green suburban parts of a city, comprising solitary street trees, as well as trees from city parks and urban forests. The sampled trees were free from any biotic or abiotic damages. Two increment cores were taken from each tree at a height of 1.3 m in perpendicular directions (North, East), using an increment borer with an inner diameter of 5 mm (Haglöf, Sweden). The sampled tree species are A. hippocastanum, T. cordata and R. pseudoacacia in Munich, T. cordata in Berlin, P. × hispanica in Paris, R. pseudoacacia in Santiago de Chile, Q. robur in Cape Town, T. cordata and R. pseudoacacia in Würzburg, and Q. nigra in Houston. Afterwards, the increment cores were glued on wooden slides and polished on a sanding machine using 120 to 1200 grit, depending on the tree species, in order to enhance the optimum visibility of the growth rings. This preparation allowed tree-ring width measurements with a precision of 0.01 mm using a digital positioning table Digitalpositiometer [52]. Crossdating of the observed tree-ring data was based on the methods provided with the R-library dplR [53] and performed up to a tree age of one year. The age of all sampled trees was computed with age formulas based on tree structures. Individual tree ages could be estimated by combining city administration records with increment core series. From the increment cores, the stem diameter growth of each tree on an annual basis was traced, resulting in a total of 66,000 observations. The most extensive observation years were covered in Berlin and ranged from 1876 to 2013.
The tree-based characteristics of the data are presented in Table 3. The number of sampled trees ranged from 69 Q. robur individuals in Cape Town to 251 T. cordata trees in Berlin. Q. robur showed the highest mean diameter at breast height (67.9 cm), while T. cordata in Würzburg showed the lowest mean DBH (33.2 cm). Hence, T. cordata in Würzburg showed the lowest mean height of 12.5 m, while P. × hispanica in Paris were the highest trees with a mean of 18.8 m. A. hippocastanum were on average the oldest trees sampled in this study with a mean age of 118 years, while R. pseudoacacia in Würzburg and Santiago de Chile had an average age of 52 years. T. cordata in Berlin showed the lowest mean annual diameter increment (5.0 mm), while Q. nigra in Houston showed the highest mean annual diameter increment (11.3 mm).
2.5. Data Analysis
Statistical evaluations were conducted using the software R-4.0.5 [54]. Linear mixed effect models were applied using lme4 package [55] to analyze the effects of climate on tree diameter growth. Fixed effects included the stem diameter (DBH), tree age (Age), and a climate parameter characterized by the annual de Martonne Index (DMI) or the trees’ average de Martonne Index (DMI avg) during each tree’s lifespan. Random effects for City, Species, Individual tree, and Calendar year were used for correcting temporal and spatial autocorrelations. Furthermore, to check for differences in the means, post-hoc tests were performed by using emmeans package with Tukey correction [56]. Model-based figures were produced using the package sjplot [57]. The climate is expressed using the 2.5th and 97.5th quantile of the DMI for the arid and humid climate conditions, respectively. This was necessary as DMI values for drought-sensitive and drought-tolerant species differed strongly, and considering relative droughts was thus possible. For analyzing the general long-term stem diameter growth reaction to climate for all trees within this study, the following model was applied:
ln DBHijkt = a0 + a1 × ln Ageijkt + a2 × DMIit + a3 × ln Ageijkt × DMIit + bi + bij + bijk + εijkt
Hereby, DBH is the response variable and refers to the stem diameter of the trees in breast height; Age represents the tree age. The indices represent (i) city, (j) species, (k) individual tree, and (t) calendar year.
For analyzing the stem diameter growth reaction of drought-tolerant (DT) and drought-sensitive (DS) tree species in urban environments, the following model was applied separately for each group:
ln DBHij = a0 + a1 × ln Ageij + a2 × DMI avgj + bi + εij
Hereby, DMI avg refers to an average value of the Martonne Index (DMI) of an individual tree’s lifespan. The indices i refer to ith tree individual, and j refers to the calendar year. The variable Species was not included in the random effects due to a low range of species for the drought-tolerant (DT) group (2 levels: A. hippocastanum, T. cordata).
The species-specific long-term stem diameter growth with age was calculated by the following model equation separately for the tree species R. pseudoacacia and T. cordata:
using Age and City as fixed effect and the indices i for individual tree and j for calendar year as random effects.
ln DBHij = a0 + a1 × ln Ageij + a2 × City + a3 × ln Ageij × City + bi + εij
To quantify the influence of drought years on stem diameter increment, the Superposed Epoch Analysis (SEA) [39,58] was applied on the ring-width dataset using the R package dplR [53]. The SEA function assesses the significance of departures in tree ring-width indices (RWI) from the mean for a given set of key event years (e.g., drought years) and lagged years (superposed epoch) by comparing the value of the superposed epoch to randomly selected epochs, which are selected from the tree-ring dataset using random sets of 11 years (five years before and after the drought year) from 1000 bootstrapped sets.
3. Results
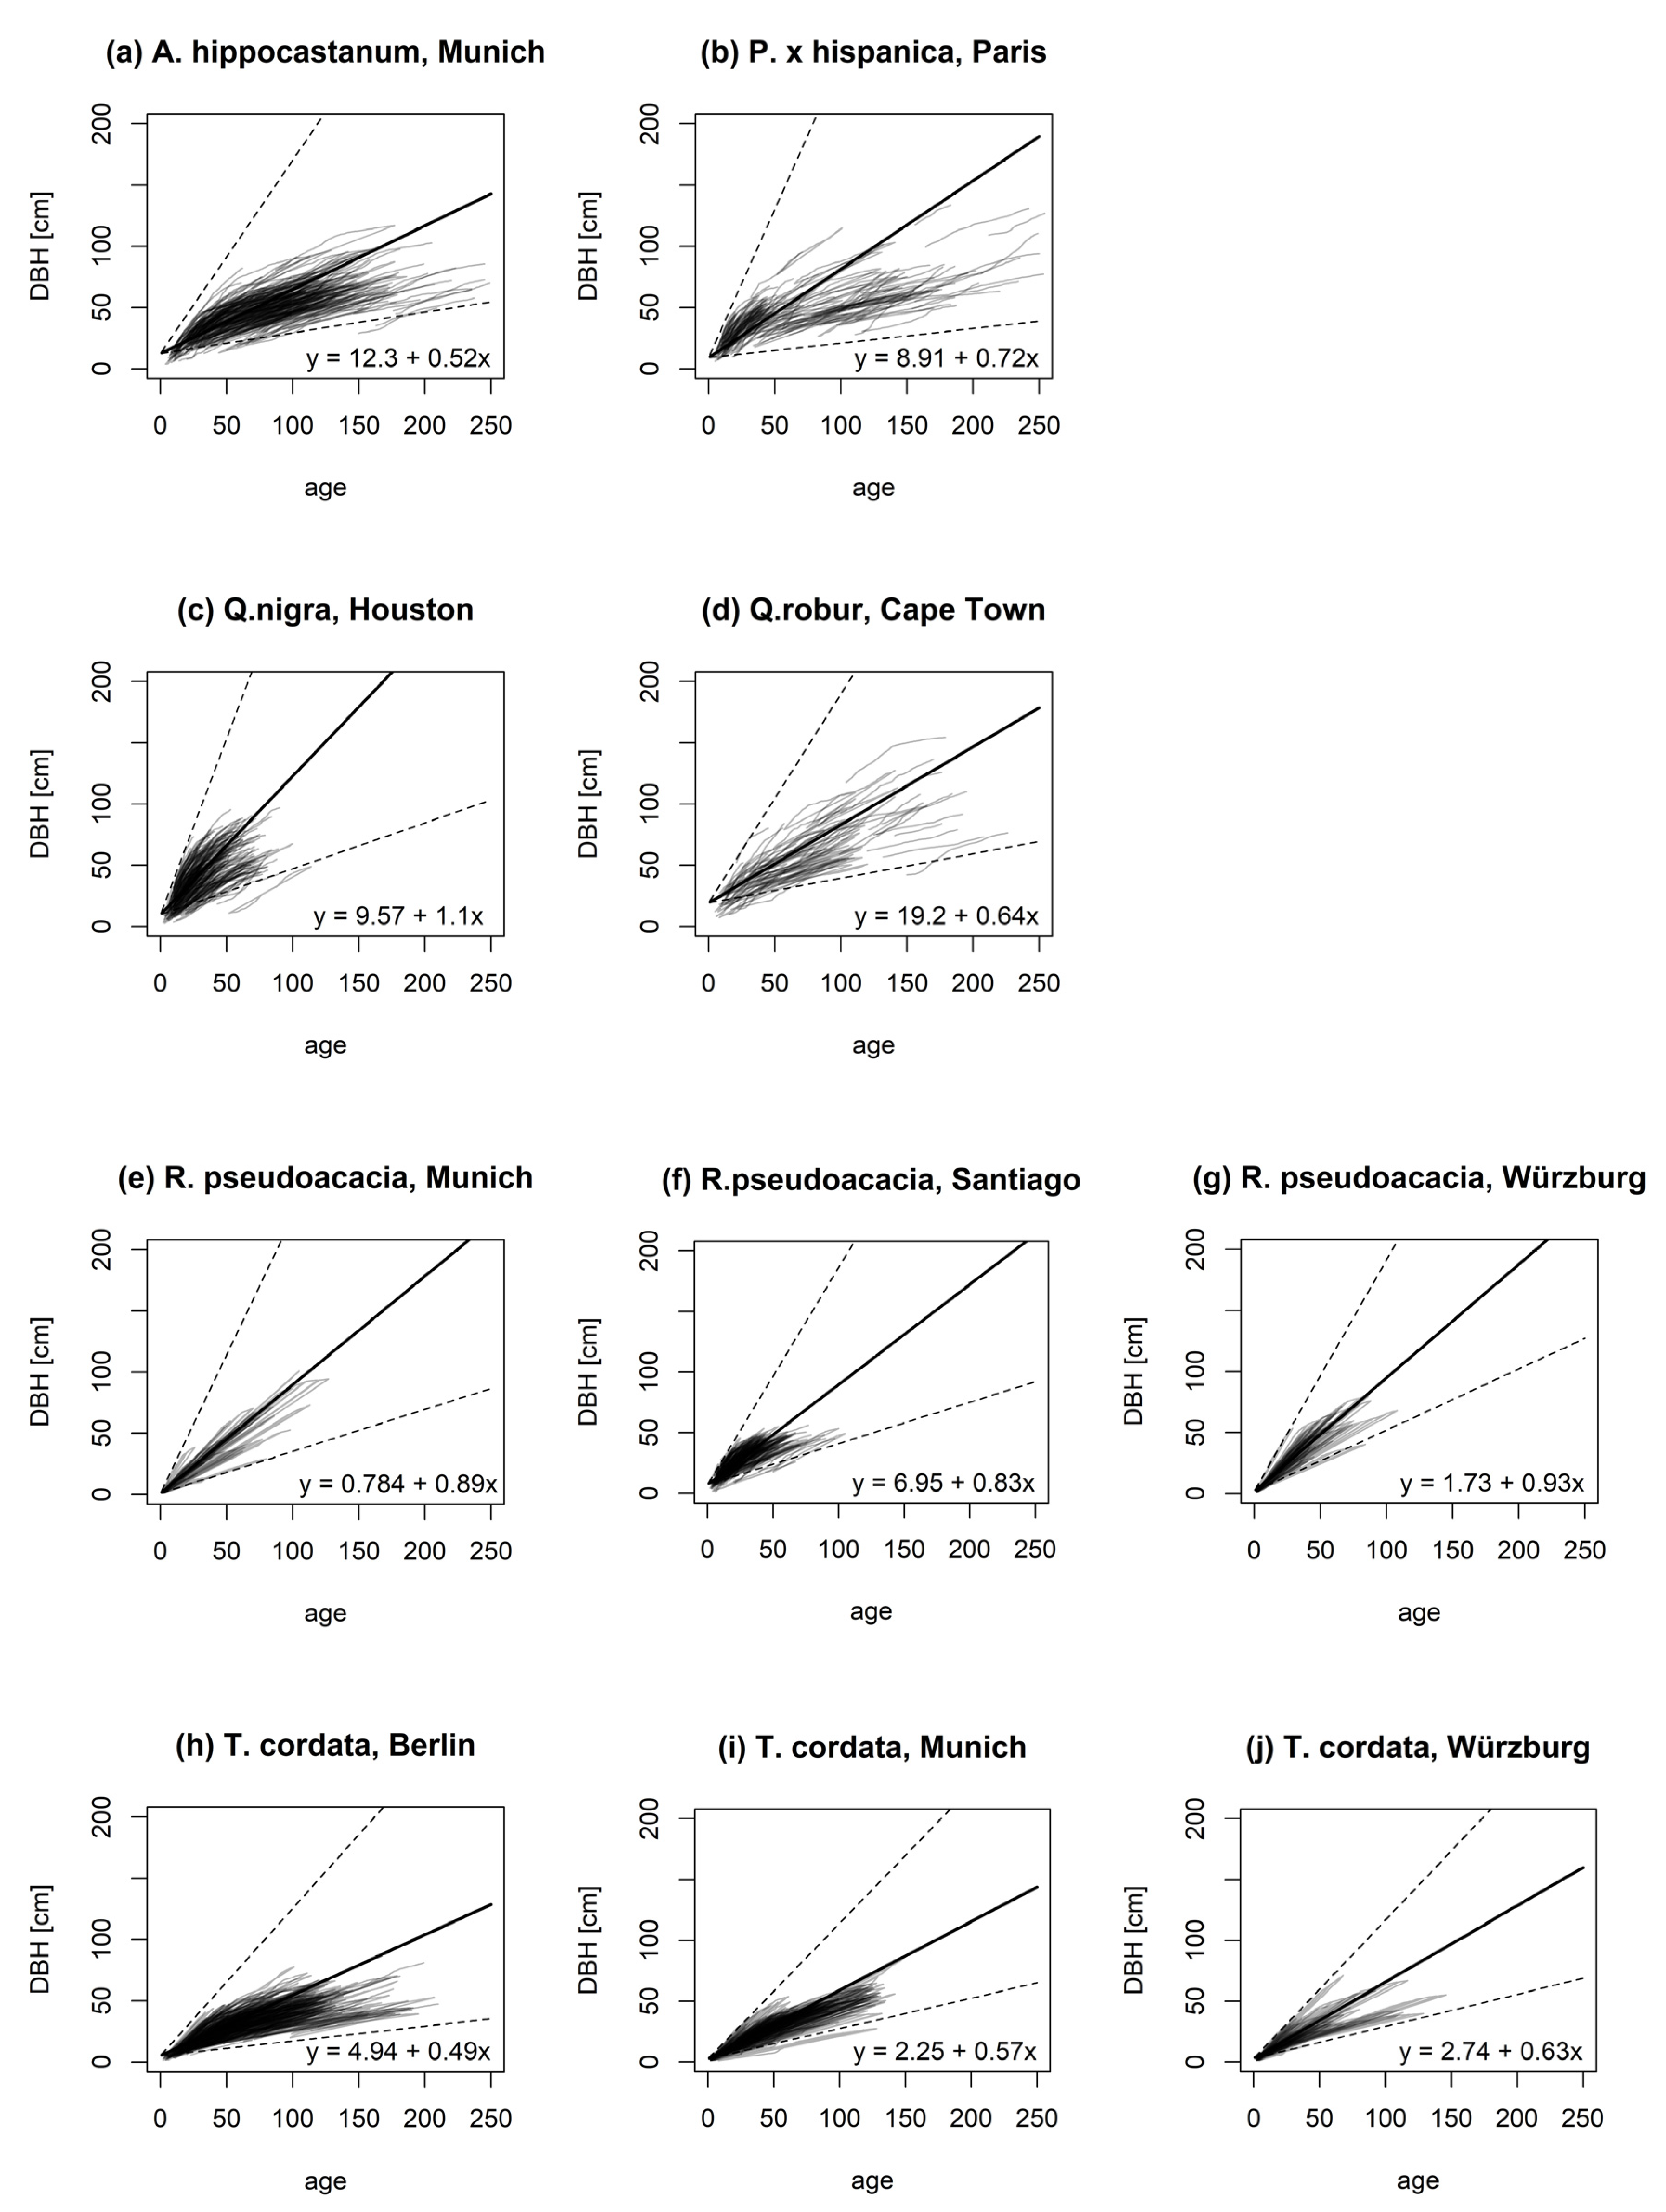
An overview of the diameter-age relationship for the analyzed species in each city is shown in Figure 1. For this, simple linear models were applied for each tree of a given species and location. Based on the steepness of the slope, Quercus nigra L. (Q. nigra) showed—in the subtropic climate of Houston—the highest diameter-age relationship (1.131, Figure 1c), followed by Robinia pseudoacacia L. (R. pseudoacacia) growing in the temperate climate cities of Würzburg (0.931, Figure 1g) and Munich (0.888, Figure 1f), and the Mediterranean climate of Santiago de Chile (0.827, Figure 1e). The slopes for Platanus × hispanica Münchh. (P. × hispanica) in the humid climate of Paris and Quercus robur L. (Q. robur) in the Mediterranean climate of Cape Town were 0.723 (Figure 1b) and 0.638 (Figure 1d), respectively. Aesculus hippocastanum L. (A. hippocastanum) showed a lower diameter-age growth relationship (0.522, Figure 1a) under humid climate conditions in Munich. Similar trends were observed for Tilia cordata Mill. (T. cordata) growing in Würzburg (0.629, Figure 1j), Munich (0.566, Figure 1i), and Berlin (0.495, Figure 1h).
3.1. Stem Diameter Growth Reaction of Urban Trees in Dependence on the Aridity
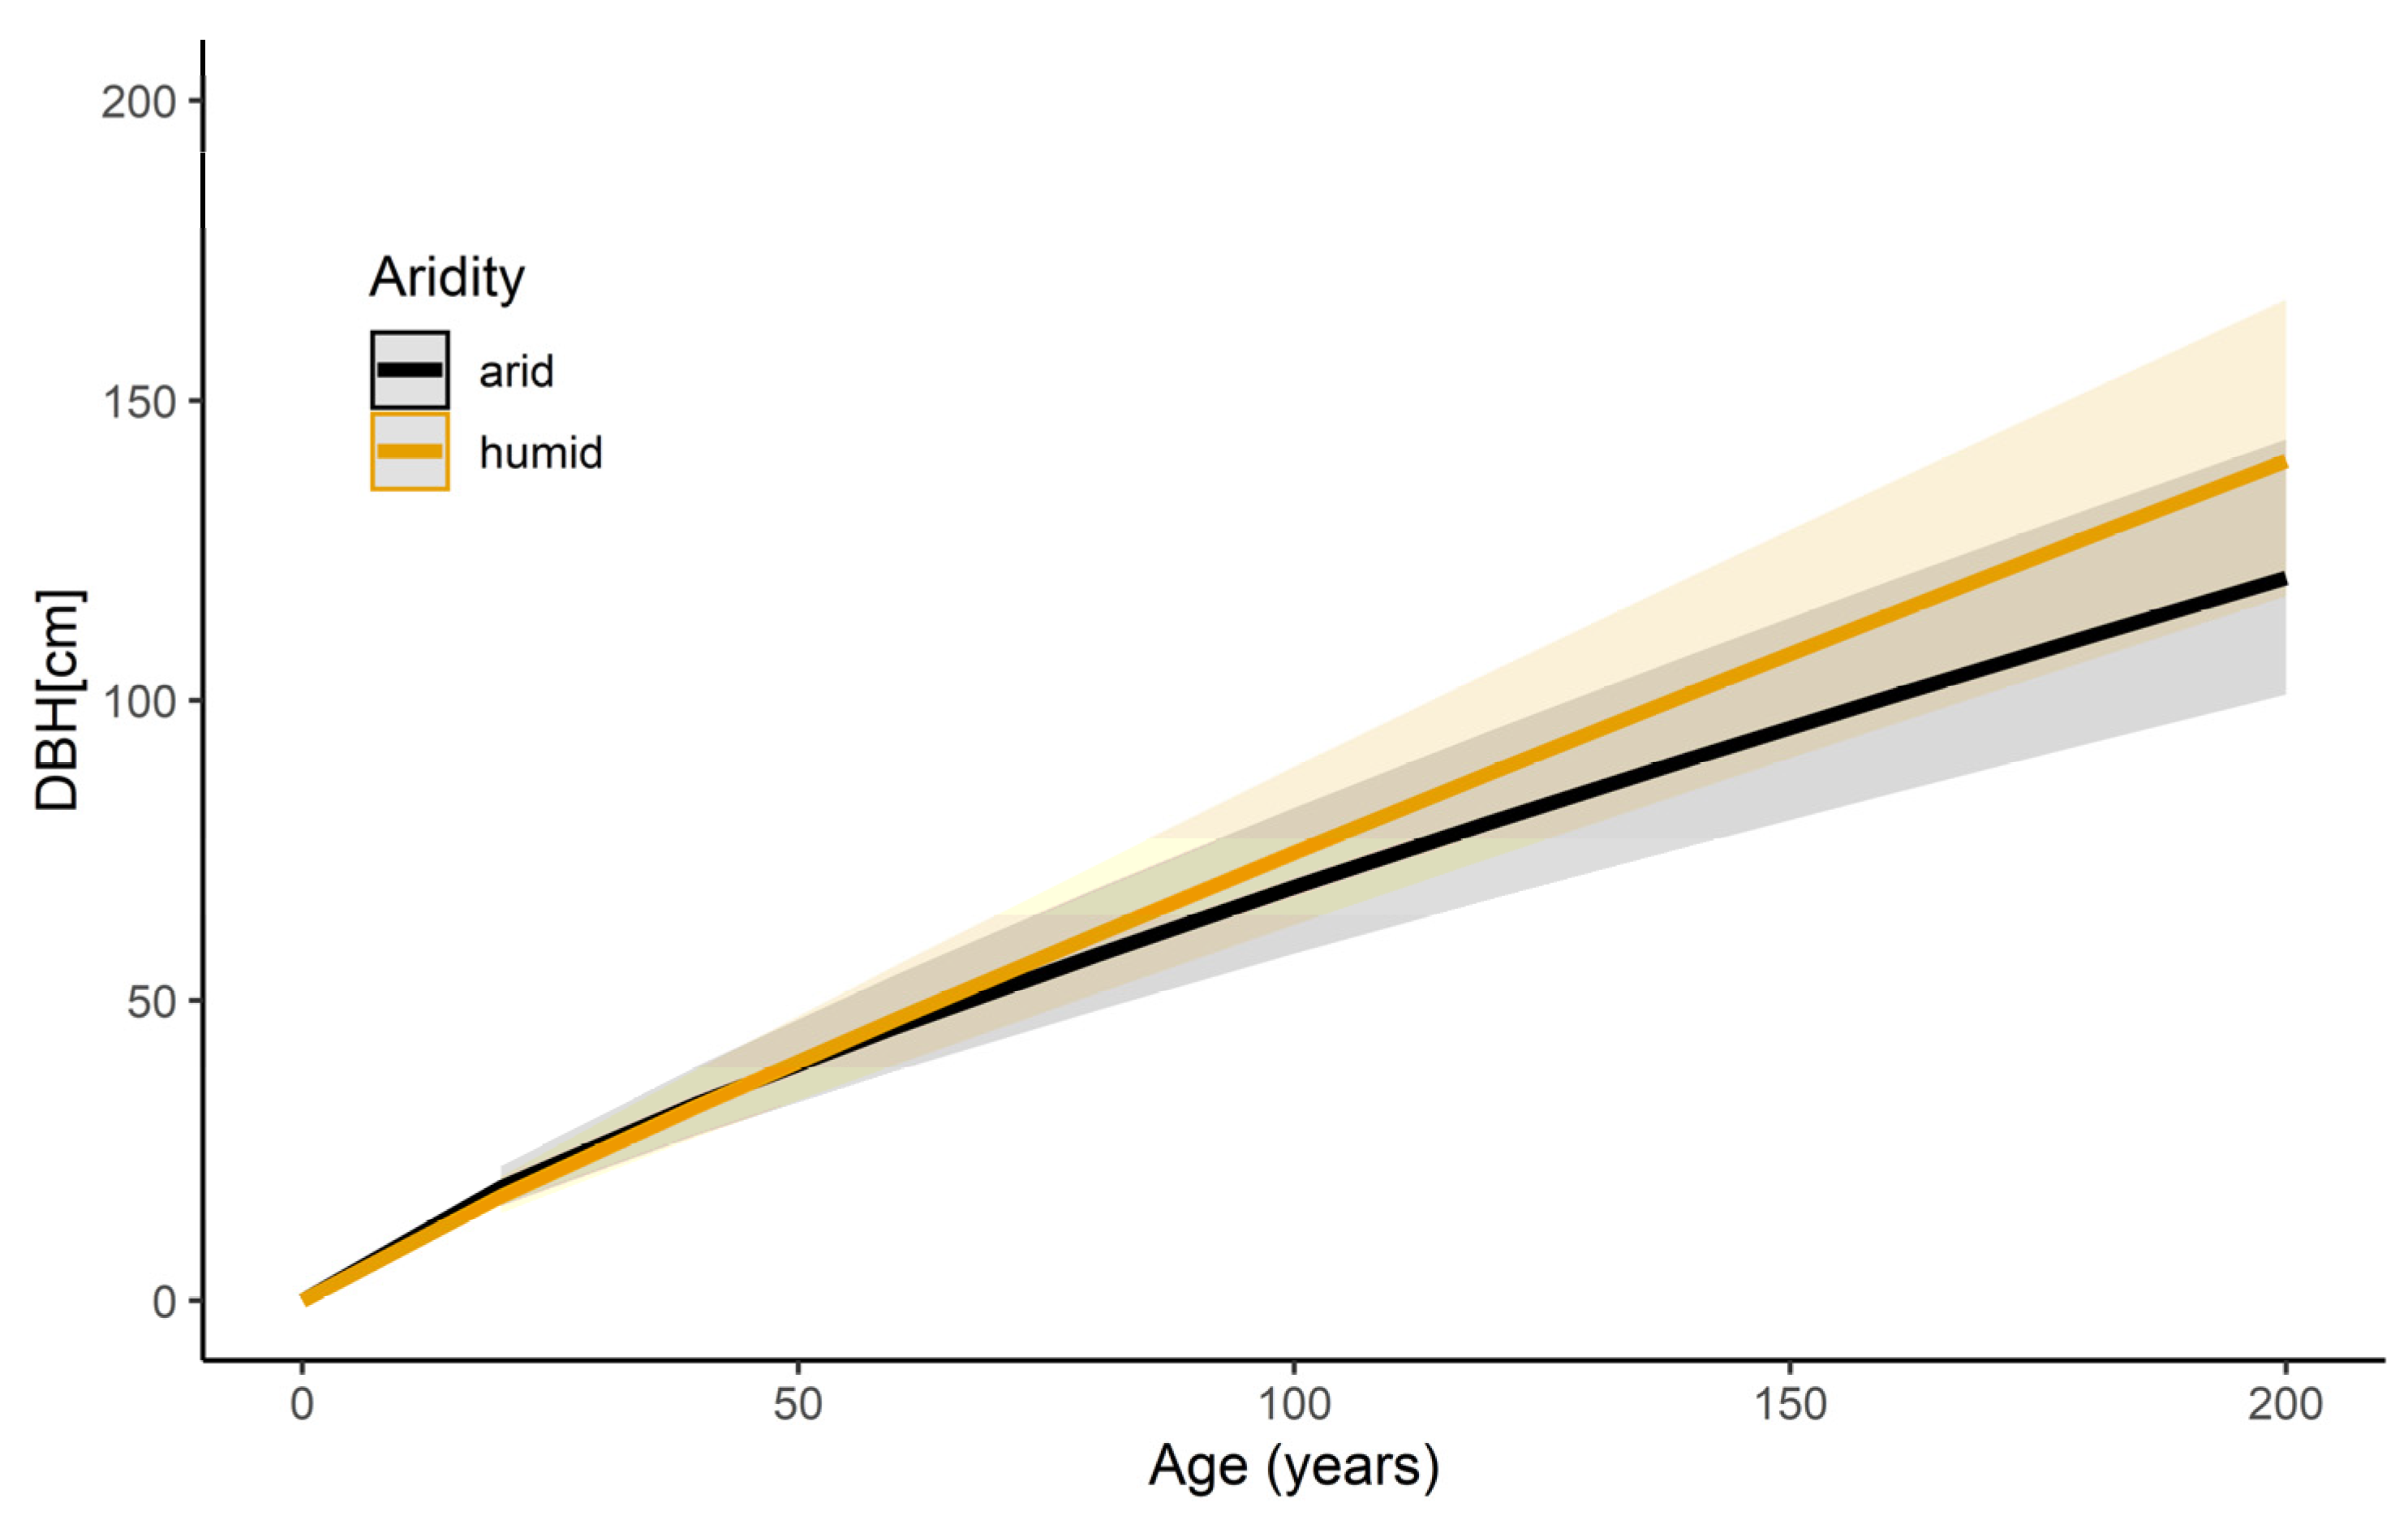
The results of the long-term tree diameter growth reaction depending on the climate within this study are presented in Figure 2 and listed in Table A1. Overall, the estimate for the diameter–age relationship was 0.784 (p < 0.001). This effect was stronger with increased DMI value (interaction ln Age and DMI, p < 0.001), showing that trees had a higher DBH growth with increased tree age and DMI value. On average, trees at the age of 60 showed a 2.9% lower DBH (45.7 cm) when growing under arid climate conditions than trees growing under humid climate (DBH = 47 cm). This effect increases with increasing tree age. Consequently, at 80, 100 and 140, the difference is by −5.9%, −8.3%, and −12.1%, respectively.
3.2. Drought Effects on Stem Diameter Growth of Drought-Tolerant and Drought-Sensitive Tree Species
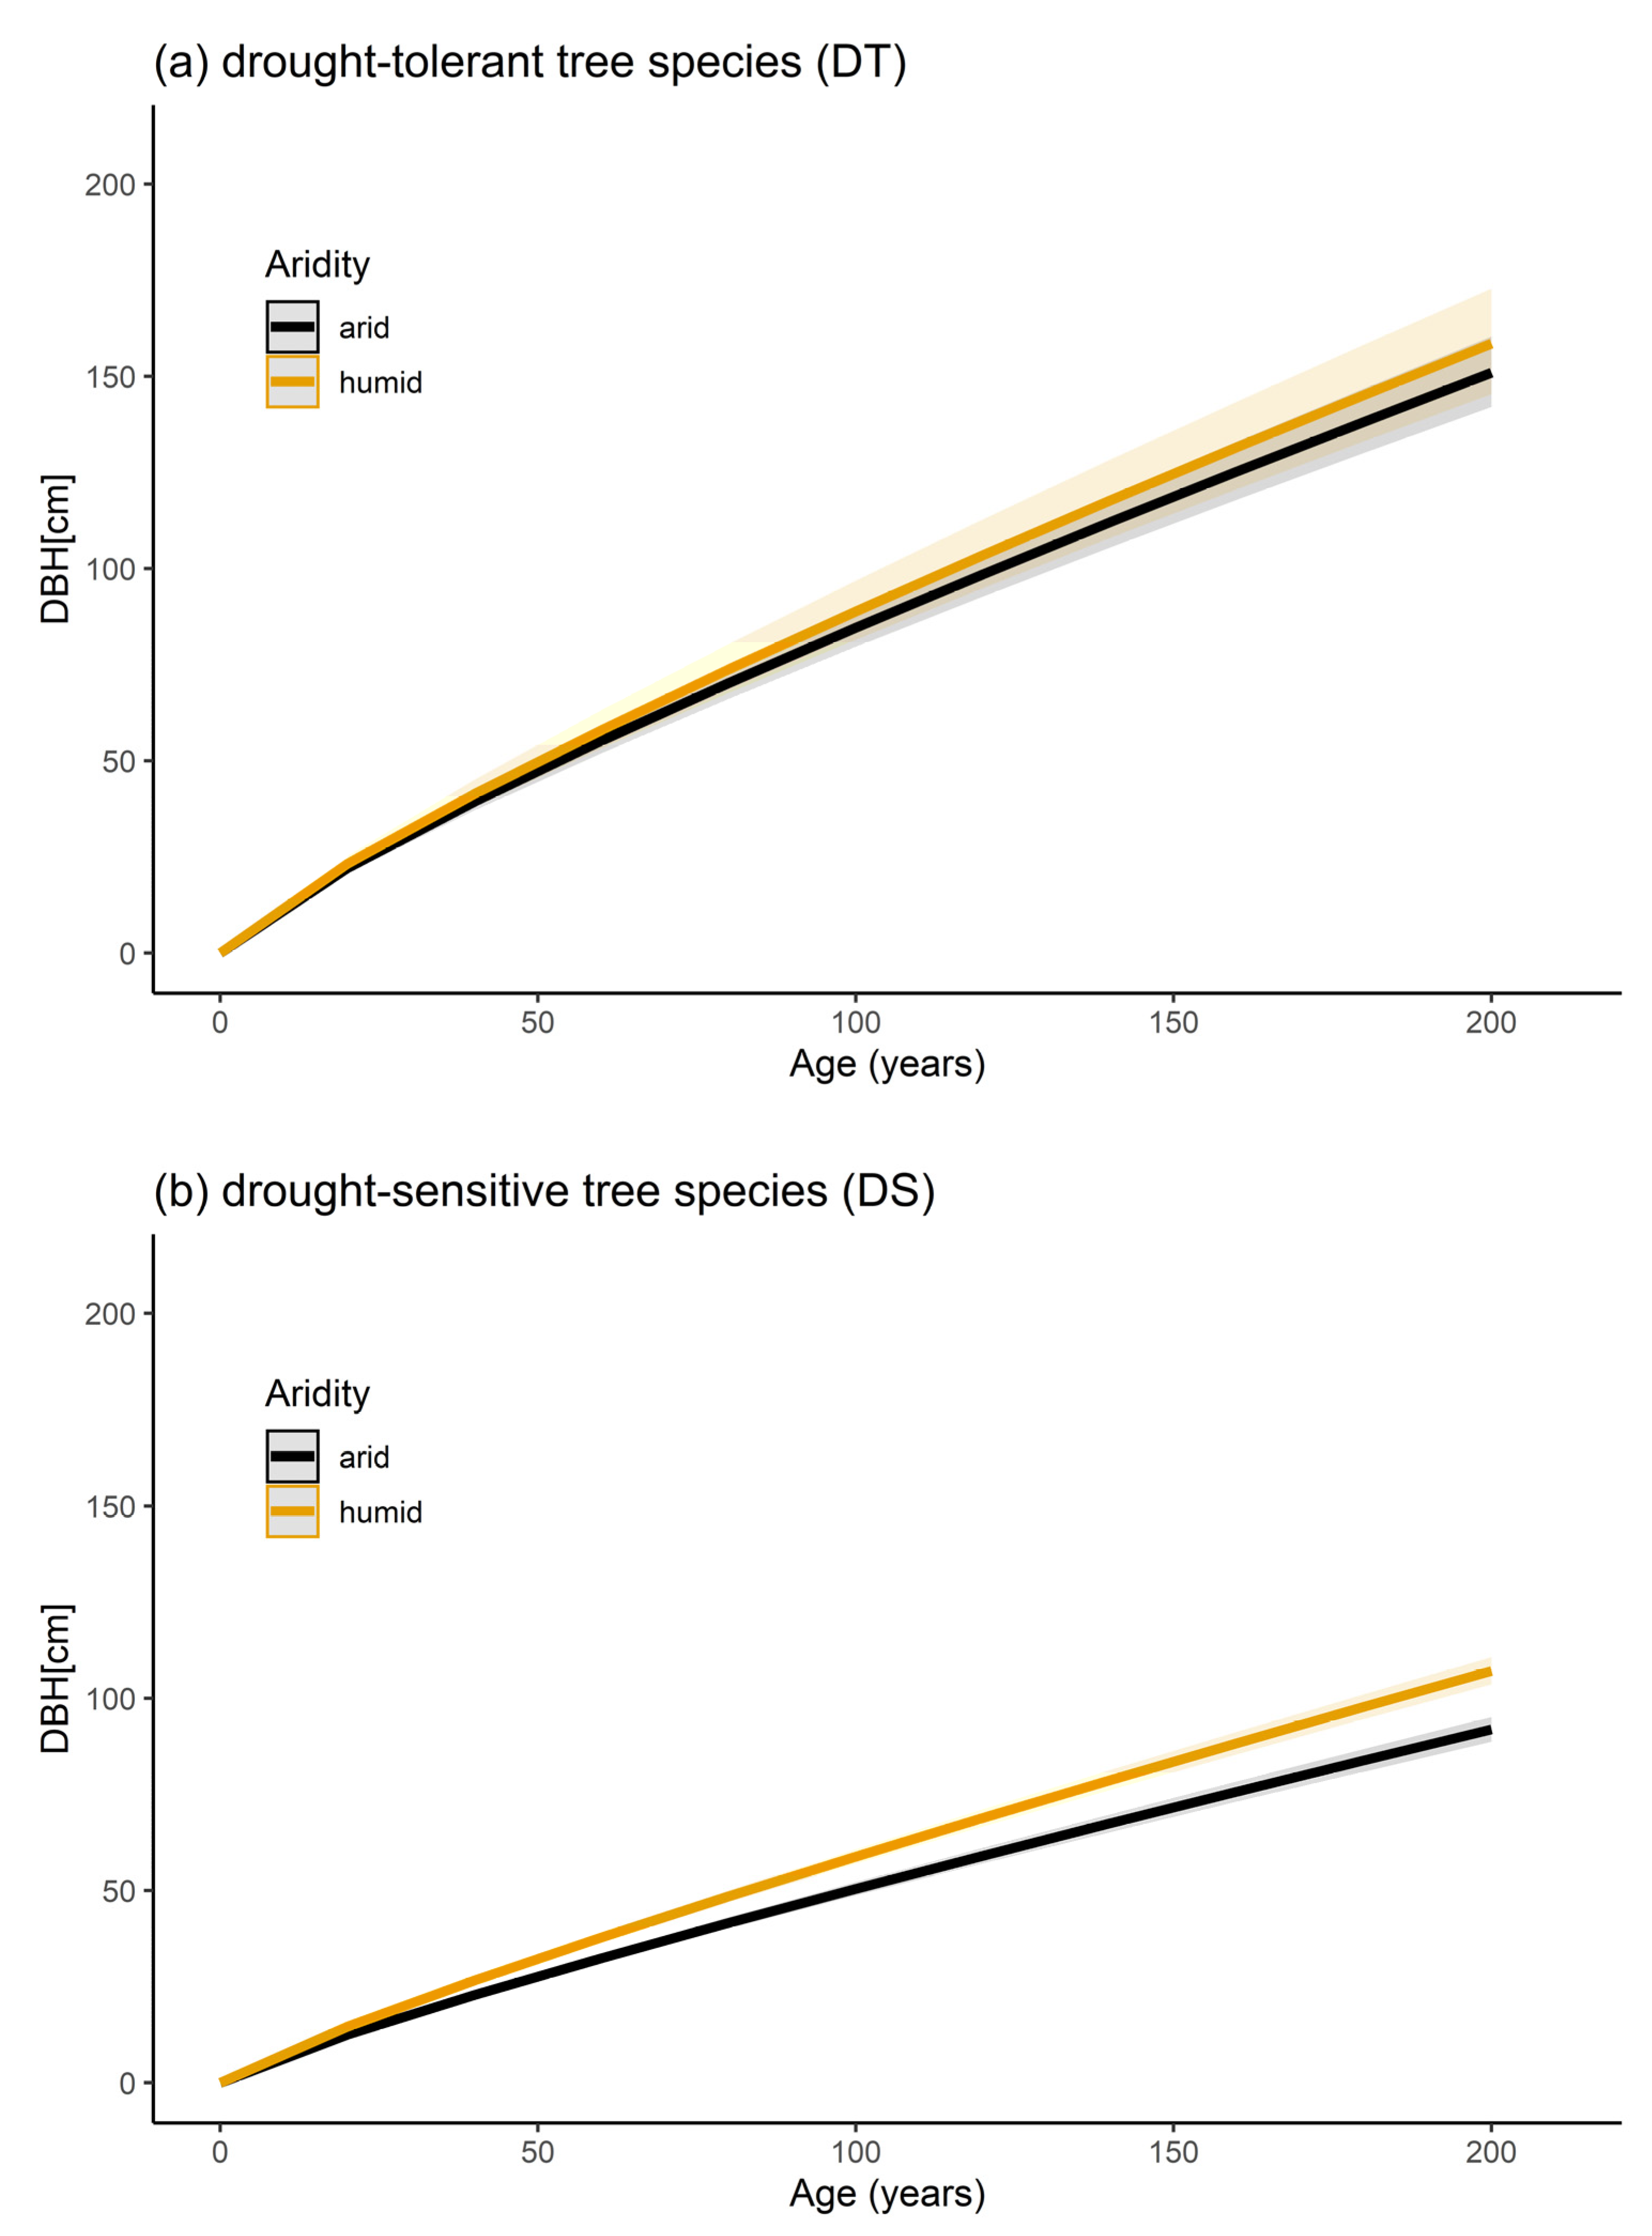
The statistical model results regarding the diameter growth reaction of drought-tolerant and drought-sensitive tree species are presented in Figure 3. Age has a significant effect on the diameter growth for both drought-tolerant and drought-sensitive tree species (p < 0.001). Averaged DMI values of each tree (DMI avg) have a significant effect on the diameter growth of drought-sensitive tree species (p < 0.001, Figure 3b) but no effect on the diameter growth of drought-tolerant tree species (p = 0.456, Figure 3a). On average, drought-sensitive tree species growing under arid climatic conditions showed a reduced diameter growth of 16.6% compared to the growth under humid climate conditions. At 100 years, drought-sensitive tree species had an average diameter of 50.4 cm when growing under arid climate conditions and 58.8 cm when growing under humid climate conditions.
3.3. Species Specific Reaction of Stem Growth on Aridity
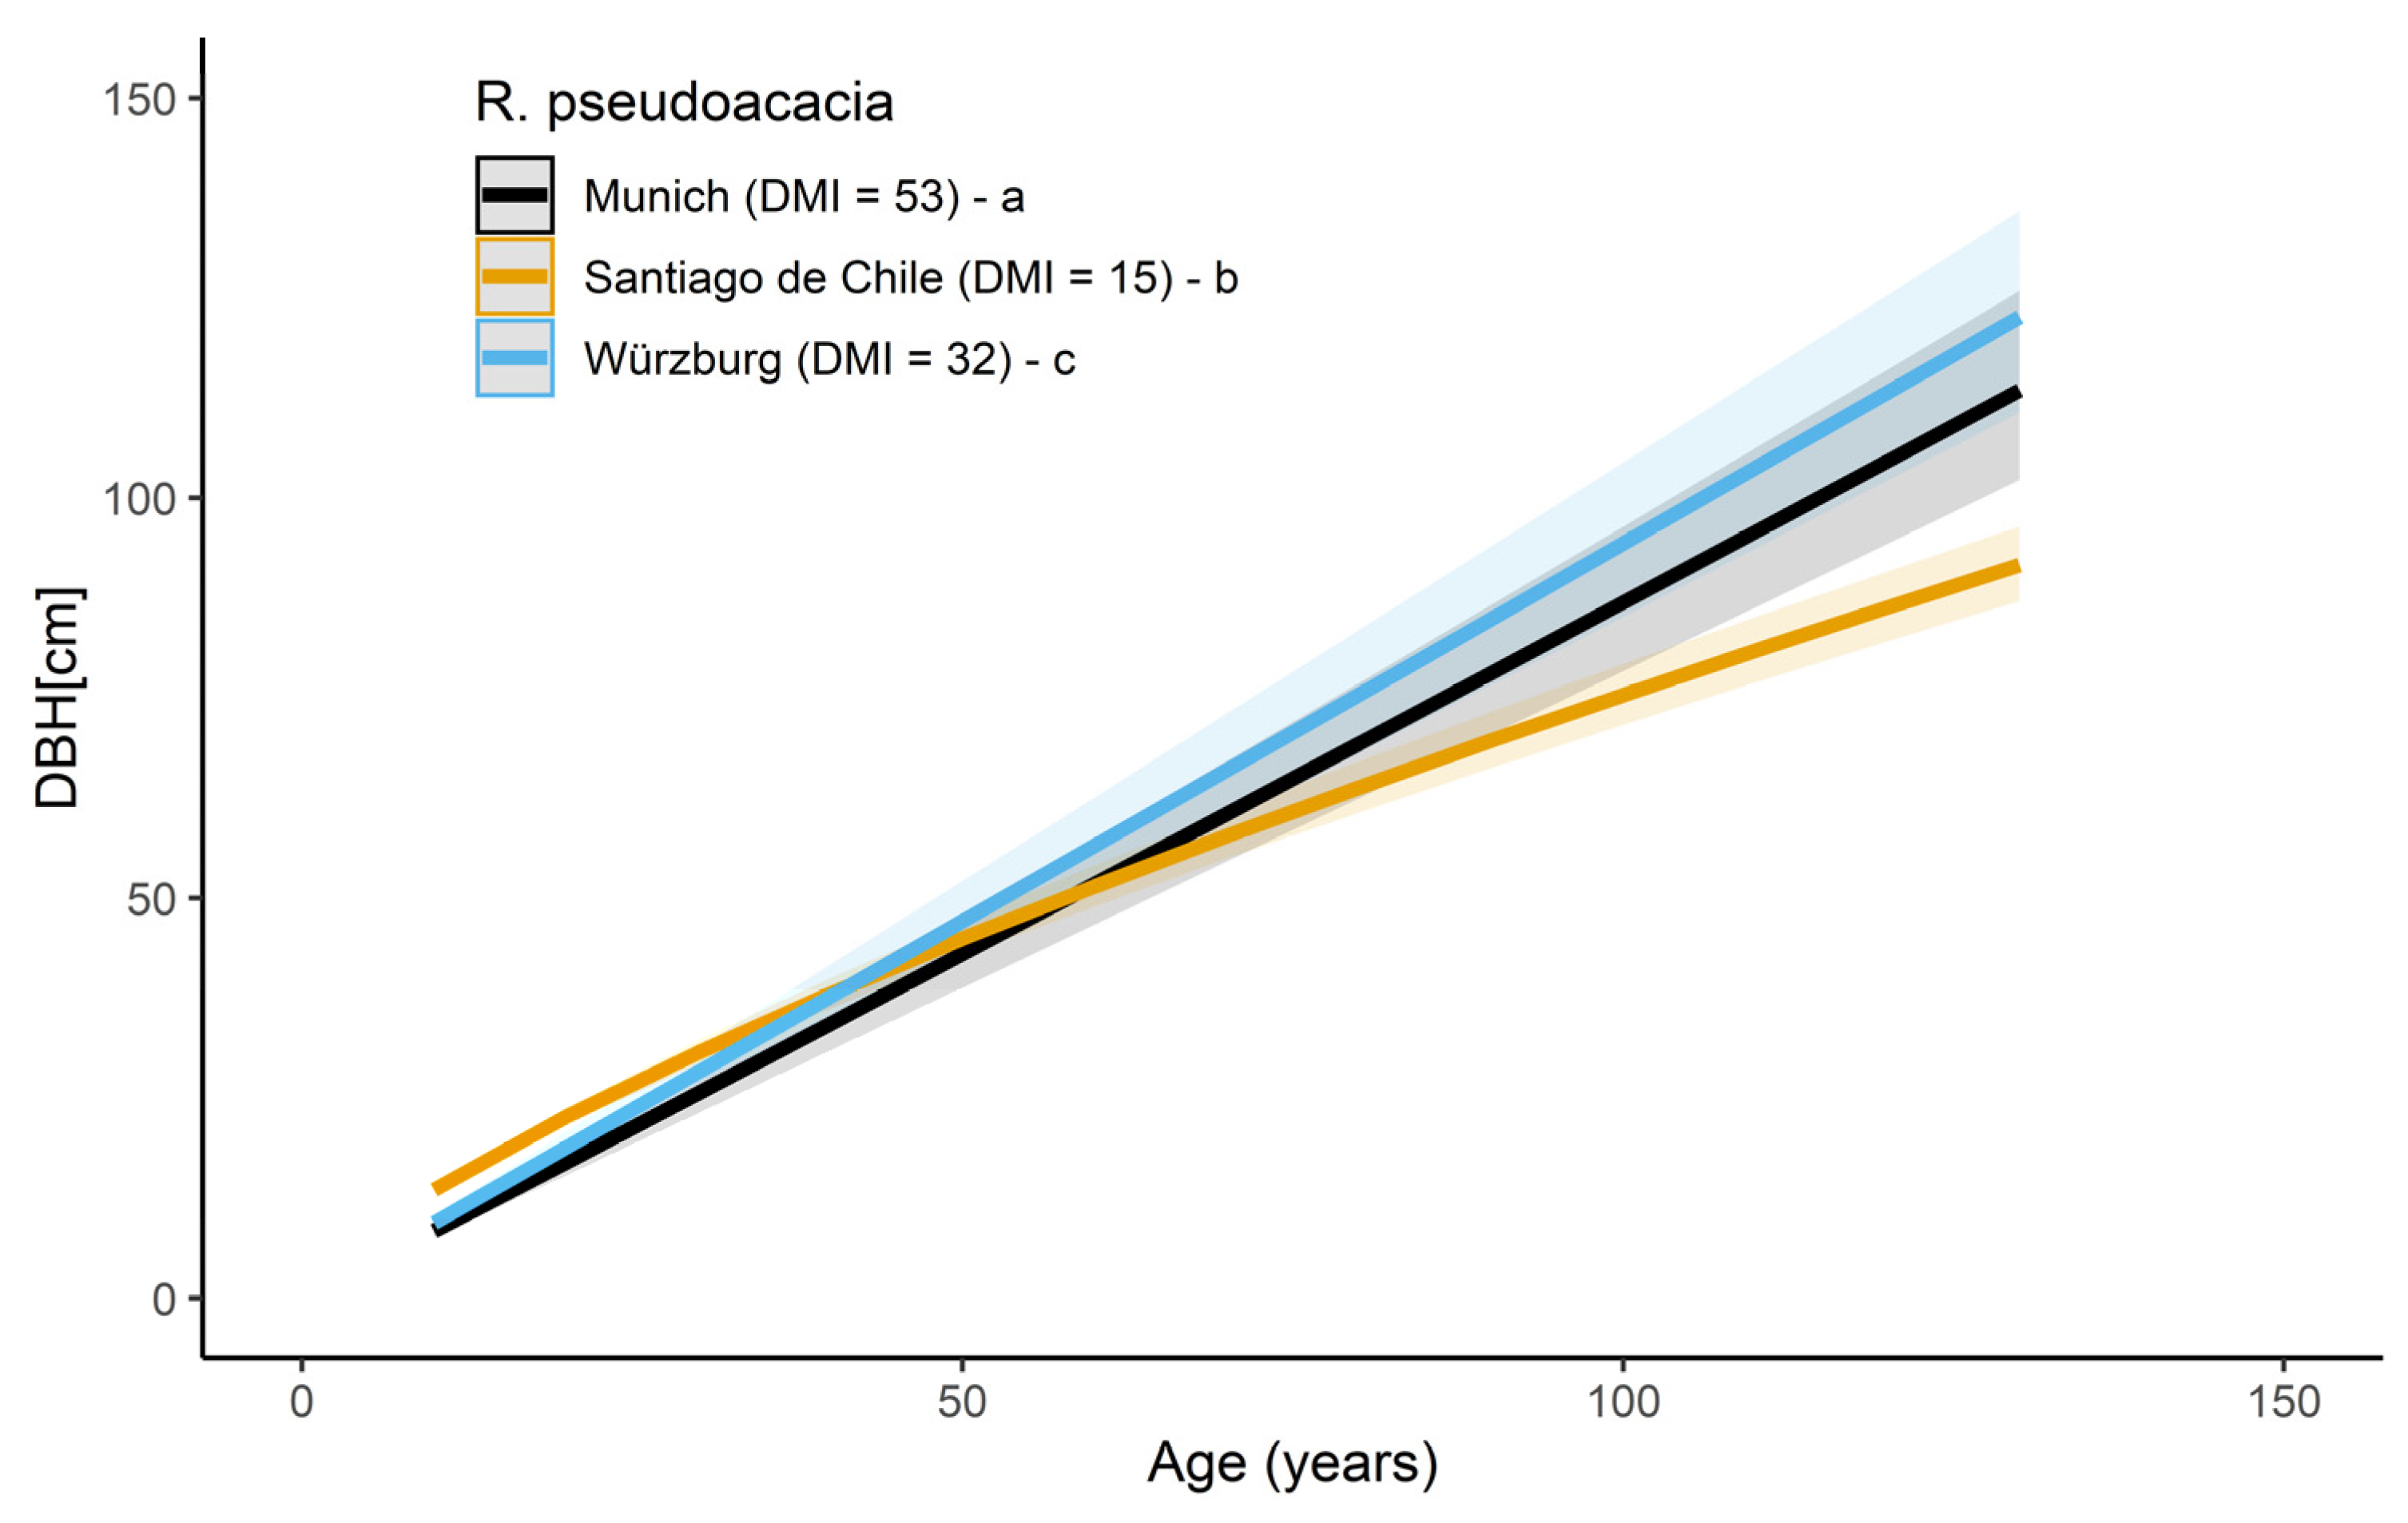
Model results for the stem diameter in dependence of age for R. pseudoacacia in three cities, Santiago de Chile (DMI = 15), Munich (DMI = 53), and Würzburg (DMI = 32), are presented in Figure 4 and listed in Table A2. The post-hoc test revealed significant differences in the slopes of all three cities, whereby the differences between Santiago de Chile and both Munich and Würzburg were significantly higher (p < 0.001) than between Munich and Würzburg (p < 0.0223). Furthermore, the lower slope for Santiago de Chile (0.746 ± 0.003), compared with Munich (1.015 ± 0.004) and Würzburg (1.001 ± 0.004), indicate that the trees in Santiago de Chile tend to have a lower diameter growth with age, compared with Munich (p < 0.001) and Würzburg (p < 0.001). At the age of 40, R. pseudoacacia in Santiago de Chile and Würzburg had a similar DBH of around 38 cm, while the trees in Munich showed a 10% lower DBH (34.3 cm). However, at 60, the trees showed a similar DBH in Santiago de Chile and Munich (51.5 and 51.8, respectively), while the trees in Würzburg had a 10.9% higher DBH (56.6 cm). At 80, trees in Würzburg showed a 15% higher DBH than Santiago de Chile and 8% to Munich. At 100 years, trees in Santiago de Chile had a 20% lower DBH compared to Würzburg and a 13% lower than Würzburg.
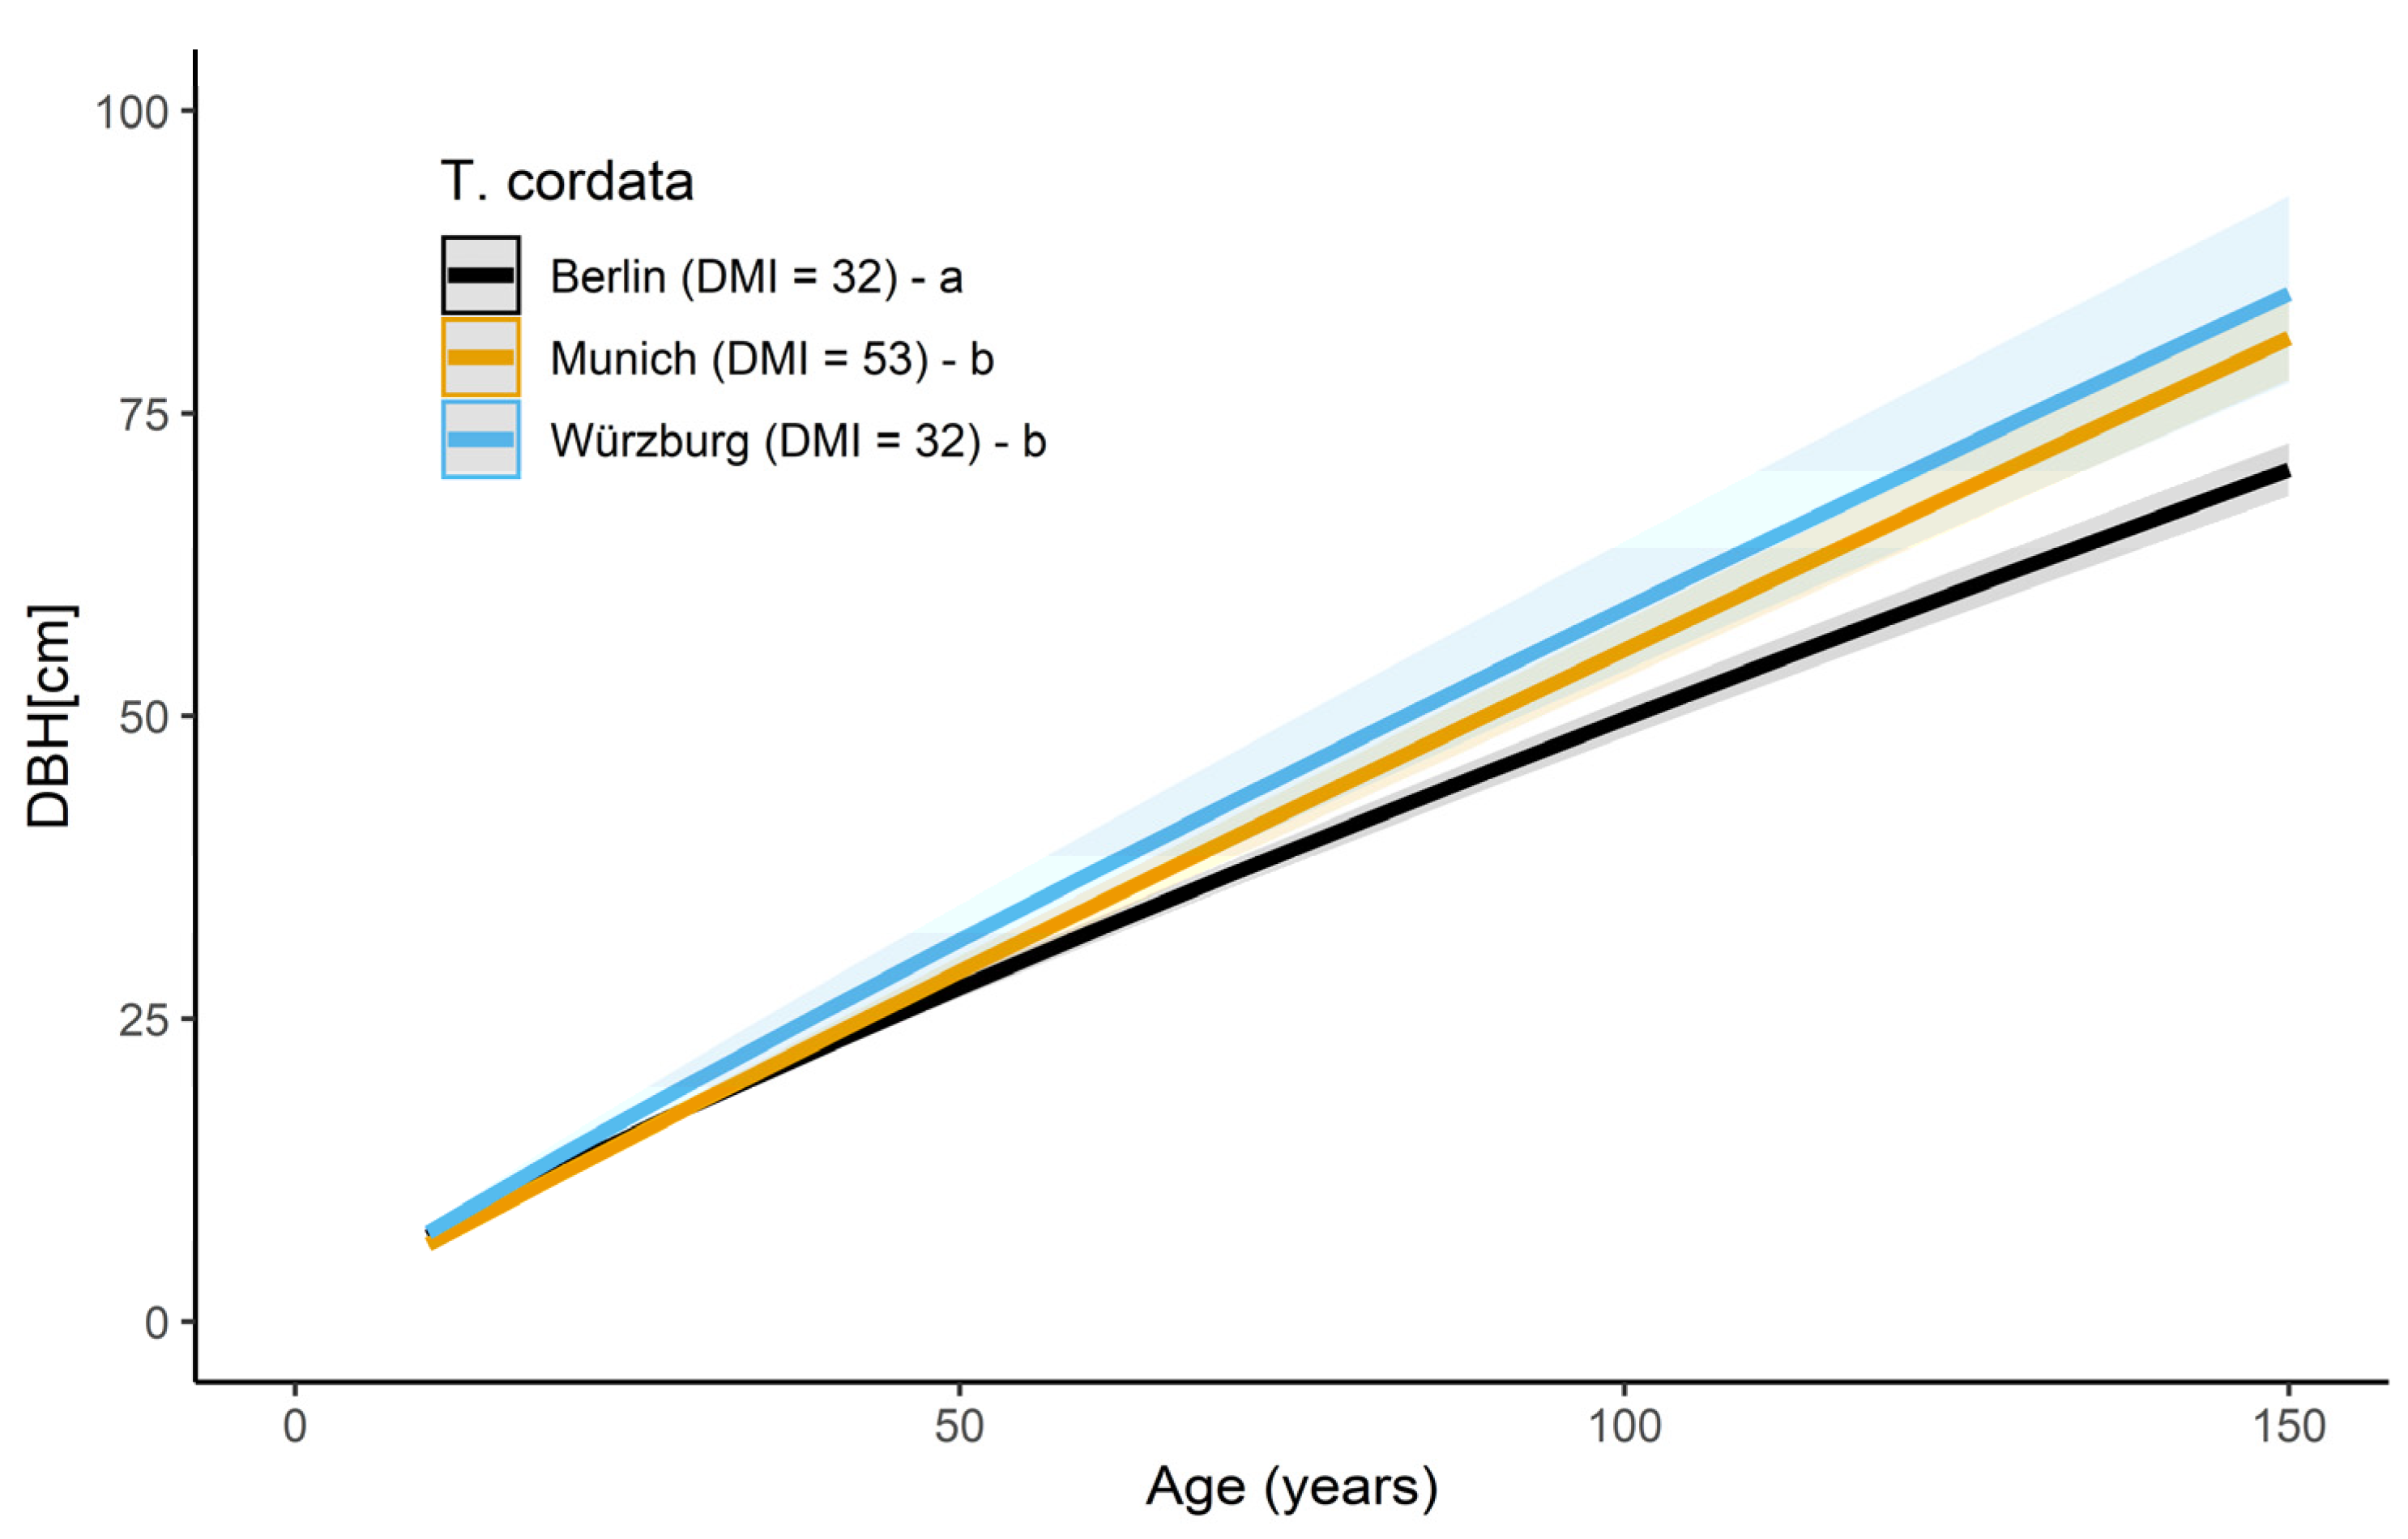
T. cordata in Berlin, Munich, and Würzburg revealed significant differences in tree growth in all three cities (see Figure 5 and Table A2). The highest slope was observed for Munich (0.9401 ± 0.0019), followed by Würzburg (0.9031 ± 0.0036) and Berlin (0.8519 ± 0.0021). On average, T. cordata, at the age of 40, showed a lower DBH in both cities, Berlin (−13%) and Munich (−10%), compared to Würzburg. Even though Würzburg and Berlin have similar climatic patterns (DMI = 32), growth differences of the DBH get more substantial with increasing age. At 80 years, compared with the trees in Würzburg (BHD = 48.1 cm), T. cordata had a 17% lower DBH in Berlin (41.2 cm), and a 7% lower DBH in Munich (DBH = 45 cm).
3.4. Effect of Drought Years on Stem Diameter Increment of Common Urban Tree Species
The superposed epoch analysis (SEA) was used to investigate the impact of drought events on the stem diameter increment. For this, three to five extreme drought years were selected as key event years for each city based on the climate dataset (see Figure A1 in Appendix A). Depending on the tree-data timeframe, the drought years with the lowest DMI value were chosen for which the tree-dataset covered at least 50% of the sampled trees of a given species in each city. The selected drought years for each tree species in each city are listed in Table 4.
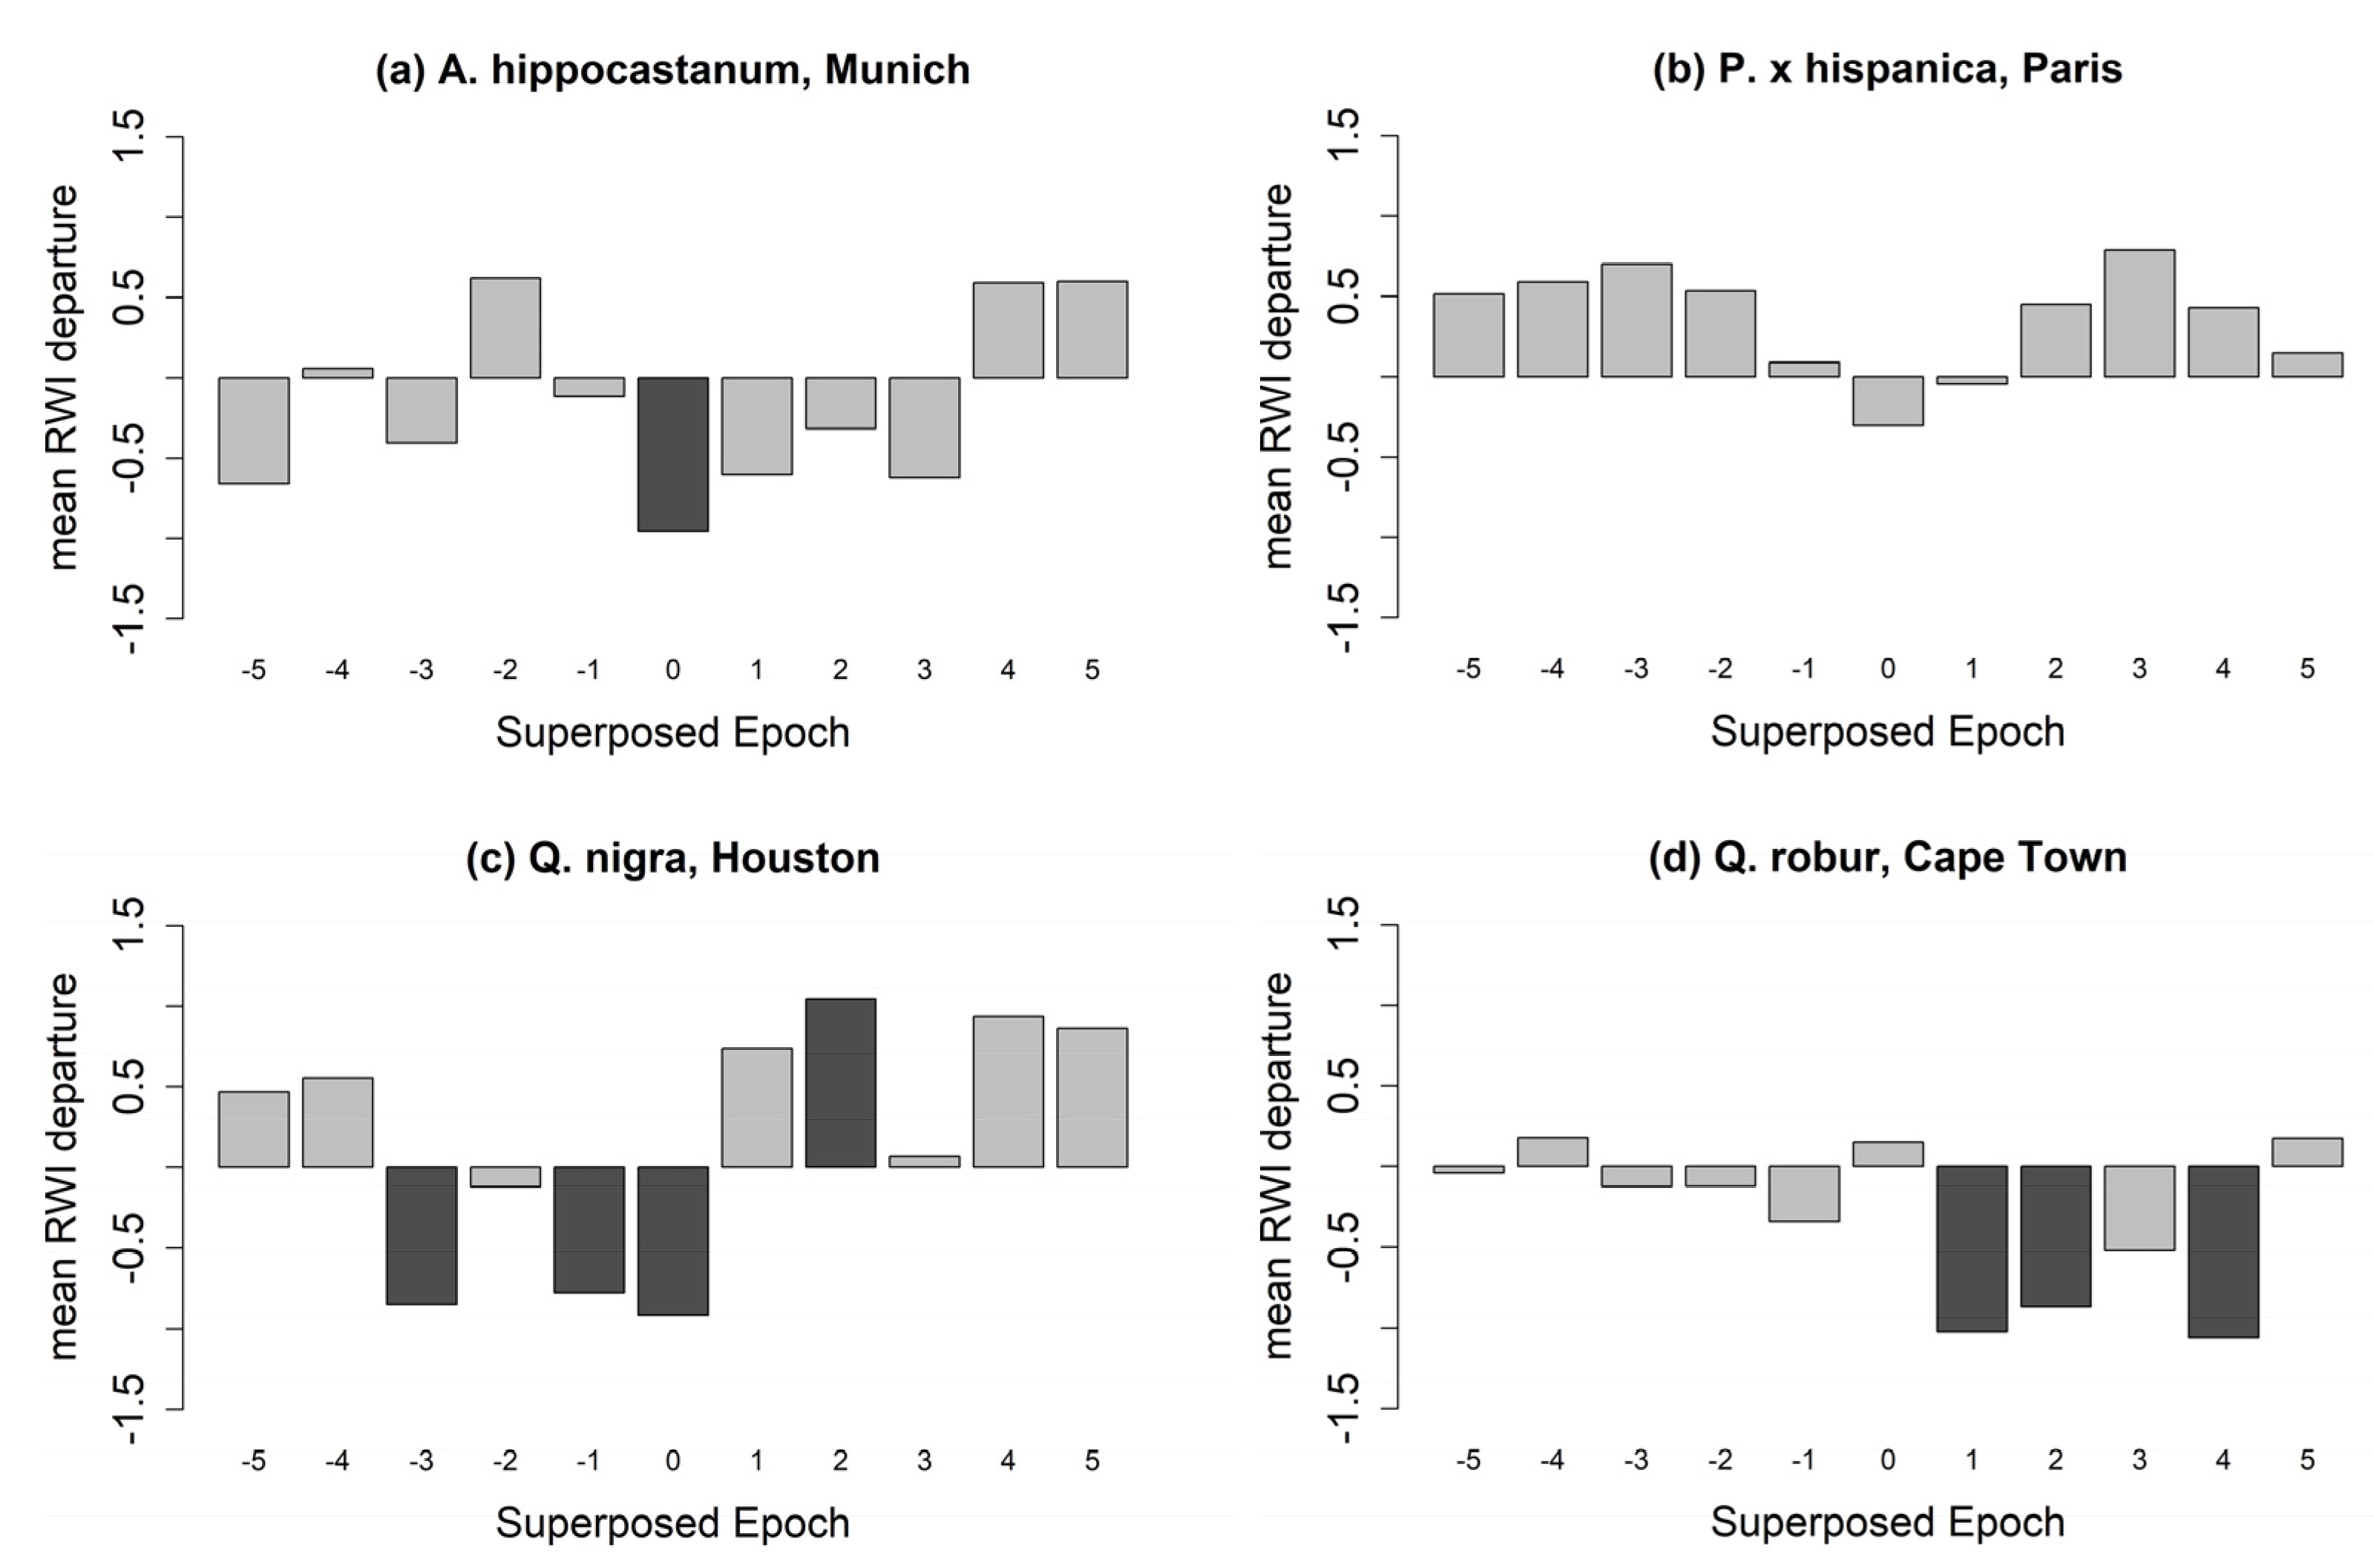
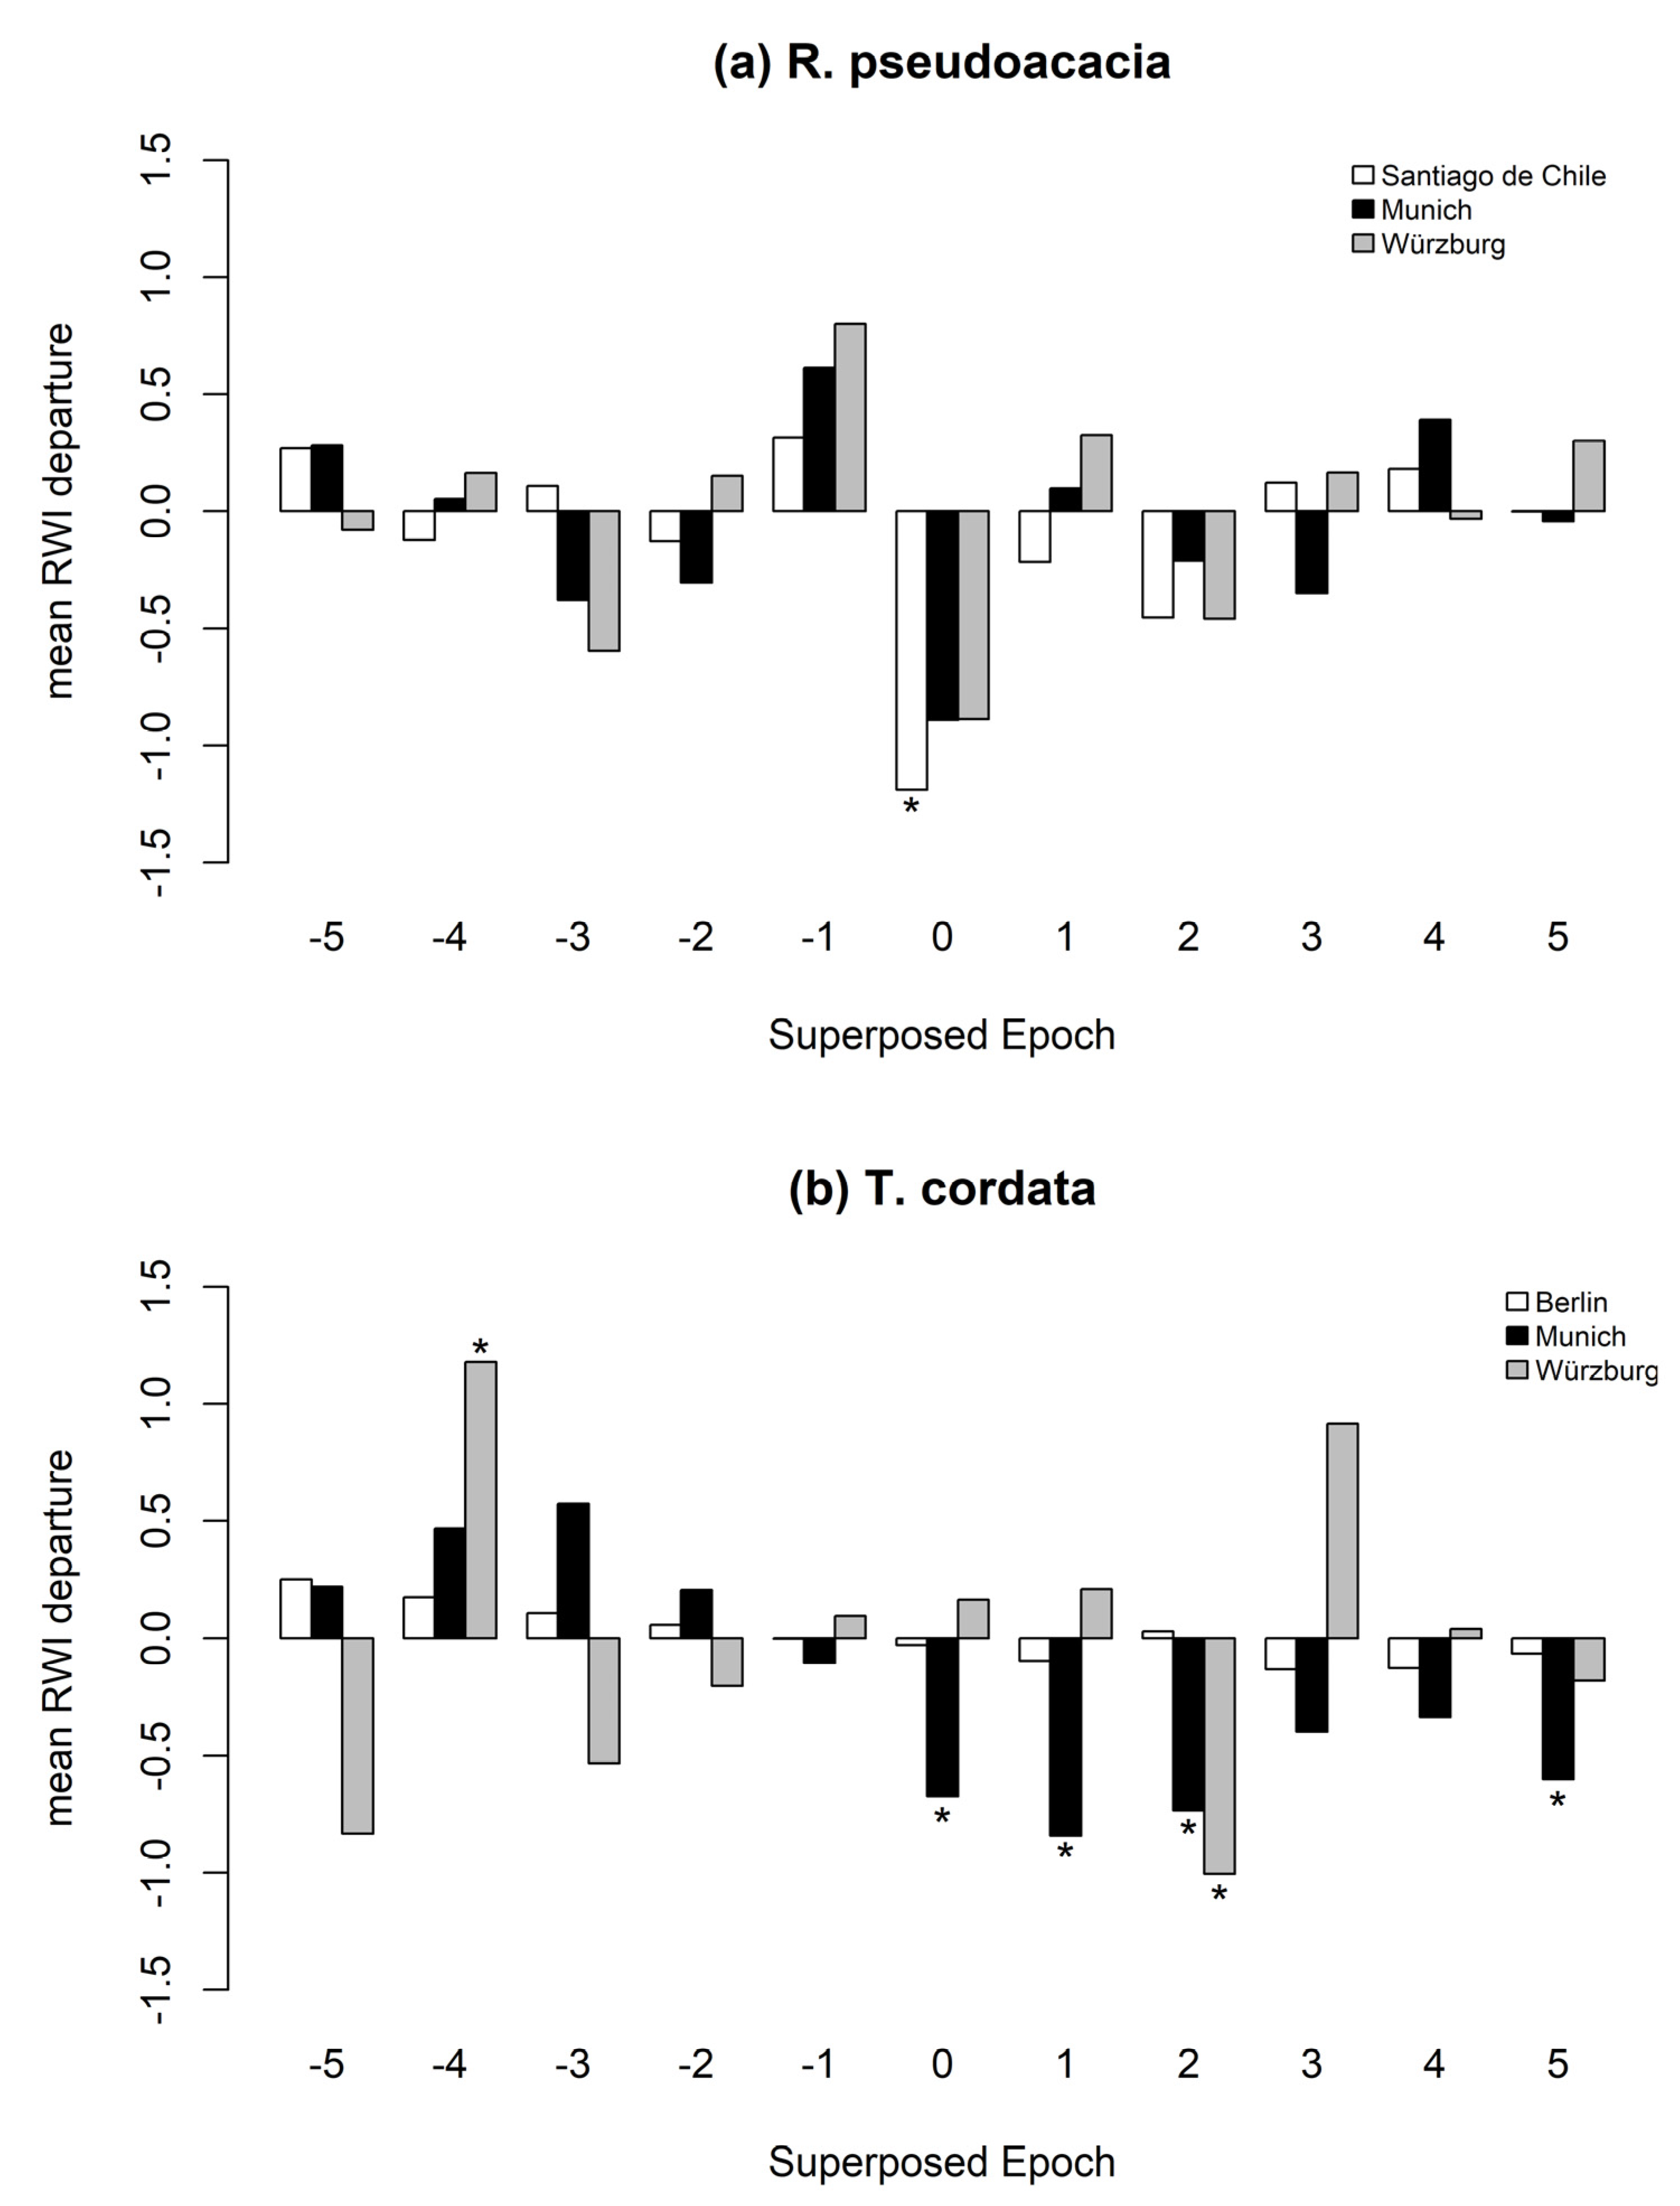
The SEA results reveal varying reactions for tree species to drought events within the analyzed cities (Figure 6 and Figure 7, and Table A3). A. hippocastanum trees in Munich showed a negative stem diameter increment only during the drought years (Figure 6a). P. × hispanica in Paris had the highest resistance to droughts and showed no significant reaction (Figure 6b). Q. nigra in Houston experienced a negative ring-width indices (RWI) development prior to and during the drought year, followed by a fast recovery, and thus showed a significant positive RWI two years after the drought (Figure 6c). Q. robur trees in Cape Town had negative RWIs in the first and the fourth year after a drought event (Figure 6d). R. pseudoacacia (Figure 7a) was resistant to drought in Munich and Würzburg, while it experienced a decreased growth in Santiago de Chile explicitly during the year of a drought event. T. cordata (Figure 7b) growing in Munich showed the highest sensitivity during and after drought years. On the other hand, T. cordata in Berlin was resistant to drought years. In Würzburg, T. cordata experienced a positive RWI four years before the drought and a negative RWI in the second year after the drought.
4. Discussion
4.1. Impact of Urban Climate on the Long-Term Growth Response of the Stem Diameter
The effect of drought on the stem diameter growth of all trees was notable and led to a suppression of the diameter at breast height (DBH) by 8.3% at the age of 100 years, presuming a change from the current Central European long term average of humid (DMI = 32 in Berlin, Paris, and Würzburg to 53 in Munich) to semi-dry conditions as in Santiago de Chile, where the average DMI is 15 (see Table 1). Such a strong shift is not likely to occur in Central Europe until 2050 [59]. However, on average, the climate of cities in the northern hemisphere is expected to shift towards warmer conditions in the next decades [59]. That shift corresponds to an average speed of 20 km a−1 and will undoubtedly persist beyond 2050 [60].
Considering the fact that the sampled tree species within this study grow in one climate zone or region explicitly (except for R. pseudoacacia), an intra-comparison for tree species growing in different climate zones was not possible. Therefore, the study at hand classified tree species into drought-tolerant tree species (including P. × hispanica, Q. nigra Q. robur, R. pseudoacacia) and drought-sensitive tree species (A. hippocastanum, T. cordata). This classification was done following the study of Niinemets and Valladares [45]. However, the general sensitivity of the DBH to arid climate conditions was due to the drought reaction of the drought-sensitive species group (see Figure 3), showing a 16.6% decline in the diameter growth at the age of 100 years. In contrast, the predicted DBH over time in the drought-tolerant group was proven to be tolerant for a DMI range between 13 to 52 (corresponding to semi-dry to very humid climate).
Due to the broad range of data for the species R. pseudoacacia and T. cordata, analyses of the DBH were possible at a species-specific level. Considering R. pseudoacacia as a prominent example for the drought-tolerant group, the diameter growth was strongly dependent on tree age and showed a different growth course in Santiago de Chile, compared with Munich and Würzburg. In Santiago de Chile, where the climate is classified as semi-dry (DMI = 13), the diameter-age growth course marked a higher diameter growth in the younger age, followed by a lower diameter growth in a mature stage (see Figure 4) compared with Munich and Würzburg. On the contrary, the diameter-age growth course in the humid climate of Munich (DMI = 53) and Würzburg (DMI = 32) was similar and marked a quasi-linear growth. On average, R. pseudoacacia showed a higher DBH in Würzburg, followed by Munich and Santiago de Chile. For example, at the age of 100, R. pseudoacacia showed an average diameter of 94.3 cm in Würzburg, 87 cm in Munich, and 75.4 cm in Santiago de Chile. However, the steeper slopes for R. pseudoacacia in humid climate cities indicate stronger growth–age relationships with increasing water supply. The differing long-term growth reaction of R. pseudoacacia in Santiago de Chile compared to Munich and Würzburg can generally be explained by the typical climate of these locations implying the phenotypic acclimation or the species adaption to the respective local conditions to which the species is exposed to. It seems that, in the long-term, R. pseudoacacia profits from the higher precipitation in the humid climate of Munich. Thus, in terms of a shift of future climate conditions in central European cities, urban planning needs to consider markedly slower tree growth in the long term, even for well-known drought-tolerant species. However, the persistence of drought-tolerant tree species under notably dry conditions will support their suitability in the future urban environment.
Furthermore, the drought sensitivity of R. pseudoacacia may be affected by the physiological adaptation of this species to a more favorable water supply. Due to its isohydric stomatal behavior strategy, R. pseudoacacia closes the stomata early during drought events to minimize water loss through transpiration [61]. This allows R. pseudoacacia to resist short drought periods [39]. However, the isohydric strategy may lead to carbon starvation and tree death. Recent findings suggest that R. pseudoacacia, as a leguminous species, is drought-resistant due to its symbiosis with nitrogen-fixing bacteria [62]. The symbiotic nitrogen (N) fixation may play a role in drought tolerance and drought avoidance by supplying N to leaves for acclimation and facilitating compensatory growth following drought. Recent findings on forest stands of Eastern Europe have shown that R. pseudoacacia will benefit from climate change [63,64] and that it is a species that reacts very plastically with radial increments to thermal and precipitation conditions [65]. However, limitation of water supply may lead to morphological changes such as reduction of individual leaf dimensions of R. pseudoacacia, resulting in a highly reduced leaf area [66] and thus, in combination with the isohydric stomatal behavior strategy, providing lower cooling of the urban environment.
T. cordata showed higher DBH in Würzburg compared with Berlin regardless of the similar long-term climate patterns in Berlin and Würzburg (DMI = 32) (see Figure 5). On average, T. cordata showed, at the age of 100 years, a diameter of 58.9 cm in Würzburg, 55.5 cm in Munich, and 49.8 cm in Berlin. Moreover, a higher slope was estimated for Munich (0.9401) and Würzburg (0.9031), indicating a higher DBH in these two cities compared to Berlin (0.8519). Possible explanations for the differing reaction of T. cordata in Würzburg and Berlin rely on climate aspects that may affect the tree growth during the vegetation period and winter. These aspects refer to the distribution of precipitation amount throughout the year, sunshine duration, temperature, relative air humidity, and winter frost. Furthermore, microclimatic aspects in the nearby environment of the trees may impact tree growth. Many studies refer to T. cordata as a tree species sensitive to the environmental site conditions within a city. In a recent study by Rötzer et al. [18], T. cordata developed a higher biomass growth in the suburban parts of Würzburg compared to the highly paved parts of the city center. The authors state that due to different microclimatic conditions, individual environmental sites may impact tree growth. A study by Moser-Reischl et al. [67] on urban tree growth in southern Germany reported a lower diameter growth for T. cordata trees growing in city squares compared to other growing sites such as parks. Other studies conducted in temperate climate cities of Central Europe recorded declined growth of T. cordata due to high environmental stress along roadside areas [68] and higher rates of necrotic leaves along heavy traffic roads [69]. This leads to the conclusion, that beside climatic tolerances, other environmental aspects such as traffic emissions need to be considered when analyzing influences on urban tree growth. In a study of temperate climate conducted in different cities, greater root development was observed for Tilia ssp. within irrigated areas and in areas where coarser fractions of gravel and debris were mixed with finer materials such as clay and silt [70]. Moser et al. [39] analyzed the growth reaction of T. cordata and R. pseudoacacia during the extremely dry and warm summer of 2015 in two different urban sites in Munich, namely highly paved squares and more open, green squares. The study showed that trees growing at open green sites had a higher diameter growth than trees growing in highly paved squares. Following the anisohydric stomatal regulation strategy, T. cordata keeps an ongoing leaf gas exchange even under drought, leading to water loss and tree mortality as a result. Together with the mentioned studies, the observed results suggest the avoidance of future plantings of T. cordata in highly paved urban areas and along roadsides.
Other factors such as genotype adaptation or provenance play an important role in the long-term growth of trees. Moreover, phenotypic acclimation or genetic adaptation, or a balance of both, may explain the growth responses of tree species to the changing climate [71]. Broadmeadow et al. [72] recommend using provenances from origins, where the prevailing climatic conditions follow the projected future conditions of the target site.
4.2. Impact of Drought Years on the Stem Diameter Increment
The SEA results revealed that P. × hispanica and R. pseudoacacia growing in temperate climate cities were the most tolerant tree species during drought events (see Figure 6a and Figure 7a, and Table A3). These results reflect the importance of drought-tolerant and fast-growing tree species for urban forestry, as shown in numerous studies on urban tree growth. For example, a dendrochronological study [73] on five different urban tree species in temperate climate cities showed that the diameter increment of P. × hispanica was not significantly affected by drought years. Furthermore, analyses on leaf-gas exchange of five tree species in the temperate climate resulted in a species-specific response to urban sites, with P. × hispanica resulting as a tree species with a high water use efficiency. Even in the selected periods of high atmospheric drought and low soil moisture, the water use efficiency remained high [74]. Other studies reported P. × hispanica as the most tolerant tree species to environmental stress for roadsides in cities of temperate climate [68]. Therefore, under the prevailing environmental and climatic conditions, P. × hispanica seems well adapted to urban environments. Moser-Reischl et al. [67] reported for P. × hispanica trees growing in three urban environments, namely parks, public squares and roadsides at six cities with a temperate climate, a similar diameter and height increment regardless of the growing site. However, other studies on P. × hispanica conducted in cities with temperate climate showed opposite results for this tree species. These studies reported a negative influence for P. × hispanica by higher sums of long-term precipitation and higher numbers of freezing days in winter on the vitality of this species [75] and reduced growth by high temperatures during the growing season [76].
For R. pseudoacacia, the observed SEA results (see Figure 7a, Table A3) revealed a high resistance of this tree species to drought years when growing in temperate climate cities. R. pseudoacacia growing in the Mediterranean climate of Santiago de Chile showed negative growth reactions during the drought years, followed by a fast recovery in the following years. Due to its great ability to cope with environmental drought, R. pseudoacacia is being seen as an important tree species in both ecosystems, forests, and urban landscapes. Thus, there has been enormous research investigating the adaptation and avoidance strategy of R. pseudoacacia to environmental drought in recent decades. In a study conducted in German rural areas, young trees of R. pseudoacacia showed ecophysiological and morphological adaptation to prolonged drought conditions by reducing water loss through transpiration and leaf size. Under drought conditions, the stomatal down-regulation of transpiration was reduced by 50% compared to growth under sufficient soil moisture supply [66]. In a recent study by Rötzer et al. [18] on the growth reaction of mature R. pseudoacacia and T. cordata in Würzburg, T. cordata showed a significant lower diameter increment compared to R. pseudoacacia and thus a lower provision of environmental ecosystem services such as carbon fixation and cooling by transpiration during the extreme drought years 2018 and 2019. Nola et al. [77] analyzed the response of xylem anatomy of mature R. pseudoacacia and Q. robur to climate variability in temperate forests of Pavia, Italy. Despite the same wood anatomy (ring-porous) of these species, the authors found differences in the vessel size and distribution within tree rings, with. Q. robur showing a typical ring-porous reaction by building a uniform vessel number and size depending on the previous summer precipitation and autumn-winter temperatures. Conversely, R. pseudoacacia was able to modulate its response to climate by varying the number and size of vessels. The xylem plasticity enables R. pseudoacacia to cope better with both inter-annual climate variations and extreme drought events than Q. robur. SEA results for Q. robur in Cape Town showed a high sensitivity of this species to drought events by showing a significantly lower diameter increment in the years after the drought events (see Figure 6d). T. cordata growing in Munich showed the highest sensitivity during and after drought years by experiencing reduced growth in the following years after drought events (see Figure 7b). Similar results were shown for the diameter increment growth of mature T. cordata in Munich for drought years during the period of 1985 to 2015 [78]. On the other hand, the observed results show that T. cordata growing in Würzburg and Berlin were resistant when facing drought events. In Würzburg, this tree species showed a significantly lower diameter growth in the second year after the drought, while in Berlin, the diameter increment was resistant to drought years. A possible reason for this reaction could be the local climate of the different cities, especially the different annual precipitation sums and the distribution over the year. While Berlin and Würzburg are characterized by a drier and warmer climate with a long-term mean annual precipitation sum of 590 mm a−1, Munich is characterized by an almost twice as high precipitation (950 mm a−1). This growth reaction may be explained by a possible adaptation of T. cordata to the dry and warm local climate conditions of Berlin and Würzburg.
A. hippocastanum trees in Munich experienced an overall reduced increment growth during drought years (Figure 6a). However, A. hippocastanum showed the ability to recover rapidly after drought years. Studies on A. hippocastanum have shown that this tree species is very sensitive to the growing site. Moser-Reischl et al. [67] analyzed the growth reactions of almost 600 trees of A. hippocastanum in South Germany. The study’s results show different growth reactions of A. hippocastanum depending on the sites of the cities. Trees growing in park sites had the highest average diameter increment compared to trees on street sites and highly paved public squares.
For Q. nigra in Houston, a significantly reduced growth before and during drought years was assessed, followed by an immediate recovery leading to significant, positive mean ring-width-index departure after two years (Figure 6c). Results of a study by Moser et al. [79] in Houston showed that young trees of Q. nigra grew better in the city center than in suburban and rural surroundings of Houston. However, this effect was reversed with increasing age.
Other aspects of urban green management, such as pruning operations, irrigation, or leaf litter removal, may affect the short-term growth reaction of urban trees. A study conducted on poplar trees (Populus spp.) [80] recorded higher leaf carbon isotopic ratios (δ13C) for pruned trees than unpruned trees, indicating a higher stomatal conductance of leaves, thus suggesting that pruned trees could have higher drought stress resistance than unpruned trees. Due to a reduced transpiration surface, the pruning treatment improved the trees’ water status. Another crucial aspect is the soil biota, especially the mycorrhizal composition in the soil, which may increase the water uptake and thus protect the tree during drought events due to the symbiosis with the host plant [81]. For forest trees, mycorrhizal fungi play an important role in the natural regeneration of forests [82]. Rusterholz et al. [83] analyzed the mycorrhizal composition on juvenile sycamore maple (Acer pseudoplatanus) along an urbanization gradient from rural surroundings to the city center of a temperate climate city. The study’s results show that the mycorrhizal fungal colonization was 15–45% lower in areas of higher urbanization than in rural areas.
Due to already mentioned and other biotic and abiotic environmental conditions, trees in urban areas show strong stress responses in their growth reactions. Further, increasing urbanization may negatively influence the growing sites of trees, raising the mortality rate of urban trees. The life expectancy of trees within urban sites is relatively low compared to forest trees [20] and depends on factors such as growing sites and proper management, amongst others. Analyzing the growth of trees and other components of the urban green infrastructure, such as shrubs and lawns, plays a crucial role towards sustainable planning and management of green infrastructure in future cities. As shown in this study, combined tree and climate datasets and permanent monitoring sites in urban environments provide the background for in-depth analyses of the provision of ecosystem services by a city’s tree cover. Such data and climate-growth relationship of urban trees can further serve as a base for the development and improvement of growth models such as the dynamic Urban Tree growth model UTDyn (Pretzsch et al. [28], Poschenrieder et al. [29]) or the process-based urban tree growth model CityTree (Rötzer et al. [6]).
5. Conclusions
This study focused on analyzing the long-term stem diameter growth reaction of 1178 trees in seven cities worldwide depending on climate conditions (air temperature, precipitation). The observed results indicate that the effect of climate on the long-term stem diameter growth at any age was outstanding and that dry and warm climate, i.e., a low de Martonne Index, led to a reduction of diameter growth. The growth decline of drought-sensitive tree species such as A. hippocastanum and T. cordata was notably higher compared to the growth of drought-tolerant tree species such as P. hispanica, Q. nigra, Q. robur, and R. pseudoacacia. It is known that ecosystem environmental services provided by trees strongly depend on the growth and dimensions of these. At the same time, tree growth depends on species-related tolerance against drought events and climatic conditions. This dependency will most likely be amplified under expected future climatic conditions. Thus, future urban green management needs to focus on a tree selection adapted to ongoing climatic changes to ensure a sustainable and further provision of environmental ecosystem services. This study’s findings and datasets may contribute to a better understanding of urban tree growth reactions to climate and to further development of concepts such as the dynamic Urban Tree Growth model UTDyn (see Pretzsch et al. [28] and Poschenrieder et al. [29]), aiming for sustainable planning and management of urban trees.
Due to the long lifespan of the trees, and their enhanced provision of ecosystem services in mature and old stages of growth in particular, urban management needs thought-out and long-term designs aiming for a sustainable management and vital growth of trees. In this context and towards future climatic impacts, there is a need for interdisciplinarity within urban green planning, including architecture, forestry, ecology, water management, new technologies, and the urban communities as important drivers.
Author Contributions
V.D.: Conceptualization; data curation; formal analysis; investigation; methodology; visualization; writing—original draft; W.P.: data curation; formal analysis; writing—original draft; T.R.: conceptualization; funding acquisition; writing—review and editing; A.M.-R.: Data curation; writing—review and editing; H.P.: Conceptualization; Project administration; Funding acquisition. All authors have read and agreed to the published version of the manuscript.
Funding
This research was funded by the Audi Environmental Foundation, grant number 5101954, the German Science Foundation (DFG), grant number PR 292/21-1 and by the Bavarian State Ministry of the 504 Environment and Consumer Protection, grant numbers TUF01UF-64971, TKP01KPB-71924 and TEW01CO2P-75382.
Institutional Review Board Statement
Not applicable.
Informed Consent Statement
Not applicable.
Data Availability Statement
Not applicable.
Acknowledgments
The authors gratefully acknowledge all funding institutions and municipalities that supported the study through funding and permissions of tree sampling. These are the AUDI Environmental Foundation for funding the project: “Reaction kinetics of trees under climate change” (5101954), the German Science Foundation (DFG) for providing funds for the project PR 292/21-1 “Impact of trees on the urban microclimate under climate change: Mechanisms and ecosystem services of urban tree species in temperate, Mediterranean and arid major cities”, the Bavarian State Ministry of the Environment and Consumer Protection for funding the study through projects: “Urban Trees under Climate Change: their growth, environmental performance, and perspectives” (TUF01UF-64971), “Climate experience Würzburg: Influence of trees on the microclimate of the city of Würzburg” (TKP01KPB-71924), and “Ecosystem services of urban green at public squares in Munich” (TEW01CO2P-75382). The authors also thank the responsible municipal authorities of Munich, Würzburg, Berlin, Paris, Houston, Cape Town, and Santiago de Chile for the support and permission to measure and core the trees. The authors thank Álvaro González-Reyes for providing the historical climate dataset for Santiago de Chile. Finally, the authors would like to thank Pascal Edelmann and Peter Biber for the constructive discussion.
Conflicts of Interest
The authors declare no conflict of interest.
Appendix A

Table A1.
Statistical results of the linear mixed effect model as described by Equations (2) and (3). DT = Drought tolerant, DS = Drought sensitive. Significant p values (p < 0.05) are shown in bold.
Table A1.
Statistical results of the linear mixed effect model as described by Equations (2) and (3). DT = Drought tolerant, DS = Drought sensitive. Significant p values (p < 0.05) are shown in bold.
| Model Equation | Equation (2) | Equation (3) on DT | Equation (3) on DS | ||||||
|---|---|---|---|---|---|---|---|---|---|
| Predictors | Estimates | SE | p | Estimates | SE | p | Estimates | SE | p |
| Intercept | 0.604 | 0.090 | <0.001 | 0.576 | 0.051 | <0.001 | −0.265 | 0.048 | <0.001 |
| ln Age | 0.784 | 0.002 | <0.001 | 0.835 | 0.002 | <0.001 | 0.865 | 0.001 | <0.001 |
| DMI | −0.007 | 0.000 | <0.001 | 0.001 | 0.002 | 0.456 | 0.007 | 0.001 | <0.001 |
| ln Age:DMI | 0.002 | 0.000 | <0.001 | ||||||
| Random Effects | |||||||||
| σ2 | 0.01 | 0.01 | 0.01 | ||||||
| τ00 treeID:(species:city) | 0.11 | ||||||||
| τ00 species:city | 0.03 | ||||||||
| τ00 city | 0.03 | ||||||||
| τ00 treeID | 0.17 | 0.09 | |||||||
| τ00 treeID:city | |||||||||
| ICC | 0.93 | 0.92 | 0.88 | ||||||
| N treeID | 1178 | 571 | 607 | ||||||
| N species | 6 | ||||||||
| N city | 7 | ||||||||
| Observations | 66,000 | 25,219 | 41,023 | ||||||
| R2 | 0.701 | 0.718 | 0.795 | ||||||
Table A2.
Statistical results of the linear mixed effect model described by Equation (4) on the diameter growth for R. pseudoacacia in Santiago de Chile, Munich, and Würzburg and T. cordata in Berlin, Munich, and Würzburg. Significant p values (p < 0.05) are shown in bold.
Table A2.
Statistical results of the linear mixed effect model described by Equation (4) on the diameter growth for R. pseudoacacia in Santiago de Chile, Munich, and Würzburg and T. cordata in Berlin, Munich, and Würzburg. Significant p values (p < 0.05) are shown in bold.
| Model Equation | Equation (4) on R. pseudoacacia | Equation (4) on T. cordata | |||||
|---|---|---|---|---|---|---|---|
| Predictors | Estimates | SE | p | Predictors | Estimates | SE | p |
| Intercept | 0.889 | 0.027 | <0.001 | Intercept | −0.015 | 0.018 | 0.395 |
| ln Age | 0.746 | 0.003 | <0.001 | ln Age | 0.852 | 0.002 | <0.001 |
| Munich | −1.096 | 0.06 | <0.001 | Munich | −0.298 | 0.029 | <0.001 |
| Würzburg | −0.953 | 0.06 | <0.001 | Würzburg | −0.068 | 0.05 | 0.174 |
| ln Age:Munich | 0.269 | 0.005 | <0.001 | ln Age:Munich | 0.088 | 0.003 | <0.001 |
| ln Age:Würzburg | 0.256 | 0.005 | <0.001 | ln Age:Würzburg | 0.051 | 0.004 | <0.001 |
| Random Effects | |||||||
| σ2 | 0.01 | σ2 | 0.01 | ||||
| τ00 treeID | 0.08 | τ00 treeID | 0.06 | ||||
| ICC | 0.87 | ICC | 0.84 | ||||
| N treeID | 190 | N treeID | 414 | ||||
| Observations | 8025 | Observations | 27,229 | ||||
| R2 | 0.828 | R2 | 0.842 | ||||
Table A3.
Superposed epoch analysis (SEA) for the single urban tree species in seven cities. p values are listed for the pre-drought years (−5 to −1), the drought years (0), and the post-drought years (1–5). Significant p values (p < 0.05) are printed in bold.
Table A3.
Superposed epoch analysis (SEA) for the single urban tree species in seven cities. p values are listed for the pre-drought years (−5 to −1), the drought years (0), and the post-drought years (1–5). Significant p values (p < 0.05) are printed in bold.
| Years | ||||||||||||
|---|---|---|---|---|---|---|---|---|---|---|---|---|
| Pre-Drought Years | Drought Years | Post-Drought Years | ||||||||||
| Tree Species | City | −5 | −4 | −3 | −2 | −1 | 0 | 1 | 2 | 3 | 4 | 5 |
| A. hippocastanum | Munich | 0.078 | 0.438 | 0.226 | 0.111 | 0.456 | 0.016 | 0.117 | 0.254 | 0.079 | 0.135 | 0.136 |
| P. × hispanica | Paris | 0.174 | 0.151 | 0.093 | 0.182 | 0.577 | 0.112 | 0.238 | 0.303 | 0.083 | 0.306 | 0.604 |
| Q. nigra | Houston | 0.196 | 0.162 | 0.046 | 0.324 | 0.048 | 0.034 | 0.094 | 0.028 | 0.484 | 0.055 | 0.077 |
| Q. robur | Cape Town | 0.498 | 0.324 | 0.405 | 0.395 | 0.264 | 0.368 | 0.013 | 0.028 | 0.149 | 0.018 | 0.320 |
| R. pseudoacacia | Santiago de Chile | 0.280 | 0.383 | 0.415 | 0.364 | 0.233 | 0.019 | 0.353 | 0.217 | 0.283 | 0.247 | 0.556 |
| Munich | 0.332 | 0.425 | 0.253 | 0.327 | 0.132 | 0.066 | 0.428 | 0.380 | 0.279 | 0.200 | 0.471 | |
| Würzburg | 0.449 | 0.431 | 0.131 | 0.377 | 0.082 | 0.061 | 0.267 | 0.221 | 0.314 | 0.513 | 0.269 | |
| T. cordata | Berlin | 0.336 | 0.402 | 0.426 | 0.464 | 0.488 | 0.466 | 0.413 | 0.500 | 0.372 | 0.373 | 0.426 |
| Munich | 0.304 | 0.104 | 0.081 | 0.318 | 0.396 | 0.050 | 0.020 | 0.039 | 0.154 | 0.167 | 0.050 | |
| Würzburg | 0.074 | 0.022 | 0.193 | 0.387 | 0.402 | 0.383 | 0.380 | 0.026 | 0.060 | 0.451 | 0.374 | |
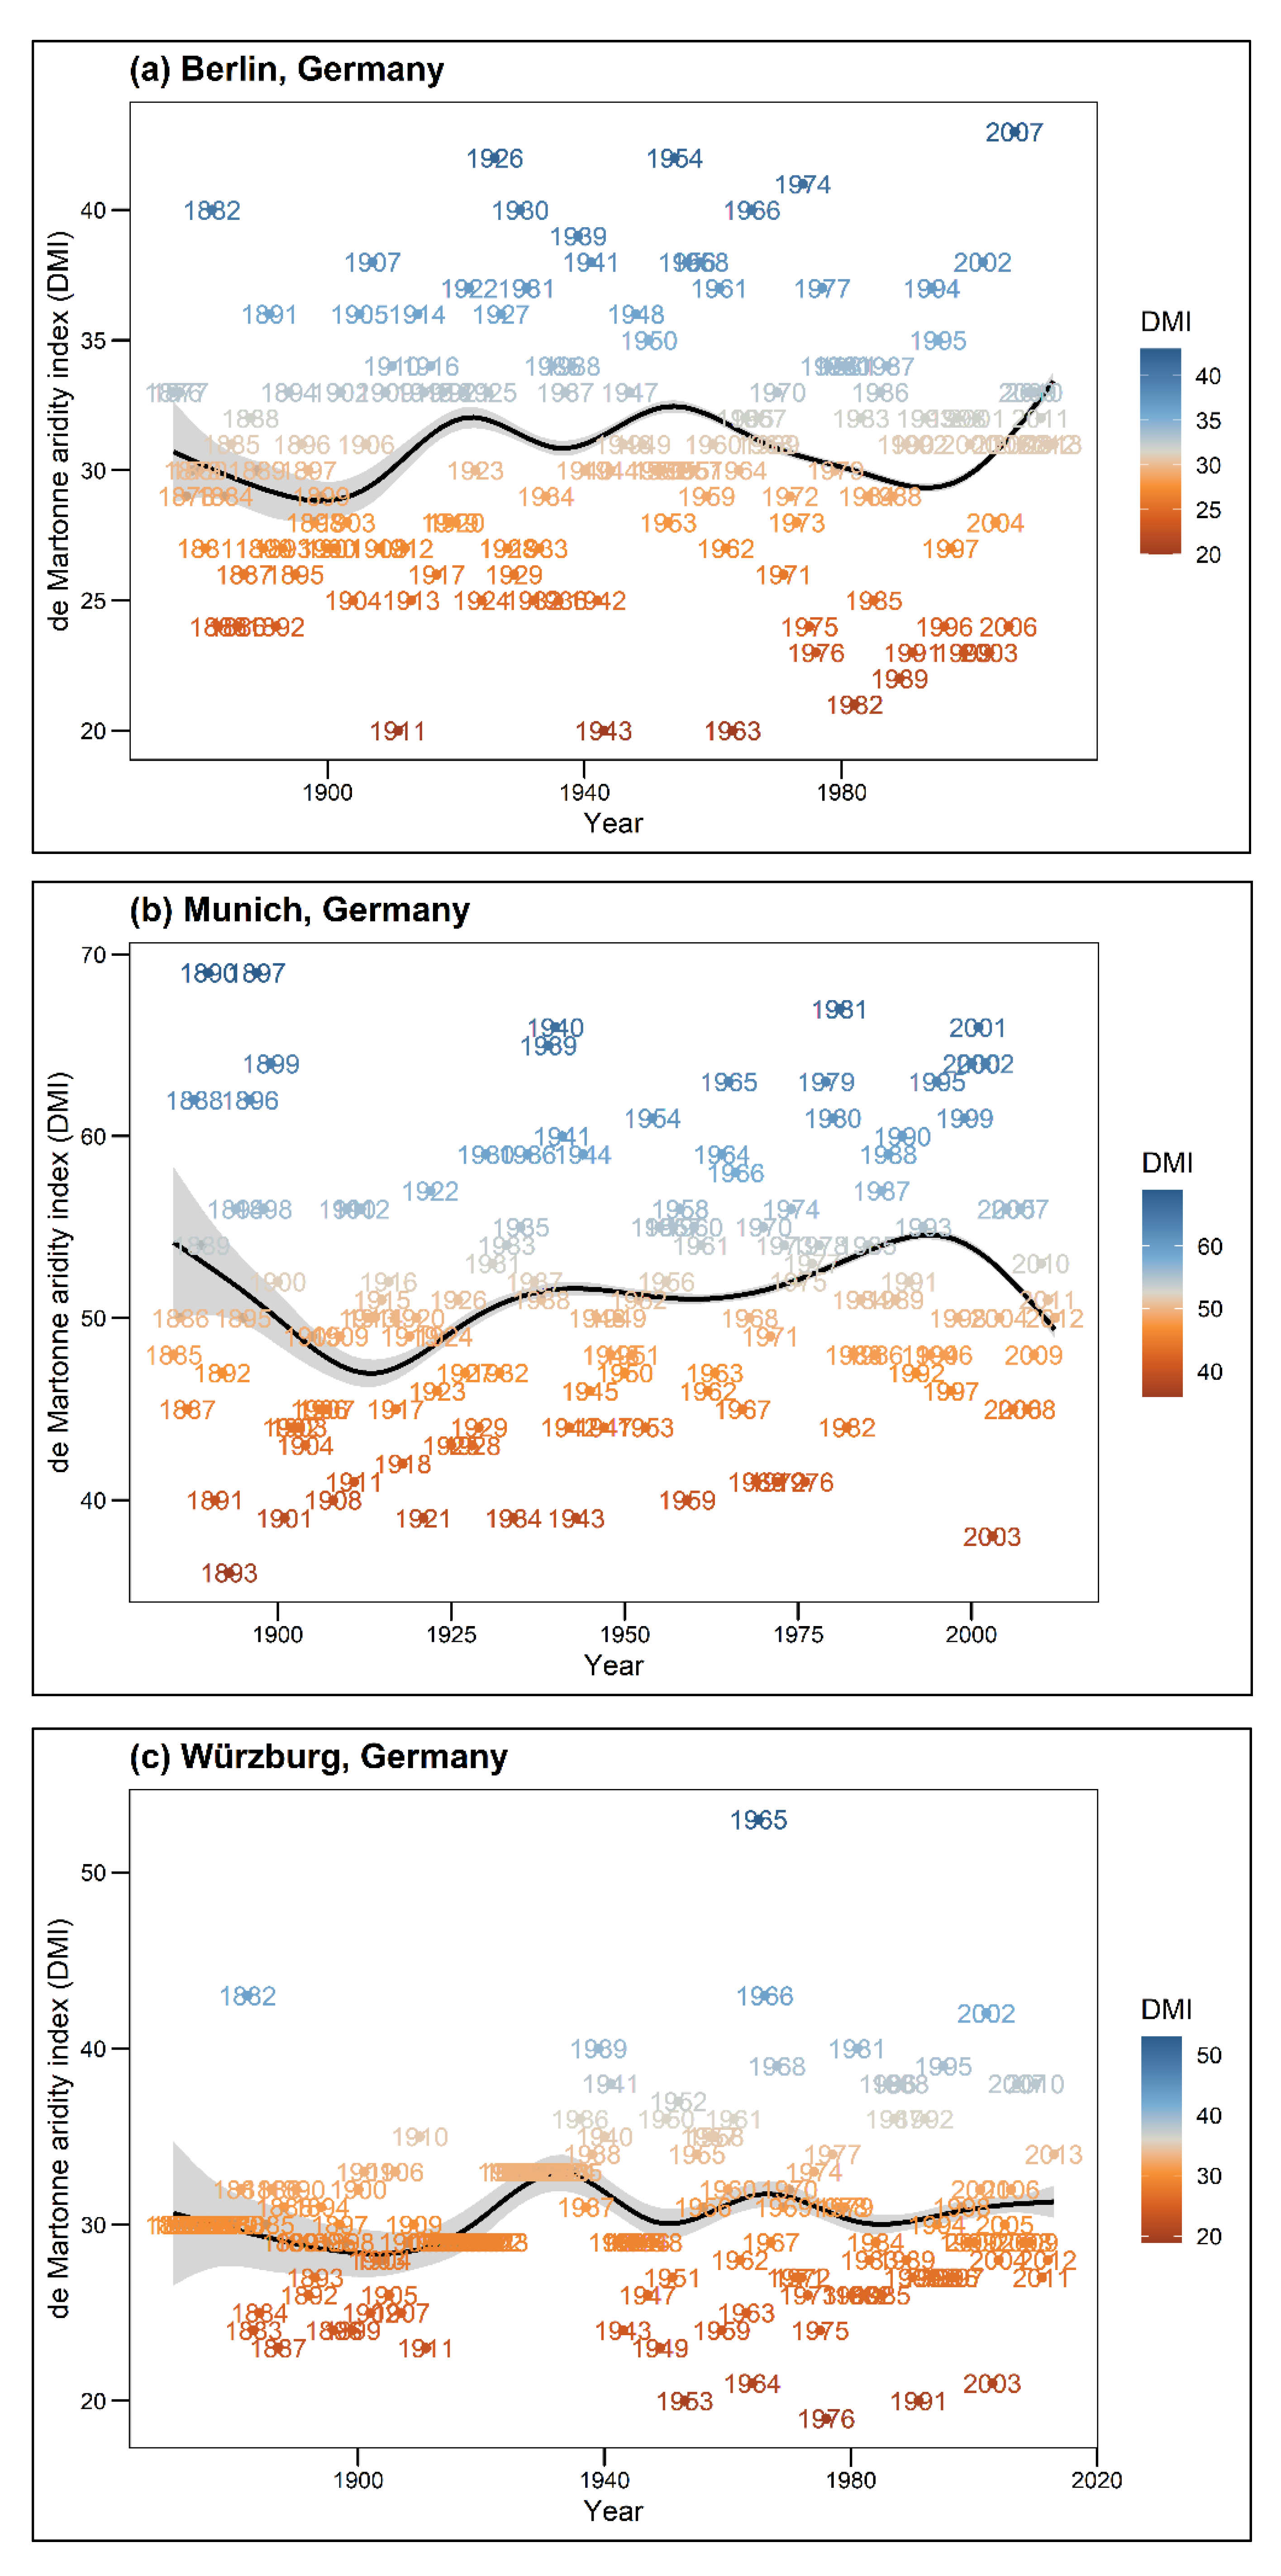
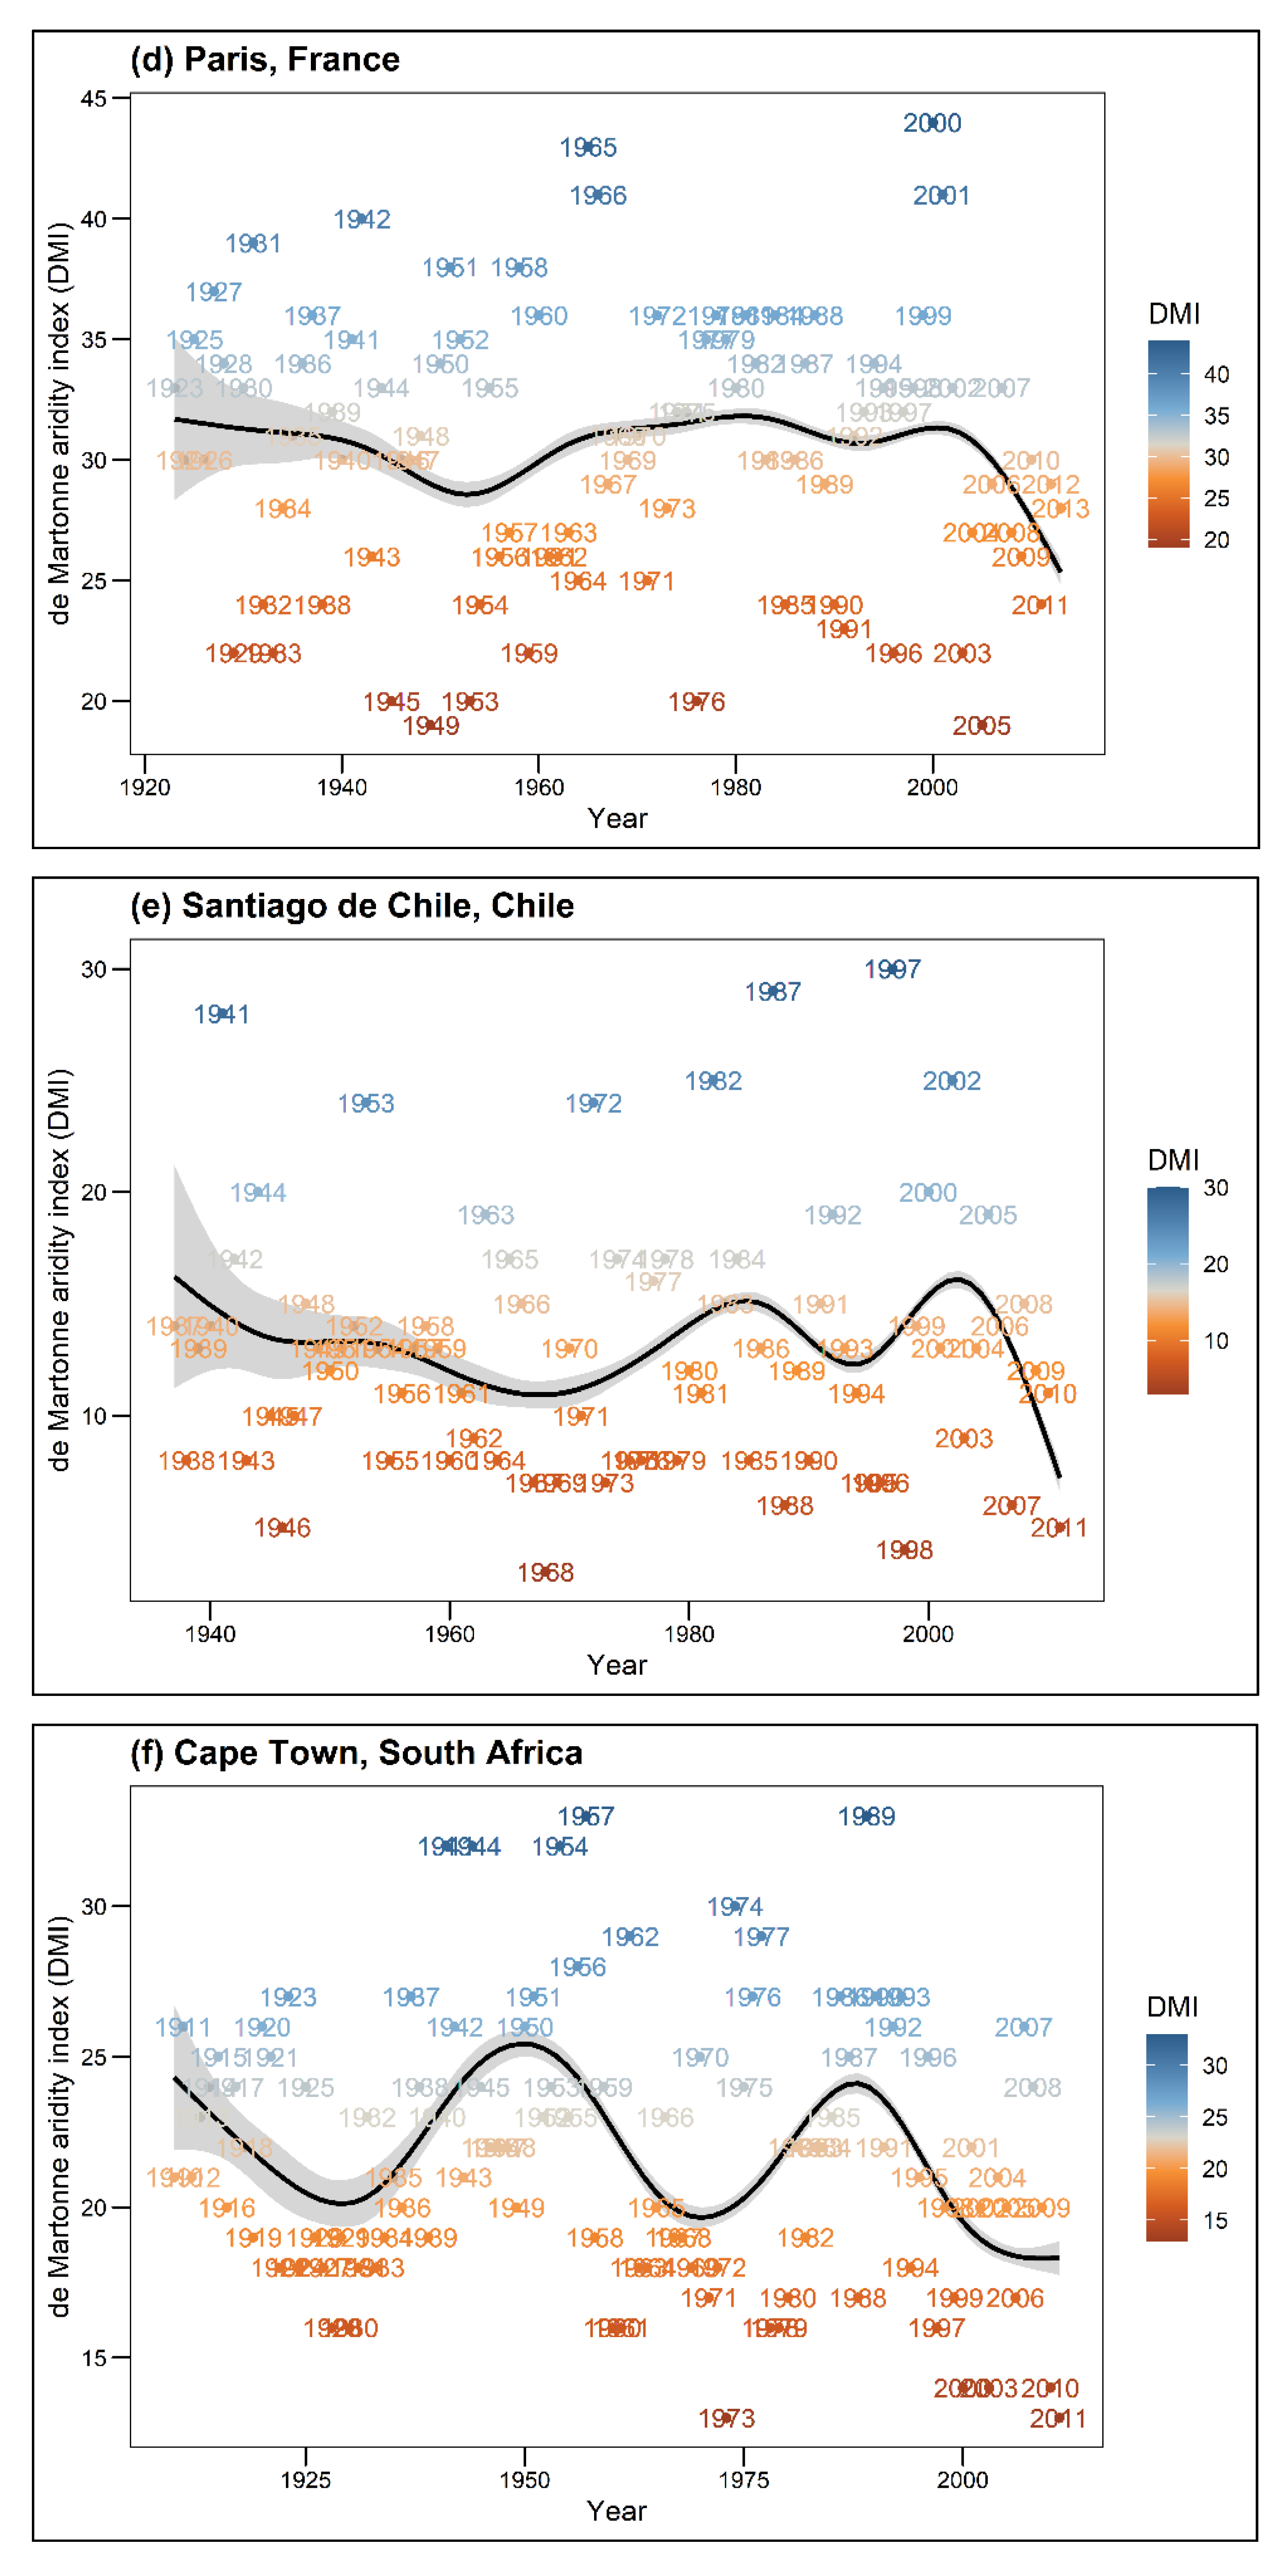
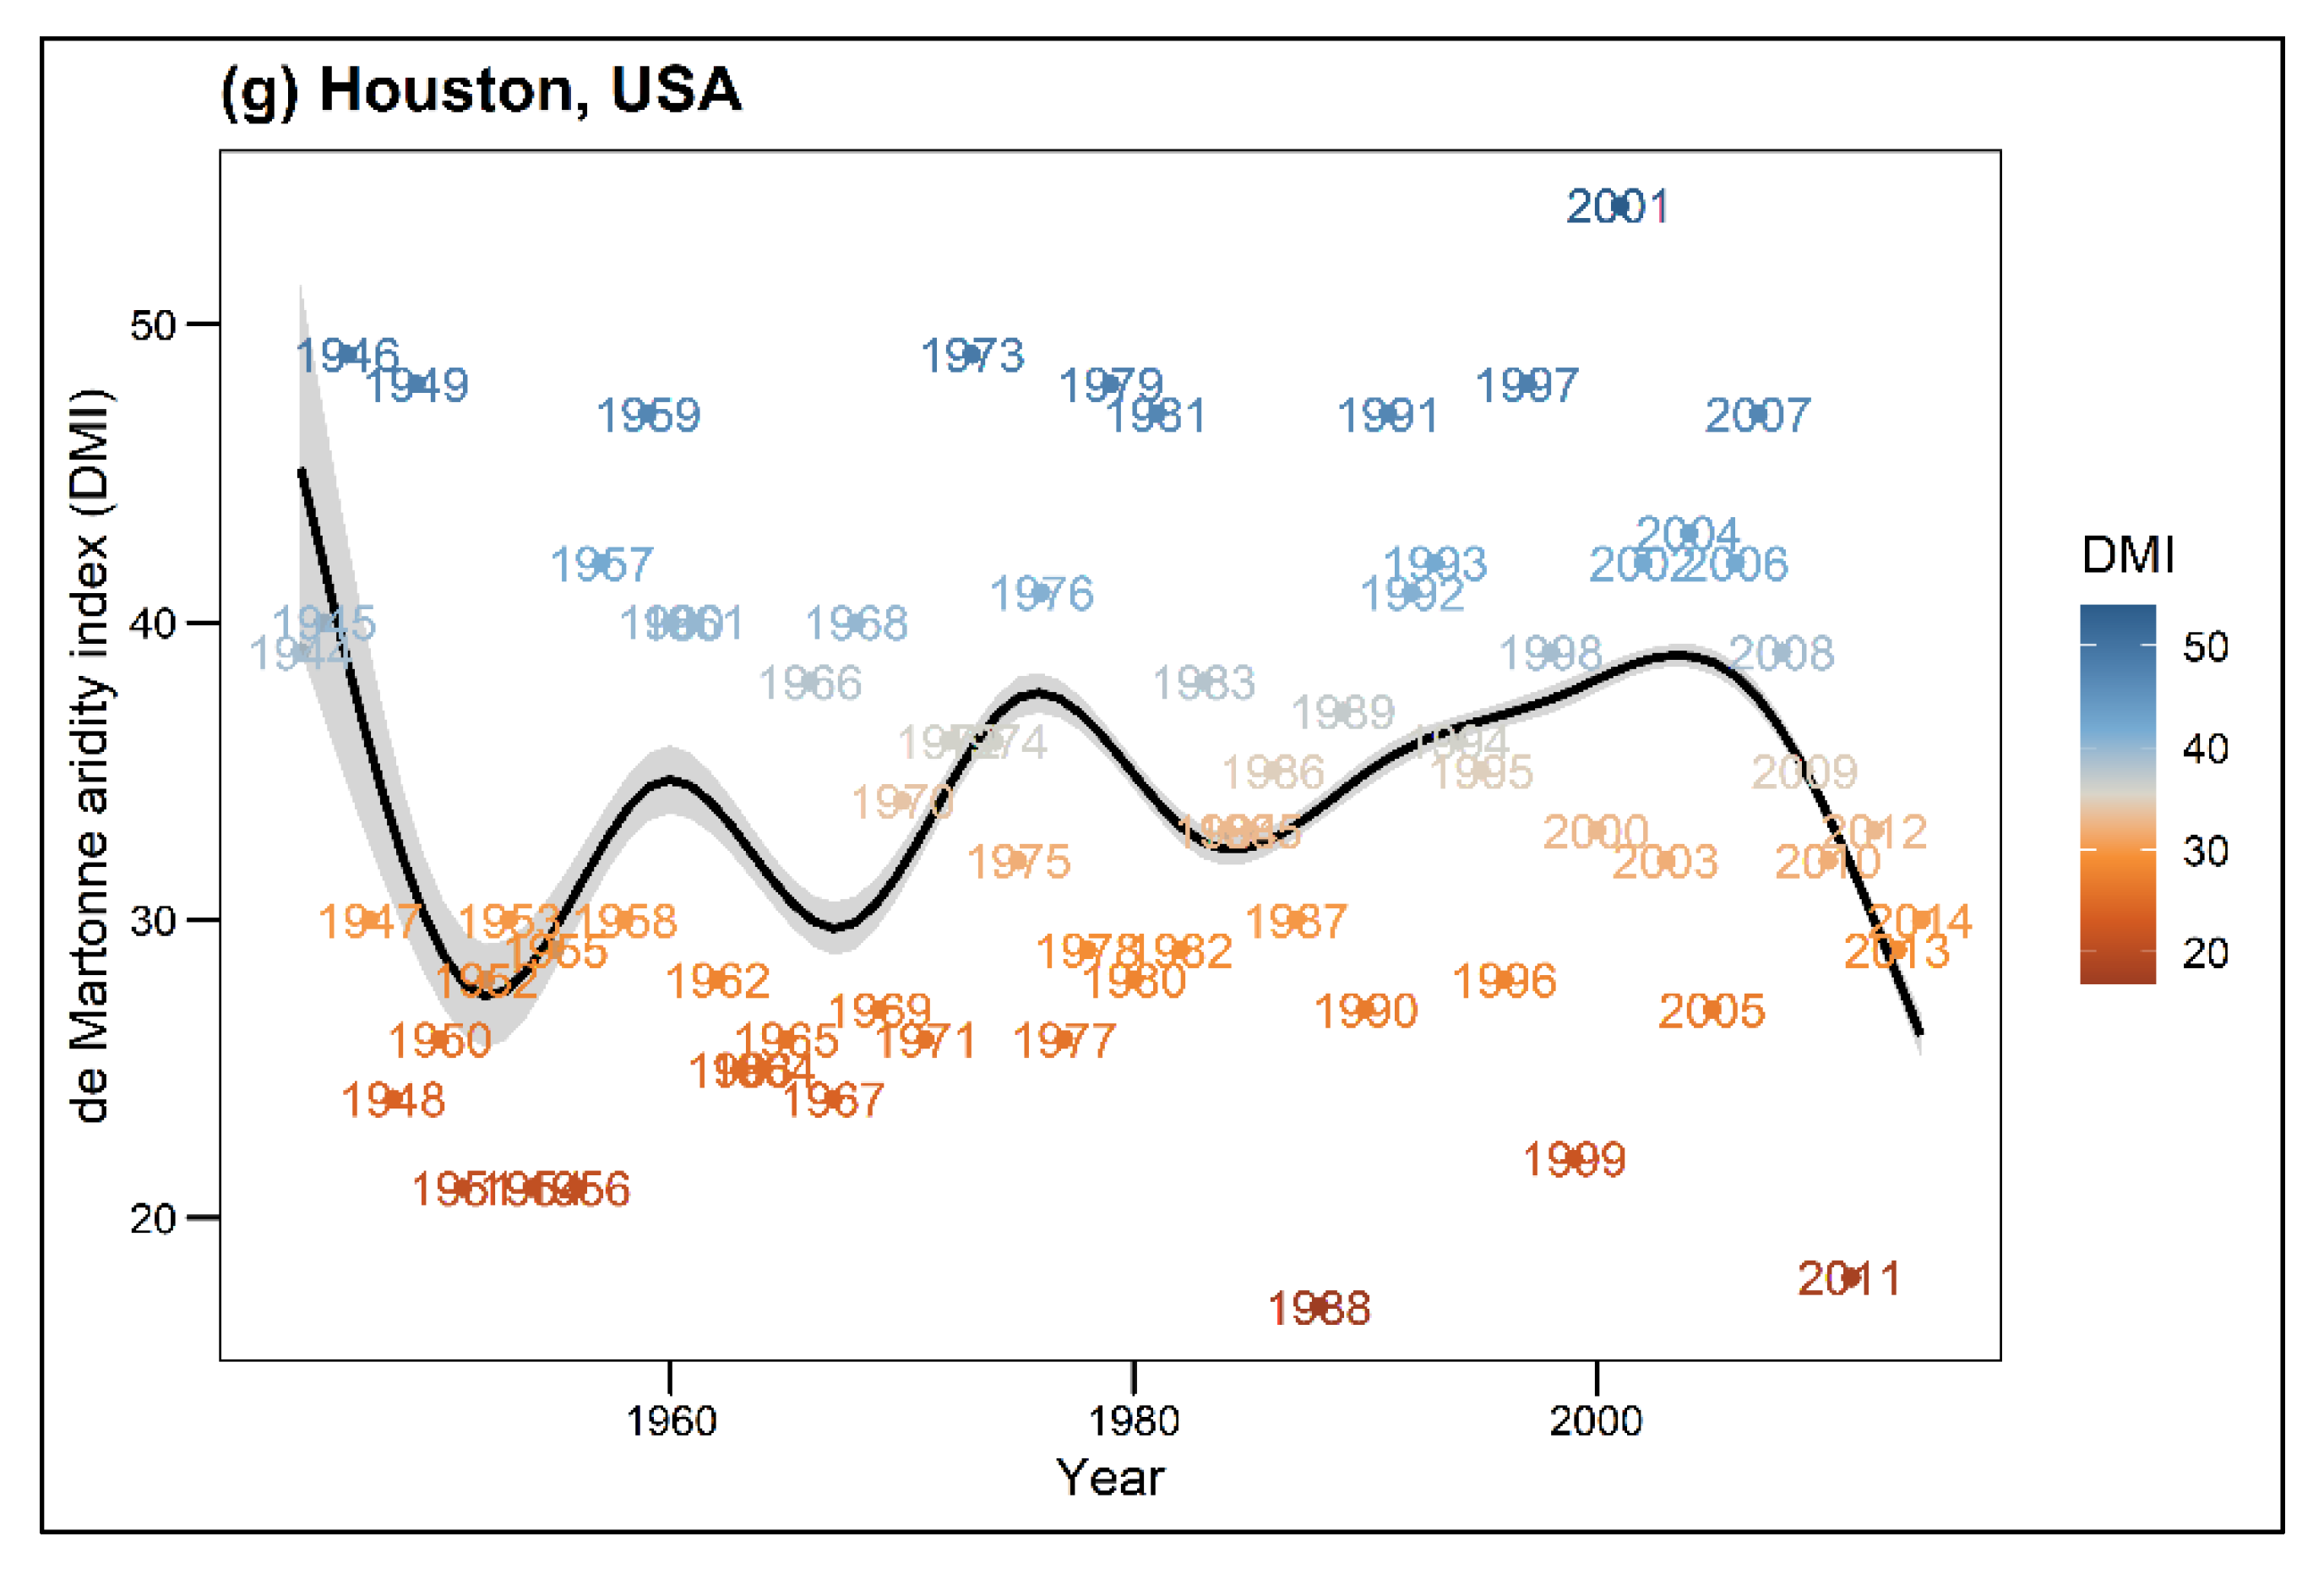
Figure A1.
Annual de Martonne Indices (DMI) over the entire periods for each city. High DMI values indicate humidity, i.e., cool and moist conditions, low DMI values indicate aridity, i.e., dry and warm conditions. The black line shows the smoothed mean DMI course through the years using gam algorithm.


References
- United Nations. World Urbanization Prospects; United Nations: New York, NY, USA, 2018; Volume 12, ISBN 9789211483192. [Google Scholar]
- Roeland, S.; Moretti, M.; Amorim, J.H.; Branquinho, C.; Fares, S.; Morelli, F.; Niinemets, Ü.; Paoletti, E.; Pinho, P.; Sgrigna, G.; et al. Towards an integrative approach to evaluate the environmental ecosystem services provided by urban forest. J. For. Res. 2019, 30, 1981–1996. [Google Scholar] [CrossRef] [Green Version]
- Moser, A.; Rötzer, T.; Pauleit, S.; Pretzsch, H. Structure and ecosystem services of small-leaved lime (Tilia cordata Mill.) and black locust (Robinia pseudoacacia L.) in urban environments. Urban For. Urban Green. 2015, 14, 1110–1121. [Google Scholar] [CrossRef]
- Nowak, D.J.; Crane, D.E. Carbon storage and sequestration by urban trees in the USA. Environ. Pollut. 2002, 116, 381–389. [Google Scholar] [CrossRef]
- Roy, S.; Byrne, J.; Pickering, C. A systematic quantitative review of urban tree benefits, costs, and assessment methods across cities in different climatic zones. Urban For. Urban Green. 2012, 11, 351–363. [Google Scholar] [CrossRef] [Green Version]
- Rötzer, T.; Rahman, M.A.; Moser-Reischl, A.; Pauleit, S.; Pretzsch, H. Process based simulation of tree growth and ecosystem services of urban trees under present and future climate conditions. Sci. Total Environ. 2019, 676, 651–664. [Google Scholar] [CrossRef] [PubMed]
- Rahman, M.A.; Stratopoulos, L.M.F.; Moser-Reischl, A.; Zölch, T.; Häberle, K.-H.; Rötzer, T.; Pretzsch, H.; Pauleit, S. Traits of trees for cooling urban heat islands: A meta-analysis. Build. Environ. 2020, 170, 106606. [Google Scholar] [CrossRef]
- Rahman, M.A.; Hartmann, C.; Moser-Reischl, A.; von Strachwitz, M.F.; Paeth, H.; Pretzsch, H.; Pauleit, S.; Rötzer, T. Tree cooling effects and human thermal comfort under contrasting species and sites. Agric. For. Meteorol. 2020, 287, 107947. [Google Scholar] [CrossRef]
- Rahman, M.A.; Dervishi, V.; Moser-Reischl, A.; Ludwig, F.; Pretzsch, H.; Rötzer, T.; Pauleit, S. Comparative analysis of shade and underlying surfaces on cooling effect. Urban For. Urban Green. 2021, 63, 127223. [Google Scholar] [CrossRef]
- Berland, A.; Shiflett, S.A.; Shuster, W.D.; Garmestani, A.S.; Goddard, H.C.; Herrmann, D.L.; Hopton, M.E. The role of trees in urban stormwater management. Landsc. Urban Plan. 2017, 162, 167–177. [Google Scholar] [CrossRef] [Green Version]
- MacGregor-Fors, I.; Escobar, F.; Rueda-Hernández, R.; Avendaño-Reyes, S.; Baena, M.L.; Bandala, V.M.; Chacón-Zapata, S.; Guillén-Servent, A.; González-García, F.; Lorea-Hernández, F.; et al. City “green” contributions: The role of urban greenspaces as reservoirs for biodiversity. Forests 2016, 7, 146. [Google Scholar] [CrossRef]
- Richards, D.R.; Fung, T.K.; Belcher, R.N.; Edwards, P.J. Differential air temperature cooling performance of urban vegetation types in the tropics. Urban For. Urban Green. 2020, 50, 126651. [Google Scholar] [CrossRef]
- Sun, L.; Chen, J.; Li, Q.; Huang, D. Dramatic uneven urbanization of large cities throughout the world in recent decades. Nat. Commun. 2020, 11, 1–9. [Google Scholar] [CrossRef] [PubMed]
- Moser-Reischl, A.; Rahman, M.A.; Pauleit, S.; Pretzsch, H.; Rötzer, T. Growth patterns and effects of urban micro-climate on two physiologically contrasting urban tree species. Landsc. Urban Plan. 2019, 183, 88–99. [Google Scholar] [CrossRef]
- Sand, E.; Konarska, J.; Howe, A.W.; Andersson-Sköld, Y.; Moldan, F.; Pleijel, H.; Uddling, J. Effects of ground surface permeability on the growth of urban linden trees. Urban Ecosyst. 2018, 21, 691–696. [Google Scholar] [CrossRef] [Green Version]
- Brune, M. Urban trees under climate change. Clim. Serv. Cent. Ger. 2016, 24, 123. [Google Scholar]
- Brandt, L.A.; Lewis, A.D.; Scott, L.; Darling, L.; Fahey, R.T.; Iverson, L.; Nowak, D.J.; Bodine, A.R.; Bell, A.; Still, S. Chicago Wilderness Region Urban Forest Vulnerability Assessment and Synthesis: A Report from the Urban Forestry Climate Change Response Framework Chicago Wilderness Pilot Project; Gen. Tech. Rep. NRS-168; U.S. Department of Agriculture, Forest Service, Northern Research Station: Newtown Square, PA, USA, 2017; 142p. [Google Scholar]
- Rötzer, T.; Moser-Reischl, A.; Rahman, M.A.; Hartmann, C.; Paeth, H.; Pauleit, S.; Pretzsch, H. Urban tree growth and ecosystem services under extreme drought. Agric. For. Meteorol. 2021, 308–309, 108532. [Google Scholar] [CrossRef]
- Burley, H.; Beaumont, L.J.; Ossola, A.; Baumgartner, J.B.; Gallagher, R.; Laffan, S.; Esperon-Rodriguez, M.; Manea, A.; Leishman, M.R. Substantial declines in urban tree habitat predicted under climate change. Sci. Total Environ. 2019, 685, 451–462. [Google Scholar] [CrossRef]
- Pretzsch, H.; Biber, P.; Uhl, E.; Dahlhausen, J.; Schütze, G.; Perkins, D.; Rötzer, T.; Caldentey, J.; Koike, T.; Van Con, T.; et al. Climate change accelerates growth of urban trees in metropolises worldwide. Sci. Rep. 2017, 7, 15403. [Google Scholar] [CrossRef]
- Iverson, L.R.; Prasad, A.M. Predicting Abundance of 80 Tree Species Following Climate Change in the Eastern United States; Wiley: Hoboken, NJ, USA, 1998; Volume 68, pp. 465–485. [Google Scholar]
- Gill, D.; Magin, G.; Bertram, E. Trees and Climate Change. A Guide to the Factors that Influence Species Vulnerability and a Summary of Adaptation Options; FAUNA FLORA Int.: Cambridge, UK, 2013; pp. 1–16. [Google Scholar]
- Churkina, G.; Grote, R.; Butler, T.M.; Lawrence, M. Natural selection? Picking the right trees for urban greening. Environ. Sci. Policy 2015, 47, 12–17. [Google Scholar] [CrossRef] [Green Version]
- Roloff, A.; Korn, S.; Gillner, S. The Climate-Species-Matrix to select tree species for urban habitats considering climate change. Urban For. Urban Green. 2009, 8, 295–308. [Google Scholar] [CrossRef]
- Coombes, A.; Martin, J.; Slater, D. Defining the allometry of stem and crown diameter of urban trees. Urban For. Urban Green. 2019, 44, 126421. [Google Scholar] [CrossRef]
- Pretzsch, H. Tree growth as affected by stem and crown structure. Trees–Struct. Funct. 2021, 35, 947–960. [Google Scholar] [CrossRef]
- Pretzsch, H.; Biber, P.; Uhl, E.; Dahlhausen, J.; Rötzer, T.; Caldentey, J.; Koike, T.; van Con, T.; Chavanne, A.; Seifert, T.; et al. Crown size and growing space requirement of common tree species in urban centres, parks, and forests. Urban For. Urban Green. 2015, 14, 466–479. [Google Scholar] [CrossRef] [Green Version]
- Pretzsch, H.; Moser-Reischl, A.; Rahman, M.A.; Pauleit, S.; Rötzer, T. Towards sustainable management of the stock and ecosystem services of urban trees. From theory to model and application. Trees–Struct. Funct. 2021, 1–20. [Google Scholar] [CrossRef]
- Poschenrieder, W.; Rötzer, T.; Biber, P.; Uhl, E.; Dervishi, V.; Pretzsch, H. Sustainable management of urban tree stocks based on multi-criteria scenario modelling. Urban For. Urban Green. 2022. forthcoming. [Google Scholar]
- Nowak, D.; Crane, D. The Urban Forest Effects (UFORE) Model: Quantifying urban forest structure and functions’, in Integrated tools for natural resources inventories in the 21st century. Integr. Tools Nat. Resour. Invent. 2000, 212, 714–720. [Google Scholar]
- Nowak, D.J.; Crane, D.E.; Stevens, J.C.; Hoehn, R.E.; Walton, J.T.; Bond, J. A ground-based method of assessing urban forest structure and ecosystem services. Arboric. Urban For. 2008, 34, 347–358. [Google Scholar] [CrossRef]
- Tree i-Tree. Available online: https://www.itreetools.org/ (accessed on 12 July 2021).
- Longcore, T.; Li, C.; Wilson, J.P. Applicability of citygreen urban ecosystem analysis software to a densely built urban neighborhood. Urban Geogr. 2004, 25, 173–186. [Google Scholar] [CrossRef] [Green Version]
- Peng, L.; Chen, S.; Liu, Y.; Wang, J. Application of CITYgreen model in benefit assessment of Nanjing urban green space in carbon fixation and runoff reduction. Front. For. China 2008, 3, 177–182. [Google Scholar] [CrossRef]
- Kramer, H.; Oldengarm, J. Urbtree: A Tree Growth Model for the Urban Environment. Photogramm. Remote Sens. 2010, 38, 4/C7. [Google Scholar]
- Pauleit, S.; Zölch, T.; Hansen, R.; Randrup, T.B.; Konijnendijk van den Bosch, C. Nature-Based Solutions and Climate Change—Four Shades of Green. In Nature-Based Solutions to Climate Change Adaptation in Urban Areas; Kabisch, N., Korn, H., Stadler, J., Bonn, A., Eds.; Theory and Practice of Urban Sustainability Transitions; Springer: Cham, Switzerland, 2017; pp. 29–49. [Google Scholar] [CrossRef] [Green Version]
- Rötzer, T.; Moser-Reischl, A.; Rahman, M.A.; Grote, R.; Pauleit, S.; Pretzsch, H. Modelling Urban Tree Growth and Ecosystem Services: Review and Perspectives. Prog. Bot. 2020, 82, 405–464. [Google Scholar] [CrossRef]
- De Martonne, E. Une nouvelle function climatologique: L’indice d’aridite. Meteorologie 1926, 2, 449–458. [Google Scholar]
- Moser, A.; Rötzer, T.; Pauleit, S.; Pretzsch, H. The urban environment can modify drought stress of small-leaved lime (Tilia cordata Mill.) and black locust (Robinia pseudoacacia L.). Forests 2016, 7, 71. [Google Scholar] [CrossRef] [Green Version]
- NOAA. NCEI Climate Data Online. Available online: https://www.ncdc.noaa.gov/cdo-web/datasets (accessed on 1 July 2020).
- Deutscher Wetterdienst (DWD). Open Data Server of the German Meteorological Service (DWD). Available online: https://opendata.dwd.de/climate_environment/CDC/observations_germany/climate/annual/more_precip/historical/ (accessed on 15 July 2020).
- González-Reyes, Á. Ocurrencia de eventos de sequías en la ciudad de Santiago de Chile desde mediados del siglo XIX. Rev. Geogr. Norte Gd. 2016, 32, 21–32. [Google Scholar] [CrossRef] [Green Version]
- Peel, M.C.; Finlayson, B.L.; McMahon, T.A. Updated world map of the Köppen-Geiger climate classification. Hydrol. Earth Syst. Sci. 2007, 11, 1633–1644. [Google Scholar] [CrossRef] [Green Version]
- Baltas, E. Spatial distribution of climatic indices in northern Greece. Meteorol. Appl. 2007, 14, 69–78. [Google Scholar] [CrossRef]
- Niinemets, Ü.; Valladares, F. Tolerance to shade, drought, and waterlogging of temperate northern hemisphere trees and shrubs. Ecol. Monogr. 2006, 76, 521–547. [Google Scholar] [CrossRef]
- Roloff, A. Bäume in der Stadt: Besonderheiten, Funktion, Nutzen, Arten, Risiken; Ulmer Eugen Verlag: Stuttgart, Germany, 2013. [Google Scholar]
- Eaton, E.; Caudullo, G.; Oliveira, S.; de Rigo, D. Quercus robur and Quercus petraea in Europe: Distribution, habitat, usage and threats. In European Atlas of Forest Tree Species; San-Miguel-Ayanz, J., Rigo, D.d., Caudullo, G., Durrant, T.H., Mauri, A., Eds.; Publication Office of the European Union: Luxembourg, 2016; pp. 160–163. [Google Scholar]
- Sitzia, T.; Cierjacks, A.; de Rigo, D.; Caudullo, G. Robinia pseudoacacia in Europe: Distribution, habitat, usage and threats. In European Atlas of Forest Tree Species; Publication Office of the European Union: Luxembourg, 2016; pp. 166–167. [Google Scholar]
- Radoglou, K.; Dobrowolska, D.; Spyroglou, G.; Nicolescu, V.N. A review on the ecology and silviculture of limes: (Tilia cordata Mill., Tilia platyphyllos Scop, and Tilia tomentosa Moench.) in Europe. Bodenkultur 2009, 60, 9–19. [Google Scholar]
- FNA Flora of North America. Available online: http://floranorthamerica.org/Main_Page (accessed on 21 July 2021).
- Martin, G.D. South African Journal of Botany Addressing geographical bias: A review of Robinia pseudoacacia (black locust) in the Southern Hemisphere. South Afr. J. Bot. 2019, 125, 481–492. [Google Scholar] [CrossRef]
- Biritz GmbH. Digitalpositiometer Typ 2. Available online: https://www.biritz.at/digitalpositiometer/digitalpositiometer-typ-2/ (accessed on 13 April 2022).
- Bunn, A.; Korpela, M.; Biondi, F.; Campelo, F.; Mérian, P.; Qeadan, F.; Zang, C. R Package Version 1.7.2. dplR: Dendrochronology Program Library in R. 2021. Available online: https://CRAN.R-project.org/package=dplR (accessed on 27 August 2021).
- R Core Team R: A Language and Environment for Statistical Computing. 2020. Available online: https://www.R-project.org/ (accessed on 21 July 2021).
- Bates, D.; Maechler, M.; Bolker, B.; Walker, S. Lme4: Linear Mixed-Effects Models Using Eigen and S4. Available online: https://cran.r-project.org/web/packages/lme4/index.html (accessed on 9 August 2021).
- Russell, V.L. R Package Version 1.7.2. Emmeans: Estimated Marginal Means, aka Least-Squares Means. 2022. Available online: https://CRAN.R-project.org/package=emmeans (accessed on 2 January 2022).
- Lüdecke, D. R Package Version 2.8.10. sjPlot: Data Visualization for Statistics in Social Science. 2021. Available online: https://CRAN.R-project.org/package=sjPlot (accessed on 15 September 2021).
- Lough, J.M.; Fritts, H.C. An assessment of the possible effects of volcanic eruptions on North American climate using tree-ring data, 1602 to 1900 A.D. Clim. Chang. 1987, 10, 219–239. [Google Scholar] [CrossRef]
- Bastin, J.F.; Clark, E.; Elliott, T.; Hart, S.; van den Hoogen, J.; Hordijki, I.; Ma, H.; Majumder, S.; Manoli, G.; Maschler, J.; et al. Understanding climate change from a global analysis of city analogues. PLoS ONE 2019, 14, e0217592. [Google Scholar] [CrossRef] [Green Version]
- IPCC. Assessment Report 6 Climate Change 2021: The Physical Science Basis; IPCC: Geneva, Switzerland, 2021. [Google Scholar]
- Klein, T. The variability of stomatal sensitivity to leaf water potential across tree species indicates a continuum between isohydric and anisohydric behaviours. Funct. Ecol. 2014, 28, 1313–1320. [Google Scholar] [CrossRef]
- Minucci, J.M.; Miniat, C.F.; Teskey, R.O.; Wurzburger, N. Tolerance or avoidance: Drought frequency determines the response of an N2-fixing tree. New Phytol. 2017, 215, 434–442. [Google Scholar] [CrossRef] [PubMed] [Green Version]
- Dyderski, M.K.; Paź, S.; Frelich, L.E.; Jagodziński, A.M. How much does climate change threaten European forest tree species distributions? Glob. Chang. Biol. 2018, 24, 1150–1163. [Google Scholar] [CrossRef] [PubMed]
- Puchałka, R.; Dyderski, M.K.; Vítková, M.; Sádlo, J.; Klisz, M.; Netsvetov, M.; Prokopuk, Y.; Matisons, R.; Mionskowski, M.; Wojda, T.; et al. Black locust (Robinia pseudoacacia L.) range contraction and expansion in Europe under changing climate. Glob. Chang. Biol. 2021, 27, 1587–1600. [Google Scholar]
- Klisz, M.; Puchałka, R.; Netsvetov, M.; Prokopuk, Y.; Vítková, M.; Sádlo, J.; Matisons, R.; Mionskowski, M.; Chakraborty, D.; Olszewski, P.; et al. Variability in climate-growth reaction of Robinia pseudoacacia in Eastern Europe indicates potential for acclimatisation to future climate. For. Ecol. Manage 2021, 492, 119194. [Google Scholar] [CrossRef]
- Mantovani, D.; Veste, M.; Freese, D. Black locust (Robinia pseudoacacia L.) ecophysiological and morphological adaptations to drought and their consequence on biomass production and water-use efficiency. New Zealand J. For. Sci. 2014, 44, 1–11. [Google Scholar] [CrossRef] [Green Version]
- Moser-Reischl, A.; Rötzer, T.; Pauleit, S.; Pretzsch, H. Urban Tree Growth Characteristics of Four Common Species in South Germany. Arboric. Urban For. 2021, 47, 150–169. [Google Scholar] [CrossRef]
- Swoczyna, T.; Kalaji, H.M.; Pietkiewicz, S.; Borowski, J.; Zaraś-Januszkiewicz, E. Photosynthetic apparatus efficiency of eight tree taxa as an indicator of their tolerance to urban environments. Dendrobiology 2010, 63, 65–75. [Google Scholar]
- Nebesnyi, V.B.; Grodzinskaya, A.A.; Gonchar, A.Y. The use of Tilia cordata Mill. as bioindicator for the evaluation of the ecological state of Kyiv urbanized areas (Ukraine). J. Med. Plants Stud. 2016, 4, 277–282. [Google Scholar]
- Day, S.D.; Wiseman, P.E.; Dickinson, S.B.; Harris, J.R. Tree Root Ecology in the Urban Environment and Implications for a Sustainable Tree Root Ecology in the Urban Environment and Implications for a Sustainable. Rhizosphere 2010, 36, 193–205. [Google Scholar] [CrossRef]
- Canham, C.D.; Murphy, L.; Riemann, R.; McCullough, R.; Burrill, E. Local differentiation in tree growth responses to climate. Ecosphere 2018, 9, 9. [Google Scholar] [CrossRef] [Green Version]
- Broadmeadow, M.S.J.; Ray, D.; Samuel, C.J.A. Climate change and the future for broadleaved tree species in Britain. Forestry 2005, 78, 145–161. [Google Scholar] [CrossRef] [Green Version]
- Gillner, S.; Bräuning, A.; Roloff, A. Dendrochronological analysis of urban trees: Climatic response and impact of drought on frequently used tree species. Trees–Struct. Funct. 2014, 28, 1079–1093. [Google Scholar] [CrossRef]
- Gillner, S.; Korn, S.; Roloff, A. Leaf-gas exchange of five tree species at urban street sites. Arboric. Urban For. 2015, 41, 113–124. [Google Scholar] [CrossRef]
- Gregorová, B.; Černý, K.; Holub, V.; Strnadová, V. Effects of climatic factors and air pollution on damage of London plane Effects of climatic factors and air pollution on damage of London plane (Platanus hispanica Mill.). Hortic. Sci. 2010, 37, 109–117. [Google Scholar] [CrossRef] [Green Version]
- Cedro, A.; Nowak, G. Effects of climatic conditions on annual tree ring growth of the Platanus × hispanica ‘Acerifolia’ under urban conditions of Szczecin. Dendrobiology 2006, 55, 11–17. [Google Scholar]
- Nola, P.; Bracco, F.; Assini, S.; von Arx, G.; Castagneri, D. Xylem anatomy of Robinia pseudoacacia L. and Quercus robur L. is differently affected by climate in a temperate alluvial forest. Ann. For. Sci. 2020, 77, 12–16. [Google Scholar] [CrossRef]
- Moser, A.; Rahman, M.A.; Pretzsch, H.; Pauleit, S.; Rötzer, T. Inter- and intraannual growth patterns of urban small-leaved lime (Tilia cordata Mill.) at two public squares with contrasting microclimatic conditions. Int. J. Biometeorol. 2017, 61, 1095–1107. [Google Scholar] [CrossRef]
- Moser, A.; Uhl, E.; Rötzer, T.; Biber, P.; Dahlhausen, J.; Lefer, B.; Pretzsch, H. Effects of Climate and the Urban Heat Island Effect on Urban Tree Growth in Houston. Open J. For. 2017, 07, 428–445. [Google Scholar] [CrossRef] [Green Version]
- Maurin, V.; DesRochers, A. Physiological and growth responses to pruning season and intensity of hybrid poplar. For. Ecol. Manage 2013, 304, 399–406. [Google Scholar] [CrossRef]
- Augé, R.M.; Stodola, A.J.W.; Tims, J.E.; Saxton, A.M. Moisture retention properties of a mycorrhizal soil. Plant Soil 2001, 230, 87–97. [Google Scholar] [CrossRef]
- Kadowaki, K.; Yamamoto, S.; Sato, H.; Tanabe, A.S.; Hidaka, A.; Toju, H. Mycorrhizal fungi mediate the direction and strength of plant–soil feedbacks differently between arbuscular mycorrhizal and ectomycorrhizal communities. Commun. Biol. 2018, 1, 1–5. [Google Scholar] [CrossRef] [PubMed]
- Rusterholz, H.P.; Studer, M.; Zwahlen, V.; Baur, B. Plant-mycorrhiza association in urban forests: Effects of the degree of urbanisation and forest size on the performance of sycamore (Acer pseudoplatanus) saplings. Urban For. Urban Green. 2020, 56, 126872. [Google Scholar] [CrossRef]
Figure 1.
Diameter-age relationship for the tree species Aesculus hippocastanum L. in Munich (a); Platanus × hispanica Münchh. in Paris (b); Quercus nigra L. in Houston (c); Quercus robur L. in Cape Town (d); Robinia pseudoacacia L. in Santiago de Chile (e), Munich (f), and Würzburg (g); and Tilia cordata Mill. in Berlin (h), Munich (i), and Würzburg (j). The solid line represents the mean stem diameter growth, while the dashed lines show the minimum and maximum.

Figure 2.
Long-term stem diameter growth reaction of all trees within this study (N = 1178) in dependence on tree age and DMI aridity index based on Equation (2) (see Table A1 for model parameters). The black curve visualizes the stem diameter growth under arid climatic conditions (DMI = 11, corresponding to the 2.5th quantile of annual DMI of all cities). The orange curve visualizes the diameter growth under humid climatic conditions (DMI = 64, corresponding to 97.5th quantile of annual DMI of all cities). Shaded bands visualize the predicted confidence interval of the curves.

Figure 3.
Stem diameter growth reaction of drought-tolerant (DT, (a)) and drought-sensitive (DS, (b)) urban tree species depending on the climate, based on model Equation (3) (see Table A1 for model parameters). Black curves visualize the diameter growth under arid climatic conditions (corresponding to the 2.5th quantile of a DMI avg-level, DMI avg = 13 for DT and DMI avg = 30 for DS). Orange curves visualize the diameter growth in humid climatic conditions (corresponding to the 97.5th quantile level of the DMI avg, 52 and 53 for DT and DS, respectively). The shaded bands visualize the prediction confidence interval of the curves.

Figure 4.
Stem diameter growth of R. pseudoacacia in Santiago de Chile (black curve, N = 129 trees), Munich (orange curve, N = 30 trees), and Würzburg (blue curve, N = 31 trees). Letters a, b, and c show significant differences between the slopes. Shaded bands visualize the prediction confidence interval of the curves.

Figure 5.
Stem diameter growth in dependence of age of T. cordata in Berlin (black curve, N = 251 trees), Munich (orange curve, N = 133 trees), and Würzburg (blue curve, N = 30 trees). Letters a and b show significant differences between the slopes. The shaded bands visualize the prediction confidence interval of the curves.

Figure 6.
Superposed epoch analysis (SEA) on the influence of drought years on the ring width index (RWI) of A. hippocastanum in Munich (a), P. × hispanica in Paris (b), Q. nigra in Houston (c), and Q. robur in Cape Town (d). RWI is shown for the drought years (0), the pre-drought (−5 to −1), and post-drought years (1 to 5). Input drought years for each city are shown in Table 4. Significant RWIs (p < 0.05) are shown in dark grey.

Figure 7.
Superposed epoch analysis on the influence of drought years in the RWI of R. pseudoacacia (a) in Santiago de Chile (white bars), Munich (black bars) and Würzburg (grey bars), and T. cordata (b) in Berlin (white bars), Munich (black bars) and Würzburg (grey bars). Shown are RWIs during drought years (0), pre-drought (−5 to −1), and post-drought years (1 to 5). Significant RWIs (p < 0.05) are marked by *.

Table 1.
Overview of the geographical position and climate conditions (1981–2010) of the study sites. Climate zone refers to the Köppen-Geiger climate classification [43].
Table 1.
Overview of the geographical position and climate conditions (1981–2010) of the study sites. Climate zone refers to the Köppen-Geiger climate classification [43].
| Location, Geographic Position of Study Sites | ||||||
|---|---|---|---|---|---|---|
| Berlin, Germany | Munich, Germany | Würzburg, Germany | Paris, France | Santiago de Chile, Chile | Cape Town, South Africa | Houston, USA |
| 52.31 °N 13.24 °E | 48.14 °N 11.58 °E | 49.46 °N 9.57 °E | 48.51 °N 2.21 °E | 33.27 °S 70.40 °W | 33.55 °S 18.25 °E | 29.46 °N 95.23 °W |
| Climate zone, total annual precipitation [mm a−1] ± SD, mean temperature [°C] | ||||||
| Temperate (Cfb) | Temperate (Cfb) | Temperate (Cfb) | Temperate (Cfb) | Mediterra-nean (Csb) | Mediterra-nean (Csb) | Subtropical (Cfa) |
| 591 ± 100 | 948 ± 141 | 601 ± 108 | 632 ± 116 | 325 ± 156 | 544 ± 118 | 1091 ± 249 |
| 9.5 | 9.7 | 9.6 | 12.3 | 14.7 | 16.7 | 21 |
| DMI Index (mean value) and climatic classification following Baltas [44] | ||||||
| 32 | 53 | 32 | 32 | 15 | 23 | 34 |
| humid | very humid | humid | humid | semi-dry | mediterranean | humid |
Table 2.
Description of sampled tree species and their characteristics on drought tolerance (following Niinemets & Valladares, 2006), wood anatomy, and maximal achievable height.
Table 2.
Description of sampled tree species and their characteristics on drought tolerance (following Niinemets & Valladares, 2006), wood anatomy, and maximal achievable height.
| Tree Species | Drought Tolerance | Wood Anatomy | Height [m] |
|---|---|---|---|
| Aesculus hippocastanum L. | sensitive | diffuse-porous | 39 |
| Platanus × hispanica Münchh. | tolerant | diffuse-porous | 35 |
| Quercus nigra L. | tolerant | ring-porous | 30 |
| Quercus robur L. | tolerant | ring-porous | 30 |
| Robinia pseudoacacia L. | tolerant | ring-porous | 35 |
| Tilia cordata Mill. | sensitive | diffuse-porous | 30 |
Table 3.
Statistical characteristics of the tree ring series from the sampled trees. N = Number of sampled trees: drought-tolerant 571 (species P. × hispanica, Q. nigra, Q. robur, and R. pseudoacacia), drought-sensitive 607 (species A. hippocastanum, T. cordata), DBH = Diameter at Breast Height.
Table 3.
Statistical characteristics of the tree ring series from the sampled trees. N = Number of sampled trees: drought-tolerant 571 (species P. × hispanica, Q. nigra, Q. robur, and R. pseudoacacia), drought-sensitive 607 (species A. hippocastanum, T. cordata), DBH = Diameter at Breast Height.
| City | Sampling Year | N | Mean Tree Age | Mean Tree Height [m] | DBH [cm] | Diameter Increment [mm a−1] |
|---|---|---|---|---|---|---|
| Aesculus hippocastanum L. | ||||||
| Munich | 2013 | 193 | 118 | 16.1 | 63.3 (19.6–117.0) | 5.4 (2.0–15.8) |
| Platanus × hispanica Münchh. | ||||||
| Paris | 2013 | 133 | 105 | 18.8 | 64.8 (40.3–144.0) | 7.3 (1.4–23.0) |
| Quercus nigra L. | ||||||
| Houston | 2014 | 179 | 53 | 16.2 | 59.9 (34.2–98.0) | 11.3 (3.8–29.2) |
| Quercus robur L. | ||||||
| Cape Town | 2011 | 69 | 103 | 15.6 | 67.9 (40.3–112.9) | 6.5 (2.2–17.3) |
| Robinia pseudoacacia L. | ||||||
| Munich | 2014 | 30 | 57 | 15.7 | 44.5 (14.0–101.9) | 8.5 (3.7–20.7) |
| Würzburg | 2014 | 31 | 52 | 15.1 | 44.3 (11.0–102.2) | 9.0 (4.8–18.3) |
| Santiago de Chile | 2012 | 129 | 52 | 15.3 | 41.4 (19.8–56.1) | 8.5 (3.6–19.2) |
| Tilia cordata Mill. | ||||||
| Berlin | 2010–2013 | 251 | 85 | 16.9 | 44.2 (16.5–81.1) | 5.0 (1.2–12.2) |
| Munich | 2014, 2018 | 133 | 81 | 13.1 | 34.2 (12.0–86.7) | 5.6 (2.1–10.3) |
| Würzburg | 2014 | 30 | 62 | 12.5 | 33.2 (14.0–71.5) | 6.2 (3.0–11.0) |
Table 4.
Selected drought years of the seven cities for the analysis of the reaction of the annual diameter increment to drought by using superposed epoch analysis (SEA).
Table 4.
Selected drought years of the seven cities for the analysis of the reaction of the annual diameter increment to drought by using superposed epoch analysis (SEA).
| Tree Species | City | Drought Years | ||||
|---|---|---|---|---|---|---|
| A. hippocastanum | Munich | 1976 | 1982 | 2003 | ||
| P. × hispanica | Paris | 1963 | 1976 | 2005 | ||
| Q. nigra | Houston | 1988 | 1998 | 2011 | ||
| Q. robur | Cape Town | 1973 | 2003 | 2010 | ||
| R. pseudoacacia | Santiago de Chile | 1968 | 1988 | 1998 | 2007 | |
| Munich | 1976 | 1982 | 2003 | |||
| Würzburg | 1976 | 1991 | 2003 | |||
| T. cordata | Berlin | 1982 | 1989 | 2003 | ||
| Munich | 1947 | 1976 | 1982 | 2003 | 2015 | |
| Würzburg | 1991 | 1996 | 2003 | |||
Publisher’s Note: MDPI stays neutral with regard to jurisdictional claims in published maps and institutional affiliations. |
© 2022 by the authors. Licensee MDPI, Basel, Switzerland. This article is an open access article distributed under the terms and conditions of the Creative Commons Attribution (CC BY) license (https://creativecommons.org/licenses/by/4.0/).
Share and Cite
MDPI and ACS Style
Dervishi, V.; Poschenrieder, W.; Rötzer, T.; Moser-Reischl, A.; Pretzsch, H. Effects of Climate and Drought on Stem Diameter Growth of Urban Tree Species. Forests 2022, 13, 641. https://0-doi-org.brum.beds.ac.uk/10.3390/f13050641
AMA Style
Dervishi V, Poschenrieder W, Rötzer T, Moser-Reischl A, Pretzsch H. Effects of Climate and Drought on Stem Diameter Growth of Urban Tree Species. Forests. 2022; 13(5):641. https://0-doi-org.brum.beds.ac.uk/10.3390/f13050641
Chicago/Turabian StyleDervishi, Vjosa, Werner Poschenrieder, Thomas Rötzer, Astrid Moser-Reischl, and Hans Pretzsch. 2022. "Effects of Climate and Drought on Stem Diameter Growth of Urban Tree Species" Forests 13, no. 5: 641. https://0-doi-org.brum.beds.ac.uk/10.3390/f13050641
Note that from the first issue of 2016, this journal uses article numbers instead of page numbers. See further details here.