Article

Temperature Sensitivity of Soil Respiration in Two Temperate Forest Ecosystems: The Synthesis of a 24-Year Continuous Observation

Institute of Physicochemical and Biological Problems of Soil Sciences, Russian Academy of Sciences, 142290 Pushchino, Russia
*
Author to whom correspondence should be addressed.
Submission received: 20 July 2022 / Revised: 15 August 2022 / Accepted: 24 August 2022 / Published: 28 August 2022
(This article belongs to the Special Issue Soil Organic Matter and Nutrient Cycling in Forests)

Abstract

:
Soil respiration (SR) is one of the largest fluxes in the global carbon cycle. The temperature sensitivity of SR (often termed as Q10) is a principal parameter for evaluating the feedback intensity between soil carbon efflux and global warming. The present study aimed to estimate the seasonal and interannual dynamics of the temperature sensitivity of SR based on a long-term 24-year series of measurements in two temperate forest ecosystems in European Russia. The study was conducted in a mature mixed forest with sandy Entic Podzol and in a secondary deciduous forest with loamy Haplic Luvisol. The SR rate was measured continuously from December 1997 to November 2021 at 7–10-day intervals using the closed chamber method. Sandy Entic Podzol demonstrated a higher temperature sensitivity of SR in comparison with loamy Entic Luvisol. The Q10 values for both soils in dry years were 1.3–1.4 times lower than they were in the years with normal levels of humidity. For both types of soil, we observed a significant positive correlation between the Q10 values and wetness indexes. The interannual variability of Q10 values for SR in forest soils was 18%–40% depending on the calculation approach and levels of aridity/humidity over the growing season. The heterogeneous Q10 values should be integrated into SR and C balance models for better predictions.

1. Introduction

Forest ecosystems play a key role in the global biogeochemical carbon (C) cycle, providing the principal part of the global carbon sink in terrestrial ecosystems [1,2]. For this reason, the forests are the main climate-stabilizing systems of the earth’s surface [3]. The Russian Federation has the largest forest area in the world, amounting to ca. 20% of all forests across the globe (https://www.fao.org/forest-resources; accessed on 1 January 2020). In the Northern Hemisphere, Russia’s forest ecosystems provide more than 50% of the total C sink in the forest area, contributing significantly to the regulation of the global cycle of organic C [4,5].
Soil respiration (SR) is one of the largest fluxes in the global C cycle [6,7,8], but until now the regional and global evaluations of SR magnitude are the most uncertain constituents of the terrestrial C cycle [9]. SR is usually defined as CO2 released from the soil into the atmosphere via the activity of two main processes: decomposing litter and soil organic matter by micro- and macro-organisms (heterotrophic respiration, HR) and root (or autotrophic) respiration, RR [10,11,12]. SR also includes the non-biological production of CO2, but this flux is usually negligible [8]. SR fluxes demonstrate high spatial [9,13,14] and temporal heterogeneity [15,16,17]. The most important abiotic factors influencing SR are the soil temperature and soil water availability, whereas the substrate quality and availability are the main biotic factors, which are governed by the type and productivity of the vegetation [18,19]. Since the temporal and spatial dynamics of SR are the integrated result of a broad spectrum of biological processes, which are controlled by wildly varying environmental constraints, SR magnitudes remain difficult to model or predict [9,20].
Until now, temperature has been considered the most significant factor that influences the SR magnitude on a global scale, as well as on local and ecosystem levels [14,16,21]. The temperature sensitivity of SR is a principal parameter for evaluating the feedback intensity between soil carbon efflux and global warming [11,18,22,23]. The temperature sensitivity of SR (often termed as Q10) is a factor by which the SR magnitude is multiplied when the temperature increases by 10 °C [19,24]. This parameter is applied in several models, which usually employ a fixed value of 1.5 or 2 for all soils and at all levels of soil moisture [9,25,26]. The mean Q10 values for different biomes range from 1.43 to 2.03, with the highest value in tundra and the lowest value in deserts [11]. When spatially heterogeneous Q10 values were integrated into SR models instead of a fixed Q10 value, 40% higher soil respiration rates were obtained. Therefore, even small inaccuracies with regard to Q10 may result in large errors in the estimation of C dynamic on a global scale [11]. Hence, a better understanding of the processes influencing the temperature sensitivity of SR is required.
In field measurements of SR, the effects of temperature- and non-temperature-related factors on SR are difficult to separate, and their impacts are inevitably confounded. The Q10 values determined by in situ SR and soil temperature measurements are known as the apparent Q10 due to the confounding effects of biotic and abiotic factors [27]. Some studies have shown that Q10 values for HR flux in various biomes may vary widely, from 1 to larger than 12 [25,28,29]. It is suggested that Q10 values significantly higher than 2.5 may be caused by the confounded effects of biotic factors such as the substrate supply or vegetation growth [19]. It is also reported that the response of RR to an increase in temperature is higher than the temperature sensitivity of HR, yielding Q10 values higher than 4.6 [30]. At the same time, the confounding effects of the soil temperature and moisture on SR significantly reduces the Q10 in hot and dry summers in Californian forests [31]. The SR becomes insensitive to the temperature increase because the temperature effect on SR is blocked by the low moisture availability that also results in the limitation of nutrient substrate availability [20,25,31,32]. Therefore, using the apparent Q10 value may lead us to overestimate or underestimate the temperature effect on the global SR magnitude and distort the prediction of future soil CO2 emissions in global warming.
The modeling of the annual SR flux and the ecosystem C budget is usually based on the constant Q10 value within a year as well. However, some studies have demonstrated that the Q10 values of SR rates are not constant throughout the year [16,33,34], because many biotic and abiotic factors, which are responsible for temperature sensitivity of SR, change with season [35]. It is generally suggested that the temperature sensitivity of SR negatively correlates with temperature and tends to reduce with decreasing soil moisture [12,33], as the water deficit can inhibit the microbial activity and root growth [19]. At the same time, the litter input, the quantity and availability of organic substrates, the activity of microbial communities and plant roots are also seasonal fluctuating factors that can affect the temporal (seasonal and interannual) dynamics of the temperature sensitivity of SR [12,36]. Obviously, seasonal changes in abiotic and biotic factors directly affect the dynamics of the two main fluxes in SR—heterotrophic and root respiration. In a 4-year soil warming experiment conducted in a cool-temperate deciduous broadleaved forest in Central Japan, it was illustrated that the warming effect on SR varied seasonally because HR was more sensitive to soil warming in the late-growing season compared to other seasons [37]. The authors highlighted that the projection of the soil carbon cycle in future climate conditions should take seasonal variations in the warming effects on SR into consideration. Therefore, more field studies in various bio-climatic regions are required in order to better understand the mechanisms of the confounded effects of the main abiotic and biotic factors on the temperature sensitivity of SR.
Until now, the interannual dynamics of the temperature sensitivity of SR have not been examined extensively. More attention has been paid to the spatial variations in the temperature sensitivity of soil respiration and its controlling factors. Usually, in situ monitoring of SR in individual ecosystems lasts no more than 3–5 years and is mostly conducted during the growing season; year-round SR measurements in ecosystems with a permanent snow cover are greatly limited [16]. Investigations identifying the factors that drive the interannual variability in Q10 at the local and ecosystem levels are practically absent. Such studies are greatly required in order to determine the direction and magnitude of individual ecosystem carbon cycle feedbacks to current climate changes.
Our on-going study aimed to estimate the seasonal and interannual dynamics of the temperature sensitivity of SR based on a long-term 24-year series of measurements in two temperate forest ecosystems in European Russia. The specific objectives of this study were to examine: (1) the correlation between the Q10 values and meteorological indexes based on the ratio between the air temperature and precipitation at different time intervals throughout the year, and (2) the impact of the forest type and soil properties on Q10 dynamics. The forests studied were formed on soils of different types (Entic Podzol vs. Haplic Luvisol) with contrast textures (sandy vs. loamy) under similar climate conditions. The study sites also differed in terms of the forest type (mixed vs. deciduous), which caused differences in the litter composition, i.e., the substrate quality and availability. Hence, the selected forest ecosystems are characterized by various internal features and identical external (climate) conditions. We hypothesized that the interannual variability of the Q10 of SR in temperate forest ecosystems would be determined by the aridity/humidity conditions during the observation period, while the internal soil properties (mainly soil texture) would affect tightness of the relationships between the temperature sensitivity of SR and meteorological indexes.

2. Materials and Methods

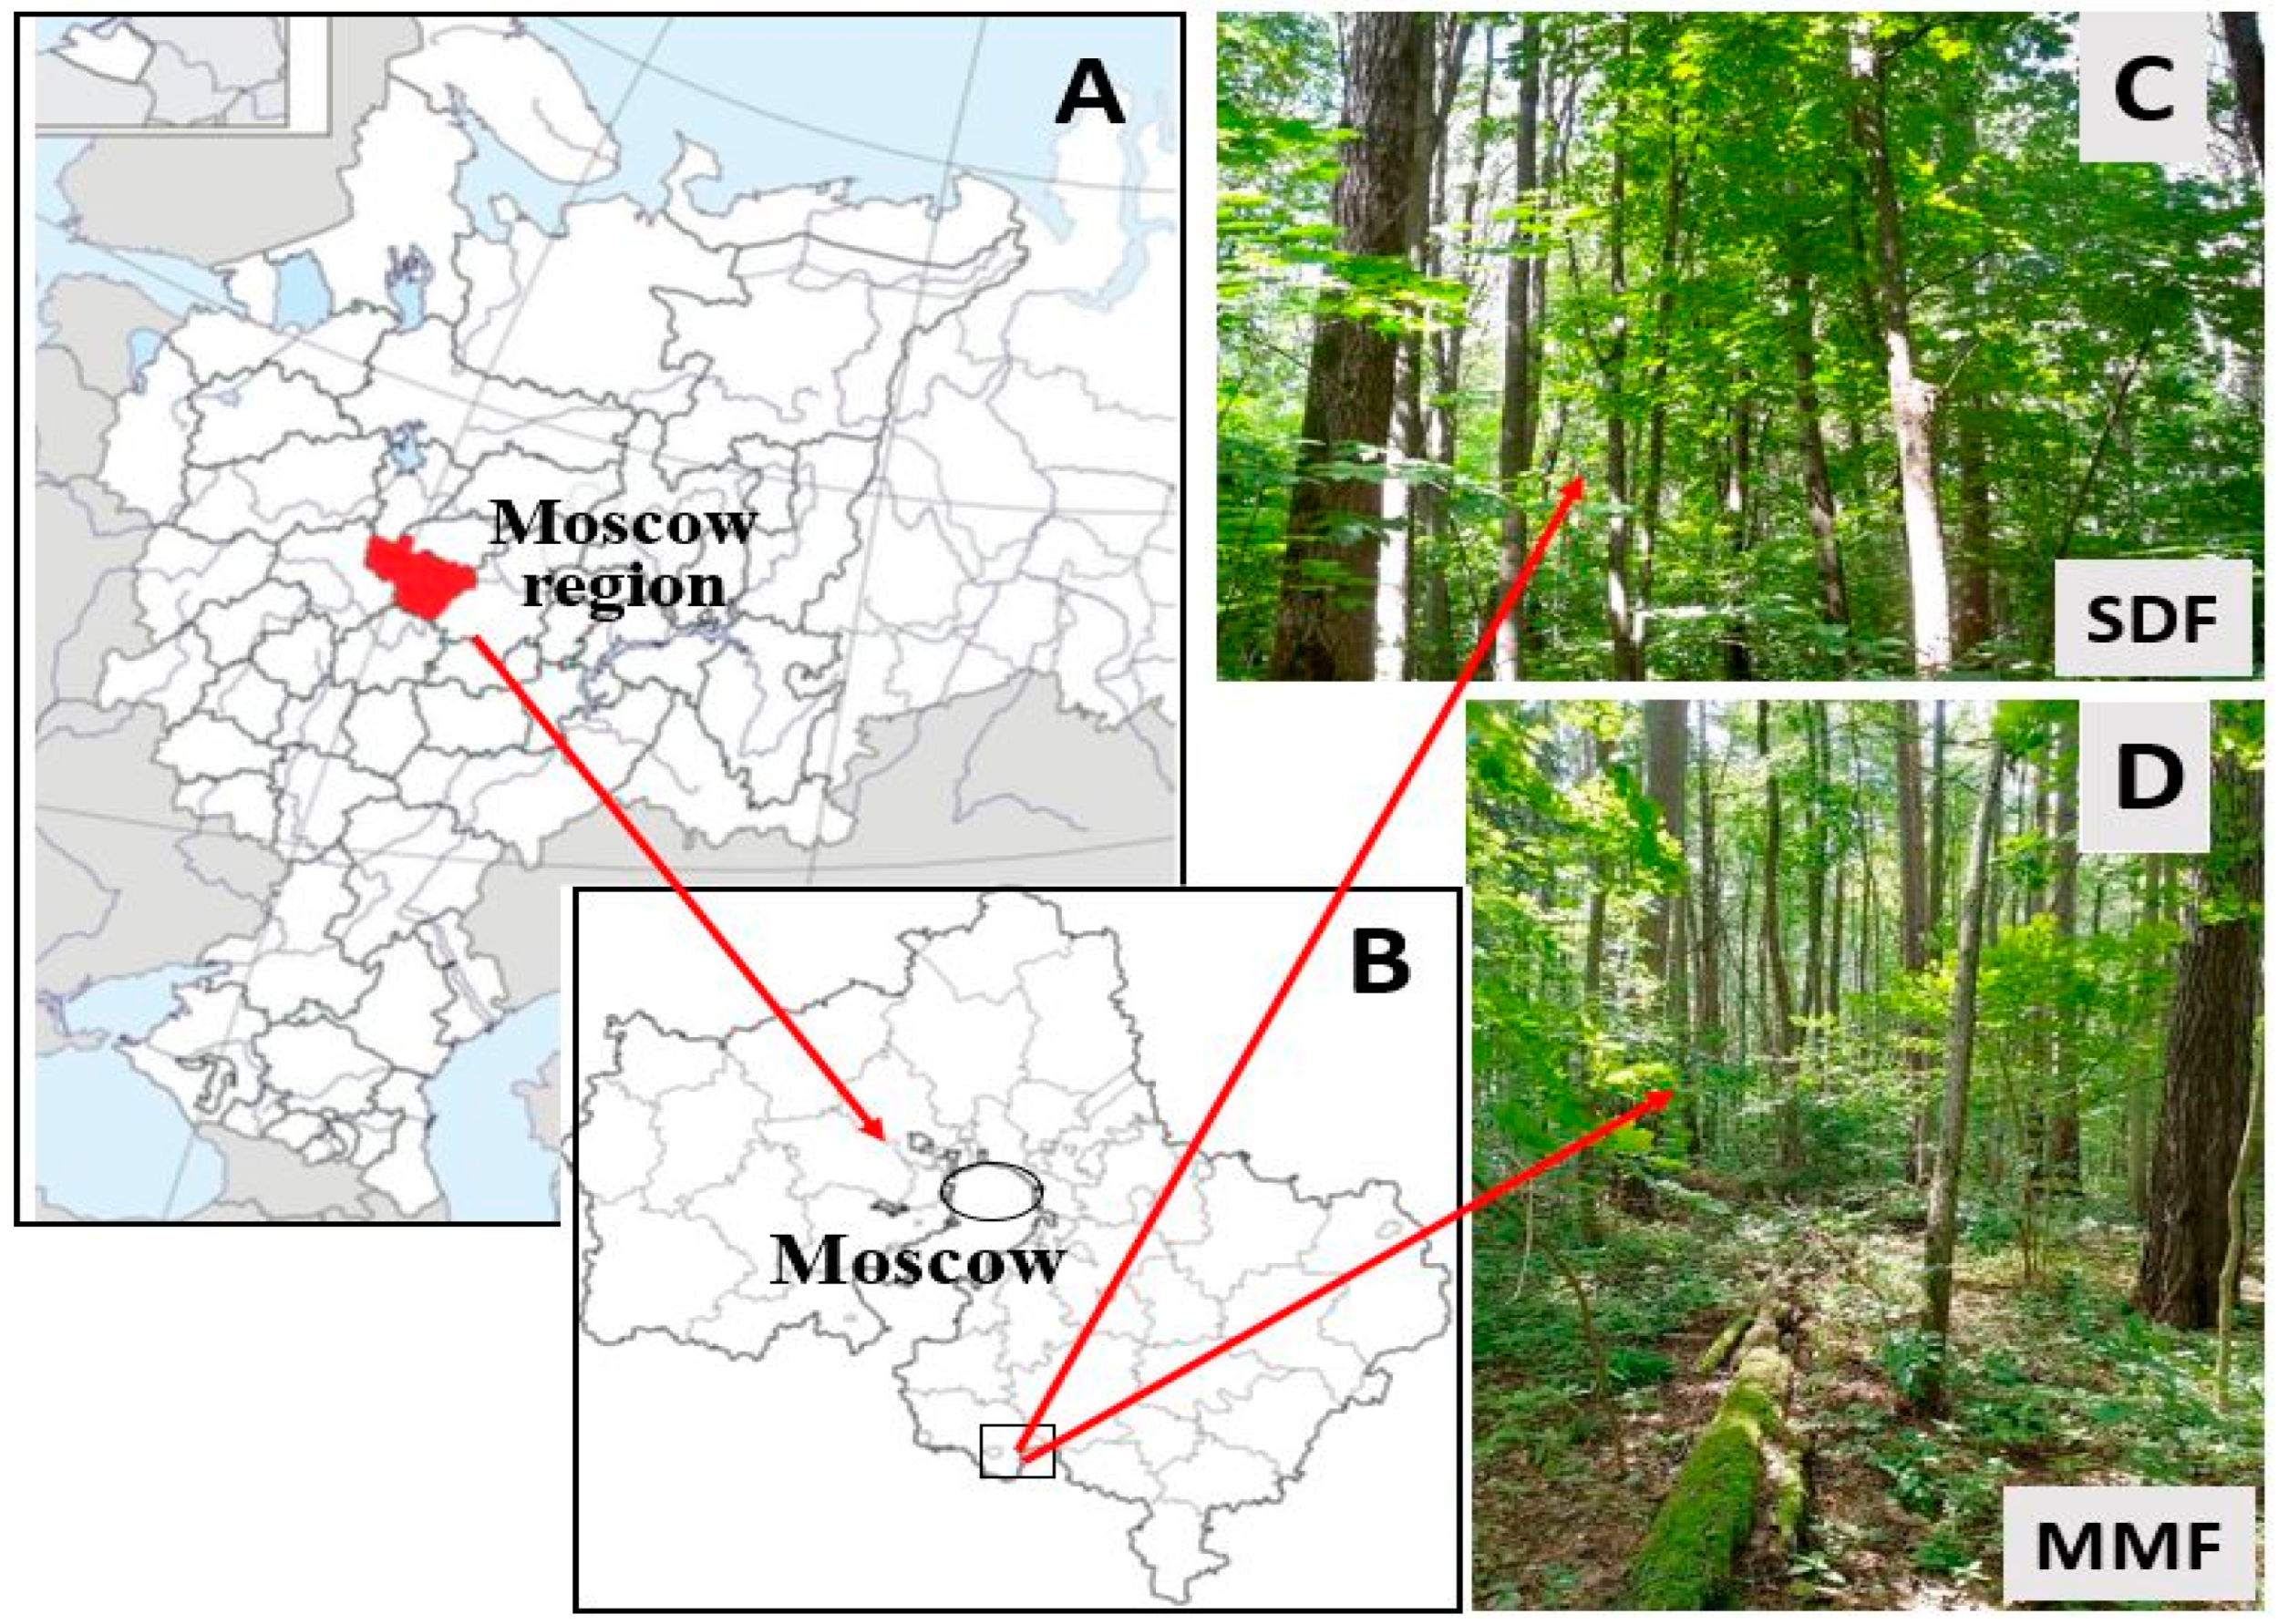
2.1. Study Area and Forest Sites

This study was conducted in the southern part of the Moscow region (Russia), which is part of a boundary between the southern taiga and broad-leaved forest zone (Figure 1). The climate in the region is classified as temperate-continental, with a mean annual temperature of 5.7 °C and an annual precipitation of 640 mm for the period between 1991 and 2020 (current climatic norm). The mean monthly temperatures in July and January for the same period are 18.8 and −7.2 °C, respectively. A permanent snow cover can appear from November to the middle of January and remains until the end of April.
The experiment was carried out in a mature mixed forest (MMF) located in the territory of Prioksko-Terrasny State Reserve (54°50′ N, 37°35′ E) and in a secondary deciduous forest (SDF) adjacent to the Experimental Field Station of the Institute of Physicochemical and Biological Problems of Soil Sciences of the Russian Academy of Sciences (54°20′ N, 37°37′ E). The soils of the studied sites were classified as Entic Podzol (Arenic) in the MMF and Haplic Luvisol (Siltic) in the SDF. The distance between the studied forest sites is about 7.5 km. The soils of the two experimental sites markedly differ in their content of organic carbon (C) and total nitrogen (N), the C to N ratio, and pH value (Table 1). They are also characterized by different values of water holding capacity (WHC), which is mainly due to the differences in soil texture and C content. The carbon stock in the litter of the MMF site is 5.8 ± 0.3 Mg C per ha, which is 2.4 times higher than in the SDF site [38].

2.2. Soil Respiration Measurements

The SR rate was measured continuously from December 1997 to November 2021 at 7–10-day intervals using a closed chamber method. Measurements were carried out all the year round between 9 and 11 a.m., when the current value of the SR rate was approximately equal to its mean daily value [39,40]. In total, over the 24-year observation period, 1070 and 981 measurements were performed in the MMF and SDF sites, respectively. We conditionally divided the calendar year into two periods: the vegetation period (or snowless period) from May to October and the cold period (mainly with snow cover) from November to April. Gas sampling procedures during the vegetation and the cold periods differed in terms of the size of the chambers used, number of replications, and exposure time [40,41]. Chambers were installed on the soil surface between plants, and the litter was not removed. During the snow-free period, steel (lightproof) cylindrical chambers (10 cm in diameter by 10 cm in height) were used. Chambers were inserted into the soil to a depth of 3–4 cm before the gas sampling. The CO2 concentration in a chamber was determined every 10 min over 30 min or every 15 min over 45 min in the Entic Podzol and Haplic Luvisol, respectively [40,41]. During the cold snowy period (mainly from November to April), 32 × 32 cm steel bases (with a water seal) were inserted permanently to a depth of 20 cm into the soil and 32 × 32 × 15 cm steel boxes were used as a cover. To exclude disturbances from the snow cover, the bases were built up by special sections as required. The increase in the CO2 concentrations in the chambers was measured over 135 min at 45-min intervals [41]. Gas samples (20 cm3) were collected by a syringe, transported to the laboratory in hermetically sealed vacuumed flasks, and analyzed on the day of sampling using gas chromatographs (Chrom-5, Prague, Czech Republic, or Kristall-2000, Yoshkar-Ola, Russia).
The measured SR flux includes the heterotrophic (mainly microbial) and autotrophic (root) respiration, as well as the non-biological production of CO2. The SR rate was calculated according to the following differential equation, taking into account the suppression of the CO2 evolution due to the decreasing CO2 gradient between the soil air and atmosphere and the inverse diffusion of CO2 into the soil [42]:
dC/dt = FCO2/H − Ds/H × (C − C0)/ZCH
which can be integrated to:
C = C0 + FCO2 × ZCH/Ds × (1 − exp(−Ds/(ZCH × H × t))),
where FCO2 is the CO2-C flux, mgC m−2 h−1; C0 is the initial head-space concentration of CO2-C, mg C m−3; C is the head-space concentration of CO2-C, mgC m−3, in time t (hour); H is the height of the head-space layer in the chamber, m; Ds is the CO2 diffusion coefficient in the soil; and ZCH is the depth of the lower chamber edge below the soil surface, m.
For the first 20 min during the warm (snow-free) period, we assumed a linear increase in the head-space CO2 concentration in the chamber with time. During the cold season, the net flux of CO2 was negligible within the measurement interval (90 min). Thus, Equations (1) and (2) can be simplified to Equations (3) and (4) [16,40]:
dC/dt = FCO2/H
or
C = C0 + FCO2 × t/H
Simultaneously, the soil moisture (Ms) and soil temperature (Ts) in the upper soil layer (0–5 cm) were determined. Ms (mass %) was determined by the classical gravimetric method, and Ts was measured using a transistorized electrical thermometer TET-2 (Saint-Petersburg, Russia) over 1997–2003. Since November 2003, Ts has been measured by the automatic thermometer Checktemp 1 (Hanna Instruments, Vöhringen, Germany) during the gas sampling procedure and also 6 times per day using the Termochrons iButton (Whitewater, WI, USA).

2.3. Data Processing

2.3.1. Calculation of the Meteorological Indexes

The series of long-term meteorological data were provided by the staff of the Station of Background Monitoring (RosHydromet observation Network), located in the territory of Prioksko-Terrasny State Reserve nearby the MMF site. The dataset included the mean daily (and monthly) air temperature (Tair, °C) and the daily (and monthly) level of precipitation (P, mm) for the whole observation period (December 1997 to November 2021). Based on these data, we calculated the following meteorological indexes (MI): (1) mean annual Tair (MAT, °C) and annual sum of precipitation (SP, mm); (2) ST5–8 and ST5–9 (°C), the sum of the mean monthly Tair from May to August and May to September, respectively; (3) SP5–8 and SP5–9, the sum of the monthly P from May to August and May to September, respectively; (4) the wetness indexes, WI5–8 and WI5–9, which present the lg(SP5–8/ST5–8) and lg(SP5–9/ST5–9), respectively [43]; and (5) the Selyaninov hydrothermal coefficient (HTC6–8) over the summer period (June–August), which is the ratio between the sum of precipitation (mm) for the period with a mean daily air temperature above 10 °C to the sum of the temperatures for the same period divided by 10 [16,38]. We believe that all these parameters are the most sensitive predictors of the interannual variability in Q10 values, since they cover various time intervals within the growing season, reflecting the differences in water supply. We also calculated the current climatic norm (ClimNorm) for each MI, which is the mean value of an index over the period between 1991–2020 (Table S1).

2.3.2. Calculation of the Temperature Coefficient Q10

The responses of the SR rate to Ts at a 5 cm depth were assessed using the linearized Q10 function [44]:
Ln(SR) = a + bTs
A logarithmic transformation of the SR values yielded a linear function with homoscedastic errors [45]. Then, the parameters of this equation were used to estimate the apparent Q10 of the soil respiration, which measures the factor of the increase in the SR rate associated with an increase of 10 °C in the soil temperature:
Q10 = exp(10b)
We also calculated SR10, the rate of soil respiration at 10 °C:
SR10 = Q10 × exp(a)
The Q10 values and SR10 were estimated individually and for the whole dataset for: (i) years with different levels of humidity (normal, wet, dry), (ii) the individual calendar seasons of winter (December–February), spring (March–May), summer (June–August) and fall (September–October); and (iii) each of 24 observation years. For every data set, calculations of Q10 and SR10 were performed for the whole interval of the Ts (Q*10 and SR*10) and also for the Ts above 1 °C (Q10 and SR10) to avoid confusing our results with the effects of the SR burst caused by the freezing-thawing processes [46,47]. In this study, we propose keeping the typical symbols Q10 and SR10 for the values calculated at Ts ≥ 1 °C, since the majority of studies on the temperature sensitivity of SR are carried out in the positive range of the Ts.
We used the coefficient of determination (R2) and sum of residual squares (SSR) to assess the goodness of fit. All correlations between Ln(SR) and Ts are presented in the Supplementary Materials (Figures S1–S8). Based on the experimental data set, we calculated the observed SR10 values (obs-SR10 as an average value at Ts = 9.5–10.4 °C) for the whole dataset and individually for the years with different levels of humidity, for the individual calendar seasons, and for each of the 24 observation years.

2.3.3. Statistical Analyses

Before the statistical analyses, all independent variables (Q*10, Q10, SR*10, and SR10 values and meteorological indexes) were tested for the normality of distribution and homogeneity of variance (Shapiro-Wilk test). The variability of the meteorological parameters, Q*10, Q10, SR*10, and the SR10 values was assessed using the following parameters (Tables S1 and S3): the variation range (VR = Max − Min), oscillation coefficient (Cos) as the ratio between the VR and the mean value (Cos = VR/Mean), and the variation coefficient (CV, %) as the ratio between the standard deviation (STD) and the mean value (CV = STD/Mean × 100). A one-way ANOVA was used to estimate the effect of the soil/forest type on the mean values of Q*10, Q10, SR*10 and the SR10 values (t-test). Relationships between Q10 and the R10 values and various MI were explored using the Pearson correlation (F test). The classical metrics of the ANOVA (including the standard deviation, standard error and median, lower and upper quartiles) were also calculated (Tables S1 and S3; Figure 2, Figure 3 and Figure 4). We also divided the 24-year series of the MI into 4–6 classes (Table S2) and then mean values of Q10 for each class were calculated. The Spearman’s correlation was used to estimate the relationship between the mean values of Q10 and the MI ranks. The paired t-test with the adjustment of the Holm–Bonferroni method was applied to assess the statistical significance of the differences between the average values of Q10 corresponding to the various classes of MI. Statistical analyses were performed with Excel MS Office 2013 or with the R software [48], using the α = 0.05 level of significance unless stated otherwise.

3. Results

3.1. Analysis of the Meteorological Indexes from 1998–2021

The meteorological indexes varied significantly over the observation period (Figure 2). The hydrothermal coefficient for the summer season (HTC6–8) and the indexes related to precipitation level during the vegetation season (SP5–8, SP5–9) were the most variable over the 24-year observation period (CV = 29%–44% and Cos > 1.0), whereas the temperature indexes (ST5–8, ST5–9) for the same period were characterized by the lowest variability, with CV = 6%–7% and Cos < 0.32 (Table S2). Based on the values of the wetness indexes (HTC6–8, WI5–8 and WI5–9), we determined the humidity level for each observation year. If the value of any parameter was above or below its mean value in the observation period by more than 1 STD, the year was referred to as wet or dry, respectively. There were 5 years classified as ‘wet’, including 1999, 2003, 2006, 2008 and 2020, whereas 7 years were classified as ‘dry’, including 2002, 2007, 2010, 2011, 2014, 2018 and 2021. The remaining 12 years were referred to as ‘normal’ in terms of humidity levels, including 1998, 2000, 2001, 2004, 2005, 2009, 2012, 2013, 2015, 2016, 2017 and 2019. In total, the observation period (1998–2021) was slightly warmer and drier than the period for which the climatological norm was assessed (1981–2010).
Figure 2. Dynamics of the meteorological indexes during the observation period (a,c) and their statistical characteristics (b,d): the median (bar), lower (Q1) and upper (Q3) quartiles (“boxes”); X1 = Q1 − 1.5 IQR (interquartile range, IQR = Q3 − Q1) and X2 = Q3 − 1.5 IQR (“moustaches”). All data are shown as dots. Meteorological indexes: SP is the annual sum of precipitation (mm); SP5–8 and SP5–9 are the sum of monthly precipitation from May to August and May to September, respectively; WI5–8 and WI5–9 are the wetness indexes from May to August and May to September, respectively; HTC6–8 is the hydrothermal coefficient over the summer period (June–August).
Forests 13 01374 g002

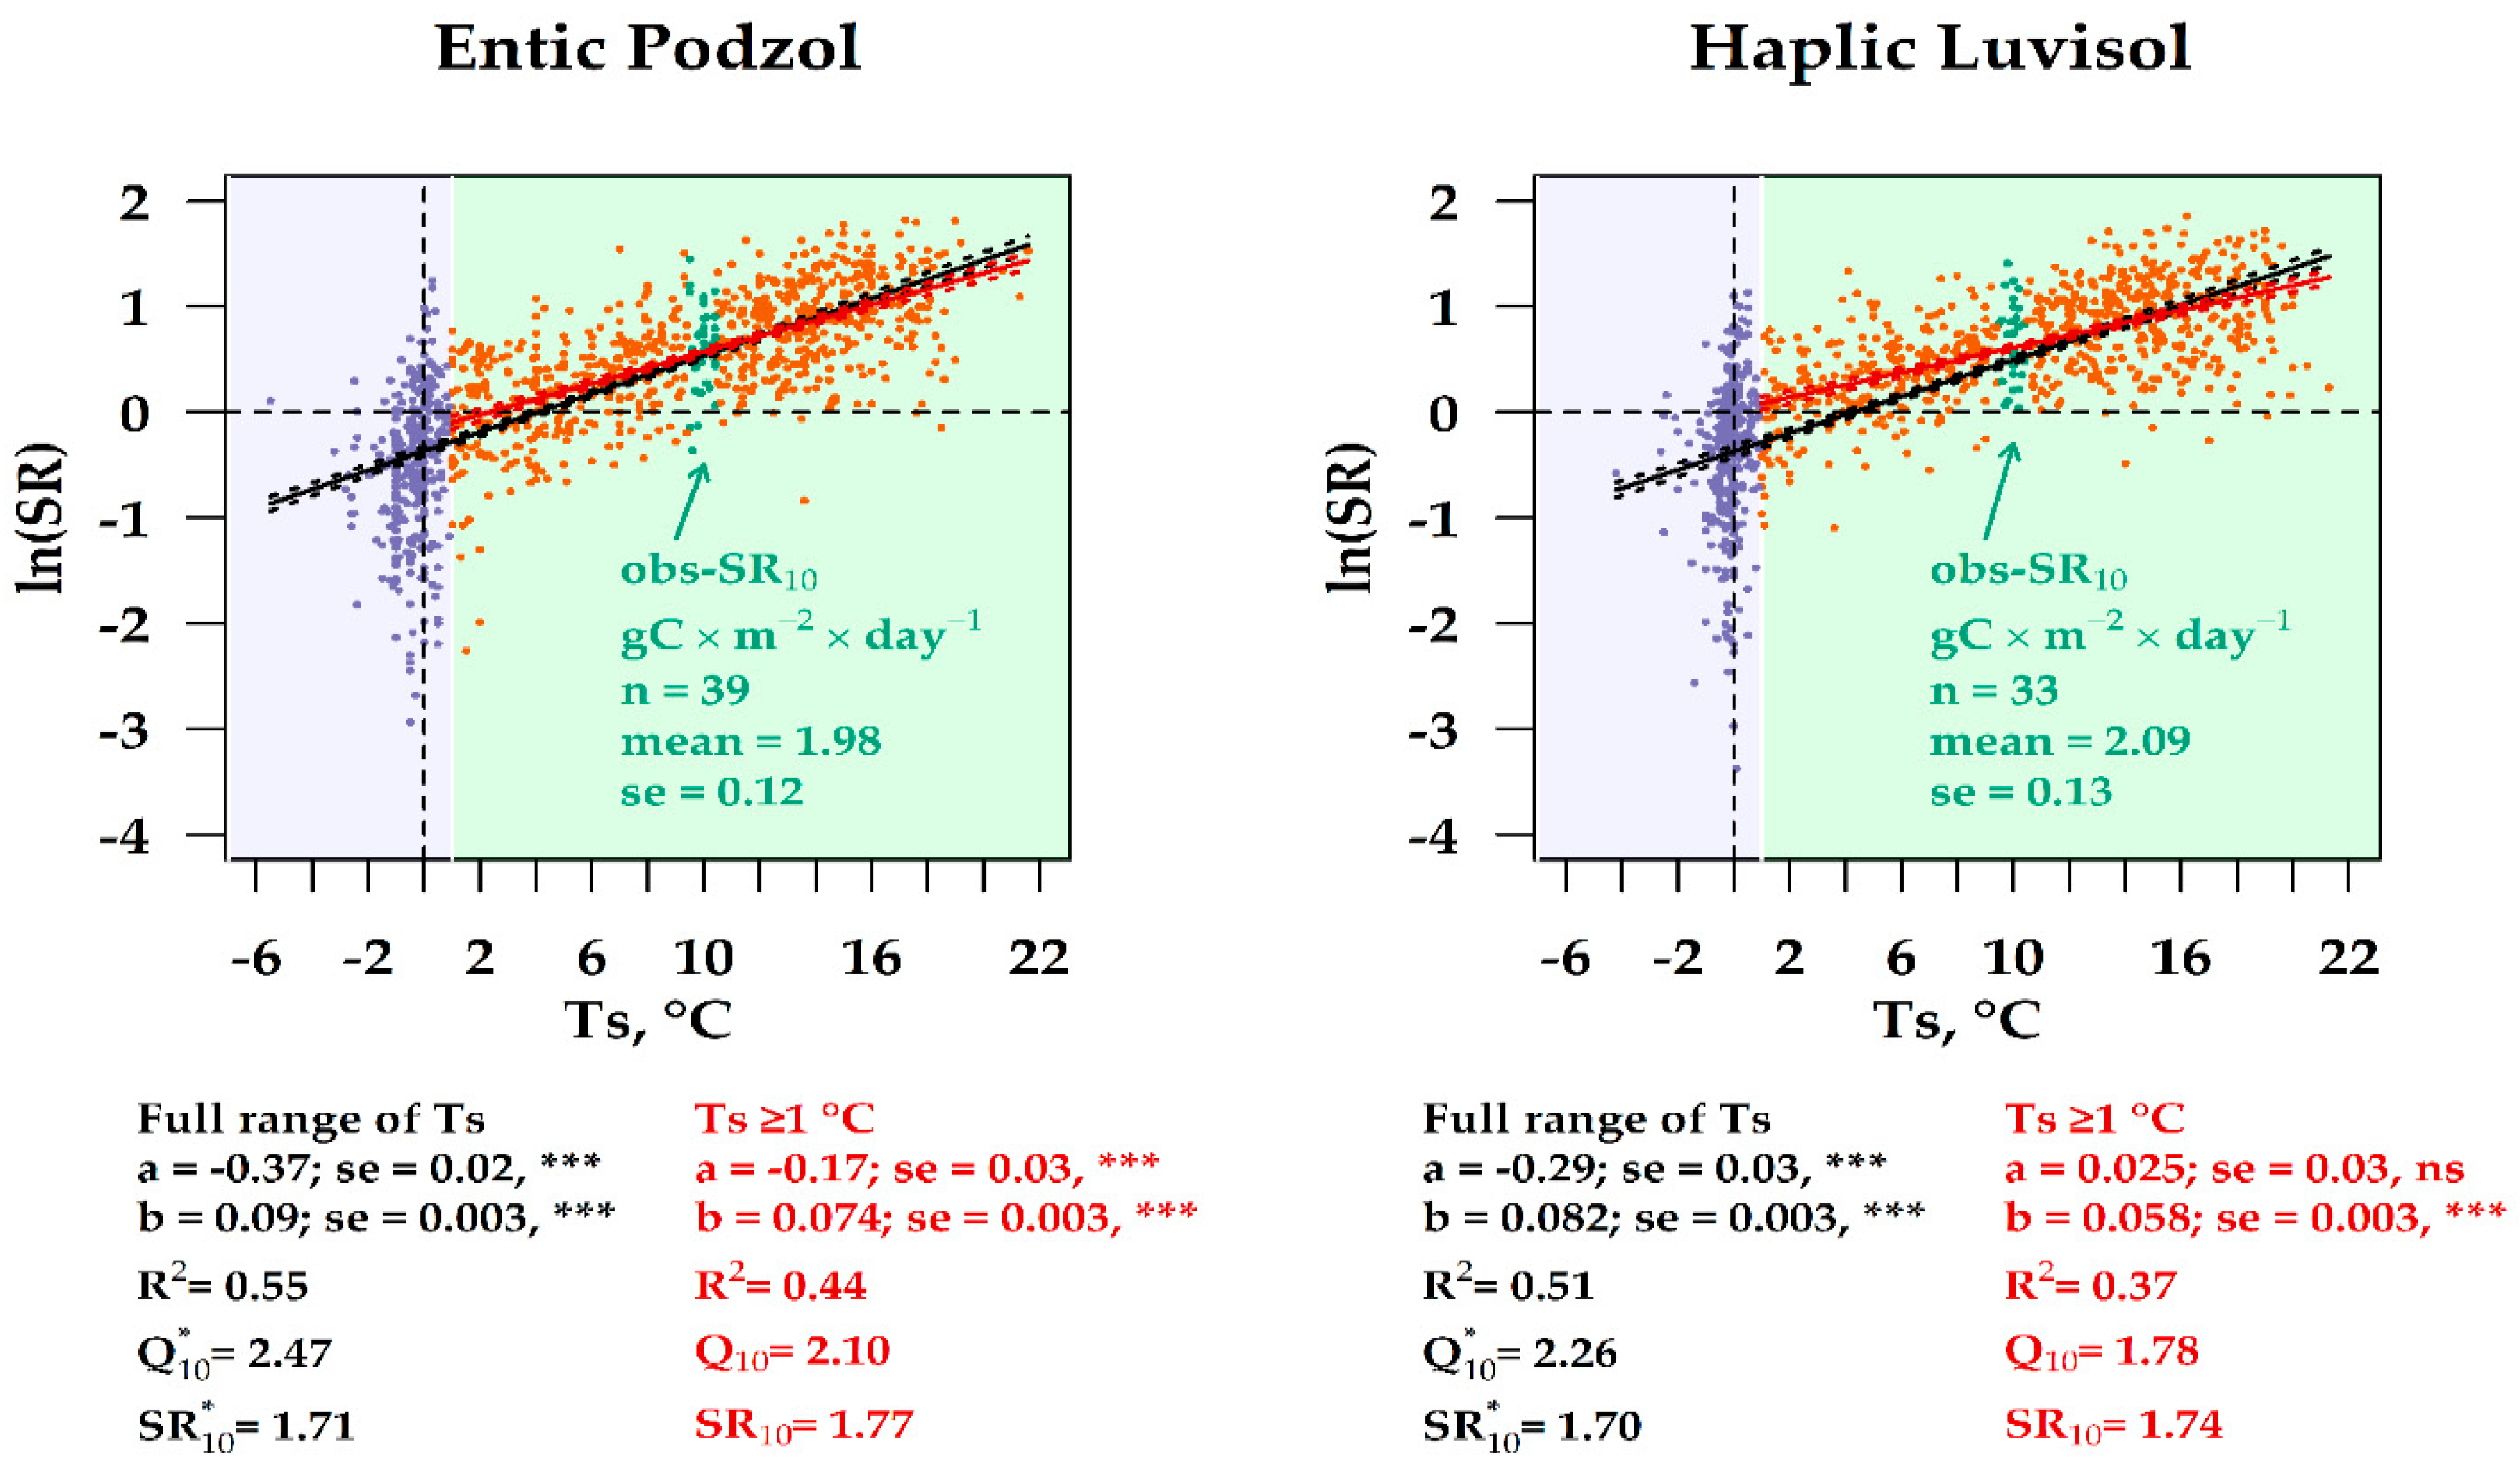
3.2. Q10 Values at Various Soil Temperature Intervals and at Different Levels of Humidity

The temperature sensitivity of SR computed for the full range of Ts (Q*10) was 2.47 and 2.26 for the sandy Entic Podzol (MMF) and for the loamy Haplic Luvisol (SDF), respectively (Figure 3, left). For the interval of Ts ≥ 1 °C, the corresponding values of Q10 were lower and amounted to 2.10 and 1.78, respectively (Figure 3, right). The values of SR*10 and SR10 in the sandy Entic Podzol, which were estimated according to Equation (7), comprised 1.71 and 1.77 gCm−2 day−1, respectively. The Loamy Haplic Luvisol was characterized by similar values of SR*10 and SR10, which amounted to 1.70 and 1.74 gCm−2 day−1, respectively.
Figure 3. Relationship between LnSR and soil temperature, with Ts at 5 cm in the Entic Podzol and Haplic Luvisol for the whole data set (black line) and for Ts >1 °C (red line). SR is the soil respiration rate, gCm−2 day−1; Ts is the soil temperature at 5 cm; R2 is the coefficient of determination; n is the number of observations; Q*10 and Q10 are the temperature sensitivity of soil respiration at the full range of Ts (black color) and for Ts ≥ 1 °C (red color), respectively. ***—parameters of regression equation (Ln(SR) = a + bTs) are significant at p < 0.0001. ns is not significant.
Forests 13 01374 g003
The temperature sensitivities of SR over the years which were normal with regard to humidity were approximately equal for both studied forest soils (Q*10 =2.66–2.72), whereas the Q10 values for SR at Ts ≥ 1 °C in the sandy Entic Podzol were higher than those in the loamy Haplic Luvisol: 2.33 vs. 2.09 (Table 2). Both the Q*10 and Q10 values for SR in the studied forests in dry years were 1.3–1.4 times lower as compared to the years with normal levels of humidity (Table 2). For the years with high levels of humidity, we also revealed a decrease in the temperature sensitivity of SR in both soils by 11%–18% in comparison to a normal year, except for the Q10 values in the Entic Podzol. In the years with normal and high levels of humidity, the Ts at 5 cm was responsible for 42%–61% of the SR variability, whereas in the dry years, only 28%–47% of the SR variation could be explained by the Ts fluctuation at 5 cm.
The estimated values of SR*10 and SR10 in both forest ecosystems over the years with normal and higher levels of humidity were similar (Table 2), ranging between 1.80 and 2.01 gCm−2 day−1. Over the dry years, the values of SR*10 and SR10 for both forests studied were considerably lower and changed from 1.41 to 1.47 gCm−2 day−1.

3.3. Seasonal Variation of the Q10 Values in the Two Types of Forest

The Q*10 values for the spring season (March–May) in both studied forests were higher in comparison with the fall season: 2.47–3.13 vs. 1.86–2.33 (Table 2). The temperature sensitivity of SR in the Haplic Luvisol at Ts ≥ 1 °C demonstrated a similar tendency, whereas in the Entic Podzol, the Q10 value in fall was higher than that in the spring season: 2.14 vs. 1.82. During the spring–fall time, the fluctuations in the Ts at 5 cm were responsible for 26%–47% of the SR variability.
The temperature sensitivity of SR in both forests was lowest during the summer season (June–August). The relationship between SR and Ts at 5 cm for the Haplic Luvisoil was not significant. During the winter season, the temperature sensitivity of SR was the highest, at Q*10 = 3.23–6.54, but the Ts fluctuations at 5 °C were responsible only for 7%–8% of the SR variability.
The estimated values of SR*10 and SR10 in the mixed mature forest (Entic Podzol) for the spring season were similar to those for the fall period and varied between 1.70 and 1.77 gCm−2 day−1 (Table 3). In the secondary deciduous forest (Haplic Luvisol), the values of SR*10 and SR10 amounted to 2.00 gCm−2 day−1 for the spring season and were slightly lower (1.78 gCm−2 day−1) during the fall period.

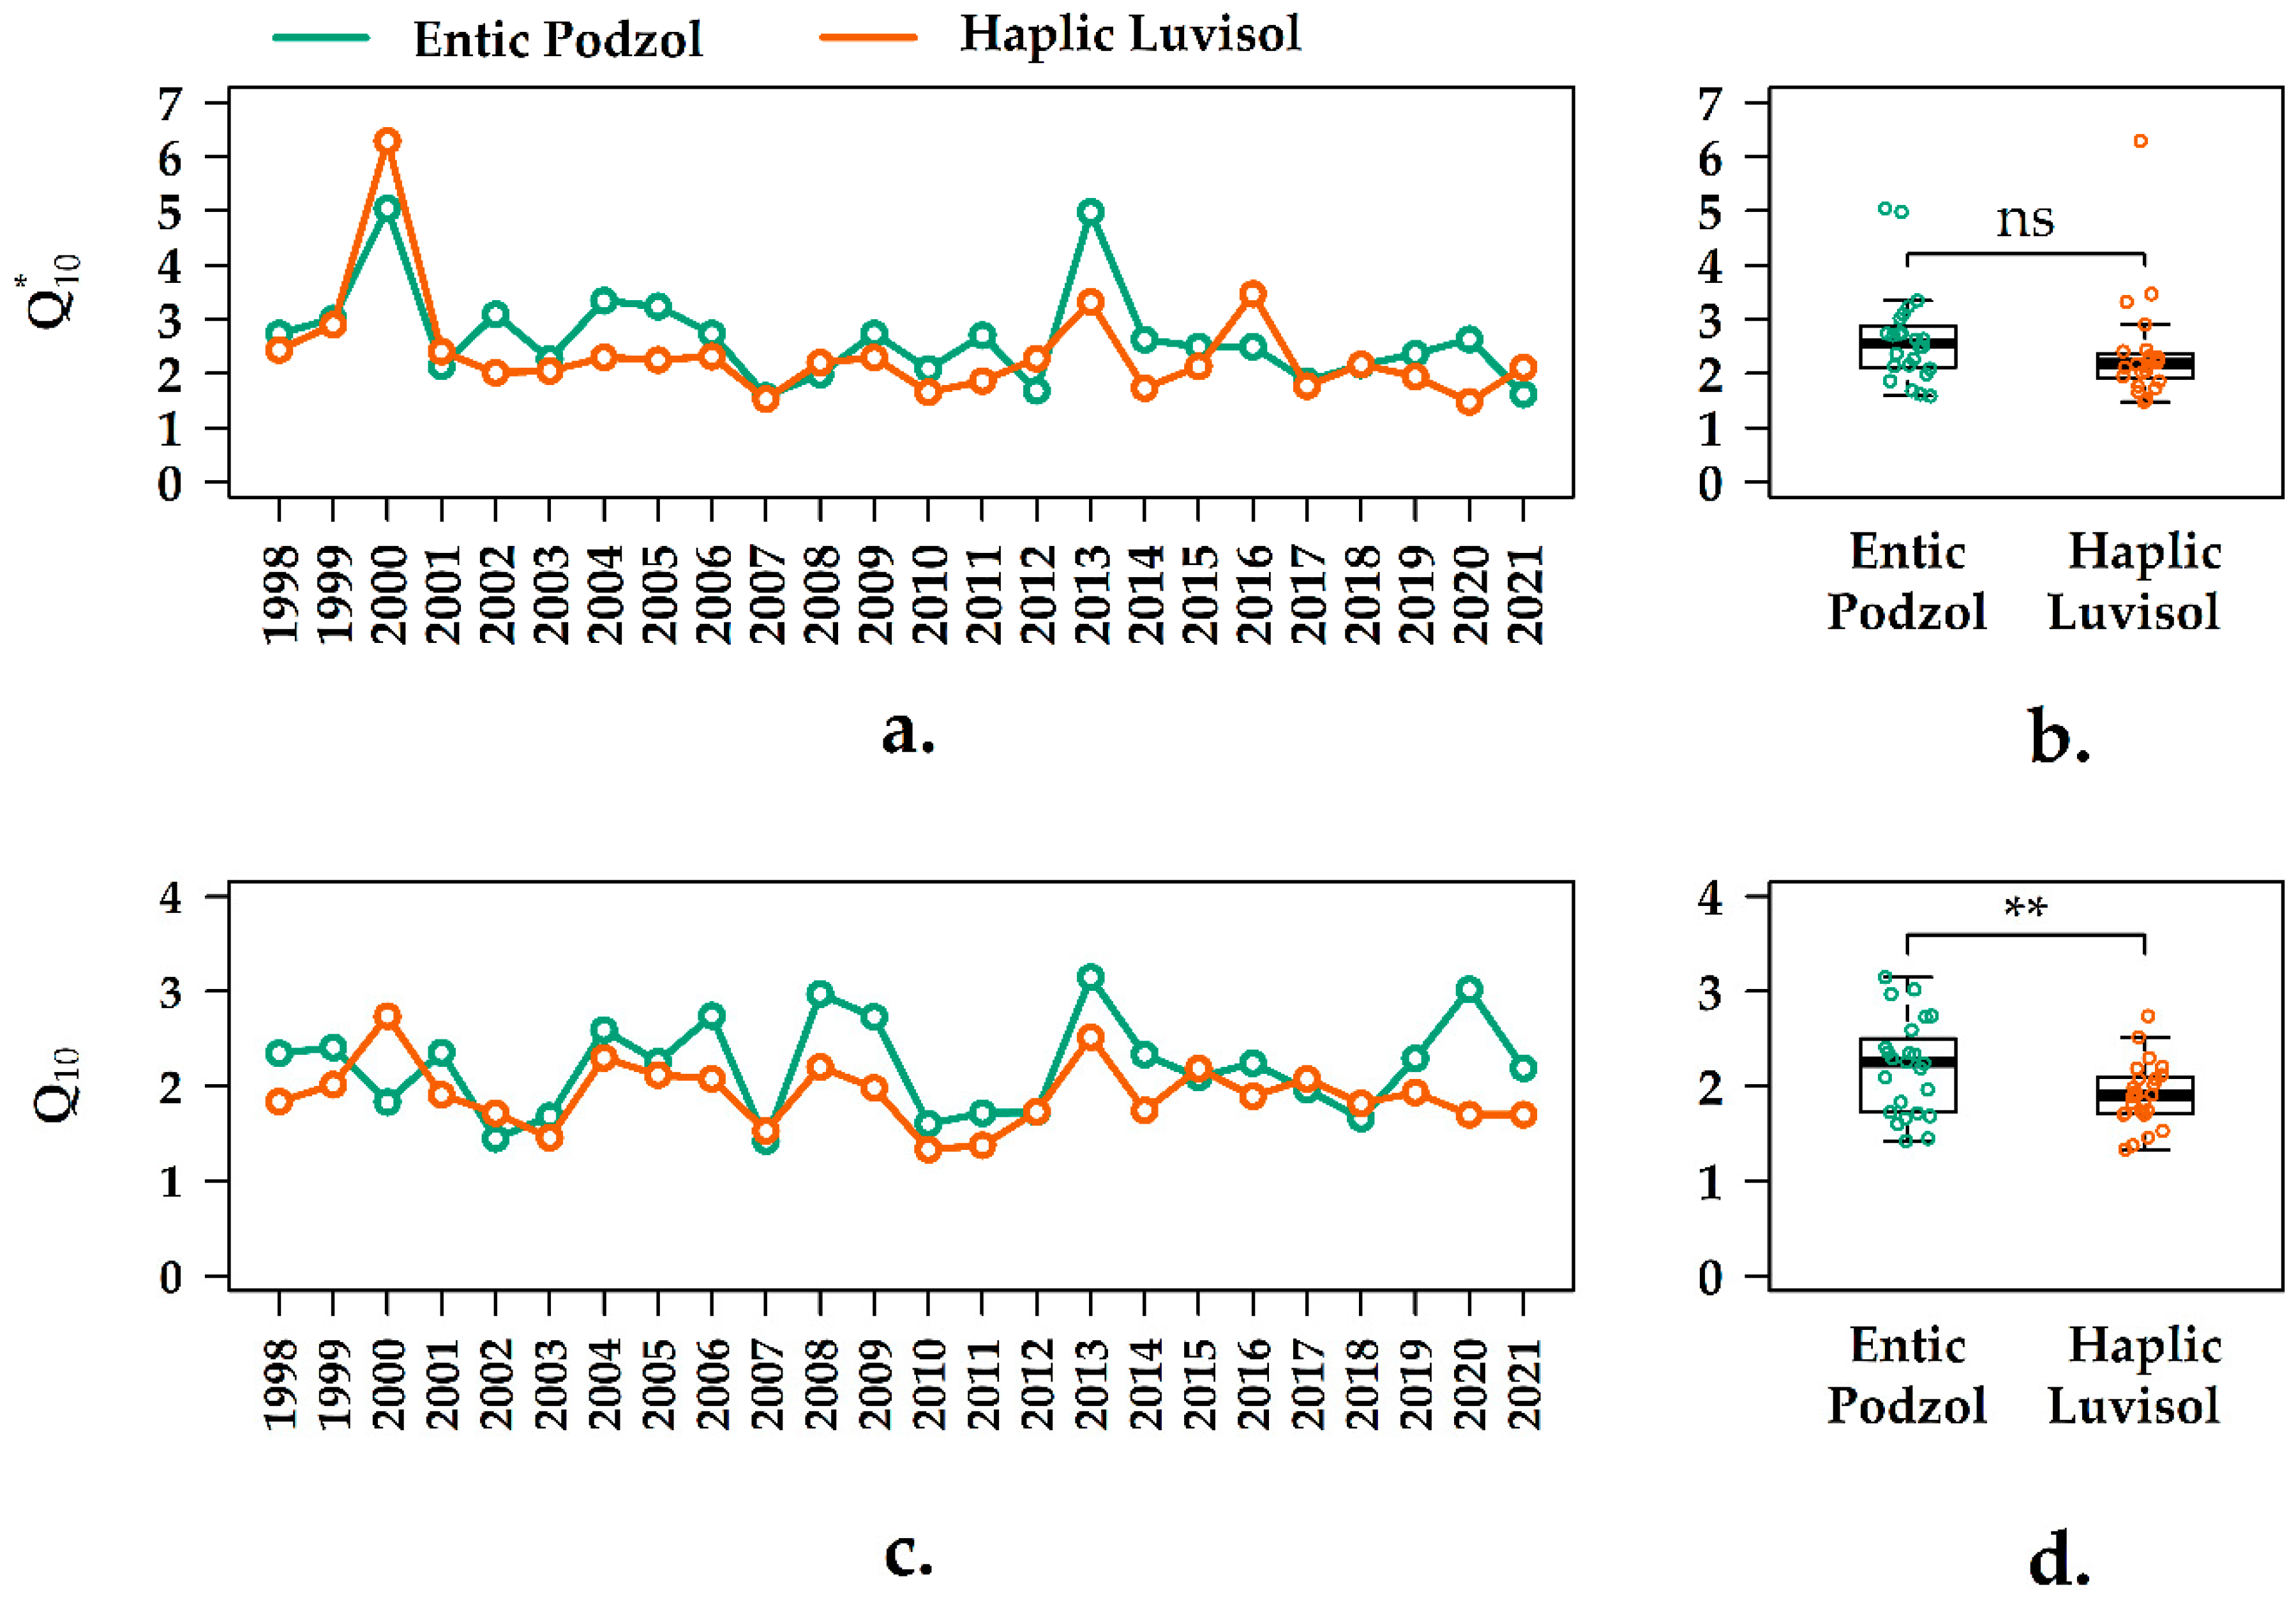
3.4. Interannual Variation of the Q10 Values in the Forest Ecosystems

The Q*10 values ranged from 1.50 to 5.04 in the sandy Entic Podzol and varied between 1.48 and 6.29 in the loamy Haplic Luvisol (Figure 4a) over the 24-year observation period. The interannual variability of the Q*10 values (CV) in these soils amounted to 33% and 40%, respectively (Table S3). The coefficients of oscillation of the Q*10 values were 1.31 and 2.03 for the Entic Podzol and Haplic Luvisol, respectively. The median value of Q*10 in the Entic Podzol was higher than in the Haplic Luvisol by a factor of 1.2, although the difference between the mean values of Q*10 was not significant (Figure 4b).
Figure 4. Dynamics of Q*10 and Q10 values in the two forests during the observation period (a,c) and their statistical characteristics (b,d): the median (bar), lower (Q1) and upper (Q3) quartiles (“boxes”); X1 = Q1–1.5 IQR (interquartile range IQR = Q3–Q1) and X2 = Q3–1.5 IQR (“moustaches”). All data are shown as dots. ns—the difference between mean values is not significant. **—the difference is significant at p < 0.01.
Forests 13 01374 g004
The values of Q10 for the interval of Ts ≥ 1 °C were considerably lower than the corresponding Q*10 values and changed from 1.42 to 3.15 in the sandy Entic Podzol and from 1.33 to 2.74 in the loamy Haplic Luvisol (Figure 4c). The coefficients of the interannual variation and the oscillation coefficients for the Q10 values were also lower than the corresponding coefficients for Q*10, being 18%–23% (CV) and 0.73–0.78 (Cos) (Table S3). The difference between the mean Q10 values in the soils studied was significant at p < 0.01 (Figure 4d). The median value of Q10 in the Entic Podzol was 1.2 times higher than in the Haplic Luvisol.

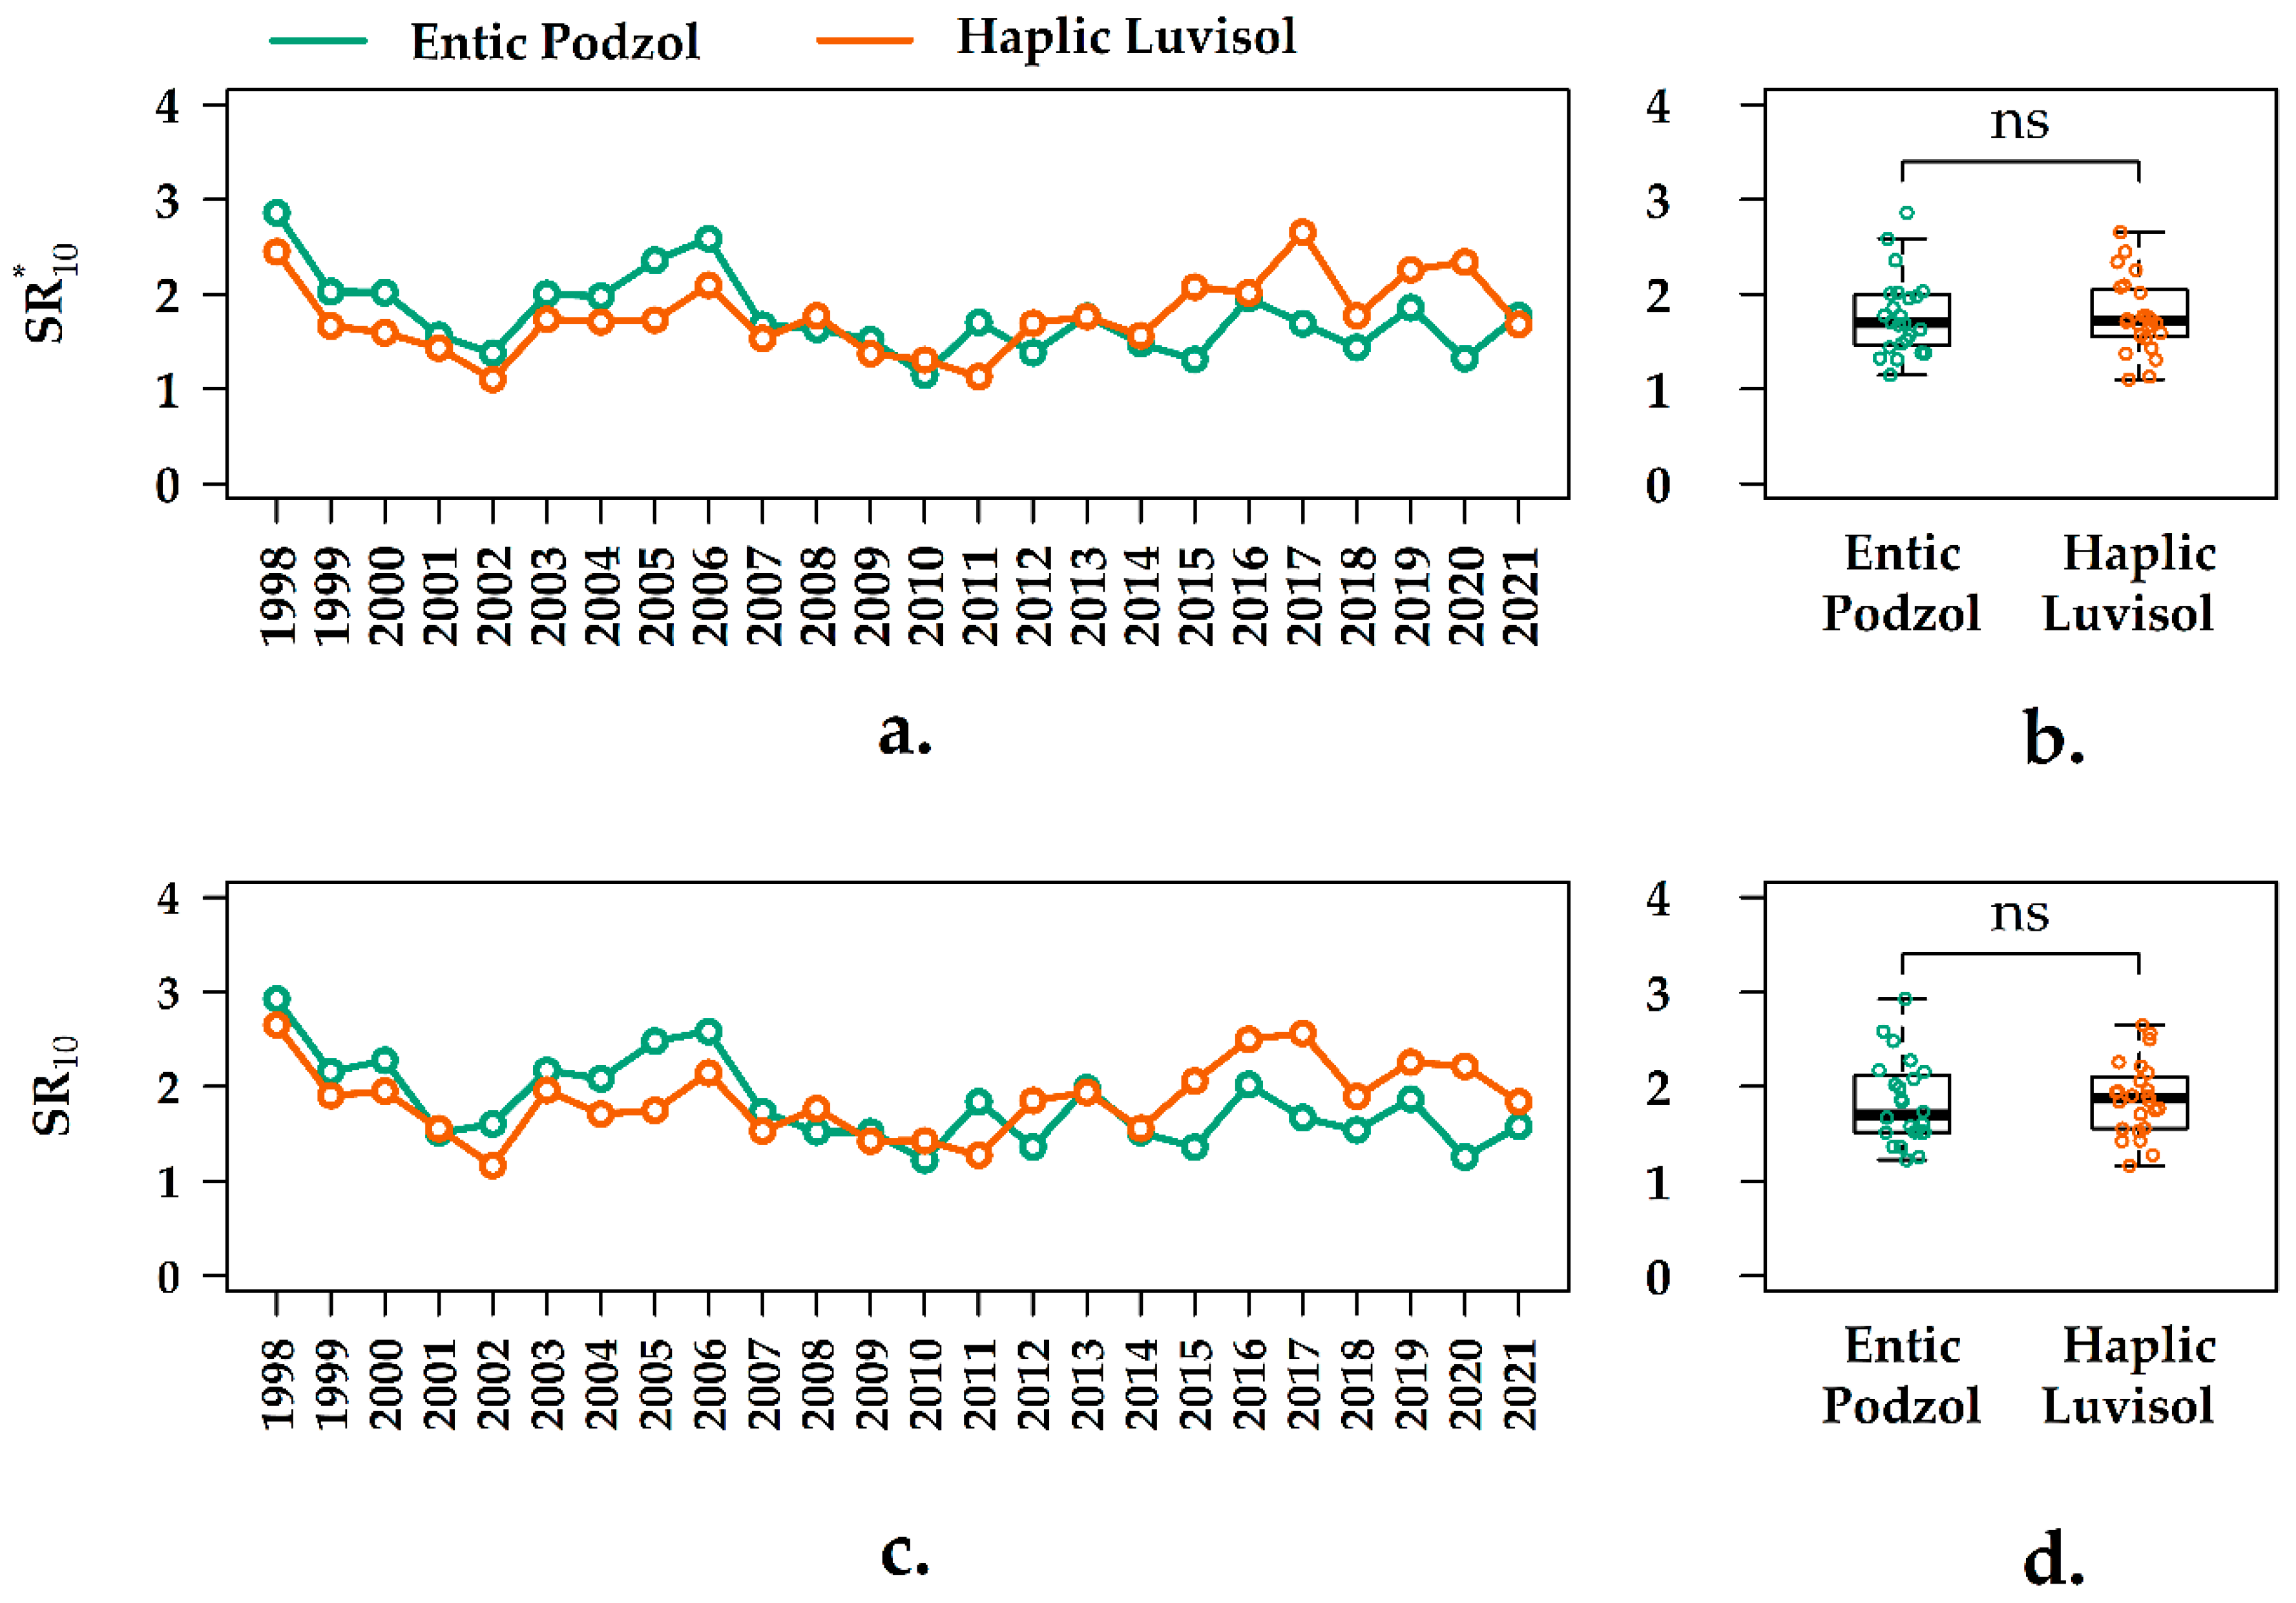
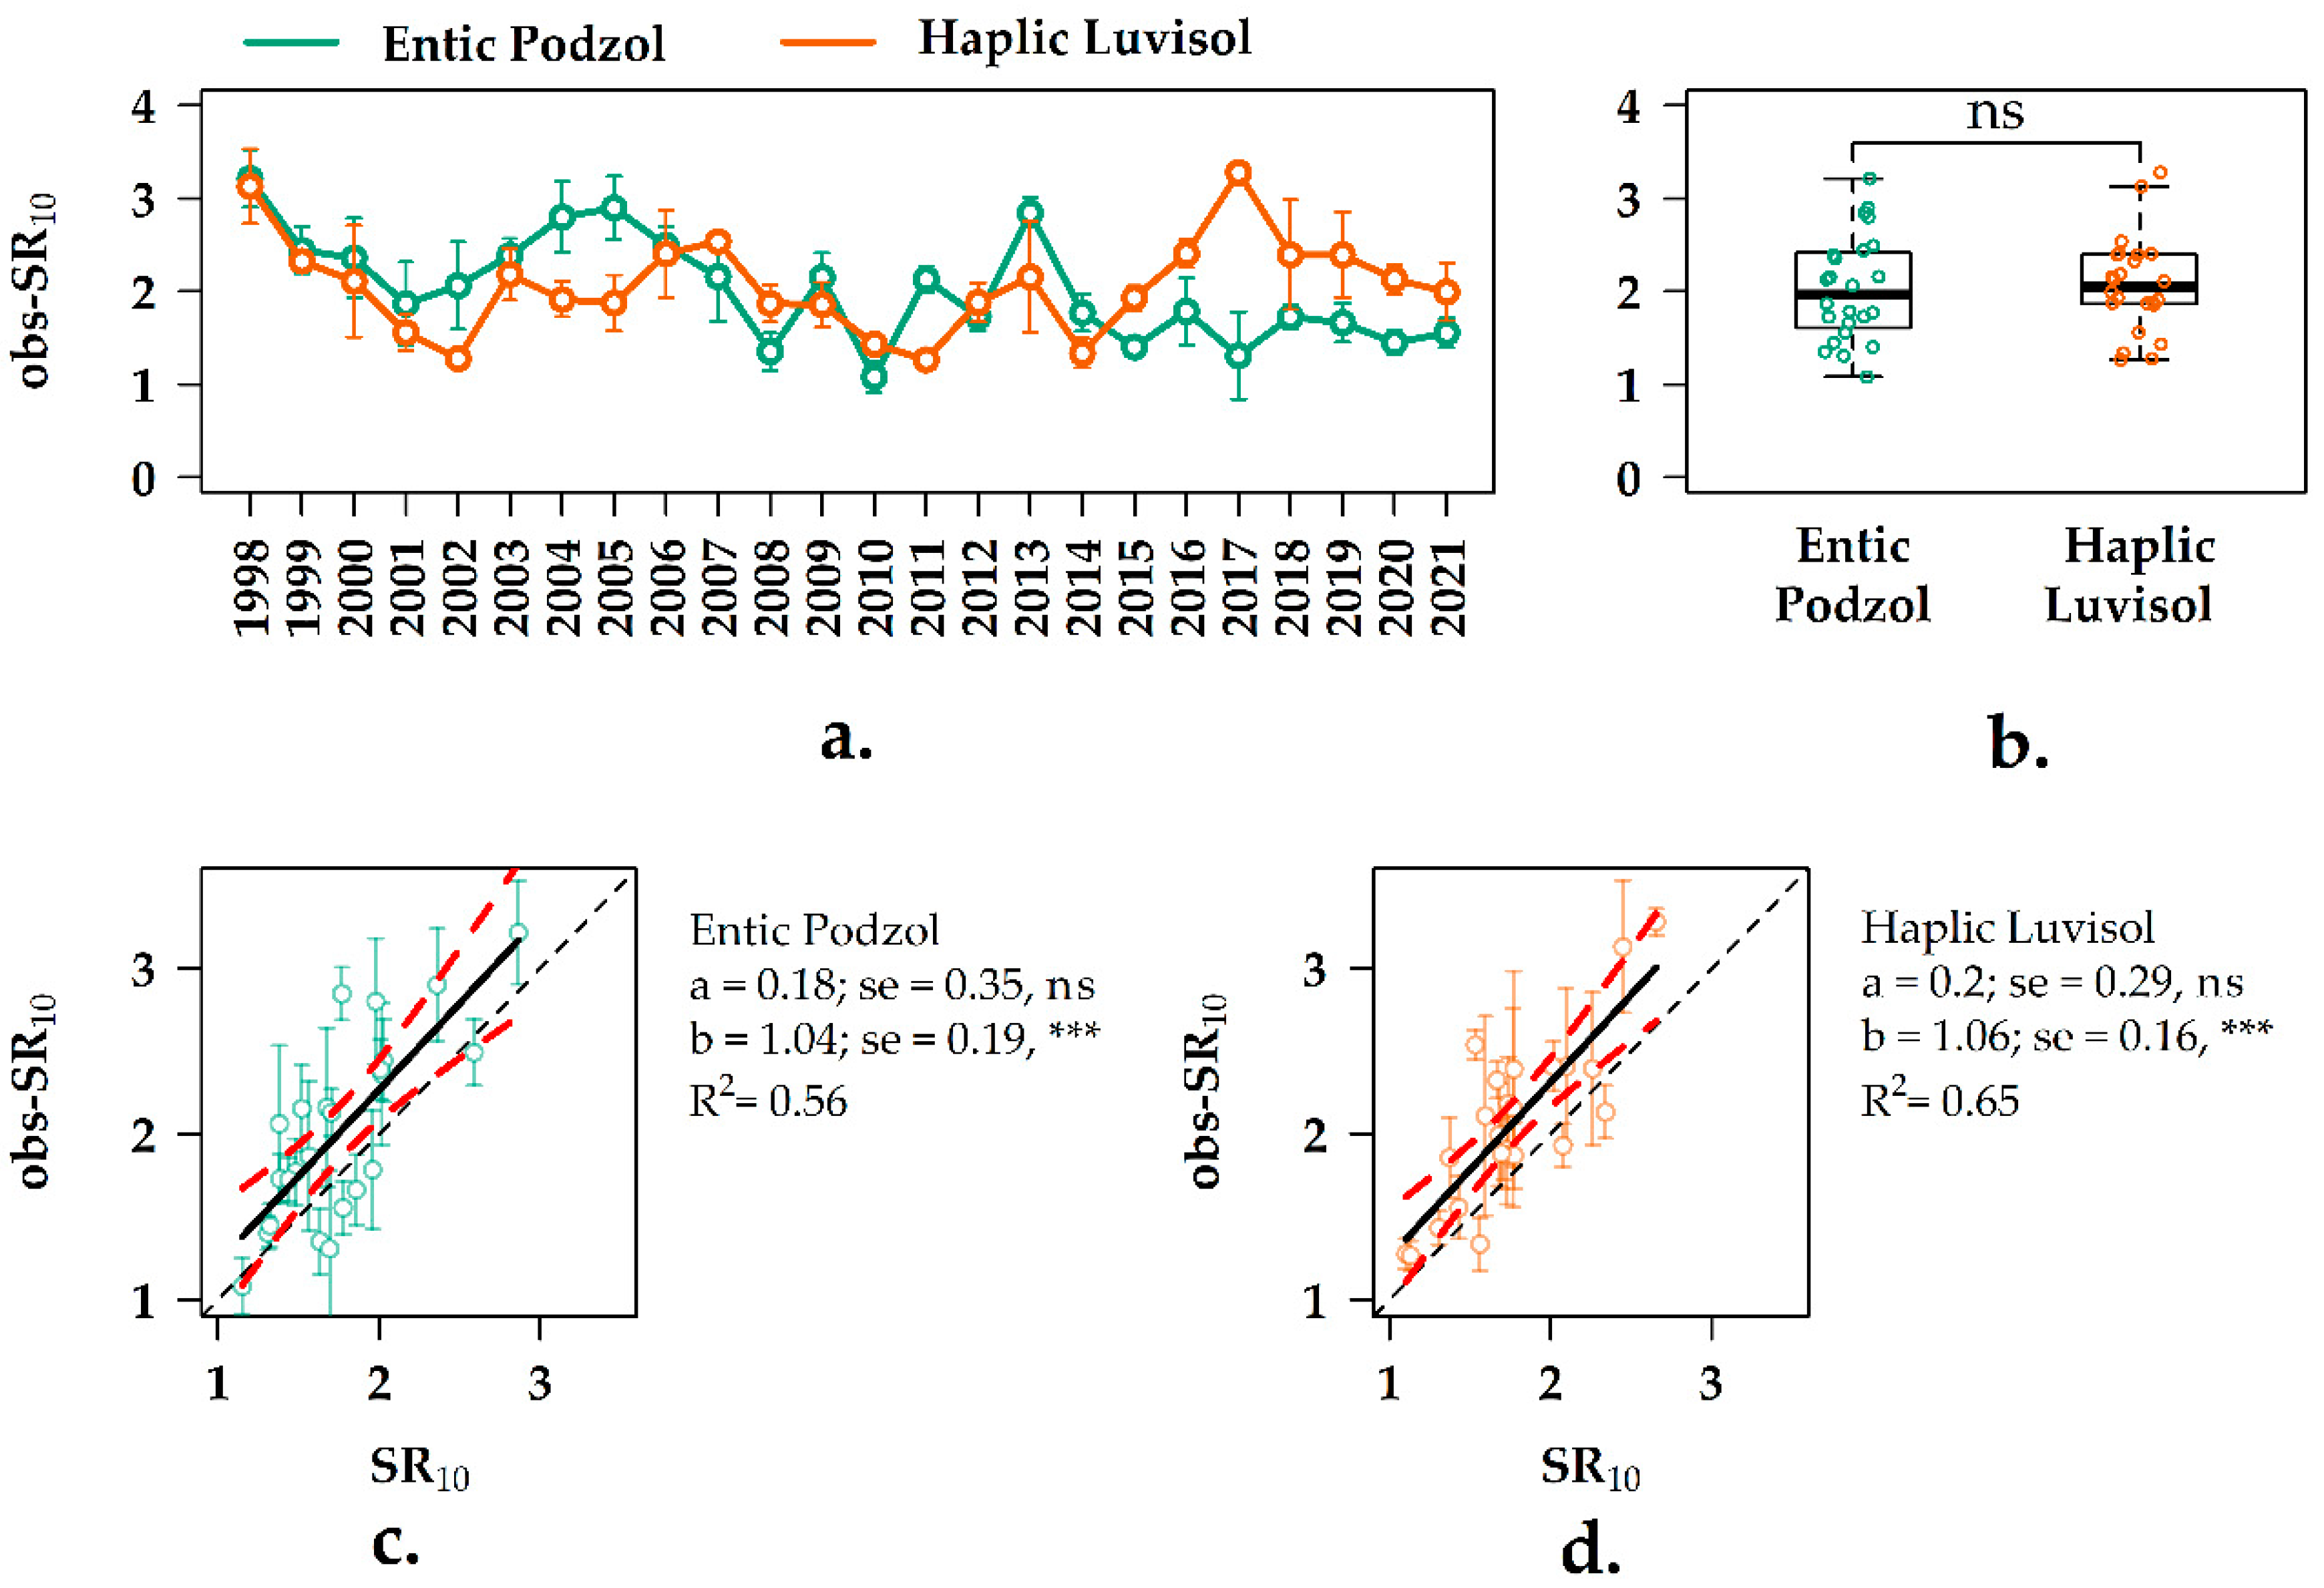
3.5. Interannual Variation of the SR10 Values in the Forest Ecosystems

The values of SR*10 ranged from 1.15 to 2.86 gCm−2 day−1 in the sandy Entic Podzol and changed in the similar interval (1.10–2.65 gCm−2 day−1) in the loamy Haplic Luvisol over the 24-year observation period (Figure 5a). The interannual coefficients of variation and the oscillation coefficients for the SR*10 values in these soils amounted to 22%–23% and 0.88–0.97, respectively (Table S3, Supplementary Materials). The median value of SR*10 in the Entic Podzol was similar to that in the Haplic Luvisol. There was no significant difference between the mean values of SR*10 in both soils studied (Figure 5b).
The values of SR10 (for the interval of Ts ≥ 1 °C) for the studied soils changed in ranges which were similar to the corresponding SR*10 values: from 1.15 to 2.86 gCm−2 day−1 in the sandy Entic Podzol and from 1.17 to 2.65 gCm−2 day−1 in the loamy Haplic Luvisol (Figure 5c). The SR*10 and SR10 values demonstrated significant negative linear trends during the measurement period (1998–2021), which equated to −0.28 and −0.35 gCm−2 day−1 per 10 years, respectively (R2 = 0.22–0.31; p < 0.02). The coefficients of the interannual variation and the oscillation coefficients for the SR10 values were also lower than the corresponding SR*10 values and amounted to 21%–24% (CV) and 0.79–0.93 (Cos) (Table S3). The Entic Podzol demonstrated a higher variability in the SR10 values in comparison with the loamy Haplic Luvisol. The median values of SR10 in the Entic Podzol and Haplic Luvisol amounted to 1.70 and 1.87 gCm−2 day−1, respectively. There was no significant difference between the mean values of SR10 in both soils studied (Figure 5d).

3.6. Experimental vs. Observation SR10 Values in the Two Forest Ecosystems

The values of obs-SR10 changed from 1.08 to 3.21 gCm−2 day−1 in the sandy Entic Podzol and from 1.26 to 3.28 gCm−2 day−1 in the loamy Haplic Luvisol (Figure 6a). During the first 8 years of observation (1998–2006), the obs-SR10 in the Entic Podzol was higher than in the Haplic Luvisol. This ratio was reversed between 2015 and 2021. There was a significant negative linear trend of obs-SR10 in the Entic Podzol during the measurement period (1998–2021), which equated to −0.51 gCm−2 day−1 per 10 years (R2 = 0.41; p < 0.001).
The coefficients of the interannual variation and the oscillation coefficients for obs-SR10 in both soils were close: 25%–28% (CV) and 0.97–1.05 (Cos) (Table S3, Supplementary Materials). The median values of obs-SR10 in the Entic Podzol and Haplic Luvisol amounted to 1.96 and 2.05 gCm−2 day−1, respectively. There was no significant difference between the mean values of obs-SR10 in both soils studied (Figure 6b). A close relationship (R2 = 0.56–0.65; p < 0.001) was observed between the obs-SR10 and SR10 values throughout the observation period in both forest soils (Figure 6c,d).

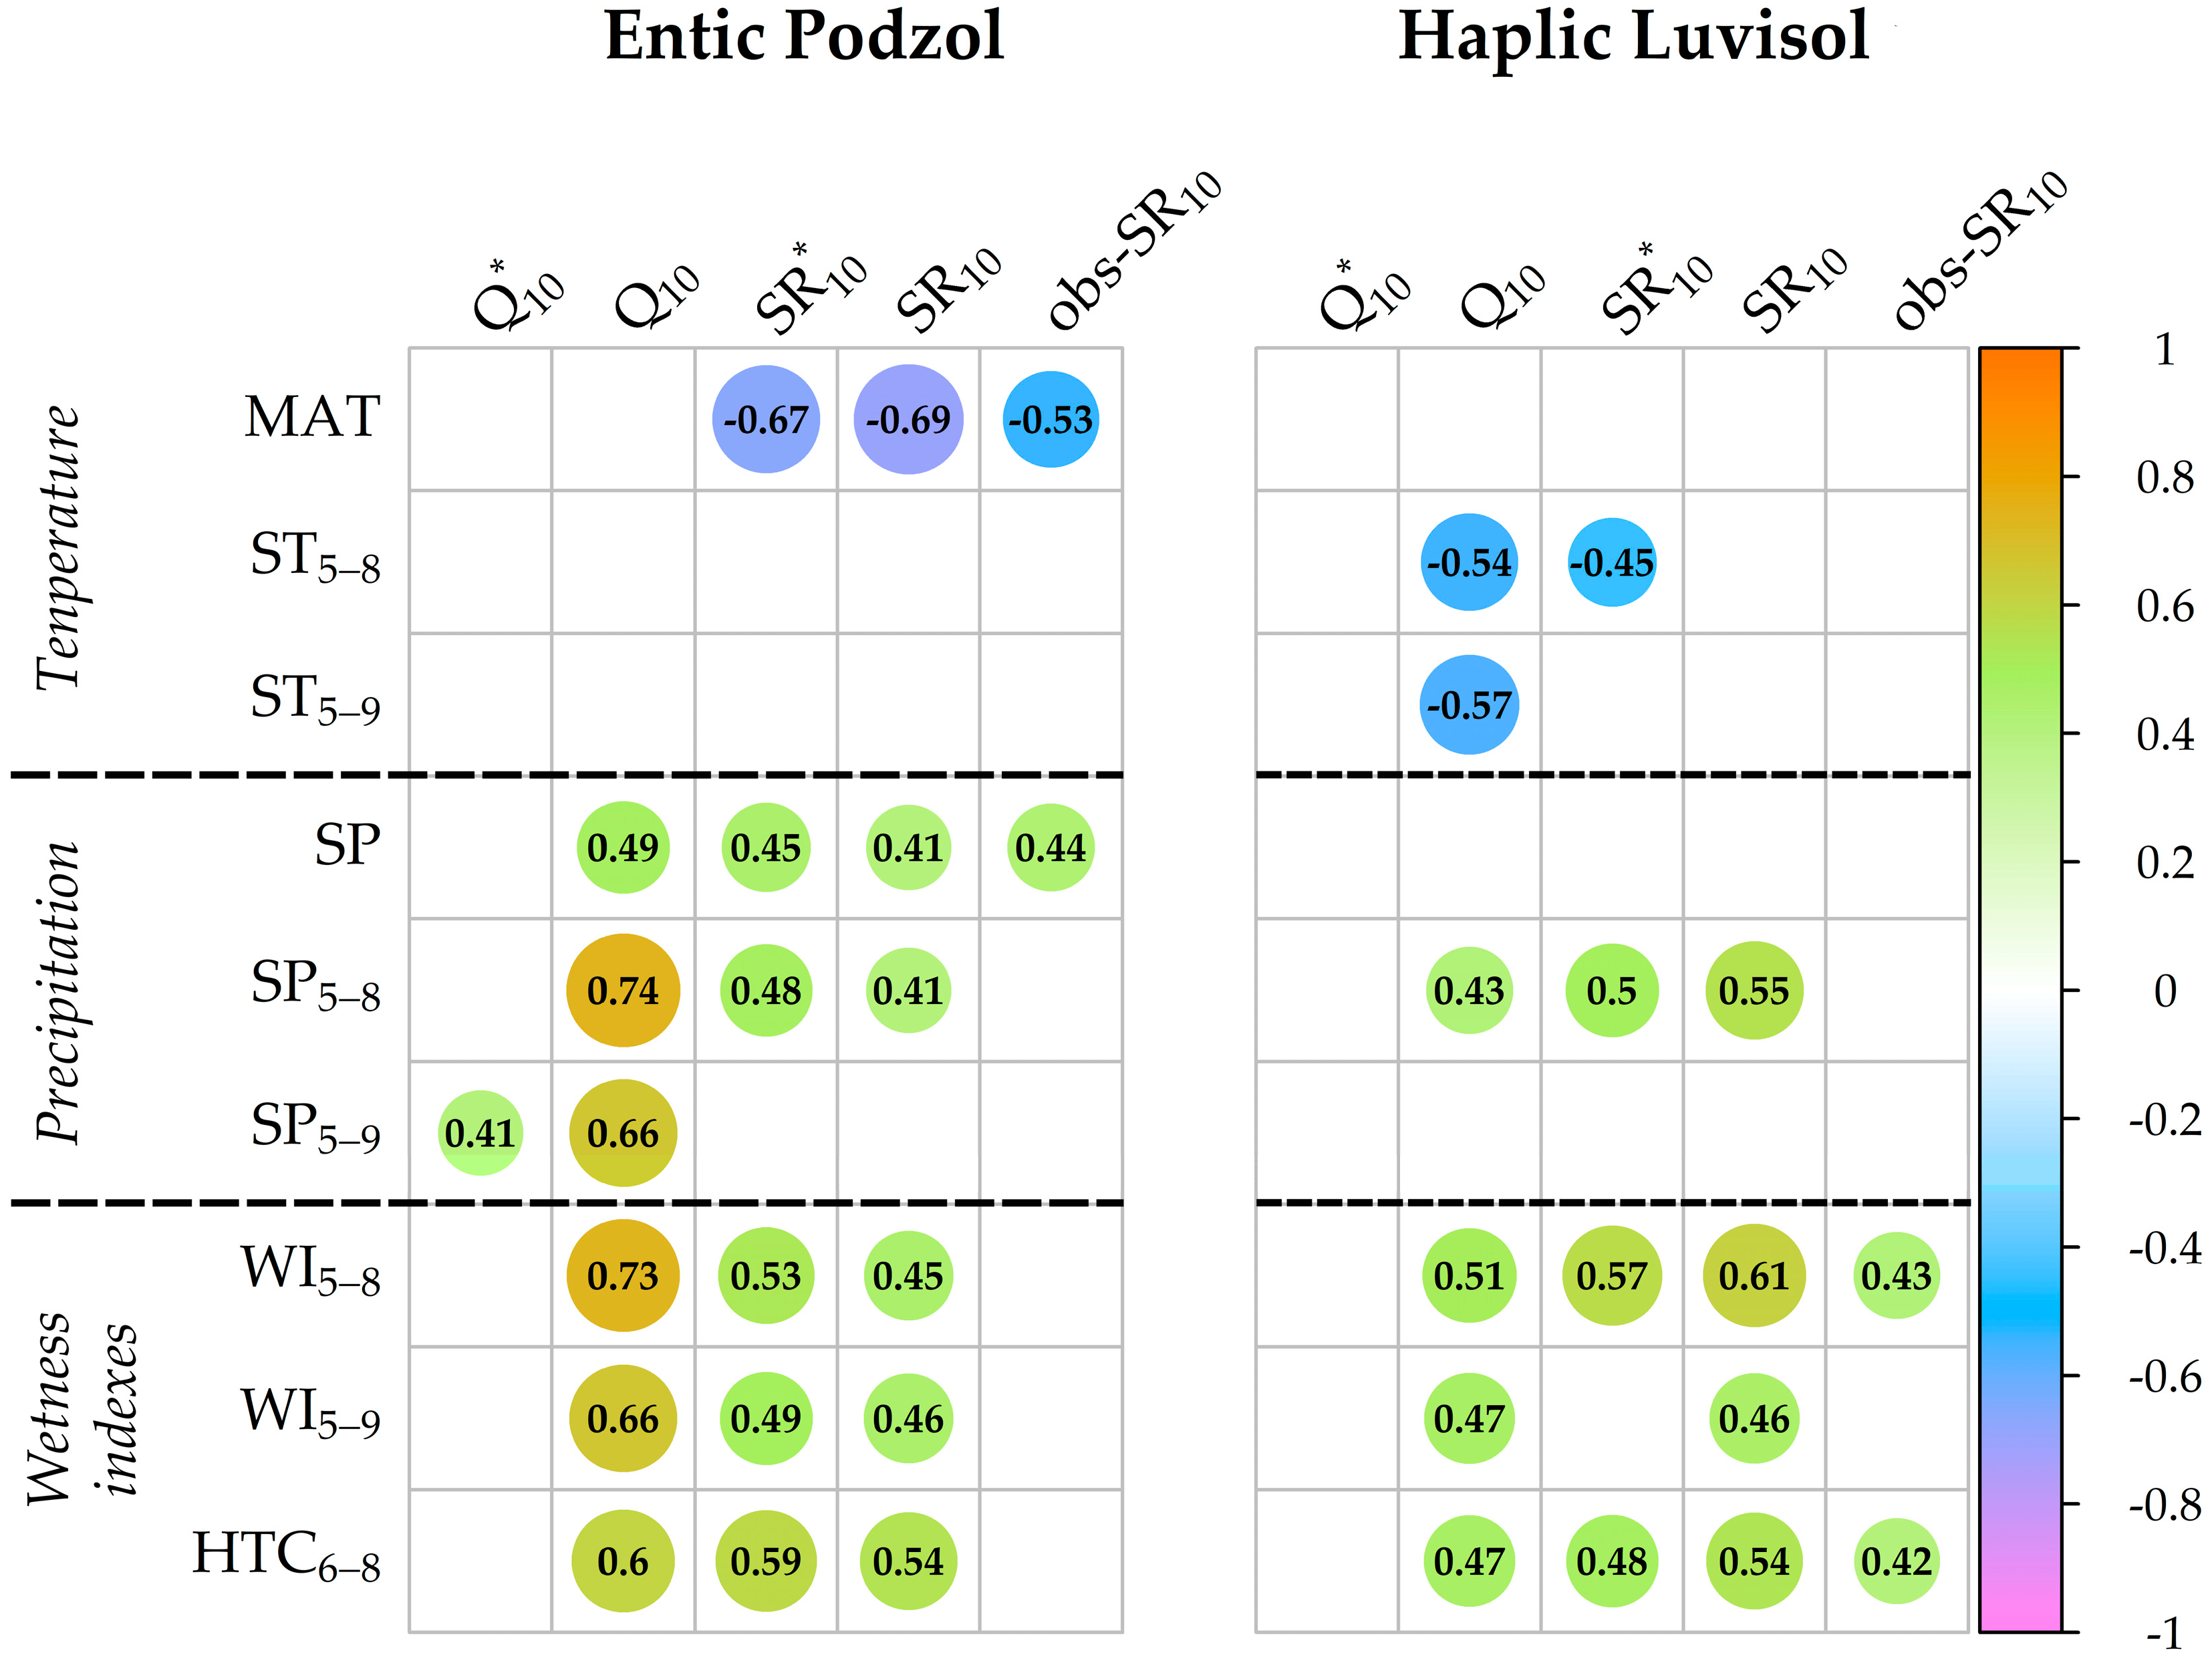
3.7. Relationship between the Q10 and SR10 Values and Meteorological Indexes over the 24-Year Observation Period

A negative relationship between the Q10 values and some temperature indexes (ST5–8 and ST5–9) was observed in the loamy Haplic Luvisol (Figure 7). Additionally, the Q10 values correlated positively with SP5–8. In the Entic Podzol, a positive correlation was found between the Q10 values and all precipitation indexes. For both soils, we observed a positive relationship between the temperature sensitivity of SR at Ts ≥ 1 °C and the wetness indexes. The identical coefficients of correlation were usually higher in the sandy Entic Podzol in comparison with the loamy Haplic Luvisol. The meteorological indexes had no significant effect on the Q*10 values, except for the positive correlation between the Q*10 values and SP5–9 in the Entic Podzol.
Over the whole observation period, the SR*10 and SR10 values in the sandy Entic Podzol demonstrated a significant positive correlation with the wetness indexes, SP and SP5–8. Additionally, the SR*10 and SR10 values were negatively correlated with MAT (Figure 7). In the loamy Haplic Luvisol, the SR10 values correlated positively with all wetness indexes and SP5–8. The SR*10 values in this soil demonstrated a negative relationship with ST5–8 and a positive correlation with SP5–8, WI5–8 and HTC6–8. The obs-SR10 value in the Entic Podzol correlated negatively with MAT and positively with SP, whereas the obs-SR10 value in the Haplic Luvisol positively correlated with WI5–8 and HTC6–8.

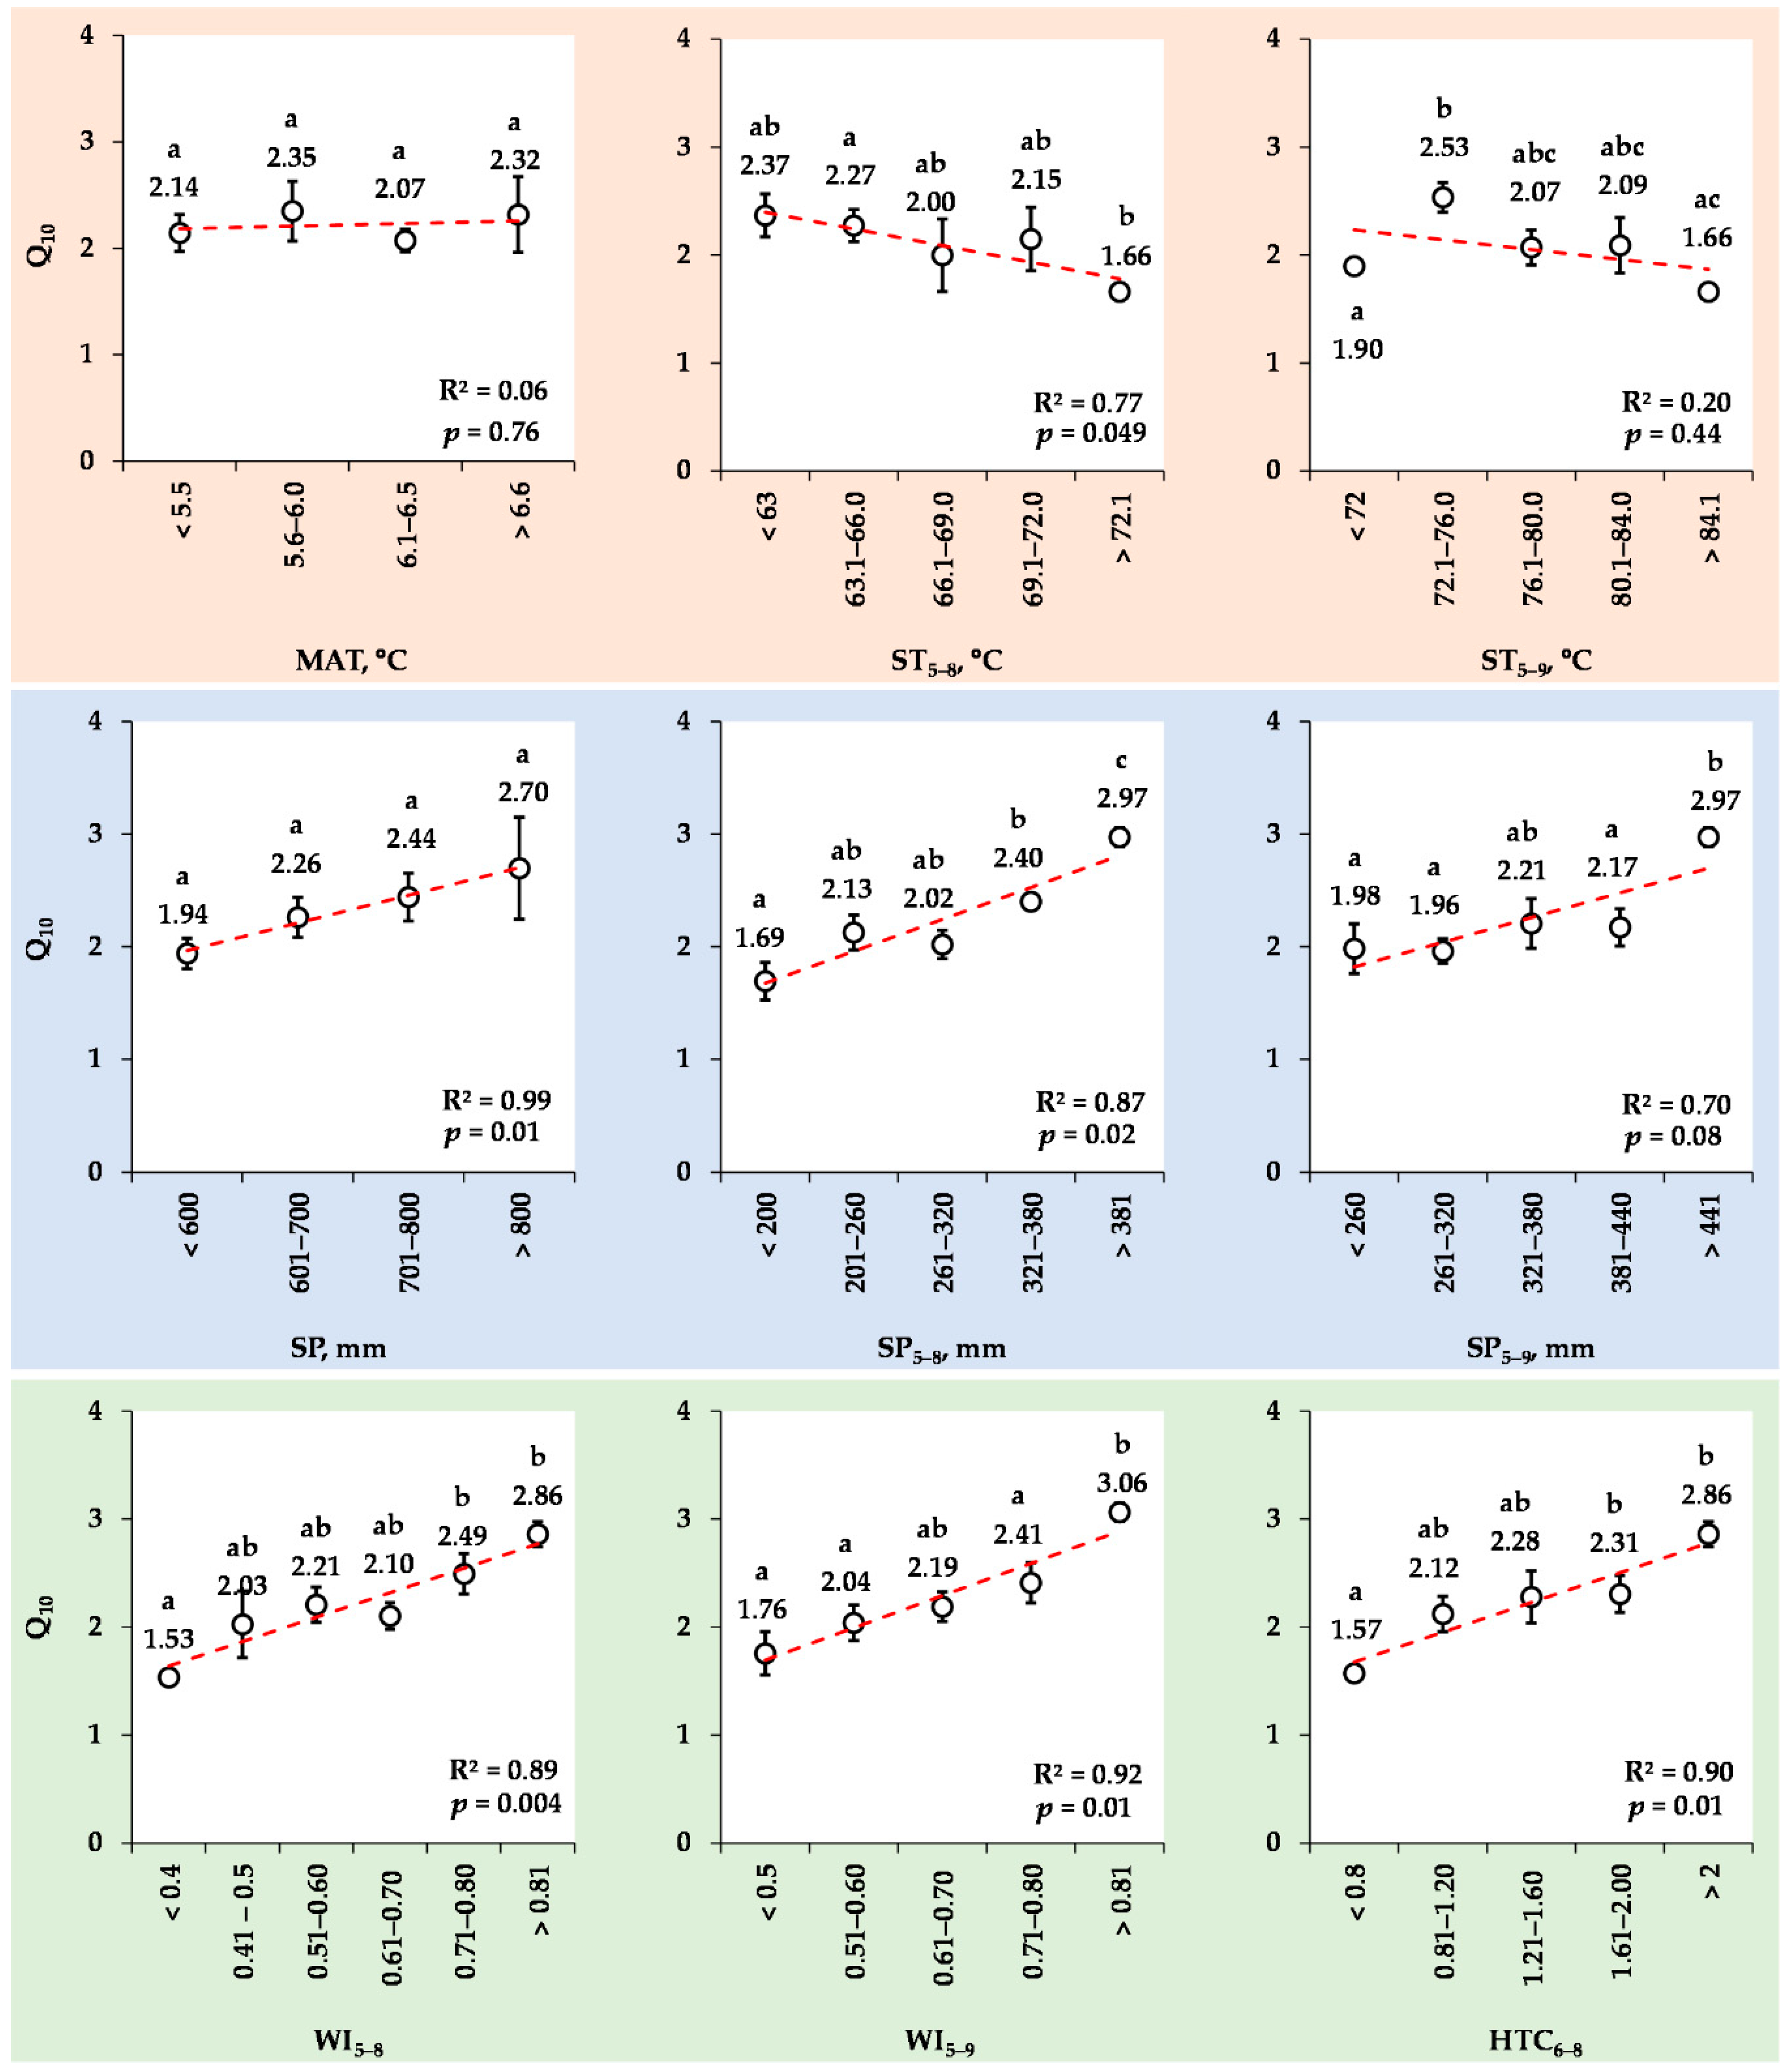
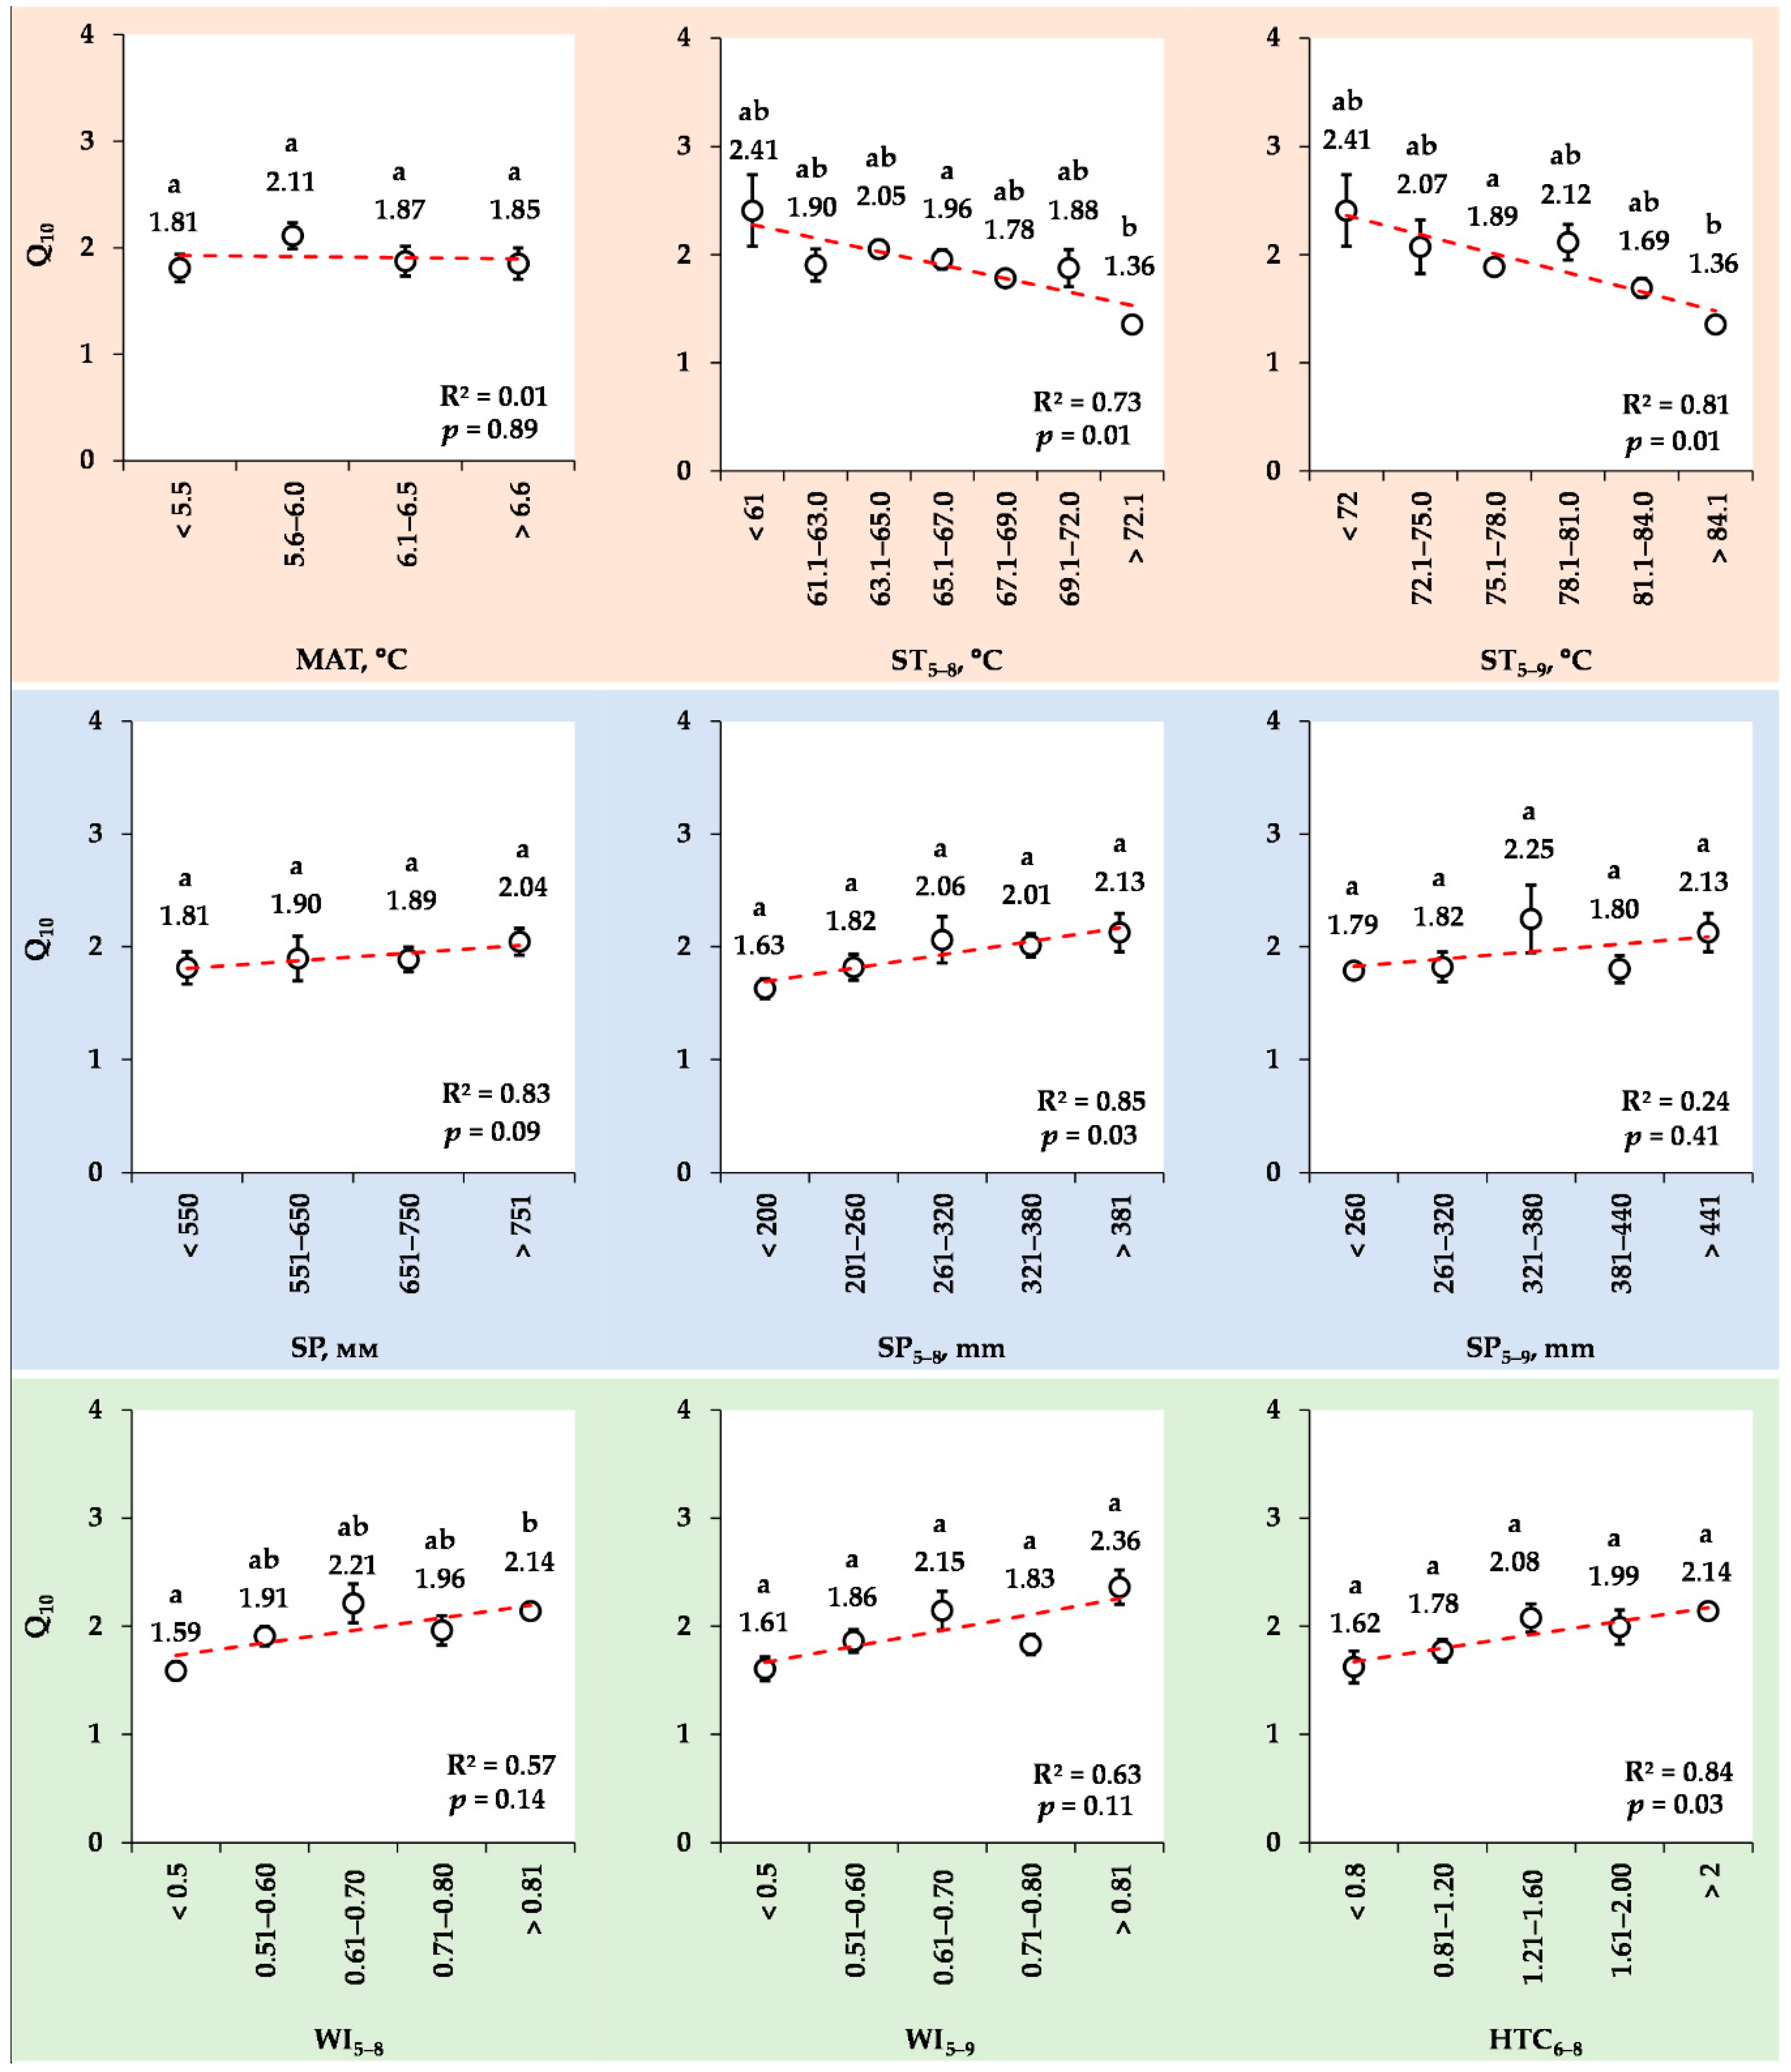
3.8. Changes in the Mean Q10 Values for Various Ranks of Meteorological Indexes

The mean values of Q10 in the sandy Entic Podzol negatively responded to the growth of the rank values ST5–8 and ST5–9. At the same time, they demonstrated a positive response to the increase in the rank values SP, SP5–8 and SP5–9 and all the wetness indexes, which were responsible for 70–99% of the variability in the rank mean Q10 values (Figure 8). The lowest Q10 values (mean ± se) were observed at SP5–8 ≤ 200 mm (Q10 = 1.69 ± 0.17), WI5–8 ≤ 0.40 (Q10 = 1.56 ± 0.17), WI5–9 ≤ 0.50 (Q10 = 1.76 ± 0.20) and HTC6–8 ≤ 0.80 (Q10 = 1.57 ± 0.06). The highest Q10 values were observed at SP5−8 ≥ 381 mm, SP5–9 ≥ 441 mm (Q10 = 2.97 ± 0.08), WI5–8 ≥ 0.71 (Q10 = 2.86 ± 0.12), WI5–9 ≥ 0.81 (Q10 = 3.06 ± 0.09) and HTC6–8 ≥ 2.01 (Q10 = 2.86 ± 0.12).
Similar to the sandy Entic Podzol, the mean values of Q10 in the loamy Haplic Luvisol also negatively responded to the growth of the rank values ST5–8 and ST5–9, which were responsible for 73%−81% of their variability (Figure 9). At the same time, the rank mean Q10 values demonstrated a positive response to the increase in the rank values SP, SP5–8 and SP5–9 and all the wetness indexes. However, these positive relationships were less close than they were in the sandy Podzol, explaining 24%–85% of variability in the rank mean Q10 values.
The lowest Q10 values were observed at ST5–8 ≥ 72.1 °C, ST5–9 ≥ 84.1 °C (Q10 = 1.36 ± 0.02), SP5–8 ≤ 200 mm (Q10 = 1.63 ± 0.09), WI5–8 ≤ 0.50 (Q10 = 1.59 ± 0.08), WI5–9 ≤ 0.50 (Q10 = 1.61 ± 0.11) and HTC6–8 ≤ 0.80 (Q10 = 1.62 ± 0.15). The highest Q10 values were observed at ST5–8 ≤ 61 °C, ST5–9 ≤ 72 °C (Q10 = 2.41 ± 0.33), SP5–8 ≥ 381 mm (Q10 = 2.13 ± 0.17), WI5–9 ≥ 0.81 (Q10 = 2.36 ± 0.16) and HTC6–8 ≥ 2.0 (Q10 = 2.14 ± 0.06).

4. Discussion

4.1. Impacts of Internal and External Factors on the Temperature Sensitivity of Soil Respiration

The Q10 values based on the field measurements of SR depend on the observation period, which may cover the entire year or be limited to the growing season [49]. The range of soil temperatures for estimating the Q10 values can vary markedly, especially in boreal regions, where freezing events are typical in soils. In the soils studied, the Ts at 5 cm varied from −5.5 to 21.6 °C during the observation period (Figure 3), indicating that the soils were regularly subjected to freeze-thaw processes. This remarkable increase in the SR rate due to the soil thawing is well known [47,50,51,52]; the Q10 can reach very high values (10.5–36.6) over the thawing period [46,53,54]. To avoid confusing our results with the effect of the SR burst on the estimations of the SR temperature sensitivity, we calculated the Q10 values for the full range of Ts (Q*10) and for Ts above 1 °C (Q10). This procedure allowed us to decrease the interannual variability of the Q10 values (Figure 3), to identify the key indicators controlling the magnitude of Q10 (Figure 7, Figure 8 and Figure 9), and to correctly compare the temperature sensitivity of the forest soils in various bio-climatic regions where the regular processes of freezing-thawing of the soils are absent.
According to our estimations, the temperature sensitivity of SR in the soils studied in the positive range of Ts was lower by a factor of 1.2 than the corresponding Q*10 values within the full range of Ts, amounting to 1.78 and 2.10 for the Haplic Luvisol and Entic Podzol, respectively (Figure 3). This was in agreement with the results of reports on field studies in Japanese forest soils (40 sites); there, the mean Q10 value was 2.12, ranging between 1.30 and 3.17 [55]. The Q10 values in China’s forests range from 1.10 to 5.18 depending on the climatic and geographical factors, with a mean value of 2.51 [56]. A higher temperature sensitivity of SR was demonstrated in the pine forest of the middle taiga (Komi Republic, Russia), for which the average Q10 value was 3.06 over the period between 2014 and 2017 [57]. The temperature sensitivity of soil respiration in a mountain larch forest in in Northeast China was estimated between 5.6 and 7.2 at different depths (0, 5 and 10 cm) within a positive interval of Ts [54]. On a global scale, the area-weighted mean values of Q10 in different types of forest vary from 1.50 to 1.75 [11]. Therefore, the temperature sensitivity of SR in the forest ecosystems in European Russia in a temperate-continental climate was slightly higher in comparison with the average worldwide values of Q10 for forest soils and lower than the Q10 values of SR in the forests of the colder Eurasian regions.
In regard to our results, both the Q*10 and Q10 values in sandy the Entic Podzol were higher than in loamy the Haplic Luvisol, whereas the estimated SR*10 and SR10 values were identical in both soils (Figure 3). The higher temperature sensitivity of microbial respiration in the sandy Entic Podzol in comparison with the loamy Haplic Luvisol was revealed at an early stage in the short incubation experiments at various levels of soil moisture [58]. Assuming the equal contributions of root respiration to the total SR in both forest soils, the difference in the temperature sensitivity of their SR could be caused by the distinctions in soil texture, which is responsible for water supply in the dry summer period and for the filtration of excess water over the wet seasons. Thus, the respiration of the sandy soils may be more sensitive to water stress, and less suppressed due to the moisture oversaturation, than the respiration of clay soils. Our results demonstrated a remarkable decrease in the Q*10 and Q10 values in both soils during the dry years compared to the period with normal levels of humidity (Table 2). For the wet years, in comparison to the normal ones, the temperature sensitivity of SR reduced more considerably in the loamy Luvisol than in the sandy Podzol. The moisture limitation during the dry years also resulted in a considerable decrease in the SR*10 and SR10 values, whereas the effect of the high humidity levels was very weak or absent.
The studied forest soils markedly differed in their substrate quality, namely the stock and the composition of the forest litter [38], the content of organic C, the C/N ratio and the pH value (Table 1), as well as the content of microbial C [58]. Clay soils usually contain more recalcitrant (or mineral-associated) organic C than sandy soils, which are more enriched by labile components of soil organic matter (SOM) [59]. It is considered that the quality and the degradability of SOM is an important regulator of Q10 [25]. However, up to the present time, it has been actively debated whether the decomposition of labile and recalcitrant SOM pools is equally sensitive to the temperature increase. Some studies demonstrated that recalcitrant and complex SOM compounds are more sensitive to warming than fresh and labile organic substrates [27,60,61]. Others have reported higher temperature sensitivities for less recalcitrant SOM [62,63,64,65], or identical Q10 values among various SOM pools [66,67]. Therefore, the temperature sensitivity of SR in the studied forest soils was caused by the confounded effects of internal factors such as soil texture, SOM content and composition, as well as levels of humidity or aridity (external factors). The SR10 values were relatively independent from the internal features of the soils studied, but they reacted to the moisture limitation.

4.2. Seasonal Variability of the Temperature Sensitivity of Soil Respiration

Today, there is evidence indicating that the temperature sensitivity of SR is not constant throughout the year and changes with the seasons [33,37,54]. In general, Q10 values are maximal in the cold period and decline with the temperature increase [11,12,64]. In line with many previous studies, our results indicated a clear seasonal dynamic of Q*10 in both studied soils, with the highest values (3.23 and 6.54) in the winter period and the lowest ones (1.03 and 1.55) over the summer season (Table 3). Therefore, our results fully support the seasonal plasticity hypothesis [68], which suggests that the microbial activity and enzyme structure adapts evolutionarily or acclimates physiologically in response to seasonal changes in temperature and thermal constraints. Often, these processes are characterized by higher temperature sensitivities in colder environments and their decline with increasing temperatures.
However, the pattern of seasonal dynamics in Q10 values may vary due to the large spatial heterogeneity in climatic and hydrothermal conditions, as well as in the SOM quality and decomposability [25,54]. For instance, in the larch mountain forests in Northeast China, soil respiration rates were most sensitive to temperature changes in the early stage of near-surface soil thawing (Q10 = 11.5–36.6) and in the middle of the growing period (Q10 = 6.5–40.2), reflecting the higher responsiveness of SR to changes in hydrometeorology and ground freeze-thaw processes [54]. A strong effect of the climatic zone on the seasonal dynamics of the temperature sensitivity of SR was revealed in an incubation experiment on soils located along the latitude gradient of eastern China [69]. In identical natural mixed forests, the spring and autumn temperature sensitivities of SR increased toward the southern region, but the Q10 values were similar across the latitude gradient in summer. It was suggested that the summer Q10 values were closely associated with the dominance of microbial r-strategy features, characterized by high copiotroph/oligotroph and labile/recalcitrant C degradation gene ratios. The spring Q10 values were independent of the microbial community composition and functions, increasing with the reducing C availability from north to south. At the same time, the autumn Q10 values were driven by the K-selected microbial communities, which may be ascribed to the priming effects mediated by fresh plant litter [69]. Therefore, the microbial community composition and exo-enzyme production vary considerably in response to the seasonal changes in substrate and nutrient availability, which might be one of the reasons for the seasonal dynamic in the Q10 values [20,37,70].
Davidson et al. [19] reported that SR always exhibited higher Q10 values in spring than in fall, perhaps because of springtime root growth and a hysteresis phenomenon based on soil temperatures, which were measured at a fixed depth, that resulted in varying levels of CO2 production over the spring and fall seasons. In our study, both the Q*10 and Q10 values exhibited the same ratio only for the SR of the clay Haplic Luvisol in the secondary deciduous forest, whereas in the sandy Entic Podzol in the mixed mature forest, the Q*10 and Q10 values over spring and fall time were almost equal (Table 3). This difference in spring–fall Q10 pattern can be explained by various dynamics in the available substrate concentrations in the soils studied. Due to the faster turnover of forest litter in the SF site compared to the MMF one (0.9 vs. 2.8 year) [71], there is a deficit of easily decomposable SOM in the clay Haplic Luvisol during the late summer and fall periods, whereas the sandy Entic Podzol is characterized by a nearly constant concentration of available C throughout the year. The estimated SR*10 and SR10 values were more or less identical in both soils during spring and fall seasons (Table 3), indicating their independence from the seasonal dynamics of the external and internal factors.
Thus, the seasonal dynamic in the temperature sensitivity of SR in the forest soils was caused by changes in both external (or abiotic) factors, such as hydrometeorology and freeze-thaw processes, and internal (or biotic) ones, including the dynamics in the litter input and its turnover, supplied substrate quality and availability, and the ability and strategy of the microbial community in decomposing SOM. For a better understanding of the seasonal dynamic in the Q10 values in the studied forest soils, year-round measurements of SR should be accompanied by the monitoring of the monthly dynamics in the substrate and nutrient availability for the decomposer microorganisms.

4.3. Interannual Variability of the Temperature Sensitivity of SR in the Forest Ecosystems

In many ecosystem carbon cycle models, it is generally suggested that the temperature sensitivity of SR is constant from year to year [12,72]. Understanding the factors controlling the interannual variability in the temperature sensitivity of SR in soils under temperate-continental climate conditions is crucial for improving our ability to assess climate feedback in the future. Some published studies have clearly demonstrated a rather wide range of the Q10 values from year to year in individual ecosystems. For instance, Osipov et al. [57] reported that the temperature sensitivity of SR over the growing season in the pine forest of the middle taiga (Komi Republic, Russia) ranged from 2.2 to 3.7 over the period between 2014 and 2017. In the sub-alpine forests (Eastern Qinghai-Tibet Plateau, China) over the period of 2004–2006, the Q10 values of the growing season varied between 3.96 and 6.82 [33]. In the Tibetan alpine grassland, the temperature sensitivity of SR varied between 2.89–5.59 and 2.29–2.89 during the growing and non-growing periods, respectively, over a 4-year observation period (2009–2012) [32].
In regard to the results of the 24-year observation presented in this study, the temperature sensitivity of SR demonstrated a high temporal interannual variability (Figure 4; Table S3), with coefficients of variation (CV) = 33%–40% for Q*10 (range 1.33–2.74) and 18%–23% for Q10 (range 1.48–6.29). The lowest Q10 values for SR in both studied soils (1.4–1.7) were registered over the dry years (e.g., 2002, 2007 and 2010), which were characterized by the lowest wetness indexes and HTC6–8 values (Figure 2, Table S1). Therefore, our data support the first hypothesis, that the moisture availability is a key factor influencing the temperature sensitivity of soil respiration in forest ecosystems in temperate-continental climates. In general, the increase in the temperature accelerates the microbial respiration due to increases in both the activity of extracellular enzymes that degrade the complex polymeric components of SOM and the rates of microbial uptake of soluble substrates [20,70]. Moisture limitation can suppress the microbial activity, regardless of the temperature, which should result in a reduction in the temperature response of SR to temperature changes [27,32,34]. The temperature sensitivity SR responds to moisture availability because it influences the diffusivity of soluble organic substrates, which is low at low water content, and oxygen diffusivity, which is low at a high water content [11]. The low diffusivity of any soluble substrates at a low water content or the oxygen limitation at a high water content reduces the respiration of soil microbiota [19]. Hence, there is a confounding effect of the main abiotic and biotic factors on the temperature sensitivity of SR, as estimated by the field studies.
The identification of the drivers controlling the temperature sensitivity of SR is usually based on the meta-analysis of field or incubation studies which are carried out along the latitudinal or climatic gradients [11,55]. On the whole, there is a negative relationship of the Q10 values with the temperature and a positive correlation with the soil moisture level. Based on the unique continuous 24-year measurements of SR, we have shown that the main controlling factor for the temperature sensitivity of SR in the sandy Entic Podzol at Ts ≥ 1 °C is the moisture supply during the growing season. There were significant correlations between the Q10 values and wetness/hydrothermal indexes over various periods of the growing season, as well as the precipitation levels over the year and for the late-spring–summer season (Figure 7). In the clay Haplic Luvisol, similar correlations were less pronounced, but additionally, a negative relationship between the Q10 values and the sum of the average temperatures for different periods of the growing season was identified. Therefore, the set of meteorological indexes controlling the interannual variability of the temperature sensitivity of forest soils in temperate-continental climates depends on the soil texture, which is responsible for the water supply during the growing season. The reference values of the SR rate at 10 °C (both SR*10 and SR10) demonstrated a relationships similar to that of Q10, indicating the close relationship between the controlling factors and the mechanisms of their interannual variability. There were no close correlations between the temperature sensitivity of SR at the full range of Ts (Q*10 values) and the studied meteorological indexes. The estimates of the rank correlations between Q10 and the meteorological indices confirmed the relationships described above and allowed us to determine the average values of Q10 for the various ranges of the meteorological indexes (Figure 8 and Figure 9). These Q10 values could be used to estimate the SR rates in forest ecosystems of boreal regions, taking into account the weather conditions of each year studied.
Therefore, we can conclude that our hypothesis was fully confirmed. Our results clearly demonstrated that the water supply, which was determined by the aridity/humidity conditions over the growing season, was a key driver of the interannual variability of the Q10 values in the temperate forest ecosystems, while the soil texture affected the nature of the relationship between the temperature sensitivity of SR and the meteorological indexes. Considering the clear tendency towards climate aridization in the region studied [16] and in many other regions of the world [73], we can predict a reducing temperature sensitivity of soil respiration and assume a rising carbon sink in the boreal and temperate forest ecosystems.

4.4. Research Perspectives in Light of the Current Climate Changes

In the future, the simulation of SR rates employing various Q10 values may be a promising method for improving the accuracy of annual SR flux estimates used for simulating soil carbon sources and sinks in the studied area. To better understand the temporal variation of the Q10 values, the monthly or seasonal monitoring of the substrate and nutrient availability for soil, as well as the composition and strategy of the microbial community, is also needed.
As an extremely sensitive component of the carbon cycle, the SR can reflect the current state of the climate in a region and respond to long-lasting changes in the hydrothermal regime [74]. The last ICCP report [75] informed us that the ability of natural ecosystems to provide carbon storage and sequestration is increasingly influenced by heat, wildfire, droughts and other impacts. In the future, with increasing global warming, more regions in the world will be affected by increases in agricultural, soil and ecological droughts [75,76,77]. For instance, an increase in the frequency and duration of droughts in the territory of the Russian Federation will be observed not only in regions with lower levels of precipitation, but also in regions where there are distinct trends of increasing total humidification levels [76]. Significant correlations between the temperature sensitivity of SR and wetness/hydrothermal indexes over different periods of the growing season, using the average values of Q10 for various ranges of the meteorological indexes which were observed in the present study, will allow us to improve the prognosis of SR fluxes on the local and regional scales.
Regional climate models (RCMs) are an important source of climate information at the regional scale [75,78]. The key reason for enhancing their use as a source of regional information is their high-scale resolution [78,79]. In particular, simulations at a kilometer-scale resolution add value to the prognosis of sub-daily precipitation extremes, soil-moisture–precipitation feedback [75], and trends in seasonal air temperatures [78,79]. This is especially important for regions with complex landscapes [78]. Therefore, the coupled application of RCMs and the findings of the present study could contribute greatly to the assessment of soil respiration fluxes in changing climates.

5. Conclusions

In this study, we conducted a synthesis of the 24-year year-round measurements of soil respiration in two forest ecosystems with temperate-continental climates and estimated, for the first time, the interannual variability of the Q10 values. Additionally, the drivers of seasonal and interannual heterogeneity of the Q10 values were determined. Our results indicated that, when the year-round SR dynamic is investigated, it is reasonable to estimate Q10 functions in the positive range of the soil temperature (Ts ≥ 1 °C) in order to avoid confusing the results with the effect of freezing-thawing on the soil respiration rate and Q10 values. We clearly demonstrated that the main controlling factor of the temperature sensitivity of SR in the sandy Entic Podzol at Ts ≥ 1 °C was the moisture availability during the growing season. There were significant correlations between the Q10 values and wetness/hydrothermal indexes over various periods of the growing season, as well as precipitation levels over the year and for the late spring–summer season. In the clay Haplic Luvisol, similar correlations were less pronounced, but additionally, a negative relationship between the Q10 values and the sum of the average temperatures for different periods of the growing season was found. The estimates of the rank correlations between Q10 and the meteorological indexes allowed us to determine the average values of Q10 for various ranges of more sensitive meteorological parameters. These Q10 values could be used to estimate the SR rates in forest ecosystems of boreal regions, taking into account the weather conditions of each year studied. Under the current trend of climate aridity intensification, we may predict a reduction in the temperature sensitivity of soil respiration and assume a rise in the carbon sink in boreal and temperate forest ecosystems. In the future, a simulation of the SR rate employing various Q10 values can provide a method to improve the accuracy of annual SR flux estimates and simulate the carbon balance in the forest ecosystems.

Supplementary Materials

The following supporting information can be downloaded at: https://0-www-mdpi-com.brum.beds.ac.uk/article/10.3390/f13091374/s1, Table S1: Statistical characteristics for meteorological indexes for the observation period (n = 24); Table S2: Ranks of meteorological indexes for calculation of the Spearmen’s correlation coefficient; Table S3: Statistical characteristics for Q10 and SR10 values for different temperature intervals (n = 24); Figure S1: Correlation between the logarithmic function of the soil respiration rate (Ln(SR)) and soil temperatures (Ts) at 5 cm at the full range of Ts in sandy Entic Podzol in 1998–2009; Figure S2: Correlation between the logarithmic function of the soil respiration rate (Ln(SR)) and soil temperatures at 5 cm (Ts) at the full range of Ts in sandy Entic Podzol in 2010–2021; Figure S3: Correlation between the logarithmic function of the soil respiration rate (Ln(SR)) and soil temperatures (Ts) at 5 cm at the full range of Ts in clay Haplic Luvisol in 1998–2009; Figure S4: Correlation between the logarithmic function of the soil respiration rate (Ln(SR)) and soil temperatures (Ts) at 5 cm at the full range of Ts in clay Haplic Luvisol in 2010−2021; Figure S5: Correlation between the logarithmic function of the soil respiration rate (Ln(SR)) and soil temperatures (Ts) at 5 cm at Ts ≥ 1 °C in sandy Entic Podzol in 1998–2009; Figure S6: Correlation between the logarithmic function of the soil respiration rate (Ln(SR)) and soil temperatures (Ts) at 5 cm at Ts ≥ 1 °C in sandy Entic Podzol in 2010−2021; Figure S7: Correlation between the logarithmic function of the soil respiration rate (Ln(SR)) and soil temperatures (Ts) at 5 cm at Ts ≥ 1 °C in clay Haplic Luvisol in 1998–2009; Figure S8: Correlation between the logarithmic function of the soil respiration rate (Ln(SR)) and soil temperatures (Ts) at 5 cm at Ts ≥ 1 °C in clay Haplic Luvisol in 2010–2021.

Author Contributions

Conceptualization, I.K.; methodology, V.L.d.G.; investigation, D.S., T.M., V.L.d.G., D.K. and V.Z.; writing—original draft preparation, I.K.; writing—review and editing, I.K.; visualization—D.K. and V.L.d.G. All authors have read and agreed to the published version of the manuscript.

Funding

This research was funded by Russian Scientific Foundation (grant number 22-24-00691).

Institutional Review Board Statement

Not applicable.

Informed Consent Statement

Not applicable.

Data Availability Statement

The data presented in this study are available upon request from the corresponding author.

Acknowledgments

We are grateful to Vera Ableeva (Atmospheric Monitoring Station, Prioksko-Terrasny State Biospheres Reserve, Danki, Moscow region, Russia) for providing the meteorological data set for 1973–2021. We are very thankful to Anna López de Guereñu (University of Potsdam, Germany) for the grammatical and stylistic editing of the English. We also thank the two anonymous reviewers for their constructive comments, which helped us to improve the manuscript.

Conflicts of Interest

The authors declare no conflict of interest.

References

  1. Le Quéré, C.; Moriarty, R.; Andrew, R.M.; Peters, G.P.; Ciais, P.; Friedlingstein, P.; Jones, S.D.; Sitch, S.; Tans, P.; Arneth, A.; et al. Global carbon budget 2014. Earth Syst. Sci. Data 2015, 7, 47–85. [Google Scholar] [CrossRef]
  2. Gauthier, S.; Bernier, P.; Kuuluvainen, T.; Shvidenko, A.Z.; Schepaschenko, D.G. Boreal forest health and global change. Science 2015, 349, 819–822. [Google Scholar] [CrossRef] [PubMed]
  3. Shvidenko, A.Z.; Schepaschenko, D.G. Carbon Budget of Russian Forests. Sib. J. For. Sci. 2014, 1, 69–92. [Google Scholar]
  4. Ciais, P.; Soussana, J.F.; Vuichard, N.; Luyssaert, S.; Don, A.; Janssens, I.A.; Piao, S.L.; Dechow, R.; Lathière, J.; Maignan, F.; et al. The Greenhouse Gas Balance of European Grasslands. Biogeosci. Discuss. 2010, 7, 5997–6050. [Google Scholar] [CrossRef]
  5. Kurganova, I.N.; Kudeyarov, V.N. Ecosystems of Russia and Global Carbon Budget. Sci. Russ. 2012, 5, 25–32. [Google Scholar]
  6. Raich, J.W.; Tufekcioglu, A. Vegetation and soil respiration: Correlations and controls. Biogeochemistry 2000, 48, 71–90. [Google Scholar] [CrossRef]
  7. Schlesinger, W.H.; Andrews, J.A. Soil respiration and the global carbon cycle. Biogeochemistry 2000, 48, 7–20. [Google Scholar] [CrossRef]
  8. Xu, M.; Shang, H. Contribution of soil respiration to the global carbon equation. J. Plant Physiol. 2016, 203, 16–28. [Google Scholar] [CrossRef]
  9. Bond-Lamberty, B.; Thomson, A. A global database of soil respiration data. Biogeosciences 2010, 7, 1915–1926. [Google Scholar] [CrossRef]
  10. Rustad, L.E.; Huntington, T.G.; Boone, R.D. Controls on soil respiration: Implications for climate change. Biogeochemistry 2000, 48, 1–6. [Google Scholar] [CrossRef]
  11. Zhou, T.; Shi, P.; Hui, D.; Luo, Y. Global pattern of temperature sensitivity of soil heterotrophic respiration (Q10) and its implications for carbon-climate feedback. J. Geophys. Res. Biogeosci. 2009, 114, G02016. [Google Scholar] [CrossRef]
  12. Han, M.; Jin, G. Seasonal variations of Q10 soil respiration and its components in the temperate forest ecosystems, northeastern China. Eur. J. Soil Biol. 2018, 85, 36–42. [Google Scholar] [CrossRef]
  13. Kudeyarov, V.N.; Kurganova, I.N. Respiration of Russian Soils: Database Analysis, Long-Term Monitoring, and General Estimates. Eurasian Soil Sci. 2005, 38, 983–992. [Google Scholar]
  14. Mukhortova, L.; Schepaschenko, D.; Moltchanova, E.; Shvidenko, A.; Khabarov, N.; See, L. Respiration of Russian soils: Climatic drivers and response to climate change. Sci. Total Environ. 2021, 785, 147314. [Google Scholar] [CrossRef]
  15. Giasson, M.-A.; Ellison, A.M.; Bowden, R.D.; Crill, P.M.; Davidson, E.A.; Drake, J.E.; Frey, S.D.; Hadley, J.L.; LaVine, M.; Melillo, J.M.; et al. Soil respiration in a northeastern US temperate forest: A 22-year synthesis. Ecosphere 2013, 4, art140. [Google Scholar] [CrossRef]
  16. Kurganova, I.N.; Lopes de Gerenyu, V.O.; Khoroshaev, D.A.; Myakshina, T.N.; Sapronov, D.V.; Zhmurin, V.A.; Kudeyarov, V.N. Analysis of the Long-Term Soil Respiration Dynamics in the Forest and Meadow Cenoses of the Prioksko-Terrasny Biosphere Reserve in the Perspective of Current Climate Trends. Eurasian Soil Sci. 2020, 53, 1421–1436. [Google Scholar] [CrossRef]
  17. Kurganova, I.N.; Lopes de Gerenyu, V.O.; Myakshina, T.N.; Sapronov, D.V.; Khoroshaev, D.A.; Zhmurin, V.A. The Temporal Variability of Respiration of a Soddy-Podzolic Soil in Forest and Meadow Coenoses of the South-Taiga Zone. Mosc. Univ. Soil Sci. Bull. 2022, 77, 74–82. [Google Scholar] [CrossRef]
  18. Reichstein, M.; Rey, A.; Freibauer, A.; Tenhunen, J.; Valentini, R.; Banza, J.; Casals, P.; Cheng, Y.; Grünzweig, J.M.; Irvine, J.; et al. Modeling temporal and large-scale spatial variability of soil respiration from soil water availability, temperature and vegetation productivity indices. Glob. Biogeochem. Cycles 2003, 17. [Google Scholar] [CrossRef]
  19. Davidson, E.A.; Janssens, I.A.; Luo, Y. On the variability of respiration in terrestrial ecosystems: Moving beyond Q10. Glob. Chang. Biol. 2006, 12, 154–164. [Google Scholar] [CrossRef]
  20. Suseela, V.; Conant, R.T.; Wallenstein, M.D.; Dukes, J.S. Effects of soil moisture on the temperature sensitivity of heterotrophic respiration vary seasonally in an old-field climate change experiment. Glob. Chang. Biol. 2012, 18, 336–348. [Google Scholar] [CrossRef]
  21. Bahn, M.; Reichstein, M.; Davidson, E.A.; Grünzweig, J.; Jung, M.; Carbone, M.S.; Epron, D.; Misson, L.; Nouvellon, Y.; Roupsard, O.; et al. Soil respiration at mean annual temperature predicts annual total across vegetation types and biomes. Biogeosciences 2010, 7, 2147–2157. [Google Scholar] [CrossRef] [PubMed]
  22. Friedlingstein, P.; Dufresne, J.-L.; Cox, P.M.; Rayner, P. How positive is the feedback between climate change and the carbon cycle? Tellus B Chem. Phys. Meteorol. 2003, 55, 692–700. [Google Scholar] [CrossRef]
  23. Luo, Y. Terrestrial Carbon-Cycle Feedback to Climate Warming. Annu. Rev. Ecol. Evol. Syst. 2007, 38, 683–712. [Google Scholar] [CrossRef] [Green Version]
  24. Kirschbaum, M.U.F. The temperature dependence of soil organic matter decomposition, and the effect of global warming on soil organic C storage. Soil Biol. Biochem. 1995, 27, 753–760. [Google Scholar] [CrossRef]
  25. Meyer, N.; Welp, G.; Amelung, W. The Temperature Sensitivity (Q10) of Soil Respiration: Controlling Factors and Spatial Prediction at Regional Scale Based on Environmental Soil Classes. Glob. Biogeochem. Cycles 2018, 32, 306–323. [Google Scholar] [CrossRef]
  26. Foereid, B.; Ward, D.S.; Mahowald, N.; Paterson, E.; Lehmann, J. The sensitivity of carbon turnover in the Community Land Model to modified assumptions about soil processes. Earth Syst. Dyn. 2014, 5, 211–221. [Google Scholar] [CrossRef]
  27. Davidson, E.A.; Janssens, I.A. Temperature sensitivity of soil carbon decomposition and feedbacks to climate change. Nature 2006, 440, 165–173. [Google Scholar] [CrossRef]
  28. Gritsch, C.; Zimmermann, M.; Zechmeister-Boltenstern, S. Interdependencies between temperature and moisture sensitivities of CO2 emissions in European land ecosystems. Biogeosciences 2015, 12, 5981–5993. [Google Scholar] [CrossRef]
  29. Hamdi, S.; Moyano, F.; Sall, S.; Bernoux, M.; Chevallier, T. Synthesis analysis of the temperature sensitivity of soil respiration from laboratory studies in relation to incubation methods and soil conditions. Soil Biol. Biochem. 2013, 58, 115–126. [Google Scholar] [CrossRef]
  30. Boone, R.D.; Nadelhoffer, K.J.; Canary, J.D.; Kaye, J.P. Roots exert a strong influence on the temperature sensitivityof soil respiration. Nature 1998, 396, 570–572. [Google Scholar] [CrossRef]
  31. Xu, M.; Qi, Y. Soil-surface CO2 efflux and its spatial and temporal variations in a young ponderosa pine plantation in northern California: Soil-Surface CO2 Efflux and Its Variation. Glob. Chang. Biol. 2001, 7, 667–677. [Google Scholar] [CrossRef]
  32. Wang, Y.; Liu, H.; Chung, H.; Yu, L.; Mi, Z.; Geng, Y.; Jing, X.; Wang, S.; Zeng, H.; Cao, G.; et al. Non-growing-season soil respiration is controlled by freezing and thawing processes in the summer monsoon-dominated Tibetan alpine grassland. Glob. Biogeochem. Cycles 2014, 28, 1081–1095. [Google Scholar] [CrossRef]
  33. Chen, B.; Liu, S.; Ge, J.; Chu, J. Annual and seasonal variations of Q10 soil respiration in the sub-alpine forests of the Eastern Qinghai-Tibet Plateau, China. Soil Biol. Biochem. 2010, 42, 1735–1742. [Google Scholar] [CrossRef]
  34. Xu, M.; Qi, Y. Spatial and seasonal variations of Q10 determined by soil respiration measurements at a Sierra Nevadan Forest. Glob. Biogeochem. Cycles 2001, 15, 687–696. [Google Scholar] [CrossRef]
  35. Janssens, I.A.; Pilegaard, K. Large seasonal changes in Q10 of soil respiration in a beech forest. Glob. Chang. Biol. 2003, 9, 911–918. [Google Scholar] [CrossRef]
  36. Shabaga, J.A.; Basiliko, N.; Caspersen, J.P.; Jones, T.A. Seasonal controls on patterns of soil respiration and temperature sensitivity in a northern mixed deciduous forest following partial-harvesting. For. Ecol. Manag. 2015, 348, 208–219. [Google Scholar] [CrossRef]
  37. Noh, N.J.; Kuribayashi, M.; Saitoh, T.M.; Muraoka, H. Different responses of soil, heterotrophic and autotrophic respirations to a 4-year soil warming experiment in a cool-temperate deciduous broadleaved forest in central Japan. Agric. For. Meteorol. 2017, 247, 560–570. [Google Scholar] [CrossRef]
  38. Kurganova, I.N.; Lopes de Gerenyu, V.O.; Myakshina, T.N.; Sapronov, D.V.; Savin, I.Y.; Shorohova, E.V. Carbon Balance in Forest Ecosystems of Southern Part of Moscow Region under a Rising Aridity of Climate. Contemp. Probl. Ecol. 2017, 10, 748–760. [Google Scholar] [CrossRef]
  39. Larionova, A.A.; Rozanova, L.N.; Samoylov, T.I. Dynamics of Gas Exchange in the Profile of a Gray Forest Soil. Sov. Soil Sci. 1989, 21, 104–110. [Google Scholar]
  40. Kurganova, I.; Lopes de Gerenyu, V.; Rozanova, L.; Sapronov, D.; Myakshina, T.; Kudeyarov, V. Annual and seasonal CO2 fluxes from Russian southern taiga soils. Tellus B Chem. Phys. Meteorol. 2003, 55, 338–344. [Google Scholar] [CrossRef]
  41. Lopes de Gerenyu, V.O.; Kurganova, I.N.; Rozanova, L.N.; Kudeyarov, V.N. Annual Emission of Carbon Dioxide from Soils of the Southern Taiga Soils of Russia. Eurasian Soil Sci. 2001, 34, 931–944. [Google Scholar]
  42. Panikov, N.S.; Gorbenko, A.J. The Dynamics of Gas Exchange between Soil and Atmosphere in Relation to Plant-Microbe Interactions: Fluxes Measuring and Modelling. Ecol. Bull. 1992, 42, 53–61. [Google Scholar]
  43. Lei, Y.; Liu, Y.; Song, H.; Sun, B. A wetness index derived from tree-rings in the Mt. Yishan area of China since 1755 AD and its agricultural implications. Chin. Sci. Bull. 2014, 59, 3449–3456. [Google Scholar] [CrossRef]
  44. Pavelka, M.; Acosta, M.; Marek, M.V.; Kutsch, W.; Janouš, D. Dependence of the Q10 values on the depth of the soil temperature measuring point. Plant Soil 2007, 292, 171–179. [Google Scholar] [CrossRef]
  45. Humphreys, E.R.; Andrew Black, T.; Morgenstern, K.; Li, Z.; Nesic, Z. Net ecosystem production of a Douglas-fir stand for 3 years following clearcut harvesting. Glob. Chang. Biol. 2005, 11, 450–464. [Google Scholar] [CrossRef]
  46. Kurganova, I.N.; Tipe, P. The Effect of Freezing-Thawing Processes on Soil Respiration Activity. Eurasian Soil Sci. 2003, 36, 976–985. [Google Scholar]
  47. Kurganova, I.N.; Lopes De Gerenyu, V.O. Contribution of abiotic factors to CO2 emission from soils in the freeze–thaw cycles. Eurasian Soil Sci. 2015, 48, 1009–1015. [Google Scholar] [CrossRef]
  48. R Core Team. R: A Language and Environment for Statistical Computing; R Foundation for Statistical Computing: Vienna, Austria, 2018. [Google Scholar]
  49. Wang, W.; Peng, S.; Wang, T.; Fang, J. Winter soil CO2 efflux and its contribution to annual soil respiration in different ecosystems of a forest-steppe ecotone, north China. Soil Biol. Biochem. 2010, 42, 451–458. [Google Scholar] [CrossRef]
  50. Kurganova, I.; Teepe, R.; Loftfield, N. Influence of freeze-thaw events on carbon dioxide emission from soils at different moisture and land use. Carbon Balance Manag. 2007, 2, 2. [Google Scholar] [CrossRef]
  51. Kurganova, I.; Lopes de Gerenyu, V.; Khoroshaev, D.; Blagodatskaya, E. Effect of snowpack pattern on cold-season CO2 efflux from soils under temperate continental climate. Geoderma 2017, 304, 28–39. [Google Scholar] [CrossRef]
  52. Xu, X. Effect of freeze-thaw disturbance on soil C and N dynamics and GHG fluxes of East Asia forests: Review and future perspectives. Soil Sci. Plant Nutr. 2022, 68, 15–26. [Google Scholar] [CrossRef]
  53. Du, E.; Zhou, Z.; Li, P.; Jiang, L.; Hu, X.; Fang, J. Winter soil respiration during soil-freezing process in a boreal forest in Northeast China. J. Plant Ecol. 2013, 6, 349–357. [Google Scholar] [CrossRef]
  54. Yang, L.; Zhang, Q.; Ma, Z.; Jin, H.; Chang, X.; Marchenko, S.S.; Spektor, V.V. Seasonal variations in temperature sensitivity of soil respiration in a larch forest in the Northern Daxing’an Mountains in Northeast China. J. For. Res. 2022, 33, 1061–1070. [Google Scholar] [CrossRef]
  55. Hashimoto, S. Q10 values of soil respiration in Japanese forests. J. For. Res. 2005, 10, 409–413. [Google Scholar] [CrossRef]
  56. Xu, Z.; Tang, S.; Xiong, L.; Yang, W.; Yin, H.; Tu, L.; Wu, F.; Chen, L.; Tan, B. Temperature sensitivity of soil respiration in China’s forest ecosystems: Patterns and controls. Appl. Soil Ecol. 2015, 93, 105–110. [Google Scholar] [CrossRef]
  57. Osipov, A.F. Effect of Interannual Difference in Weather Conditions of the Growing Season on the CO2 Emission from the Soil Surface in the Middle-Taiga Cowberry–Lichen Pine Forest (Komi Republic). Eurasian Soil Sci. 2018, 51, 1419–1426. [Google Scholar] [CrossRef]
  58. Kurganova, I.N.; Lopes de Gerenyu, V.O.; Gallardo Lancho, J.F.; Oehm, C.T. Evaluation of the rates of soil organic matter mineralization in forest ecosystems of temperate continental, mediterranean, and tropical monsoon climates. Eurasian Soil Sci. 2012, 45, 68–79. [Google Scholar] [CrossRef]
  59. Schmidt, M.W.I.; Torn, M.S.; Abiven, S.; Dittmar, T.; Guggenberger, G.; Janssens, I.A.; Kleber, M.; Kögel-Knabner, I.; Lehmann, J.; Manning, D.A.C.; et al. Persistence of soil organic matter as an ecosystem property. Nature 2011, 478, 49–56. [Google Scholar] [CrossRef]
  60. Knorr, W.; Prentice, I.C.; House, J.I.; Holland, E.A. Long-term sensitivity of soil carbon turnover to warming. Nature 2005, 433, 298–301. [Google Scholar] [CrossRef]
  61. Conant, R.T.; Ryan, M.G.; Ågren, G.I.; Birge, H.E.; Davidson, E.A.; Eliasson, P.E.; Evans, S.E.; Frey, S.D.; Giardina, C.P.; Hopkins, F.M.; et al. Temperature and soil organic matter decomposition rates—Synthesis of current knowledge and a way forward. Glob. Chang. Biol. 2011, 17, 3392–3404. [Google Scholar] [CrossRef]
  62. Melillo, J.M.; Steudler, P.A.; Aber, J.D.; Newkirk, K.; Lux, H.; Bowles, F.P.; Catricala, C.; Magill, A.; Ahrens, T.; Morrisseau, S. Soil Warming and Carbon-Cycle Feedbacks to the Climate System. Science 2002, 298, 2173–2176. [Google Scholar] [CrossRef] [PubMed]
  63. Rey, A.; Jarvis, P. Modelling the effect of temperature on carbon mineralization rates across a network of European forest sites (FORCAST). Glob. Chang. Biol. 2006, 12, 1894–1908. [Google Scholar] [CrossRef]
  64. Bradford, M.A.; Davies, C.A.; Frey, S.D.; Maddox, T.R.; Melillo, J.M.; Mohan, J.E.; Reynolds, J.F.; Treseder, K.K.; Wallenstein, M.D. Thermal adaptation of soil microbial respiration to elevated temperature. Ecol. Lett. 2008, 11, 1316–1327. [Google Scholar] [CrossRef] [PubMed]
  65. Larionova, A.A.; Maltseva, A.N.; Lopes de Gerenyu, V.O.; Kvitkina, A.K.; Bykhovets, S.S.; Zolotareva, B.N.; Kudeyarov, V.N. Effect of temperature and moisture on the mineralization and humification of leaf litter in a model incubation experiment. Eurasian Soil Sci. 2017, 50, 422–431. [Google Scholar] [CrossRef]
  66. Fang, C.; Smith, P.; Moncrieff, J.B.; Smith, J.U. Similar response of labile and resistant soil organic matter pools to changes in temperature. Nature 2005, 433, 57–59. [Google Scholar] [CrossRef] [PubMed]
  67. Conen, F.; Leifeld, J.; Seth, B.; Alewell, C. Warming mineralizes young and old soil carbon equally. Biogeosciences 2006, 3, 515–519. [Google Scholar] [CrossRef]
  68. Drake, J.E.; Giasson, M.-A.; Spiller, K.J.; Finzi, A.C. Seasonal plasticity in the temperature sensitivity of microbial activity in three temperate forest soils. Ecosphere 2013, 4, art77. [Google Scholar] [CrossRef]
  69. Yang, S.; Wu, H.; Wang, Z.; Semenov, M.V.; Ye, J.; Yin, L.; Wang, X.; Kravchenko, I.; Semenov, V.; Kuzyakov, Y.; et al. Linkages between the temperature sensitivity of soil respiration and microbial life strategy are dependent on sampling season. Soil Biol. Biochem. 2022, 172, 108758. [Google Scholar] [CrossRef]
  70. Wallenstein, M.D.; Mcmahon, S.K.; Schimel, J.P. Seasonal variation in enzyme activities and temperature sensitivities in Arctic tundra soils. Glob. Chang. Biol. 2009, 15, 1631–1639. [Google Scholar] [CrossRef]
  71. Lopes de Gerenyu, V.; Kurganova, I.; Kuznetzov, M.; Osipov, A.; Myakshina, T.; Sapronov, D.; Kaganov, V.; Bobkova, K.; Kudeyarov, V. Organic Carbon Pools and CO2 Fluxes from Soils of Forest Ecosystems in the European Part of Russia. In Proceedings of the 1st Pan-Eurasian Experiment (PEEX) Conference and the 5th PEEX Meeting, Helsinki, Finland, 10–13 February 2015; Volume 163, pp. 250–255. [Google Scholar]
  72. Zheng, Z.-M.; Yu, G.-R.; Fu, Y.-L.; Wang, Y.-S.; Sun, X.-M.; Wang, Y.-H. Temperature sensitivity of soil respiration is affected by prevailing climatic conditions and soil organic carbon content: A trans-China based case study. Soil Biol. Biochem. 2009, 41, 1531–1540. [Google Scholar] [CrossRef]
  73. IPCC Climate Change 2014: Synthesis Report. In Contribution of Working Groups I, II and III to the Fifth Assessment Report of the Intergovernmental Panel on Climate Change; IPCC: Geneva, Switzerland, 2014.
  74. Lopes de Gerenyu, V.O.; Kurganova, I.N.; Khoroshaev, D.A. The Effect of Contrasting Moistening Regimes on CO2 Emission from the Gray Forest Soil under a Grass Vegetation and Bare Fallow. Eurasian Soil Sci. 2018, 51, 1200–1213. [Google Scholar] [CrossRef]
  75. Arias, P.A.; Bellouin, N.; Coppola, E.; Jones, R.G.; Krinner, G.; Marotzke, J.; Naik, V.; Palmer, M.D.; Plattner, G.-K.; Rogelj, J.; et al. Technical Summary. In Climate Change 2021: The Physical Science Basis. Contribution of Working Group I to the Sixth Assessment Report of the Intergovernmental Panel on Climate Change; Cambridge University Press: Cambridge, UK; New York, NY, USA, 2021; pp. 33–144. [Google Scholar] [CrossRef]
  76. Roshydromet Second Assessment Report on Climate Change and Its Consequences in the Russian Federation (General Summary); Roshydromet: Moscow, Russia, 2014; ISBN 978-5-904206-13-0.
  77. Stefanidis, S.; Alexandridis, V. Precipitation and Potential Evapotranspiration Temporal Variability and Their Relationship in Two Forest Ecosystems in Greece. Hydrology 2021, 8, 160. [Google Scholar] [CrossRef]
  78. Stefanidis, S.P. Ability of Different Spatial Resolution Regional Climate Model to Simulate Air Temperature in a Forest Ecosystem of Central Greece. J. Environ. Prot. Ecol. 2021, 22, 1488–1495. [Google Scholar]
  79. Stefanidis, S.; Dafis, S.; Stathis, D. Evaluation of Regional Climate Models (RCMs) Performance in Simulating Seasonal Precipitation over Mountainous Central Pindus (Greece). Water 2020, 12, 2750. [Google Scholar] [CrossRef]
Figure 1. Location of the study sites. (A)—The European part of Russia; (B)—Moscow region; (C)—secondary deciduous forest (SDF); (D)—mature mixed forest (MMF).
Forests 13 01374 g001
Figure 5. Dynamics of SR*10 and SR10 values (gCm−2 day−1) in the two forests during the observation period (a,c) and their statistical characteristics (b,d): the median (bar), lower (Q1) and upper (Q3) quartiles (“boxes”); X1 = Q1 − 1.5 IQR (interquartile range = Q3 − Q1) and X2 = Q3 − 1.5 IQR (“moustaches”). All data are shown as dots. ns—the difference between mean values is not significant.
Forests 13 01374 g005
Figure 6. Dynamics of obs-SR10 values (gCm−2 day−1) in the two forests during the observation period (a,c) and their statistical characteristics (b): the median (bar), lower (Q1) and upper (Q3) quartiles (“boxes”); X1 = Q1 − 1.5 IQR (interquartile range = Q3 − Q1) and X2 = Q3 – 1.5 IQR (“moustaches”). All data are shown as dots. ns—the difference between mean values is not significant. Relationship between obs-SR10 and SR10 for both forest soils (c,d). ***—the parameters of regression equation are significant at p < 0.0001. ns—not significant. Black solid line is a regression line (significant at p < 0.001). Red dotted line corresponds to the standard error, se). Vertical bars are standard errors (±se).
Forests 13 01374 g006
Figure 7. Correlations between Q*10, Q10, SR*10 and SR10 values and the meteorological indexes. Only the significant correlations are shown (p < 0.05). Q*10 and Q10 are the temperature coefficients of the soil respiration at all ranges of the soil temperature, Ts, and for Ts ≥ 1 °C, respectively; SR*10 and SR10 are the rates of soil respiration at 10 °C (gCm−2 day−1) calculated using Q*10 and Q10. Obs-SR10 is the observation SR value at Ts = 10 °C. Meteorological indexes: SP is the annual sum of precipitation (mm); SP5–8 and SP5–9 are the sums of monthly precipitation from May to August and May to September, respectively; WI5–8 and WI5–9 are the wetness indexes from May to August and May to September, respectively; HTC6–8 is the hydrothermal coefficient over the summer period (June–August).
Forests 13 01374 g007
Figure 8. Rank correlations between the mean Q10 values in the sandy Entic Podzol and meteorological indexes: MAT, °C mean annual Tair; ST5–8 and ST5–9 (°C) are the sums of the mean monthly Tair from May to August and May to September, respectively; SP is the annual sum of precipitation (mm); SP5–8 and SP5–9 are the sums of the monthly precipitation from May to August and May to September, respectively; WI5–8 and WI5–9 are the wetness indexes from May to August and May to September, respectively; HTC6–8 is the hydrothermal coefficient over the summer period (June–August). Letters indicate significant differences at p < 0.05.
Forests 13 01374 g008
Figure 9. Rank correlations between the mean Q10 values in the loamy Haplic Luvisol and the meteorological indexes: MAT, °C mean annual Tair; ST5–8 and ST5–9 (°C) are the sums of the mean monthly Tair from May to August and May to September, respectively; SP is the annual sum of precipitation (mm); SP5–8 and SP5–9 are the sums of the monthly precipitation from May to August and May to September, respectively; WI5–8 and WI5–9 are the wetness indexes from May to August and May to September, respectively; HTC6–8 is the hydrothermal coefficient over the summer period (June–August). Letters indicate significant differences at p < 0.05.
Forests 13 01374 g009
Table 1. Basic soil properties (0–10 cm layer) of the forest sites (mean values ± standard error (SE) are shown).
SiteSoilSand:Silt:ClayWHC, %CNC/NpHKCl
g/kg of Soil
MMFEntic Podzol Arenic11.6:1.0:1.340.5 ± 2.712.2 ± 2.80.96 ± 0.1515.33.67 ± 0.02
SDFHaplic Luvisol Siltic1.2:2.3:1.057.5 ± 2.330.0 ± 1.82.35 ± 0.1012.85.56 ± 0.09
Note: texture classes: sand: >0.05 mm, silt: 0.002–0.050 mm, clay: <0.002 mm; WHC: water holding capacity.
Table 2. Temperature coefficients (Q*10 and Q10) of soil respiration, SR*10, and SR10 values for periods of different levels of humidity in the two types of forest.
Level of HumidityQ*10nR2SR*10Q10nR2SR10
Mixed mature forest, Entic Podzol
Normal2.725240.591.802.333610.511.85
Wet2.422250.611.862.321570.521.89
Dry2.133150.451.481.642070.291.57
Secondary deciduous forest, Haplic Luvisol
Normal2.664730.561.852.093240.501.98
Wet2.172110.541.891.801430.422.01
Dry1.892970.471.411.492040.281.54
Note: Q*10 and Q10 are the temperature coefficients of soil respiration at the full range of the soil temperature, Ts, and for Ts > 1 °C, respectively; n is the number of observations; R2 is the coefficient of determination; SR*10 and SR10 are the rates of soil respiration at 10 °C (gCm−2 day−1) calculated using Equation (7). All the regression equations are significant (p < 0.0001).
Table 3. Temperature coefficients (Q*10 and Q10) of soil respiration, SR*10, and SR10 values for different calendar seasons in the two types of forest.
SeasonQ*10nR2SR*10Q10nR2SR10
Mixed mature forest, Entic Podzol
Spring2.472720.341.761.821540.261.70
Fall2.332810.401.792.142590.341.77
Winter3.232410.07nd1.1440nsnd
Summer1.552760.06nd1.552760.06nd
Secondary deciduous forest, Haplic Luvisol
Spring3.132430.472.002.171520.432.00
Fall1.862630.351.781.752400.271.78
Winter6.542160.08nd2.1420nsnd
Summer1.03249nsnd1.03249nsnd
Note: Q*10 and Q10 are the temperature coefficients of soil respiration at the full range of the soil temperature, Ts, and for Ts ≥ 1 °C, respectively; n is the number of observations; R2 is the coefficient of determination; SR*10 and SR10 are the rates of soil respiration at 10 °C (gCm−2 day−1) calculated using Equation (7). nd is not determined: the reference SR*10 and SR10 values for Ts < 10 °C (winter) and for Ts > 10 °C (summer) were not estimated). All the regression equations are significant (p < 0.0001) except ns—not significant.
Publisher’s Note: MDPI stays neutral with regard to jurisdictional claims in published maps and institutional affiliations.

