Article

Spatial Distribution Pattern and Genetic Diversity of Quercus wutaishanica Mayr Population in Loess Plateau of China

1
Key Laboratory of Resource Biology and Biotechnology in Western China, Ministry of Education, Northwest University, Xi’an 710069, China
2
College of Life Science, Northwest University, Xi’an 710069, China
3
Shuanglong State-Owned Ecological Experimental Forest Farm of Qiaoshan State-Owned Forestry Administration of Yan’an City, Yan’an 727306, China
4
Shaanxi Micangshan National Nature Reserve Administration, Hanzhong 723000, China
5
Xi’an Botanical Garden of Shaanxi Province/Institute of Botany of Shaanxi Province, Xi’an 710069, China
*
Author to whom correspondence should be addressed.
Submission received: 27 July 2022 / Revised: 24 August 2022 / Accepted: 26 August 2022 / Published: 28 August 2022
(This article belongs to the Special Issue Plant Adaptation to Extreme Environments in Drylands)

Abstract

:
The Quercus wutaishanica forest influences the ecological environment and climate characteristics and plays an important ecological role in the Loess Plateau region. However, we still know relatively little about the genetic diversity and spatial distribution of Q. wutaishanica. Here, we assessed the genetic diversity of Q. wutaishanica using simple sequence repeats and used the point pattern method to analyze the spatial distribution patterns as well as intraspecific relationships. Our results indicate that the diameter structure of the Q. wutaishanica population was inverted J-type, showing a growing population. In addition, the population maintained high genetic diversity on a small scale. Due to dispersal constraints, the spatial distribution pattern of Q. wutaishanica seedlings (DBH < 1 cm) tended to aggregate at small scales and the degree of aggregation decreased with increasing spatial scale. However, trees (DBH > 5 cm) and saplings (1 cm ≤ DBH < 5 cm) showed more random distribution at the scale, indicating that Q. wutaishanica individuals shift from aggregation to random distribution at the spatial scale. In addition, although individuals of different diameter classes showed facilitative (trees vs. saplings, 5–6.5 m) and competitive effects (trees vs. seedlings, 13.5–16 m) on some scales, they showed no correlation on other scales, especially for saplings and seedlings, where they were not correlated on any scale. The results contribute to revealing the status and dynamics of Q. wutaishanica in the Loess Plateau, thereby providing a theoretical basis for further study on the maintenance mechanism of the population.

1. Introduction

The spatial distribution patterns of populations, which are the basic constituent units of plant communities, have been one of the trending topics of ecological research [1,2,3]. Different distribution patterns and spatial correlations can directly reflect the processes of individual biology, intra-species competition, and population–environment interactions [4], and the mechanism of population formation can be deduced from the distribution patterns and spatial correlations of populations [5]. Therefore, studying the spatial distribution patterns of populations and their correlations is of great importance to real successional trends, intra-species relationships, environmental adaptation mechanisms, and the formation of forest community structure [6,7,8].
One of the main drivers of species coexistence and community dynamics is species competition for scarce resources [9,10]. Competition can occur through density-dependent mortality events, which affect the survival and growth of species by robbing each other of living space and resources [11,12]. When larger trees disproportionately affect the growth and survival of smaller trees, asymmetric competition between individuals occurs [13]. For example, adult trees may inhibit seedling formation through competition, allelopathy, or increased populations of herbivores and pathogens [14]. Thus, tree size is a key factor influencing the spatial pattern and structure of forest populations.
Biological polymorphism and species diversity are based on genetic variation. Ecological processes such as interspecific interactions and community structure are significantly influenced by genetic diversity [15]. In recent years, the development of polymorphic markers and statistical analysis tools has allowed us to understand population maintenance mechanisms from a molecular perspective. For example, researchers have used inter-simple sequence repeat analysis (ISSR) to determine that genetic variation can explain intraspecific variation in plant–soil biotic interactions [16]. In addition, genetic diversity can also be analyzed by other molecular makers, such as random amplified polymorphic DNA (RAPD), restriction fragment length polymorphisms (RFLPs), amplified fragment length polymorphisms (AFLPs), single nucleotide polymorphisms (SNPs) [17,18] and simple sequence repeats (SSRs) [19]. In the last two decades, SSR markers have become a powerful tool for such studies because they are highly informative, polymorphic, and co-dominant, and present transferability between closely related species [20,21]. Researchers have studied the genetic diversity of some Quercus spp. by using SSR markers [22,23,24,25,26], but there are fewer experiments on the study of Quercus wutaishanica as a target, especially in the Loess Plateau region, and there are almost no studies on the genetic diversity of Q. wutaishanica for this region. Therefore, the study of the genetic diversity of Q. wutaishanica is important for understanding the level of species diversity and population genetic structure as well as the development of species conservation strategies and measures.
Q. wutaishanica is a deciduous tree belonging to the Quercus subgenus Quercus in the Fagaceae family. It is closely related to Quercus mongolica and considered by some scholars to be a synonym of the Q. mongolica. However, some researchers used SSR and AFLP analysis methods to analyze 15 separately distributed and mixed populations of Q. wutaishanica and Q. mogolica in China and found that Q. wutaishanica and Q. mogolica have clearly identifiable independent gene pools not only in separately distributed populations, but also in mixed populations, so they should remain as independent taxonomic units [27]. The Loess Plateau region, with its severe erosion and intense soil erosion, is a key area for ecological restoration in China, and the dynamics of its ecological environment have traditionally received widespread attention. The Q. wutaishanica forest is a relatively stable terminal forest community in the Loess Plateau region, which has an important influence on the ecological environment and climate characteristics of the region and plays an important ecological role [28]. At present, research on Q. wutaishanica in the Loess Plateau region has focused on taxonomy, morphological, and physiological characteristics [29,30], seed dispersal, and population renewal [31], but less on genetic diversity and spatial distribution patterns. Therefore, in this paper, we investigated populations’ genetic diversity and spatial distribution patterns and their associations using SSR analysis and scale-based point pattern analysis, respectively, with populations of Q. wutaishanica in the Loess Plateau region as the research object. Specifically, our primary aims were to: (1) assess the population structure and genetic diversity of Q. wutaishanica; and (2) determine the distribution pattern and compare differences in the spatial association between trees of different diameter classes. The findings are discussed in the context of conservation and restoration strategies of Q. wutaishanica in the Loess Plateau region.

2. Materials and Methods
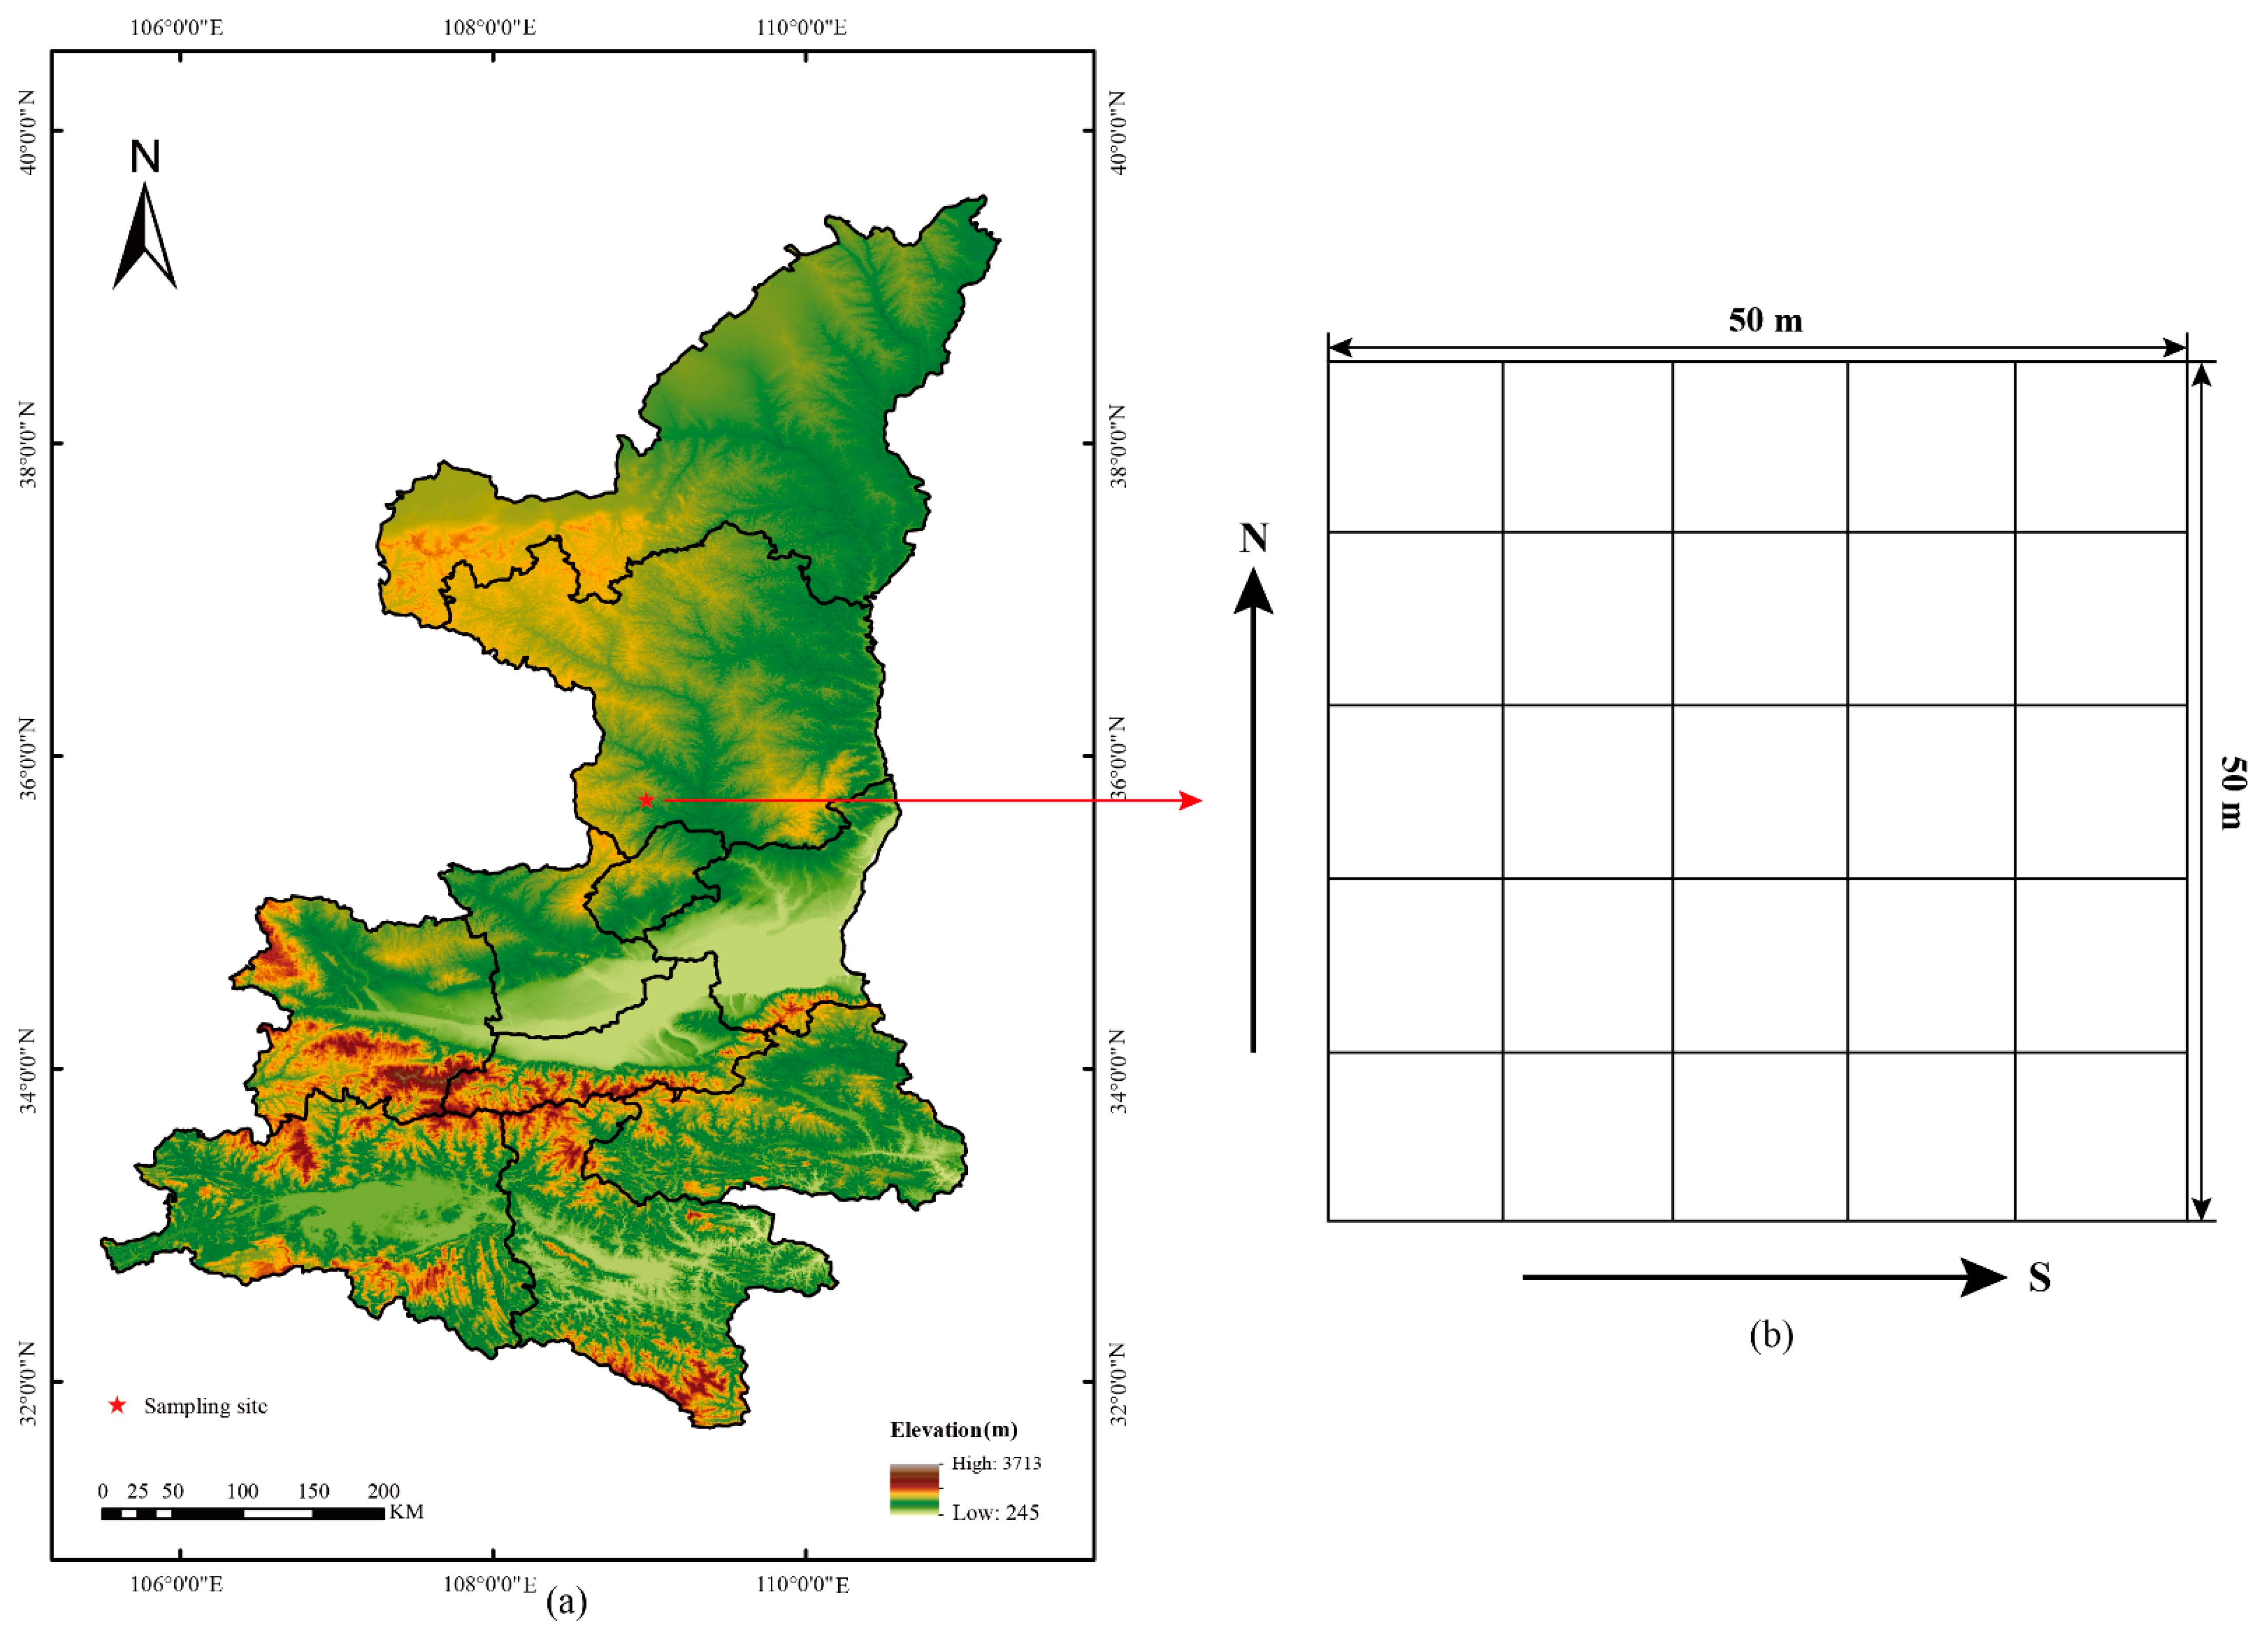
2.1. Study Area

The research was conducted in the Shuanglong Forest Farm (35°32′06″–35°45′55″ N, 108°33′40″–109°19′41″ E), Yan’an City, Shaanxi Province, China, which belongs to the Ziwuling Mountain region in the middle of the Loess Plateau. This area has a warm-temperate continental monsoon climate with an average annual temperature of 9–11 °C [32]. The mean annual precipitation is 550–650 mm [33]. The elevation ranges from 800 to 1700 m.
Historically, the natural forests in the Ziwuling Mountain region of the Loess Plateau were widely distributed, but the forests were severely damaged due to the interference of historical human activities [34]. Since the vegetation began to recover naturally, it has been 150 years, and now the Ziwuling Mountain has formed a large and continuous secondary forest landscape [34,35,36], with a denseness of 0.7–0.9. Typical secondary forest species in the forest area include Q. wutaishanica, Betula platyphylla Sulk., Populus davidiana Dode, etc. Among them, the Q. wutaishanica forest was the most widely distributed as the natural climax vegetation [37], and its mixed plants mainly include Quercus acutissim var. acutissima, Quercus aliena Blume, B. platyphylla, Carpinus turczaninowii Hance, etc. The forest area is currently growing well and playing an important role in the regional ecosystem.

2.2. Data Collection

In July 2018, a 50 m × 50 m plot was set up at the Qiaoshan forest ecosystem positioning and research station in Shaanxi Province, and this plot was divided into 25 quadrats of 10 m × 10 m (Figure 1). We recorded the coordinate position of all Q. wutaishanica individuals in the plot, measured diameter at breast height (DBH, defined as 1.3 m above the ground) or basal diameter (for seedlings), and numbered each individual. Then, we divided stems into separate sizes classed based on DBH. We defined seedlings as individuals <1 cm DBH, saplings as ≥1 cm and <5 cm DBH, and trees as ≥5 cm DBH [38,39]. For all saplings and trees, about three fresh and healthy leaves were collected from each plant, placed in a self-sealing bag, and dried with silica gel for genetic analysis.

2.3. DNA Extraction and SSR Analysis

The dried leaves were ground on a TissueLysser (Scientz-48) before the DNA extraction. Genomic DNA was extracted following the method of Hormaza [40] and using the Speedtools Plant DNA Extraction Kit (Bioteke, Beijing, China) according to the manufacturer’s instructions [41,42,43]. The extracted DNA was measured by a nucleic acid analyzer and quality was checked by 0.8% agarose gel electrophoresis.
A preliminary screening of primers for Q. wutaishanica was carried out by reviewing the literature [25,26,44,45,46], and a total of 20 pairs of primers were finally selected. Forty samples were randomly selected from the extracted DNA samples and subsequent experiments were carried out with the initially screened pairs of primers. The PCR reaction system was 25 μL: 1 μL template DNA, 1 μL each upstream and downstream primers, 12.5 μL PCR Premix (Taq DNA polymerase, dNTPs, MgCl2, KCl reaction buffer, other stabilizers and enhancers), 9.5 μL ddH2O. The PCR reaction procedure was: pre-denaturation at 94 °C for 5 min, denaturation at 94 °C for 45 s, denaturation at 46–59 °C for 40 s, extension at 72 °C for 45 s, and final extension at 72 °C for 7 min. The PCR products were detected by 1% agarose gel electrophoresis, and the primers with bright and clear bands were selected.
Of the 20 primer pairs selected, 12 were amplified successfully and the amplified products were obtained. Five pairs of primers with clear bands, good polymorphism, and high stability were selected for SSR analysis, and the primer sequences are shown in Table 1. The DNA samples were sent to the Tsingke Biotechnology Co., Ltd. (Bejing, China) to complete SSR analysis.
Popgene32 software was used to calculate the genetic diversity of trees and saplings, including the effective number of alleles (Ne), Shannon’s information index (I), observed number of alleles (Na), observed heterozygosity (Ho), expected heterozygosity (He), and fixation index (Fis). In addition, we tested for differences in the number of alleles, genetic diversity, and fixation index between trees and saplings using the Wilcoxon Matched Pairs Test.
It is worth noting that due to data deficiencies (only two size groups’ data), we did not calculate genetic differentiation indices (allele frequency differentiation, AFD) [47] for the three stages, as in previous studies [48,49].

2.4. Point Pattern Analysis and Null Model

The pairwise correlation function g(r) was used to study the distribution patterns of populations at different scales. The pairwise correlation function g(r) is derived from the K function, which is a non-accumulative distribution function compared with the K function, and can more sensitively discern the extent to which the actual distribution of points at a given scale deviates from the expected value, and is not affected by the cumulative effects at small scales when analyzing patterns at large scales [50]. We analyzed the spatial distribution patterns within tree species using the univariate g(r) function and the spatial association of size classes within species using the bivariate g(r) function.
The choice of a null model that has a clear ecological meaning and accurately describes the extent to which the data deviate from the theory is important for the analysis of spatial point patterns [38,51]. In our study, there were two different patterns (univariate pairwise correlation and bivariate pairwise correlation) using two different null model groups, and both of these two null model groups were based on heterogeneous Poisson. The heterogeneous Poisson model defines the distribution of individuals based on the density function λ(x, y), which can exclude the effect of environmental heterogeneity at large scales. We used sigma = 30 m for this analysis [50].
The univariate pairwise correlation function was used to analyze the spatial distribution patterns of tree species as a whole and populations of different diameter classes and the bivariate pairwise correlation function was used to analyze the spatial relationships among individuals at different diameter classes. We performed 99 Monte-Carlo simulations, and the maximum and minimum values of the results were used to generate 99% confidence intervals formed by the upper and lower Poisson distribution envelopes. When the observed values were above the upper limits of the envelope line, within the intervals and below the lower limits, they corresponded to the aggregated or positive correlation, random or uncorrelated and uniform distribution or negative correlation, respectively [51]. All analyses were conducted using the ‘statstat’ package in R 4.1.2 (R Core Team, 2021).

3. Results

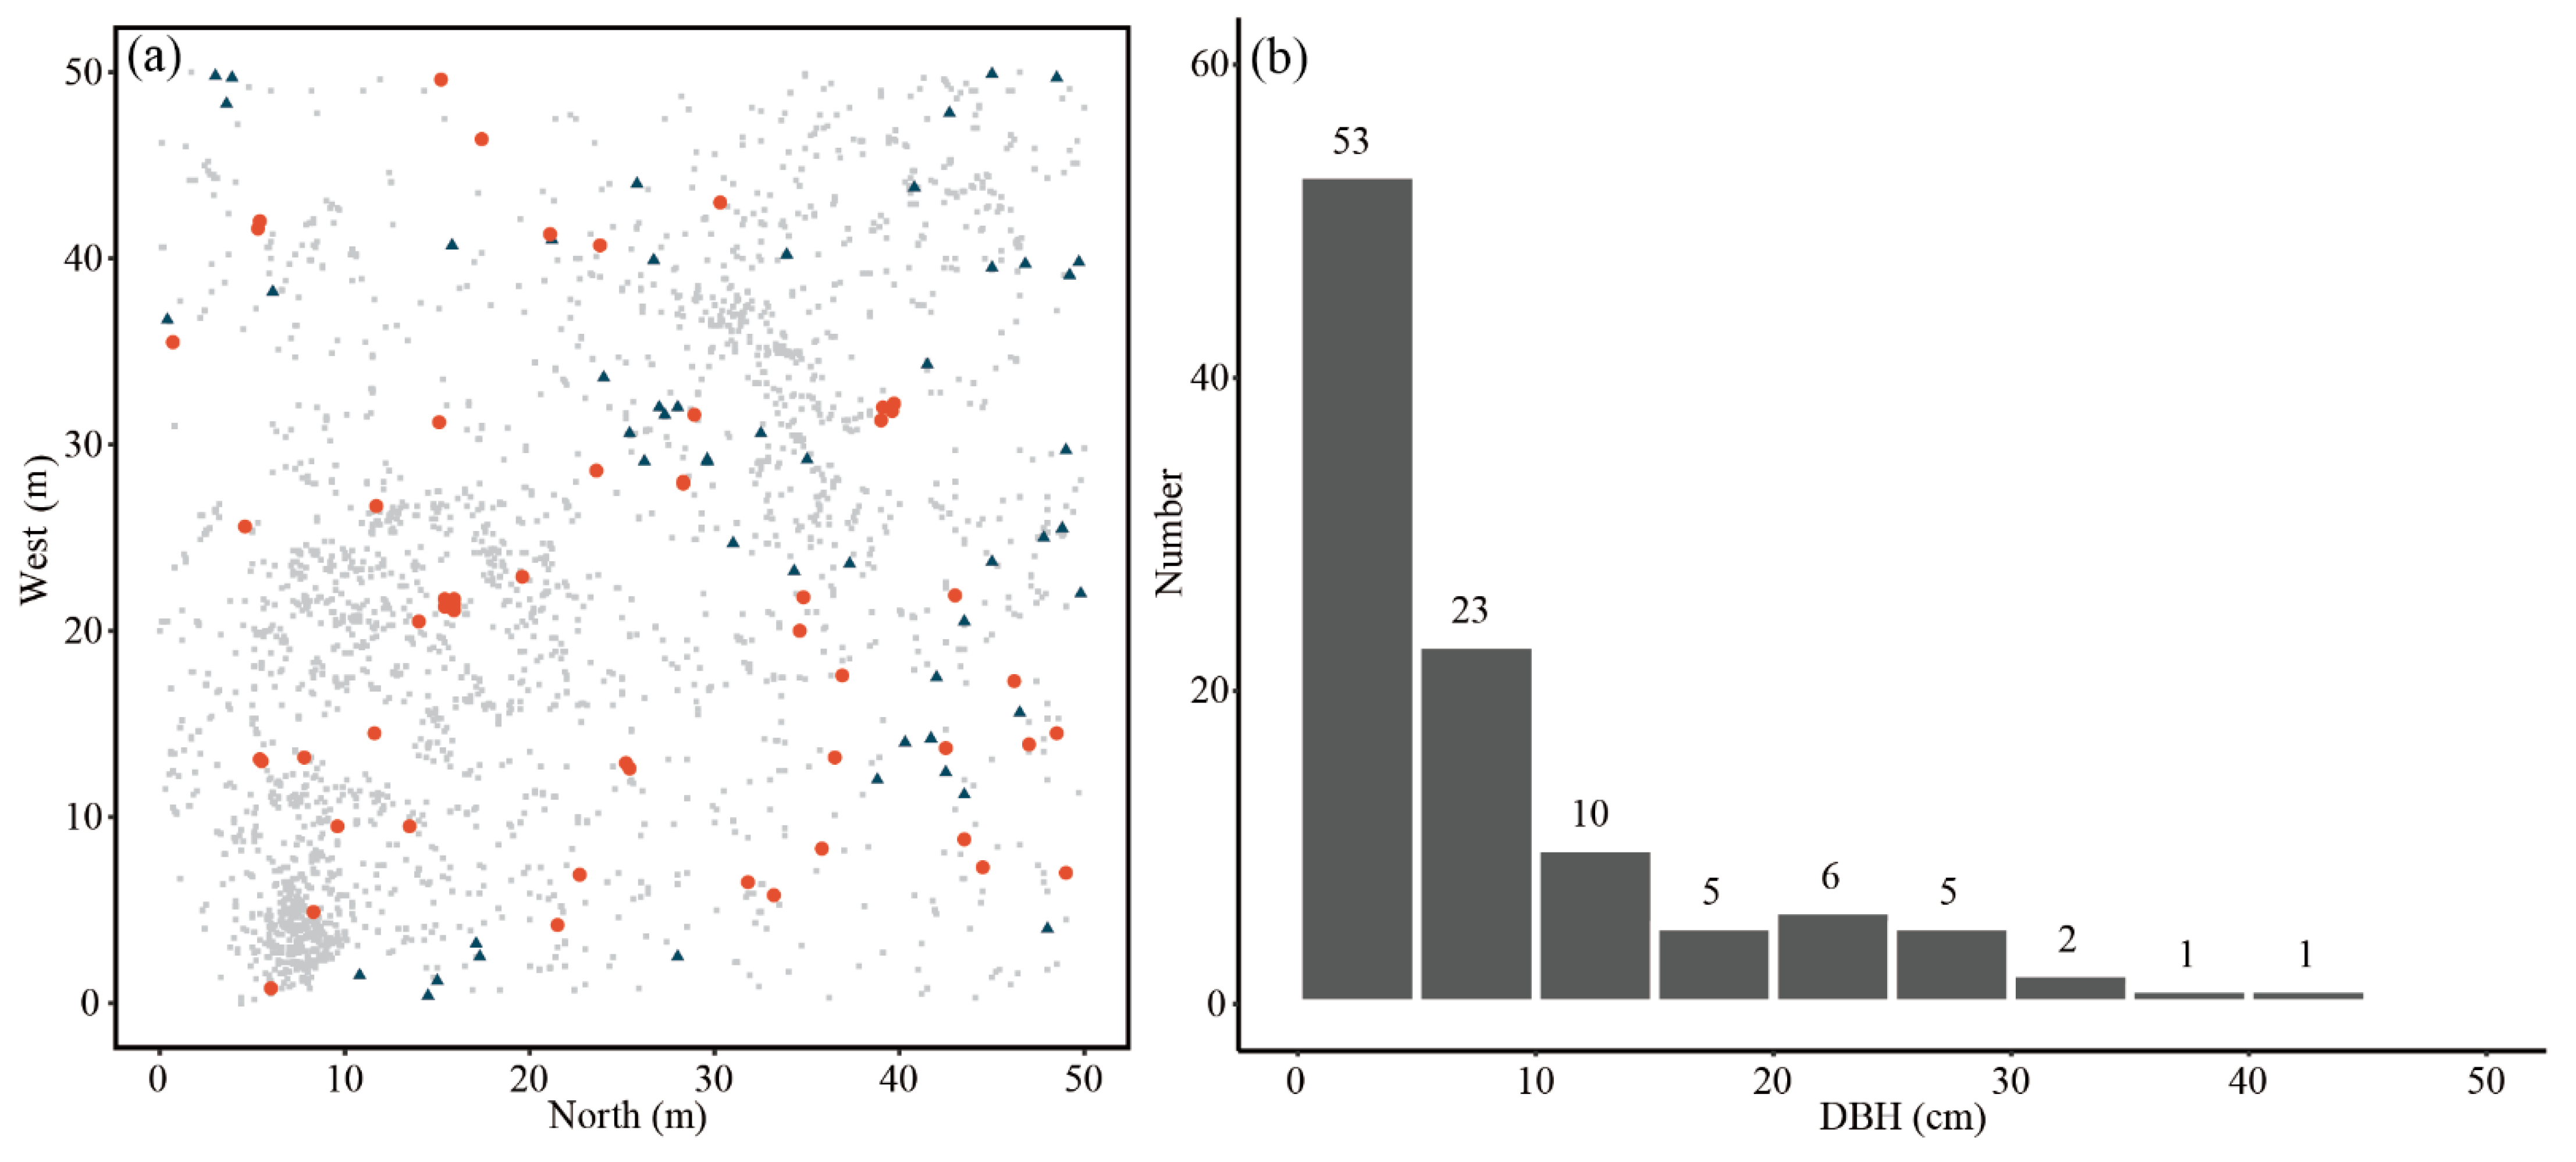
3.1. Individual Distribution and Population Structure

In this study, a total of 2964 individuals of Q. wutaishanica were counted (Figure 2a), of which 53 trees with DBH more than 5 cm, 53 saplings with DBH between 1 cm and 5 cm, and 2858 seedlings (DBH <1 cm). The large trees in the community were mainly distributed evenly in the plot, with only a few individual clusters. In addition, there were almost no saplings around the trees, but a large number of seedlings were distributed. However, the aggregation of seedlings around the saplings was not apparent.
The DBH size structure of the Q. wutaishanica showed an obvious inverted J-type distribution, in other words, the number of individuals decreased with increasing DBH size classes (Figure 2b). Moreover, the age structure population was dominated by small-sized individuals, and the age structure of the population was pyramidal-type and showed a growing population.

3.2. Genetic Diversity

A total of 66 alleles were amplified using 5 SSR primers across 106 Q. wutaishanica (53 trees and 53 saplings). The number of alleles per locus (Na) ranged from 7 to 22, with an average value of 13.2 (Table 2). The lowest observed heterozygosity (Ho) ranged from 0.7980 (10b) to 0.8371 (E79), and the mean value was 0.8371 for all accessions. The expected heterozygosity (He) values ranged between 0.7419 for E79 and 0.8973 for 04b, with an average of 0.8159 per locus. In addition, the lowest Shannon’s information index (I) was 1.5015 and the highest was 2.5257, with an average of 1.9410. The F-statistics showed moderate population differentiations for each locus and fixation index (Fis) varied from −0.2125 to 0.0810.
Although trees and saplings had high genetic diversity, the populations showed significant inbreeding in both life stages and total population (Table 2). The Wilcoxon paired test showed that trees and saplings were not significantly different in number of alleles (Na, P = 0.68), genetic diversity (He, P = 0.58), and fixation index (Fis, P = 0.22) (P > 0.05 for all comparisons).

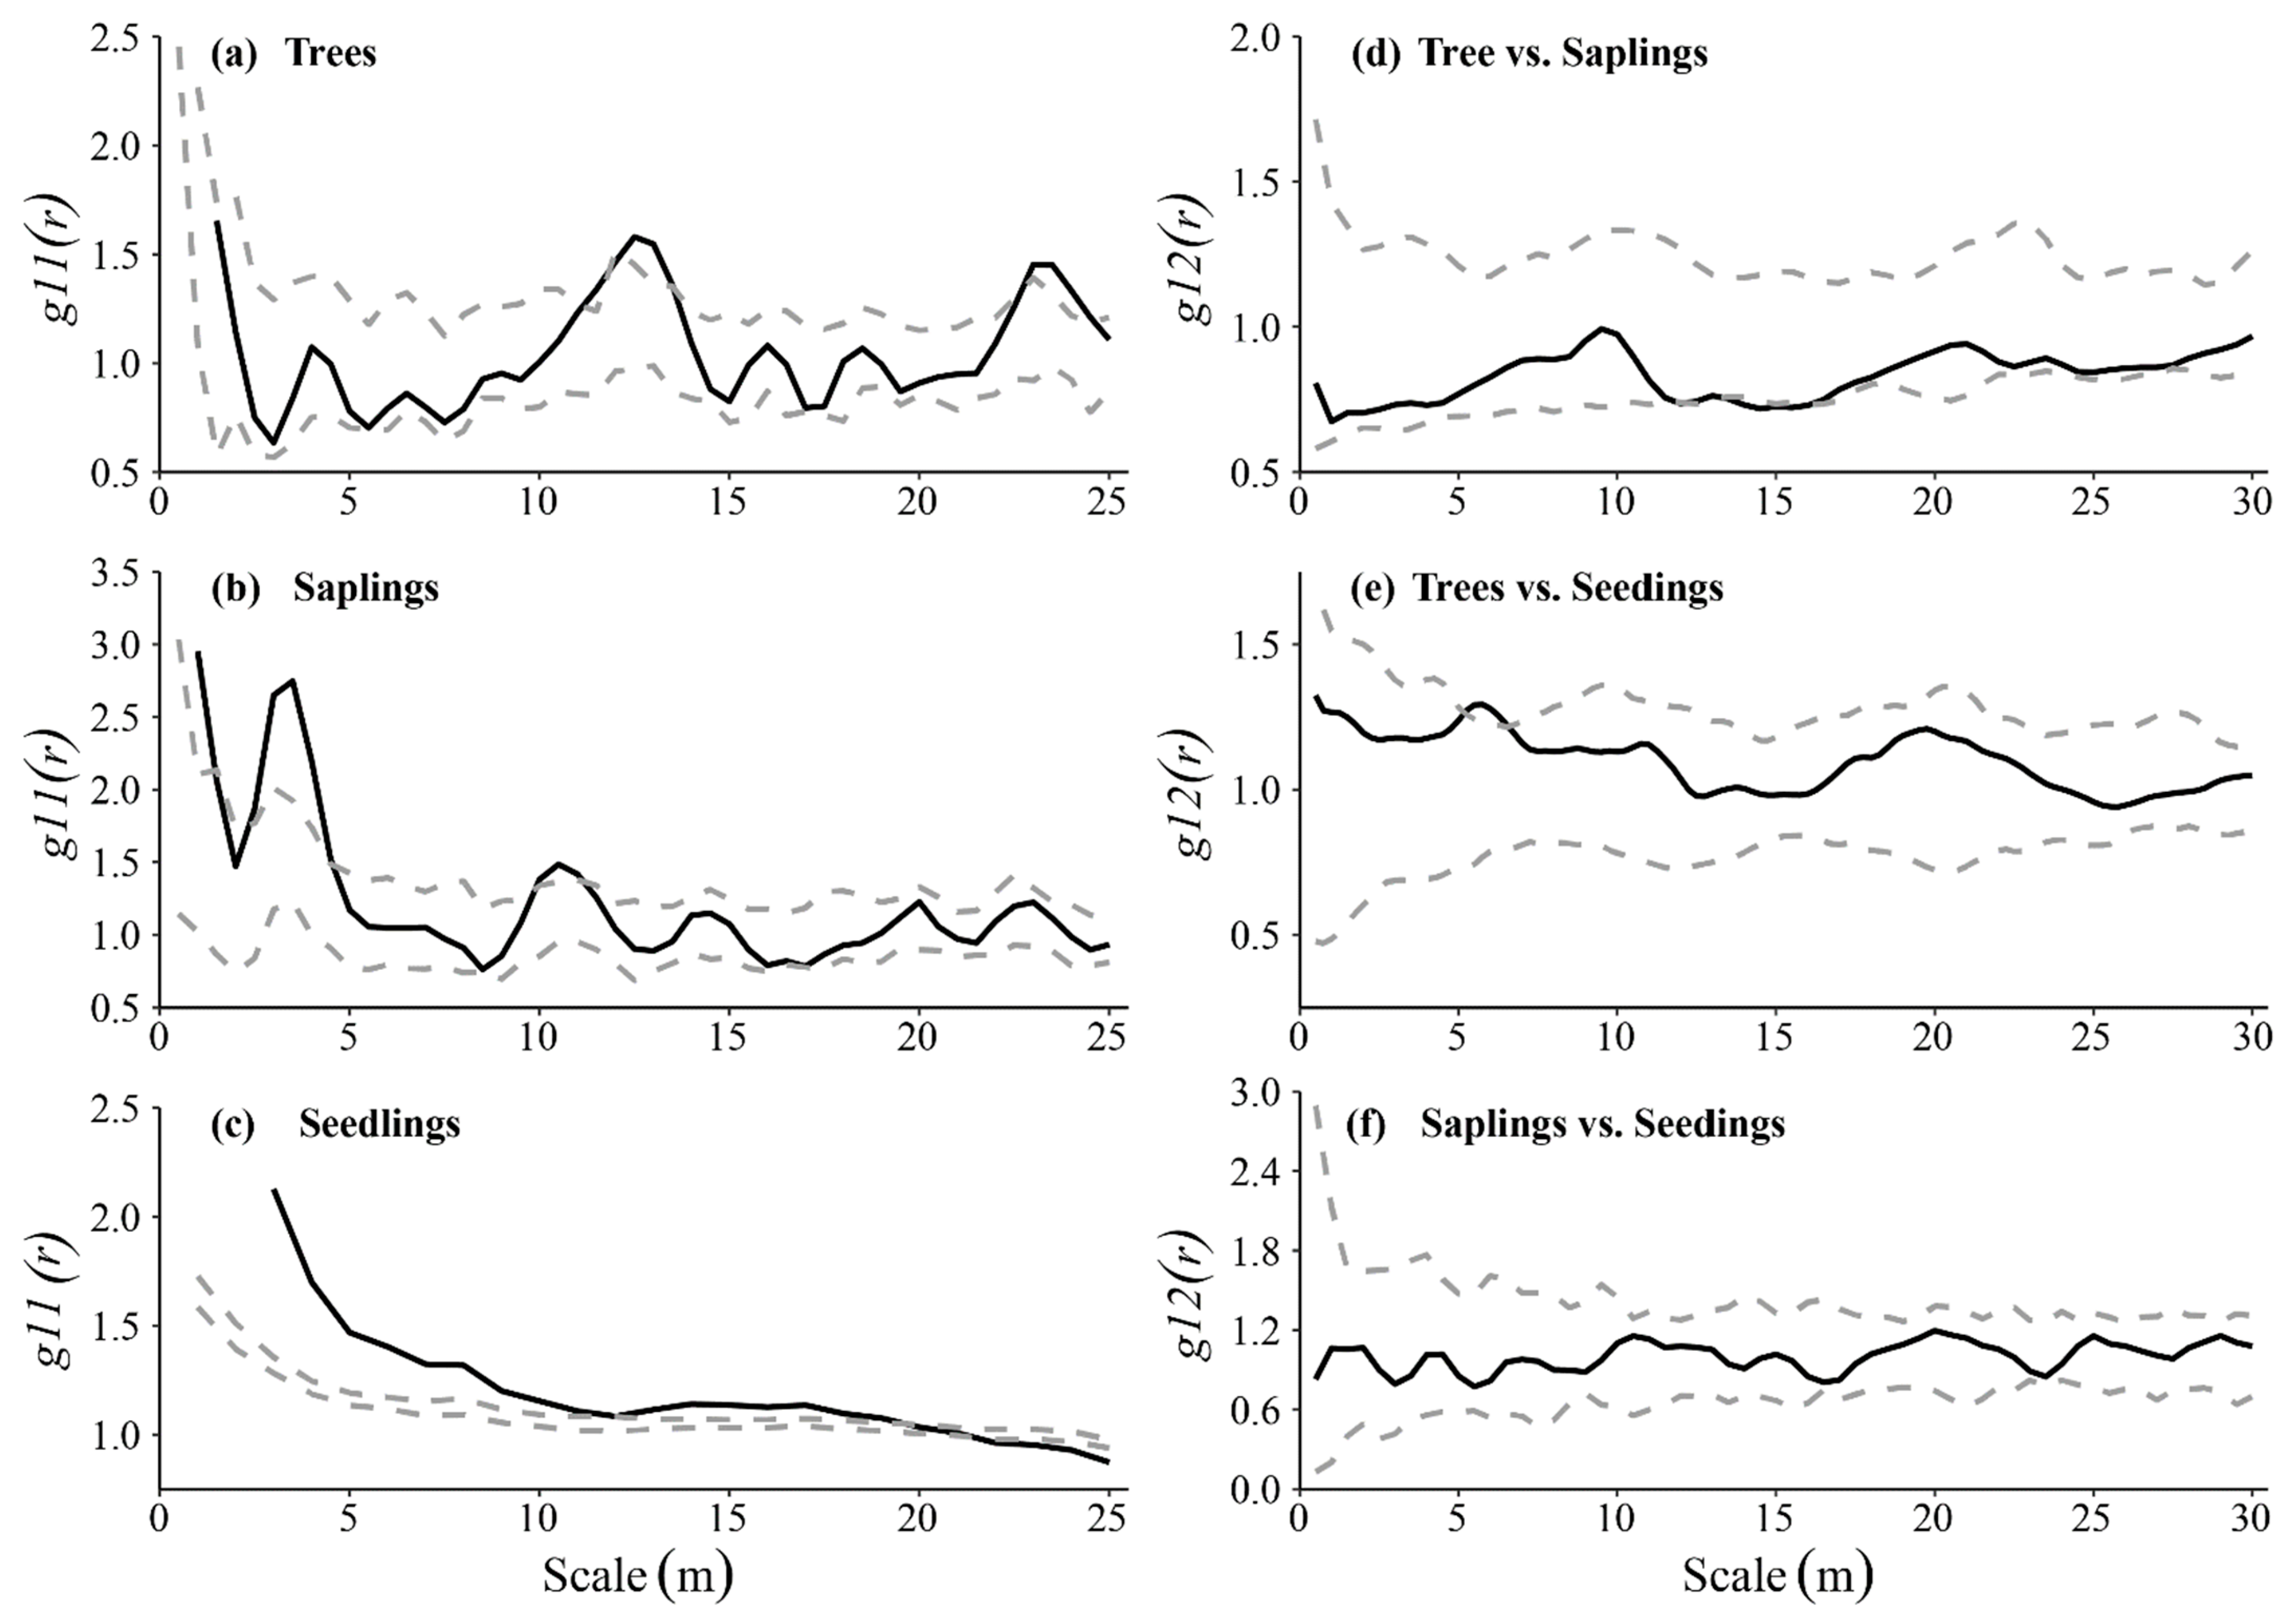
3.3. Spatial Distributions Patterns and Intraspecific Association

We found differences in the spatial distribution of three life stages of Q. wutaishanica in this study (Figure 3a–c). The trees were almost randomly distributed at the whole scale. For saplings of Q. wutaishanica, the spatial distribution was aggregated at some medium and small scales (0–1.5 m, 2.5–4.5 m and 10–11 m). In other scales, the saplings’ distribution was random. However, Q. wutaishanica seedlings showed a regular distribution at large scale (>21 m) and aggregated distribution between 0 and 20 m. The degree of aggregation then decreased with increasing scale.
There was a positive correlation between individuals of different diameter classes of Q. wutaishanica at a small interval (Figure 3d–f). Trees and seedlings showed a positive association at 5–6.5 m, but there was no association at other scales. For trees and saplings, they showed a negative association at some medium scale (13.5–16 m). At small and large scales, they were not spatially correlated. Meanwhile, no obvious associations were observed between saplings and seedlings of Q. wutaishanica.

4. Discussion

4.1. Diameter Classes Structure of Q. wutaishanica

The diameter class structure of plant populations is the result of the interaction between population viability and the external environment, and to a certain extent, it can reflect the current structure and renewal strategy of the population [52,53]. In the present study, the diameter class structure of the Q. wutaishanica population showed a typical inverted J-type distribution, with an abundance of individuals in seedlings and a gradual decrease in the number of individuals as the diameter class increased, and no individuals missing at any diameter class. In addition, a large number of renewed seedings were present and growing well in this area. The possible reason is that Q. wutaishanica will produce a large number of seeds, but its tannin content is high, bitter, and toxic, resulting in Q. wutaishanica seeds becoming an alternative food for animals [54], which in turn leads to a high number of saved seeds and the formation of a large number of seedlings. However, with the growth of individual plants, the demand for resources in the environment will become greater [55], the degree of nutrient specialization will increase [56], and strong competition will be formed within and between populations. Therefore, only a small number of seedlings will grow into saplings, and this will be more likely to occur in an area far from the adult trees, as predicted by the Janzen–Connell hypothesis. This also explains why only a small number of large-diameter individuals are in the plot. It can be seen that seed number and environmental adaptability are important reasons for the good regeneration of Q. wutaishanica.

4.2. Gene Diversity of Q. wutaishanica

Genetic diversity is a condition for the long-term survival and evolutionary basis of species [57], and the higher the genetic diversity, the better the species’ ability to adapt to its environment [58]. During the survey and collection in the field, we speculated that the Q. wutaishanica population might have been propagated from the largest individual at DBH in the sample plot, and that the Q. wutaishanica individuals in the sample might be extremely close in kinship, or even have the possibility of identical SSR analysis results. However, the SSR analysis results do not correspond to our speculation. A total of 66 alleles were amplified by the set of SSR markers, emphasizing their high degree of polymorphism. In addition, the genetic diversity of Q. wutaishanica in this study was at a high level, with an average expected heterozygosity of 0.816, compared to 0.678 for Castanea mollissima, which is also a member of the Fagaceae family [59]. Furthermore, the expected heterozygosity of other families such as Abies ziyuanensis is 0.337 [60] and poplar is 0.552 [61]. This suggests that Q. wutaishanica at small scales can still maintain rich genetic diversity, which is very beneficial for the conservation of populations. Some researchers suggested that mating patterns have an important influence on the genetic diversity of plants [62]. In general, an increase in the proportion of self or inbred in plants leads to a decrease in genetic diversity, while plant outbreeding can increase the genetic diversity [63]. In addition, hybridization between closely related species of the same genus can also increase genetic diversity, and natural hybridization is very common in Quercus spp. Moreover, Q. wutaishanica is a anemophilous plant, and can be outbred [64]. Therefore, we guess that natural hybridization between Q. wutaishanica and Q. aliena leads to a high genetic diversity of Q. wutaishanica.
The level of genetic diversity of a species is the result of a combination of factors, including the biology of the species itself, its biological characteristics (life type, breeding system), external natural environmental changes, interactions with other species, and anthropogenic disturbances, all of which have an impact on the level of genetic diversity of the species [65]. In this study, the correlation between genetic distance and geographical distance among individuals of Q. wutaishanica was weak (Mantel test, r = 0.09, P = 0.044), indicating that at a small scale, spatial distribution pattern was not the main reason for influencing genetic diversity. In addition, because the Q. wutaishanica community is the climax community in the Loess Plateau region, its community species richness is higher and the intensity of interactions between species is stronger, which also promotes the higher genetic diversity of Q. wutaishanica individuals to some extent.

4.3. Spatial Distribution Pattern of Q. wutaishanica at Different Life Stages

Spatial distribution patterns of plant populations reflect the survival strategies and adaptive mechanisms by which populations adapt to their environment [66]. Under natural conditions, biotic and abiotic factors and processes such as habitat heterogeneity, dispersal limitation, interactions between organisms, and disturbance are considered potential ecological mechanisms that influence the formation and variation of species patterns at different spatial scales [53,67,68,69]. In general, at smaller scales, the distribution patterns of populations are mainly determined by biological characteristics such as seed dispersal mechanisms, individual reproductive characteristics, and intraspecific competition; while at larger scales, they may be influenced by environmental factors such as topography, soil, moisture, and light [70,71]. In this study, seedlings showed clustered, random, and regular distributions in order of increasing spatial scale, i.e., the degree of aggregation decreased as the spatial scale increased. This generally differs from the results observed in the tropics but is consistently observed in the temperate zones. While both tropical and temperate studies showed species aggregation at certain scales, tropical studies did not find a significant decrease in species aggregation with increasing scale, and temperate forests showed a significant decrease in species aggregation [1,72,73]. The possible reasons are that the intensity and scale of spatial aggregation of populations are related to the way seeds disperse [74]. Seed dispersal is an extremely important ecological process in population dynamics and an important mechanism for explaining changes in the spatial pattern of populations [75,76]. In addition to environmental factors such as wind, water, animals, and topography, the factors affecting seed dispersal are also closely related to the reproductive and biological characteristics of plants [77,78]. The initial distribution pattern of the Q. wutaishanica population in this study may be related to seed dispersal and environmental factors [79]. Because the main way of seed dispersal is gravity and animal dispersal [80], and the seed can easily fall off after maturity, thus forming a cluster distribution pattern centered on the mother tree, while cluster distribution is conducive to mutual shelter between individuals of small diameter wood and improving interspecific competition [81]. In addition, as the spatial scale increases, it is also influenced by environmental heterogeneity, thus showing a random or regular distribution at large scales.
At smaller scales, the spatial distribution of adult trees is more dispersed than that of juveniles and saplings, mainly due to extreme competition among individuals [38]. In our study, sapling shows a random distribution at intermediate and large scales and trees at 0–25 m scales, a distribution pattern that is also found in other regional forest ecosystems [7,53,82,83]. As predicted by the classical Janzen–Connell hypothesis, large individuals tend to over-disperse in small areas because of intense competition among individuals of the same species. These results indicated that individuals of Q. wutaishanica changed from aggregated distribution (seedlings) to random distribution (trees) at a certain spatial scale. This finding confirms previous studies that density-dependent mortality leads to the observed increase in overdispersion from small to large sized trees [12,71]. This is because Q. wutaishanica seedlings have good shade tolerance and the shade of the forests provides good environmental conditions for the seedings to survive. However, as the plant grows, individuals of Q. wutaishanica need more light to promote their growth. This leads to rapid growth of plants at the edge of the forests or forest gaps, while plants in shaded conditions do not receive enough light and die [84]. In other words, when the population enters the middle and late life history, the plants’ demand for light, water, nutrients, space, and other resources increases, intra- and interspecific competition intensifies, and the self-thinning and alien-thinning effects are enhanced, leading to a large number of plant deaths and eventually tending to a random distribution [85]. In summary, Q. wutaishanica communities showed different spatial patterns at different life stages, which is not only beneficial for individual plants to obtain sufficient water, growing space, light, soil, and other environmental resources under different spatial distribution patterns, but also a survival strategy and adaptation mechanism for the population [86].

4.4. Spatial Correlation of Q. wutaishanica at Different Life Stages

Spatial correlations between different developmental stages of the same population can reveal the interactions between individuals within a population over some time and help to describe the status and dynamics of the population [6]. In addition, spatial relatedness can reflect the results of plants’ mutual facilitation under unfavorable conditions or competing for limited resources [87]. Spatial associations between plants depend to some extent on the spatial and temporal distribution patterns of habitat resources, and habitat heterogeneity spatially constrains the distribution of individuals at different diameter classes, leading to different spatial associations between individuals at different diameter classes within a population. Many previous studies have proposed the existence of competition and facilitation in temperate forests [88,89,90,91]. Competition regulates the abundance and distribution of tree populations through intra- or interspecific density-dependent effects [11,92]. Facilitation may occur mainly among trees of different sizes or life history characteristics, such as sheltering of small trees by large trees and sheltering of newly established seedlings by shrubs [93,94]. In this study, Q. wutaishanica populations showed both facilitative and competitive effects between individuals of different diameter classes. Specifically, competitive effects occurred mainly between trees and saplings and only at intermediate scales, while trees and seedlings showed facilitative effects at small scales. The positive association indicates that individuals of different diameter classes of plants have similar needs for environmental resources. trees with larger canopy width can create a suitable renewal and growth microenvironment for seedlings, including protection from strong light, reduction of ground evaporation, and maintenance of soil moisture, providing shelter for the growth of small diameter classes, resulting in the higher survival rate of small diameter classes and thus dominance in the plots [95], thus creating a facilitating effect between trees and seedlings. In turn, when seedlings develop into young trees, there is competition for resources with adults [85], resulting in a negative correlation between adult and young trees at some scales. In addition, saplings and seedlings showed no correlation at all scales, due to the relatively low competition for resources such as nutrients and water between individuals at small diameter levels, and similar resource preferences that allow them to harmonize their relationships with each other and to jointly resist disturbance by herbivores [39].

4.5. Suggestions for Conservation and Management

The findings on the population structure and genetic diversity of Q. wutaishanica forests can be used as one of the bases for the management, can provide theoretical references for the conservation and management of populations, and have certain guiding significance for the sustainable management of Quercus forests in the Loess Plateau region. Given the population structure of this Q. wutaishanica forest, it is suggested that more efforts should be made to nurture Q. wutaishanica forests in this area, selectively adopt disturbance and carry out artificial thinning, which is not only conducive to the renewal and development of populations, but also of great significance to the conservation of forest ecosystems and biodiversity in the Loess Plateau region.
In addition, this study has some limitations. The scale of this study was small, and only a 50 m × 50 m sample plot was investigated. Subsequent studies can expand the scale and the research object and continue the survey sampling analysis to make the results more credible and scientific, and provide a theoretical basis for the conservation of this natural secondary forest.

Author Contributions

Conceptualization, D.H. (Dong Hu), M.Y. and Y.C.; investigation, Y.X., T.T., K.W., P.L., M.W., J.Z. and D.H. (Dafu Hou); formal analysis, D.H. (Dong Hu), Y.X., K.W. and P.L.; writing—original draft, D.H. (Dong Hu); writing—review and editing, M.Y., Y.C. and D.H. (Dafu Hou); data curation, M.W. and J.Z.; supervision, M.Y. All authors have read and agreed to the published version of the manuscript.

Funding

This research was financially supported by the National Natural Science Foundation of China (41571500, 41871036).

Institutional Review Board Statement

Not applicable.

Informed Consent Statement

Not applicable.

Data Availability Statement

Not available.

Conflicts of Interest

The authors declare that they have no conflict of interest.

References

  1. Condit, R.; Ashton, P.S.; Baker, P.; Bunyavejchewin, S.; Gunatilleke, S.; Gunatilleke, N.; Hubbell, S.P.; Foster, R.B.; Itoh, A.; LaFrankie, J.V.; et al. Spatial Patterns in the Distribution of Tropical Tree Species. Science 2000, 288, 1414–1418. [Google Scholar] [CrossRef] [PubMed]
  2. Lydersen, J.M.; North, M.P.; Knapp, E.E.; Collins, B.M. Quantifying Spatial Patterns of Tree Groups and Gaps in Mixed-Conifer Forests: Reference Conditions and Long-Term Changes Following Fire Suppression and Logging. For. Ecol. Manag. 2013, 304, 370–382. [Google Scholar] [CrossRef]
  3. May, F.; Huth, A.; Wiegand, T. Moving beyond Abundance Distributions: Neutral Theory and Spatial Patterns in a Tropical Forest. Proc. Royal Soc. B 2015, 282, 20141657. [Google Scholar] [CrossRef]
  4. Lin, Y.; Chang, L.; Yang, K.; Wang, H.; Sun, I. Point Patterns of Tree Distribution Determined by Habitat Heterogeneity and Dispersal Limitation. Oecologia 2011, 165, 175–184. [Google Scholar] [CrossRef]
  5. Tuo, F.; Liu, X.; Liu, R.; Zhao, W.; Jing, W.; Ma, J.; Wu, X.; Zhao, J.; Ma, X. Spatial distribution patterns and association of Picea crassifolia population in Dayekou Basin of Qilian Mountains, northwestern China. Chin. J. Plant Ecol. 2020, 44, 1172–1183. [Google Scholar] [CrossRef]
  6. Huang, X.; Li, S.; Su, J.; Liu, W.; Lang, X. Distribution of Pinus yunnanensis Natural Population in Yunlong Tianchi National Nature Reserve. For. Res. 2018, 31, 47–52. [Google Scholar] [CrossRef]
  7. Liu, H.; Chen, Q.; Xu, Z.; Wu, C.; Chen, Y. Natural population structure and spatial distribution pattern of rare and endangered species Dacrydium pectinatum. Acta Ecol. Sin. 2020, 40, 2985–2995. [Google Scholar] [CrossRef]
  8. Martínez, I.; Wiegand, T.; González-Taboada, F.; Obeso, J.R. Spatial Associations among Tree Species in a Temperate Forest Community in North-Western Spain. For. Ecol. Manag. 2010, 260, 456–465. [Google Scholar] [CrossRef]
  9. Tilman, D. Resource Competition between Plankton Algae: An Experimental and Theoretical Approach. Ecology 1977, 58, 338–348. [Google Scholar] [CrossRef]
  10. Wright, A.; Schnitzer, S.A.; Reich, P.B. Living Close to Your Neighbors: The Importance of Both Competition and Facilitation in Plant Communities. Ecology 2014, 95, 2213–2223. [Google Scholar] [CrossRef] [Green Version]
  11. Peters, H.A. Neighbour-Regulated Mortality: The Influence of Positive and Negative Density Dependence on Tree Populations in Species-Rich Tropical Forests. Ecol. Lett. 2003, 6, 757–765. [Google Scholar] [CrossRef]
  12. Getzin, S.; Dean, C.; He, F.A.; Trofymow, J.; Wiegand, K.; Wiegand, T. Spatial Patterns and Competition of Tree Species in a Douglas-Fir Chronosequence on Vancouver Island. Ecography 2006, 29, 671–682. [Google Scholar] [CrossRef]
  13. Zhang, C.; Jin, W.; Gao, L.; Zhao, X. Scale Dependent Structuring of Spatial Diversity in Two Temperate Forest Communities. For. Ecol. Manag. 2014, 316, 110–116. [Google Scholar] [CrossRef]
  14. Tilman, D. Resource Competition and Community Structure; Princeton University Press: Princeton, NJ, USA, 1982; ISBN 978-0-691-08302-5. [Google Scholar]
  15. Hughes, A.R.; Inouye, B.D.; Johnson, M.T.J.; Underwood, N.; Vellend, M. Ecological Consequences of Genetic Diversity. Ecol Lett 2008, 11, 609–623. [Google Scholar] [CrossRef] [PubMed]
  16. Liu, X.; Etienne, R.S.; Liang, M.; Wang, Y.; Yu, S. Experimental Evidence for an Intraspecific Janzen-Connell Effect Mediated by Soil Biota. Ecology 2015, 96, 662–671. [Google Scholar] [CrossRef] [PubMed]
  17. Campoy, J.A.; Lerigoleur-Balsemin, E.; Christmann, H.; Beauvieux, R.; Girollet, N.; Quero-García, J.; Dirlewanger, E.; Barreneche, T. Genetic Diversity, Linkage Disequilibrium, Population Structure and Construction of a Core Collection of Prunus Avium L. Landraces and Bred Cultivars. BMC Plant Biol. 2016, 16, 49. [Google Scholar] [CrossRef]
  18. Mas-Gómez, J.; Cantín, C.M.; Moreno, M.Á.; Prudencio, Á.S.; Gómez-Abajo, M.; Bianco, L.; Troggio, M.; Martínez-Gómez, P.; Rubio, M.; Martínez-García, P.J. Exploring Genome-Wide Diversity in the National Peach (Prunus persica) Germplasm Collection at CITA (Zaragoza, Spain). Agronomy 2021, 11, 481. [Google Scholar] [CrossRef]
  19. Topp, B.L.; Russell, D.M.; Neumüller, M.; Dalbó, M.A.; Liu, W. Plum. In Fruit Breeding; Badenes, M.L., Byrne, D.H., Eds.; Springer: Boston, MA, USA, 2012; pp. 571–621. ISBN 978-1-4419-0762-2. [Google Scholar]
  20. Mason, A.S. SSR Genotyping. Methods Mol. Biol. 2015, 1245, 77–89. [Google Scholar] [CrossRef]
  21. Vieira, M.L.C.; Santini, L.; Diniz, A.L.; Munhoz, C.d.F. Microsatellite Markers: What They Mean and Why They Are so Useful. Genet. Mol. Biol. 2016, 39, 312–328. [Google Scholar] [CrossRef]
  22. Dow, B.D.; Ashley, M.V. Factors Influencing Male Mating Success in Bur Oak, Quercus Macrocarpa. New For. 1998, 15, 161–180. [Google Scholar] [CrossRef]
  23. Lefort, F.; Echt, C.; Streiff, R.; Giovanni Giuseppe, V. Microsatellite Sequences: A New Generation of Molecular Markers for Forest Genetics. For. Genet. 1999, 6, 15–20. [Google Scholar]
  24. Lefort, F.; Lally, M.; Thompson, D.; Douglas, G. Morphological Traits, Microsatellite Fingerprinting and Genetic Relatedness of a Stand of Elite Oaks (Q. Robur L.) at Tullynally, Ireland. Silvae Genet. 1998, 47, 257–262. [Google Scholar]
  25. Liu, M. The Research on Genetic Evolution Relationship of Quercus. mongolia and Quercus. wutaishanica. Master’s Thesis, Northeast Forestry University, Haerbin, China, 2012. [Google Scholar]
  26. Qin, Y. Study on the Genetic Diversity of Quercus liaotungensis Natural Population in Shanxi Province. Master’s Thesis, Beijing Forestry University, Beijing, China, 2012. [Google Scholar]
  27. Zeng, Y.; Liao, W.; Petit, R.J.; Zhang, D. Exploring Species Limits in Two Closely Related Chinese Oaks. PLoS ONE 2010, 5, e15529. [Google Scholar] [CrossRef]
  28. Wang, M.; Xu, J.; Chai, Y.; Guo, Y.; Liu, X.; Yue, M. Differentiation of Environmental Conditions Promotes Variation of Two Quercus Wutaishanica Community Assembly Patterns. Forests 2020, 11, 43. [Google Scholar] [CrossRef]
  29. Chen, C.; Liu, D.; Wu, J.; Kang, M.; Zhang, J.; Liu, Q.; Liang, Y. Leaf traits of Quercus wutaishanica and their relationship with topographic factors in Mount Dongling. Chin. J. Ecol. 2015, 34, 2131–2139. [Google Scholar] [CrossRef]
  30. Yang, J.; Lv, J.; He, Q.; Yan, M.; Li, G.; Du, S. Time lag of stem sap flow and its relationships with transpiration characteristics in Quercus liaotungensis and Robina pseudoacacia in the loess hilly region, China. Chin. J. Appl. Ecol. 2019, 30, 2607–2613. [Google Scholar] [CrossRef]
  31. Ou, R.; Yan, X.; Ma, H.; Jiang, Y. Predation and removal of Quercus wutaishanica and Prunus davidiana seeds of different size by rodents. Seed 2017, 36, 76–80. [Google Scholar] [CrossRef]
  32. Chai, Y.; Yue, M.; Liu, X.; Guo, Y.; Wang, M.; Xu, J.; Zhang, C.; Chen, Y.; Zhang, L.; Zhang, R. Patterns of Taxonomic, Phylogenetic Diversity during a Long-Term Succession of Forest on the Loess Plateau, China: Insights into Assembly Process. Sci. Rep. 2016, 6, 27087. [Google Scholar] [CrossRef] [PubMed]
  33. Chai, Y.; Yue, M.; Wang, M.; Xu, J.; Liu, X.; Zhang, R.; Wan, P. Plant Functional Traits Suggest a Change in Novel Ecological Strategies for Dominant Species in the Stages of Forest Succession. Oecologia 2016, 180, 771–783. [Google Scholar] [CrossRef]
  34. Li, Y.; Shao, M. The change of plant diversity during natural recovery process of vegetation in Ziwuling area. Acta Ecol. Sin. 2004, 24, 252–260. [Google Scholar] [CrossRef]
  35. Wang, J.; Chen, Y.; Cao, Y.; Zhou, J.; Hou, L. Carbon concentration and carbon storage in different components of natural Quercus wutaishanica forest in Ziwuling of Loess Plateau, Northwest China. Chin. J. Ecol. 2012, 31, 3058–3063. [Google Scholar] [CrossRef]
  36. Zou, H.; Liu, G.; Wang, H. The vegetation development in North Ziwulin forest region in last fifty years. Acta Bot. Boreali Occident. Sin. 2002, 22, 1–8. [Google Scholar]
  37. Wang, S.; Wang, X.; Guo, H.; Fan, W.; Lv, H.; Duan, R. Distinguishing the Importance between Habitat Specialization and Dispersal Limitation on Species Turnover. Ecol. Evol. 2013, 3, 3545–3553. [Google Scholar] [CrossRef]
  38. Liu, P.; Wang, W.; Bai, Z.; Guo, Z.; Ren, W.; Huang, J.; Xu, Y.; Yao, J.; Ding, Y.; Zang, R. Competition and Facilitation Co-Regulate the Spatial Patterns of Boreal Tree Species in Kanas of Xinjiang, Northwest China. For. Ecol. Manag. 2020, 467, 118167. [Google Scholar] [CrossRef]
  39. Qiu, J.; Han, A.; He, C.; Yin, Q.; Jia, S.; Luo, Y.; Li, C.; Hao, Z. Spatial distribution pattern and intraspecific association of the dominant species Quercus aliena var. acutiserrata in Qinling Mountains, China. Chin. J. Appl. Ecol. 2022, 33, 1–9. [Google Scholar] [CrossRef]
  40. Hormaza, J.I. Molecular Characterization and Similarity Relationships among Apricot (Prunus armeniaca L.) Genotypes Using Simple Sequence Repeats. Theor. Appl. Genet. 2002, 104, 321–328. [Google Scholar] [CrossRef] [PubMed]
  41. Guerra, M.E.; Guerrero, B.I.; Casadomet, C.; Rodrigo, J. Self-(in)Compatibility, S-RNase Allele Identification, and Selection of Pollinizers in New Japanese Plum-Type Cultivars. Sci. Hortic. 2020, 261, 109022. [Google Scholar] [CrossRef]
  42. Guerra, M.E.; López-Corrales, M.; Wünsch, A. Improved S-Genotyping and New Incompatibility Groups in Japanese Plum. Euphytica 2012, 186, 445–452. [Google Scholar] [CrossRef]
  43. Guerrero, B.I.; Guerra, M.E.; Rodrigo, J. Establishing Pollination Requirements in Japanese Plum by Phenological Monitoring, Hand Pollinations, Fluorescence Microscopy and Molecular Genotyping. JoVE 2020, 165, e61897. [Google Scholar] [CrossRef]
  44. Kampfer, S.; Lexer, C.; Glössl, J.; Steinkellner, H. Characterization of (GA)n Microsatellite Loci from Quercus Robur. Hereditas 1998, 129, 183–186. [Google Scholar] [CrossRef]
  45. Steinkellner, H.; Fluch, S.; Turetschek, E.; Lexer, C.; Streiff, R.; Kremer, A.; Burg, K.; Glössl, J. Identification and Characterization of (GA/CT)n- Microsatellite Loci from Quercus petraea. Plant. Mol. Biol. 1997, 33, 1093–1096. [Google Scholar] [CrossRef] [PubMed]
  46. Aldrich, P.R.; Michler, C.H.; Sun, W.; Romero-Severson, J. Microsatellite Markers for Northern Red Oak (Fagaceae: Quercus rubra). Mol. Ecol. Notes 2002, 2, 472–474. [Google Scholar] [CrossRef]
  47. Berner, D. Allele Frequency Difference AFD–An Intuitive Alternative to FST for Quantifying Genetic Population Differentiation. Genes 2019, 10, 308. [Google Scholar] [CrossRef] [PubMed] [Green Version]
  48. Stölting, K.N.; Paris, M.; Meier, C.; Heinze, B.; Castiglione, S.; Bartha, D.; Lexer, C. Genome-Wide Patterns of Differentiation and Spatially Varying Selection between Postglacial Recolonization Lineages of Populus Alba (Salicaceae), a Widespread Forest Tree. New Phytol. 2015, 207, 723–734. [Google Scholar] [CrossRef]
  49. Chen, J.; Källman, T.; Ma, X.-F.; Zaina, G.; Morgante, M.; Lascoux, M. Identifying Genetic Signatures of Natural Selection Using Pooled Population Sequencing in Picea Abies. G3 Genes|Genomes|Genet. 2016, 6, 1979–1989. [Google Scholar] [CrossRef]
  50. Wiegand, T.A.; Moloney, K. Rings, Circles, and Null-Models for Point Pattern Analysis in Ecology. Oikos 2004, 104, 209–229. [Google Scholar] [CrossRef]
  51. Wiegand, T.; Moloney, K.A. Handbook of Spatial Point-Pattern Analysis in Ecology; Chapman and Hall/CRC Press: Boca Raton, FL, USA, 2013; ISBN 978-1-4200-8254-8. [Google Scholar]
  52. Suriguga; Zhang, J.; Cheng, J.; Zhang, B. Population structure and distribution pattern of dominant species in Tilia mandshurica forest in Dongling Mountain of Beijing. Chin. J. Ecol. 2009, 28, 1253–1258. [Google Scholar] [CrossRef]
  53. Zhang, X.; Zhang, X.; Guo, C.; Zhang, Q. Point pattern analysis of Pteroceltis tatarinowii population at its different development stages in limestone mountain area of north Anhui, East China. Chin. J. Ecol. 2013, 32, 542–550. [Google Scholar] [CrossRef]
  54. Shimada, T. Nutrient Compositions of Acorns and Horse Chestnuts in Relation to Seed-Hoarding. Ecol. Res. 2001, 16, 803–808. [Google Scholar] [CrossRef]
  55. Yang, X.; Anwar, E.; Zhou, J.; He, D.; Gao, Y.; Lv, G.; Cao, Y. Higher Association and Integration among Functional Traits in Small Tree than Shrub in Resisting Drought Stress in an Arid Desert. Environ. Exp. Bot. 2022, 201, 104993. [Google Scholar] [CrossRef]
  56. Zhu, Y.; Bai, F.; Liu, H.; Li, W.; Li, L.; Li, G.; Wang, S.; Sang, W. Population distribution patterns and interspecific spatial associations in warm temperate secondary forests, Beijing. Biodivers. Sci. 2011, 19, 252–259. [Google Scholar] [CrossRef]
  57. Gao, J.; Liu, Z.-L.; Zhao, W.; Tomlinson, K.W.; Xia, S.-W.; Zeng, Q.-Y.; Wang, X.-R.; Chen, J. Combined Genotype and Phenotype Analyses Reveal Patterns of Genomic Adaptation to Local Environments in the Subtropical Oak Quercus Acutissima. J. Syst. Evol. 2021, 59, 541–556. [Google Scholar] [CrossRef]
  58. Yang, M.; Zhang, M.; Shi, S.; Kang, Y.; Liu, J. Analysis of Genetic Structure of Magnolia sprengeri Populations Based on ISSR Markers. Sci. Silvae Sin. 2014, 50, 76–81. [Google Scholar] [CrossRef]
  59. Tian, H.; Kang, M.; Li, L.; Yao, X.; Huang, H. Genetic diversity in natural populations of Castanea mollissima inferred from nuclear SSR markers. Biodivers. Sci. 2009, 17, 296–302. [Google Scholar] [CrossRef]
  60. Tang, S.; Dai, W.; Li, M.; Zhang, Y.; Geng, Y.; Wang, L.; Zhong, Y. Genetic Diversity of Relictual and Endangered Plant Abies Ziyuanensis (Pinaceae) Revealed by AFLP and SSR Markers. Genetica 2008, 133, 21–30. [Google Scholar] [CrossRef]
  61. Song, Y.; Jiang, X.; Zhang, M.; Wang, Z.; Bo, W.; An, X.; Zhang, Z. Genetic differences revealed by Genomic-SSR and EST-SSR in poplar. J. Beijing For. Univ. 2010, 32, 1–7. [Google Scholar] [CrossRef]
  62. Wen, Y.; Han, W.; Wu, S. Plant genetic diversity and its influencing factors. J. Cent. South Univ. For. Technol. 2010, 30, 80–87. [Google Scholar] [CrossRef]
  63. O’Connell, L.M.; Mosseler, A.; Rajora, O.P. Extensive Long-Distance Pollen Dispersal in a Fragmented Landscape Maintains Genetic Diversity in White Spruce. J. Hered. 2007, 98, 640–645. [Google Scholar] [CrossRef]
  64. Rushton, B.S. Natural Hybridization within the Genus Quercus L. Ann. For. Sci. 1993, 50, 73s–90s. [Google Scholar] [CrossRef]
  65. Souza, I.G.B.; Souza, V.A.B.; Lima, P.S.C. Molecular Characterization of Platonia Insignis Mart. (“Bacurizeiro”) Using Inter Simple Sequence Repeat (ISSR) Markers. Mol. Biol. Rep. 2013, 40, 3835–3845. [Google Scholar] [CrossRef]
  66. Ma, X.; Zhao, C.; Zhang, Q.; Li, Y.; Hou, Z. Spatial pattern and spatial association of Melica przewalskyi and Artemisia frigida in degraded grassland. Chin. J. Ecol. 2013, 32, 299–304. [Google Scholar] [CrossRef]
  67. Zhang, J. Analysis of spatial point pattern for plant species. Acta Phytopathol. Sin. 1998, 22, 344–349. [Google Scholar]
  68. Jin, X.; Zhang, Q.; Xu, Q.; Ji, Y.; Bi, R. Population distribution patterns and interspecific spatial associations of Acanthopanax senticosus populations in Lingkong Mountain, Shanxi Province, China. Plant Sci. J. 2018, 36, 327–335. [Google Scholar] [CrossRef]
  69. Wiegand, T.; Gunatilleke, S.; Gunatilleke, N. Species Associations in a Heterogeneous Sri Lankan Dipterocarp Forest. Am. Nat. 2007, 170, e77–e95. [Google Scholar] [CrossRef] [PubMed] [Green Version]
  70. Liu, G.; Ding, Y.; Zang, R.; Guo, Z.; Zhang, X.; Cheng, K.; Bai, Z.; Ayoufu, B. Distribution patterns of Picea schrenkiana var. tianschanica population in Tianshan Mountains. Chin. J. Appl. Ecol. 2011, 22, 9–13. [Google Scholar] [CrossRef]
  71. Zhang, Z.; Hu, G.; Zhu, J.; Luo, D.; Ni, J. Spatial Patterns and Interspecific Associations of Dominant Tree Species in Two Old-Growth Karst Forests, SW China. Ecol. Res. 2010, 25, 1151–1160. [Google Scholar] [CrossRef]
  72. Carrer, M.; Castagneri, D.; Popa, I.; Pividori, M.; Lingua, E. Tree Spatial Patterns and Stand Attributes in Temperate Forests: The Importance of Plot Size, Sampling Design, and Null Model. For. Ecol. Manag. 2018, 407, 125–134. [Google Scholar] [CrossRef]
  73. Wang, X.; Ye, J.; Li, B.; Zhang, J.; Lin, F.; Hao, Z. Spatial Distributions of Species in an Old-Growth Temperate Forest, Northeastern China. Can. J. For. Res. 2010, 40, 1011–1019. [Google Scholar] [CrossRef]
  74. Jiang, D.; Tang, Y.; Busso, C.A. Effects of Vegetation Cover on Recruitment of Ulmus Pumila L. in Horqin Sandy Land, Northeastern China. J. Arid Land 2014, 6, 343–351. [Google Scholar] [CrossRef]
  75. Murrell, L.D.J. The Community-Level Consequence of Seed Dispersal Patterns. Annu. Rev. Ecol. Evol. Syst. 2003, 34, 549–574. [Google Scholar] [CrossRef]
  76. Ismail, S.A.; Ghazoul, J.; Ravikanth, G.; Kushalappa, C.G.; Uma Shaanker, R.; Kettle, C.J. Evaluating Realized Seed Dispersal across Fragmented Tropical Landscapes: A Two-Fold Approach Using Parentage Analysis and the Neighbourhood Model. New Phytol. 2017, 214, 1307–1316. [Google Scholar] [CrossRef] [PubMed]
  77. Bohrer, G.; Katul, G.G.; Nathan, R.; Walko, R.L.; Avissar, R. Effects of Canopy Heterogeneity, Seed Abscission and Inertia on Wind-Driven Dispersal Kernels of Tree Seeds. J. Ecol. 2008, 96, 569–580. [Google Scholar] [CrossRef]
  78. Liu, S.; Jiao, J.; Hu, S.; Wu, D.; Deng, N. Effect of flood runoff on seed dispersal and population regeneration—A case study of Salix matsudana in the Loess Hill and Gully Region. Res. Soil Water Conserv. 2018, 25, 99–103. [Google Scholar] [CrossRef]
  79. Fraver, S.; D’Amato, A.W.; Bradford, J.B.; Jonsson, B.G.; Jönsson, M.; Esseen, P.-A. Tree Growth and Competition in an Old-Growth Picea Abies Forest of Boreal Sweden: Influence of Tree Spatial Patterning. J. Veg. Sci. 2014, 25, 374–385. [Google Scholar] [CrossRef]
  80. Zhang, Y. Seed Rain Dynamics and Seedling Spatial Pattern of Deciduous Broad-Leaved Forest in Malan Forest Region of Loess Plateau. Master’s Thesis, Shaanxi Normal University, Xi’an, China, 2015. [Google Scholar]
  81. Wang, X.; Liang, C.; Wang, W. Balance between Facilitation and Competition Determines Spatial Patterns in a Plant Population. Chin. Sci. Bull. 2014, 59, 1405–1415. [Google Scholar] [CrossRef]
  82. Yang, X.; Miao, Y.; Zhang, Q.; Zhang, L.; Bi, R. Spatial Pattern Analysis of Individuals in Different Age-classes of Pinus bungeana in Wulu Mountain Reserve, Shanxi, China. Bull. Bot. Res. 2013, 33, 24–30. [Google Scholar]
  83. Shen, Z.; Hua, M.; Dan, Q.; Lu, J.; Fang, J. Spatial pattern analysis and associations of Quercus aquifolioides population at different growth stages in Southeast Tibet, China. Chin. J. Appl. Ecol. 2016, 27, 387–394. [Google Scholar] [CrossRef]
  84. Omelko, A.; Ukhvatkina, O.; Zhmerenetsky, A.; Sibirina, L.; Petrenko, T.; Bobrovsky, M. From Young to Adult Trees: How Spatial Patterns of Plants with Different Life Strategies Change during Age Development in an Old-Growth Korean Pine-Broadleaved Forest. For. Ecol. Manag. 2018, 411, 46–66. [Google Scholar] [CrossRef]
  85. Cai, F. A stuidy on the structure and dynamics of Cyclobalanopsis glauca population at hills around West Lake in Hangzhou. Sci. Silvae Sin. 2000, 36, 67–72. [Google Scholar] [CrossRef]
  86. Hubbell, S.P. Neutral Theory and the Evolution of Ecological Equivalence. Ecology 2006, 87, 1387–1398. [Google Scholar] [CrossRef]
  87. Brooker, R.W.; Maestre, F.T.; Callaway, R.M.; Lortie, C.L.; Cavieres, L.A.; Kunstler, G.; Liancourt, P.; Tielbörger, K.; Travis, J.M.J.; Anthelme, F.; et al. Facilitation in Plant Communities: The Past, the Present, and the Future. J. Ecol. 2008, 96, 18–34. [Google Scholar] [CrossRef]
  88. Metz, J.; Annighöfer, P.; Schall, P.; Zimmermann, J.; Kahl, T.; Schulze, E.-D.; Ammer, C. Site-Adapted Admixed Tree Species Reduce Drought Susceptibility of Mature European Beech. Glob. Chang. Biol. 2016, 22, 903–920. [Google Scholar] [CrossRef] [PubMed]
  89. Muhamed, H.; Maalouf, J.-P.; Michalet, R. Summer Drought and Canopy Opening Increase the Strength of the Oak Seedlings–Shrub Spatial Association. Ann. For. Sci. 2013, 70, 345–355. [Google Scholar] [CrossRef]
  90. Zanini, L.; Ganade, G.; Hübel, I. Facilitation and Competition Influence Succession in a Subtropical Old Field. Plant Ecol. 2006, 185, 179–190. [Google Scholar] [CrossRef]
  91. Kubota, Y. Spatial Pattern and Regeneration Dynamics in a Temperate Abies–Tsuga Forest in Southwestern Japan. J. For. Res. 2006, 11, 191–201. [Google Scholar] [CrossRef]
  92. Gray, L.; He, F. Spatial Point-Pattern Analysis for Detecting Density-Dependent Competition in a Boreal Chronosequence of Alberta. For. Ecol. Manag. 2009, 259, 98–106. [Google Scholar] [CrossRef]
  93. Muhamed, H.; Touzard, B.; Le Bagousse-Pinguet, Y.; Michalet, R. The Role of Biotic Interactions for the Early Establishment of Oak Seedlings in Coastal Dune Forest Communities. For. Ecol. Manag. 2013, 297, 67–74. [Google Scholar] [CrossRef]
  94. Comita, L.S.; Hubbell, S.P. Local Neighborhood and Species’ Shade Tolerance Influence Survival in a Diverse Seedling Bank. Ecology 2009, 90, 328–334. [Google Scholar] [CrossRef]
  95. Han, A.; Qiu, J.; He, C.; Yin, Q.; Jia, S.; Luo, Y.; Li, C.; Hao, Z. Spatial distribution patterns and intraspecific and interspecific associations of the dominant shrub species Lonicera fragrantissima var. lancifolia in Huangguan of Qinling Mountains, China. Chin. J. Appl. Ecol. 2022, 33, 1–9. [Google Scholar] [CrossRef]
Figure 1. Map of the study area showing (a) the sampling site in an elevation map of the administrative regions of the Shaanxi Province, and (b) the layout of the plot and quadrats.
Forests 13 01375 g001
Figure 2. Spatial distribution of the sample plot (a), and diameter at breast height (DBH) structure of the Quercus wutaishanica (b). Trees, red circles; saplings, blue triangle; seedlings, gray rectangle.
Forests 13 01375 g002
Figure 3. Univariate point pattern analyses show the spatial pattern using the pair-correlation function (ac), and bivariate point pattern analyses show intra-species spatial associations among three size classes (df) of Q. wutaishanica. Black lines indicated the g11(r)/g12(r) function, dotted lines indicated the upper and lower limits of the 99% confidence interval.
Forests 13 01375 g003
Table 1. Sequences and proper annealing temperature of 12 primer pairs.
LocusPrimer Sequence (5′–3′)Annealing Temperature (°C)
PL123-124(F) GCTTGAGAGTTGAGATTTGT55
(R) GCAACACCCTTTAACTACCA
PL127-128(F) GCAATTACAGGCTAGGCTGG55
(R) GTCTGGACCTAGCCCTCATG
PL125-126(F) CTTCACTGGCTTTTCCTCCT58
(R) TGAAGCCCTTGTCAACATGC
E79(F) CCATTAAAAGAAGCAGTATTTTGT52
(R) GCAACACTCAGCCTATATCTAGAA
E71(F) CGTCTATAAGTTCTTGGGTGA46
(R) GTAACTATGATGTGATTCTTACTTCA
Qden 05011(F) CCCACTCCCTGTCCATTGT59
(R) CACTGTGTGCTGCGACTTG
ssrQrZAG 96(F) CCCAGTCACATCCACTACTGTCC59
(R) GGTTGGGAAAAGGAGATCAGA
ssrQrZAG 7(F) CAACTTGGTGTTCGGATCAA55
(R) GTGCATTTCTTTTATAGCATTCAC
01b(F) GTTCAACAATTTTATTAGGGTGC56
(R) GCCTATTACACACAACAAGCC
02b(F) ATGTCAATATGGTCACCTACCG53
(R) TTTTTGTAGATTTTTAAGCACGC
04b(F) TTCCTTTTCCTCAGTTTGGG52
(R) CCCGCATCAAAGAACTATTG
10b(F) GAATGGATCTTCATTTATCGTTG55
(R) TCTGCATATTTTCAACATACATTTAG
Note: Bold are 5 pairs of primers with clear bands, good polymorphism, and high stability selected in this study.
Table 2. Genetic diversity in the different life stages in a population of Quercus wutaishanica.
Life StageLocusNNaNePICIHeHoFis
Trees and saplings02b10573.86770.55251.50150.74500.8000−0.0790
04b106229.35550.42532.52570.89730.82080.0810
10b99137.30600.52602.13230.86750.79800.0755
E71101115.67190.51561.91380.82780.8713−0.0578
E79105133.82150.29401.63150.74190.8952−0.2125
Mean13.26.00450.46271.94100.81590.8371
Trees02b5373.69850.52841.47580.77360.73660.0370
04b53189.34780.51932.48090.83020.9015−0.0713
10b49106.70670.67072.02500.71430.8597−0.1454
E7150105.76700.57671.93310.88000.83490.0451
E7953114.36520.39681.73780.83020.77830.0519
Mean11.25.97700.53841.93050.80570.8222
Saplings02b5263.91320.65221.49810.75170.8269−0.0752
04b53167.95750.49732.29680.88270.8113−0.0714
10b50137.81250.60102.19300.88080.88000.0008
E715195.22290.58031.81110.81650.8627−0.0462
E795283.13330.39171.33150.68750.9615−0.2740
Mean10.45.60790.54451.82610.80380.8685
Note: N, number of sampled individuals; Na, observed number of alleles; Ne, effective number of alleles; PIC, Polymorphism Information Content; I, Shannon’s information index; He, expected heterozygosity; Ho, observed heterozygosity; Fis, fixation index.
Publisher’s Note: MDPI stays neutral with regard to jurisdictional claims in published maps and institutional affiliations.

