Article

Sight versus Sound: Do Visual Assessments of Dead Standing Trees Reflect Acoustic Nondestructive Evaluations of Wood Quality?

1
United States Department of Interior, Bureau of Land Management, Lewistown, MT 59457, USA
2
College of Forest Resources and Environmental Sciences, Michigan Technological University, Houghton, MI 49931, USA
3
Forest Service, Forest Products Laboratory, United States Department of Agriculture, Madison, WI 53726, USA
4
Scion (New Zealand Forest Research Institute), Rotorua 3046, New Zealand
*
Authors to whom correspondence should be addressed.
Submission received: 15 September 2022 / Revised: 30 September 2022 / Accepted: 5 October 2022 / Published: 13 October 2022

Abstract

:
The forest industry typically uses visual appearance to evaluate the wood quality when salvaging dead standing trees. We investigated whether the visual appearance of white spruce (Picea glauca (Moench) Voss) defoliated by the spruce budworm (Choristoneura fumiferana (Clem.)) accurately reflects wood quality measured using nondestructive techniques. Longitudinal and transverse acoustic velocities were measured on white spruce, representing three condition categories assessed visually, ranging from live trees to dead standing trees with signs of decay. Generalized linear models were used to determine whether there were significant differences in longitudinal and transverse acoustic velocities among the visual categories. Longitudinal velocities significantly differed between the live and poorest visual categories. Transverse velocities did not differ by visual category. We found that tree appearance provides coarse but useful insight into intrinsic wood quality. We recommend that forest managers use acoustic, non-destructive technologies on marginal trees to measure the wood quality of salvaged trees to ensure the wood is utilized for the highest and best use thereby optimizing possible values.

1. Introduction

A challenge when marketing dead standing trees is the unpredictable decline in wood quality postmortem [1]. As a result, dead standing trees are often marketed for low-value products or left unsalvaged due to assumed poor wood quality. However, being able to accurately assess wood quality in salvage and pre-salvage timber sales would help stakeholders market timber for the highest value and ensure that timber is used for its highest and best use. This is particularly pertinent given the increasing prevalence of forest insect and disease outbreaks [2] and rising interest in salvaging dead standing trees.
One species of particular interest to the salvage timber market in the Great Lakes Region is white spruce (Picea glauca (Moench) Voss). This region experienced three consecutive years of increased tree defoliation by spruce budworm (Choristoneura fumiferana (Clem.)) from 2015 to 2017 [3,4,5]. Spruce budworm is a native species to the region that generally persists at low population densities, attacking suppressed and weakened spruce and balsam fir. However, its population has been documented to grow to outbreak proportions over a cycle of approximately 30–40 years [6]. During outbreaks that typically last 10–15 years, healthy spruce and balsam fir may be overwhelmed and succumb to consecutive years of spruce budworm defoliation [6]. Spruce and fir stands affected by the spruce budworm outbreaks decrease in value as the wood quality of the dead standing trees declines through an attack from secondary insects and decay fungi [1,6,7]. In addition, tree mortality caused by the spruce budworm may increase wildfire severity [8] and create a public safety hazard [9].
While dead standing trees provide important ecological functions [10], discovering a higher-value use of salvaged white spruce affected by the spruce budworm could increase utilization of this wood source and ease the economic and safety problems associated with spruce budworm outbreaks. Currently, the industry typically utilizes visual assessments of wood quality in standing dead trees prior to salvaging a stand. For example, the US Forest Service Forest Inventory and Analysis (FIA) data collection protocol classifies dead standing trees into five decay classes based on a visual assessment of fine branches, limbs, bark, sap, and heartwood [11]. However, it is not clear if these decay classes accurately reflect measured wood quality characteristics.
The development and use of technologies that accurately determine wood quality through nondestructive evaluation of standing live trees are increasing. The goal of these efforts is to develop techniques that are relatively simple to implement, do not require the destruction of a sample, and can provide information on intrinsic wood quality [12]. The improved knowledge of intrinsic wood quality in standing trees through the use of nondestructive evaluation may help stakeholders sort and market timber to increase revenue [13]. Two specific nondestructive measurements of interest which are known to correlate to tree intrinsic wood quality [12] are longitudinal and transverse acoustic velocity. The time-of-flight (TOF) method is typically used to measure these acoustic velocities in standing trees [14] by inserting two probes, one sending and one receiving, into the sapwood of a tree’s bole. Acoustic energy is produced with a tap of a hammer against the sending probe, and the amount of time taken for the leading edge of the acoustic wave to travel from the sending to receiving probe, so-called TOF, is recorded [14]. The velocity of the acoustic wave can then be calculated. The placement of probes on a tree’s bole determines the travel direction of the acoustic wave relative to the anatomical direction—along the longitudinal or transverse planes.
The acoustic velocities along the stem’s longitudinal and transverse directions provide distinctive information, indicating different wood quality characteristics. For example, Wang et al. [15] showed that dynamic modulus of elasticity (MOE) estimated from longitudinal acoustic measurements on standing trees correlates well with statically determined MOE. On the other hand, transverse acoustic measurements may be used to indicate decay, or lack thereof, within the bole of standing trees [16]. Transverse acoustic waves travel directly across the diameter of a structurally sound tree. Internal decay and defects cause the path of transverse acoustic waves to deviate towards the outerwood, or circumference, of the bole in the transverse plane resulting in a lower acoustic velocity. Therefore, internal decay within standing trees of the same species can be inferred from a reduced transverse velocity [16]. To date, most studies of nondestructive evaluation that investigate longitudinal or transverse acoustic velocities and their implications for intrinsic wood quality have focused on live trees.
While a substantial effort has been made to interpret the wood quality using acoustic measurements on live trees, little is known about the ability of acoustic nondestructive evaluation to predict the intrinsic wood quality of dead standing trees. Wang et al. [17] found that longitudinal acoustic velocity can predict the static MOE in both live and dead jack pine (Pinus banksiana) logs after harvest. However, nondestructive evaluation for the jack pine study was conducted on butt logs rather than standing trees [17]. While Wang et al. [17] are applicable in determining the value of salvaged jack pine post-harvest, little information is available on the application of nondestructive evaluation to aid in sorting dead standing trees prior to salvage. In addition, considering the difference in appearance between live and dead standing trees, little is written about the correlation between tree appearance, the prevalent method of grading salvage timber, and non-destructive wood quality measurements.
Our aim in this study was to inform techniques used to efficiently sort white spruce salvaged after a spruce budworm outbreak for the highest and best use to optimize value. Nondestructive evaluation of dead standing white spruce prior to harvest could help in predicting the quality of wood within the measured trees. However, measuring wood quality, via nondestructive evaluation, of every tree within salvage or pre-salvage harvests may not always be feasible or economical. Therefore, the specific objective of this study was to investigate whether the visual appearance of white spruce defoliated by the spruce budworm accurately reflects wood quality measured using nondestructive techniques. This paper is part of a Master’s Thesis by the first author, available online at https://0-doi-org.brum.beds.ac.uk/10.37099/mtu.dc.etdr/730/ (accessed on 4 October 2022) [18].

2. Materials and Methods

2.1. Study Site

The white spruce assessed for this study were located in a stand managed by the Ottawa National Forest, approximately 9 miles West of Iron River, MI (46°5.1333′ N, 88°47.516′ W). The white spruce was planted into a degraded, sugar maple-dominated, northern hardwood stand at an unknown date [19]. Prior to salvage, the stand was dominated by white spruce with sugar maple and a minor component of other northern hardwood species (Table 1). Analysis of increment cores from six large, live white spruce at a height of 0.15 m suggests that the trees were planted in approximately the mid to late 1940s.
Wabeno-Goodwit silt loams and Monico loam are the predominant soil types within the stand, with slopes within the stand ranging from 0% to 15% [20]. The annual normal temperature for this area ranges between −15 and 27 °C [21], and average annual precipitation is 78 cm [22]. The site index for white spruce within the stand is 49, indicating that it is a moderate site for this region [23].
A large portion of white spruce within the stand was defoliated by the spruce budworm during our initial site visit in June 2017. At that time, the condition of individual white spruce within the stand varied greatly, ranging from completely defoliated and dead-standing trees to healthy, vigorous trees with almost no apparent defoliation. The year this increase in spruce budworm attack began, noticeably defoliating white spruce within this stand, is unknown [19]; however, an increase in spruce budworm defoliation in Michigan’s Western Upper Peninsula has been observed in forest health surveys since 2014 [3].

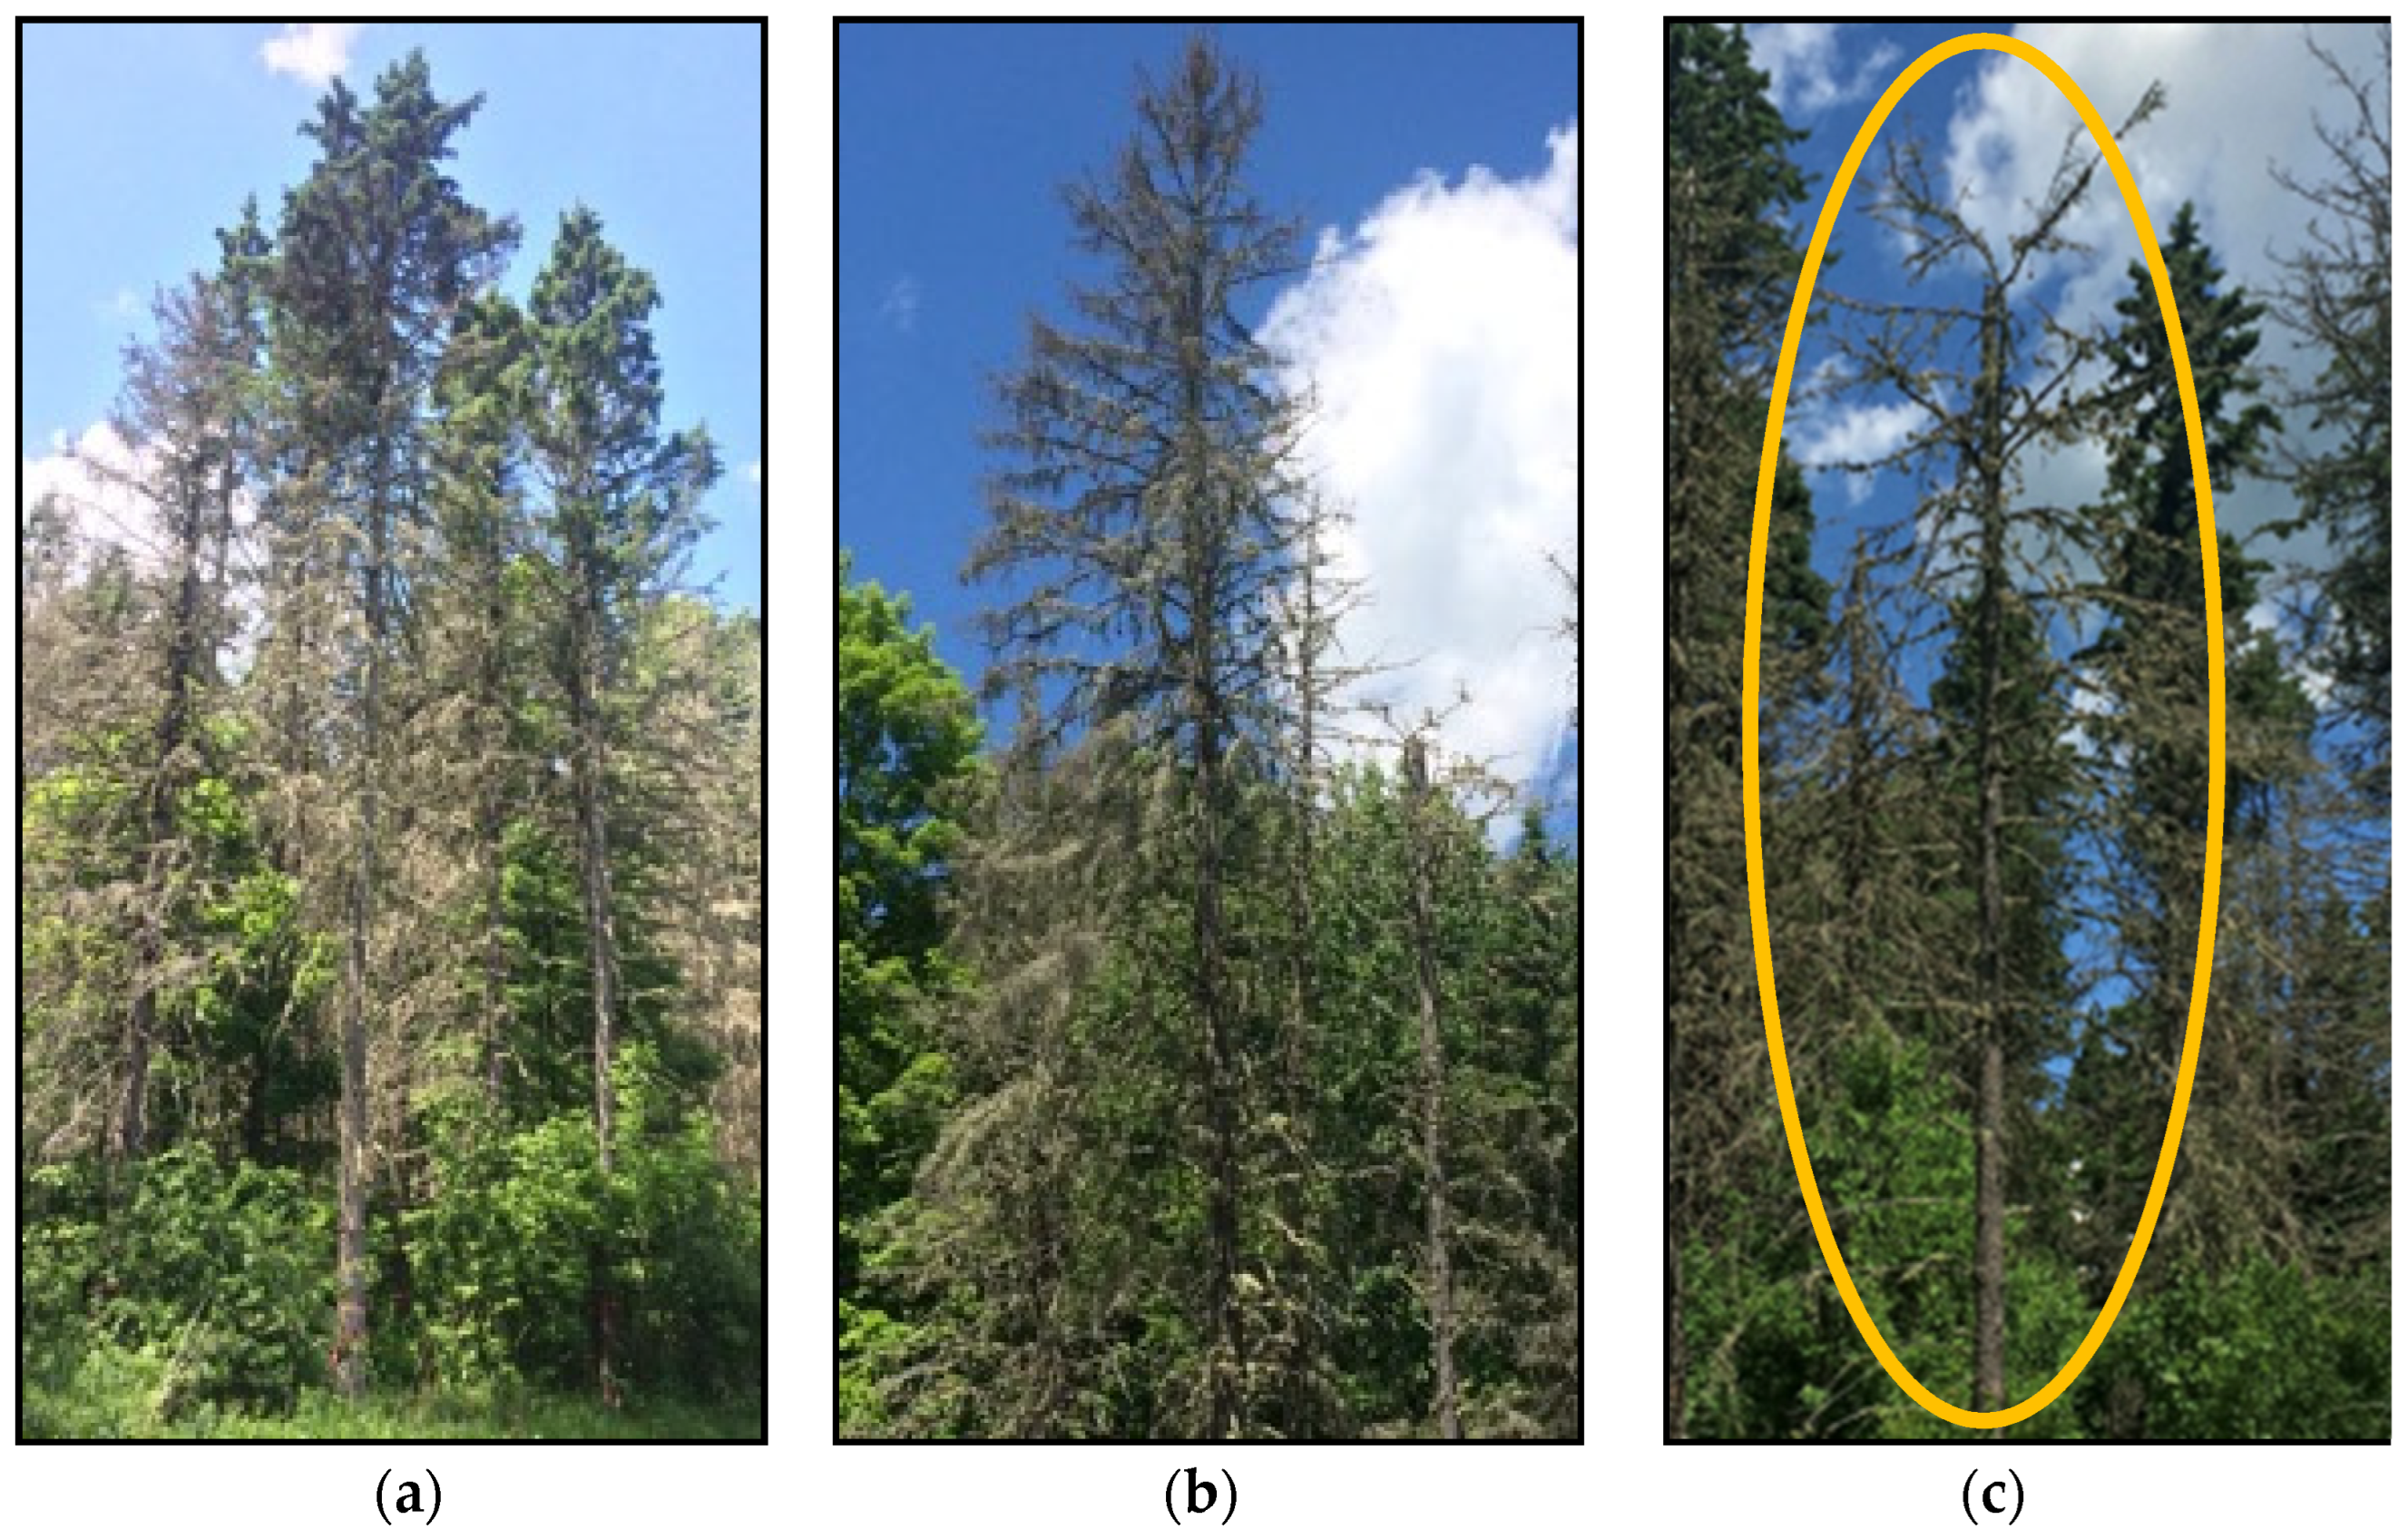
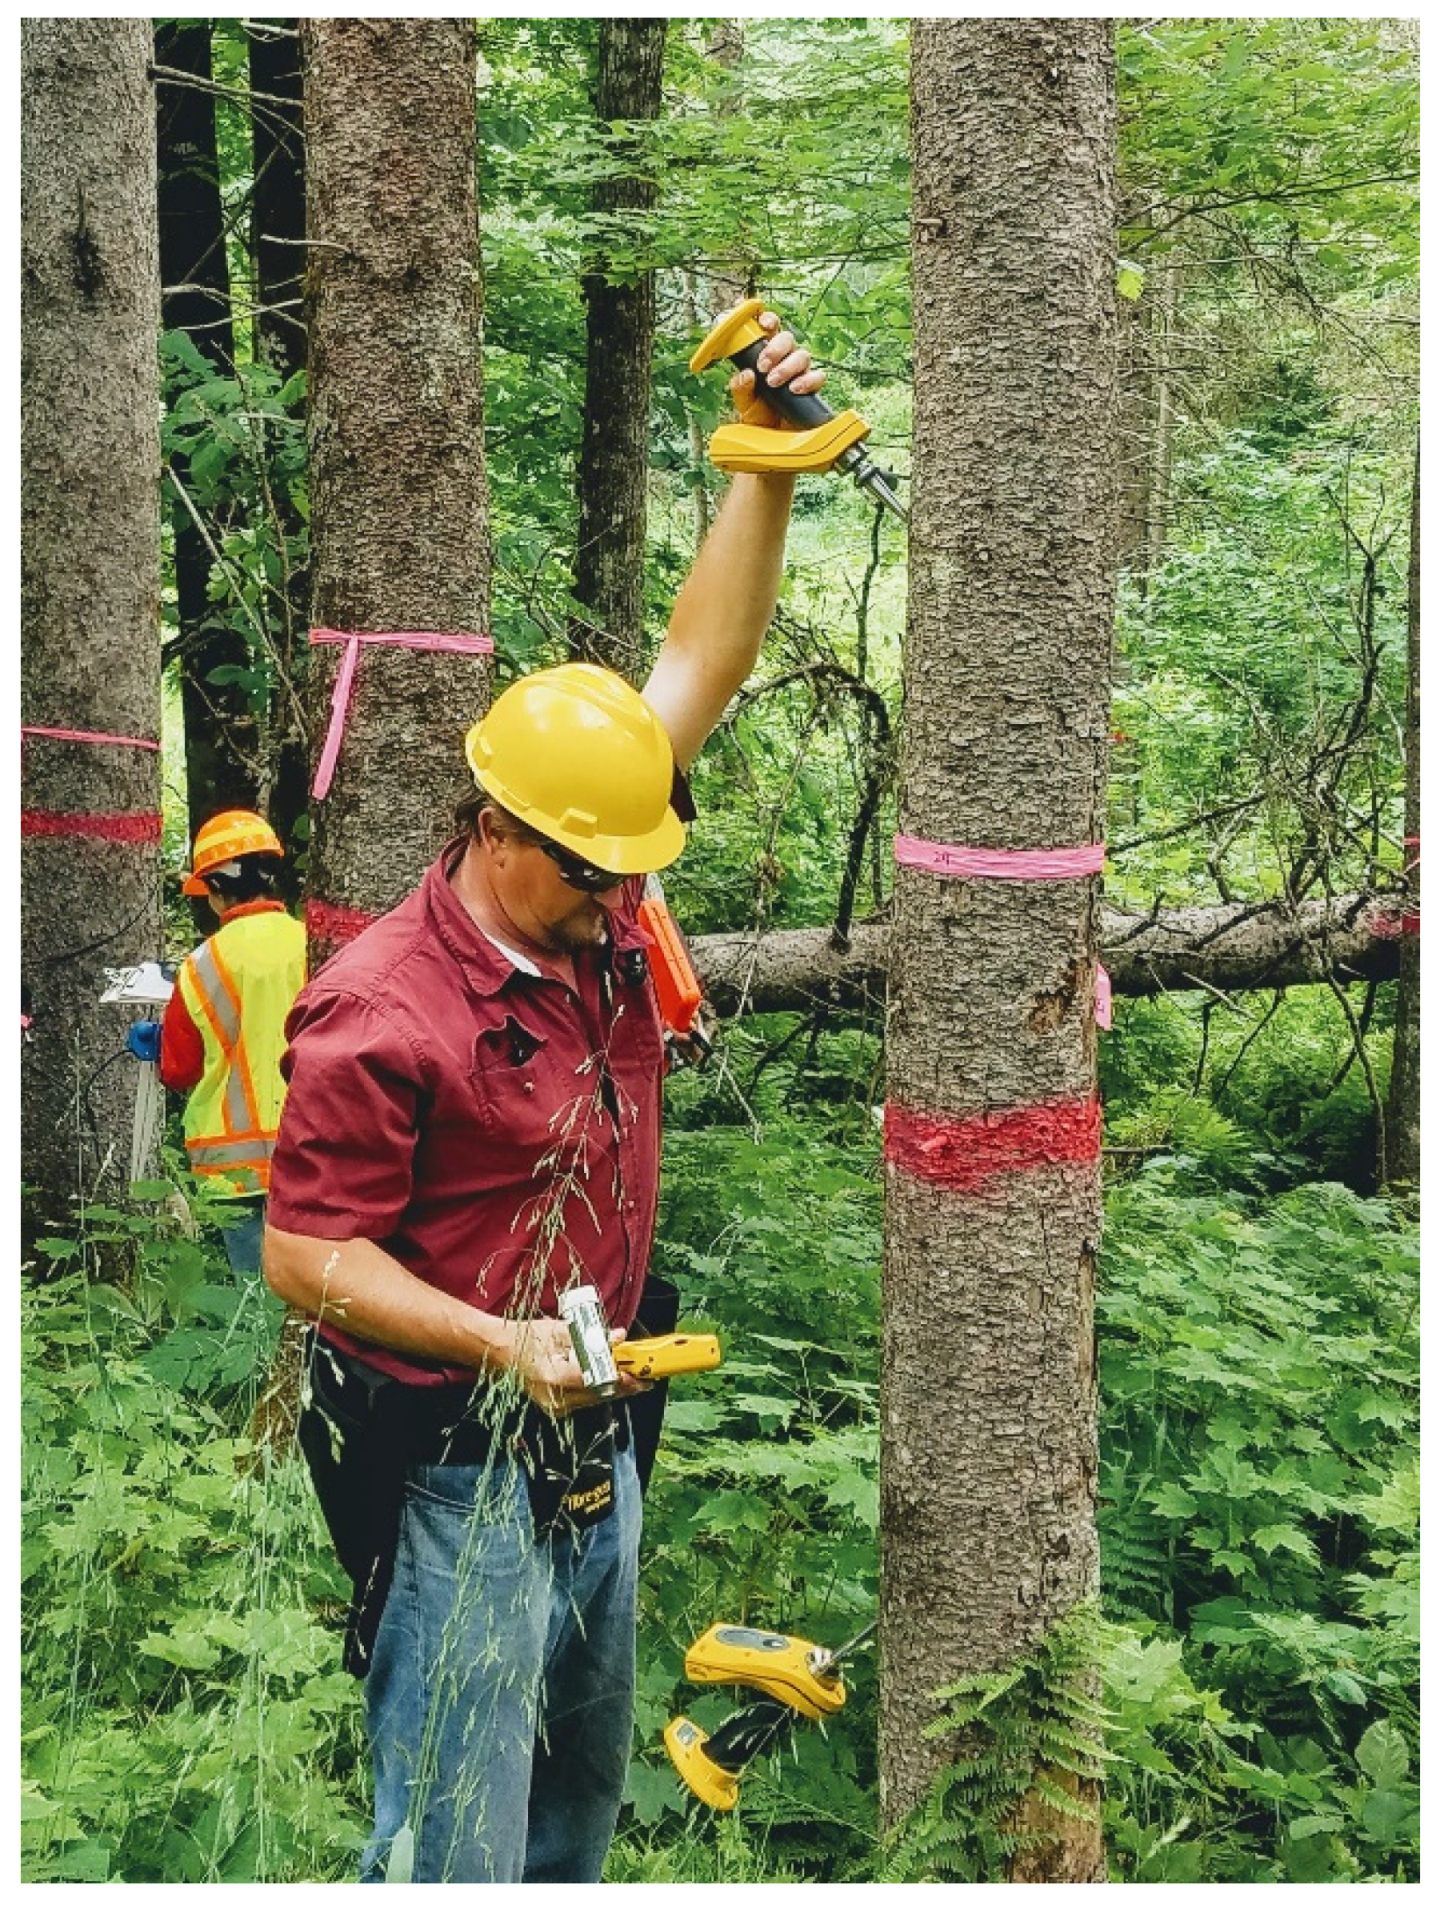
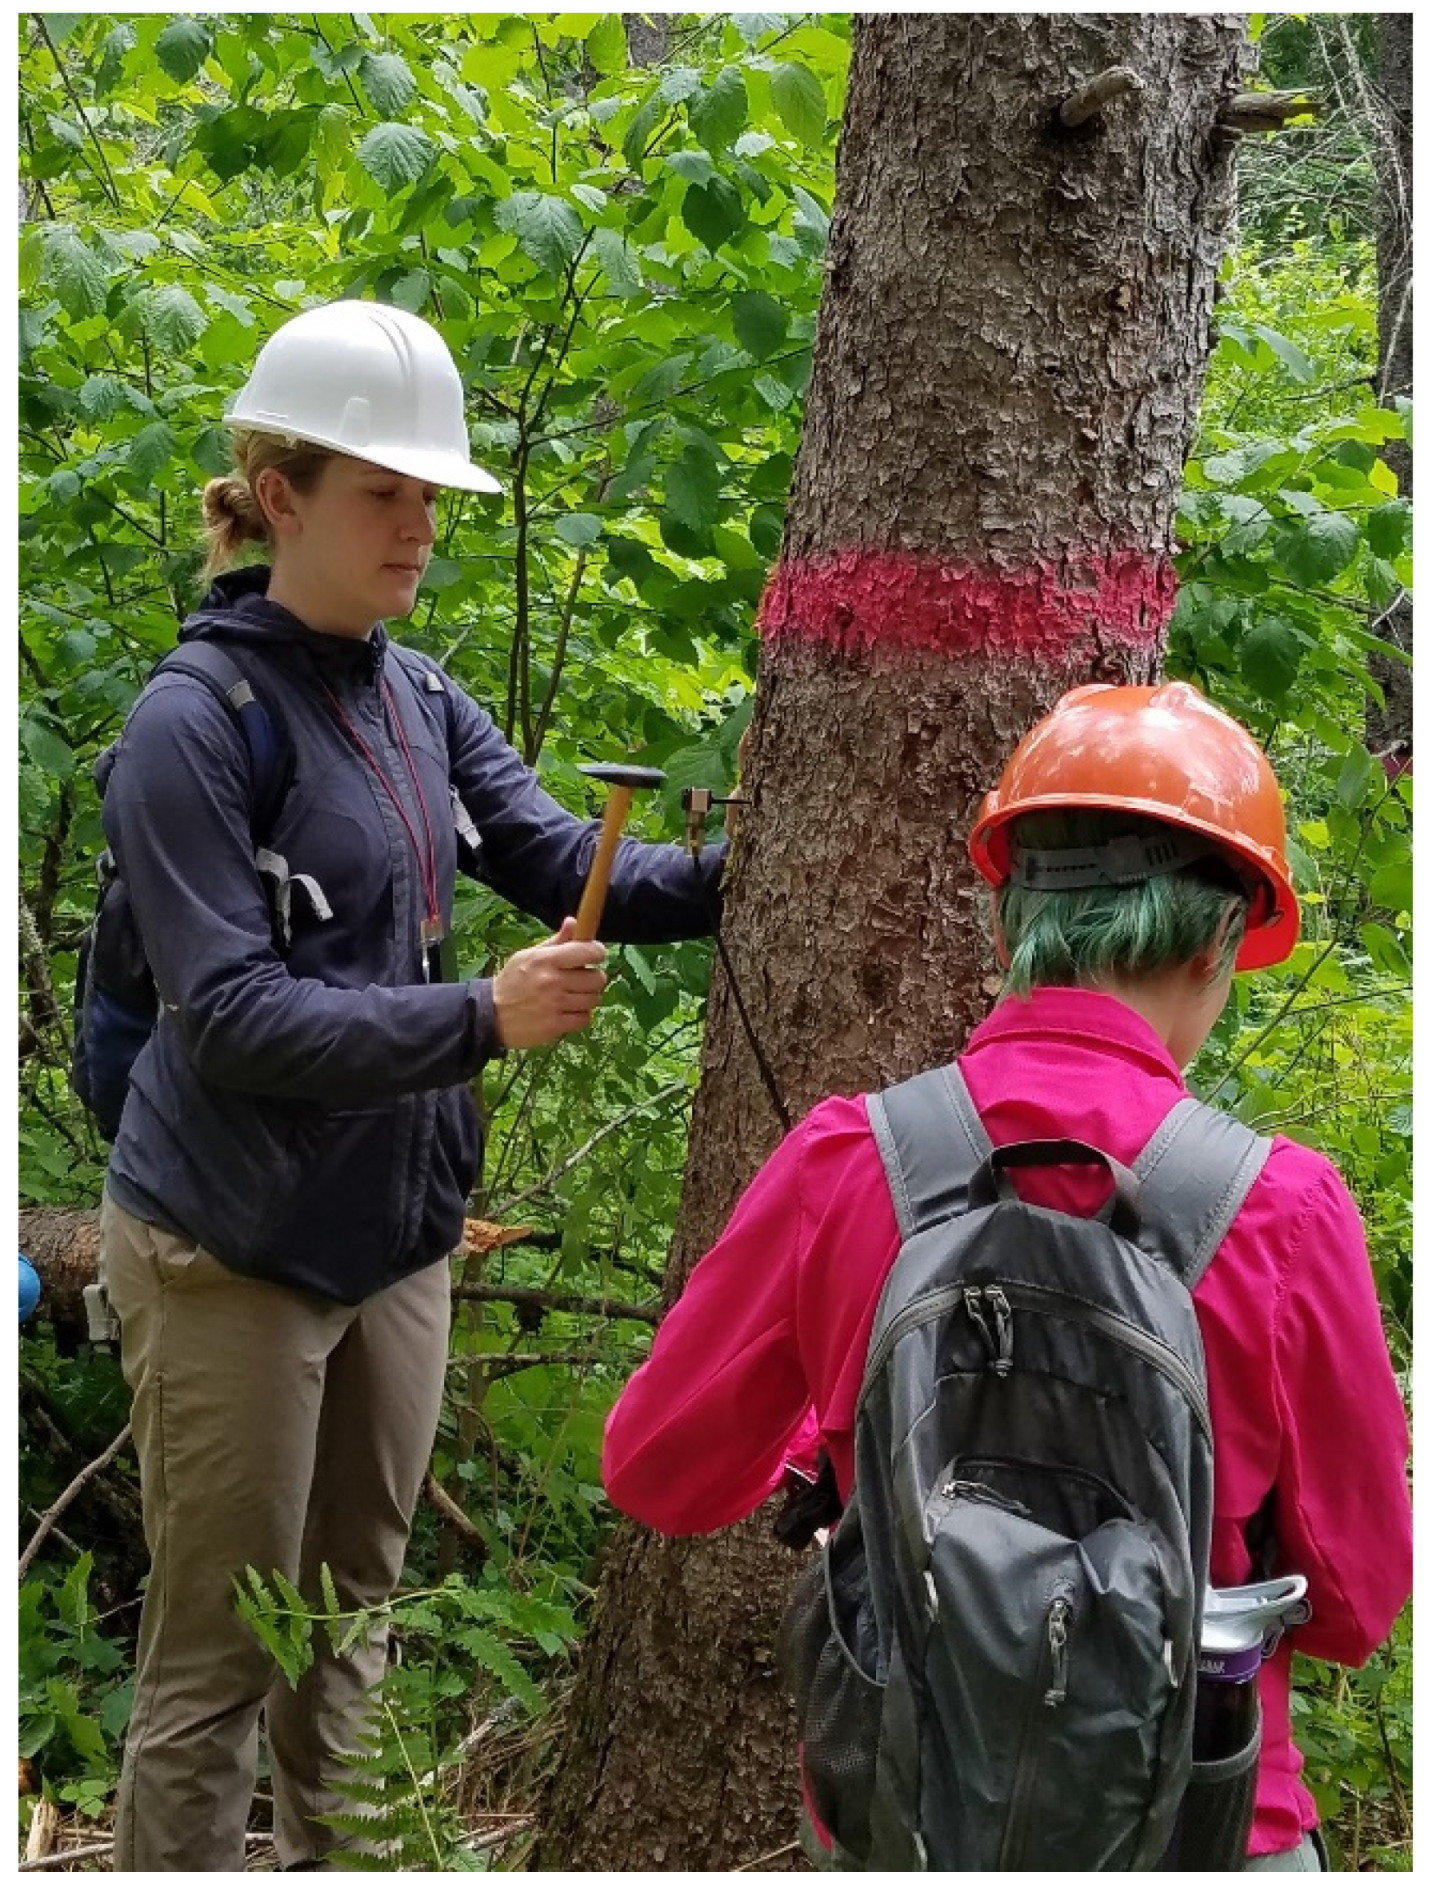
2.2. Field Data Collection

One hundred forty-nine mature white spruce were selected across a gradient of spruce budworm defoliation and decline at the study site in June 2017. To minimize disruption to a concurrent commercial harvest in this stand, study trees were selected in clusters that contained between 12 to 59 trees. Approximately 50 trees were selected in each of three distinct categories defined using visual characteristics of decline and decay [11] (Figure 1).
Category 1 (n = 50) included live trees with any amount of visible green foliage, including those with some sign of spruce budworm defoliation. Given the findings of Basham [1], we expected that live trees which have been heavily defoliated by the spruce budworm would contain wood of the same quality as unaffected, healthy trees. In addition, category 1 trees may represent timber produced from pre-salvage harvests intended to minimize loss from expected spruce budworm outbreaks, such as those recommended under current forest management guidelines [4].
In contrast, category 2 (n = 49) included dead-standing white spruce with no visible green foliage. category 2 trees had reddish-brown foliage and most of the fine, needle-bearing branches intact. White spruce within category 2 were assumed to have died relatively recently due to the presence of fine branches and attached brown foliage. We expected these recently dead trees would be suitable for salvage harvest because Basham [7] found that time since death was a good indicator of wood decay in balsam fir (Abies balsamea) attacked by the spruce budworm.
Lastly, category 3 represented dead standing white spruce with the poorest visual appearance. The category 3 trees (n = 50) were characterized as having no visible green foliage and fine, needle-bearing branches largely absent. Trees with no visible green foliage and broken tops were also included in category 3. Insect and fungal attacks within trees’ stems are the major cause of post mortem wood decay [1,6,7]. We expected that standing trees with no green foliage and few fine branches to have been dead for some time and have poorer wood quality due to the longer duration of insect and fungal damage. Further, we expected that the wood quality of Category 3 trees would be unsuitable for utilization.
To compare measured wood quality between the visual categories, we evaluated each tree using two acoustic non-destructive evaluation tools. Longitudinal acoustic velocity (km·s−1) was measured using a Hitman ST300 (Fibre-gen Ltd., Christchurch, New Zealand; Figure 2). Longitudinal acoustic wave velocity measurements were centered at breast height (1.4 m), with the tool’s probes vertically spaced 1.2 m apart on the East side of each tree (Figure 2). The sending probe was located at a height of 0.8 m, while the receiving probe was inserted at a height of 2.0 m. Longitudinal acoustic velocity was measured three times per tree, and the mean velocity was calculated.
In addition, transverse acoustic velocity was measured on each tree using the Fakopp Microsecond Timer (Fakopp Enterprise, Agfalva, Hungary; Figure 3). These measurements were taken at breast height (1.4 m) on each tree in two orthogonal directions: North-South, and East-West. To measure transverse velocity, sending and receiving probes were inserted horizontally into the sapwood of each tree at opposite sides of the bole. The diameter of the tree between the probes was measured using a tree caliper, and the sending probe was tapped with a hammer 3–5 times until the readings ranged within 2 microseconds of each other. This procedure was repeated to produce three recorded TOF data. Transverse acoustic velocity was calculated using the tree diameter at the point of measurement and the time taken for the leading edge of the acoustic wave to travel from sending probe to receiving probe. Six transverse acoustic velocities were calculated per tree—three in the North-South direction and three in the East-West direction, and the overall mean velocity was calculated.
Moisture content affects the acoustic velocity of wood [24,25,26,27], and the moisture content of stems of trees attacked by the spruce budworm is expected to decline after death [1]. Therefore, the moisture content of each tree was measured and included as a covariate in our analyses. A moisture sample of each white spruce was collected as the tree was harvested in October 2017. A 7.6 cm thick disc was cut from the lower end of each tree’s butt log and stored in a sealed bag to prevent moisture loss during transport. A wood strip of 5.1 cm by 5.1 cm cross-section intersecting the pith of the disc and spanning the disc’s diameter was cut. The wet weight of each wood sample was recorded, and the samples were stored in a freezer to further reduce potential moisture loss. The samples were oven dried in batches at a temperature of 105 °C for 7 days until a consistent weight was achieved. The moisture content of each sample was calculated using oven-dry and wet mass according to the oven-dry method [28].

2.3. Data Analysis

Initially, ANOVA with a post hoc Tukey test was used to determine if there were statistically significant differences among the decay categories in terms of wood moisture content. Following this, generalized linear models with post hoc Tukey tests were used to determine if there were statistically significant differences in longitudinal and transverse acoustic velocities among the three visual categories. Specifically, a generalized linear model was used to determine whether visual category explained variations for each of the two acoustic nondestructive evaluation measurements. The mean acoustic velocity calculated for each tool was the dependent variable in each generalized linear model, with visual decay category as an independent explanatory variable. Moisture content was also included as an independent covariate in each model because it was determined that there were statistically significant differences among the decay categories. To fulfill the assumptions of linear models, moisture content (%) was log-transformed, and transverse acoustic velocities were raised to the fourth power. All models were evaluated using an alpha value of 0.05. Where acoustic velocity varied significantly among the visual categories overall, post hoc Tukey tests were used to compare each of the three visual categories. R 3.5.1 (R Foundation for Statistical Computing, Vienna, Austria) was used for all data analysis, with the multcomp [29] and margins [30] packages.

3. Results

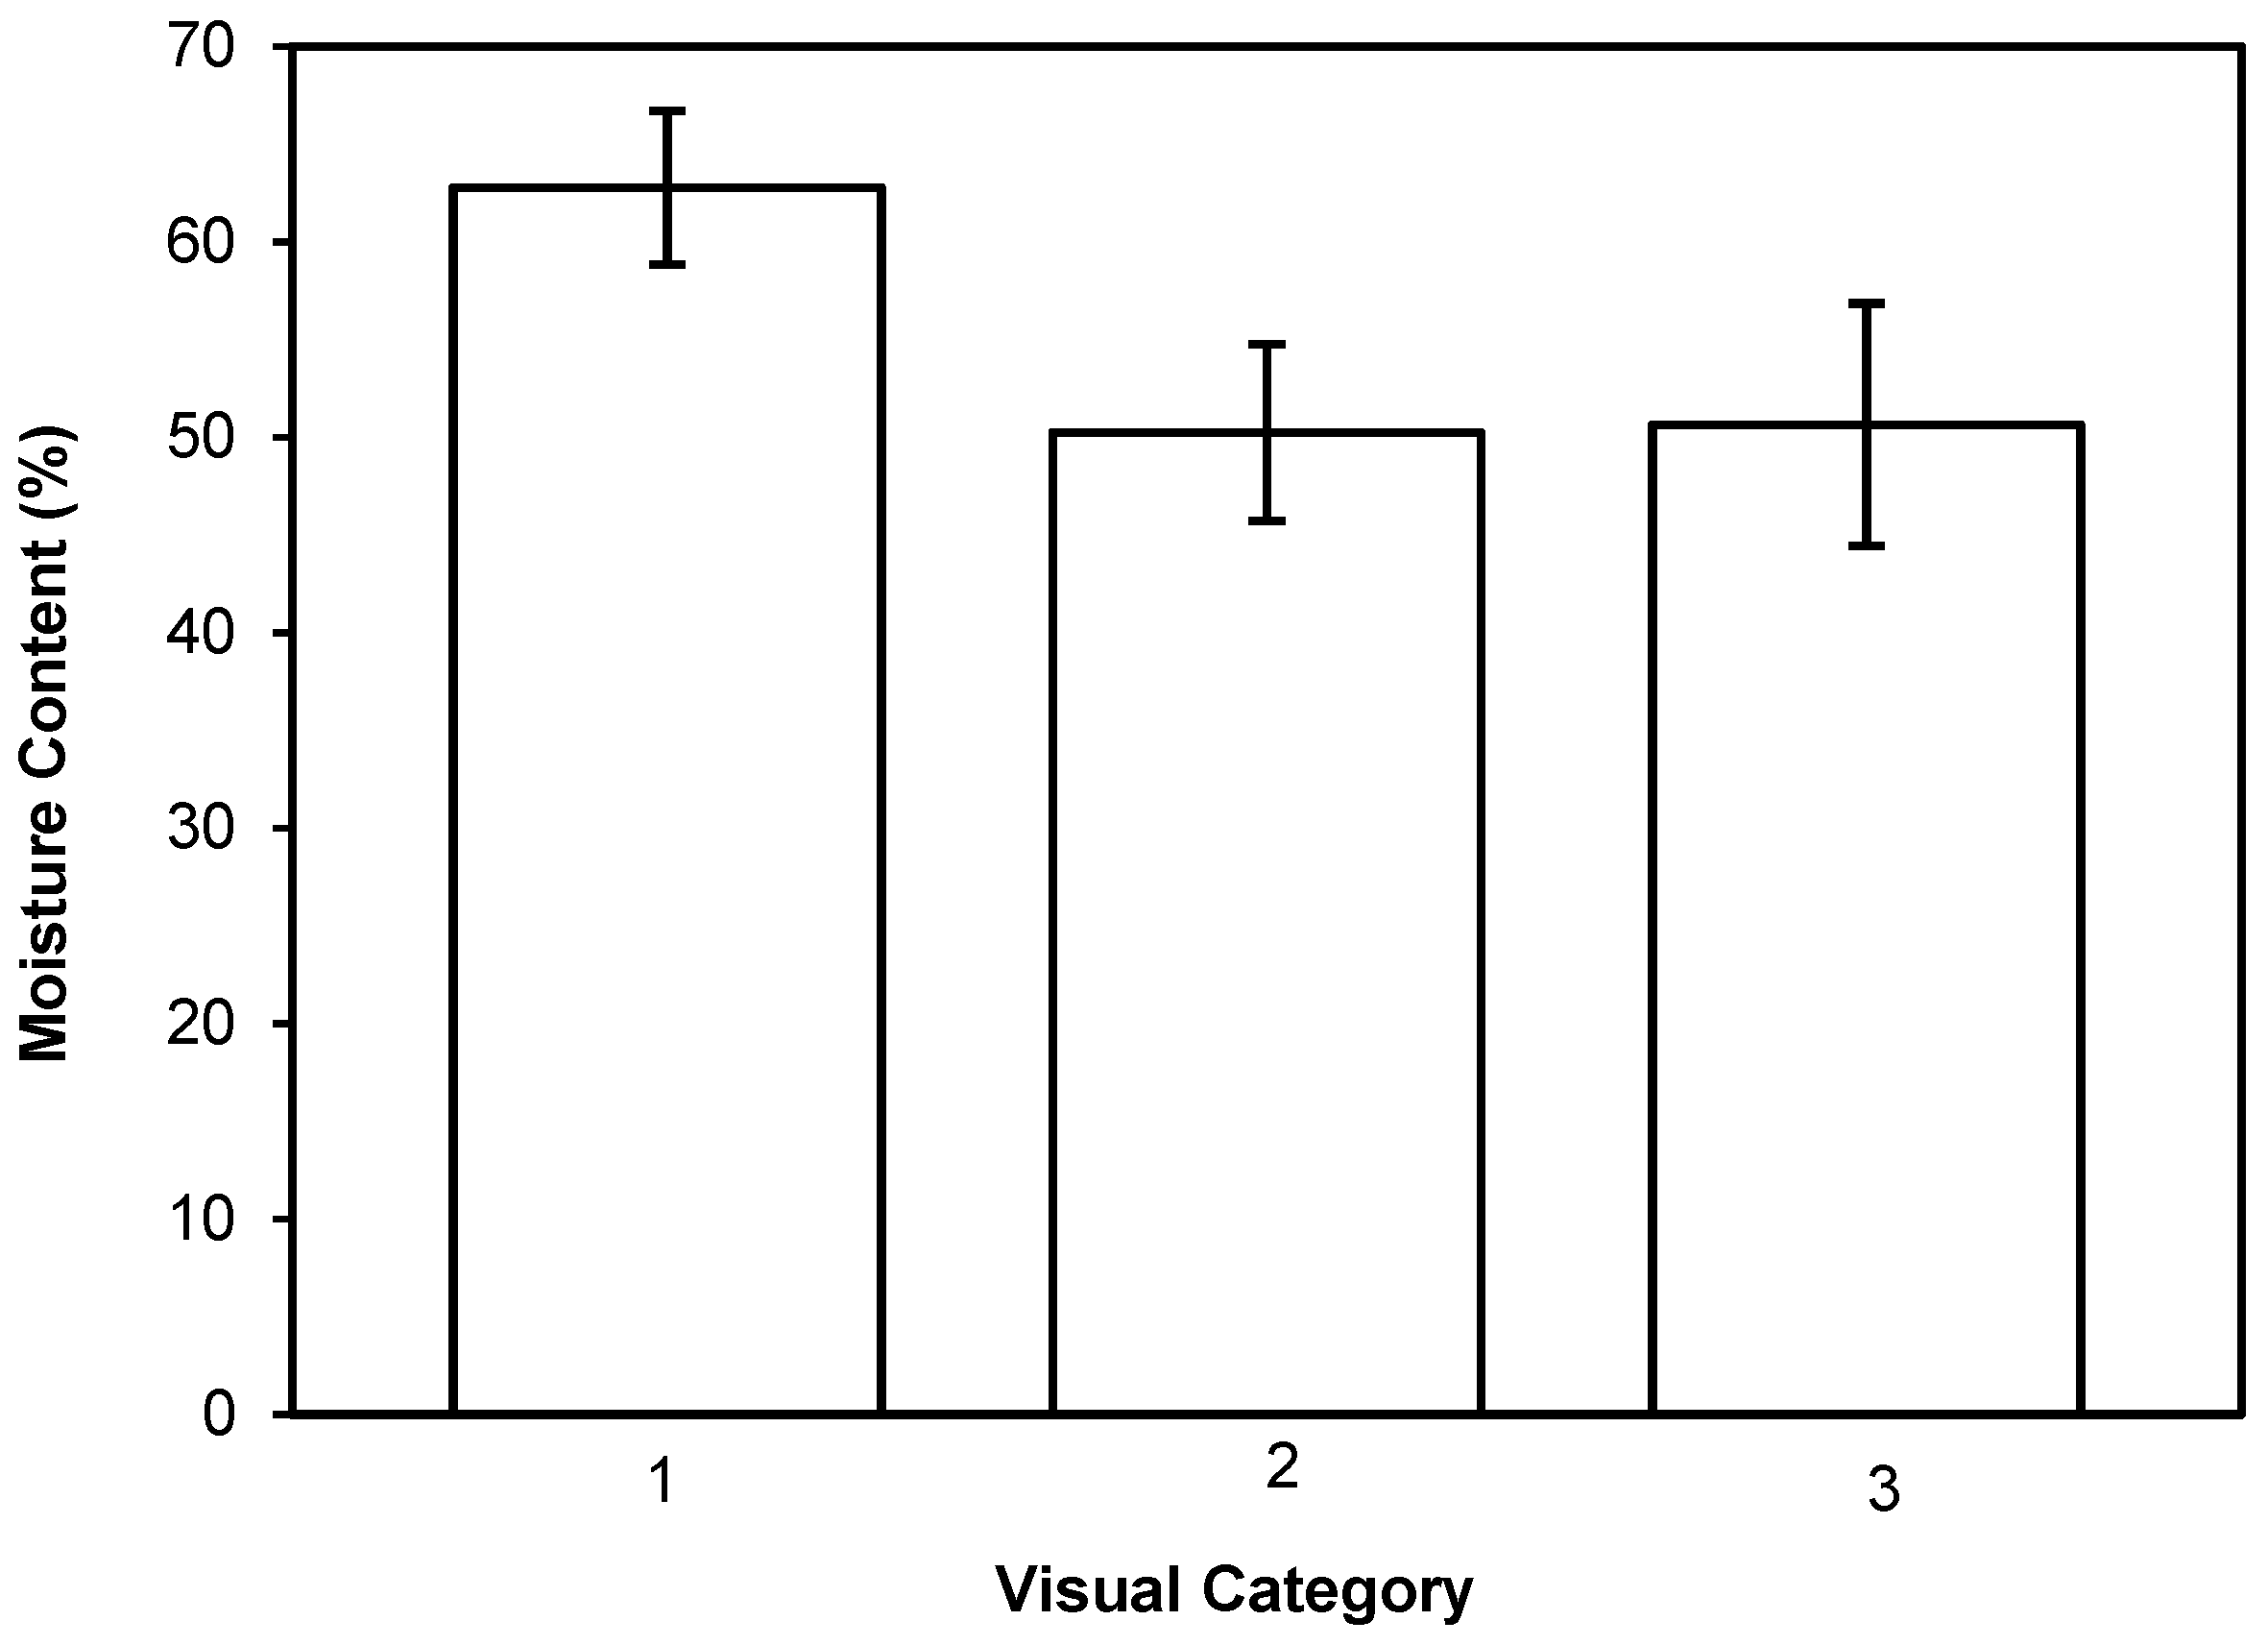
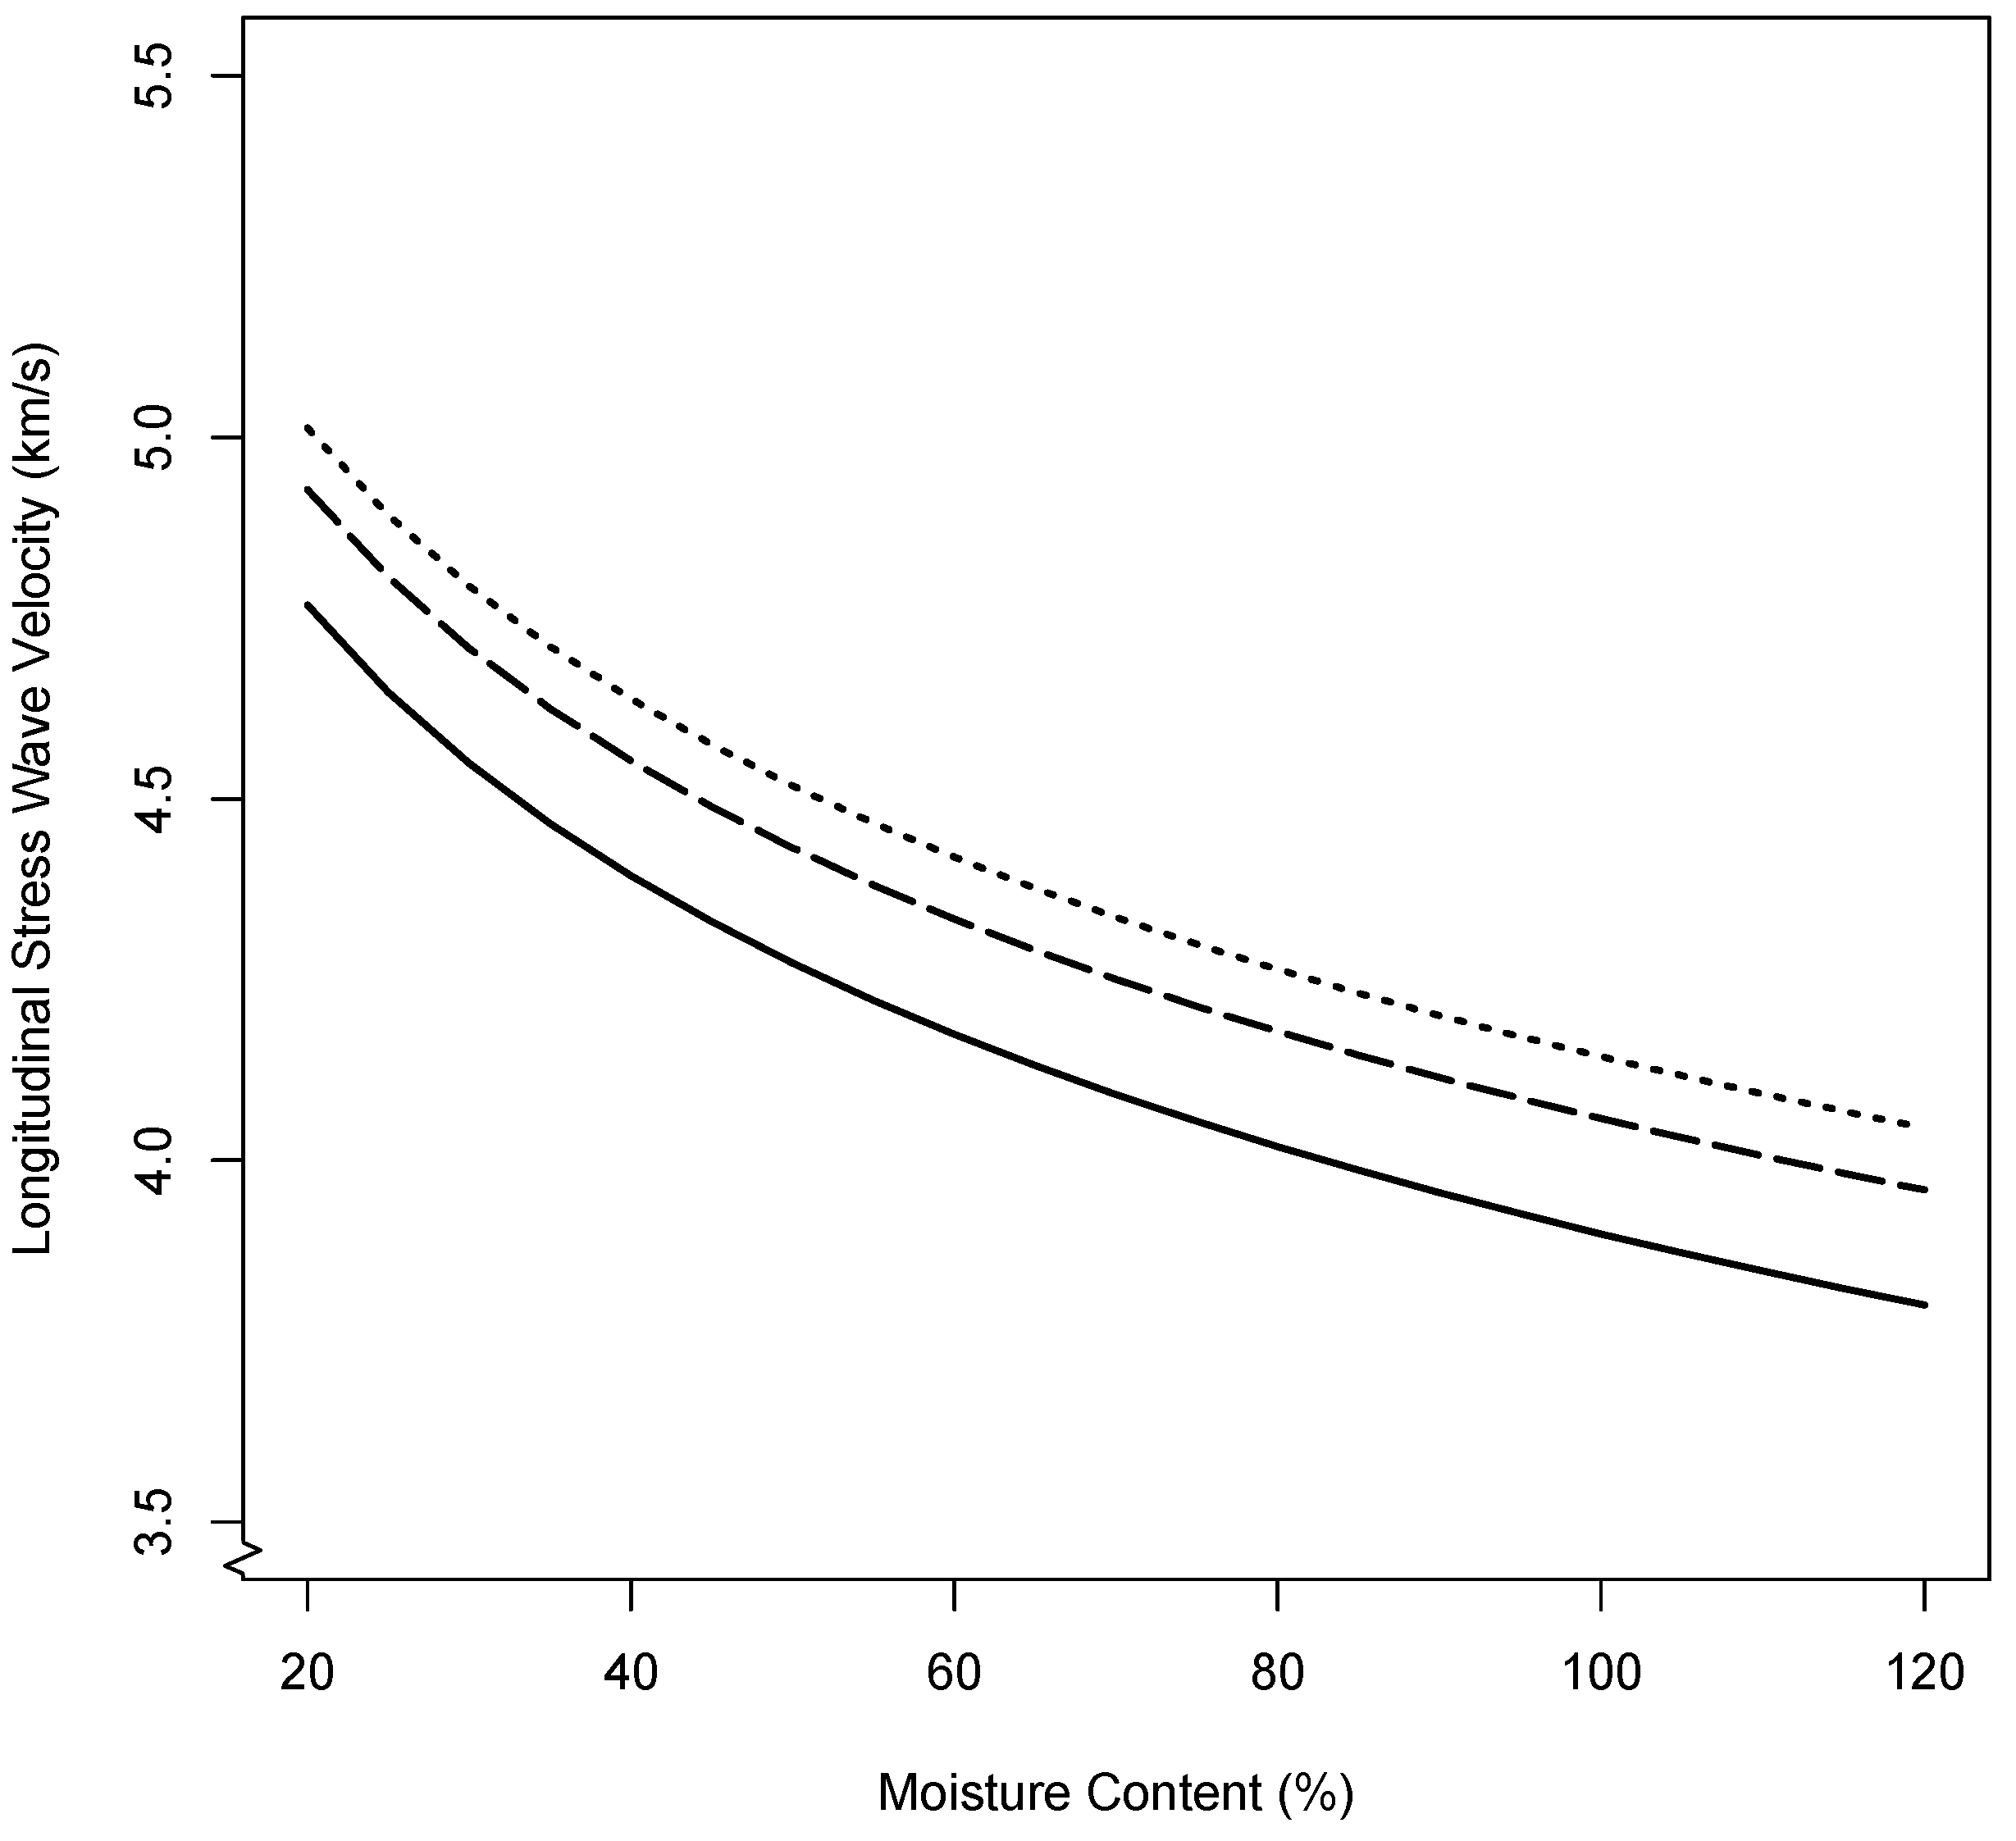
3.1. Moisture Content

Mean moisture contents (% by oven-dry weight) varied significantly among the visual categories (p = 0.002, Figure 4). The contrast between living (category 1) and dead (categories 2 and 3) white spruce moisture content suggests that a considerable decline in post mortem moisture content occurred (p = 0.006 for both comparisons). There was no significant difference between visual categories 2 and 3 (p = 0.999). This variation in moisture content likely influenced the velocity of both longitudinal and transverse acoustic waves. Therefore, we included moisture content as a covariate in further analyses to account for its influence.

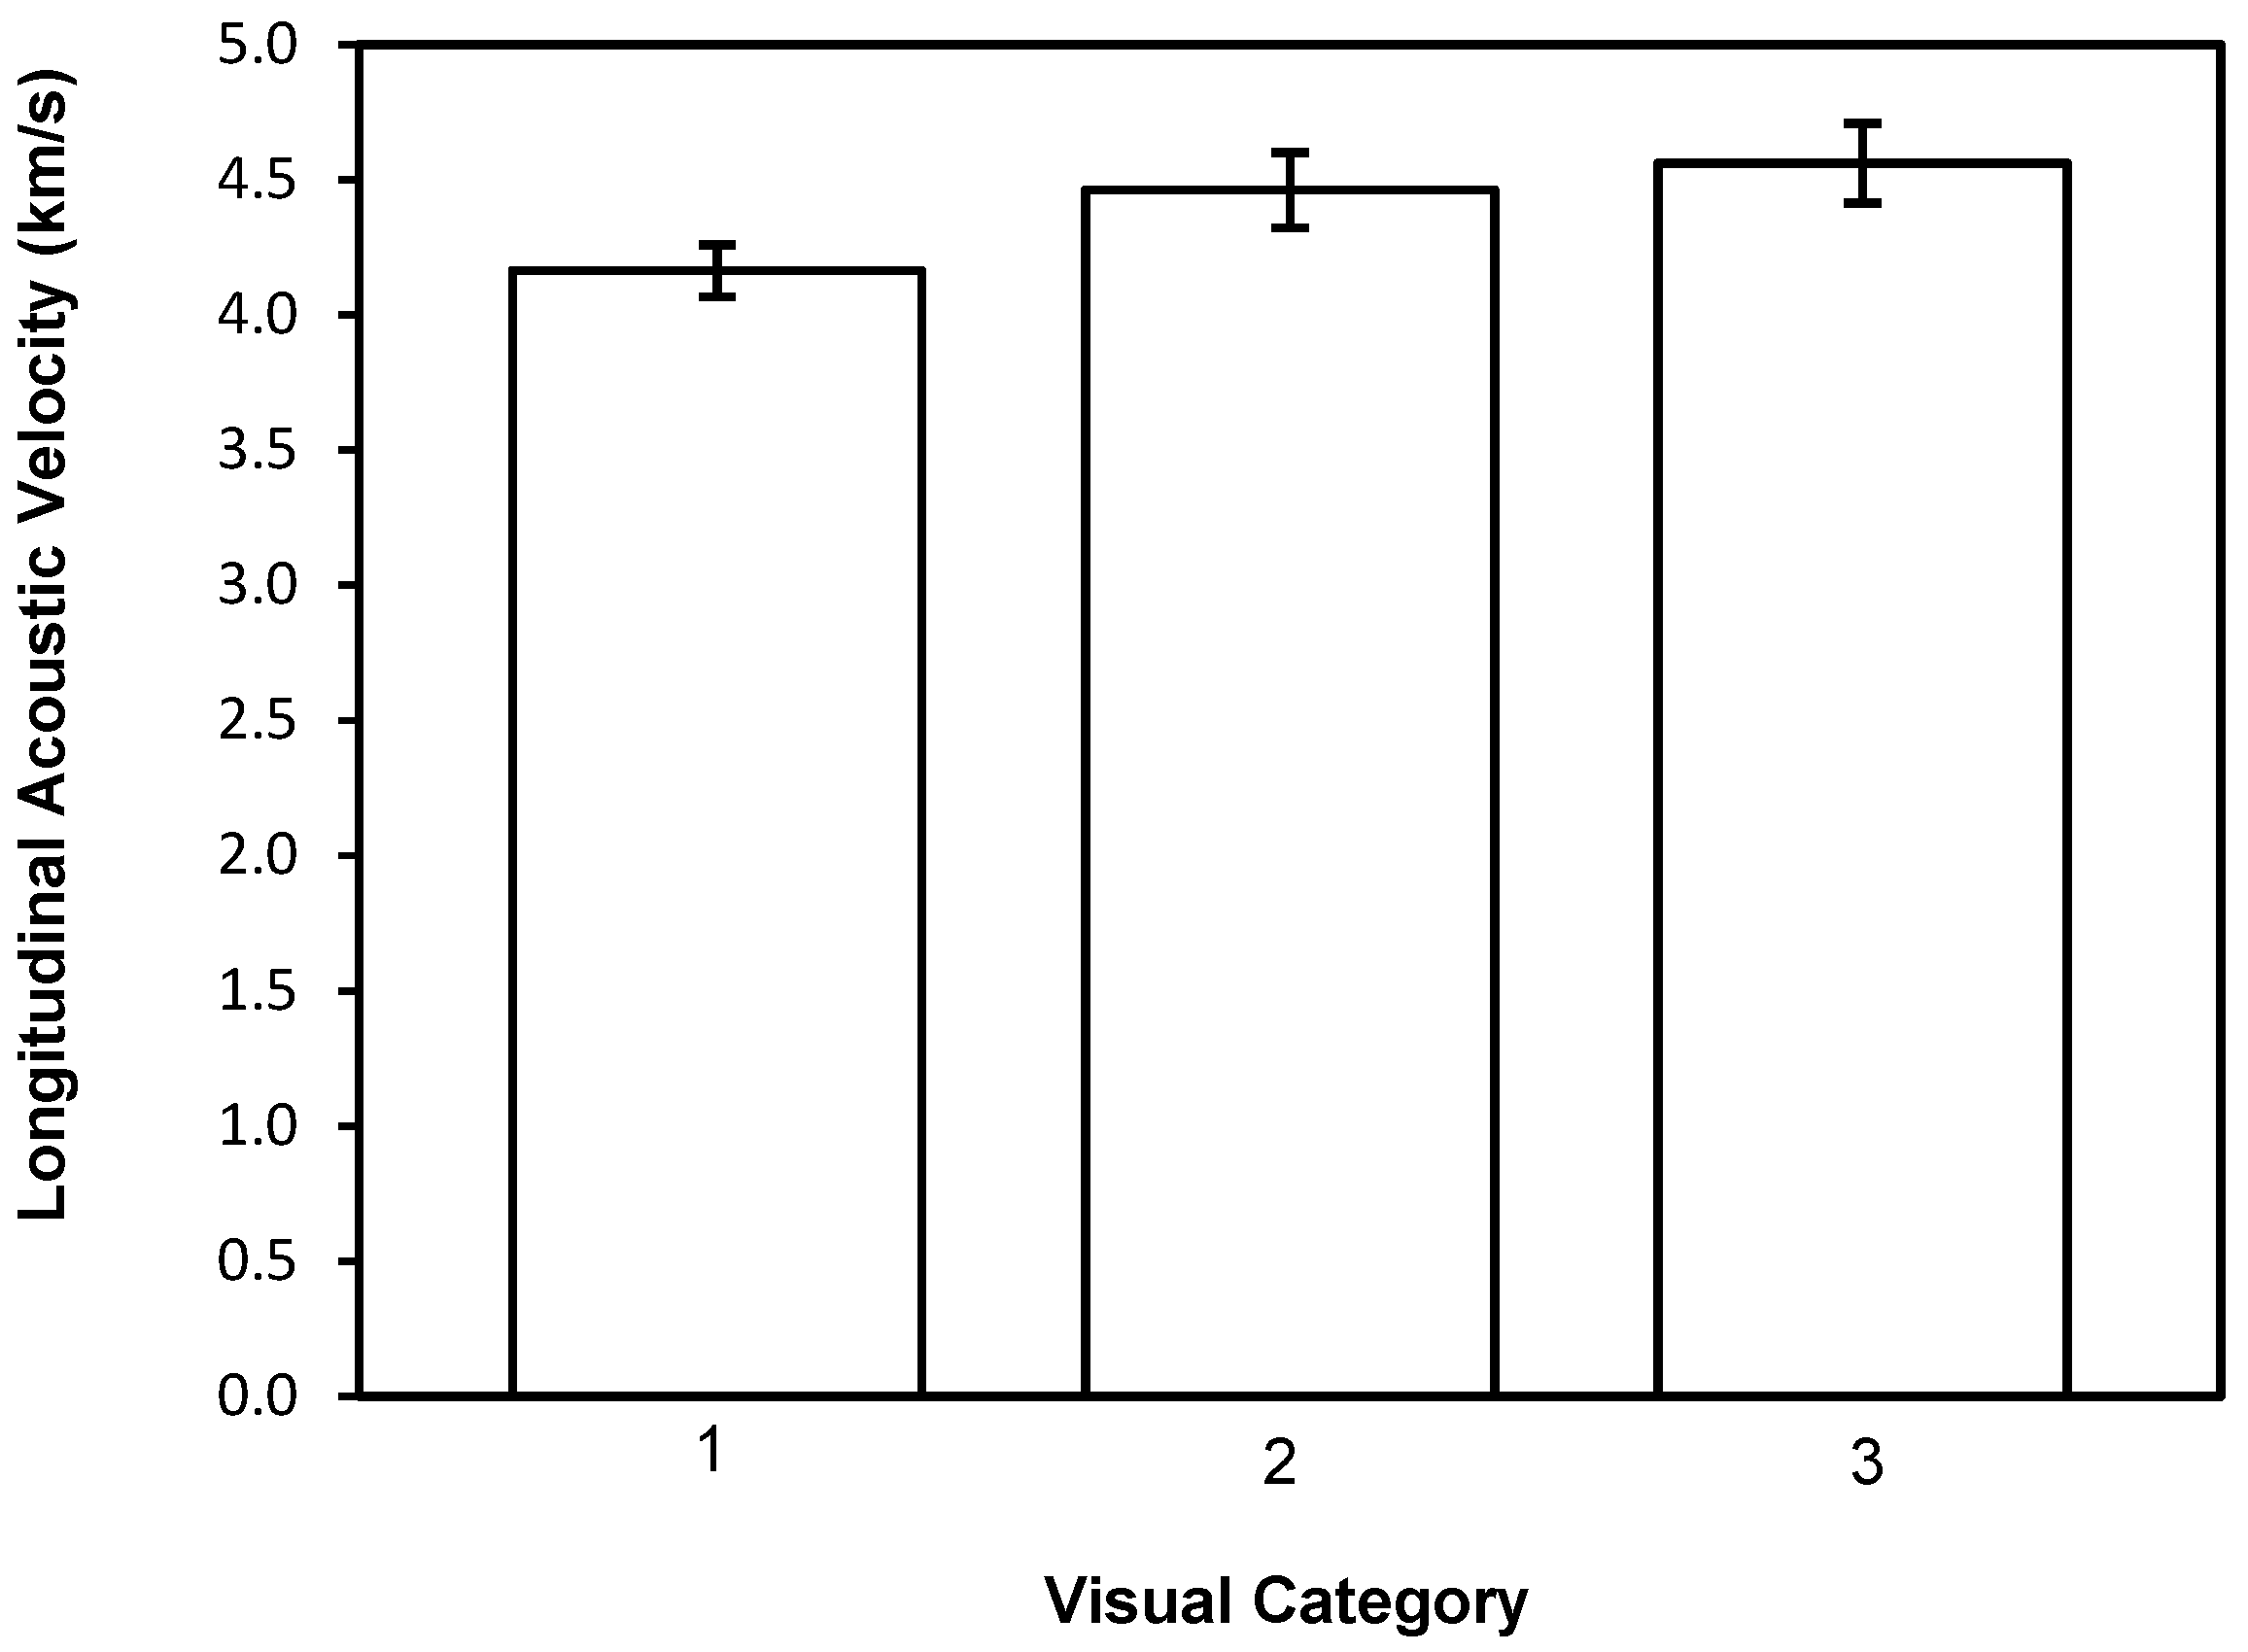
3.2. Longitudinal Acoustic Velocity by Hitman ST300

Longitudinal acoustic velocity, measured with the Hitman ST300, ranged from 2.57 km/s to 5.50 km/s across all measured trees, with a mean of 4.40 km/s. Furthermore, the longitudinal acoustic velocity was higher in dead trees compared with live trees (Figure 5). The post hoc Tukey test indicated that visual categories 1 and 2 did not have significantly different mean longitudinal velocities (p = 0.157). Similarly, visual categories 2 and 3 did not have significantly different mean longitudinal velocities (p = 0.556). However, visual category 1 (live trees) had significantly lower mean longitudinal velocities than category 3 (dead trees) (p = 0.013). This was expected, given that the moisture content of the standing dead trees declined after death (Figure 4).
However, the general linear model indicated that both visual category and moisture content were statistically significant variables in explaining variation in longitudinal acoustic velocity measured with the Hitman ST300 (Table 2). The marginal effects of visual category and moisture content on acoustic velocity suggest that longitudinal acoustic velocity similarly increases as moisture content decreases for all three visual categories (Figure 6). Furthermore, holding moisture content constant, longitudinal acoustic velocities were fastest for category 3 trees, and slowest for category 1 trees (Figure 6). The estimated coefficients for the general linear model (Table 2) suggest that there was an expected increase in longitudinal acoustic velocity of 0.16 km/s between visual category 1 (live) and visual category 2, holding moisture content constant. Likewise, there was a marginal increase in longitudinal acoustic velocity of 0.25 km/s between visual category 1 (live) and visual category 3.
In general, higher longitudinal velocities indicate better wood quality than lower velocity [13]. Holding moisture content constant, the lower quality trees of categories 2 and 3 have a higher longitudinal velocity than category 1. This discrepancy is largely caused by the reduced moisture content in categories 2 and 3. In this study, the measured moisture content of each wood sample is an average value for the disk. Figure 4 indicates about a 10% decrease in moisture content for categories 2 and 3 compared with category 1. Assuming the same wood quality among the three categories, just considering the effect of moisture content, the longitudinal acoustic velocity is expected to increase for categories 2 and 3. In addition, the dead-standing trees in categories 2 and 3 might have a moisture content gradient in the radial direction as a result of natural drying post mortem, drier outerwood, and wet corewood. The increased acoustic velocity in categories 2 and 3 is most likely the result of the drier outerwood, which can overshadow the effect of wood deterioration.

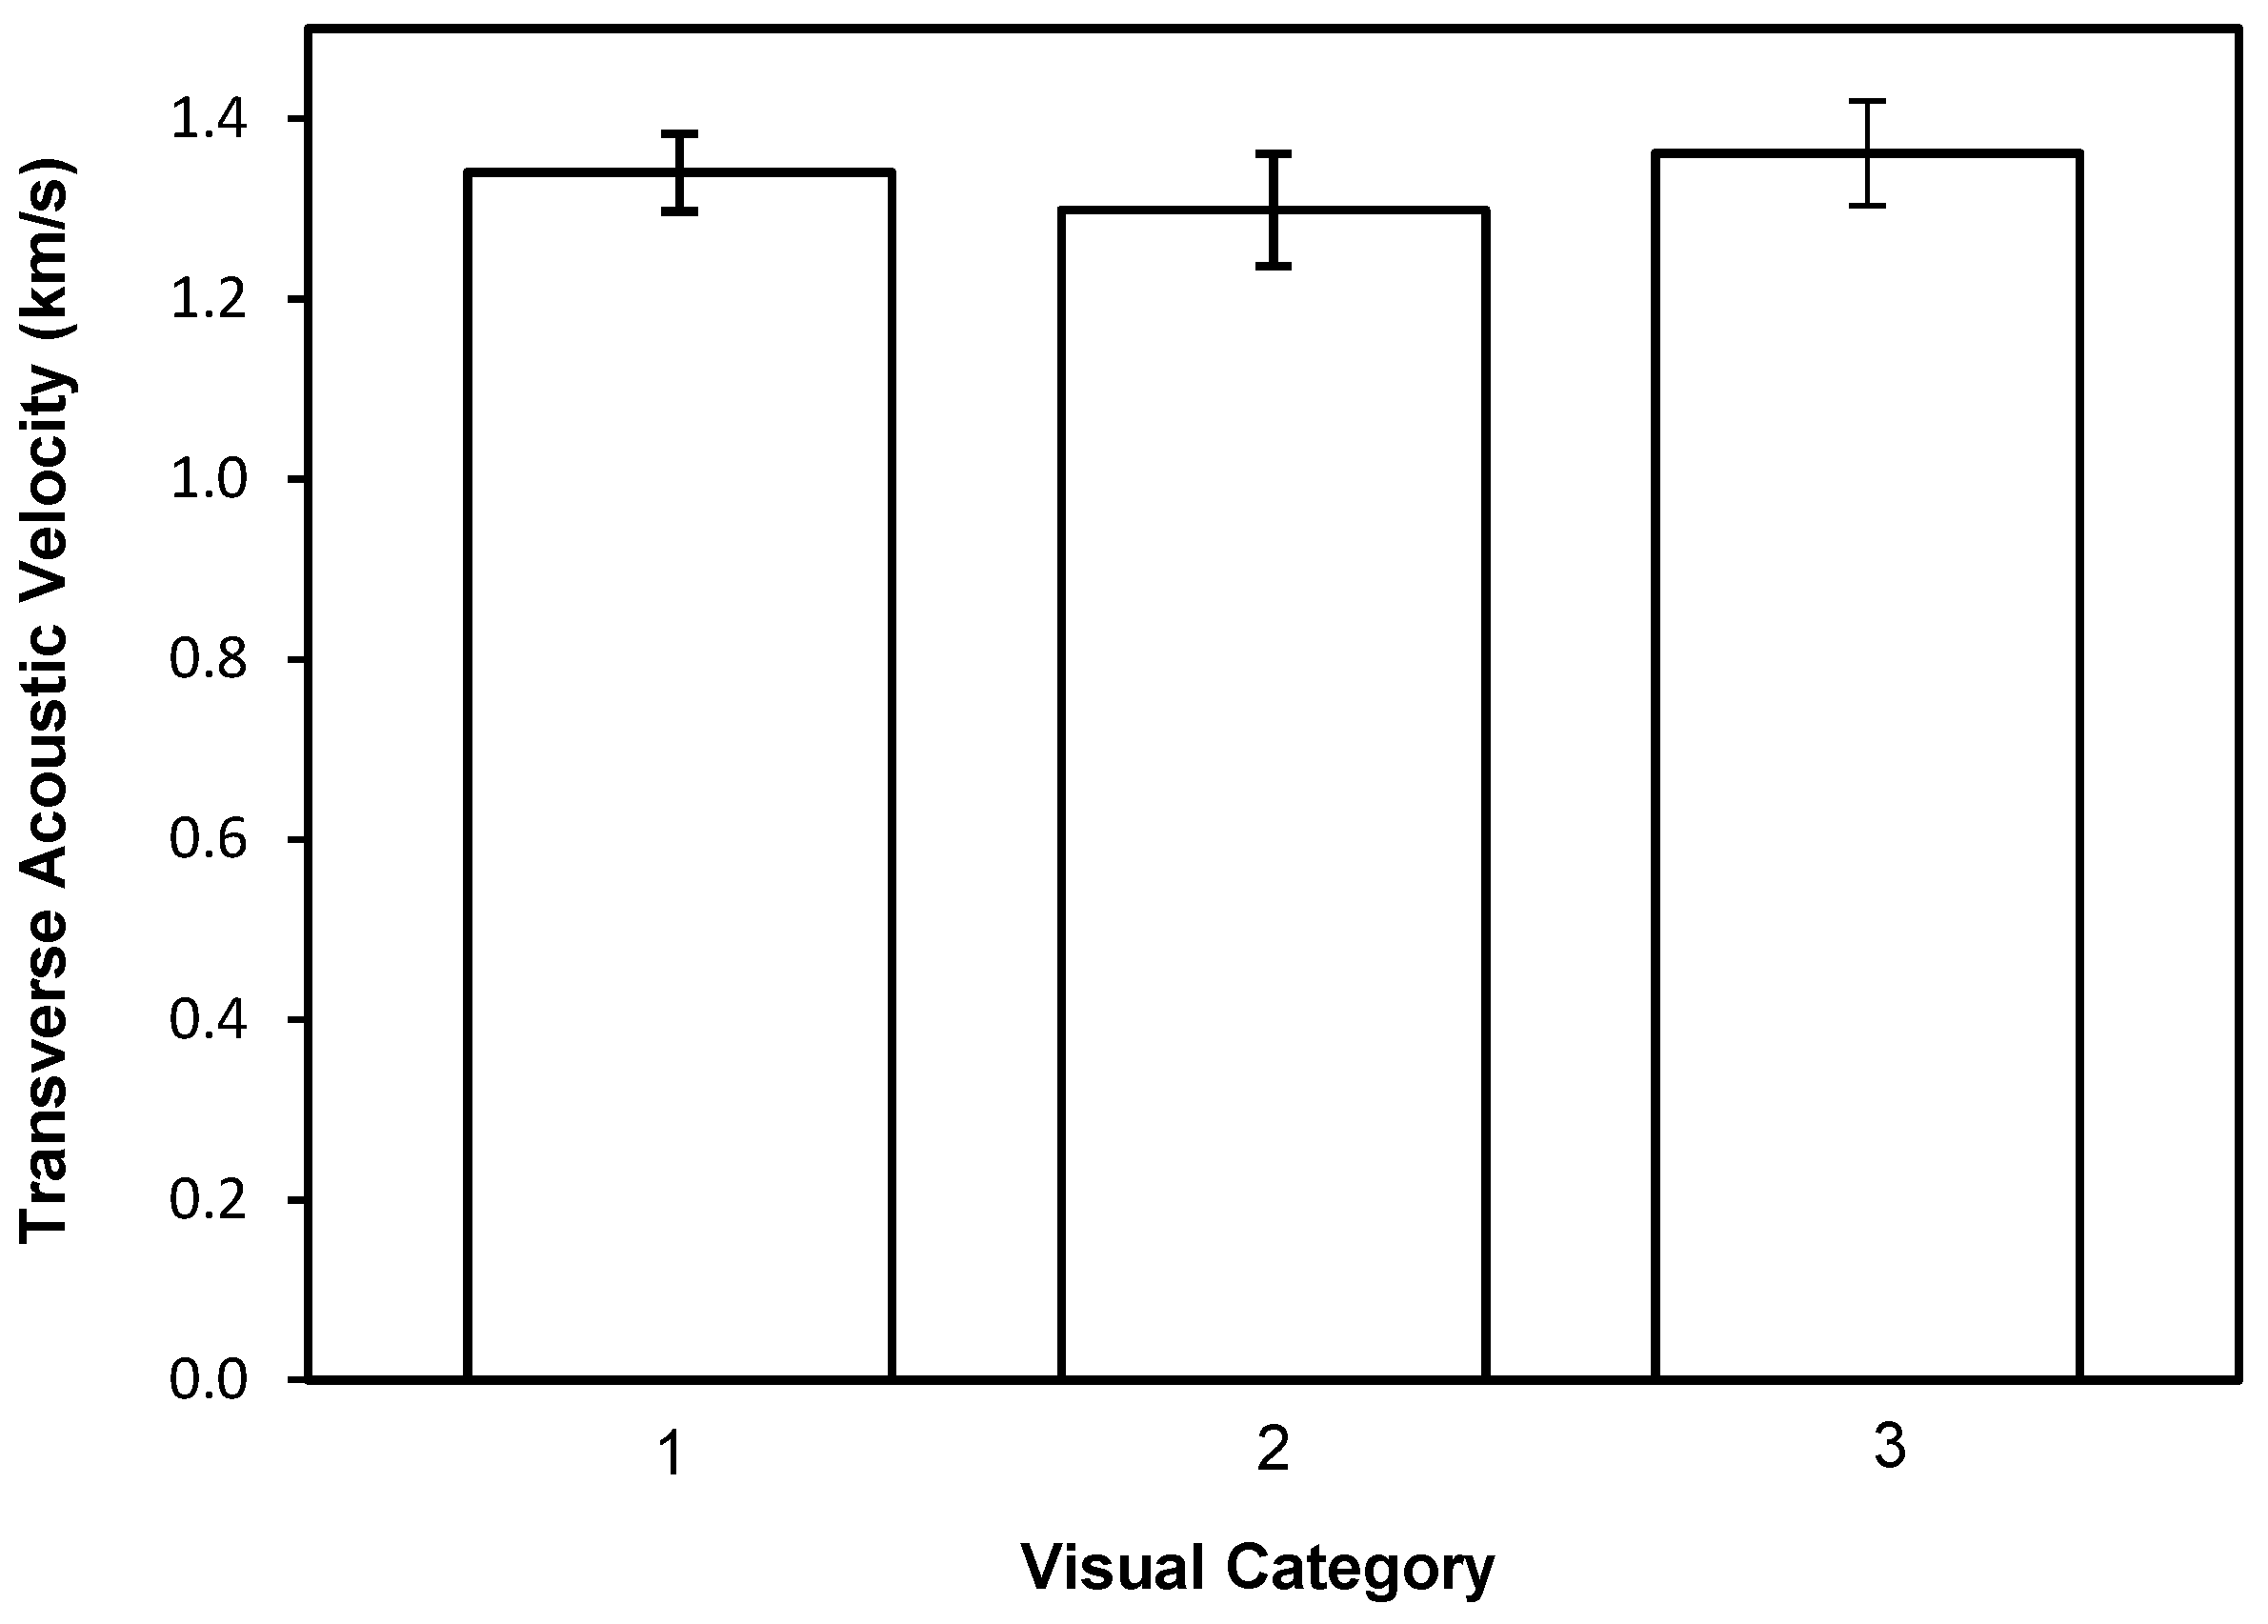
3.3. Transverse Acoustic Velocity by Fakopp Microsecond Timer

There was less variation in mean transverse acoustic velocity across visual categories (Figure 7) in comparison with differences in mean longitudinal acoustic velocities (Figure 5). The general linear model indicated that neither visual category (p = 0.118) nor moisture content (p = 0.484) had significant statistical relationships with transverse acoustic velocity.

4. Discussion

Visually assessed categories can provide coarse wood quality information, as measured by longitudinal acoustic velocity in dead standing trees. The most visually deteriorated white spruce (visual category 3) had significantly different wood quality compared with the live trees (visual category 1), considering longitudinal velocity measurements. This finding is important as longitudinal velocity measured on standing trees correlates to MOE of wood within measured trees [15,24,31], and MOE is commonly used to define acceptable standards of wood for utilization in building codes. Therefore, we suggest sorting live trees with green foliage (category 1) and those with obvious signs of severe decay (category 3) based on their respective visual indicators. However, dead standing trees with no visible green needles but most fine branches intact (category 2) represent a wide range of longitudinal acoustic velocities, and visually assessed decay categories were unable to provide precise wood quality information for these trees. Therefore, longitudinal velocity should be measured to appropriately evaluate trees within visual category 2 to allow for the utilization of this wood for its highest and best use. Measuring the wood quality of category 2 trees would help loggers and foresters more precisely sort them for utilization by appropriate markets, such as pulp or lumber, which may increase overall financial returns.
Conducting nondestructive evaluation on standing trees prior to a salvage harvest using hand-held devices like those utilized in our study may be cost-prohibitive. These tools take more time to assess the wood quality compared with standard visual assessments currently used in forest inventory. However, technological advances that incorporate nondestructive evaluation equipment into felling heads are now commercially available [32]. Using felling heads that contain nondestructive evaluation tools would enable the evaluation and sorting of salvaged timber at the time of harvest—likely reducing costs associated with nondestructive evaluation.
Visual appearance did not significantly explain the variation in the transverse acoustic velocity of the white spruce trees in this study. Transverse acoustic velocity correlates to the extent of internal decay in standing trees [16]. Upon harvest, we anecdotally noticed a tendency of standing dead study trees (categories 2 and 3) to show more decay in the sapwood, near the cambium, than heartwood. Furthermore, the Fakopp probes may have been inserted beyond this decayed sapwood region, and therefore a disproportionate amount of structurally sound wood was likely measured in the transverse direction. Furthermore, analysis of transverse acoustic velocities may have failed to show differences between visual categories because of the lack of heart rot in our study trees. Only one tree of 149 trees in the study was found to have heart rot upon harvest. The lack of heart rot likely led to more uniform transverse acoustic velocities among the visual categories (Figure 7) compared with stands containing trees with varying amounts of heart rot. We recommend conducting transverse acoustic measurements when information on the presence and extent of internal decay is desired. This information could be helpful to stakeholders, such as landowners, loggers, and pulp and lumber mills, when valuating or purchasing standing timber.
A challenge when using acoustic velocity to sort both live and dead trees is the need to account for moisture content differences. Lower moisture content in dead trees (visual categories 2 and 3) likely caused increased longitudinal velocity (Figure 5). Several published studies that measured longitudinal velocity on live trees didn’t account for moisture content variations [15,33,34]; however, live trees have relatively consistent moisture content values. Standing trees lose moisture after mortality, and this drying influences wave propagation velocities. The need for moisture content data to interpret acoustic velocity findings makes acoustic nondestructive evaluation slightly more difficult to interpret when working with dead standing trees. Future work could overcome this challenge by creating a reduction factor for longitudinal velocity measured on dead standing trees. A standard reduction factor would make comparisons between live and dead trees within a species simple and allow for easier industry adoption of acoustic nondestructive evaluation.
The second challenge of applying acoustic nondestructive testing to dead trees is the need to confirm the statistical relationship with mechanical properties of interest. Ross [12] summarizes many studies that have found statistically significant relationships between acoustic nondestructive evaluation to mechanical properties of live trees, including the MOE and the presence of internal decay pockets. However, little information is available regarding the species-specific relationships of acoustic measurements on dead standing trees to static measurements of internal wood properties. Further understanding of the estimation of mechanical properties, like MOE, from acoustic measurements of dead standing trees, would provide important knowledge to the industry. Future work focused on relating nondestructive acoustic measurements to mechanical properties for dead standing trees would help in utilizing this timber to produce higher-value products such as structural lumber and engineered components. In addition, relating standing-tree acoustic measurements to nondestructive lumber measurements, taken at standard conditions, could provide information on the wood properties of dead standing trees.
The ability to predict the intrinsic wood quality of dead standing trees based solely on visual cues is limited. While coarse wood quality information of dead standing trees can be determined visually, nondestructive evaluation using acoustic measurements likely offers a better prediction of wood quality. It can help sort dead standing white spruce for appropriate markets. With the recent focus on salvage and utilization of wood after insect outbreaks, the ability to infer the wood quality of salvage trees becomes valuable. This inference may allow land managers and the forest products industry to increase value by asserting known quality attributes to salvage timber. Continued work to elucidate species-specific relationships between acoustic measurements of dead standing trees and their mechanical properties will aid in the appropriate utilization of salvaged timber.

5. Conclusions

Standing dead trees may have reduced value; however, the utilization of acoustic, nondestructive evaluation methods for assessing wood quality may be helpful in optimizing the values recovered during salvage. Currently, white spruce and balsam fir affected by the spruce budworm are utilized in low-value products or left unutilized based on visual assessments of wood quality. Accurately quantifying the wood quality of a salvaged stand prior to harvest could limit economic loss from budworm defoliation. We assessed the ability to determine the wood quality of salvage white spruce from visual appearance. We found the visual appearance of white spruce only coarsely correlated to wood quality measurements of longitudinal acoustic velocity, a good indicator of the modulus of elasticity (MOE) of wood. Therefore, wood quality should be measured rather than assumed prior to or during salvage harvests. The forestry and forest products industries should include fast, low-cost wood quality measurements like longitudinal acoustic velocity during timber sale preparation using handheld devices or during harvest using systems integrated into the mechanized felling head to increase the value recovery from salvaged timber and increase revenue for stakeholders.

Author Contributions

Conceptualization, Y.L.D., R.J.R., and X.W.; methodology, T.J.H., Y.L.D. and X.W.; field testing and data collection, T.J.H., J.W.F., X.W., and Y.L.D.; data analysis, T.J.H. and Y.L.D.; writing—original draft preparation, T.J.H.; writing—review and editing, Y.L.D., X.W., X.X., R.J.R. and M.R.; supervision and project administration, Y.L.D. All authors have read and agreed to the published version of the manuscript.

Funding

This research was funded by USDA Forest Service Wood Innovations Grant (16-DG-11420014-166).

Data Availability Statement

Data supporting the results is contained in the article.

Acknowledgments

The authors sincerely appreciate the following individuals who assisted with field data collection: Peter Hoch, Ande Myers, Elizabeth Stimmel, Jack Wei, and Lujing Zhou. In addition, the authors thank the staff of the USDA Ottawa National Forest for their cooperation and assistance with this project.

Conflicts of Interest

The authors declare no conflict of interest.

References

  1. Basham, J.T. Degradation and loss of wood fibre in spruce budworm-killed timber, and effects on utilization. For. Chron. 1984, 60, 10–14. [Google Scholar] [CrossRef]
  2. Lovett, G.M.; Weiss, M.; Liebhold, A.M.; Holmes, T.P.; Leung, B.; Lambert, K.F.; Orwig, D.A.; Campbell, F.T.; Rosenthal, J.; McCullough, D.G.; et al. Nonnative forest insects and pathogens in the United States: Impacts and policy options. Ecol. Appl. 2016, 26, 1437–1455. [Google Scholar] [CrossRef] [PubMed]
  3. Michigan Department of Natural Resources (MIDNR). 2015 Forest Health Highlights; Michigan Department of Natural Resources, Forest Resources Division: Lansing, MI, USA, 2016; 50p.
  4. MIDNR. 2016 Forest Health Highlights; Michigan Department of Natural Resources, Forest Resources Division: Lansing, MI, USA, 2017; 52p.
  5. MIDNR. 2017 Forest Health Highlights; Michigan Department of Natural Resources, Forest Resources Division: Lansing, MI, USA, 2018; 31p.
  6. Barrette, J.; Thiffault, E.; Saint-Pierre, F.; Wetzel, S.; Duchesne, I.; Krigstin, S. Dynamics of dead tree degradation and shelf-life following natural disturbances: Can salvaged trees from boreal forests ‘fuel’ the forestry and bioenergy sectors? For. Int. J. For. Res. 2015, 88, 275–290. [Google Scholar] [CrossRef]
  7. Basham, J.T. Biological factors influencing stem deterioration rates and salvage planning in balsam fir killed after defoliation by spruce budworm. Can. J. For. Res. 1986, 16, 1217–1229. [Google Scholar] [CrossRef]
  8. Stocks, B.J. Fire potential in the spruce budworm-damaged forests of Ontario. For. Chron. 1987, 63, 8–14. [Google Scholar] [CrossRef] [Green Version]
  9. Johnson, D.W. Tree Hazards: Recognition and Reduction in Recreation Sites; USDA Forest Service Tech. Rep. R2-1; Rocky Mountain Region, State and Private Forestry, Forest Pest Management: Lakewood, CO, USA, 1981; 17p.
  10. Goodburn, J.M.; Lorimer, C.G. Cavity trees and coarse woody debris in old-growth and managed northern hardwood forests in Wisconsin and Michigan. Can. J. For. Res. 1998, 28, 427–438. [Google Scholar] [CrossRef]
  11. United States Forest Service (USFS). Forest Inventory and Analysis National Core Field Guide, Volume 1: Field Data Collection Procedures for Phase 2 Plots. Version 7.2. 2017. Available online: https://www.fia.fs.fed.us/library/field-guides-methods-proc/docs/2017/core_ver7-2_10_2017_final.pdf (accessed on 15 January 2019).
  12. Ross, R.J. Static bending, transverse vibration, and longitudinal stress wave nondestructive evaluation methods. In Nondestructive Evaluation of Wood: Second Edition; Ross, R.J., Ed.; USDA Forest Service Gen. Tech. Rep. FPL-GTR-238; Forest Products Laboratory: Madison, WI, USA, 2015; pp. 5–19. 176p. [Google Scholar]
  13. Wang, X.; Carter, P.; Ross, R.J.; Brashaw, B.K. Acoustic assessment of wood quality of raw forest materials—A path to increased profitability. For. Prod. J. 2007, 57, 6–14. [Google Scholar]
  14. Wang, X. Acoustic measurements on trees and logs: A review and analysis. Wood Sci. Technol. 2013, 47, 965–975. [Google Scholar] [CrossRef]
  15. Wang, X.; Ross, R.J.; McClellan, M.L.; Barbour, R.J.; Erickson, J.R.; Forsman, J.W.; McGinnis, G.D. Nondestructive evaluation of standing trees with a stress wave method. Wood Fiber Sci. 2001, 33, 522–533. [Google Scholar]
  16. Wang, X.; Divos, F.; Pilon, C.; Brashaw, B.K.; Ross, R.J.; Pellerin, R.F. Assessment of Decay in Standing Timber using Stress Wave Timing Nondestructive Evaluation Tools: A Guide for Use and Interpretation; USDA Forest Service Gen. Tech. Rep. FPL-GTR-147; Forest Products Laboratory: Madison, WI, USA, 2004; 12p.
  17. Wang, X.; Ross, R.J.; Mattson, J.A.; Erickson, J.R. Nondestructive evaluation techniques for assessing modulus of elasticity and stiffness of small-diameter logs. For. Prod. J. 2002, 52, 79–86. [Google Scholar]
  18. Hovde, T. Nondestructive Evaluation of Salvage White Spruce. Open Access. Master’s Thesis, Michigan Technological University, Houghton, MI, USA, 2018; 47p. [Google Scholar] [CrossRef]
  19. Frank, T.; Ottawa National Forest, Ontonagon, MI, USA. Personal communication, 2 March 2017.
  20. USDA Natural Resources Conservation Service. Web Soil Survey. 2017. Available online: https://websoilsurvey.sc.egov.usda.gov/app/websoilsurvey.aspx (accessed on 12 November 2018).
  21. National Oceanic and Atmospheric Administration (NOAA). NOAA’s 1981-2010 Climate Normal: Monthly Temperature Normal. 2011. Available online: https://www.ncdc.noaa.gov/normalsPDFaccess (accessed on 9 November 2018).
  22. NOAA. Monthly Total Precipitation for Iron Mtn-Kingsford WWTP, MI. 2018. Available online: https://w2.weather.gov/climate/xmacis.php?wfo=mqt (accessed on 9 November 2018).
  23. Carmean, W.H.; Hahn, J.T.; Jacobs, R.D. Site Index Curves for Forest Tree Species in the Eastern United States; USDA Forest Service Gen. Tech. Rep. NC-128; North Central Forest Experiment Station: St. Paul, MN, USA, 1989; 142p. [Google Scholar]
  24. Chan, J.M.; Walker, J.C.; Raymond, C.A. Effects of moisture content and temperature on acoustic velocity and dynamic MOE of radiata pine sapwood boards. Wood Sci. Technol. 2011, 45, 609–626. [Google Scholar] [CrossRef]
  25. Legg, M.; Bradley, S. Measurement of stiffness of standing trees and felled logs using acoustics: A review. J. Acoust. Soc. Am. 2016, 139, 588–604. [Google Scholar] [CrossRef] [PubMed]
  26. Yamasaki, M.; Tsuzuki, C.; Sasaki, Y.; Onishi, Y. Influence of moisture content on estimating Young’s modulus of full-scale timber using stress wave velocity. J. Wood Sci. 2017, 63, 225–235. [Google Scholar] [CrossRef]
  27. Gao, S.; Tao, X.; Wang, X.; Wang, L. Theoretical modeling of the effects of temperature and moisture content on the acoustic velocity of Pinus resinosa wood. J. For. Res. 2018, 29, 541–548. [Google Scholar] [CrossRef]
  28. ASTM D4442-16; Standard Test Methods for Direct Moisture Content Measurement of Wood and Wood-Based Materials. ASTM International: West Conshohocken, PA, USA, 2016.
  29. Hothorn, T.; Bretz, F.; Westfall, P. Simultaneous inference in general parametric models. Biom. J. 2008, 50, 346–363. [Google Scholar] [CrossRef] [Green Version]
  30. Leeper, T.J. Margins: Marginal Effects for Model Objects. R Package Version 0.3.23. 2018. Available online: https://github.com/leeper/margins (accessed on 12 March 2018).
  31. Wang, X.; Ross, R.J.; Carter, P. Acoustic evaluation of wood quality in standing trees. Part, I. acoustic wave behavior. Wood Fiber Sci. 2007, 39, 28–38. [Google Scholar]
  32. Fibre-gen, Ltd. Hitman PH330. 2018. Available online: https://www.fibre-gen.com/hitman-ph330 (accessed on 10 October 2018).
  33. Lenz, P.; Auty, D.; Achim, A.; Beaulieu, J.; Mackay, J. Genetic improvement of white spruce mechanical wood traits-early screening by means of acoustic velocity. Forests 2013, 4, 575–594. [Google Scholar] [CrossRef] [Green Version]
  34. Bérubé-Deschênes, A.; Franceschini, T.; Schneider, R. Factors affecting plantation grown white spruce (Picea glauca) acoustic velocity. J. For. 2016, 114, 629–637. [Google Scholar] [CrossRef]
Figure 1. White spruce trees representing visual categories 1—(a) live trees with visible green foliage), 2—(b) dead-standing trees with no visible green foliage, recently dead), and 3—(c) dead-standing trees with poorest visual appearance, obvious signs of severe decay.
Forests 13 01680 g001
Figure 2. Longitudinal acoustic velocity measurements on white spruce trees using the Hitman ST300.
Forests 13 01680 g002
Figure 3. Transverse acoustic velocity measurements on white spruce trees using the Fakopp Microsecond Timer.
Forests 13 01680 g003
Figure 4. Mean moisture content (% by oven-dry weight) by visual category. Error bars represent the 95% confidence interval.
Forests 13 01680 g004
Figure 5. Mean longitudinal acoustic velocity (km/s) by visual category. Acoustic velocity was measured with the Hitman ST300. Error bars represent the 95% confidence interval.
Forests 13 01680 g005
Figure 6. Modeled effect of moisture content (% by oven-dry weight) on longitudinal acoustic velocity (km/s) for visual categories 1 (live trees, solid black line), 2 (dead with no visible green foliage, dashed black line), and 3 (dead with poorest visual appearance, dotted black line).
Forests 13 01680 g006
Figure 7. Mean transverse stress wave velocities (km/s) by visual category. Error bars represent a 95% confidence interval.
Forests 13 01680 g007
Table 1. Stand composition data, including basal area, trees per hectare, and quadratic mean diameter.
SpeciesBA
(m2/ha)
Trees
per ha
Quadratic Mean
Diameter (cm)
White Spruce (Picea glauca)12.67269.628.2
Sugar Maple (Acer saccharum)9.52598.027.2
Black Cherry (Prunus serotina)1.3329.528.6
Quaking Aspen (Populus tremuloides)0.9755.831.7
Swamp White Oak (Quercus bicolor)0.4226.120.3
American Basswood (Tilia Americana)0.424.835.2
Red Maple (Acer rubra)0.3626.118.1
Pin Cherry (Prunus pensylvanica)0.3081.88.3
Yellow Birch (Betula alleghanienisis)0.244.732.5
Ironwood (Carpinus caroliniana)0.1221.09.4
Slippery Elm (Ulmus rubra)0.126.819.0
Balsam Fir (Abies balsamea)0.0626.45.4
Eastern Hemlock (Tsuga canadensis)0.060.441.9
Northern White Cedar (Thuja occidentalis)0.060.442.8
All Species26.671151.727.8
Table 2. Coefficients and p-values of a general linear model to test relationships between decay category, moisture content, and stand average velocity.
VariableEstimated Coefficientp-Value
Intercept6.3861<0.001
Decay cat 20.15920.068
Decay cat 30.24490.005
MC_log10−1.2440<0.001
Publisher’s Note: MDPI stays neutral with regard to jurisdictional claims in published maps and institutional affiliations.

