Article

Carbon Allocation of Quercus mongolica Fisch. ex Ledeb. across Different Life Stages Differed by Tree and Shrub Growth Forms at the Driest Site of Its Distribution

MOE Laboratory for Earth Surface Processes, College of Urban and Environmental Sciences, Peking University, Beijing 100871, China
*
Author to whom correspondence should be addressed.
Submission received: 3 September 2022 / Revised: 30 September 2022 / Accepted: 5 October 2022 / Published: 23 October 2022
(This article belongs to the Special Issue Plant Adaptation to Extreme Environments in Drylands)

Abstract

:
There are less than 10% of woody species that can have both tree and shrub growth forms globally. At the xeric timberline, we observed the tree-to-shrub shift of the Quercus mongolica Fisch. ex Ledeb.. Few studies have explored the underlined mechanism of this morphological transition of tree-to-shrub in arid regions. To examine whether the tree-to-shrub shift affects carbohydrate allocation and to verify the effect of life stage on non-structural carbohydrate (NSC) storage, we measured the concentration of soluble sugar and starch of Q. mongolica in the seedlings, saplings, and adult trees by selecting two sites with either tree or shrub growth forms of Q. mongolica at the driest area of its distribution. Accordingly, there was no significant difference in the radial growth with different growth forms (p > 0.05). The results showed that the effects of growth form on NSC concentrations are significant in the seedling and sapling stages, but become less pronounced as Q. mongolica grows. The results of the linear mixed model showed that life stage has a significant effect on soluble sugar concentration of tree-form (p < 0.05), starch and TNC concentration of shrub-form (p < 0.05). Compared with a shrub form without seedling stage, a tree form needs to accumulate more soluble sugar from seedling stage to adapt to arid environment. Saplings and adult shrubs store more starch, especially in thick roots, in preparation for sprout regeneration. Our study shows that the same species with tree and shrub forms embody differentiated carbohydrate allocation strategies, suggesting that shrub form can better adapt to a drier habitat, and the tree-to-shrub shift can benefit the expansion of woody species distribution in dryland.

1. Introduction

Trees adapt their size and shape to match their growing environment [1]. According to a global plant trait database, approximately 9.2% of woody species have both shrub and tree growth forms [2]. Compared with trees with a single stem, shrubs are reduced in tree height and have basal sprouting stems [2]. In more disturbed environments, multiple potential growth forms should allow woody plants to acclimate better and reproduce faster than those with less morphological plasticity [3].
Tree-to-shrub shifts with the reduction of tree height ensure the safety of water transportation. As taller trees are generally at greater risk of hydraulic failure due to embolism in areas where water becomes progressively more limiting, the same species will tend to grow shorter in arid areas [4]. Tree-to-shrub shifts also ensure hydraulic safety and carbon assimilation, avoiding forest dieback [5].
Tree-to-shrub shifts may also represent a change in the way of reproduction, from seed reproduction to resprouting regeneration. Resprouting regeneration avoids the costs associated with sexual reproduction, such as the production of seeds and accessories [6]. Reproductive allocation (RA) is considered to participate in resource trade-offs regarding vegetative growth and defense [7,8]. Most angiosperms have the ability to regenerate through resprouting. Resprouting regeneration accelerates the regeneration process, speeds up tree replacement, and improves the ability to avoid mortality and withstand drought [9,10]. In regions with frequent disturbance, the community tends to have a high proportion of species that mostly resprout [11,12]. A global multispecies study has also revealed that growth form is the factor that has the greatest impact on seed masses, the seeds produced by shrubs being significantly smaller than those produced by trees [13].
Few studies have examined whether this morphological transition of tree-to-shrub in arid regions also alters the physiological carbon allocation strategy of trees, which plays a key role in ecosystem dynamics and plant acclimation to changing environmental conditions [14]. A mechanistic understanding of how plants, particularly long-living organisms, such as trees, allocate and remobilize stored carbohydrates is still very poor. Previous studies have shown that carbon allocation in adult trees involves at least three trade-offs between storage, growth, and reproduction [15,16]. Nonstructural carbohydrates (NSC) play a central role in plant functioning because they are building blocks and energy carriers for plant metabolic processes. Although, on an annual basis, net carbon flux to storage may be small relative to allocation of respiration and growth, recent studies tend to suggest that storage represents a sink that can compete with other sinks like growth [17]. Storage is used in plants for maintenance respiration, growth resumption, foliage building in the spring, and protection tree physiological integrity against environmental stresses, such as frost [18,19], defoliation [20,21], shade [22,23], insect attacks, and wounds [15,24]. In arid regions of our concern, soluble sugars play important roles in cavitation induction, signaling, and repairment, as the xylem of trees undergoes diurnal and seasonal cavitation and repair [25,26,27]. We therefore hypothesize that growth form affects carbon allocation.
Differences in tree life stages have long been ignored in the studies of NSC dynamics, although the intensity of survival stress commonly changes during tree ontogeny. Seedlings have shallow roots and can only absorb water from shallow soils, while large trees can use water from deeper soils [28]. Considering operability, field control experiments mostly use tree seedlings as the research objects [29]. If the results of the field control experiment are simply applied to adult trees, it may lead to inaccurate conclusions [30]. Simultaneous measurements of the NSC concentrations of each organ at different life stages are required. We further hypothesize that the NSC concentration at different life stages differs.
To test the above hypotheses, we selected the natural Quercus mongolica Fisch. ex Ledeb. forest in the Saihanwula Nature Reserve in Inner Mongolia, China. The site is at the xeric timberline, where the driest site of Q. mongolica distribution and forests are threatened by long-term water limitation [5]. Q. mongolica, a drought-resistant and cold-resistant deciduous tree species [31], is naturally secondary and dominant in the temperate forests of northern China. From shady to sunny slopes, tree-to-shrub growth form shifts typically occur at the xeric timberline [32]. According to the water balance calculation, the soil available water of the shady slopes is 253 mm per year, much more than that of the sunny slopes (about 0 mm per year) [32]. We simultaneously measured the NSC concentrations of each organ in three stages of life: seedling, sapling, and adult tree. Carbon allocation to growth, storage, and reproduction function was assessed by quantifying the differences in radial growth, nonstructural carbohydrates concentrations, and number of resprouts, respectively [7,20].

2. Materials and Methods

2.1. Study Area and Site Features

The Saihanwula National Nature Reserve (43°59′–44°27′ N, 118°18′–118°55′ E) is located in the southern part of the Greater Khingan Mountains. It is located in the semiarid region, with cold winters and little snowfall; summer is hot with sufficient sunlight. The annual average temperature is 2 °C, and the average annual precipitation is 400 mm [29]. From shady to sunny slopes, tree-to-shrub growth form shifts typically occur (Figure S1, Table S1) [32].
The average soil thickness of the shady slopes was measured as 48.6 cm and that of the sunny slopes was 24.3 cm. We measured the soil water content and soil bulk density of two different slopes aspects using the ring knife method, and the results showed that the surface soil water content of the shady slopes was significantly higher than that of the sunny slopes (p < 0.05) (Figure S2a). The soil bulk density at 0–10 cm and 10–20 cm on the sunny slopes was significantly higher than that on the shady slopes (p < 0.05) (Figure S2b).

2.2. Field Survey

We conducted site surveys and sample collection in July and August 2019. In this study, different life stages of Q. mongolica were distinguished, including adult trees, saplings, and seedlings. Multiple plant organs were sampled separately. First, a 10 × 10 m plot was set up, and trees with a diameter at breast height ≥ 10 cm were defined as adult trees [33]. Trees with a diameter at breast height ranging from 1 to 9.9 cm were defined as saplings, and those with unlignified stem diameters < 1 cm and tree heights < 30 cm were defined as seedlings. We investigated 12 plots on the sunny slopes and 15 plots on the shady slopes while collecting samples. The heights and diameters at breast height (1.3 m above the ground) of every tree were measured in each plot. Sprout regeneration seedlings are differentiated from seed regeneration seedlings by emergence of the stem from a lateral root of the parent tree running in the upper soil horizon (Figure 1). We distinguished seedlings in this study on that basis. The ratio of seedling from seed germination was calculated by digging around each whole plant and removing the superficial soil temporarily to confirm the contact of the root sprout to its parent tree.

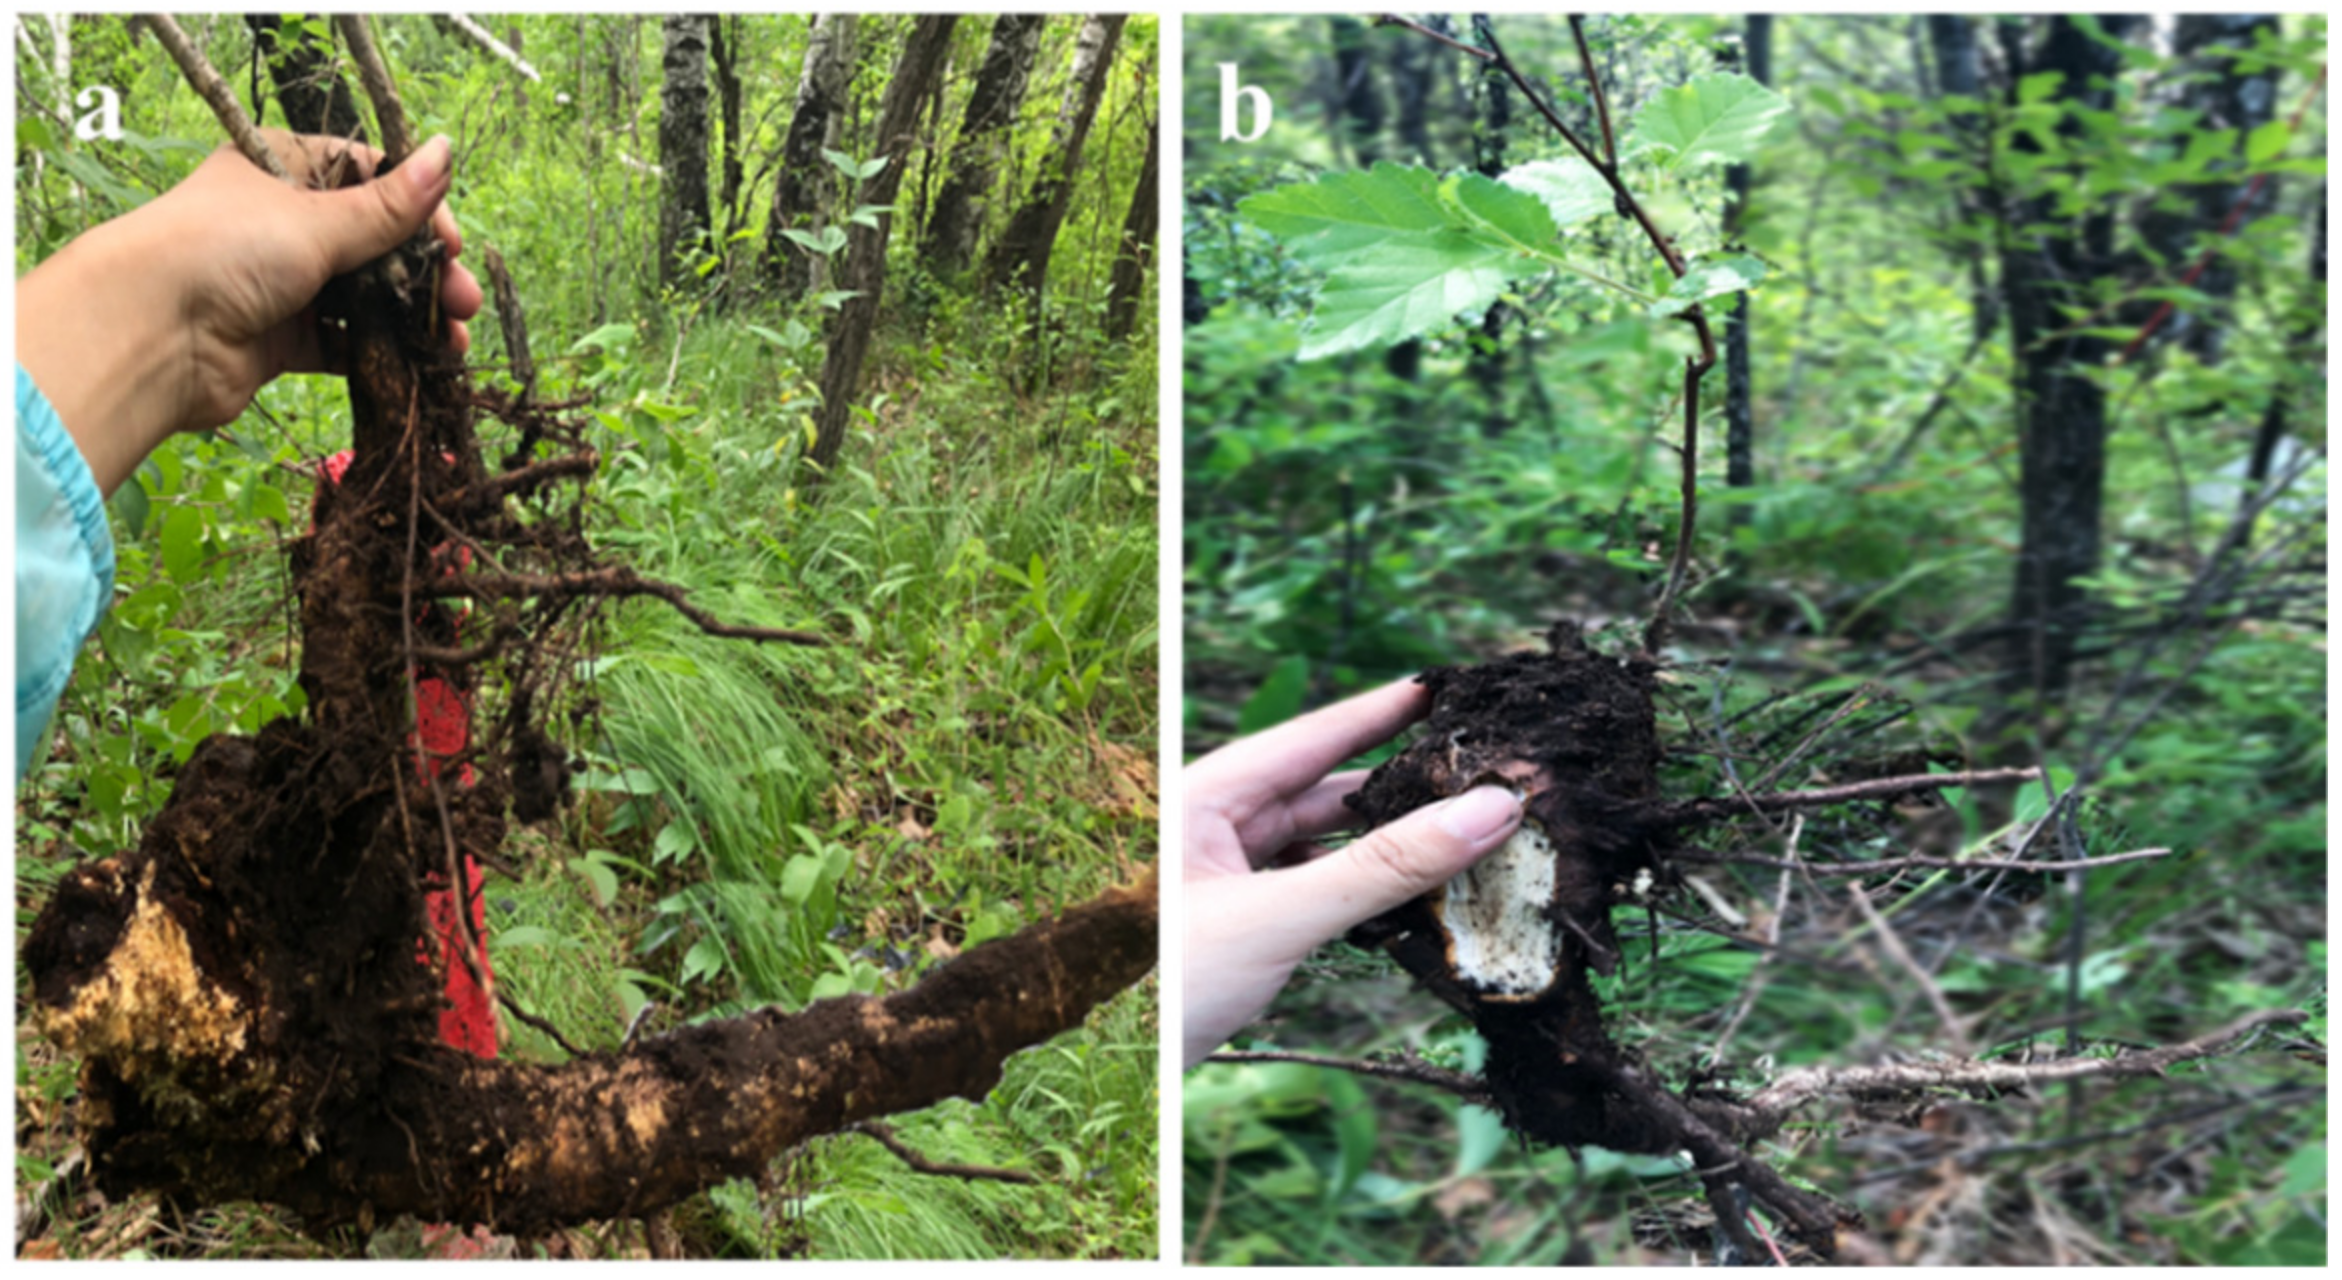
2.3. Sample Collection

To compare stem growth rates across different growth forms, we sampled two tree ring cores from 10 adult trees per growth form in the study site using increment borers with an inner diameter of 5 mm parallel to the contour on the opposite sides of the tree trunk at breast height (1.3 m). After air drying, the cores were polished using progressively fine sandpaper until tree ring details were clearly visible. All polished tree ring samples were dated using the cross-dating technique [34]. Tree ring widths were measured using a width meter with an accuracy of 0.001 mm using LINTAB. The quality of cross-dating was then validated using the COFECHA program [35]. Some cores were redated until the series intercorrelated up to 0.6 to ensure that the measured ring widths were reliable. Based on the ring widths, the BAI was calculated as:
BAI = π (rt2rt−12)
where rt is the stem radius at year t and rt−1 is the stem radius in the year before year t [36].
Considering that the tree canopy position has no significant effect on the branch NSC concentration in previous studies [37], this study did not sample according to the canopy position. The first-level branches in the middle of the canopy were randomly selected as standard branches. Branches with good growth were cut off by branch shears, and then the leaves on the branches were picked off (attempting to choose leaves without insect eggs). An increment borer was used to drill 4 tree cores at the breast height of each sample tree. During each sampling, the drilling position was slightly moved, and the sampling was in a Z-shape to avoid overlapping with the previous sampling position and decrease the experimental error. Two root samples from each tree were excavated using iron picks, shovels, and branch shears to cut from the soil layer between the root and the farthest end of the canopy at a depth of 5–30 cm. After washing the soil on the root surface, they were divided into thick roots (>5 mm) and fine roots (<2 mm), according to diameters.
The saplings are dug up with the roots, and the sprouted root saplings are collected from the roots of the parent tree. We took the seed regeneration seedlings to the shady slopes and the sprouted seedlings to the sunny slopes. Since the seedlings are small, the whole plant is brought back to the laboratory and decomposed into leaves, stems, and roots (fine roots and thick roots). A total of 6 seedlings, 4 saplings, and 5 adult tree form samples were collected on the shady slope. A total of 11 seedlings, 9 saplings, and 8 adult shrub form samples were collected on the sunny slope.

2.4. Measurements of NSC Concentration

All samples were deactivated using a microwave oven at high heat (600 W) to denature the enzyme, and then dried to a constant weight in a drying oven at 65 °C. In this study, the concentrations of starch and soluble sugar were determined by the anthracene copper concentrated sulfuric acid method [38,39,40,41]. Total nonstructural carbohydrates (TNCs) were defined as the sum of soluble sugar and starch concentrations.
One gram of purified anthrone was weighed and dissolved in 1000 mL of dilute sulfuric acid solution to obtain an anthrone reagent. It was prepared with 100 µg/mL glucose standard solution for drawing a standard curve. The grinded plant tissue weighed about 0.05 g and the actual weight was recorded and extracted repeatedly with 80% ethanol. After collecting the supernatant, anthrone reagent was added to measure the absorbance with a spectrophotometer (UV-1800 PC, Shanghai MAPADA Instruments, Shanghai, China) at 620 nm wavelength. With the sugar concentration in the filtrate analyzed from the standard curve (or calculated by a linear regression formula), the percentage of sugar in the sample was calculated, the unit of sugar concentration being a percent of sugar per gram of the sample dry weight.
Perchloric acid and distilled water were added to the residue after extraction of soluble sugar for repeated extraction. Anthrone reagent was added to the supernatant and measured on a spectrophotometer to calculate the absorbance. The starch concentration was read from the standard curve.

2.5. Statistical Analysis

Multivariate analysis of variance (MANOVA) was used to test whether there were significant differences in different growth forms. A mixed linear model was used to analyze whether each factor had a significant effect on the NSC concentration. The NSC concentration was used as the dependent variable, the growth forms, life stages, organs, and their interactions were used as fixed factors, and different individuals were used as random factors. All statistical analyses and figure graphing were performed in R version 4.1.2 and Origin version 2020b.

3. Results

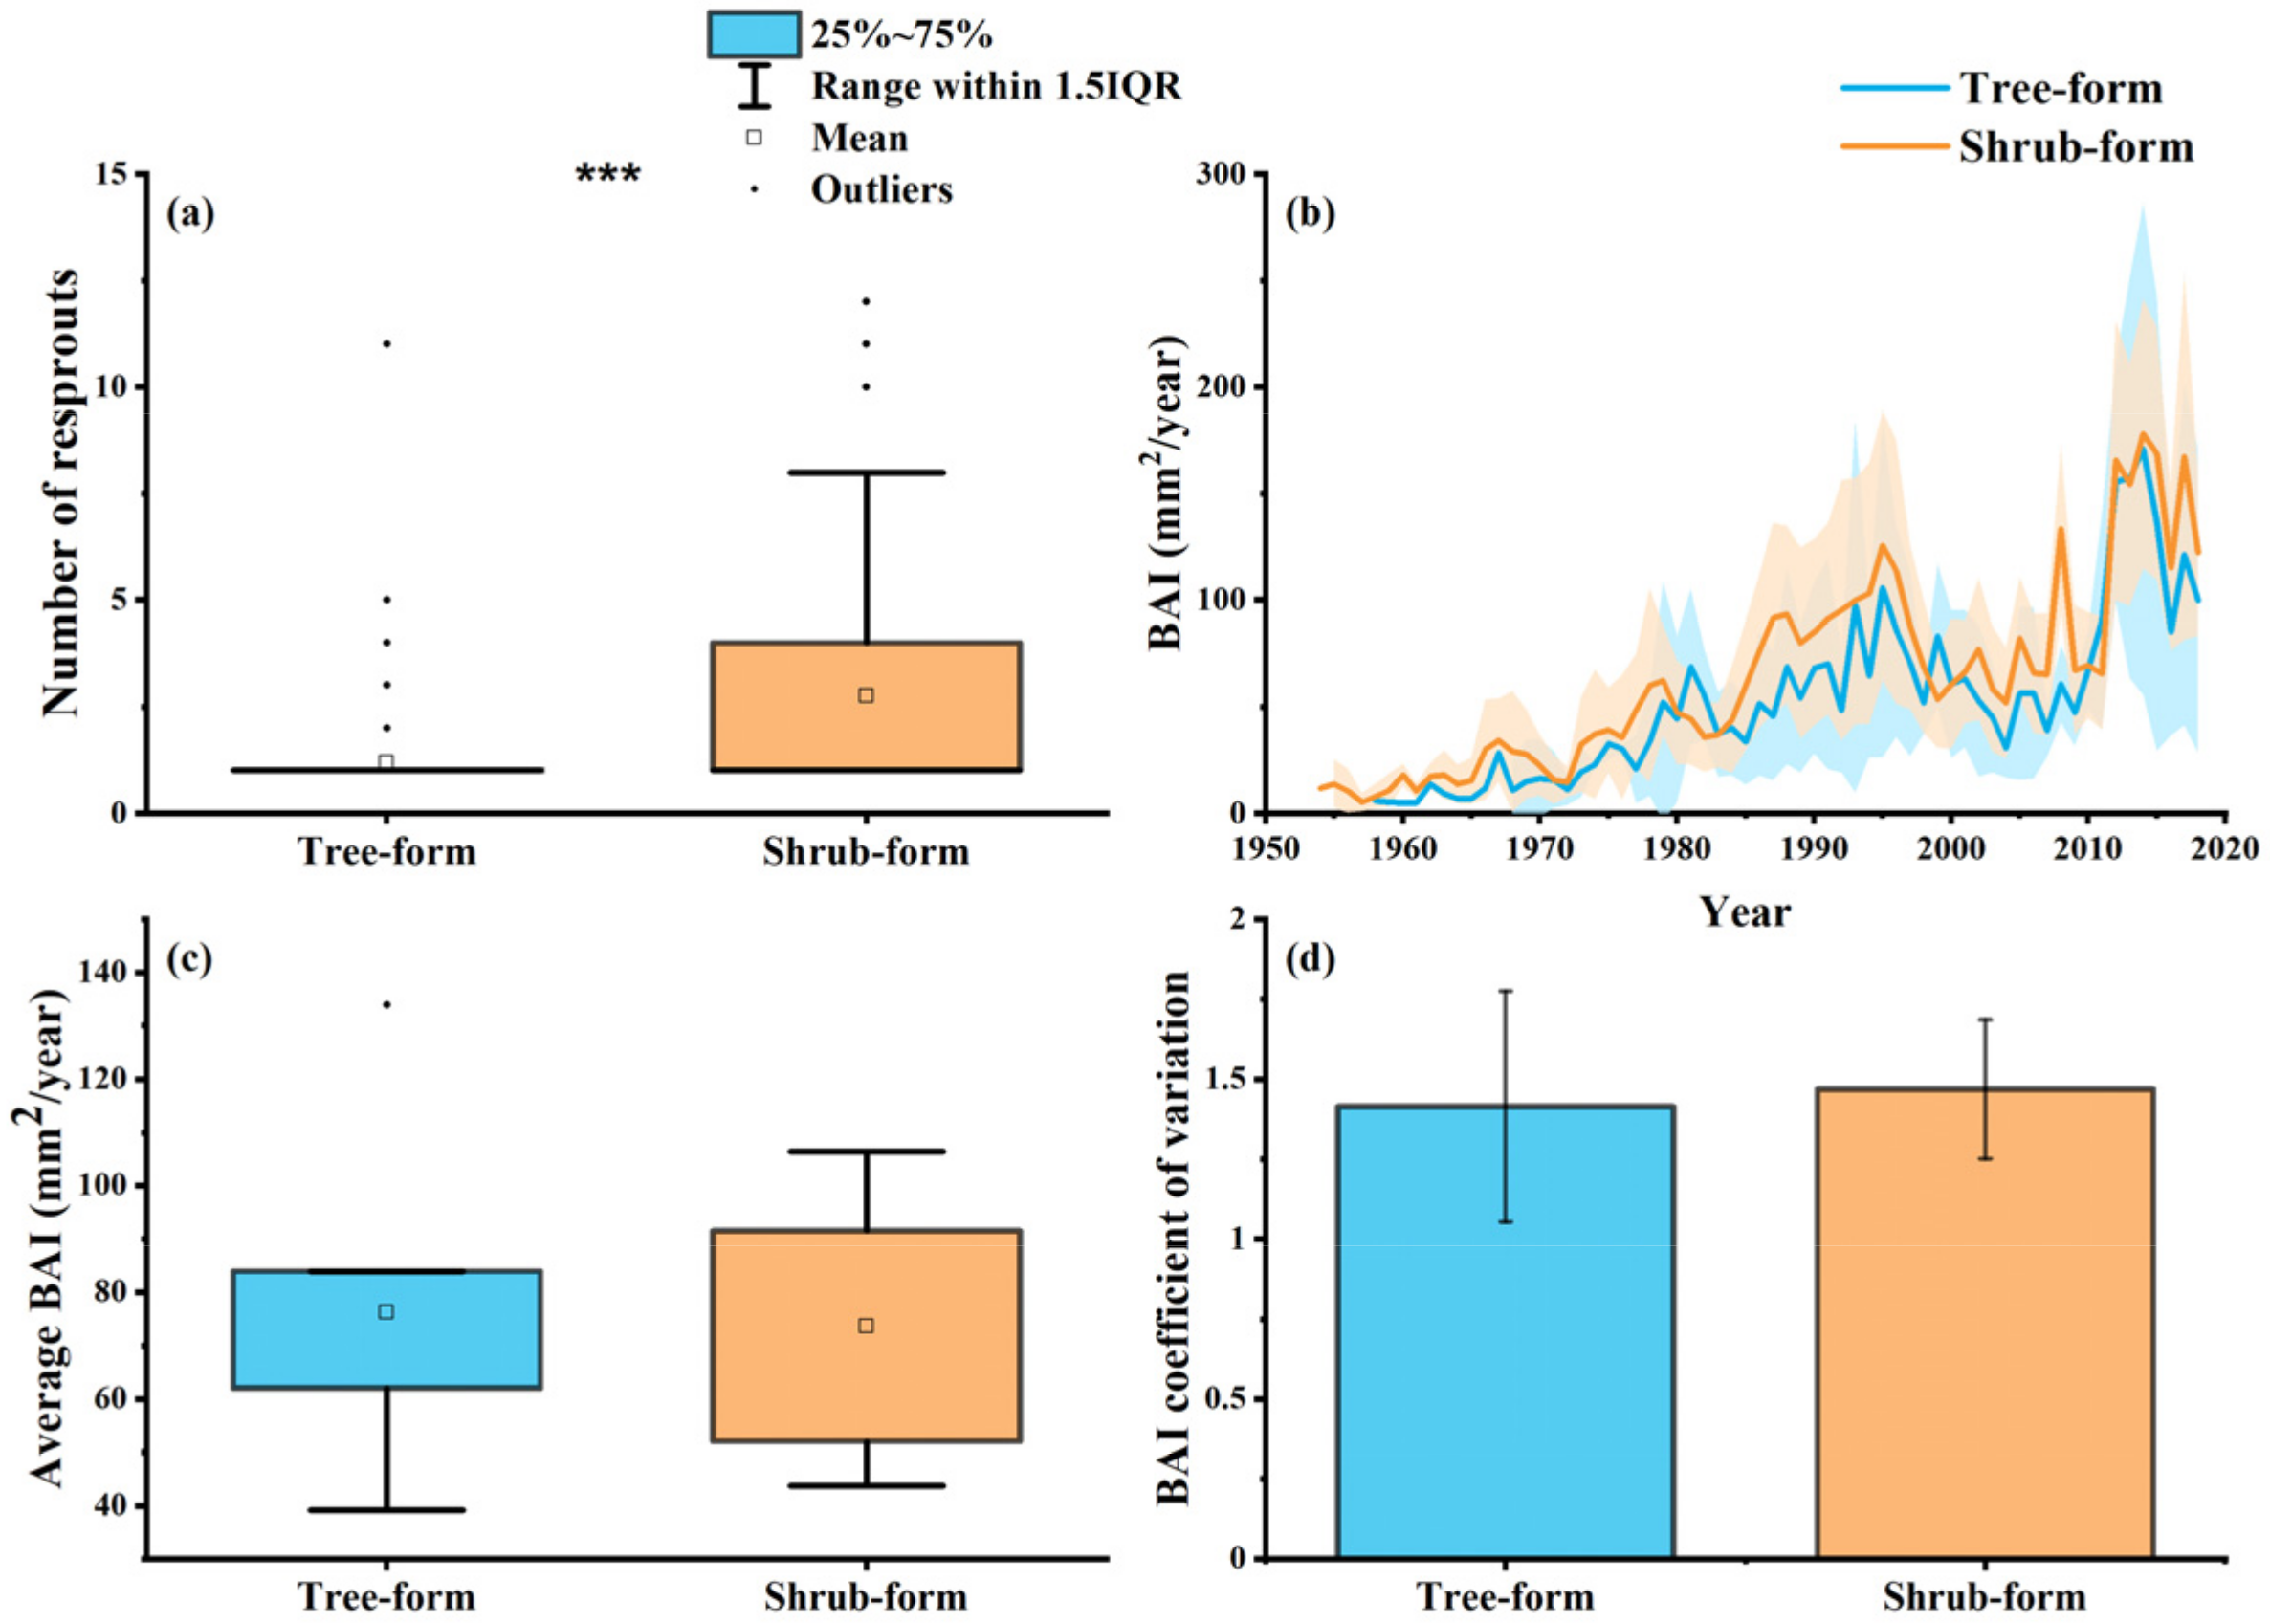
3.1. Growth Features of Tree and Shrub Form Quercus mongolica

The results of the quadratic survey showed that 1/3 of seedlings for the tree form were produced by seed germination, while all the seedlings for the shrub form were sprout production (Table 1).
The tree heights of saplings and adult trees on the shady slope were significantly higher than those on the sunny slope (p < 0.05). DBH of saplings and adult trees, as well as height of seedlings, did not differ significantly between the two slopes (p > 0.05). There was no significant difference in the age of the two growth forms of Q. mongolica (p > 0.05).

3.2. Carbon Allocation for Reproduction and Growth

The basal number of sprouts of shrub form Q. mongolica was significantly higher than that of tree form adult trees (p < 0.001) (Figure 2a). Most trees of tree form only had single main trunk, while those of shrub form mostly grew with multiple stems. The ages of different growth forms are relatively similar (Table 1). Although the shrub form showed less growth variances relative to tree form (Figure 2b), the growth difference between them was not significant (p > 0.05, Figure 2c). There is no significant interannual differences in multi-year BAI between tree and shrub growth forms (p > 0.05, Figure 2d).

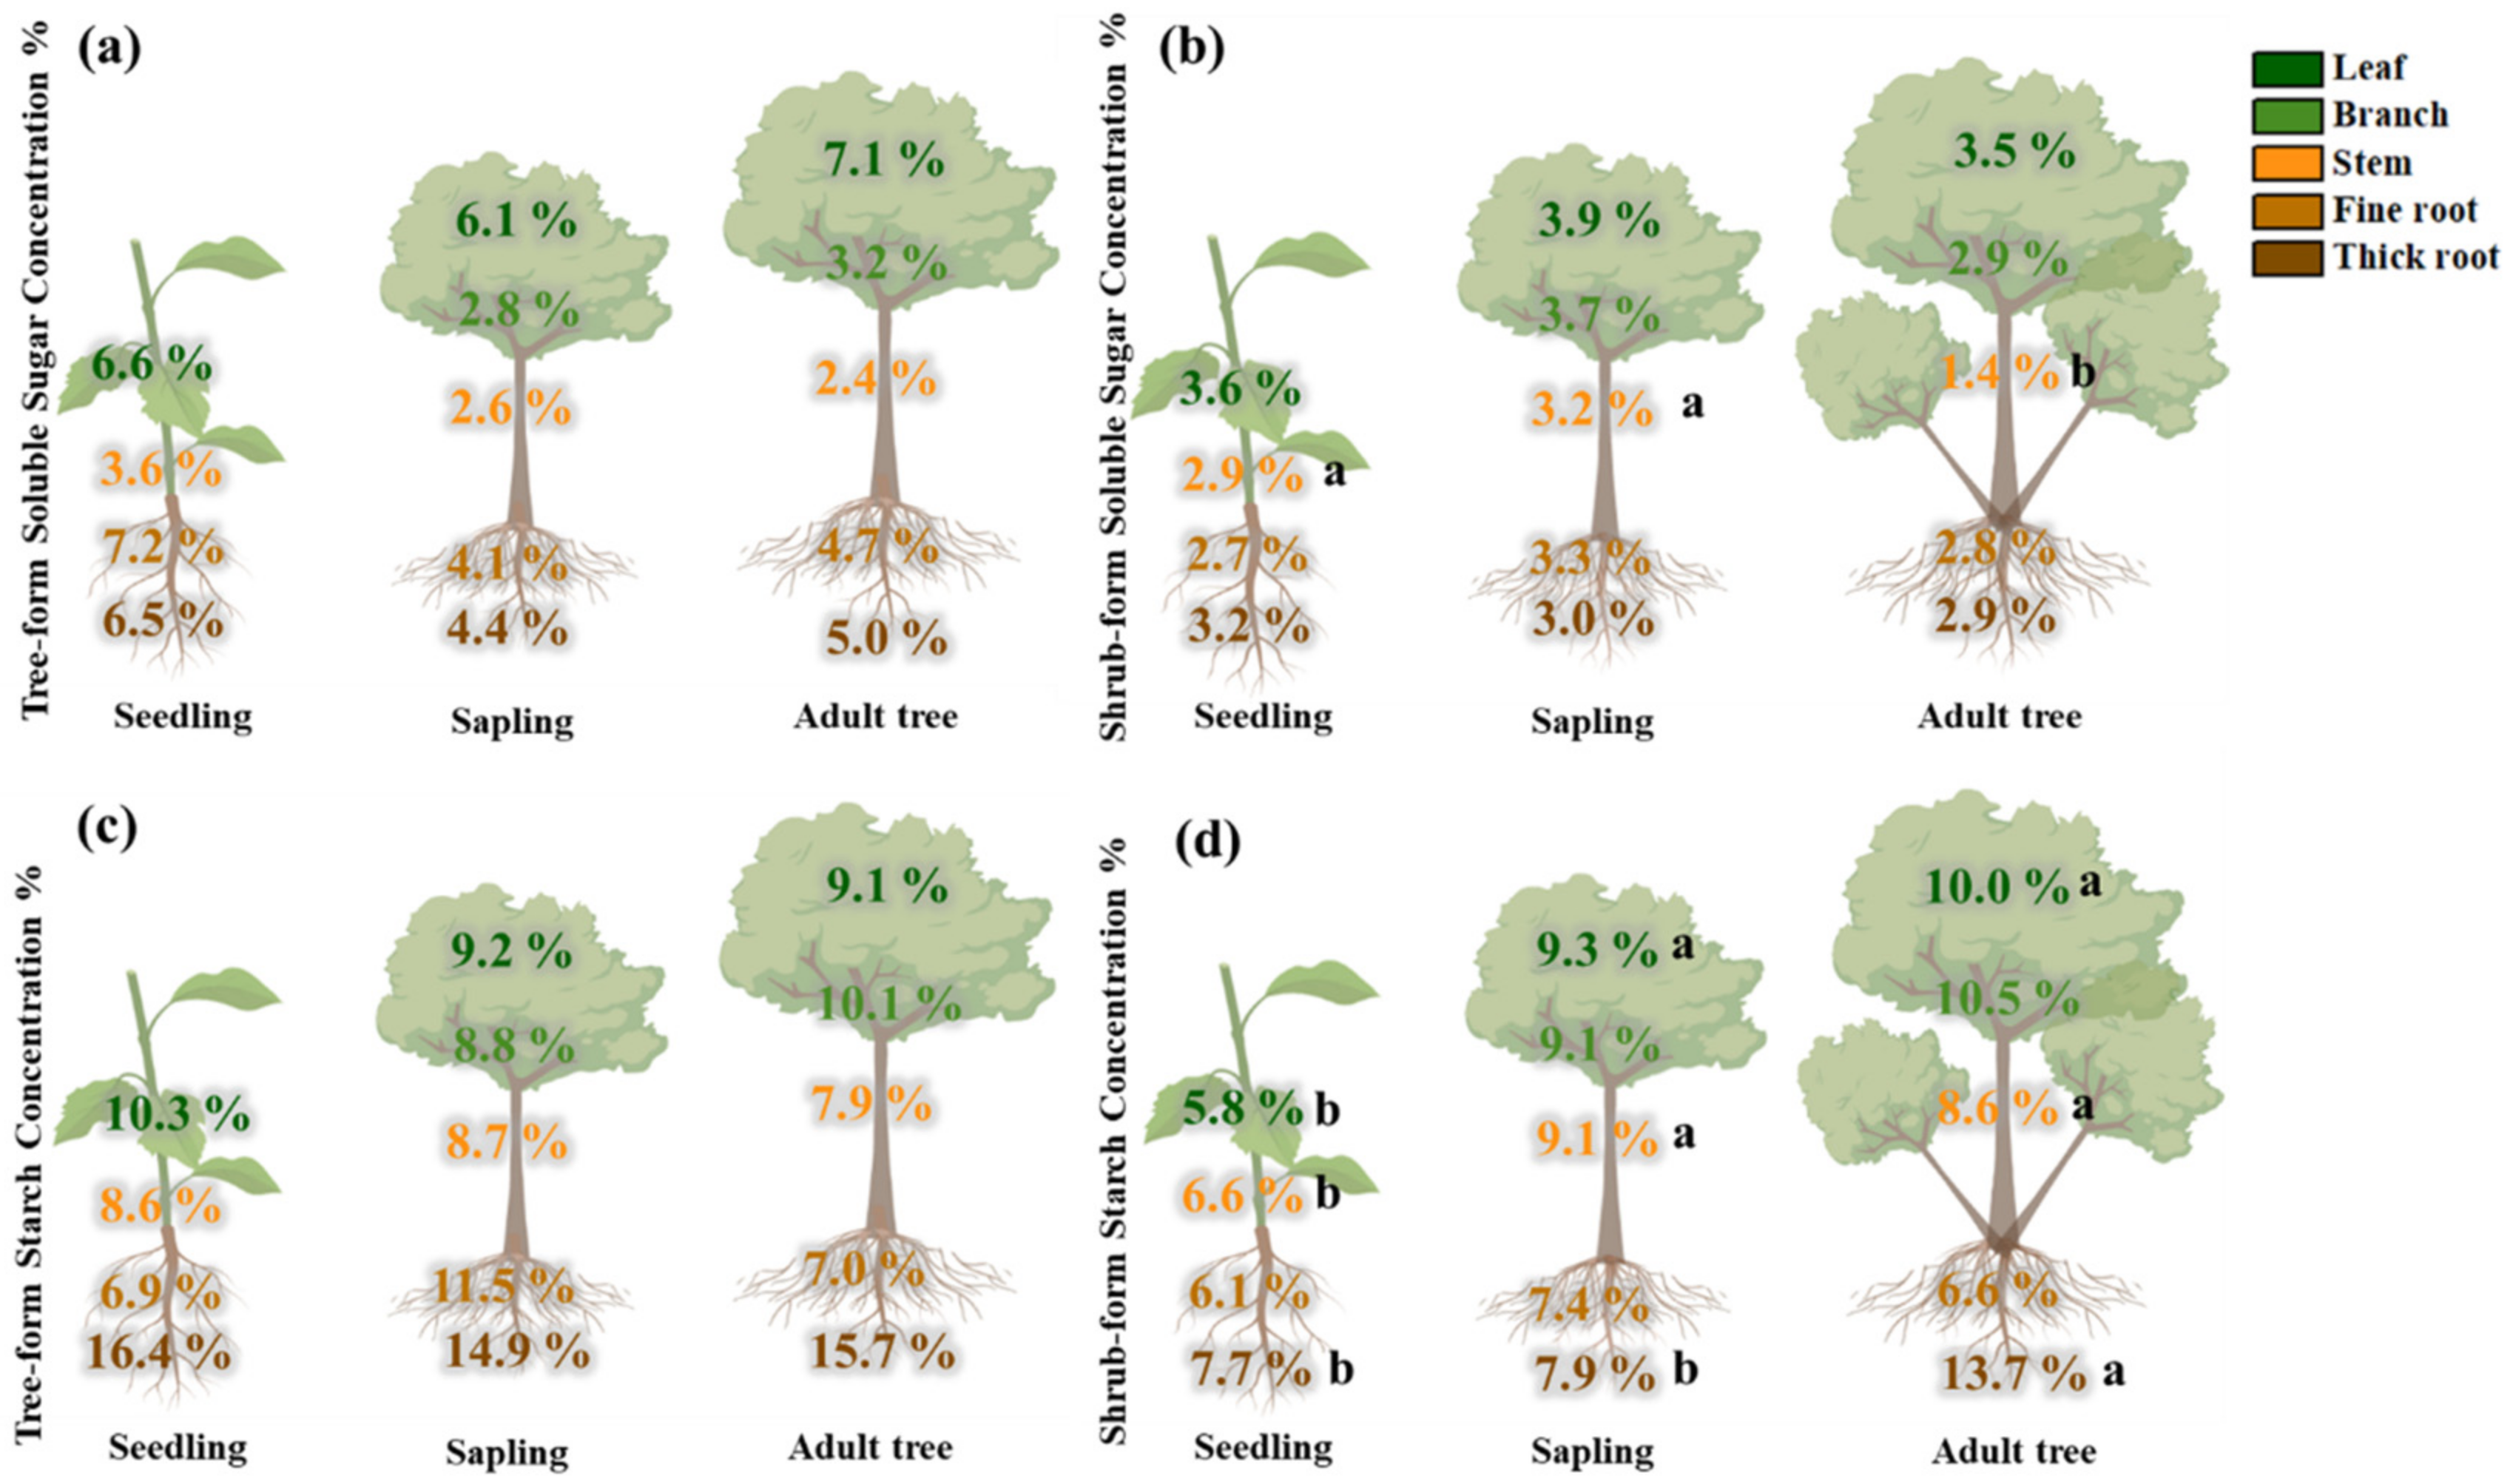
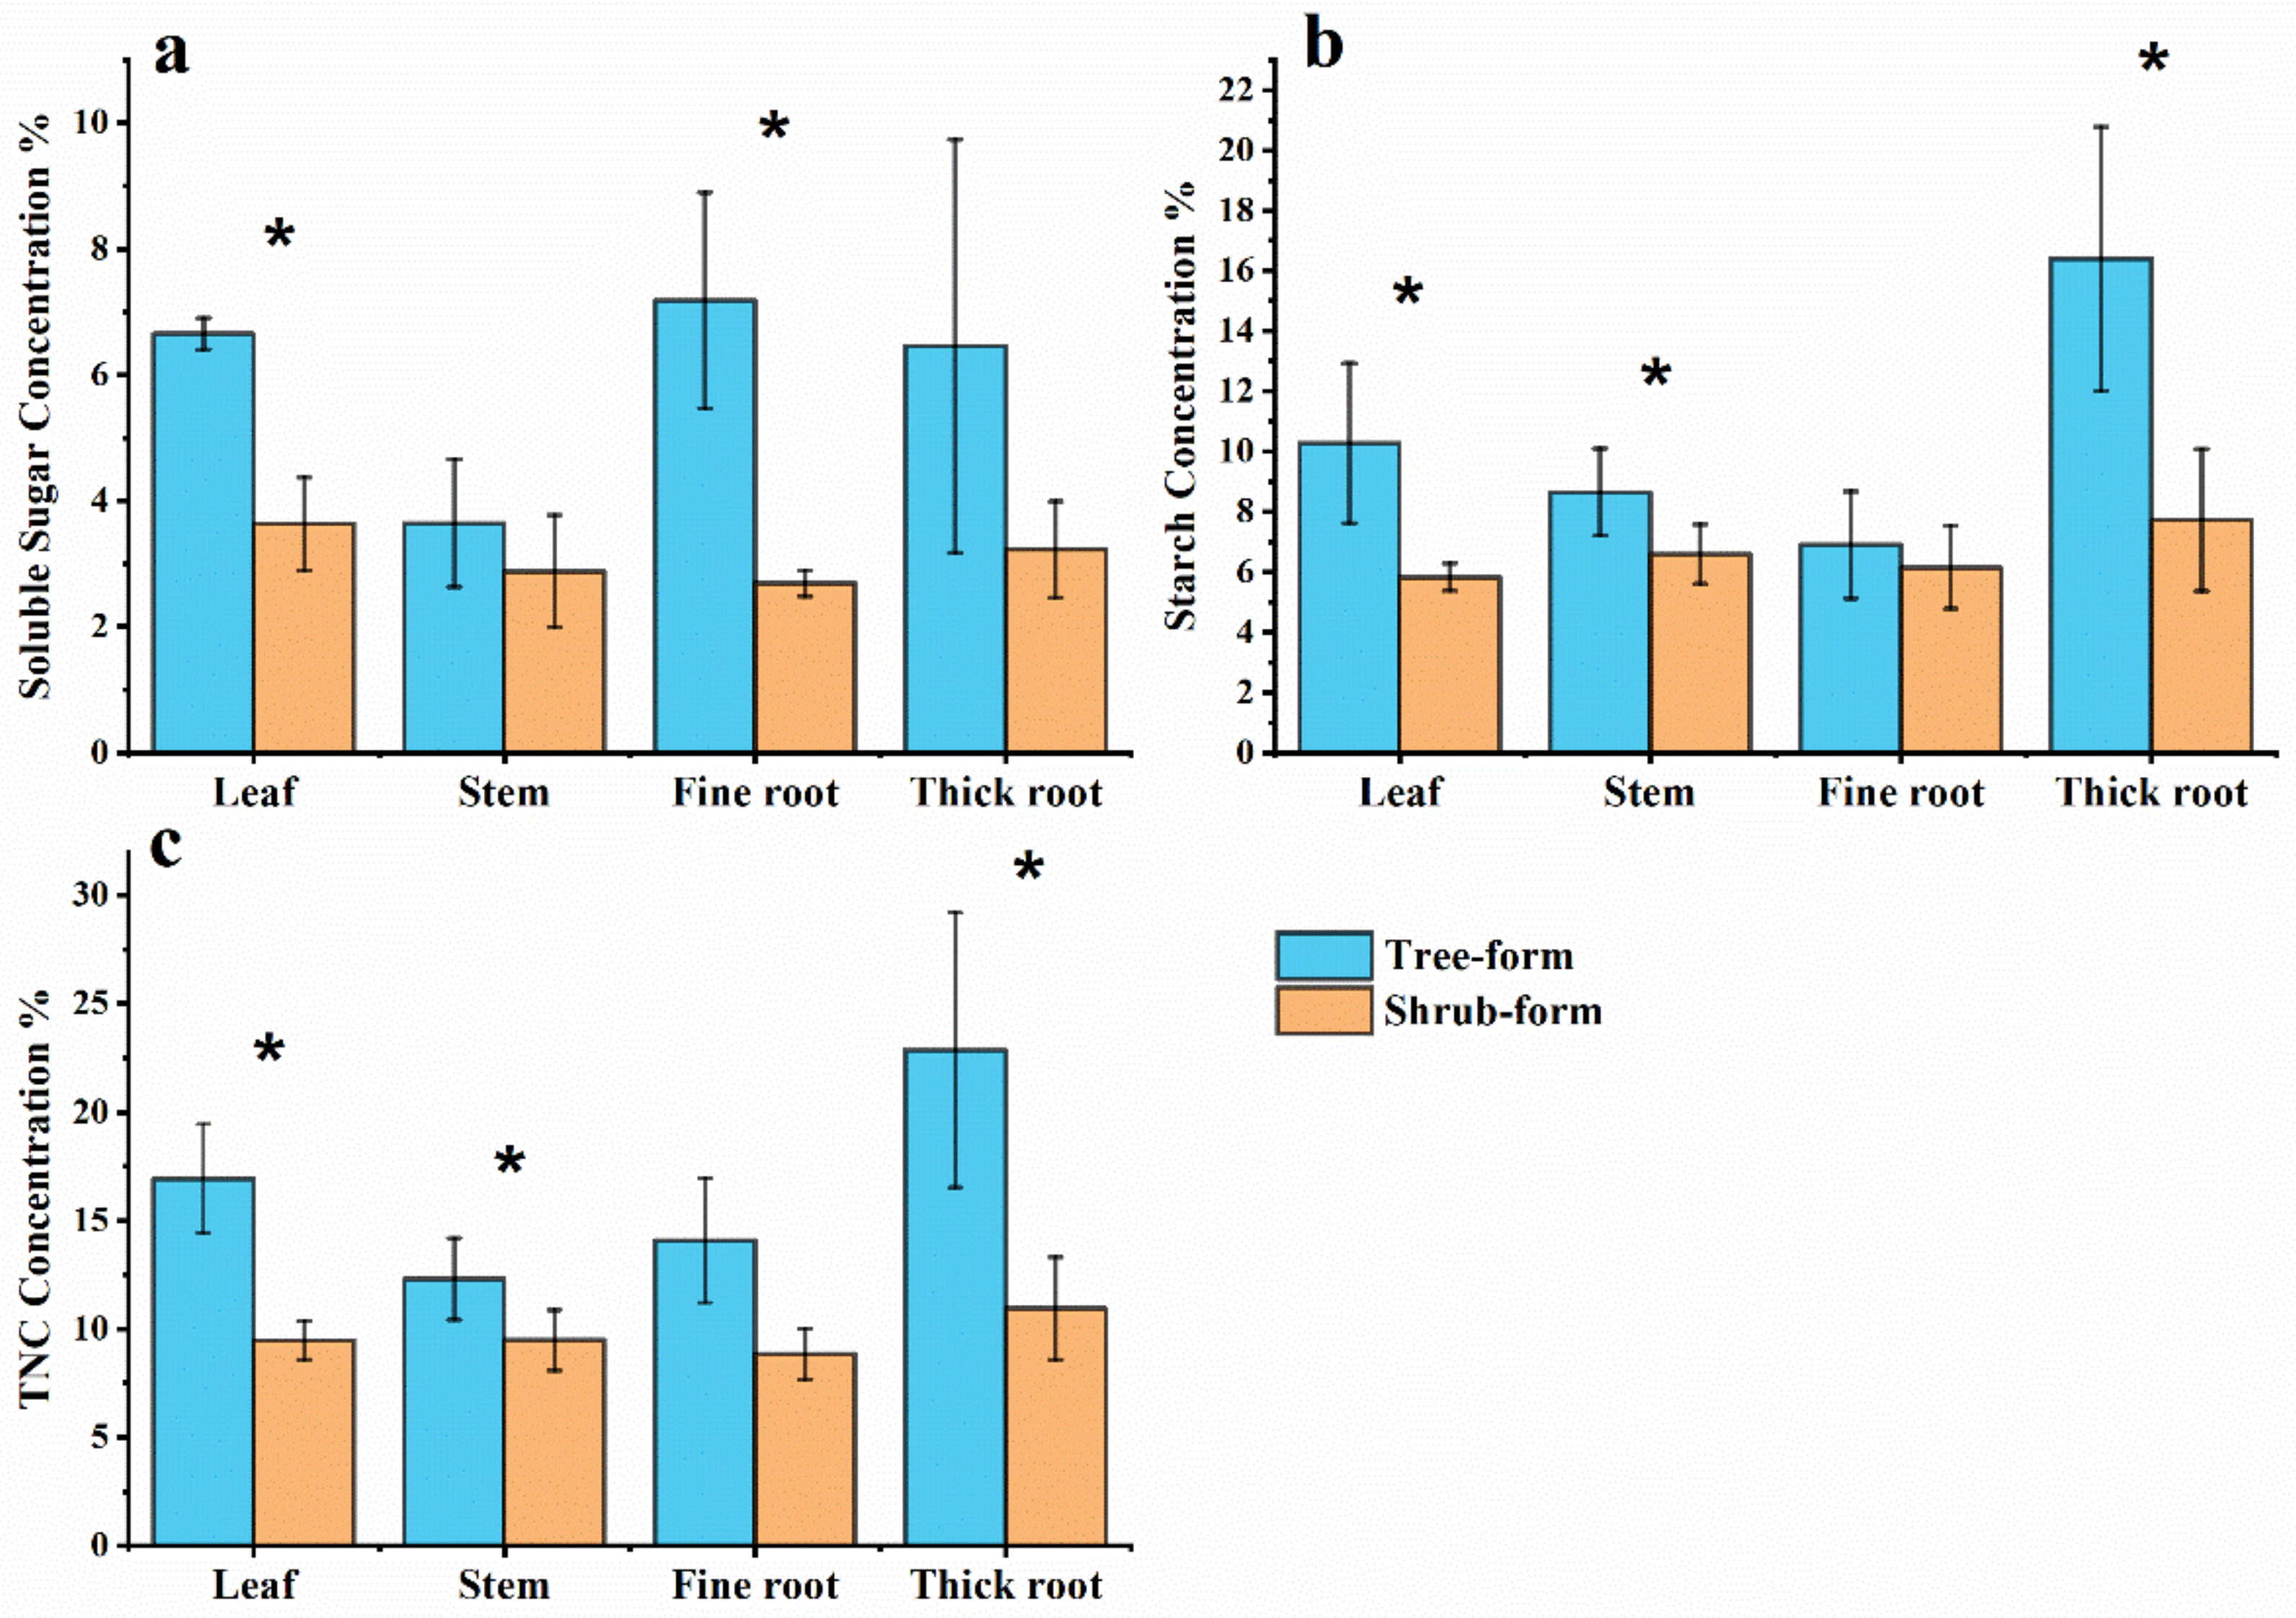
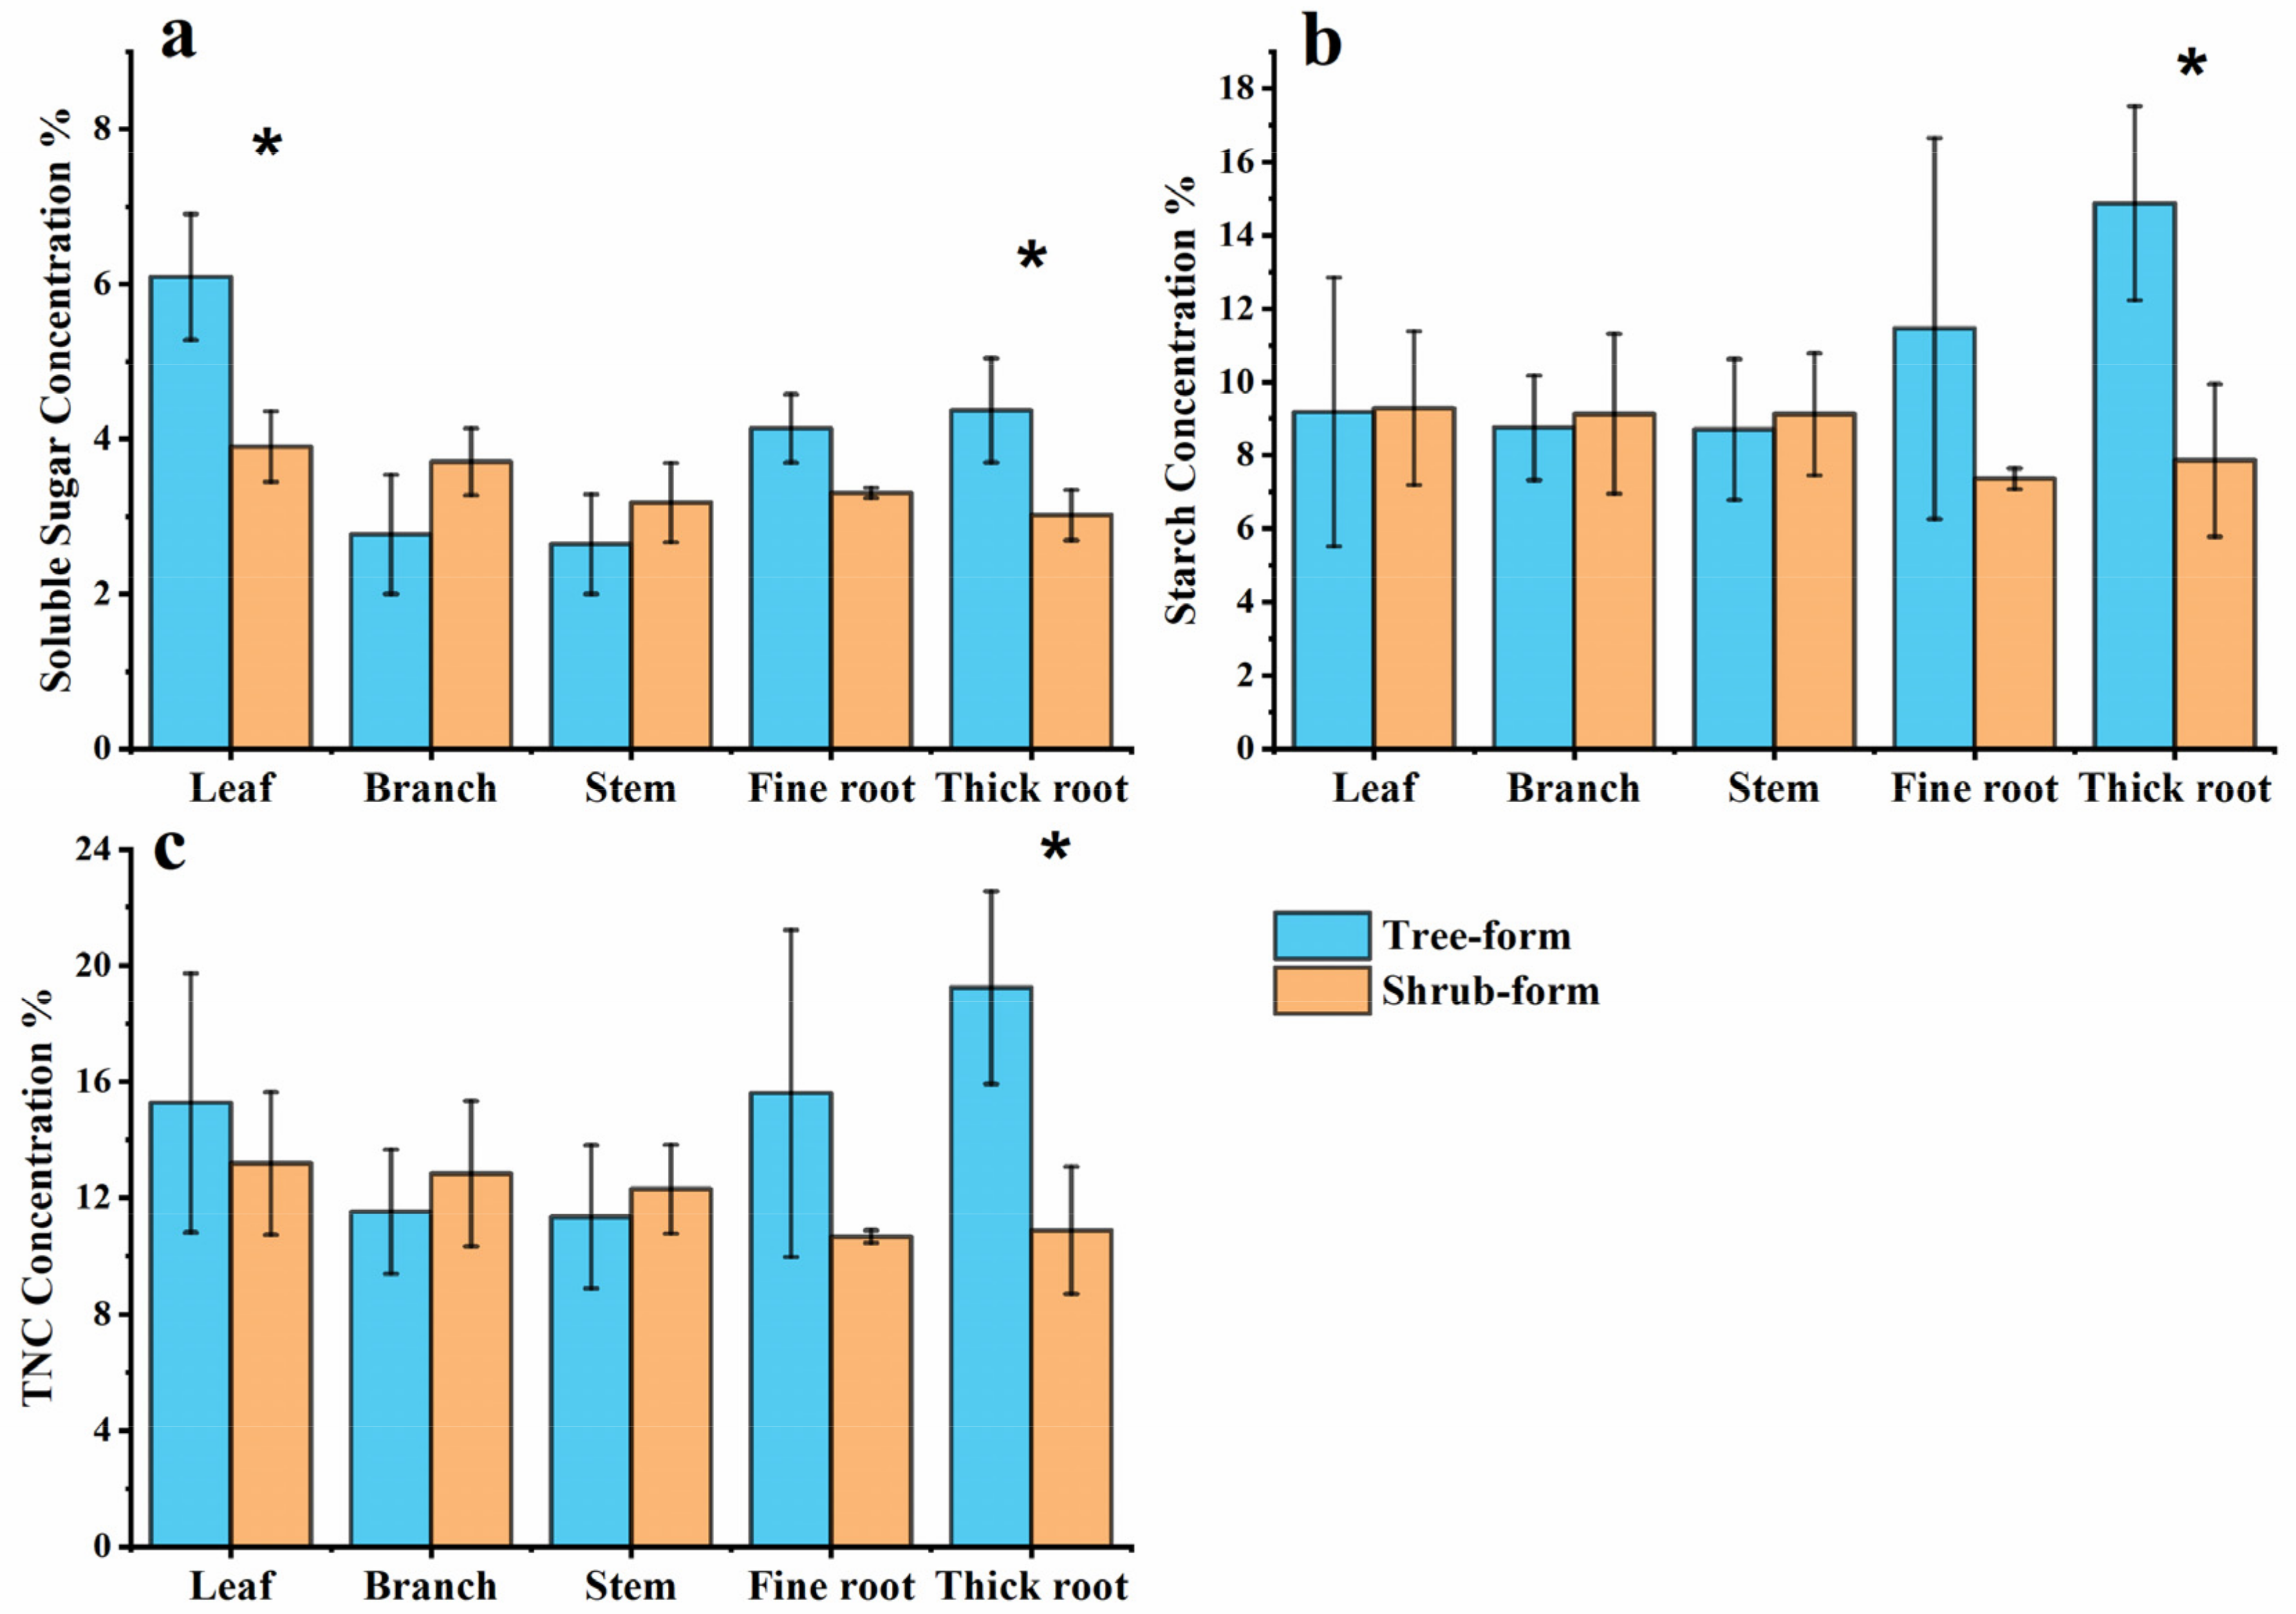
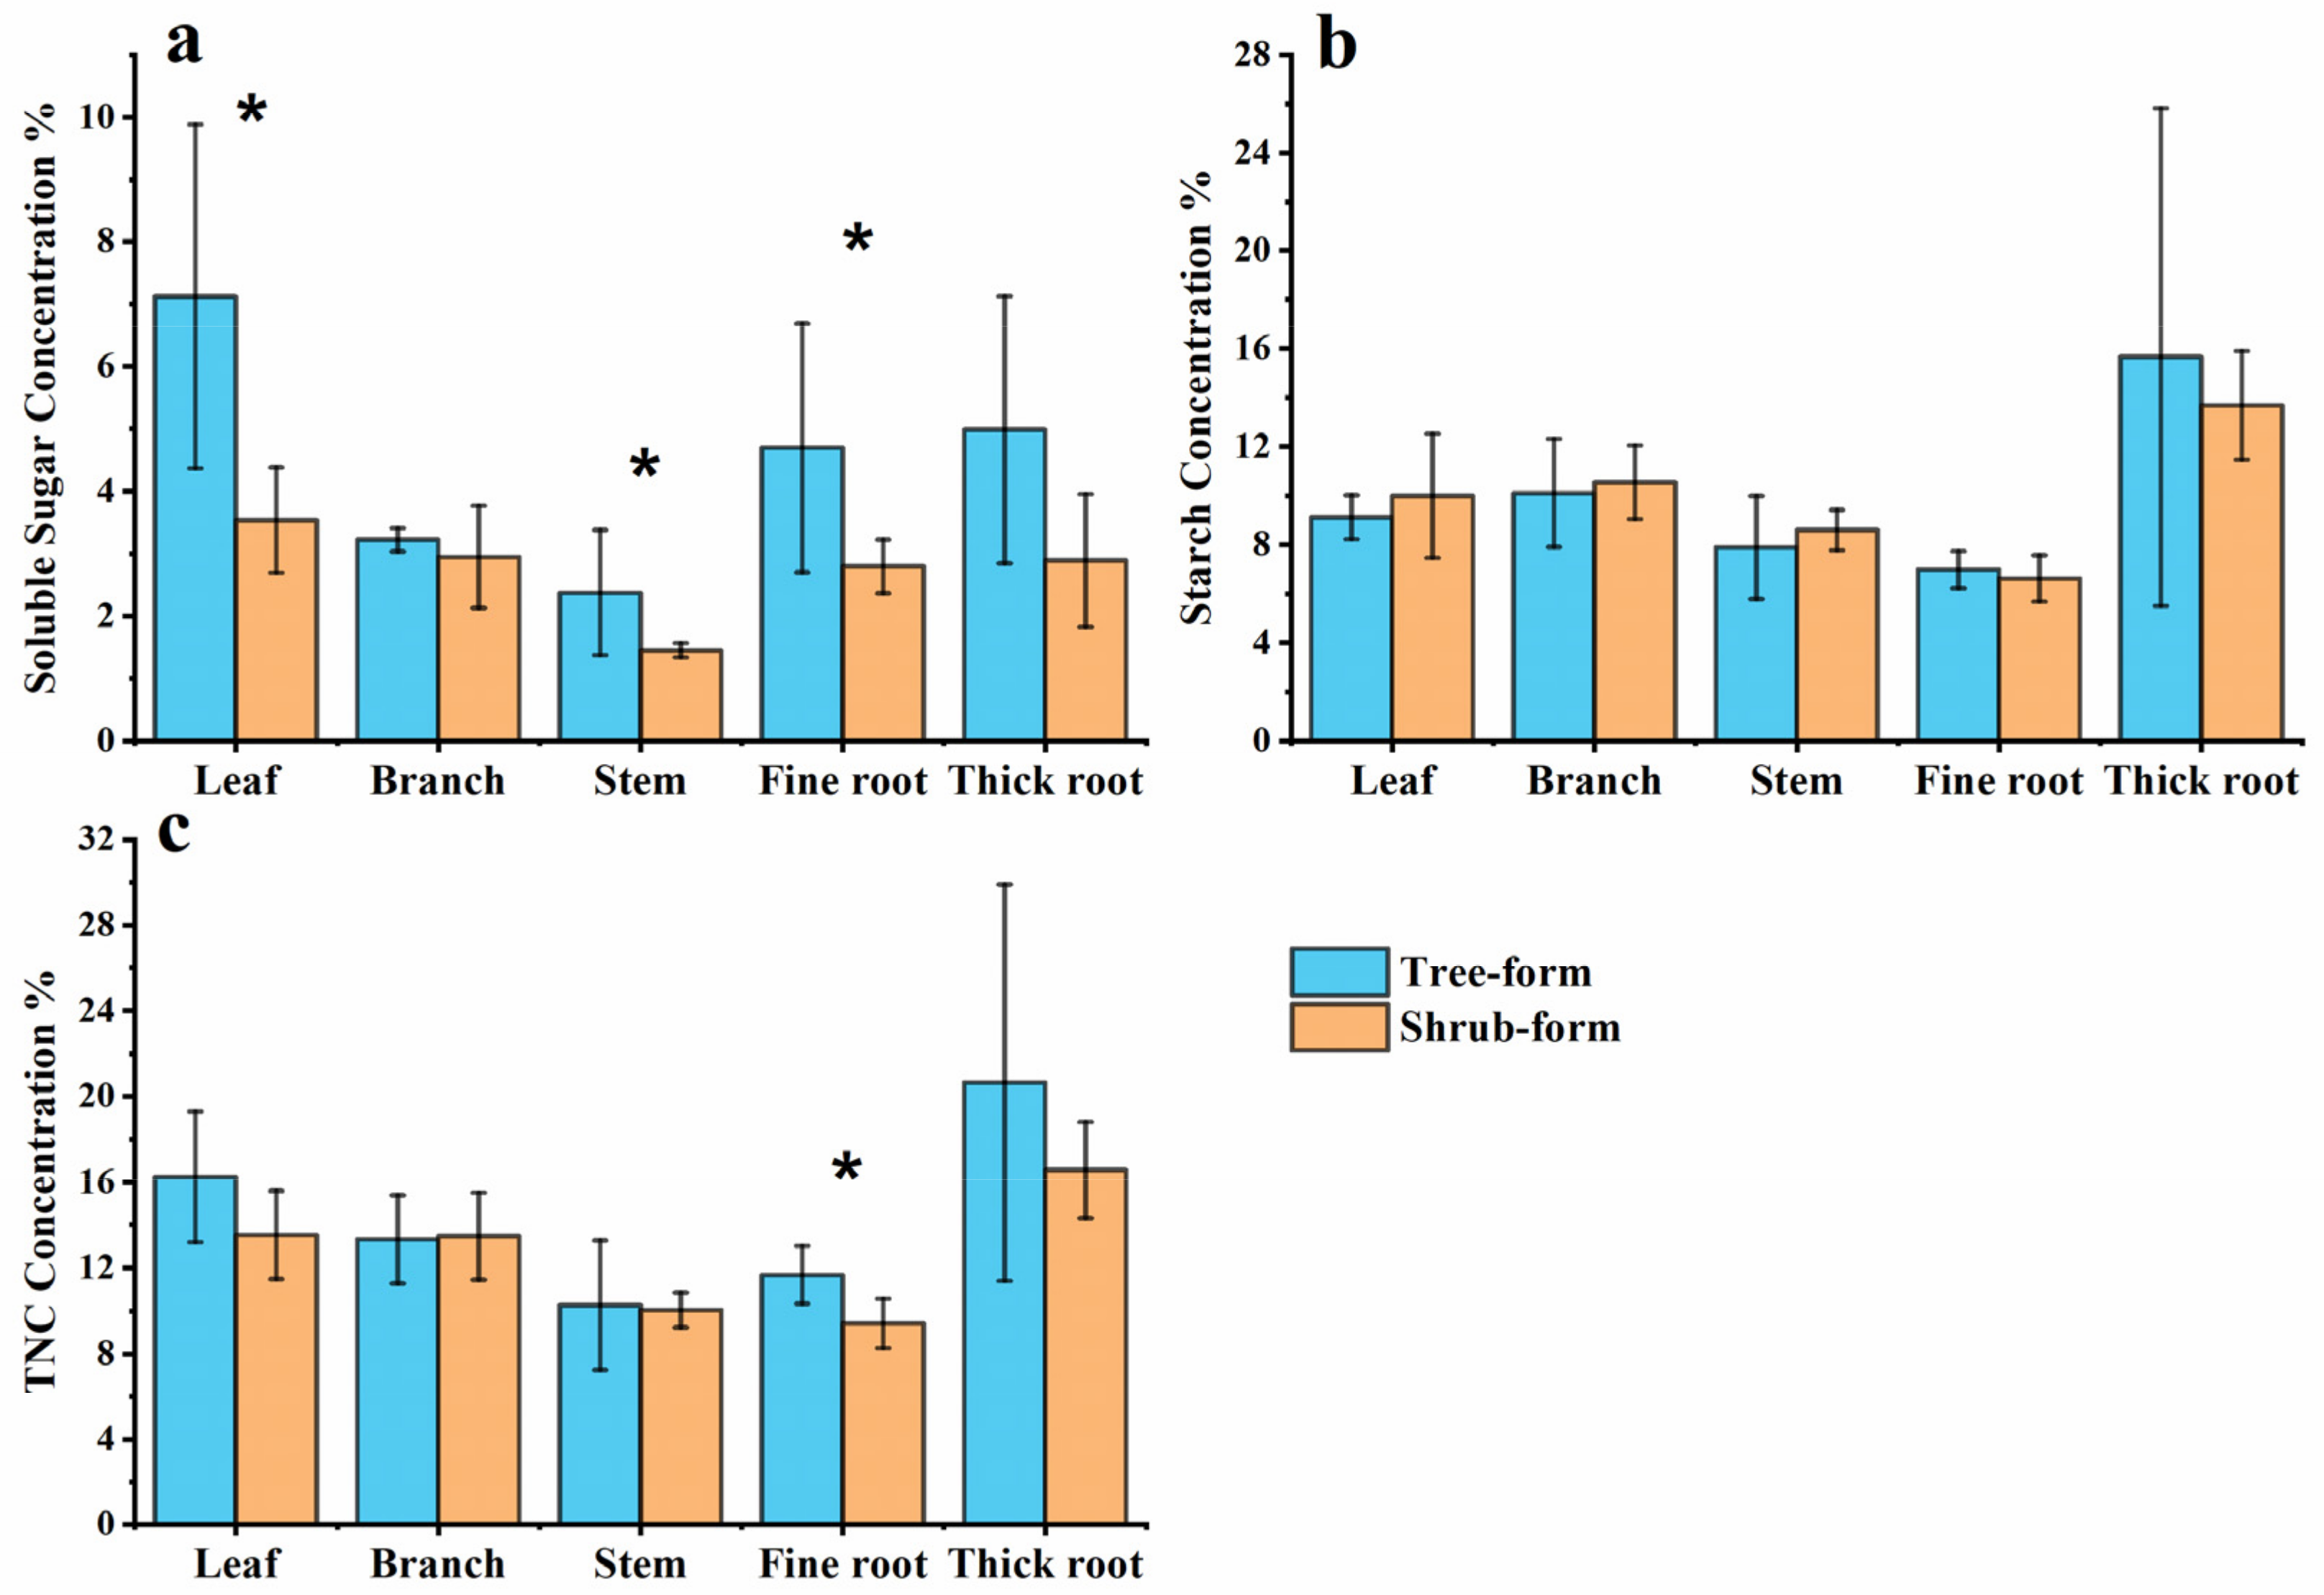
3.3. Carbon Allocation for NSC Storage

The results of the mixed linear model show that the differences in both growth form and organ significantly affected the soluble sugar, starch, and total nonstructural carbohydrates (TNCs) (p < 0.01, Table 2). Life stage significantly affected soluble sugar concentration (p < 0.05) but had no significant effect on starch and TNC concentrations (p > 0.05). Different life stages and sites showed significant interactions in starch and TNC (p < 0.05). Growth form and organ showed significant interactions on soluble sugar, starch, and TNC (p < 0.01).
NSC concentrations in Q. mongolica with different growth forms were affected differently by life stage and organ (Table 3). The soluble sugar concentration of tree form Q. mongolica was significantly affected by life stage (p < 0.05). The starch concentration and TNCs of shrub form Q. mongolica were significantly affected by life stage (p < 0.01). NSC concentrations with different growth forms were significantly affected by different organs (p < 0.001).
Results of MANOVA analysis showed that, for Q. mongolica of both tree and shrub forms, the concentrations of soluble sugar and starch were different in each life stage (Figure 3). There were no significant differences in starch and soluble sugar concentrations in the same organ of tree form Q. mongolica at different life stages (p > 0.05, Figure 3a,c). The changes in NSCs in shrub form Q. mongolica were completely different. The concentration of soluble sugar in adult tree stems (1.4%) was significantly lower than that in seedling (2.9%) and sapling (3.2%) stems (p < 0.05, Figure 3b). Meanwhile, the starch concentrations in the leaves (5.8%) and stems (6.6%) of the seedling stage were significantly lower than those of the saplings and the adult trees (p < 0.05, Figure 3d). The starch concentration in the thick roots (13.7%) of the adult trees was significantly higher than those of the seedlings (7.7%) and saplings (7.9%) (p < 0.05, Figure 3d).
In terms of NSC concentration in different organs, except for the tree form seedlings, the soluble sugar concentration in leaves (3.5%–7.7%) was the highest at each life stage, and the soluble sugar concentration in stems (1.4%–3.6%) was relatively low (Figure 3a,b). Except for the shrub form saplings, the starch concentration in the thick roots (7.7%–16.4%) was always the highest, and the starch concentration in the fine roots (6.1%–11.5%) was relatively low (Figure 3c,d).

3.4. Effects of Different Life Stages on NSC Storage

The results of a linear mixed model for different life stages showed that growth form significantly affected the soluble sugar, starch, and TNC contents of seedlings (p < 0.01, Table 4). However, there was no significant effect on the NSC concentration of saplings (p > 0.05), though there was a significant effect on the soluble sugar concentration in adult trees (p < 0.01, Table 4).
The MANOVA results showed that at the seedling stage of the shrub form, the soluble sugar (3.0% decrease), starch (4.4% decrease), and TNC (7.5% decrease) concentrations in leaves, and the concentrations of starch and TNC in stems (2.1% decrease) and thick roots (8.7% decrease) were significantly lower than those of the tree form (Figure 4). The soluble sugar concentration in fine roots (4.5% decrease) of the shrub form was significantly lower (Figure 4). In the sapling stage, the NSC concentrations of shrub form in thick roots (soluble sugar decreased 1.3% and starch decreased 7.0%) and soluble sugar concentration in the leaves (2.2% decrease) were significantly lower than those of tree form (Figure 5). The NSC concentrations in branches (soluble sugar increased 1.0% and starch increased 0.4%) and stems (soluble sugar increased 0.5% and starch increased 0.4%) were higher than those of the tree form, but the difference was not significant (Figure 5). For adult trees, the concentration of soluble sugar in leaves (3.6% decrease), stems (0.9% decrease), and fine roots (1.9% decrease) of the shrub form were lower, and the TNC concentration in fine roots (2.3% decrease) was lower (Figure 6). While starch (0.4% increase) and TNC concentrations (0.2% increase) in branches were higher than those of treeform, the difference was not significant (Figure 6).
Different organs had a significant effect on the NSC concentrations of seedlings and adult trees (p < 0.05) and had a significant effect on the soluble sugar concentration of saplings (p < 0.001) (Table 4). Interactions between growth forms and organs on the NSC concentrations were significant in saplings and seedlings (p < 0.05), except for the soluble sugar of seedling (Table 4).

4. Discussion

4.1. Growth Form Affecting Carbon Allocation for Both Tree Growth and Reproduction

Our results showed that the effects of tree and shrub growth forms were significant for the seedlings and sapling of Q. mongolica and became less pronounced as it grew up. Due to the smaller carbon pool of seedlings, the carbon in seedlings relies on constant carbon assimilation and was therefore more prone to dramatic fluctuations in response to environmental stress [42]. Tree-to-shrub significantly decreased starch accumulation in thick roots at the seedling and sapling stages and in leaves and stems at the seedling stage (Figure 4 and Figure 5). Meanwhile, changes in the growth form from tree to shrub at the sapling and adult tree stages resulted in increased starch concentrations in leaves, branches, and stems, but the increase was not significant (Figure 5 and Figure 6). This distribution method might facilitate the rapid transportation and utilization of soluble sugars and starches [29].
Some previous studies suggested that the primary function of NSC storage was to obtain higher storage at the expense of reduced growth and sacrifice of seed reproduction to ensure the survival of the species in extreme environments [20,43]. Although we could not sample and compare the differences in the quantity and quality of seeds produced in this experiment, evidence for seedling regeneration patterns and the number of resprouts indicated that we observed a change in the regeneration mode, leading to a change in regeneration modes from seedling to sprout production (Figure 2).
By comparing the tree ring BAI, the growth difference between those was not significant (Figure 2). There was no significant difference in the interannual growth variations of trees with different growth forms. It was suggested that there was a trade-off between reserve storage and the production of new tissues, and the growth form and plant size was generally used to quantify the trade-off [44]; however, this trade-off was not found in our study. Therefore, we speculated that Q. mongolica in an arid environment would change NSC storage patterns and reduce investment in seed production to ensure vegetative growth.

4.2. Divergent Carbon Allocation at Different Life Stages

The NSC concentration in the different life stages of Q. mongolica were distinct, and the soluble sugar concentration was significantly different with the life stages (Table 2). Soluble sugar concentration in seedlings is relatively high. Compared with adult trees, seedlings did not have lignified stems, and the absence of non-storing heartwood and older sapwood, therefore they could store more soluble sugars than adult trees [30]. Additionally, soluble sugars were also higher in seedling roots. The NSC concentration in the seedling stem could be three to four times that of an adult tree [45,46].
Previous studies suggested that the NSC concentration either increased or decreased gradually with growth [16,47]. Peaks in starch and soluble sugar levels could also occur at intermediate stages of life [48]. However, there was no such consistent pattern between saplings and adult trees in our study, and the NSC concentration could not be simply scaled according to allometric relationships. The concentration of NSCs was more likely to fluctuate during plant growth, with allocations adjusted according to growth needs at distinct stages. Our results indicated that tree form Q. mongolica significantly changed the soluble sugar concentration with tree growth, while the starch and TNC concentrations of shrub form changed significantly. Specifically, the concentration of soluble sugar in the stems of shrub form adults had significantly decreased, and the concentration of starch in the thick roots had significantly increased. Starch concentrations in leaves and stems of shrub form seedlings were significantly lower than those of saplings and adult trees. Compared with shrub form Q. mongolica, tree form Q. mongolica needed to accumulate more soluble sugar at the seedling stage to adapt to arid environment [49]. Shrub form saplings and adults stored more starch, especially in thick roots, in preparation for sprout regeneration, which could be explained by the classic paradigm that the availability of stored carbohydrate reserves was the major driver of resprouting [50].
It should be noted that our sampling was a one-time sampling, and the NSC concentration in plants often fluctuated with the seasons [26,51,52], so our results could only represent the nonstructural carbon concentration in Q. mongolica during our sampling period.

5. Conclusions

In summary, our study revealed changes in carbon allocation at different growth forms. We observed adaptation to dry climate through carbon allocation adjustments for growth, reproduction, and storage in the driest regions of the Q. mongolica distribution. Our study could shed light on the adaptation of trees to a dry climate through NSC allocation, which could benefit the improvement of vegetation dynamics models.

Supplementary Materials

The following supporting information can be downloaded at: https://0-www-mdpi-com.brum.beds.ac.uk/article/10.3390/f13111745/s1, Figure S1: Photos of the tree and shrub-form Quercus mongolica. a, Tree-form oaks on shady slopes. b, Shrub-form oaks on sunny slopes. Figure S2: Physical proper-ties of soil on shady and sunny slopes. a, Soil moisture content, b, soil bulk density measured by the ring knife method. Asterisks indicate significant differences at the same soil layer depth on different slopes (*, p < 0.05; **, p < 0.01). Table S1: Basic Information for the shady and sunny slope of Quercus mongolica.

Author Contributions

H.L. and Y.Q. conceived of the study idea. Y.Q. performed the analyses. H.L., Y.Q., W.H., J.D., L.S. and Z.S. interpreted the results and implications. H.L. supervised the research. Y.Q. and H.L. wrote the first draft of the manuscript. All authors revised the text and provided critical feedback. All authors have read and agreed to the published version of the manuscript.

Funding

This work was granted by National Key Research and Development Program of China (Grant No. 2022YFF0801803) and National Natural Science Foundation of China (No. 42161144008).

Data Availability Statement

The data that support the findings of this study are available from the corresponding author upon reasonable request.

Conflicts of Interest

The authors declare that they have no conflicts of interest.

References

  1. Jucker, T.; Fischer, F.J.; Chave, J.; Coomes, D.A.; Caspersen, J.; Ali, A.; Loubota Panzou, G.J.; Feldpausch, T.R.; Falster, D.; Usoltsev, V.A.; et al. Tallo: A global tree allometry and crown architecture database. Global. Change Biol. 2022, 28, 5254–5268. [Google Scholar] [CrossRef] [PubMed]
  2. Scheffer, M.; Vergnon, R.; Cornelissen, J.H.C.; Hantson, S.; Holmgren, M.; van Nes, E.H.; Xu, C. Why trees and shrubs but rarely trubs? Trends Ecol. Evol. 2014, 29, 433–434. [Google Scholar] [CrossRef] [PubMed]
  3. Vincent, G.; Harja, D. Exploring Ecological Significance of Tree Crown Plasticity through Three-dimensional Modelling. Ann. Bot. 2007, 101, 1221–1231. [Google Scholar] [CrossRef] [PubMed] [Green Version]
  4. Stovall, A.E.L.; Shugart, H.; Yang, X. Tree height explains mortality risk during an intense drought. Nat. Commun. 2019, 10, 4385. [Google Scholar] [CrossRef] [Green Version]
  5. Dai, J.; Liu, H.; Wang, Y.; Guo, Q.; Hu, T.; Quine, T.; Green, S.; Hartmann, H.; Xu, C.; Liu, X.; et al. Drought-modulated allometric patterns of trees in semi-arid forests. Commun. Biol. 2020, 3, 405. [Google Scholar] [CrossRef]
  6. Barrett, S.C.H. Influences of clonality on plant sexual reproduction. Proc. Natl. Acad. Sci. USA 2015, 112, 8859–8866. [Google Scholar] [CrossRef] [Green Version]
  7. Qiu, T.; Andrus, R.; Aravena, M.; Ascoli, D.; Bergeron, Y.; Berretti, R.; Berveiller, D.; Bogdziewicz, M.; Boivin, T.; Bonal, R.; et al. Limits to reproduction and seed size-number trade-offs that shape forest dominance and future recovery. Nat. Commun. 2022, 13, 2381. [Google Scholar] [CrossRef]
  8. Wenk, E.H.; Falster, D.S. Quantifying and understanding reproductive allocation schedules in plants. Ecol. Evol. 2015, 5, 5521–5538. [Google Scholar] [CrossRef] [Green Version]
  9. Xu, C.; Liu, H.; Zhou, M.; Xue, J.; Zhao, P.; Shi, L.; Shangguan, H. Enhanced sprout-regeneration offsets warming-induced forest mortality through shortening the generation time in semiarid birch forest. Forest Ecol. Manag. 2018, 409, 298–306. [Google Scholar] [CrossRef]
  10. Zeppel, M.J.B.; Harrison, S.P.; Adams, H.D.; Kelley, D.I.; Li, G.; Tissue, D.T.; Dawson, T.E.; Fensham, R.; Medlyn, B.E.; Palmer, A.; et al. Drought and resprouting plants. New Phytol. 2015, 206, 583–589. [Google Scholar] [CrossRef]
  11. Malanson, G.P.; Trabaud, L. Vigour of post-fire resprouting by Quercus coccifera L. J. Ecol. 1988, 76, 351–365. [Google Scholar] [CrossRef]
  12. Bellingham, P.J.; Sparrow, A.D. Resprouting as a life history strategy in woody plant communities. Oikos 2000, 89, 409–416. [Google Scholar] [CrossRef]
  13. Moles, A.T.; Ackerly, D.D.; Webb, C.O.; Tweddle, J.C.; Dickie, J.B.; Pitman, A.J.; Westoby, M. Factors that shape seed mass evolution. Proc. Natl. Acad. Sci. USA 2005, 102, 10540–10544. [Google Scholar] [CrossRef] [PubMed] [Green Version]
  14. Frank, D.; Reichstein, M.; Bahn, M.; Thonicke, K.; Frank, D.; Mahecha, M.D.; Smith, P.; Velde, M.; Vicca, S.; Babst, F.; et al. Effects of climate extremes on the terrestrial carbon cycle: Concepts, processes and potential future impacts. Global. Chang. Biol. 2015, 21, 2861–2880. [Google Scholar] [CrossRef] [PubMed] [Green Version]
  15. Lauder, J.D.; Moran, E.V.; Hart, S.C. Fight or flight? Potential tradeoffs between drought defense and reproduction in conifers. Tree Physiol. 2019, 39, 1071–1085. [Google Scholar] [CrossRef] [PubMed]
  16. Genet, H.; Breda, N.; Dufrene, E. Age-related variation in carbon allocation at tree and stand scales in beech (Fagus sylvatica L.) and sessile oak (Quercus petraea (Matt.) Liebl.) using a chronosequence approach. Tree Physiol. 2010, 30, 177–192. [Google Scholar] [CrossRef]
  17. Green, J.K.; Keenan, T.F. The limits of forest carbon sequestration. Science 2022, 376, 692–693. [Google Scholar] [CrossRef]
  18. Long, R.W.; Dudley, T.L.; D’Antonio, C.M.; Grady, K.C.; Bush, S.E.; Hultine, K.R. Spenders versus savers: Climate-induced carbon allocation trade-offs in a recently introduced woody plant. Funct. Ecol. 2021, 35, 1640–1654. [Google Scholar] [CrossRef]
  19. Yin, X.H.; Hao, G.Y.; Sterck, F. A trade-off between growth and hydraulic resilience against freezing leads to divergent adaptations among temperate tree species. Funct. Ecol. 2022, 36, 739–750. [Google Scholar] [CrossRef]
  20. Wiley, E.; Casper, B.B.; Helliker, B.R. Recovery following defoliation involves shifts in allocation that favour storage and reproduction over radial growth in black oak. J. Ecol. 2017, 105, 412–424. [Google Scholar] [CrossRef]
  21. Jacquet, J.S.; Bosc, A.; O’Grady, A.; Jactel, H. Combined effects of defoliation and water stress on pine growth and non-structural carbohydrates. Tree Physiol. 2014, 34, 367–376. [Google Scholar] [CrossRef] [PubMed]
  22. Piper, F.I. Patterns of carbon storage in relation to shade tolerance in southern South American species. Am. J. Bot. 2015, 102, 1442–1452. [Google Scholar] [CrossRef] [PubMed] [Green Version]
  23. Maguire, A.J.; Kobe, R.K. Drought and shade deplete nonstructural carbohydrate reserves in seedlings of five temperate tree species. Ecol. Evol. 2015, 5, 5711–5721. [Google Scholar] [CrossRef] [PubMed]
  24. Ferrenberg, S.; Kane, J.M.; Langenhan, J.M. To grow or defend? Pine seedlings grow less but induce more defences when a key resource is limited. Tree Physiol. 2015, 35, 107–111. [Google Scholar] [CrossRef] [PubMed] [Green Version]
  25. Morgan, J.M. Osmoregulation and water-stress in higher-plants. Annu. Rev. Plant Physiol. Plant Mol. Biol. 1984, 35, 299–319. [Google Scholar] [CrossRef]
  26. Guo, J.S.; Gear, L.; Hultine, K.R.; Koch, G.W.; Ogle, K. Non-structural carbohydrate dynamics associated with antecedent stem water potential and air temperature in a dominant desert shrub. Plant Cell Environ. 2020, 43, 1467–1483. [Google Scholar] [CrossRef]
  27. Hartmann, H.; Trumbore, S. Understanding the roles of nonstructural carbohydrates in forest trees—From what we can measure to what we want to know. New Phytol. 2016, 211, 386–403. [Google Scholar] [CrossRef] [Green Version]
  28. Drake, P.L.; Mendham, D.S.; White, D.A.; Ogden, G.N. A comparison of growth, photosynthetic capacity and water stress in Eucalyptus globulus coppice regrowth and seedlings during early development. Tree Physiol. 2009, 29, 663–674. [Google Scholar] [CrossRef] [Green Version]
  29. He, W.; Liu, H.; Qi, Y.; Liu, F.; Zhu, X. Patterns in nonstructural carbohydrate contents at the tree organ level in response to drought duration. Global. Chang. Biol. 2020, 26, 3627–3638. [Google Scholar] [CrossRef]
  30. Hartmann, H.; Adams, H.D.; Hammond, W.M.; Hoch, G.; Landhäusser, S.M.; Wiley, E.; Zaehle, S. Identifying differences in carbohydrate dynamics of seedlings and mature trees to improve carbon allocation in models for trees and forests. Environ. Exp. Bot. 2018, 152, 7–18. [Google Scholar] [CrossRef]
  31. Xu, X.; Wang, Z.; Rahbek, C.; Sanders, N.J.; Fang, J. Geographical variation in the importance of water and energy for oak diversity. J. Biogeogr. 2016, 43, 279–288. [Google Scholar] [CrossRef]
  32. Dai, J.; Lu, S.; Qi, Y.; Liu, H. Tree-to-Shrub Shift Benefits the Survival of Quercus mongolica Fisch. ex Ledeb. at the Xeric Timberline. Forests 2022, 13, 244. [Google Scholar] [CrossRef]
  33. Zhu, Y.; Comita, L.S.; Hubbell, S.P.; Ma, K. Conspecific and phylogenetic density-dependent survival differs across life stages in a tropical forest. J. Ecol. 2015, 103, 957–966. [Google Scholar] [CrossRef]
  34. Schweingruber, F.H. Tree Rings: Basics and Applications of Dendrochronology; Springer Science & Business Media: Dordrecht, The Netherlands, 2012. [Google Scholar]
  35. Holmes, R.L. Computer-assisted quality control in tree-ring dating and measurement. Tree-Ring Bull. 1983, 43, 69–78. [Google Scholar]
  36. Monserud, R.A.; Sterba, H. A basal area increment model for individual trees growing in even-and uneven-aged forest stands in Austria. For. Ecol. Manag. 1996, 80, 57–80. [Google Scholar] [CrossRef]
  37. Li, M.H.; Hoch, G.; Körner, C. Spatial variability of mobile carbohydrates within Pinus cembra trees at the alpine treeline. Phyton 2001, 41, 203–213. [Google Scholar]
  38. Trevelyan, W.E.; Harrison, J.S. Studies on yeast metabolism. I. Fractionation and microdetermination of cell carbohydrates. Biochem. J. 1952, 50, 298–303. [Google Scholar] [CrossRef]
  39. Osaki, M.H.U.S.; Shinano, T.; Tadano, T. Redistribution of carbon and nitrogen compounds from the shoot to the harvesting organs during maturation in field crops. Soil Sci. Plant Nutr. 1991, 37, 117–128. [Google Scholar] [CrossRef]
  40. Quentin, A.G.; Pinkard, E.A.; Ryan, M.G.; Tissue, D.T.; Baggett, L.S.; Adams, H.D.; Maillard, P.; Marchand, J.; Landhäusser, S.M.; Lacointe, A.; et al. Non-structural carbohydrates in woody plants compared among laboratories. Tree Physiol. 2015, 35, 1146–1165. [Google Scholar] [CrossRef] [Green Version]
  41. Ashwell, G. Colorimetric analysis of sugars. In Methods in Enzymology; Academic Press: Cambridge, MA, USA, 1957; Volume 3, pp. 73–105. [Google Scholar]
  42. Niinemets, Ü. Responses of forest trees to single and multiple environmental stresses from seedlings to mature plants: Past stress history, stress interactions, tolerance and acclimation. Forest Ecol. Manag. 2010, 260, 1623–1639. [Google Scholar] [CrossRef]
  43. Wiley, E.; Helliker, B. A re-evaluation of carbon storage in trees lends greater support for carbon limitation to growth. N. Phytol. 2012, 195, 285–289. [Google Scholar] [CrossRef] [PubMed]
  44. Vesk, P.A. Plant size and resprouting ability: Trading tolerance and avoidance of damage? J. Ecol. 2006, 94, 1027–1034. [Google Scholar] [CrossRef]
  45. Weber, R.; Schwendener, A.; Schmid, S.; Lambert, S.; Wiley, E.; Landhausser, S.M.; Hartmann, H.; Hoch, G. Living on next to nothing: Tree seedlings can survive weeks with very low carbohydrate concentrations. New Phytol. 2018, 218, 107–118. [Google Scholar] [CrossRef] [Green Version]
  46. Hoch, G.; Richter, A.; Körner, C. Non-structural carbon compounds in temperate forest trees. Plant Cell Environ. 2003, 26, 1067–1081. [Google Scholar] [CrossRef]
  47. Sala, A.; Hoch, G. Height-related growth declines in ponderosa pine are not due to carbon limitation. Plant Cell Environ. 2009, 32, 22–30. [Google Scholar] [CrossRef] [PubMed]
  48. Martin, A.R.; Thomas, S.C. Size-dependent changes in leaf and wood chemical traits in two Caribbean rainforest trees. Tree Physiol. 2013, 33, 1338–1353. [Google Scholar] [CrossRef] [Green Version]
  49. Qiu, T.; Sharma, S.; Woodall, C.W.; Clark, J.S. Niche Shifts From Trees to Fecundity to Recruitment That Determine Species Response to Climate Change. Front. Ecol. Evol. 2021, 9, 719141. [Google Scholar] [CrossRef]
  50. Bowen, B.J.; Pate, J.S. The Significance of Root Starch in Post-fire Shoot Recovery of the Resprouter Stirlingia latifolia R. Br. (Proteaceae). Ann. Bot. 1993, 72, 7–16. [Google Scholar] [CrossRef]
  51. Tixier, A.; Guzmán-Delgado, P.; Sperling, O.; Amico Roxas, A.; Laca, E.; Zwieniecki, M.A. Comparison of phenological traits, growth patterns, and seasonal dynamics of non-structural carbohydrate in Mediterranean tree crop species. Sci. Rep. 2020, 10, 347. [Google Scholar] [CrossRef] [Green Version]
  52. Gilson, A.; Barthes, L.; Delpierre, N.; Dufrene, E.; Fresneau, C.; Bazot, S. Seasonal changes in carbon and nitrogen compound concentrations in a Quercus petraea chronosequence. Tree Physiol. 2014, 34, 716–729. [Google Scholar] [CrossRef]
Figure 1. Sprout regeneration sapling and seedling. (a), The lateral roots of sapling are connected to the parent tree. (b), The roots of the seedling are much older than the seedling itself.
Forests 13 01745 g001
Figure 2. Carbon allocation reflected in growth and reproduction. (a), Box plots show the resprout number of different growth form has significant difference (***, p < 0.001). (b), Interannual variation in the basal area increment (BAI) of Q. mongolica. Shaded areas are the variations in BAI of average BAI standard variation. (c), Box plots show multi-year average BAI of two growth forms have no significant difference (p > 0.05). (d), BAI coefficients of variations have no significant difference between the two growth forms (p > 0.05). The coefficient of variation (C.V) is calculated as the ratio of the BAI standard deviation to the mean.
Forests 13 01745 g002
Figure 3. Effects of the interaction between life stages and organs on NSC concentration. (a), Soluble sugar concentration for tree form. (b), Soluble sugar concentration for shrub form. (c), Starch concentration for tree form. (d), Starch concentration for shrub form. Different lowercase letters indicate significant differences between life stages in the same organ (p < 0.05).
Forests 13 01745 g003
Figure 4. Effects of growth form on NSC concentration in seedlings. Changes of (a), soluble sugar, (b), starch and (c), TNC concentration of each organ. Asterisks indicate that MANOVA shows significant differences between different growth form trees (*, p < 0.05).
Forests 13 01745 g004
Figure 5. Effects of growth form on NSC concentration in saplings. Changes of (a), soluble sugar, (b), starch and (c), TNC concentration of each organ. Asterisks indicate that MANOVA shows significant differences between the two growth forms (*, p < 0.05).
Forests 13 01745 g005
Figure 6. Effects of growth form on NSC concentration in adult trees/shrubs. Changes of (a), soluble sugar, (b), starch and (c), TNC concentration of each organ. MANOVA shows significant differences between the two growth forms (*, p < 0.05).
Forests 13 01745 g006
Table 1. Sample plot overview. Diameter at breast height (DBH), tree height, and adult tree age of Quercus mongolica Fisch. ex Ledeb. are shown at different growth stages (seedling, sapling, adult trees) of different growth forms.
Growth FormSeedlingSaplingAdult Tree/Shrub
Height (m)Seedlings from Seed GerminationHeight (m)DBH (cm)Height (m)DBH (cm)Age (Year)
Tree0.14 ± 0.06 a33.3%3.10 ± 2.25 a5.60 ± 2.49 a7.21 ± 1.81 a11.65 ± 1.32 a33.8 ± 16.6 a
Shrub0.16 ± 0.08 a02.41 ± 1.55 b5.13 ± 2.90 a4.26 ± 1.23 b11.33 ± 2.13 a48.1 ± 12.7 a
Different lowercase letters indicate significant differences between growth forms (p < 0.05).
Table 2. Results of mixed linear models for factors affecting NSC concentration. The NSC concentration was used as the dependent variable, life stage, growth form, and organ. Their interactions were used as fixed factors, and different individuals were used as random factors.
Fixed FactorsSoluble SugarStarchTNC
Growth form37.7754 ***7.9883 **27.0347 ***
Life stage5.1772 *1.00880.0049
Organ12.2682 ***13.7526 ***14.6334 ***
Growth form × Life stage2.31923.4001 *3.9453 *
Growth form × Organ5.9409 **4.9803 **6.7068 ***
Values indicate the F values, and stars indicate the significance level (*, p < 0.05; **, p < 0.01; ***, p < 0.001).
Table 3. Mixed linear model results of tree and shrub growth forms for factors affecting NSC concentration. In each growth form, the NSC concentration was used as the dependent variable, life stage, and organs were used as fixed factors. Different individuals were used as random factors.
Fixed
Factors
Tree FormShrub Form
Soluble SugarStarchTNCSoluble SugarStarchTNC
Life stage5.00 *1.074.003.1719.01 ***12.65 **
Organ12.83 ***10.85 ***13.17 ***10.67 ***7.55 ***8.21 ***
Values indicate the F values, and stars indicate the significance level (*, p < 0.05; **, p < 0.01; ***, p < 0.001).
Table 4. Results for mixed linear models of NSC storage between different life stages. In each life stage, the NSC concentration was used as the dependent variable, growth forms, organs. Their interactions were used as fixed factors, and different individuals were used as random factors.
Fixed FactorsSeedlingSaplingAdult Tree
Soluble SugarStarchTNCSoluble SugarStarchTNCSoluble SugarStarchTNC
Growth form16.53 **32.10 **42.17 **5.301.752.6012.38 **0.112.62
Organ3.93 *9.14 **7.04 **9.00 ***1.812.83 *6.07 ***7.81 ***9.48 ***
Growth form × Organ2.303.63 *3.17 *6.22 **7.05 ***6.55 ***1.840.410.71
Values indicate the F values, and stars indicate the significance level (*, p < 0.05; **, p < 0.01; ***, p < 0.001).
Publisher’s Note: MDPI stays neutral with regard to jurisdictional claims in published maps and institutional affiliations.

