Article

Evaluation of Softwood Timber Quality—A Case Study on Two Silvicultural Systems in Central Germany

1
Spatial Structures and Digitization of Forests, Faculty of Forest Sciences, University of Göttingen, Büsgenweg 1, 37077 Göttingen, Germany
2
Fraunhofer Institute for Wood Research, Wilhelm-Klauditz-Institut (WKI), Bienroder Weg 54E, 38108 Braunschweig, Germany
3
Silviculture and Forest Ecology of the Temperate Zones, Faculty of Forest Sciences, University of Göttingen, Büsgenweg 1, 37077 Göttingen, Germany
4
Faculty of Resource Management, University of Applied Sciences and Art Hildesheim/Holzminden/Göttingen, Büsgenweg 1a, 37077 Göttingen, Germany
*
Author to whom correspondence should be addressed.
Submission received: 27 September 2022 / Revised: 4 November 2022 / Accepted: 11 November 2022 / Published: 14 November 2022

Abstract

:
Norway spruce (Picea abies (L.) H.Karst) trees planted with high stem densities produce finely branched, solid logs but are vulnerable to extreme weather events, e.g., storms. Over the last decades spruce stands have been planted at lower stand densities, resulting in wider crowns, lower crown bases, and higher stand stability, but this might decrease the quality of coniferous timber due to an increased growing rate and wider annual rings. Therefore, in this case study we investigated the influence of different silvicultural treatments and stand densities on tree morphology and wood properties of 100 spruce trees up to sawn timber as the final product. Tree morphology was assessed using mobile laser scanning. Ring width analysis, wood density measurements, and the four-point bending strength test on visually graded boards were conducted to gain information on wood properties and product quality. In stands thinned from below, higher wood densities were observed due to smaller annual rings compared to stands that were thinned from above at equal annual ring widths. In addition, crown asymmetry and the height-to-diameter ratio were identified as proxies for wood density. Lastly, visually assessed quality differences between the forest stands were discerned on the examined boards.

1. Introduction

In response to climate change, the Earth’s average surface temperature is rising, precipitation patterns are changing, and the probability of severe meteorological events is increasing [1]. Consequently, recent storms, droughts, and heat events in central Europe have led to direct and significant losses in forest stands and large diebacks [2,3]. In Germany, pure stands of Norway spruce (Picea abies (L.) H.Karst) are highly susceptible to such risks, as spruce has been extensively planted far beyond its natural range of distribution [4,5]. In order to reduce the risk of stand losses and to increase stand stability, pure spruce stands are thus being converted into mixed stands [6,7] or forest management has been adapted and stand densities have been adjusted [8]. This adaptation of forest management has been carried out over the years. In this regard, the number of plants per hectare has been reduced in order to improve individual tree stability within pure spruce stands in the face of more frequent and more severe weather extremes [8].
While trees in less dense stands are more stable due to a wider crown radius, a lower crown base height (CBH), and an increased radial growth, wood quality has declined in stands with greater tree spacing [9]. The silvicultural treatment applied in this process is thinning from above (TFA) with the aim of creating a layered and more or less even aged stand [10]. By TFA, the dominant trees are promoted by removing neighboring dominant or co-dominant trees of lower quality and/or vitality [10].
Norway spruce has formerly been cultivated in pure stands at high stand densities [11], focusing on the production of large amounts of timber with rather homogeneous dimensions and properties [5]. The silvicultural treatment used in this process is thinning from below (TFB), with the aim of establishing an even-aged and single-layered stand in order to support the best dominating trees [10]. At the same time, higher height-to-diameter ratios (h/d ratio) resulting from higher stand densities have been shown to decrease stand stability [8].
Therefore, forest management has been adapted and focused on reducing the number of plants per hectare over the years in order to improve the stability of Norway spruce stands. Since trees planted in lower stand densities grow faster, larger annual rings are formed. Conversely, this means that the proportion of latewood, which is decisive for wood density, decreases [12,13,14]. Wood density, in turn, is one of the most important parameters influencing the strength properties and thus the usability of wood as construction material and for wood products. The elastic and strength properties, hardness, abrasion resistance, as well as thermal conductivity, also decrease with decreasing wood density [14]. As a result, the quality of coniferous timber is deteriorating and there are already large areas of coniferous trees whose timber no longer meets the strength grading requirements for structural application (e.g., European grading standard: DIN 4074-1;2012-06 and DIN EN 338:2016, [15,16]).
The harmonized European standard EN 14081 [17] regulates the requirements for sawn timber for structural applications. Next to mechanical grading with optical sensors, visual grading is a fast and easy system but depends on human perception. The basis for visual assessment on the German timber market is provided by DIN 4074 [15]. The resulting property profile divides sawn timber into the visual grading classes S7, S10, and S13 of increasing quality. The visual properties provide a simple prediction model for the mechanical properties. Other studies have tried to advance the non-destructive quality assessment of timber in varying ways. Hu et al. [18] have modelled the local module of elasticity (MoE) of sawn timber as a dependent variable of fiber orientation measured by optical sensors and processed in a finite element model. Different endeavors have been made to predict the timber quality of standing trees, mostly focusing on tree age, tree spacing [19], or pruning [20]. For works not focusing on silvicultural parameters, quality estimation has been done via acoustic and resonance techniques [21], which employ the linear relationship between impulse velocity across a tree section and the static MoE. This technique corresponds to state-of-the-art devices in the sawing industry, which are used to estimate the wood density of sawn timber. Nevertheless, distortions due to strongly varying wood moisture impact the results and can only be addressed by correction factors. Non-destructive evaluation approaches have also found application in heretical analysis as possible selection methods for tree breeding programs to promote wood quality [22,23]. A controlled thinning experiment was done for Black pine (Pinus nigra J.F. Arnold) with a measurement of the dynamic velocity eleven years later to measure the effect of different thinning intensities by Russo et al. [24].
One of the objectives of this case study is to identify the influence of the two different silvicultural management practices (TFA and TFB) and thus the effects of different tree morphologies on the mechanical strength of timber. When addressing the morphology of a tree and its relationship with internal timber quality, the interactions with neighboring trees are essential. Competition from neighboring trees not only affects nutrient and light availability but also space occupation and growth behavior [17].
Conventionally, the parameters describing tree morphology and timber quality were assessed manually and required considerable time and personnel resources. Terrestrial laser scanning (TLS) has been shown to be a precise tool for automatically estimating these parameters from terrestrial point cloud data in forests [18,19]. However, the application of TLS can also be quite laborious if a multiple scan approach is used to acquire each study tree from several directions [20]. In addition, post-processing of the scans (co-registration and filtering) requires a considerable amount of time. Alternatively, mobile laser scanning (MLS) with simultaneous localization and mapping (SLAM) can be performed. Studies have shown that while point cloud density is lower with MLS compared to TLS, the advantages in terms of time efficiency, sample size, and labor costs can outweigh the disadvantages [21]. Using a hand-held mobile laser scanner, forest structure, tree parameters such as diameter at breast height (DBH), tree height, or biomass, as well as tree morphology such as crown shape or branchiness can be easily assessed [22,23]. Morphological tree properties, together with the grading criteria of the visual method according to EN 4074 [15] were therefore used as a central part of the comparative analysis of the investigated study sites.
Overall, the objectives of this case study were, first (i), to investigate the relationship between tree morphology and strength properties of differently managed spruce trees: these effects were monitored all the way to the final product (sawn boards). In this context, second (ii), the well-known relationships between annual ring width and wood density (for coniferous species, e.g., [12,24,25]) of differently managed spruce trees were also investigated. Third (iii), the relationship to mechanical properties was examined to provide possible suggestions for future silvicultural decisions regarding the establishment of mixed forests and the reforestation of calamity areas.

2. Materials and Methods

2.1. Study Sites and Study Objects

This case study was conducted in pure Norway spruce stands of the forest districts Breidenbacher Grund (forest office Biedenkopf, Hessen-Forst, Hesse, Germany; 50°52′31.39″ N 8°23′1.33″ E and 50°52′39.69″ N 8°23′25.71″ E) and Lilienberg (forest office Riefensbeek, Niedersächsische Landesforsten, Lower Saxony, Germany; 51°43′01.0” N 10°25′00.3” E, 51°43′03.7″ N 10°25′16.9″ E, and 51°42′13.9″ N 10°25′18.4″ E). In the forest district Breidenbacher Grund, two study sites were selected; in the forest district Lilienberg, three study sites were selected. The total of five study sites (P2–P6 with P = plot) consisted of stands of different ages (~40 and ~80 years). The sites were treated by different silvicultural management concepts: (i) TFA or (ii) TFB (see Table 1). In each stand, we selected 20 dominant to co-dominant Norway spruce sample trees (tree classes 1–3 according to Kraft [26]), resulting in a total of 100 study trees. The selection was done in cooperation with local district foresters following the procedure for a standard commercial harvesting operation, in which three future crop trees were also included. This case study is not intended to examine the influence of the current silvicultural treatment. Rather, it is aimed to investigate the influence of the previous silvicultural treatment up to the time of harvest. Detailed stand information and description of site condition can be found in Table 1.
The sample trees were harvested in September 2019 (Biedenkopf, P2 and P3), November 2019 (Riefensbeek, P4), and March 2020 (Riefensbeek, P5 and P6). Prior to harvesting, all 100 sample trees were scanned using a mobile laser scanner (ZEB horizon, GeoSLAM Ltd., Nottingham, United Kingdom) to receive quantitative in-situ information on external quality features and tree morphology (e.g., crown asymmetry, branchiness) but also to acquire tree measures like DBH and height. Carrying the hand-held mobile laser scanner, each sample tree was surrounded twice in concentric circles (see Figure 1) and with normal walking speed (approximately 3–4 km*h−1). First, with a small circle close to the sample tree followed by a wider and larger circle to capture the tree from all possible directions. For each plot, two scans were performed including ten sample trees each. Subsequently, the DBH as well as the direction to geographical north was tagged on each tree for later stem disc sampling. Then, all sample trees were harvested motor-manually and cut into log sections of 2.70 m length. For the investigation of annual ring widths, stem discs were taken at 1.30 m above the ground (DBH) and at CBH (crown base height, defined as the height of the first needle-bearing branch).

2.1.1. Annual Ring Analysis

In order to reduce internal stress of the stem discs and to minimize cracking during drying, the stem discs were sawn into so-called ‘measuring crosses’ with four radii oriented by geographic direction (see Figure S1, supplementary material). After drying from forest-fresh to forest-dry, the tops of the measuring crosses were sanded with a belt sander to improve the visibility of the individual annual rings. Subsequently, the annual ring widths of all four geographic directions were measured with the LINTAB TM 6 annual ring measuring device from Rinntech (Rinntech-Metriwerk GmbH & Co. KG, Heidelberg, Germany). The annual ring analysis was conducted from bark to pith and started directly at the latewood border of 2019. Simultaneously, the data were transferred to the software TSAP WIN TM (Version 4.81, Rinntech, Rinntech-Metriwerk GmbH & Co. KG, Heidelberg, Germany), which automatically assigned the respective absolute annual ring width to the calendar year. For the data analysis, the mean ring width was calculated using the measurements of all four cardinal geographic directions (north, east, south, west). This way, ring width was determined without any confounding effects of non-circularity that would introduce bias as in the case of simply dividing stem radius by the number of tree rings (years of age). Additionally, it was also used to check whether slope or reaction wood had an effect by testing for significant differences in mean annual ring width of the four different geographic directions.

2.1.2. Wood Density

The wood density was assessed on samples (oven dry weight, 103 °C ± 2 °C; [29]) with a maximum dimension of 50 mm × 50 mm × 150 mm (length of the samples was dependent on stem disc radius: see Figure S2, supplementary material) by radiometric density profile determination [14]. The radiometric density profile was generated using a ‘Density Analyzer X-ray’ (DAX 6000, Fagus-GreCon Greten GmbH & Co. KG, Alfeld, Germany) in cooperation with the Fraunhofer Institute for Wood Research (Wilhelm-Klauditz-Institut WKI, Braunschweig, Germany). The annual rings of the samples had to be as parallel to the edges as possible and the samples had to start and end with complete annual rings. In addition, the east–west axis was initially cut along the edge of the north–south axis. This left the north–south axis as one complete piece which was divided at the pith. Samples longer than 150 mm were cut in half. The density was determined in 20 μm sections in the direction from the pith to the bark at a rate of 1 mm/s, from which the mean density was subsequently calculated.

2.1.3. Visual Timber Grading and Four-Point Bending Strength

The harvested log sections above 1.3 m with 2.70 m length were sawn into boards with the dimensions 13 cm × 3 cm × 210 cm. The logs were plain sawn into smaller diameters to maximize the yield. Logs with diameters larger than 30 cm were halved and cant (cant = completely edged piece of wood) sawn, resulting in flat grained and angled boards. The heart center was cut out every time. The boards were dried in a climate chamber under controlled conditions, starting at 40 °C and gradually increasing to 60 °C while simultaneously lowering the relative humidity from 75% to 55% and including a relaxation phase with raised humidity and lower temperature for 24 h. The wood moisture content after drying was 11% ± 2%. Once dried, the sawn boards were planed to 12 cm × 2 cm × 210 cm to ensure even dimensions and smooth surfaces. The specimen size was not in accordance with the ideal length to height ratio described in standard EN 408 [30], due to limitations in maximum span width of available test equipment, but it was within the range for mathematical adjustment. This was followed by a visual sorting according to DIN 4074-1 [15] to allocate the 696 examined boards into visual grading classes (S7, S10, and S13). Sawn timber that negatively exceeded one of the visual grading criteria thresholds was labeled as rejected. The four-point bending strength was assessed in accordance with EN 408 in an edgewise bending test [30] for a sample of 110 boards. The bending test of EN 408 [30] was chosen as a central evaluation instrument because the module of rupture (MoR), module of elasticity (MoE), and wood density can be employed to calculate the remaining mechanical properties, e.g., tensile, compression, and shear strength, in EN 384. The bending strength was therefore deemed to be a sufficient quality indicator. The test setup was a four-point-on-edge bending test, with the outer support bearings 15 h (height) apart due to limitations of the employed support beams’ span width. The force was applied symmetrically with bearings 6 h apart. Testing speed was adjusted to 0.36 mm/s to ensure material failure within 300 ± 120 s. Bending strength (fm) and elasticity (Em,g) were calculated from F max according to standard EN 408 [30] using the following formulae:
f m   =   3 × F × a b × h 2
    E   m ,   g   = 3 × a × l 2     4 × a 3 2 × b × h 3 × 2 × w 2 w 1 F 2 F 1     6 × a 5 × G × b × h
F = force [N]; a = distance between load site and bearing [mm]; b = length of smaller cross-section-edge; h = sample height or broader cross-section-edge; l = distance between bearings [mm]; F1 measured at point of linear load increase; F2 measured at 20% of maximum load; wx = deformation of sample [mm] at Fx; G = modulus of shear, which is set at infinite when grading into strength classes of EN 338 [16].

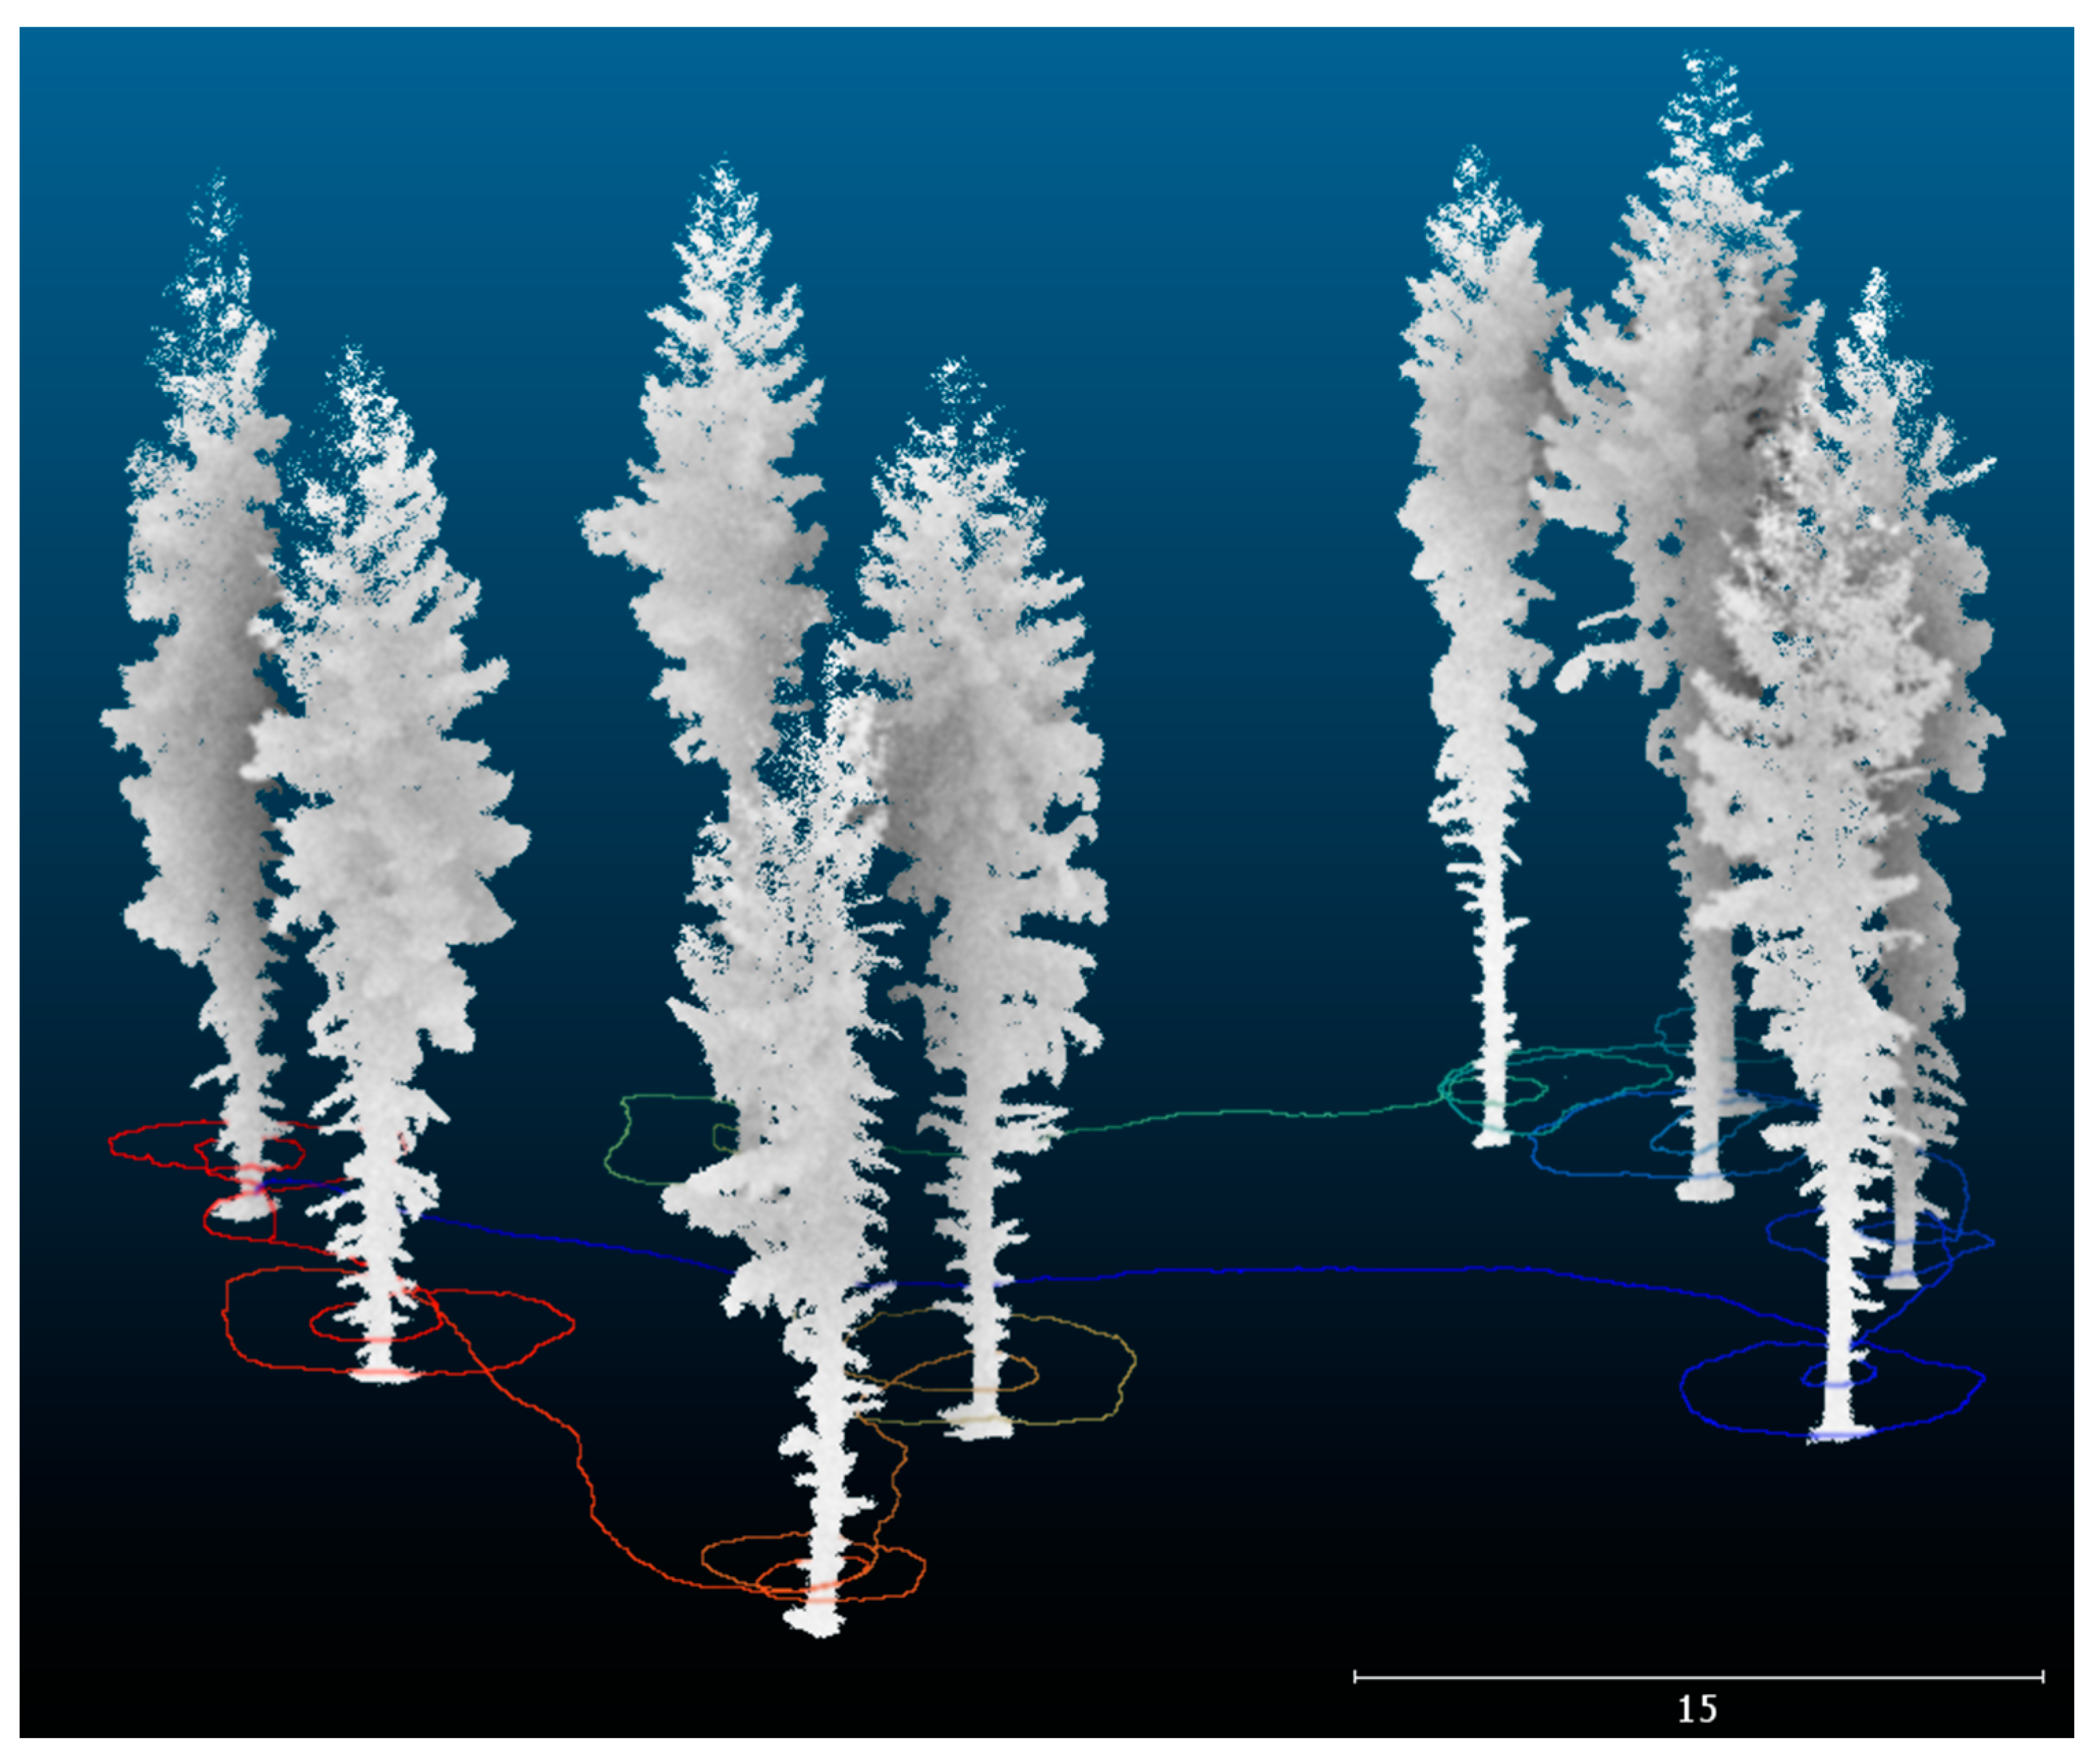
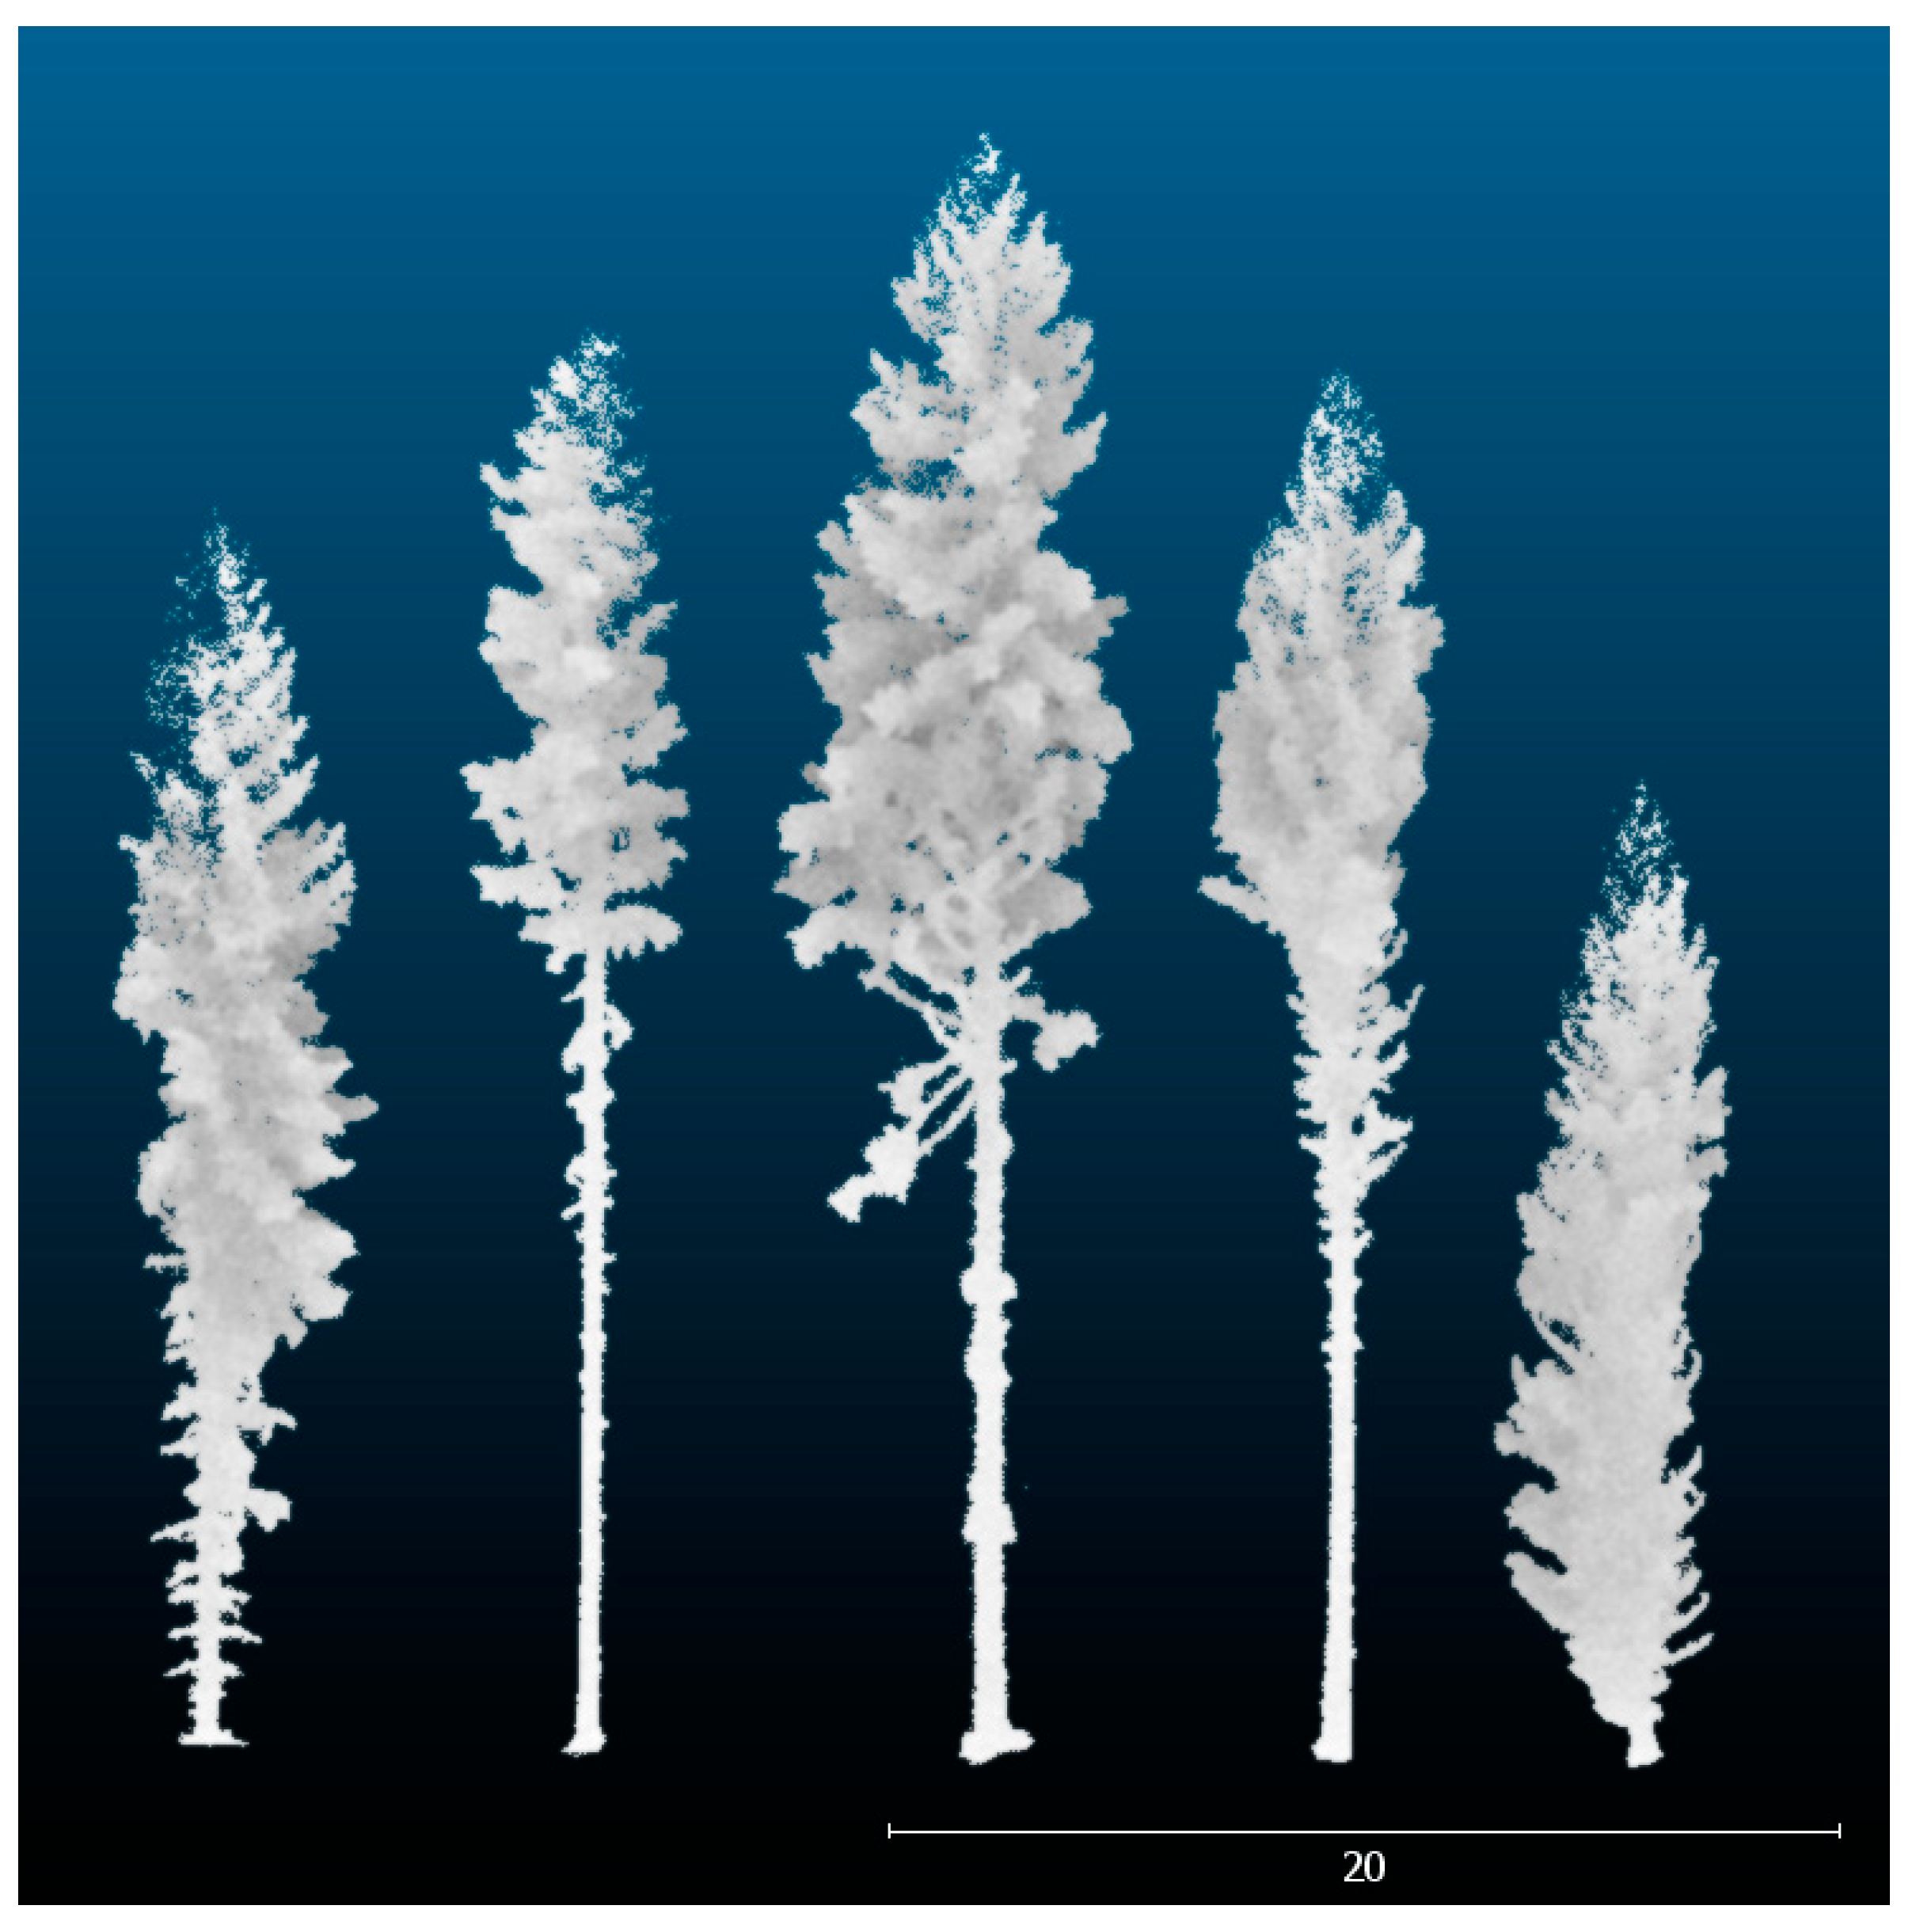
2.1.4. Point Cloud Processing

The acquired three-dimensional point clouds from the three-dimensional laser scanning were automatically processed and exported as LAZ files using the point cloud processing platform GeoSlam Hub 6.0.1 (GeoSlam Ltd., Nottingham, UK). Subsequently, the processed point clouds were imported to the open source software ‘CloudCompare’ (Version 2.10.2 ‘Zephyrus’; http://www.danielgm.net, last accessed on 13 November 2022) in order to manually extract the sample trees from the scanned forest scenes (see Figure 2). Using Mathematica Software (Version 12, Wolfram Research, Champaign, USA), we selected the lowermost 12 m of the logs for further analysis. This was done for three reasons: First, stem sections of equal length should be compared. Second, this lower part of the tree is the most valuable part in terms of timber production and, finally, the quality of the point cloud is highest for those parts of the tree that are located closer to the scanner during scanning, which is naturally the lower stem area.
Next, the free software CompuTree (Version 4, [31]) was used to derive several parameters for each stem after transforming the point cloud into a cylinder model (quantitative structure model; abbr. QSM). A QSM represents the whole tree based on cylinders of varying lengths and diameters that were fit to the point cloud based on statistical approaches. The branch orders are persevered during the cylinder-fitting process. Details on the QSM approach can be found in Piboule et al. [31]. First, the volume of the stem, from the bottom to the end of the 12 m long section, was determined by summing up the volumes of all cylinders denoted ‘stem’ in the output of the CompuTree software [31]. In addition, we considered the merchantable volume of the log section separately, by summing up only the volume of cylinders with a diameter larger than 7 cm. Furthermore, the number of first order branches as well as the number of branches greater 4 cm [32] were counted. In addition, the following morphological properties of the study trees were derived: crown asymmetry, CBH, crown length, crown radius, crown surface area, crown volume, DBH, total tree height, and lean; lastly, the h/d ratio was calculated [18,20,33,34,35].

2.2. Statistical Analysis

All statistical analyses were performed using the free and open source software R (version 4.1.0, [36]) and OriginPro (version 2021b, [37]) with a significance level of p < 0.05.
The Kolmogorov–Smirnov test for sample sizes with n > 50 was applied to test for normal distribution of the data and Levene’s test was used to test for variance homogeneity. For the smaller sample sizes of sawn timber boards and their visual and mechanical properties, the Shapiro–Wilk test was used in combination with Levene’s test to discern normality and variance homogeneity. Kruskal–Wallis and subsequent post-hoc Kruskal–Dunn test (with Bonferroni correction) were performed to test for differences in mean density and mean ring width between the investigated plots. Should the Levene’s test suggest variance inhomogeneity, a Games–Howell test was conducted, as a multigroup form of the Welch test, to discern significant groupings, as can be seen in the results for elasticity after mechanical testing of sample boards. For parametric data, Pearson’s correlation coefficient was used to indicate significant correlations, e.g., between the mechanical MoR and the visual criteria single knot and knot cluster, fiber angle, and growth ring width. Spearman’s rank correlation coefficient (range: −1 to +1) was calculated and tested for significant relationships between the response variable (y) mean density and the explanatory variable (x) mean ring width at two different heights of the stem (DBH and CBH). Since both mean ring width and mean density at DBH were highly correlated with mean ring width and mean density at CBH, it was decided to use mean ring width and mean density at CBH as some stem discs from DBH were not available for either ring width measurement or density sampling due to stem rot. Spearman’s rank correlation coefficient was also calculated and tested for significant relationships between (y) mean density and (x) the tree morphology was assessed using MLS (e.g., crown asymmetry, crown radius, lean, h/d ratio). Only properties that were significantly correlated with mean density were used for further investigations. To further describe the mechanical results of MoR for the different plots, which were proven to be parametric by the aforementioned statistical tests, a one-way ANOVA was conducted to reveal distinct groupings in the resulting properties of on-edge bending strength tests.
To investigate the relationship between mean density and mean ring width linear mixed-effect models (package lme4; [38]) were calculated with silvicultural treatment and age as fixed effects and site condition (=plot) as random effect (with random intercept) to account for the hierarchical structure of the data and to control for differences in mean density among the five investigated plots. The authors are aware of the problem and limitation of the case study with only one silvicultural treatment carried out per site condition. In order to counteract confounding of the factors, two silvicultural different treated plots per site condition should have been investigated. Due to a lack of spruce study sites caused by calamities, this experimental setup was impossible to conduct. Since the interaction between mean ring width and silvicultural treatment was not significant it was assumed that slopes were not significantly different. Therefore, a random intercept model was used. Furthermore, linear regression models were used to describe the relationship between the wood property mean density and the morphological tree properties crown asymmetry, h/d ratio, and DBH (the only properties that significantly correlated with mean density).
For the visual quality grading, a total of 760 spruce boards were sawn and assigned to the grading classes specified by DIN 4074-1 [15]. The higher the quality class, the more demanding the requirements. Thus, the value ranges of the different grading criteria become smaller and their share of the response surface model for MoR decreases. For each grading class, a random sample was selected according to its proportion of the experimental setup, so that a total amount of 130 boards was mechanically tested based on their visual properties, grading class, and stand origin. The number of mechanically tested boards was reduced compared to the total amount of available boards due to the costs of processing and the need for an adequate sample size in additional experiments with glue-laminated timber in further studies of the project.

3. Results

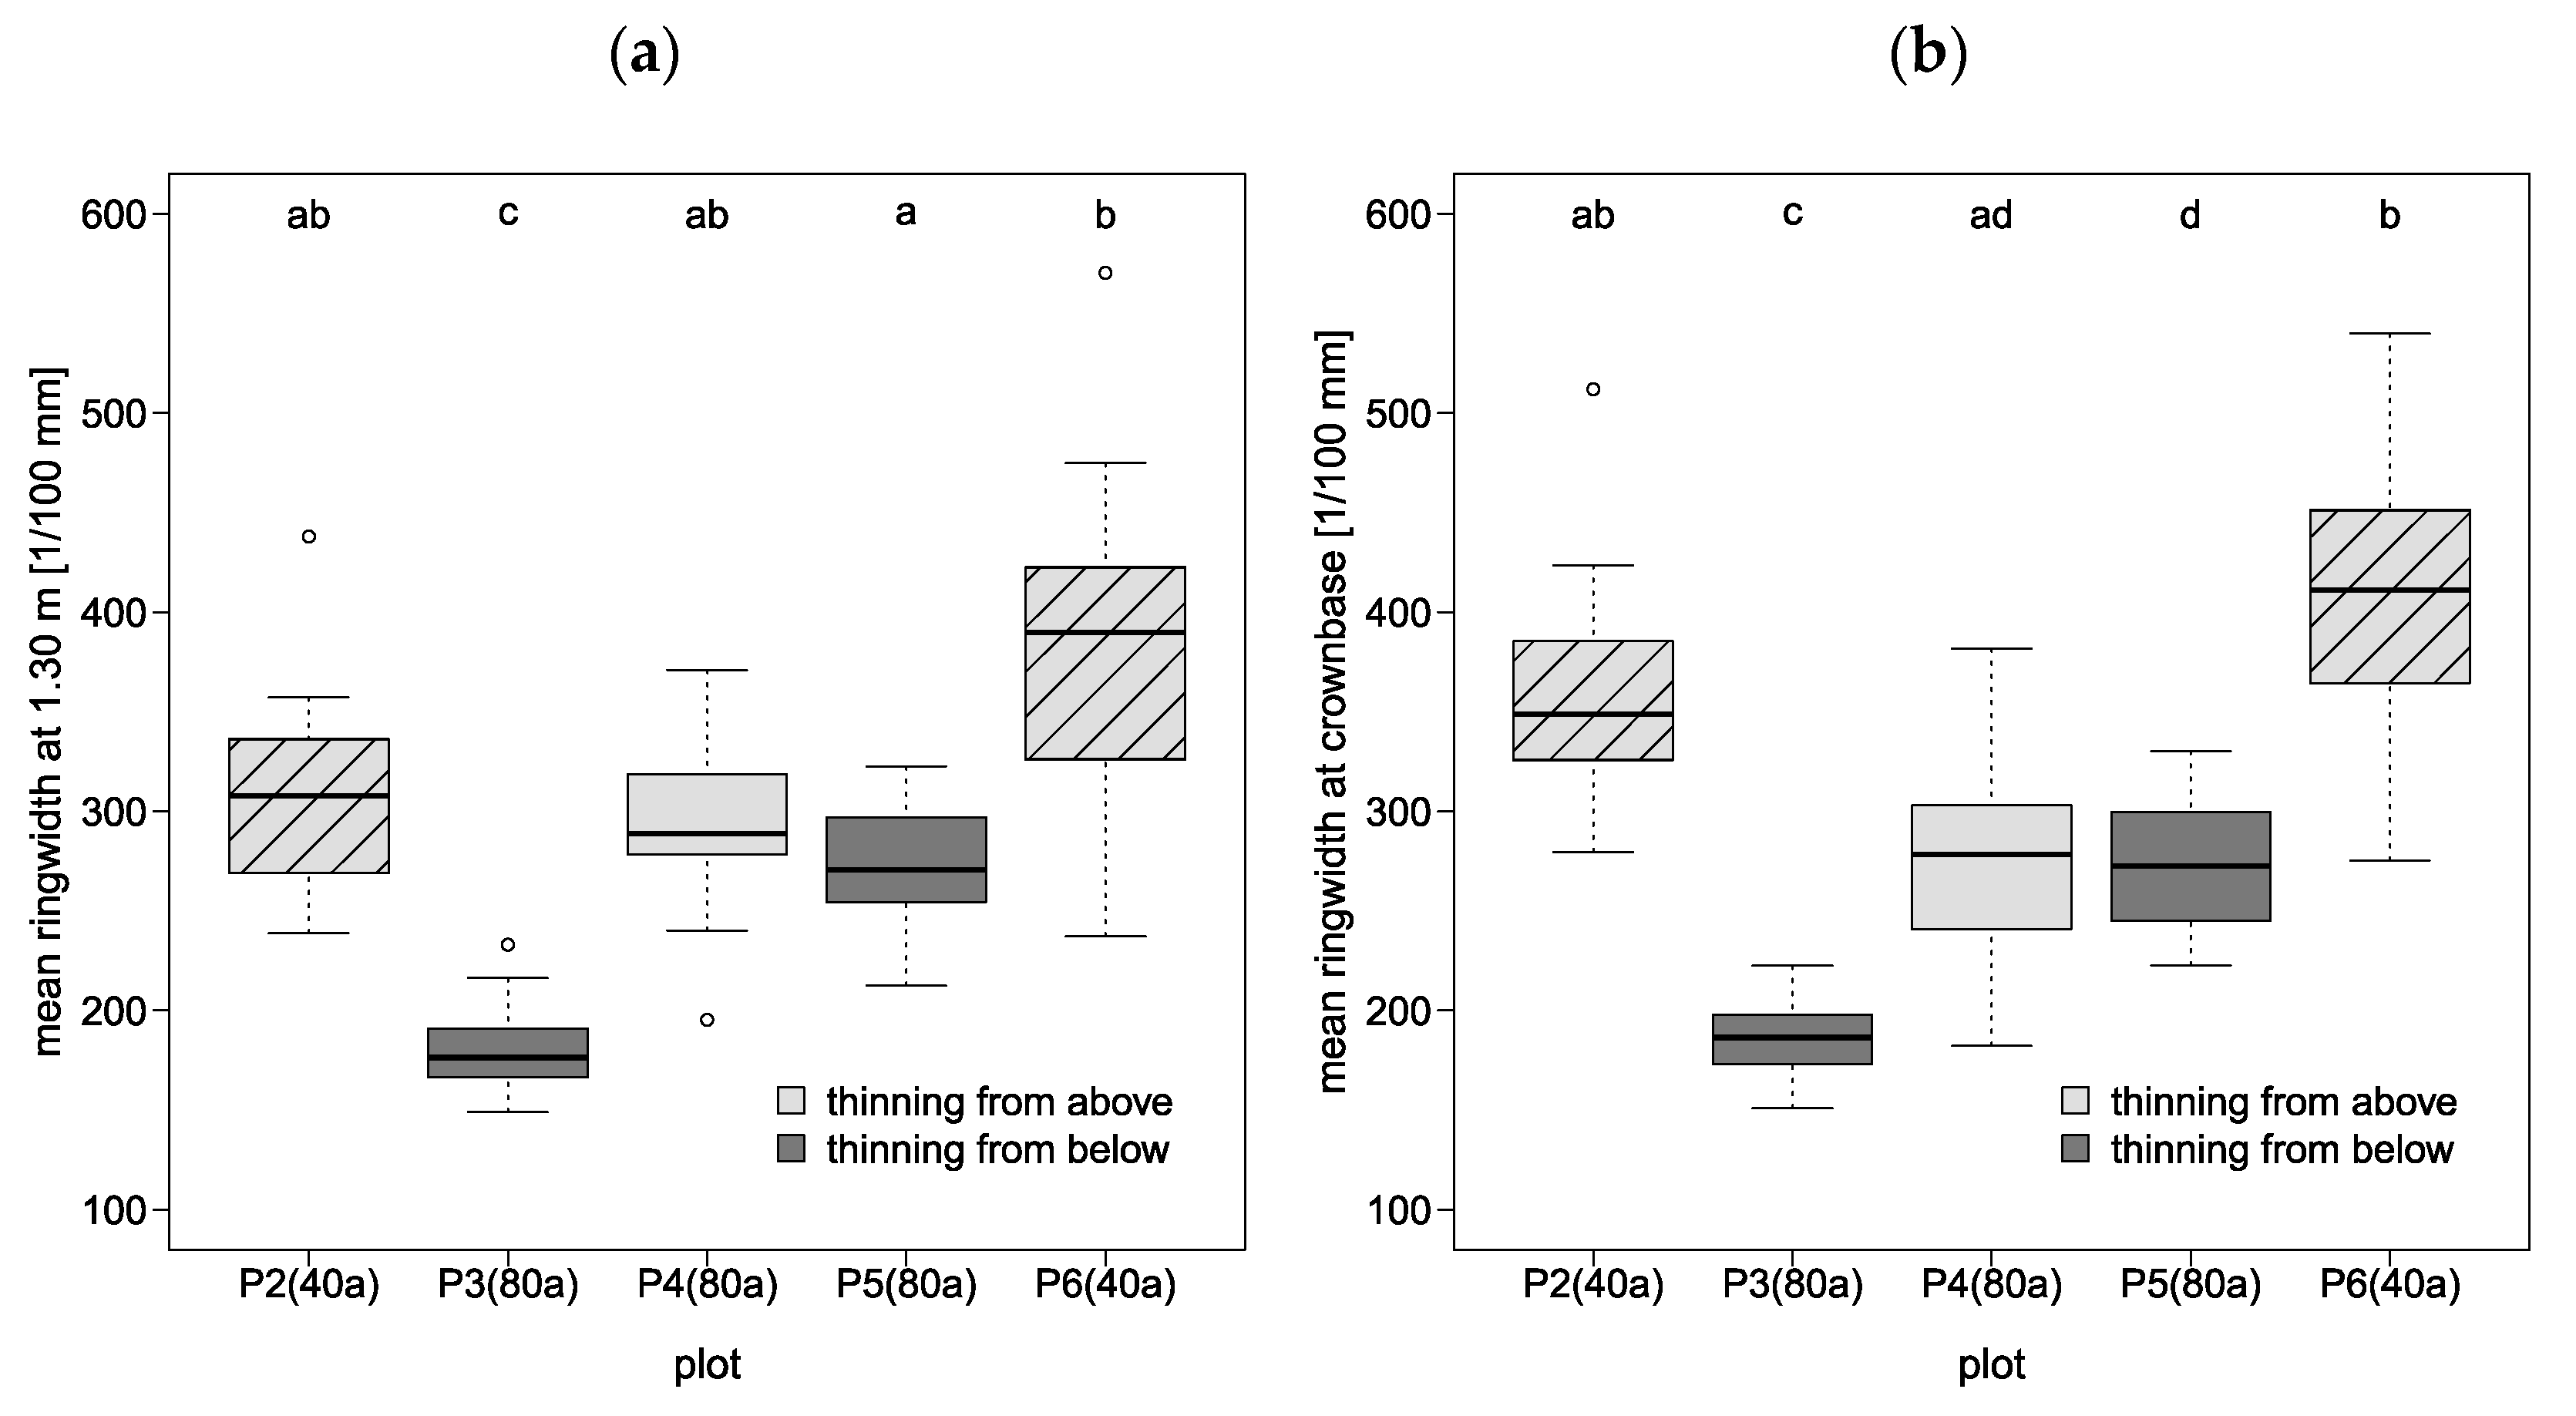
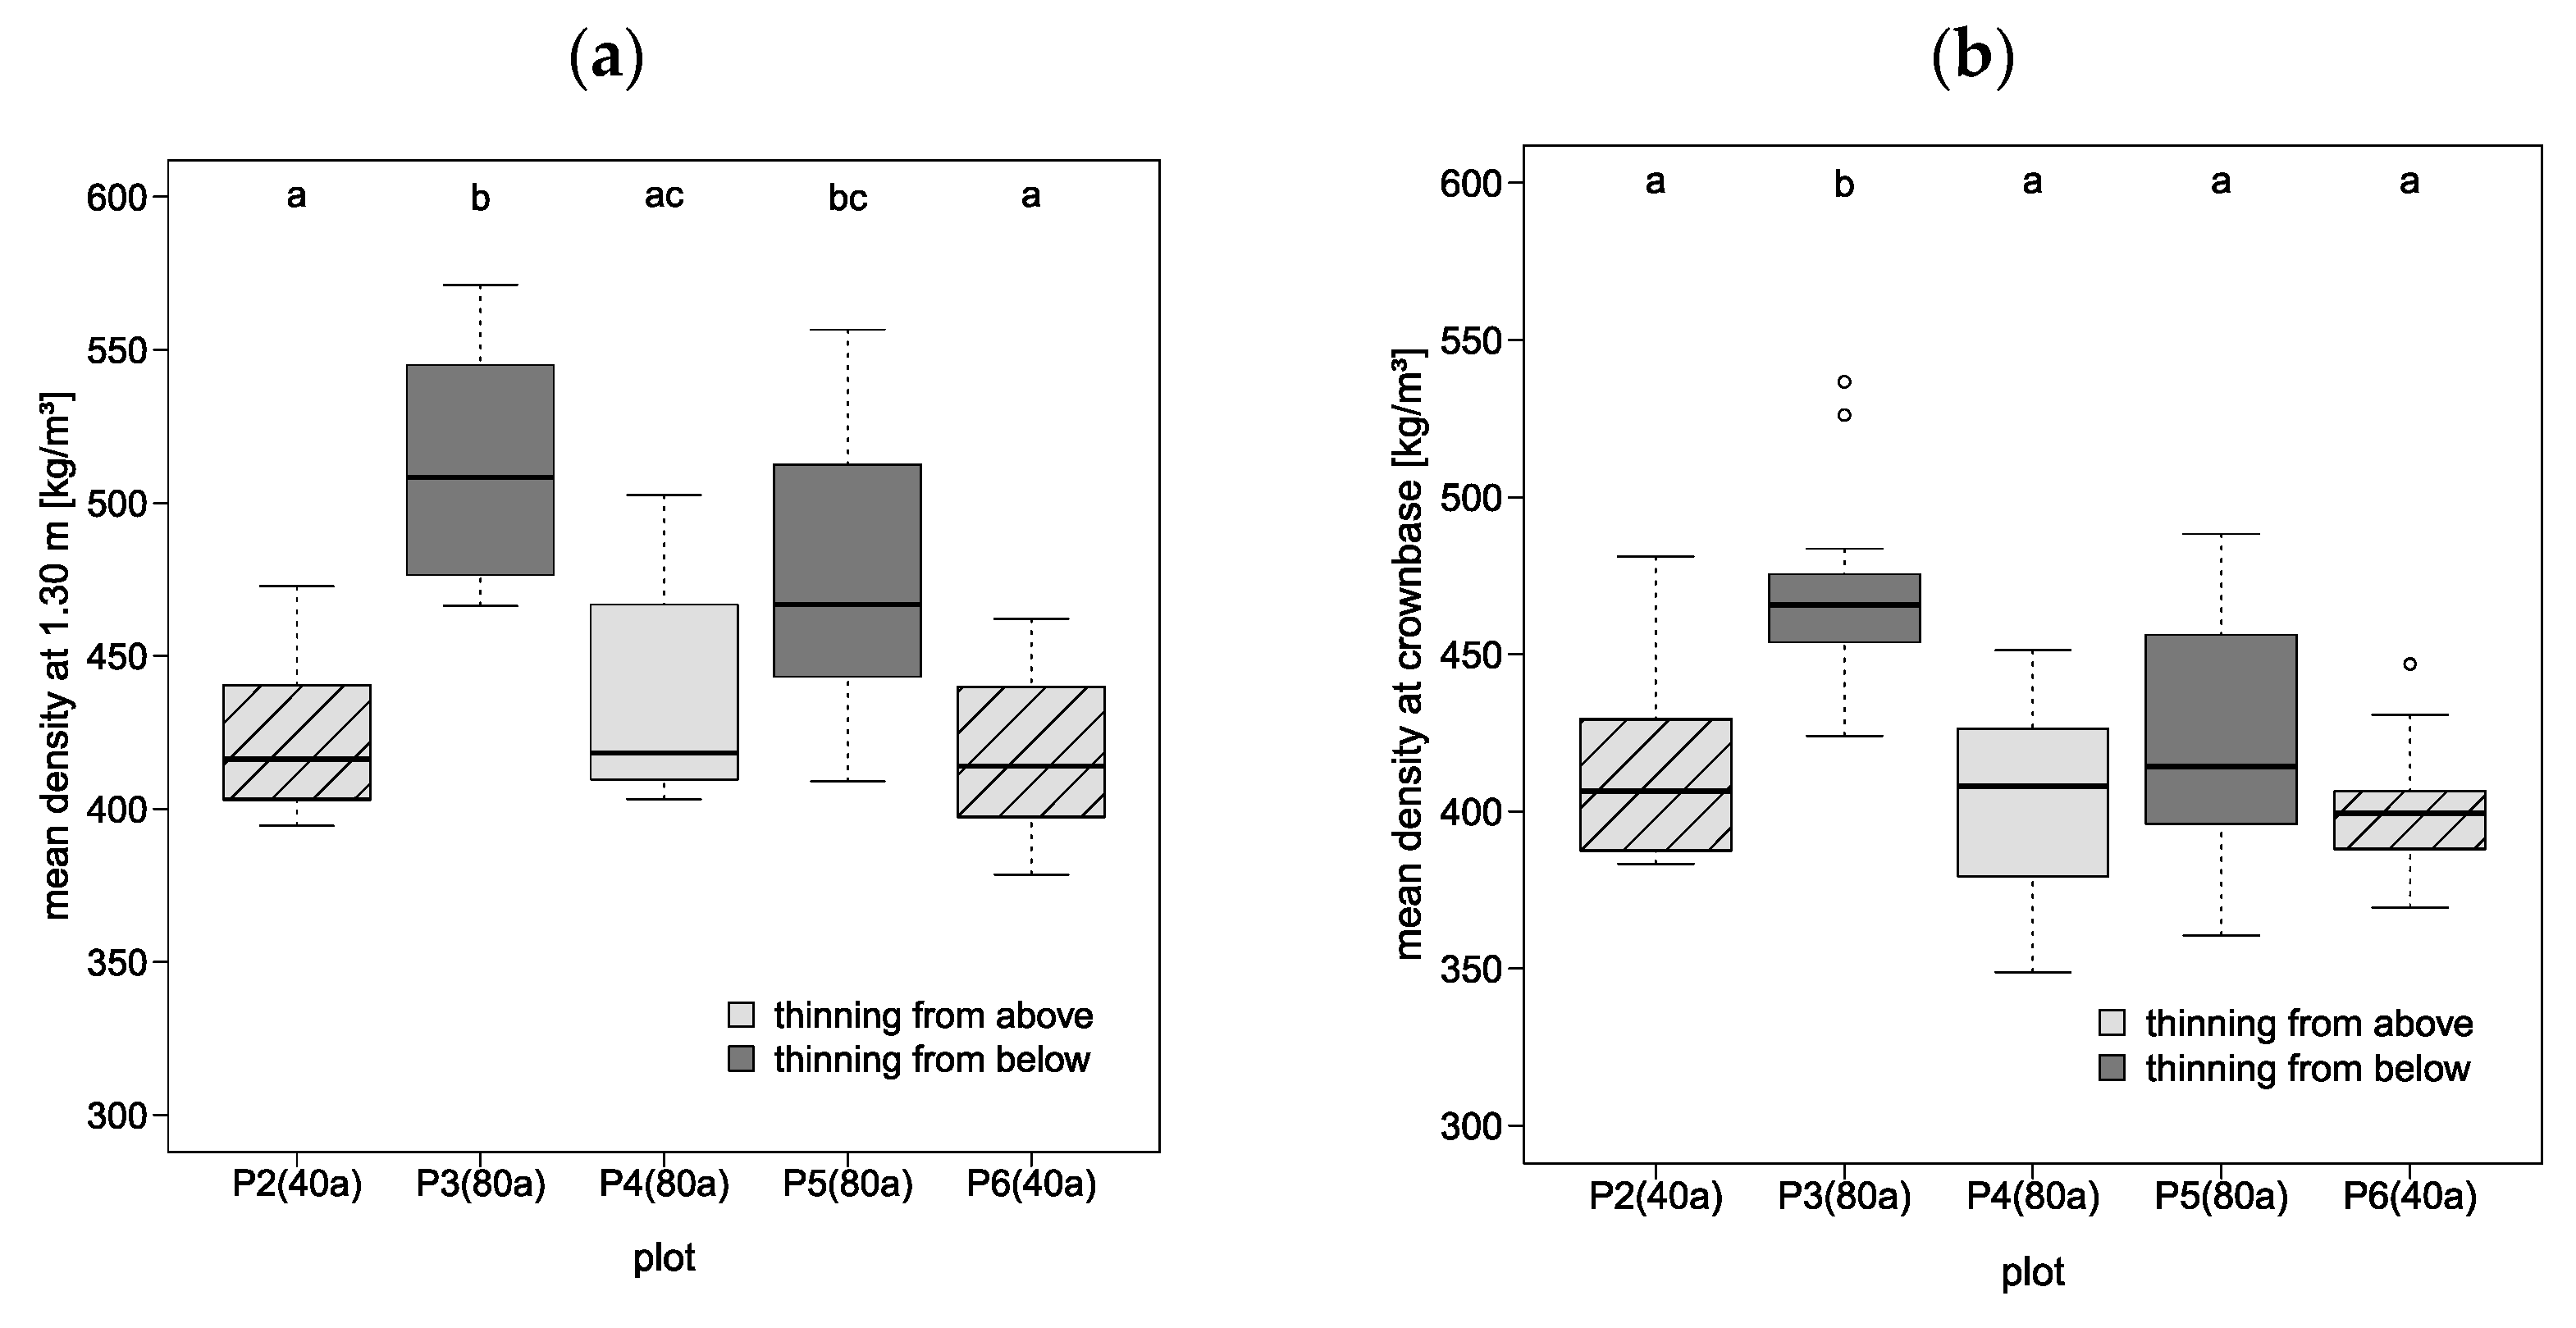
3.1. Mean Ring Width and Mean Density

In the following, the five plots were considered individually despite different silvicultural treatments because of potential differences in site conditions. The range of mean ring width at DBH and at CBH varied between the investigated five sample plots and thus between the applied silvicultural treatments (Figure 3). At DBH (Figure 3a), the smallest annual rings were observed in sample trees of plot 3 (mean: 178.0 ± 21.3 1/100 mm; TFB; age group 80), while the largest annual rings were found in sample trees of plot 6 (mean: 374.0 ± 77.8 1/100 mm; TFA; age group 40). At CBH (Figure 3b), the smallest annual rings were also observed in sample trees of plot 3 (mean: 185.3 ± 19.5 1/100 mm), while the largest annual rings in trees were found in sample trees of plot 6 (mean: 409.8 ± 70.6 1/100 mm). Trees from stands that were thinned from above (plots 2 (age group 40), 4 (age group 80), and 6 (age group 40)) had wider annual rings compared to trees from stands that were thinned from below (plots 3 and 5; both age group 80; exception: plot 5 was only significantly different to plot 6 for DBH and not significantly different to plot 4 for CBH).
The range of mean density at DBH and at CBH also varied between the investigated five sample plots and between the applied silvicultural treatments (Figure 4). At DBH (Figure 4a), the highest densities were observed in trees from plot 3 (mean: 511.4 ± 37.5 kg·m−3; TFB; age group 80) and the lowest densities were observed in trees from plot 6 (mean: 414.7 ± 23.2 kg·m−3; TFA; age group 40). Trees from stands that were thinned from below (plots 3 and 5; both age group 80) showed higher densities compared to trees from stands that were thinned from above (plots 2 (age group 40), 4 (age group 80), and 6 (age group 40); exception: plot 4 was not significantly different to plot 5). At CBH (Figure 4b), trees from plot 3 showed the highest densities (mean: 468.7 ± 28.9 kg·m−3), while lower densities were observed in all other plots (not significantly different). Comparing mean density at DBH with mean density at CBH (Figure 4a,b), it can be seen that with increasing tree height, mean density decreased to a greater extent in trees from stands that were thinned from below compared to trees from stands that were thinned from above.

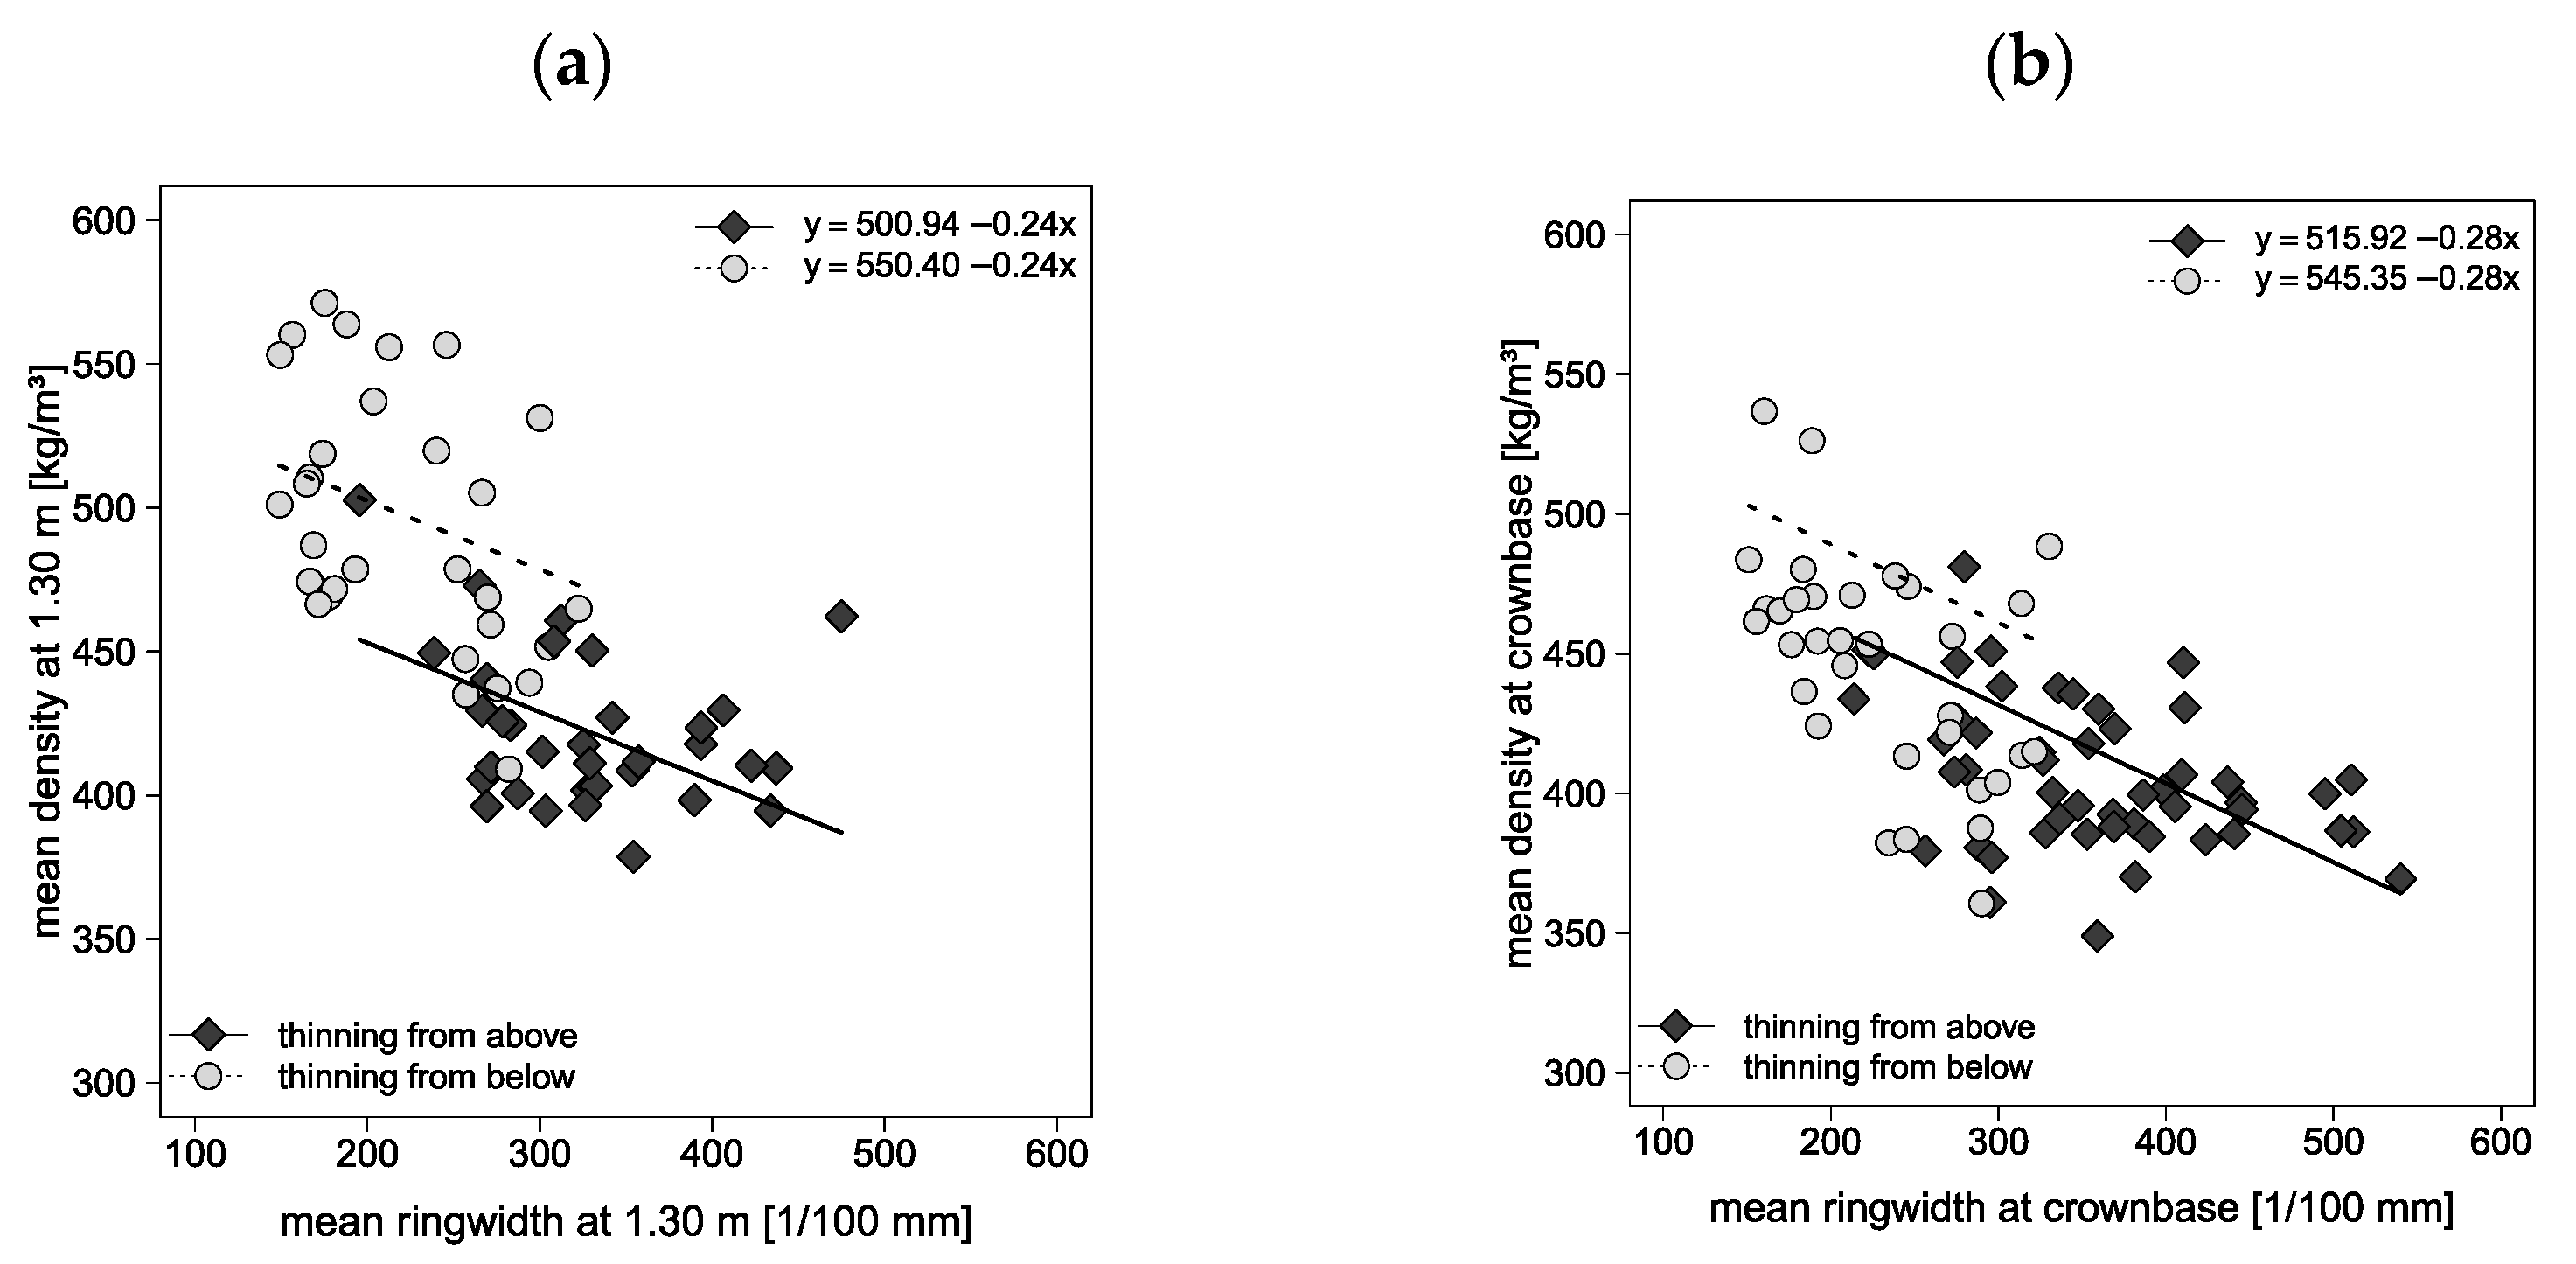
3.2. Relation between Mean Ring Width and Mean Density

Spearman’s rank correlation coefficient revealed that mean ring width at DBH was negatively correlated with mean density at DBH (ρ = −0.754, p < 0.001; Table 2) and with mean density at CBH (ρ = −0.634, p < 0.001; Table 2). Additionally, mean ring width at CBH was also significantly negative correlated with mean density at DBH (ρ = −0.763, p < 0.001; Table 2) and at CBH (ρ = −0.612, p < 0.001; Table 2).
The linear mixed-effect modelling confirmed a significant negative relationship between mean ring width and mean density at DBH and at CBH observed in this case study. With increasing mean ring width by 1/100 mm, mean density significantly decreased by −0.2 kg·m−3 (for DBH) and by −0.3 kg·m−3 (for CBH) (Figure 5a,b and Table 3). Furthermore, we observed differences between the applied silvicultural treatments: TFB led to smaller mean ring widths and to significantly higher mean density at DBH (by 49.5 kg·m−3) as well as at CBH (by 29.4 kg·m−3) (Figure 5a,b) when compared to TFA. Moreover, small annual rings had higher densities from the sample trees from stands that were thinned from below (intercepts: 550.4 and 545.4 kg·m−3) compared to sample trees from stands that were thinned from above (intercepts: 500.9 and 515.9 kg·m−3). Regarding the fixed effect age group, no significant influence on mean density was observed (p = 0.86) for the linear mixed-effect model at DBH. For CBH, trees of age group 80 showed a significantly lower mean density than trees of age group 40 by −34.3 kg·m−3. The random effect site condition explained 0% of the variance for both linear mixed-effect models due to the lack of replications.

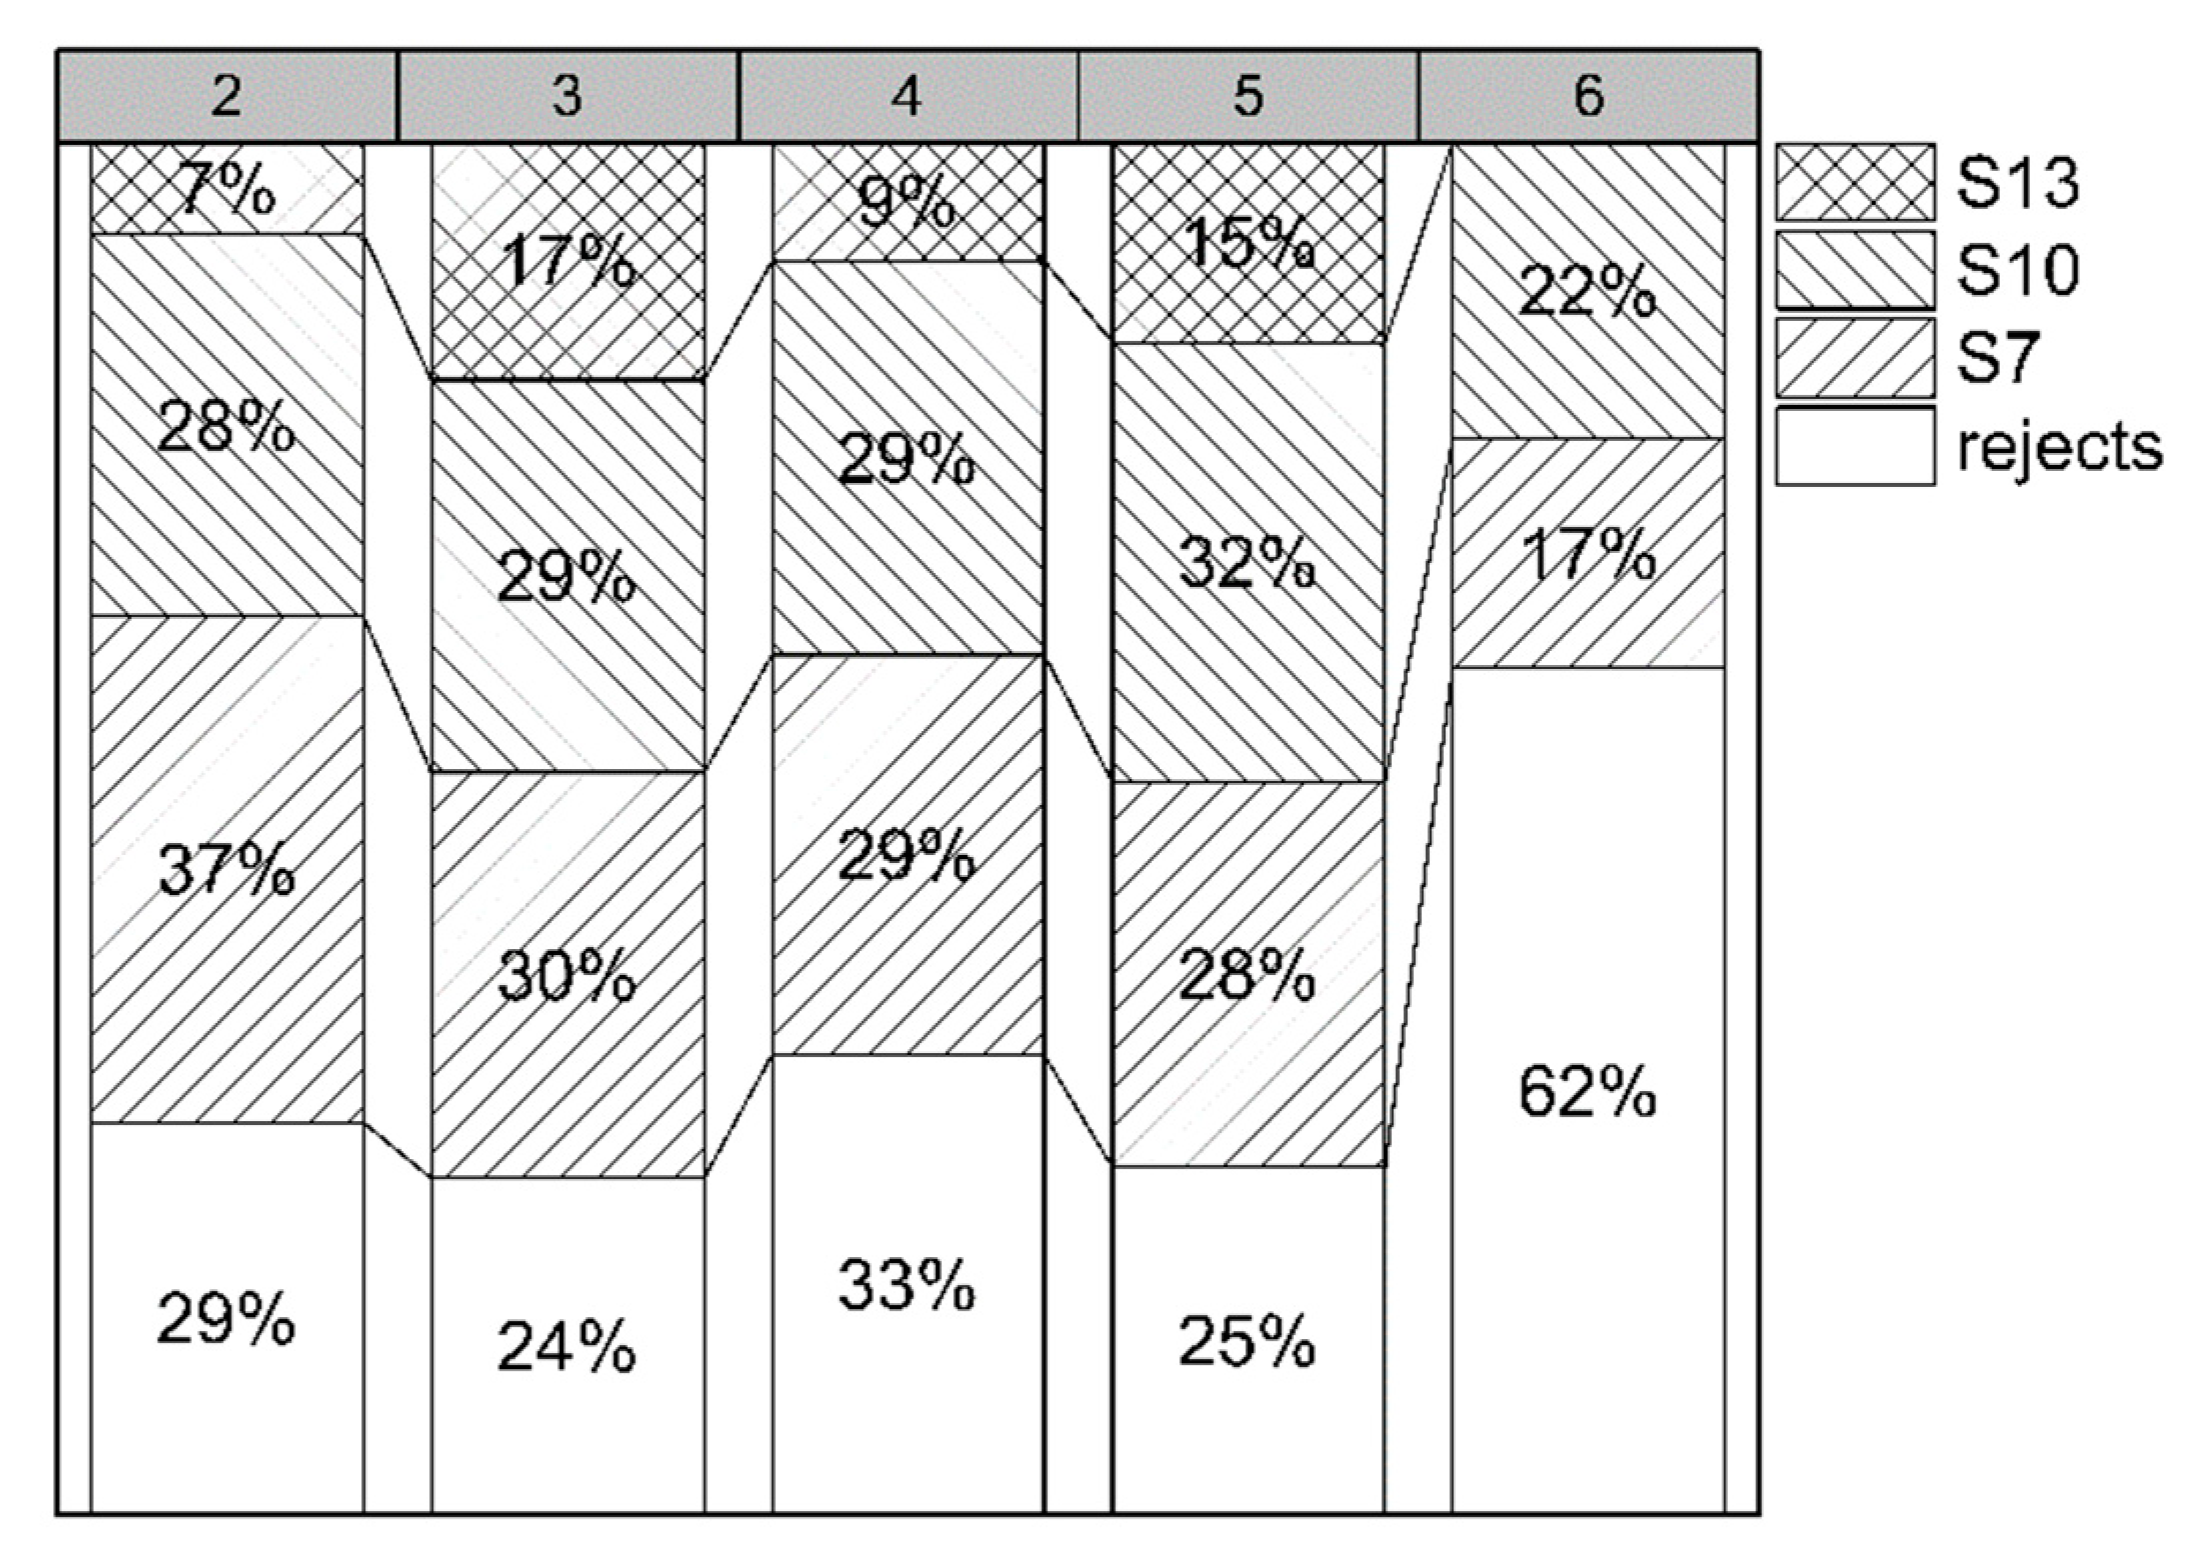
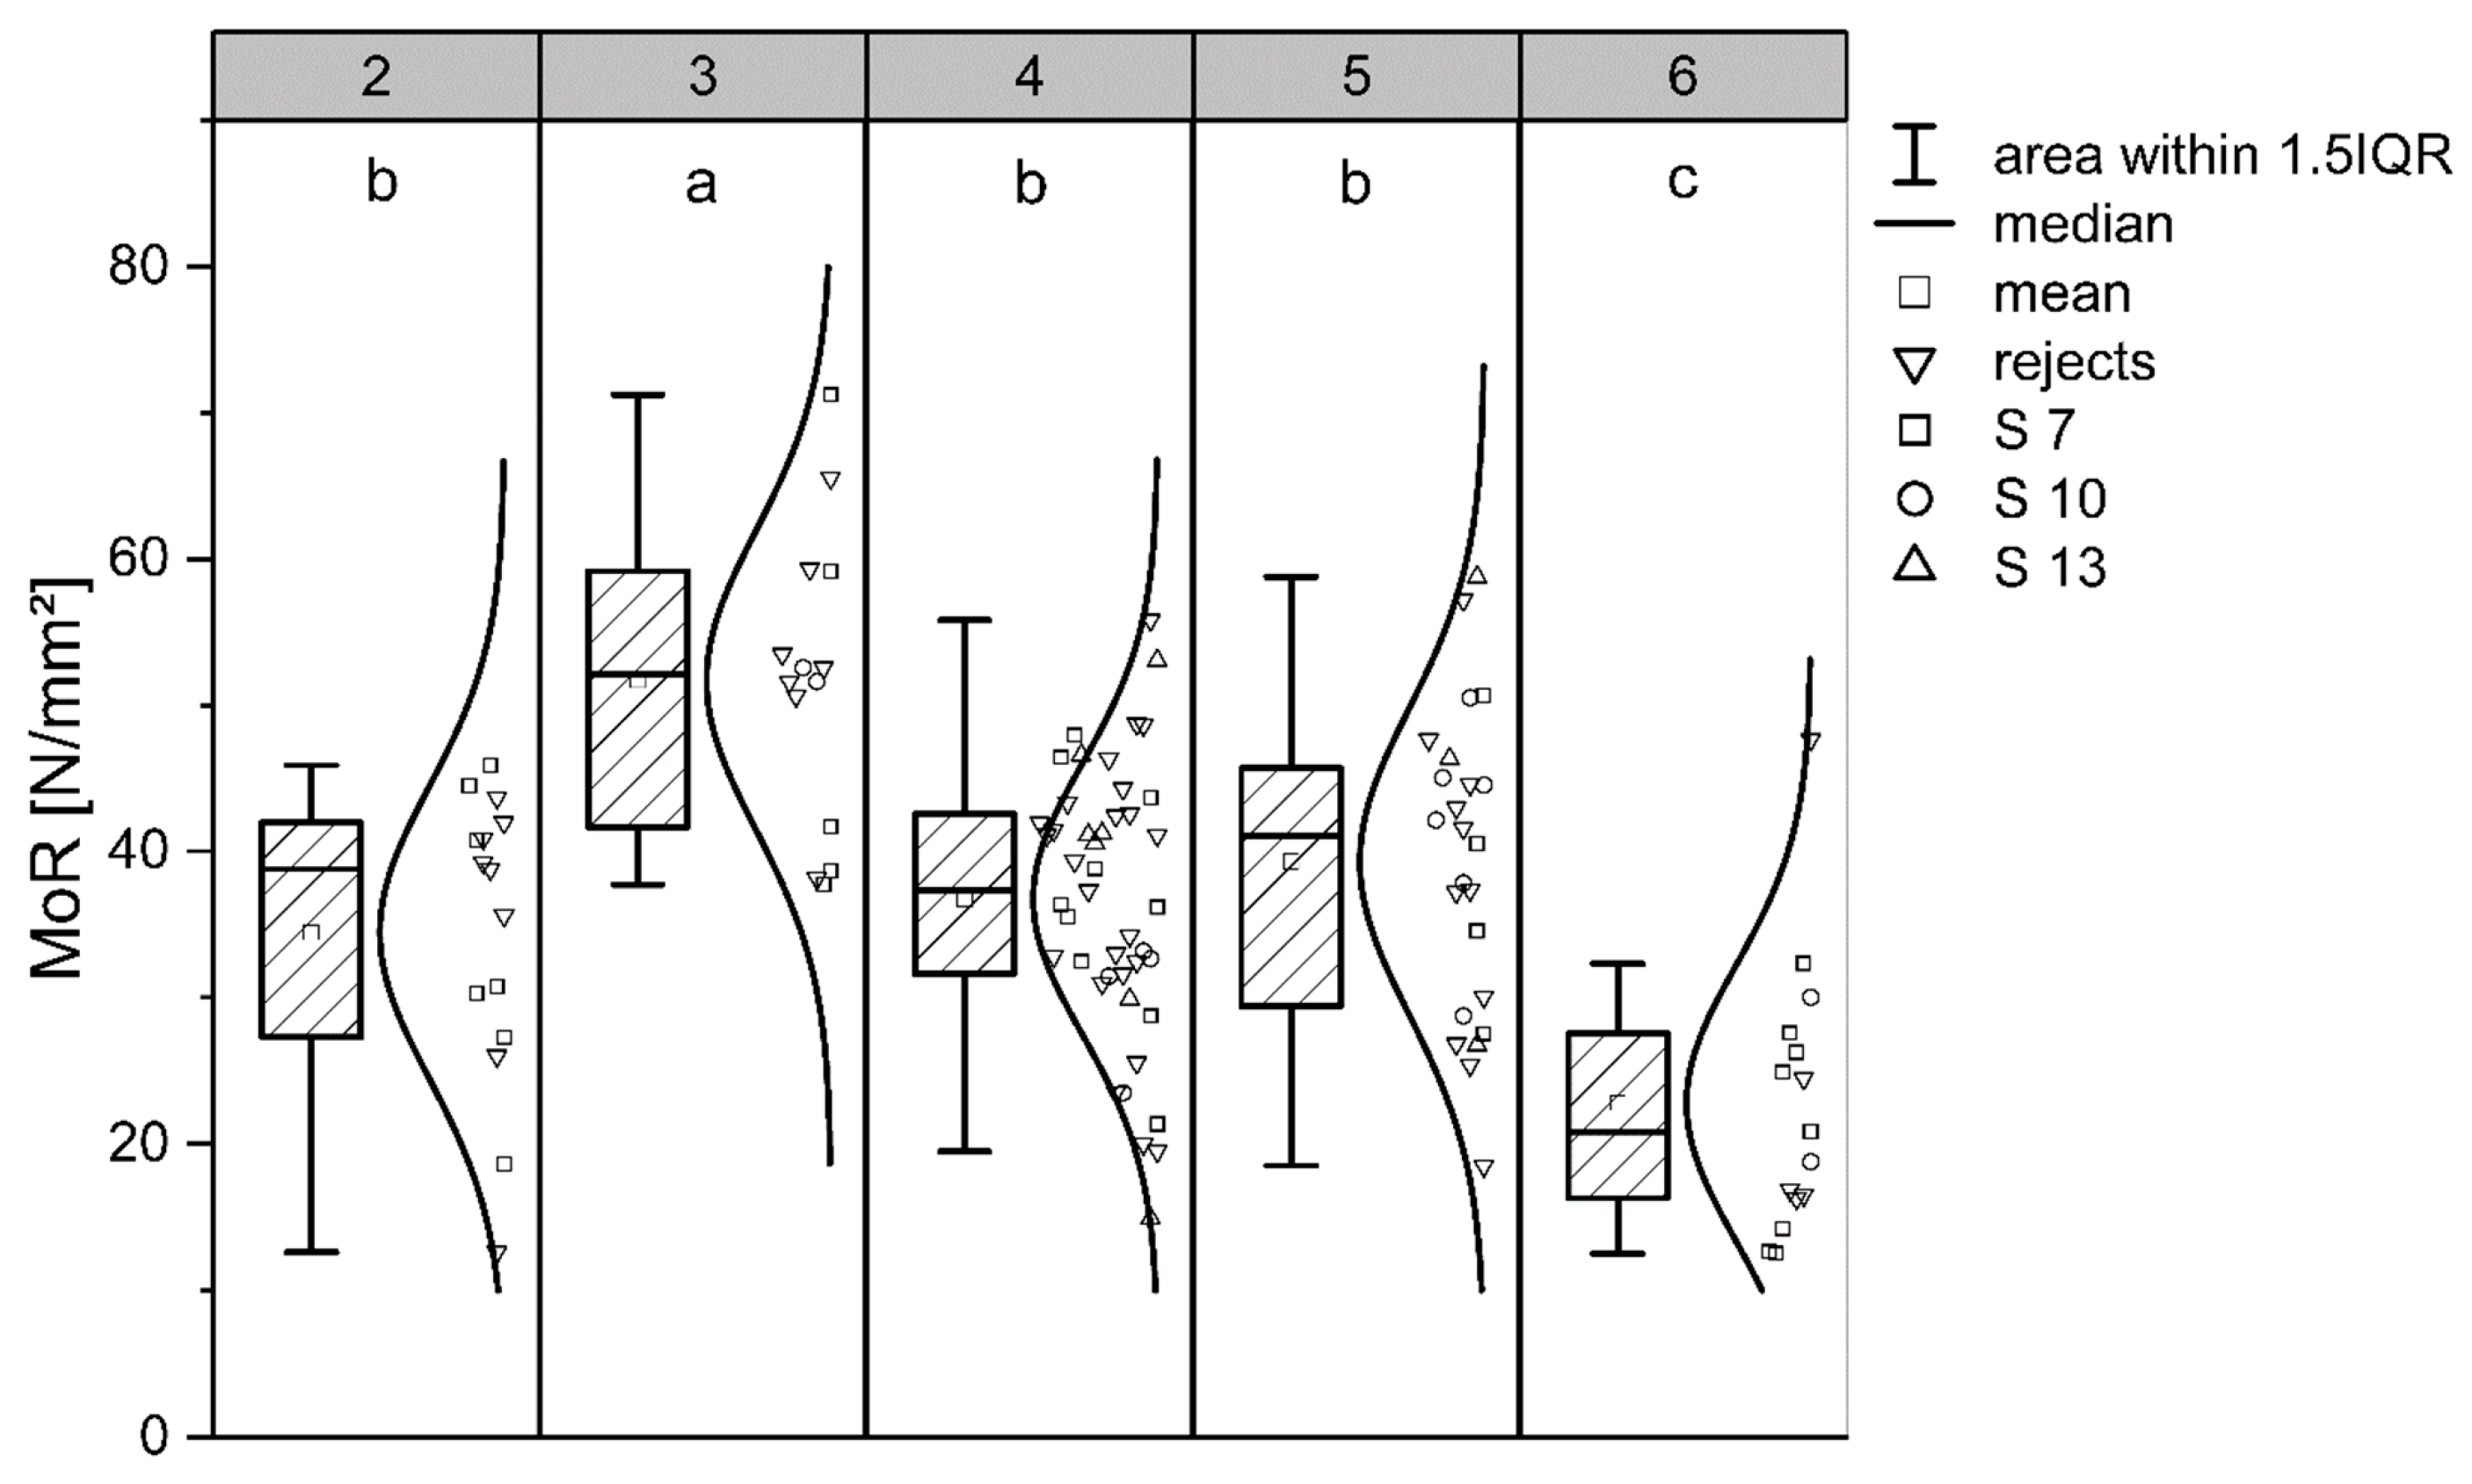
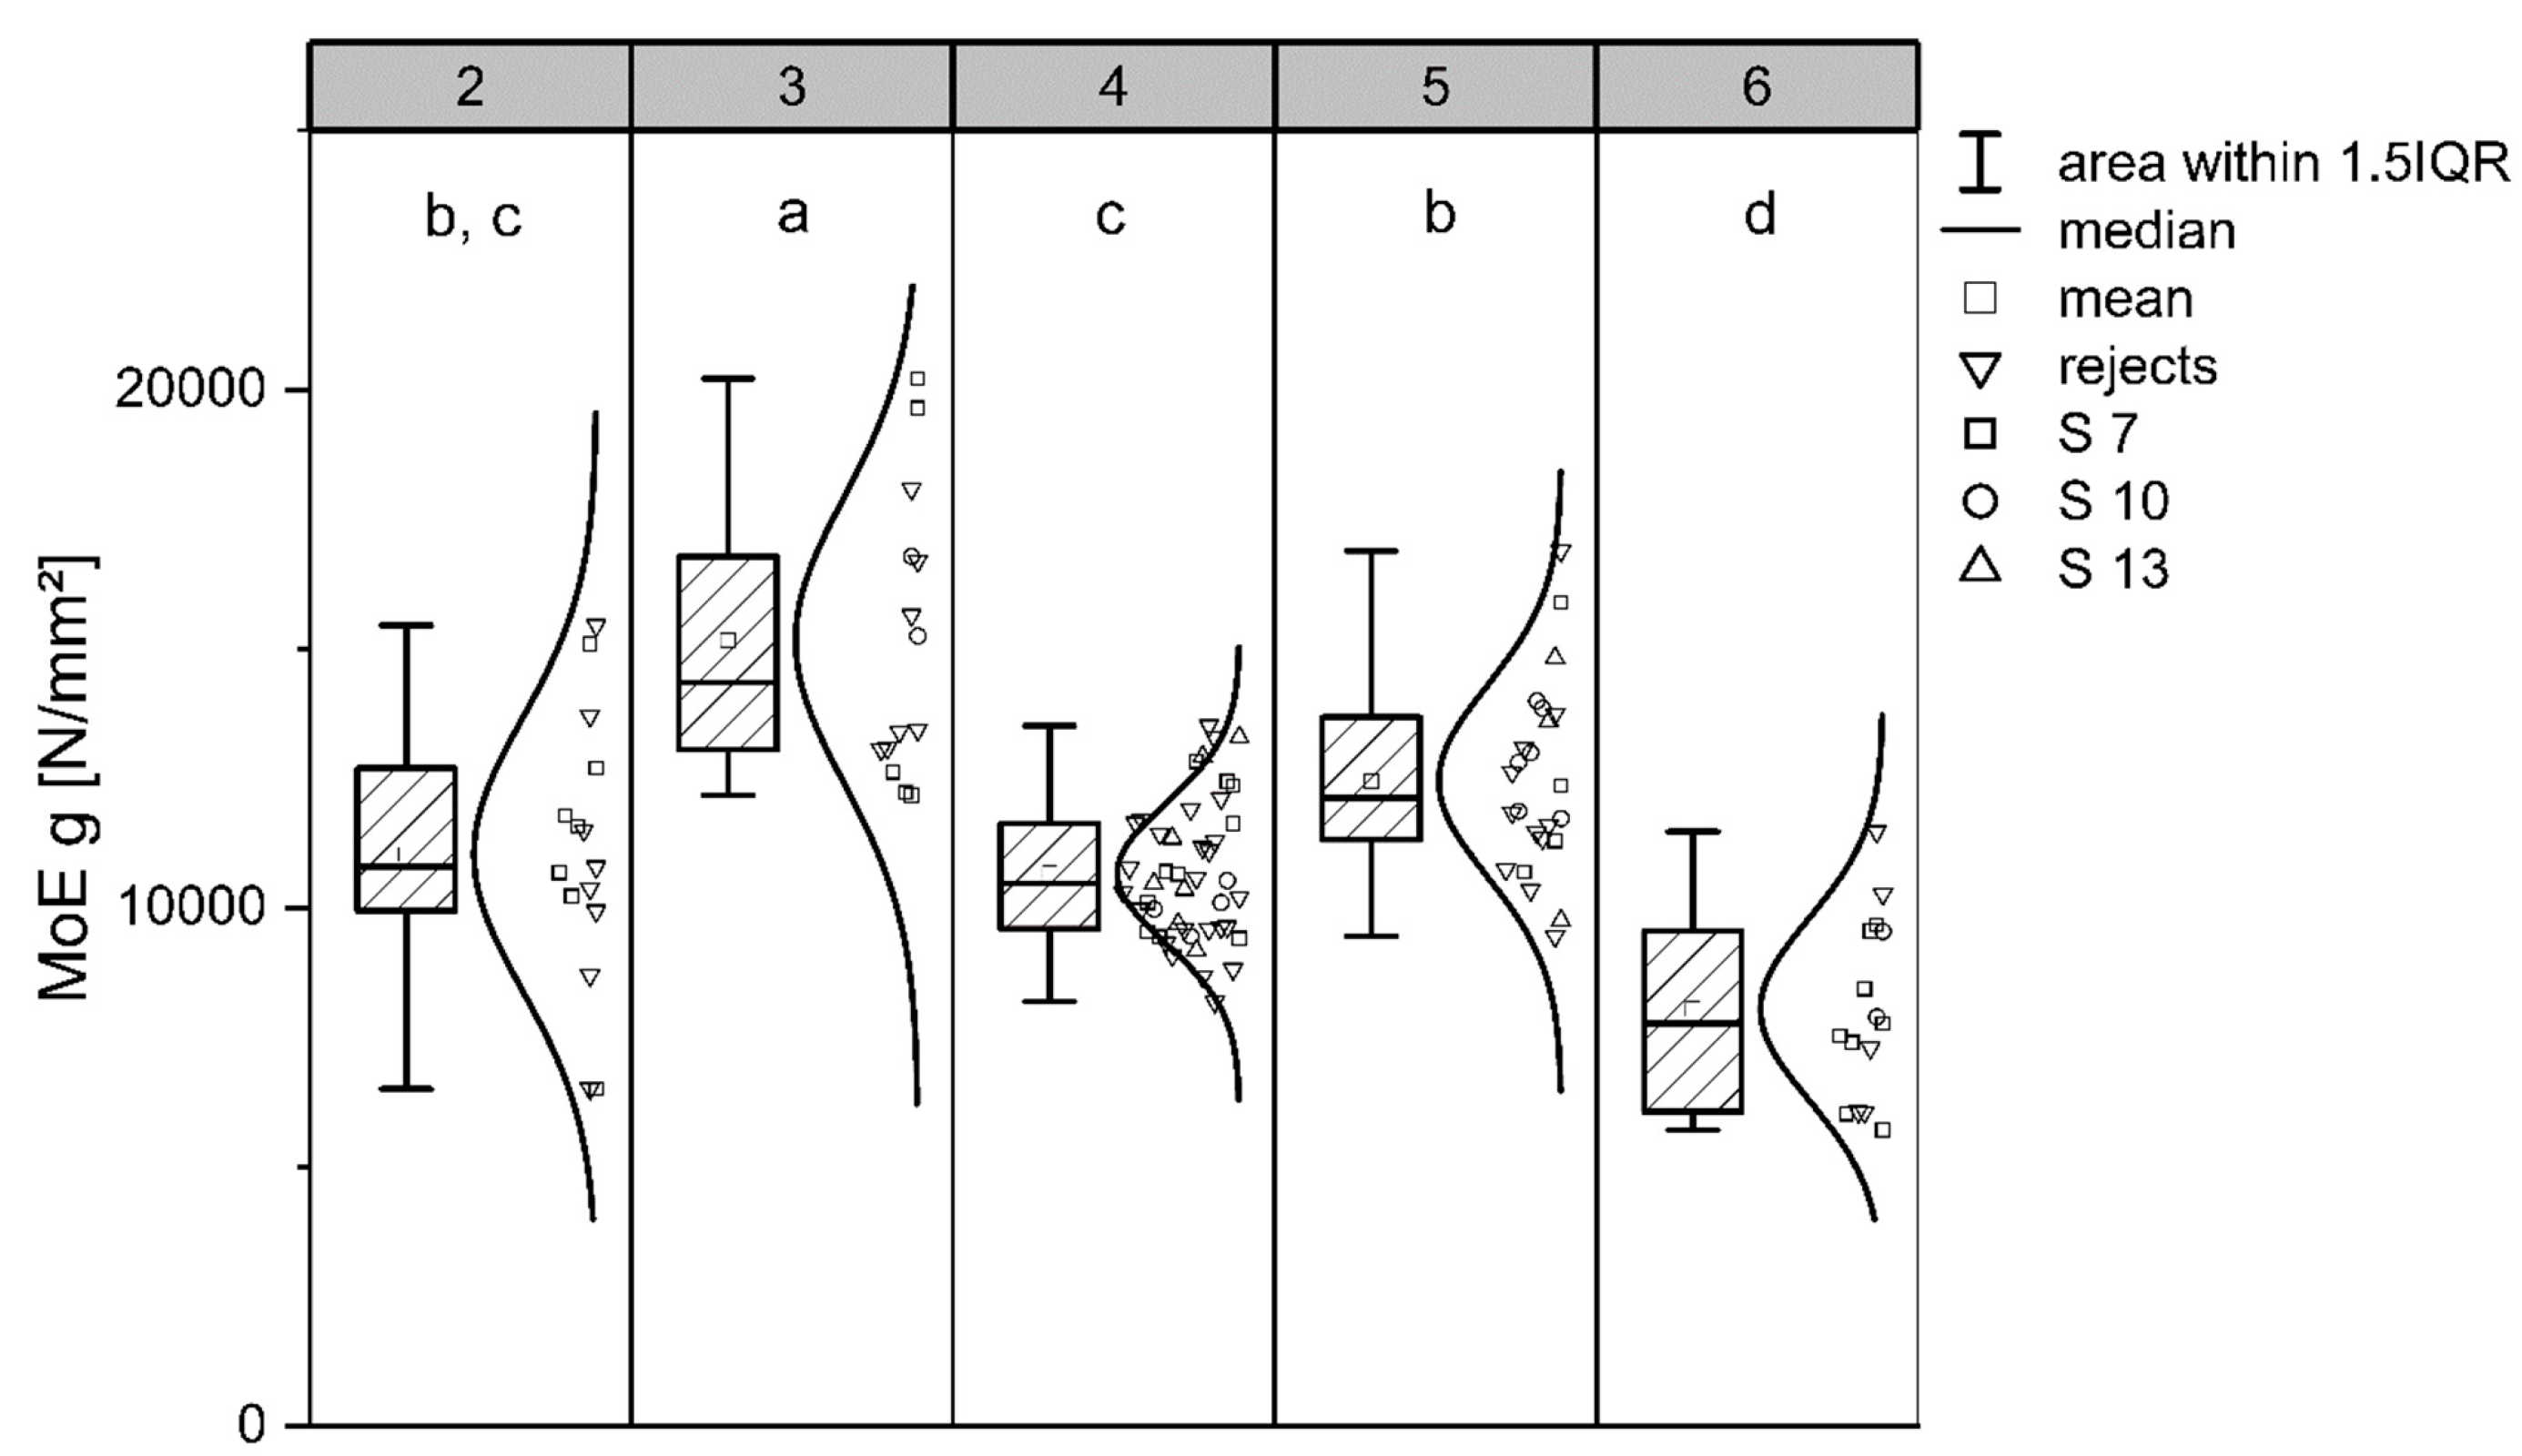
3.3. Visual Timber Grading and Bending Strength

For the visual grading of timber, the growth-related properties knottiness (individual knot size and size of knot clusters), compression wood, growth ring width, and the fiber inclination, which all reduced strength and resulted in drying defects, proved to be decisive for a downgrading of the grading class. A summary of the grading class distribution of the examined board surfaces (Figure 6) showed that plots 3 and 5 (thinning from below, both age group 80), with 17% and 15%, respectively, had the highest proportions of sawn timber graded in S13 and also produced the lowest reject rates (plot 3: 24%, plot 5: 25%). The results of plot 4 (thinning from above), which, like plots 3 and 5, has 80-year-old sample trees, were worse due to larger diameters of single knots, and with 33% rejects still remained behind plot 2 (29%, thinning from above, age group 40). Plot 6 (thinning from above, age group 40), on the other hand, had the highest percentage of rejects (62%) and no sawn timber could be graded into the quality class S13. Based on the visual grading, a clustering of the strength results of plots 2 and 4, as well as of plots 3 and 5, would be expected.
The modulus of rupture (MoR) of the sawn timber from plot 3 (thinning from below, age group 80) was significantly higher with a mean value of 51.8 N·mm² (standard deviation: ±10.6 N·mm²), while sawn timber from plot 6 (thinning from above, age group 40) had significantly lower bending strengths with a mean value of 22.0 N·mm² (standard deviation: ±7.3 N·mm²) (Figure 7). The plots can be divided into the statistically distinct groups a, b and c. A one-way ANOVA for the comparison of the grading classes using the same statistical method could not prove a significant difference in bending strength. Statistical tests indicated significant correlations between the mechanical MoR and the visual criteria single knot and knot cluster (−0.24), fiber angle (−0.33), and growth ring width (−0.26). The non-parametric Spearman correlation test revealed significant correlations between MoR and the stand characteristics age (0.38) and h/d ratio (0.18), as well as a correlation of −0.28 comparing the forest management type thinning from below to thinning from above.
The calculation of the global modulus of elasticity (MoE) has shown a more diverse grouping of results (Figure 8). Determined by Games–Howell post-hoc testing, the samples of plot 5 have proven significantly better elastical properties compared to plot 4. A result which was not apparent from the bending strength alone. Due to a high correlation of MoE and MoR (Spearman: 0.79), the relative results appear graphically similar, with plot 3 achieving the best results at a median MoE of 15,899.3 N·mm² and with plot 6, in the distinct d grouping, with the lowest median of 7832.5 N·mm².

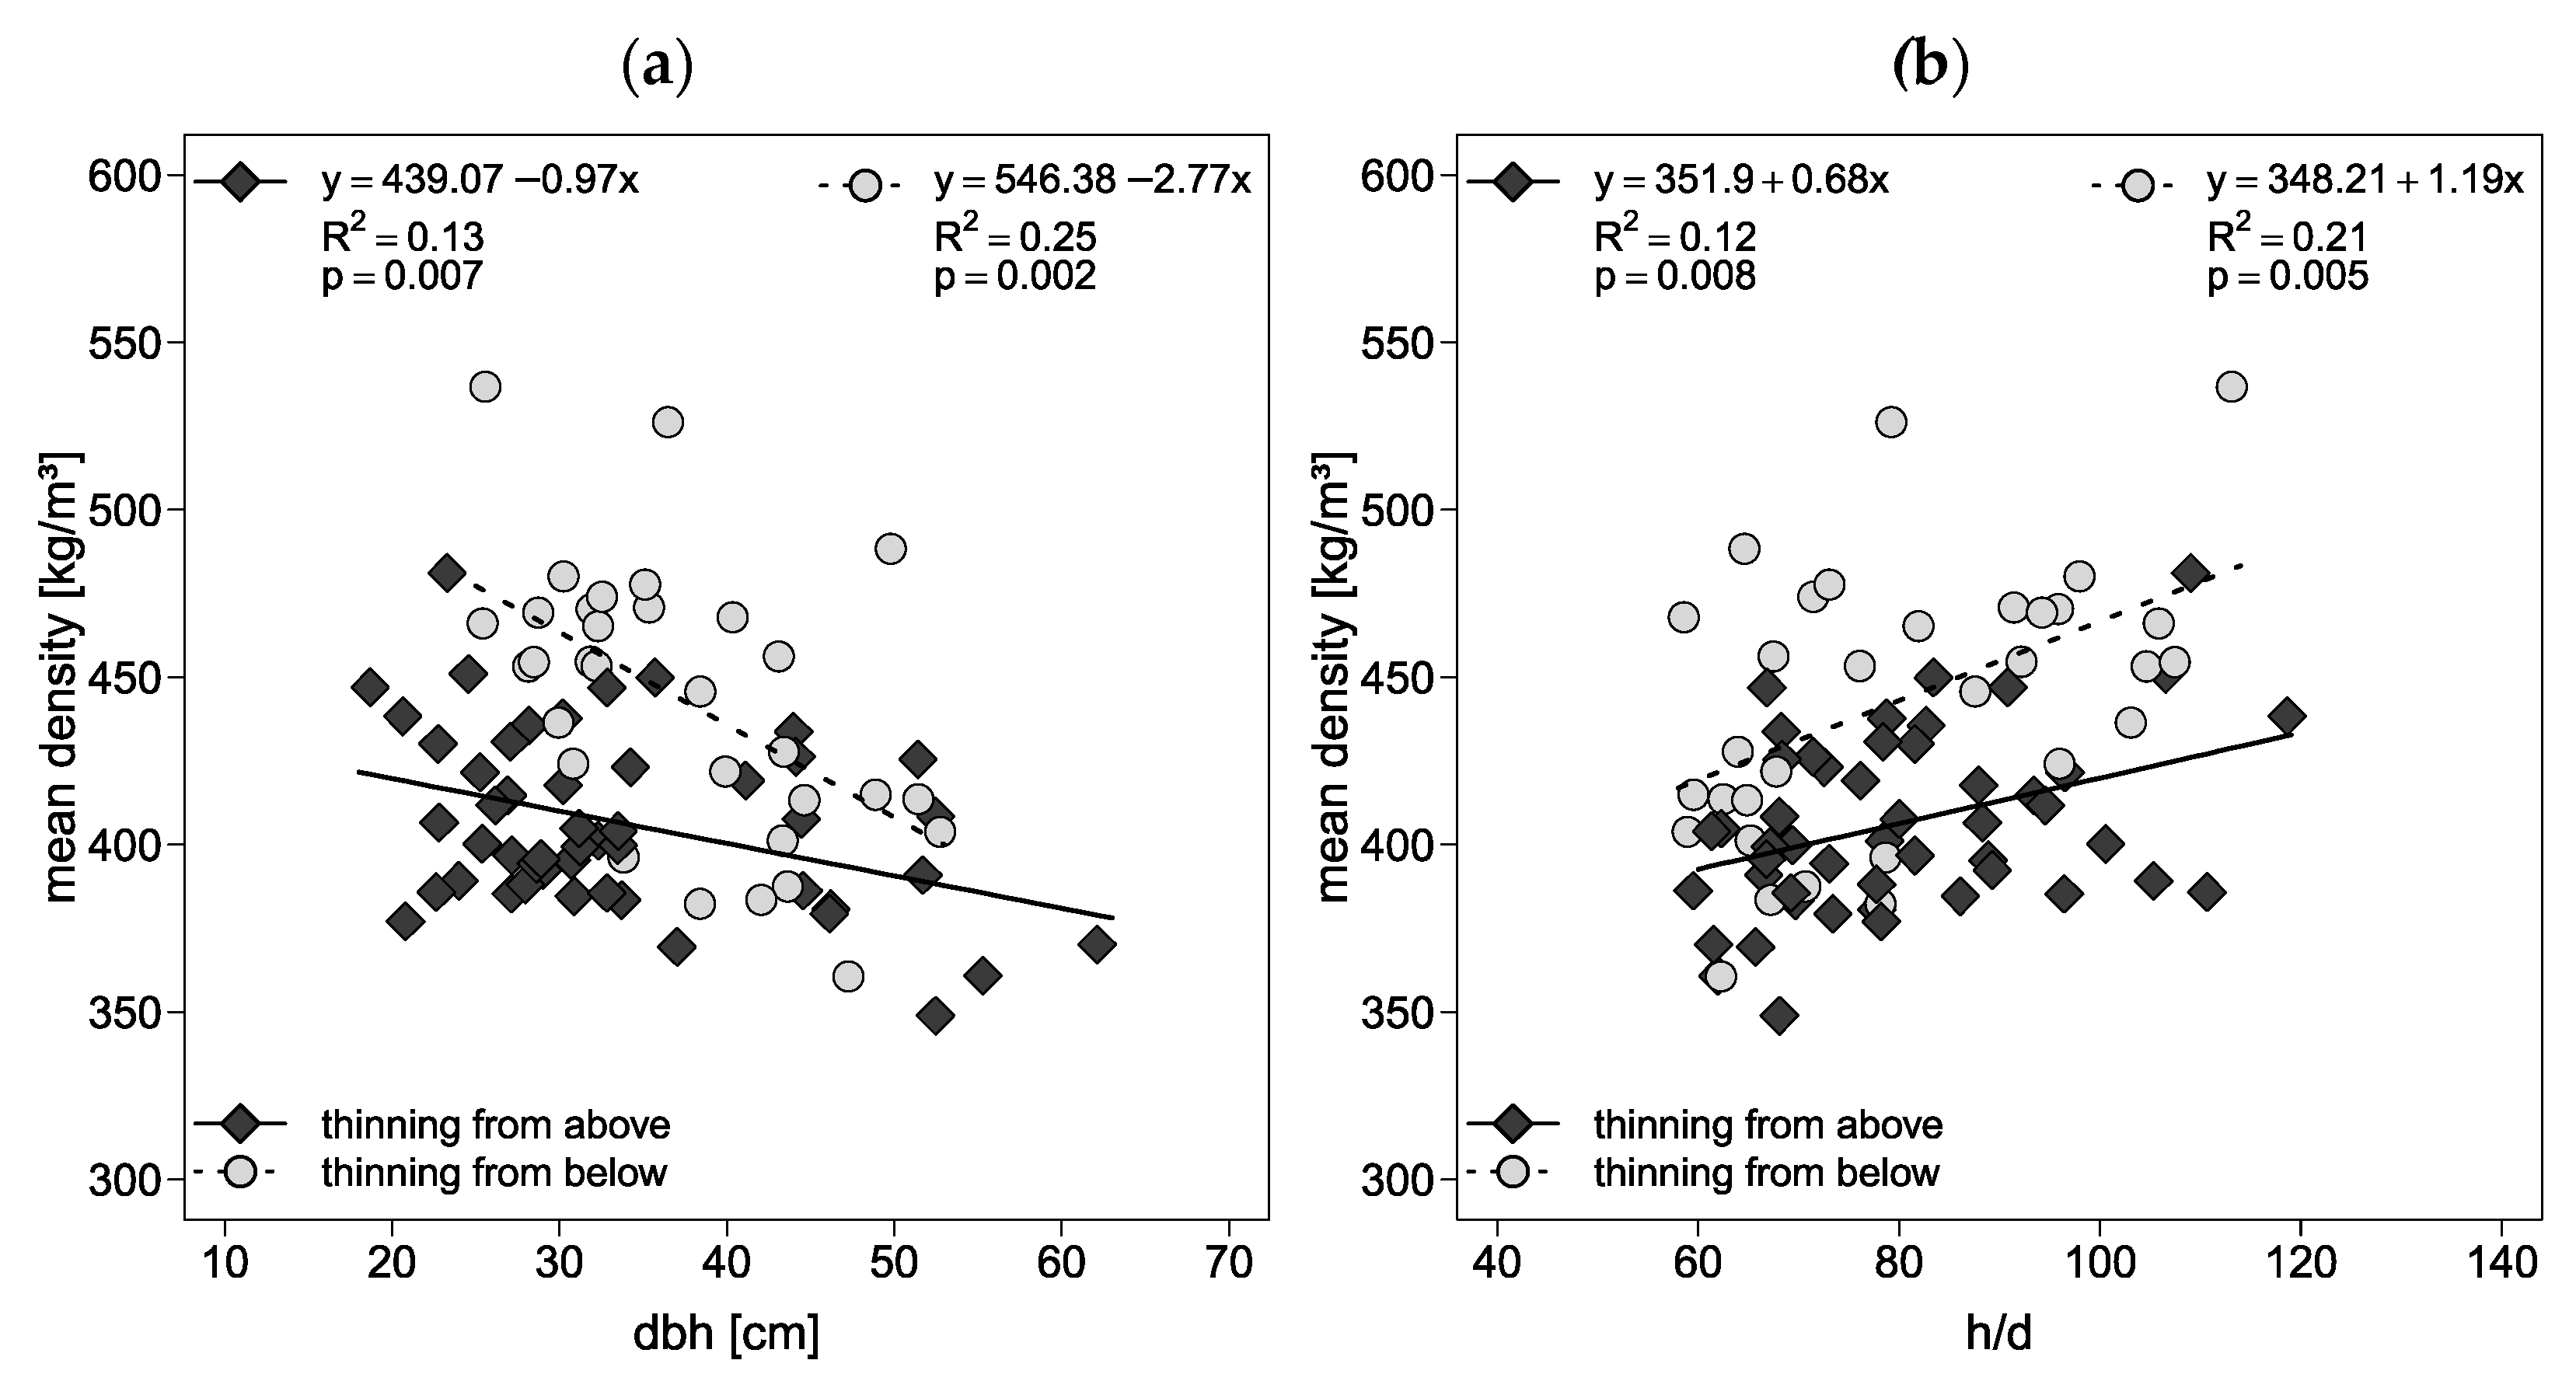
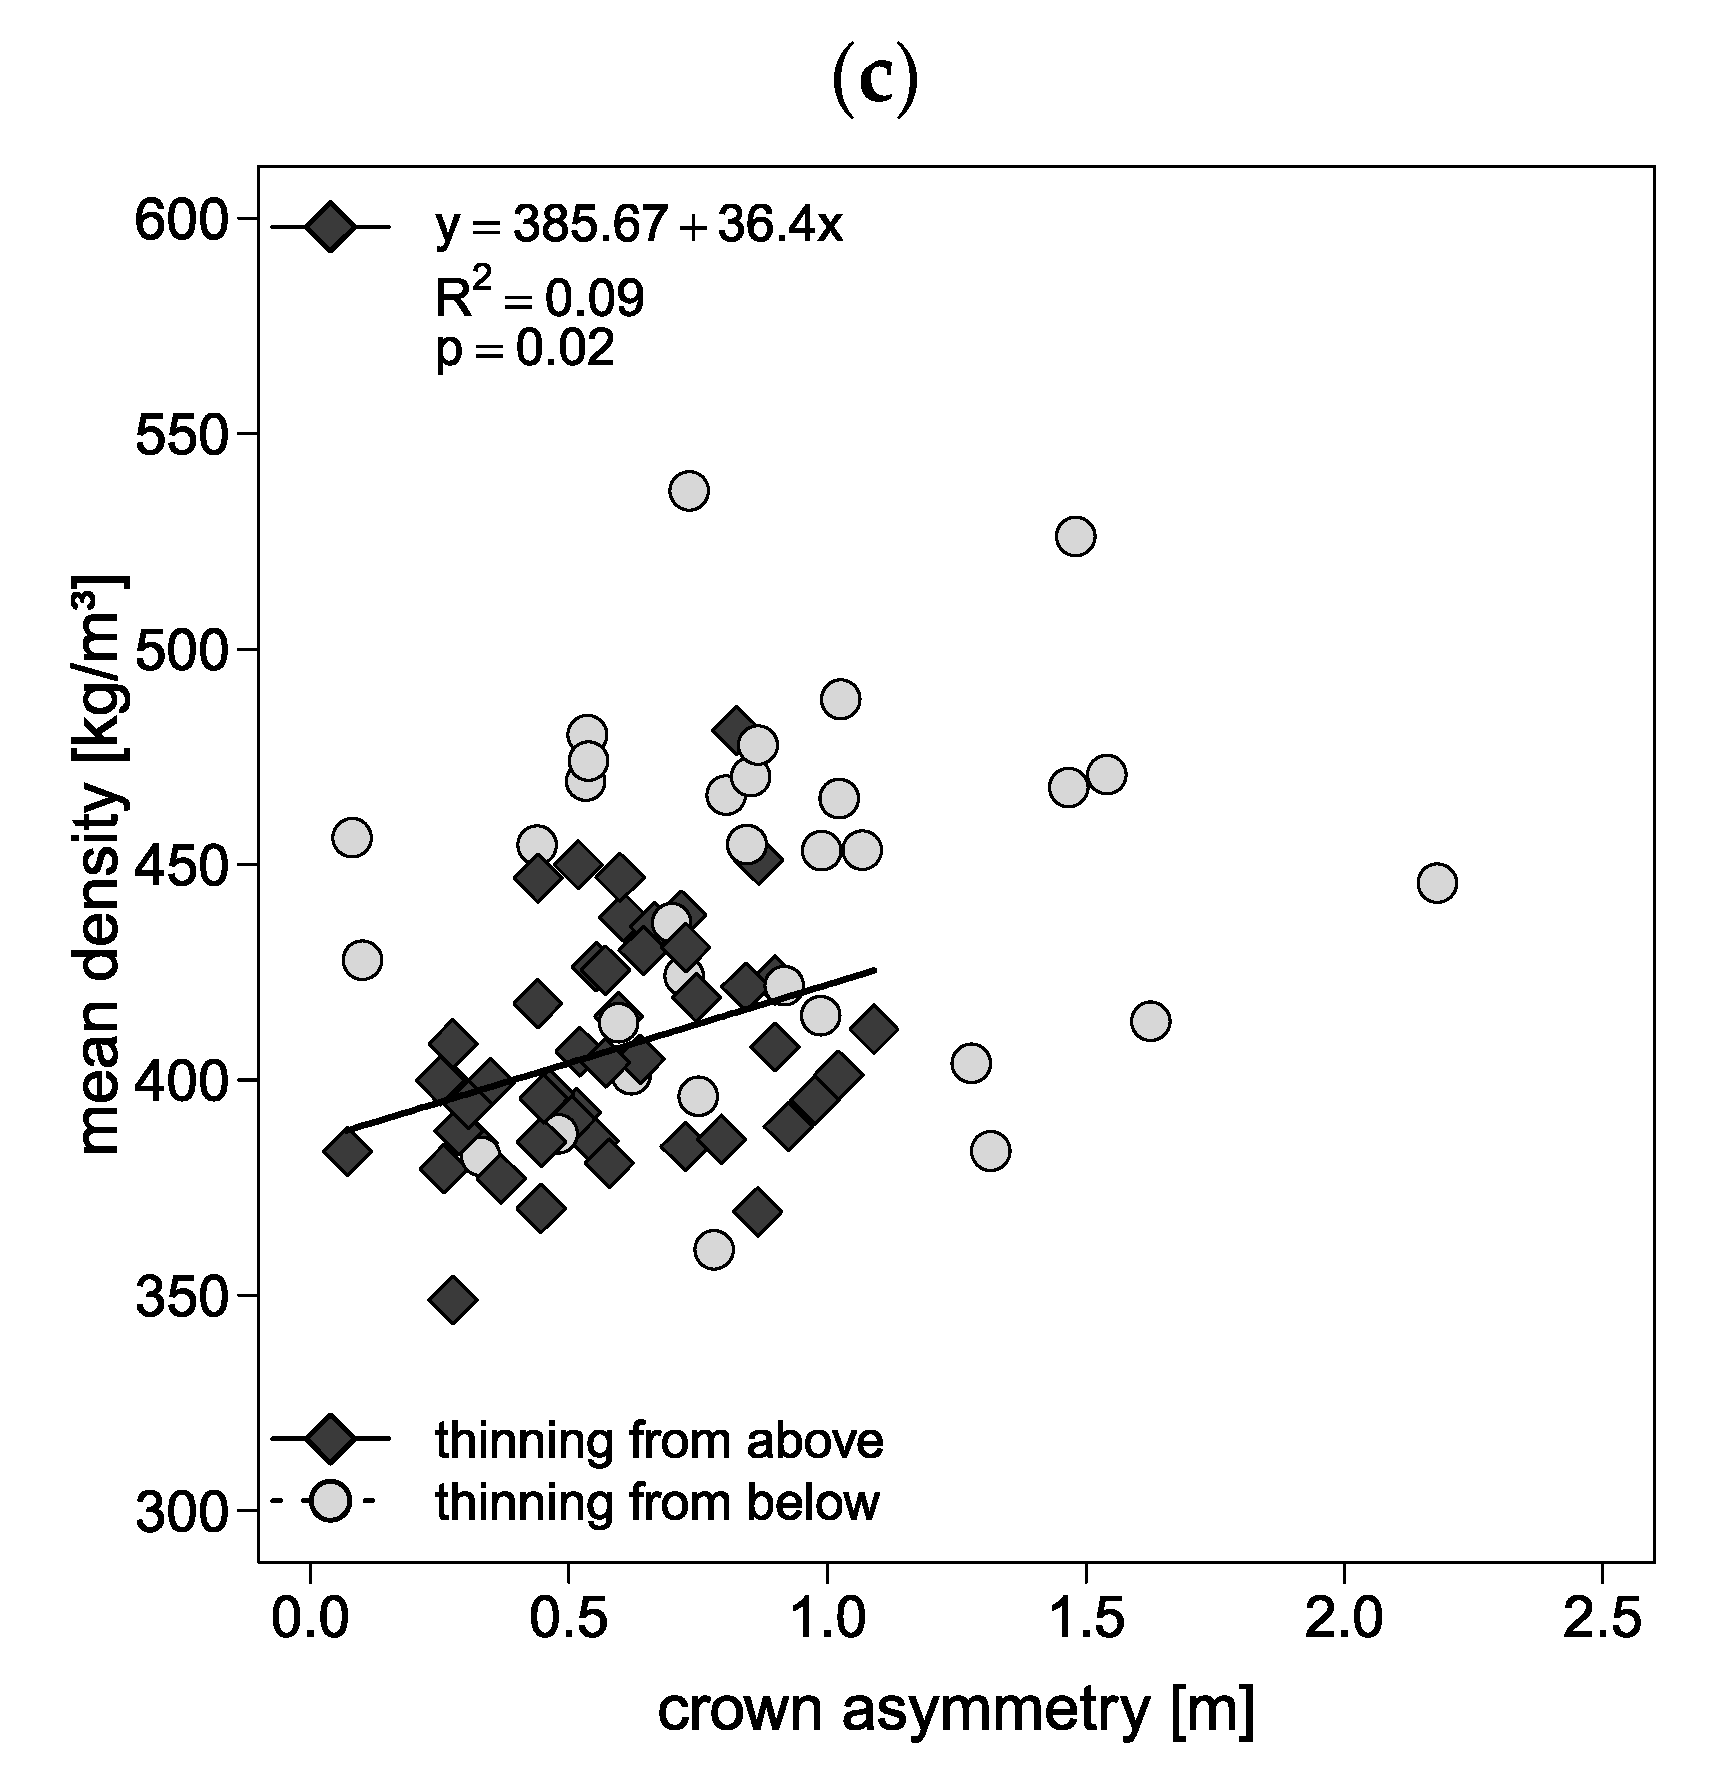
3.4. Relationship between Tree Morphology and Mean Density

Mean density (at CBH) was significantly influenced by DBH (Figure 9a), h/d ratio (Figure 9b), and crown asymmetry (Figure 9c). With increasing DBH, mean density decreased significantly for trees of both silvicultural treatments (Figure 9a): The mean density of trees from stands that were thinned from below, decreased by 2.8 kg·m−3 with increasing DBH and by 1.0 kg·m−3 for trees from stands that were thinned from above. Furthermore, TFB led to higher mean densities (intercept = 546.4 kg·m−3) compared to TFA (intercept = 439.1 kg·m−3).
Additionally, mean density increased with increasing h/d ratio for both silvicultural treatments (Figure 9b). Mean density increased by 0.7 kg·m−3 (TFA) and by 1.2 kg·m−3 (TFB). The intercept was higher for trees from stands that were thinned from below (351.9 kg·m−3) compared to the intercept for trees from stands that were thinned from above (348.2 kg·m−3). An increase in the h/d ratio of 10 corresponded to an increase in mean density of about 6.8 kg·m−3.
The morphological attribute crown asymmetry only significantly influenced mean density for trees thinned from above (Figure 9c); with increasing crown asymmetry, mean density increased by 36.4 kg·m−3. The crown asymmetry of trees from stands that were thinned from below was more scattered (standard deviation: ±0.7 m) compared to the crown asymmetry of trees from stands that were thinned from above (standard deviation: ± 0.4 m). In the studied trees growing in a stand managed with thinning from above, we found 1 m of crown asymmetry to correspond to an increase in mean density of about 36.4 kg·m−3.

4. Discussion

Wood density is one of the most important properties of wood for industrial use and is frequently used as an indicator for timber quality [39]. According to earlier studies, wood density is, among other factors, influenced by the growth rate of a tree, which in turn is controlled by environmental conditions [40,41,42]. Hence, with increasing growth rate, the proportion of earlywood increases more than the latewood proportion (for conifers only, [12,43]), and since earlywood of coniferous timber generally has a lower density than latewood, a higher growth rate of a tree thus reduces wood density [13]. This is in accordance with the findings of the present case study, as a decrease in mean density was observed with increasing mean ring width. Also, the share of rejected boards due to growth rate-related criteria increased with increasing mean ring width as expected. Trees from stands that were thinned from below had a higher mean density compared to trees from stands that were thinned from above. This is consistent with, e.g., Pape [44,45] and Lindström [46], who stated that forest management practices, such as regulating stand density, directly affect wood density by changing the environmental factors that influence crown development and thus tree growth. In our case study, trees from stands that were thinned from above had wider crowns and lower crown base heights than trees from stands that were thinned from below.
The regulation of tree growth with silvicultural treatments (thinning, fertilizing) can thus control wood density and timber quality [13,41,44,47,48]. For example, Pretzsch and Rais [41] explained that the crown links tree growth with timber quality while Mäkinen and Isomäki [47] stated that regulating stand density through silvicultural treatments has been the primary method of controlling growth of trees and thus enhancing timber quality. Against this background, the regulation of stand density is an effective silvicultural tool to control competition [49] and thus tree growth, crown and branch development, and finally timber quality [20,50]. In our stands with low crown space availability due to TFB (plots 3 and 5), we clearly observed that the competition-induced reduced crown development reduced mean ring width and thereby increased mean density and bending strength. This finding is in accordance with earlier studies (e.g., [41]), explaining that trees in forests with limited growing space have higher wood density compared to trees growing in widely spaced and heavily thinned stands. Furthermore, for equal mean ring widths, the wood from trees from stands that were thinned from below nonetheless had a higher mean density than the wood from trees from stands that were thinned from above. We hypothesize that this may be a predetermined growth pattern that is established at an early age and does not change in later years. This would be analogous to Dutilleul et al. [25], who reported a negative relationship between wood density and ring width for slow-grown Norway spruce trees. Dutilleul et al. [25] thus suggested a preconditioning of this relationship already before the first thinning, together with a difference in this relationship between trees that are genetically predisposed to grow faster than others. Here, anatomical studies of the cell wall structure or the latewood proportion might provide possible insights and will be the focus of future studies.
According to studies by, e.g., Jyske et al. [51], wood density increases with increasing log height. Similarly, it was found in this study that mean density for trees from stands thinned from above was higher at CBH than at DBH. However, for stands that were thinned from below, mean density was shown to be slightly lower at CBH. It is suspected that the increase in density at higher stem heights may be related to low precipitation influenced by climate change. Due to low precipitation, the early wood content in juvenile wood, which is predominant in conifers at higher stem heights, becomes smaller. Since juvenile wood in particular is characterized by age-related wider growth rings compared to mature wood, as well as a significantly larger proportion of earlywood containing primarily water-conduction tracheids [52,53], it seems reasonable to assume that lower precipitation is likely to reduce the proportion of earlywood. Consequently, the proportion of latewood would increase, which largely determines the density in the growth ring. Although juvenile wood is also present at lower stem heights, which influences the mean density, this wood has never been exposed to the lower precipitation. Even though mean density was higher for equal mean ring width in wood from trees in stands that were thinned from below in this case study, the mean density of these trees also decreased more with increasing tree height compared to wood from trees from stands that were thinned from above. The gain in timber quality is thus lost with increasing tree height, and the most valuable part of the logs is still in the first few meters (value timber production of conifers is usually limited to the lower half of the stem and can contain up to 80% of the timber value [54,55]). In case of, e.g., heavy browsing, peeling, or damages through harvesting operations, this would lead to extreme financial losses, as the first three and sometimes even six meters are unusable.
Based on the three-dimensional data from the laser scanning approach, relationships between morphological measures of the trees and wood properties were also observed. Positive relationships between both, h/d ratio and crown asymmetry and the corresponding mean density of the trees were found. For the positive relationship between mean density and crown asymmetry, the formation of compression wood as compensation in areas of uneven crown formation (branch- and wind-related) [56] would be a possible explanation, as compression wood has a higher density, bending, and compressive strength compared to normal wood [14]. Although compression wood was observed on the boards in this case study, it did not significantly affect bending strength of the examined boards of the lower sections (up to a height of 6.7 m). Therefore, we argue that both increased crown asymmetry [33] and an increased h/d ratio are indicators for competitive pressure and hence relate to reduced growth ring width. Therefore, trees showing high crown asymmetry or high h/d ratios do have higher mean densities than trees growing with more canopy space available. This is an important finding from a silvicultural point of view, as forestry has so far used other variables such as stocking density, DBH, or crown length for silvicultural decisions. Until now, the h/d ratio was mainly an indicator for the stability of a tree. The present results suggest that the h/d ratio is also a good indicator of timber quality.
With regard to the morphological measures number of first-order branches or the number of branches greater than four cm, no significant correlation was found with mean density. This result differs from studies by, e.g., Osborne and Maguire [57] or Richter [56], stating that branch diameter and thus knots affect several properties of wood (strength, stiffness, swelling, shrinkage) due to deviations in the anatomical structure and should hence affect mean density. Although the branch diameter is the most important factor for quality grading of coniferous timber [58], it did not influence mean density in this case study. The values for the morphological properties of branches of first order or branches greater than four cm affected the visual grading criteria single knot or knot cluster only weakly (correlation coefficient 0.2). This can be explained by growth dynamics at different ages. As the lower parts of the logs were used for the production of timber to emulate realistic timber acquisition, we can assume that the current state of crown anatomy is representative for branch characteristics in the tree’s youth only to a certain degree. The remaining investigated morphological properties (e.g., lean) were also not significantly correlated with mean density, which is probably due to the low degree of variability among these properties in our dataset.
The lack of significant differences in the measured bending strengths (MoR) between the grading classes is of concern from a technical point of view. Based on the present results, the origin and silvicultural treatment of the raw timber had a stronger predictive power for the achievable bending strengths than the classification according to visual criteria. Comparable rejection ratios were found by Burawska-Kupniewska et al. [59] in a study on the effectiveness of grading processes dependent of log type, resulting in 3.3% rejects by machine grading and 42.7% rejects by the visual process. Though the sawn timber product standard EN 14081 [60] demands a validated characterization of sawn timber for each different origin with regard to silvicultural treatment, the results of this case study show that differences in mechanical properties can differ even on the smallest scale. This holds especially true for the comparison of plots 2 and 3, which are adjacent but differ significantly with regard to their silvicultural treatment and their measured properties. These results suggest that a significant proportion of visually graded sawn timber is not graded accordingly to its potential [61,62]. Both the bending strength and visual characteristics of plot 6 performed poorly compared to the other plots. Thus, the silvicultural treatment (thinning from above, mean CBH was 6.2 m) of plot 6 should be critically questioned, as 62% of the boards were rejected. It can also be noted that spruce of about 80 years produced less board rejects compared to spruce of about 40 years. This was mainly related to the clustering of branches in the investigated lower stem area, which were more widely distributed in the stem cross-section for larger stem diameters. Longer rotation periods seem to be preferable for the production of the visually highest quality assortments. Regarding the mechanical quality, the coefficient of determination between density and tree anatomy of up to 0.59 is comparable to the results of Llana et al. [63] that achieved 0.59 for MoE prediction by velocity and 0.48 for the prediction of MoR. Russo et al. [64] have found that the dynamic MoE was highest in stands of low and medium intensity thinning while no thinning or high intensity thinning resulted in lower wave velocities. This is in accordance with the results of this study and additionally taking the deductions of Pretzsch [65] regarding the total yield of different thinning intensities into account, a low to medium intensity thinning strategy seems advisable.

5. Conclusions

This case study confirmed earlier findings that identified a relationship between silvicultural management regimes in pure spruce stands and the corresponding wood density of trees growing in these stands. Although many of the results of this case study confirm well-known relationships, the limited sample size of 100 trees at six study sites in two regions only justifies the term of case study, for which an upscaling of the results remains limited. Furthermore, possible causes for some of the observed results remain unclear due to the lack of replications. Nevertheless, we assume that the investigated trees appear to follow a growing pattern and retain their wood anatomical structures despite changes of forest management. Spruce trees from stands that were thinned from below at young ages still showed higher wood densities when thinned more intensively at a higher age compared to spruces with the same annual ring widths but larger growing space at a young age. With wood density being an important property of timber intended to be used for construction, i.e., in a load-bearing function and not just as cladding or for palettes, the results for density, MoR, and MoE may contribute to an optimization of the management of spruce and other coniferous species by serving as model references. Especially with regard to the conversion of pure coniferous stands to site-adapted mixed stands, these results may be beneficial to the production of high quality coniferous timber in the future. Additionally, we identified two morphological measures, namely the h/d ratio as well as the extent of crown asymmetry, as proxies for wood density, which may serve as helpful indicators for practical field work. While crown asymmetry is difficult to measure in the field, it would be an interesting topic for future studies to investigate the h/d ratio at which the wood quality suffers exceedingly in order to then take this into account as a recommendation for silvicultural decisions. In addition, the possibility to assess the potential quality of stands in a non-destructive manner on standing trees would provide a tool to accurately price and distribute wood resources according to mechanical quality [66,67].
The results of the technological tests clearly suggest that it could be beneficial to change the grading criteria for a strength-oriented classification of structural timber. No significant correlation was found for the grading criterion compression wood to bending strength (r² = 0.04), which can, however, be decisive for bonding and dimensional stability. For a combined model, a fast way to measure the wood density is needed, considering the aforementioned relationship between growth ring width, density, and management style, which for a visual grading system seems hardly possible. Incorporating the h/d ratio, which showed significant correlation to the MoR into a holistic prediction model, seems appropriate but would require the transfer of trackable data from forestry to processor. Currently, provenance (as expressed by SC) and management system seem to be the best predictors. In further investigations, the correlations will be verified by means of multiple regression and also investigated for the final glulam product.

Supplementary Materials

The following supporting information can be downloaded at: https://0-www-mdpi-com.brum.beds.ac.uk/article/10.3390/f13111910/s1, Figure S1: Image of an exemplary measuring cross for the tree ring analysis carried out with LINTAB TM 6 annual ring measuring device from Rinntech (Rinntech-Metriwerk GmbH & Co. KG, Heidelberg, Germany); Figure S2: Image of an exemplary density sample for the radiometric density profile generated using a ‘Density Analyzer X-ray’ (DAX 6000, Fagus-GreCon Greten GmbH & Co. KG, Alfeld, Germany).

Author Contributions

Conceptualization, B.K. and D.S.; methodology, D.S., K.H. and T.K.; software, D.S., K.H. and T.K.; validation, B.K., D.B., D.S., K.H., M.E. and T.K.; formal analysis, K.H. and T.K.; investigation, K.H. and T.K.; resources, B.K., D.B. and D.S.; data curation, K.H. and T.K.; writing—original draft preparation, K.H.; writing—review and editing, B.K., D.B., D.S., J.M., K.H., M.E. and T.K.; visualization, K.H. and T.K.; supervision, B.K., D.B. and D.S.; project administration, B.K.; funding acquisition, B.K., D.B. and D.S. All authors have read and agreed to the published version of the manuscript.

Funding

This research was funded by Fachagentur Nachwachsende Rohstoffe e. V. (FNR), promoted by the Federal Ministry of Food and Agriculture (grant numbers 22WK314901 and 22WK314903).

Data Availability Statement

The datasets generated during and/or analyzed during the current case study are available from the corresponding author on reasonable request with permission of Fachagentur Nachwachsende Rohstoffe e. V.

Acknowledgments

We thank the district foresters Frank Bösser (forest office Breidenbacher Grund) and Dirk Vodegel (forest office Lilienberg) for providing access to the sample trees and supporting field work. Furthermore, we thank Richard Deetz for assisting density measurements and Jan Krömer for conducting density measurements. The authors address special thanks to Martin Thren for helpful comments on study design and field work as well as for assisting in sample tree selection. Lastly, we would like to thank Carolin Kroneberger for supporting field work, data acquisition, and for her constructive and helpful comments.

Conflicts of Interest

The authors declare no conflict of interest. The funders had no role in the design of the study; in the collection, analyses, or interpretation of data; in the writing of the manuscript; or in the decision to publish the results.

References

  1. IPCC. Summary for Policymakers. In Climate Change and Land: An IPCC Special Report on Climate Change, Desertification, Land Degradation, Sustainable Land Management, Food Security, and Greenhouse Gas Fluxes in Terrestrial Ecosystems; Shukla, P.R., Skea, J., Buendia, E.C., Masson-Delmotte, V., Pörtner, H.-O., Roberts, D.C., Zhai, P., Slade, R., Connors, S., van Diemen, R., et al., Eds.; IPCC: Geneva, Switzerland, 2019; Available online: https://www.ipcc.ch/srccl/ (accessed on 26 September 2022).
  2. BMEL. Deutschlands Wald im Klimawandel-Eckpunkte und Maßnahmen: Diskussionspapier zum Nationalen Waldgipfel. 25 September 2019. Available online: https://www.bmel.de/SharedDocs/Downloads/DE/Broschueren/waldgipfel-2019-diskussionspapier.html (accessed on 28 January 2021).
  3. Schuldt, B.; Buras, A.; Arend, M.; Vitasse, Y.; Beierkuhnlein, C.; Damm, A.; Gharun, M.; Grams, T.E.; Hauck, M.; Hajek, P.; et al. A first assessment of the impact of the extreme 2018 summer drought on Central European forests. Basic Appl. Ecol. 2020, 45, 86–103. [Google Scholar] [CrossRef]
  4. Spiecker, H. (Ed.) Growth of Norway Spruce (Picea abies [L.] Karst.) under Changing Environmental Conditions in Europe. In Spruce Monocultures in Central Europe. Problems and Prospects; European Forest Institute: Joensuu, Finland, 2000. [Google Scholar]
  5. Spiecker, H. Silvicultural management in maintaining biodiversity and resistance of forests in Europe—Temperate zone. J. Environ. Manag. 2003, 67, 55–65. [Google Scholar] [CrossRef]
  6. von Lüpke, B.; Ammer, C.; Braciamacchie, M.; Brunner, A.; Ceitel, J.; Collet, C.; Deu-leuze, C.; Di Placido, J.; Huss, J.; Jankovic, J.; et al. Silvicultural strategies for conversion. In Norway Spruce Conversion—Options and Consequences; Spiecker, H., Hansen, J., Klimo, E., Skovsgaard, J., Sterba, H., von Teuffel, K., Eds.; Brill: Leiden, The Netherlands; Boston, MA, USA, 2004; pp. 121–164. [Google Scholar]
  7. Ammer, C.; Bickel, E.; Kölling, C. Converting Norway spruce stands with beech–a review of arguments and techniques. Austrian J. For. Sci. 2008, 125, 3–26. [Google Scholar]
  8. Röhrig, E.; Bartsch, N.; Lüpke, B.V. Waldbau auf Ökologischer Grundlage, 7; Vollständig Aktualisierte, Auflage; Ulmer: Stuttgart, Germany, 2006; ISBN 3800145952. [Google Scholar]
  9. Seifert, T.; Breibeck, J.; Nickel, M.; Klemmt, H.J.; Pretzsch, H. Holzeigenschaften der Fichte bei unterschiedlicher Bestandesdichte. AFZ-Der. Wald. 2009, 2, 89–91. [Google Scholar]
  10. Bartsch, N.; von Lüpke, B.; Röhrig, E. Waldbau auf ökologischer Grundlage, 8; Vollständig Überarbeitete und Erweiterte Auflage; Eugen Ulmer KG: Stuttgart, Germany, 2020; ISBN 978-3-8385-8754-7. [Google Scholar]
  11. Beinhofer, B. Weitständig erzogene Nadelholzbestände–eine lukrative Alternative? Allg. Forst-Und Jagdzeitung. 2009, 180, 65–75. [Google Scholar]
  12. Kollmann, F.F.P.; Côté, W.A. Solid wood. In Principles of Wood Science and Technology; Springer: Tokyo, Japan, 1984; Volume 1, p. 180. [Google Scholar]
  13. Mäkinen, H.; Saranpää, P.; Linder, S. Wood-density variation of Norway spruce in relation to nutrient optimization and fibre dimensions. Can. J. For. Res. 2002, 32, 185–194. [Google Scholar] [CrossRef]
  14. Niemz, P.; Sonderegger, W. Holzphysik: Physik des Holzes und der Holzwerkstoffe; Carl Hanser Verlag GmbH Co KG: München, Germany, 2017; ISBN 3446445463. [Google Scholar]
  15. 4074-1:2012-06; Sortierung von Holz nach der Tragfähigkeit-Teil 1: Nadelschnittholz. Beuth Verlag GmbH: Berlin, Germany, 2012.
  16. 338:2016-07; Bauholz für tragende Zwecke-Festigkeitsklassen: Deutsche Fassung EN 338:2016. Beuth Verlag GmbH: Berlin, Germany, 2016.
  17. Ammer, C. Diversity and forest productivity in a changing climate. New Phytol. 2019, 221, 50–66. [Google Scholar] [CrossRef] [Green Version]
  18. Metz, J.; Seidel, D.; Schall, P.; Scheffer, D.; Schulze, E.-D.; Ammer, C. Crown modeling by terrestrial laser scanning as an approach to assess the effect of aboveground intra- and interspecific competition on tree growth. For. Ecol. Manag. 2013, 310, 275–288. [Google Scholar] [CrossRef]
  19. Liang, X.; Kankare, V.; Hyyppä, J.; Wang, Y.; Kukko, A.; Haggrén, H.; Yu, X.; Kaartinen, H.; Jaakkola, A.; Guan, F.; et al. Terrestrial laser scanning in forest inventories. ISPRS J. Photogramm. Remote Sens. 2016, 115, 63–77. [Google Scholar] [CrossRef]
  20. Höwler, K.; Annighöfer, P.; Ammer, C.; Seidel, D. Competition improves quality-related external stem characteristics of Fagus sylvatica. Can. J. For. Res. 2017, 47, 1603–1613. [Google Scholar] [CrossRef]
  21. Stal, C.; Verbeurgt, J.; de Sloover, L.; de Wulf, A. Assessment of handheld mobile terrestrial laser scanning for estimating tree parameters. J. For. Res. 2021, 32, 1503–1513. [Google Scholar] [CrossRef]
  22. Heidenreich, M.G.; Seidel, D. Assessing Forest Vitality and Forest Structure Using 3D Data: A Case Study From the Hainich National Park, Germany. Front. For. Glob. Chang. 2022, 5, 929106. [Google Scholar] [CrossRef]
  23. Neudam, L.; Annighöfer, P.; Seidel, D. Exploring the Potential of Mobile Laser Scanning to Quantify Forest Structural Complexity. Front. Remote Sens. 2022, 3. [Google Scholar] [CrossRef]
  24. Grammel, R. Zusammenhänge zwischen Wachstumsbedingungen und holztechnologischen Eigenschaften der Fichte. Eur. J. For. Res. 1990, 109, 119–129. [Google Scholar] [CrossRef]
  25. Dutilleul, P.; Herman, M.; Avella-Shaw, T. Growth rate effects on correlations among ring width, wood density, and mean tracheid length in Norway spruce (Picea abies). Can. J. For. Res. 1998, 28, 56–68. [Google Scholar] [CrossRef]
  26. Kraft, G. Beiträge zur Lehre von den Durchforstungen, Schlagstellungen und Lichtungshieben; Verlag Klindworth: Hannover, Germany, 1884. [Google Scholar]
  27. DWD. Climate Data Center. Available online: https://cdc.dwd.de/portal/ (accessed on 26 September 2022).
  28. DWD. Nutzung klimatologischer Referenzperioden ab 2021. Available online: https://www.dwd.de/DE/leistungen/besondereereignisse/verschiedenes/20210119_neue_referenzperiode.html (accessed on 27 October 2022).
  29. Williamson, G.B.; Wiemann, M.C. Measuring wood specific gravity…Correctly. Am. J. Bot. 2010, 97, 519–524. [Google Scholar] [CrossRef] [Green Version]
  30. 408:2022-10; Holzbauwerke-Bauholz für Tragende Zwecke und Brettschichtholz-Bestimmung Einiger Physikalischer Und Mechanischer Eigenschaften: Deutsche Fassung EN 408:2010 +A1:2012. Beuth Verlag GmbH: Berlin, Germany, 2012.
  31. Piboule, A.; Krebs, M.; Esclatine, L.; Hervé, J.C. (Eds.) Computree: A collaborative platform for use of terrestrial lidar in dendrometry. In Proceedings of the International IUFRO Conference MeMoWood, Nancy, France, 1–4 October 2013. [Google Scholar]
  32. Burkardt, K.; Annighöfer, P.; Seidel, D.; Ammer, C.; Vor, T. Intraspecific Competition Affects Crown and Stem Characteristics of Non-Native Quercus rubra L. Stands in Germany. Forests 2019, 10, 846. [Google Scholar] [CrossRef] [Green Version]
  33. Seidel, D.; Leuschner, C.; Müller, A.; Krause, B. Crown plasticity in mixed forests—Quantifying asymmetry as a measure of competition using terrestrial laser scanning. For. Ecol. Manag. 2011, 261, 2123–2132. [Google Scholar] [CrossRef]
  34. Seidel, D.; Schall, P.; Gille, M.; Ammer, C. Relationship between tree growth and physical dimensions of Fagus sylvatica crowns assessed from terrestrial laser scanning. Iforest-Biogeosci. For. 2015, 8, 735–742. [Google Scholar] [CrossRef]
  35. Juchheim, J.; Annighöfer, P.; Ammer, C.; Calders, K.; Raumonen, P.; Seidel, D. How management intensity and neighborhood composition affect the structure of beech (Fagus sylvatica L.) trees. Trees 2017, 31, 1723–1735. [Google Scholar] [CrossRef]
  36. R Core Team. R: A Language and Environment for Statistical Computing; The R Foundation: Vienna, Austria, 2021; Available online: https://www.R-project.org/ (accessed on 26 September 2022).
  37. OriginLab Corporation. OriginPro, Distributor for Germany, Switzerland, Austria and Liechtenstein: Northampton, MA, USA; Additive GmbH: Friedrichsdorf, Germany, 2021.
  38. Bates, D.; Mächler, M.; Bolker, B.; Walker, S. Fitting Linear Mixed-Effects Models Using lme4. arXiv 2014, arXiv:1406.5823. [Google Scholar] [CrossRef]
  39. Lindström, H. Basic density in Norway spruce. Part, I. A literature review. Wood Fiber Sci. 1996, 28, 15–27. [Google Scholar]
  40. Jaakkola, T.; Mäkinen, H.; Saranpää, P. Wood density of Norway spruce: Responses to timing and intensity of first commercial thinning and fertilisation. For. Ecol. Manag. 2006, 237, 513–521. [Google Scholar] [CrossRef]
  41. Pretzsch, H.; Rais, A. Wood quality in complex forests versus even-aged monocultures: Review and perspectives. Wood Sci. Technol. 2016, 50, 845–880. [Google Scholar] [CrossRef]
  42. Krajnc, L.; Farrelly, N.; Harte, A.M. The effect of thinning on mechanical properties of Douglas fir, Norway spruce, and Sitka spruce. Ann. For. Sci. 2019, 76, 3. [Google Scholar] [CrossRef] [Green Version]
  43. Brüchert, F.; Becker, G.; Speck, T. The mechanics of Norway spruce [Picea abies (L.) Karst]: Mechanical properties of standing trees from different thinning regimes. For. Ecol. Manag. 2000, 135, 45–62. [Google Scholar] [CrossRef]
  44. Pape, R. Effects of Thinning Regime on the Wood Properties and Stem Quality of Picea abies. Scand. J. For. Res. 1999, 14, 38–50. [Google Scholar] [CrossRef]
  45. Pape, R. Influence of Thinning and Tree Diameter Class on the Development of Basic Density and Annual Ring Width in Picea abies. Scand. J. For. Res. 1999, 14, 27–37. [Google Scholar] [CrossRef]
  46. Lindström, H. Basic density in Norway spruce, Part III. Development from pith outwards. Wood Fiber Sci. 1996, 28, 391–405. [Google Scholar]
  47. Mäkinen, H.; Isomäki, A. Thinning intensity and growth of Norway spruce stands in Finland. Forestry 2004, 77, 349–364. [Google Scholar] [CrossRef] [Green Version]
  48. Jaakkola, T.; Mäkinen, H.; Saranpää, P. Wood density in Norway spruce: Changes with thinning intensity and tree age. Can. J. For. Res. 2005, 35, 1767–1778. [Google Scholar] [CrossRef]
  49. Pretzsch, H. (Ed.) Forest Dynamics, Growth and Yield; Springer: Berlin/Heidelberg, Germany, 2009; ISBN 978-3-540-88306-7. [Google Scholar]
  50. Hein, S. Knot attributes and occlusion of naturally pruned branches of Fagus sylvatica. For. Ecol. Manag. 2008, 256, 2046–2057. [Google Scholar] [CrossRef]
  51. Jyske, T.; Mäkinen, H.; Saranpää, P. Wood density within Norway spruce stems. Silva Fenn. 2008, 42, 439–455. [Google Scholar] [CrossRef] [Green Version]
  52. Knigge, W. Untersuchungen ueber die Beziehungen zwischen Holzeigenschaften und Wuchs der Gastbaumart Douglasie (Pseudotsuga taxifolia Britt.). In Schriftenreihe der Forstlichen Fakultaet der Universitaet Goettingen und Mitteilungen der Niedersaechsischen Forstlichen Versuchsanstalt (Bd. 20); J. D. Sauerländer’s Verlag, Frankfurt am Main: Bad Orb, Germany, 1958. [Google Scholar]
  53. Sauter, U. Technologische Holzeigenschaften der Douglasie (Pseudotsuga Menziesii (Mirb.) Franco) Als Ausprägung Unterschiedlicher Wachstumsbedingungen. Ph.D. Thesis. 1992. Available online: https://hal.archives-ouvertes.fr/hal-00981419 (accessed on 26 September 2022).
  54. Bachmann, P. Wirtschaftliche Überlegungen zur Waldpflege. Hespa Mitt. 1970, 20, 1–24. [Google Scholar]
  55. Kint, V.; Hein, S.; Campioli, M.; Muys, B. Modelling self-pruning and branch attributes for young Quercus robur L. and Fagus sylvatica L. trees. For. Ecol. Manag. 2010, 260, 2023–2034. [Google Scholar]
  56. Richter, C. Holzmerkmale der Bäume: Beschreibung der Merkmale, Ursachen, Vermeidung, Auswirkungen auf die Verwendung des Holzes, Technologische Anpassung, 1; Auflage; DRW-Verlag: Leinfelden-Echterdingen, Germany, 2019; ISBN 3871819352. [Google Scholar]
  57. Osborne, N.L.; Maguire, D.A. Modeling knot geometry from branch angles in Douglas-fir (Pseudotsuga menziesii). Can. J. For. Res. 2016, 46, 215–224. [Google Scholar] [CrossRef] [Green Version]
  58. 1927-1:2008-06; Qualitäts-Sortierung von Nadel-Rundholz-Teil 1: Fichten und Tannen: Deutsche Fassung EN 1927-1:2008. Beuth Verlag GmbH: Berlin, Germany, 2008.
  59. Burawska-Kupniewska, I.; Krzosek, S.; Mańkowski, P. Efficiency of Visual and Machine Strength Grading of Sawn Timber with Respect to Log Type. Forests 2021, 12, 1467. [Google Scholar] [CrossRef]
  60. 14081-1:2016+A1:2019; Holzbauwerke-Nach Festigkeit sortiertes Bauholz für tragende Zwecke mit rechteckigem Querschnitt: Teil 1: Allgemeine Anforderungen; Deutsche Fassung EN. Beuth Verlag GmbH: Berlin, Germany, 2019.
  61. Kessel, M.H.; Sandoz, J.L. Zur Effizienz der Festigkeitssortierung von Fichtenkantholz. Eur. J. Wood Prod. 1989, 47, 323–327. [Google Scholar] [CrossRef]
  62. Hecker, M.; Ressmann, J.; Becker, G.; Merforth, C. Prognose der Schnittholz-Qualität auf der Grundlage der Rundholz-Sortierung. Eur. J. Wood Prod. 2000, 58, 168–176. [Google Scholar] [CrossRef]
  63. Llana, D.F.; Short, I.; Harte, A.M. Use of non-destructive test methods on Irish hardwood standing trees and small-diameter round timber for prediction of mechanical properties. Ann. For. Sci. 2020, 77, 62. [Google Scholar] [CrossRef]
  64. Russo, D.; Marziliano, P.A.; Macri, G.; Proto, A.R.; Zimbalatti, G.; Lombardi, F. Does Thinning Intensity Affect Wood Quality? An Analysis of Calabrian Pine in Southern Italy Using a Non-Destructive Acoustic Method. Forests 2019, 10, 303. [Google Scholar] [CrossRef] [Green Version]
  65. Pretzsch, H. Density and growth of forest stands revisited. Effect of the temporal scale of observation, site quality, and thinning. For. Ecol. Manag. 2020, 460, 117879. [Google Scholar] [CrossRef]
  66. Kankare, V.; Joensuu, M.; Vauhkonen, J.; Holopainen, M.; Tanhuanpää, T.; Vastaranta, M.; Hyyppä, J.; Hyyppä, H.; Alho, P.; Rikala, J.; et al. Estimation of the Timber Quality of Scots Pine with Terrestrial Laser Scanning. Forests 2014, 5, 1879–1895. [Google Scholar] [CrossRef] [Green Version]
  67. Höwler, K.; Vor, T.; Seidel, D.; Annighöfer, P.; Ammer, C. Analyzing effects of intra-and interspecific competition on timber quality attributes of Fagus sylvatica L.—From quality assessments on standing trees to sawn boards. Eur. J. For. Res. 2019, 138, 327–343. [Google Scholar] [CrossRef]
Figure 1. Shown are 10 exemplary Norway spruce trees with the corresponding trajectory consisting of two concentric circles per sample tree. Colors indicate passing minutes; the unit is equal to meter.
Forests 13 01910 g001
Figure 2. Point clouds of randomly selected individual Norway spruce trees as seen from the side (from left to right: P2–P6 with P = plot). The unit is equal to meter.
Forests 13 01910 g002
Figure 3. Range of mean ring width [1/100 mm] at (a) DBH and at (b) CBH for the investigated five plots with different silvicultural treatment (light gray: TFA, dark gray: TFB; hatched: age group 40, not hatched: age group 80). Letters (a–d) indicate significant differences between the plots at p < 0.05 (non-parametric, Kruskal–Wallis test with Bonferroni correction).
Forests 13 01910 g003
Figure 4. Range of mean density [kg·m−3] at DBH (a) and at CBH (b) for the investigated five plots with different silvicultural treatment (light gray: TFA, dark gray: TFB; hatched: age group 40, not hatched: age group 80). Letters (a–c) indicate significant differences between the plots at p < 0.05 (non-parametric, Kruskal–Wallis test with Bonferroni correction).
Forests 13 01910 g004
Figure 5. Relationship between mean density and mean ring width at (a) DBH and at (b) CBH. The lines refer to the applied linear regression models showing significant relationships at p < 0.05. Please note: some density and ring width measurements are missing due to stem rot.
Forests 13 01910 g005
Figure 6. Distribution of the quality grading classes of spruce lamellae of plots 2 to 6. Visually sorted according to DIN 4074-1 [15].
Forests 13 01910 g006
Figure 7. Results of the on-edge four-point bending test following EN 408 [30] for plots 2 to 6. Normal distribution was assumed using the Shapiro–Wilk test with a significance level of p < 0.05. Assignment to significantly different groups ((a–c) at p < 0.05) by one-way ANOVA with Holm–Bonferroni correction.
Forests 13 01910 g007
Figure 8. Results of the on-edge four-point bending test in accordance with EN 408 [30] for plots 2 to 6. Normal distribution could be assumed, variance inhomogeneity led to determination of groups with a Games–Howell test.
Forests 13 01910 g008
Figure 9. Relationship between mean density (at CBH) and the tree morphology attributes (a) diameter at breast height (DBH), (b) height-to-diameter ratio (h/d ratio), and (c) crown asymmetry. Regression models were computed separately for plots with different silvicultural treatment (TFA and TFB). The lines refer to the applied linear regression models showing only significant relationships at p < 0.05.
Forests 13 01910 g009aForests 13 01910 g009b
Table 1. Description of the site conditions of the five study sites (P2–P6 with P = plot) from the forest districts Breidenbacher Grund and Lilienberg.
P2P3P4P5P6
226-2227 A11528a2226c1517b2
GPS-Coordinates
(Degrees, Minutes, Seconds)
50°52′31.39″ N 8°23′1.33″ E50°52′39.69″ N 8°23′25.71″ E51°43′01.0″ N
10°25′00.3″ E
51°43′03.7″ N 10°25′16.9″ E51°42′13.9″ N 10°25′18.4″ E
Site conditionAltitude above sea level450–490 m430–520 m551–600 m501–550 m551–600 m
Slope exposureN (≤36%)NW–W (≤36%)NSS
Soil conditionMesotrophicMesotrophicMesotrophicMesptrophicMesotrophic
Moisture conditionModerately freshModerately freshFreshFreshFresh
Annual average temp. 11961–1990 (7.7 °C); 1991–2020 (9.7 °C)
1961–1990 (902 mm); 1991–2020 (822 mm)
1961–1990 (5.9 °C); 1991–2020 (6.9 °C)
Annual total precipitation1961–1990 (1263 mm); 1991–2020 (1303 mm)
Stand descriptionShare [%]1001009590100
Area [ha]1.72.316.45.96.3
Tree speciesPCAB 4PCABPCABPCABPCAB
Age 24183808039
Dominant height [m] 30.829.318
Basal area [m²∙ha−1]34.137.237.128.335
MAImax 317.811.4121112
Sample tree informationMean height [m]25.329.833.828.220.5
Mean DBH [cm]28.532.346.342.428.6
Visually graded boards1329723117759
Mechanically tested boards1514442314
Thinning categoryTFA 5TFB 6TFATFBTFA
Thinning interventions [m3∙ha−1]2012 (67)2012 (71)2014 (2.9); 2018 (12.7)2014 (25.9)2014 (41.3)
1 The weather stations for P2 and P3 are located at Biedenkopf/Cölbe and for P4–P6 at Braunlage [27,28]; 2 Age: A stand of 40 years that had been TFB was unable to be studied as it was not a common practice and therefore no study site with this combination has been found; 3 MAI: mean annual increment; 4 PCAB: Picea abies (L.) H. Karst; 5 TFA: thinning from above; 6 TFB: thinning from below.
Table 2. Spearman’s rank correlation (ρ) and corresponding p value for the relationship between mean density [kg·m−3] and mean ring width [1/100 mm] and at DBH and at CBH.
Spearman’s Rank CorrelationMean Ring WidthMean Density
DBHCBHDBHCBH
mean ring widthDBHρ 0.937−0.754−0.634
p value <0.001<0.001<0.001
CBHρ −0.763−0.612
p value <0.001<0.001
mean densityDBHρ 0.754
p value <0.001
Table 3. Results of the linear mixed-effect models (diameter at breast height, DBH; crown base height, CBH) with mean density as response variable and mean ring width as explanatory variable. Given are the parameter estimates, standard error (SE), degrees of freedom (df), t-statistics (t-value), model significance (p-value), and marginal R² (R²m) and conditional R² (R²c).
Fixed EffectsEstimatesSEdft-Valuep-ValueR²mR²cRandom EffectVarianceSD
DBHIntercept500.9425.366419.75<0.0010.590.59SC 30.000.00
MRW 1−0.240.07 −3.280.002 Residual108132.87
TFB 249.4716.48 3.000.004
Age 80−2.9916.43 −0.180.86
CBHIntercept515.9219.708326.20<0.0010.470.47SC0.000.00
MRW−0.280.05 −5.63<0.001 Residual759.427.56
TFB29.439.40 3.130.002
Age 80−34.3010.21 −3.360.001
1 MRW: mean ring width; 2 TFB: thinning from below; 3 SC: site condition.
Publisher’s Note: MDPI stays neutral with regard to jurisdictional claims in published maps and institutional affiliations.

