Article

Chemical Elements Recorded by Quercus mongolica Fisch. ex Ledeb. Tree Rings Reveal Trends of Pollution History in Harbin, China

1
WSL, Swiss Federal Institute for Forest, Snow and Landscape Research, 8903 Birmensdorf, Switzerland
2
Department of Geography, University of Zurich, 8057 Zurich, Switzerland
3
Key Laboratory of Sustainable Forest Ecosystem Management, Ministry of Education, School of Forestry, Northeast Forestry University, Harbin 150040, China
4
Institute of Geochemistry and Petrology, ETH, 8092 Zurich, Switzerland
5
Department of Forest and Conservation Sciences, Faculty of Forestry, University of British Columbia, Vancouver, BC V6T 1Z4, Canada
*
Author to whom correspondence should be addressed.
Submission received: 22 December 2022 / Revised: 10 January 2023 / Accepted: 17 January 2023 / Published: 18 January 2023

Abstract

:
Rapid industrialization has led to a dramatic increase in air pollution. In China, the factors driving the abundance and composition of smog, particularly fine particulate matter, remain poorly understood, and short-term air pollution data are available from few air quality monitoring networks. Using laser ablation-inductively coupled plasma-mass spectrometry (LA-ICP-MS), chemical elements (Mg, Al, Si, S, K, Ca, Ti, Cr, Mn, Fe, Co, Ni, Cu, Zn, As, Sr, Tl, Pb, Bi) were analyzed in Quercus mongolica Fisch. ex Ledeb. tree rings from Harbin, China, in latewood at 5-year resolution over the period 1965–2020. The temporal trend of some elements was influenced by physiological factors, by environmental factors such as pollution, or influenced by both. Mg, K, Zn, Cu, Ni, Pb, As, Sr and Tl showed changes in pollution levels over time. The signal of K, Zn, Ni, Cu and Pb in trees from Harbin statistically did not differ from those at the control site after the 2000s. Our analysis confirmed the success of the undertaken emission reduction measures, which lead to an improvement in China’s urban air quality after 2010. However, As increased from 2000 to 2020 in Harbin which is consistent with rising As concentrations in China. Our study proved that dendrochemistry is a reliable tool to monitor the long-term history of pollution and to contribute to extending instrumental records of pollution back in time.

1. Introduction

Environmental pollution is of great societal concern due to the adverse effects on humans and environment that it is causing around the globe. Anthropogenic activities are the prime cause of pollution. Several pollutants are discharged into the waters, soils and atmosphere [1]. Pollution from heavy metal primarily occurs, for example, due to the mining of the metals, leaching of metals from different sources such as landfills, waste dumps, runoffs, and from vehicular traffic and roadwork. In rapidly industrializing regions of the world, such as China, during the past two decades, societal concern arose about air pollution and the occurrence and severity of single smog episodes in the main densely populated metropolitan areas. Rapid industrialization and urbanization in developing countries have led to a dramatic increase in air pollution, along a similar trajectory to that experienced during the 1950s by then-industrializing countries such as the United Kingdom or the USA. In China, industrialization has grown exponentially, and highly urbanized areas have played a leading role in the economic, technological and population growth of China over the past 15 years [2]. High anthropogenic emissions and fine particulate matter (PM2.5) concentrations in the air have dramatically increased. PM2.5 exposure peaked in 2012 at 52.8 µg m−3, primarily from industrial (31%) and residential (22%) emissions [3]. Although air pollution remains a major challenge at a national and regional scale, as the emission levels are still seven times above the World Health Organization’s (WHO) guidelines [3,4], in the last years, important measures to reduce emissions were taken by the Chinese government. Such emission reduction efforts significantly reduced SO2 and PM2.5 concentrations, but the complex interactions among the factors driving the abundance and composition of PM2.5 in China remain poorly understood.
Trees can accumulate trace metals in their leaves. In China, trees have been planted at a large scale to reduce PM2.5 concentrations in highly populated urban areas such as Beijing and Shanghai [5,6]. Heavy metals can enter trees through roots (see for a review [7]) and, as recently demonstrated, through leaves and bark [8,9]. They become incorporated in the wood, i.e., in the annually formed tree rings, allowing on the one hand their storage, and on the other hand the temporal monitoring of environmental changes through the use of tree-ring chemical analysis, i.e., dendrochemistry [10,11]. Many factors influence the applicability of dendrochemistry, such as the tree species and its physiology, the chemical species and its characteristics (e.g., weight and mobility across tree-ring boundaries), and the availability of analytical instrumentation [7,12,13]. Many studies have successfully applied dendrochemical methods to investigate historical changes in the trace metal concentration in several polluted areas worldwide [14,15,16,17]. The history of pollution was also investigated through dendrochemical analyses in many locations in China, spanning several decades, analyzing different trace metals (see some examples of study cases in Table S1 [48, 49, 50, 51, 52, 53, 54, 55, 56, 57, 58, 59] in the Supplementary Materials). In Asia, such studies are of utmost importance because only scarce air pollution data are available from only few air quality monitoring networks, mostly covering very short periods of time.
In Harbin, one of the largest cities and most important industrial centers in northeastern China, air quality monitoring systems were built only by the end of 2015 to meet the national requirements [18]. Thus, dendrochemical analyses could be used as a tool to complement for the lack of air quality data over longer periods of time, thus allowing for the reconstruction of the temporal trend of trace metals. The main aims of this study were to: (a) assess the chemical composition of Quercus mongolica Fisch. ex Ledeb. tree rings from Harbin using a recently developed system of laser ablation-inductively coupled plasma-mass spectrometry (LA-ICP-MS), (b) identify the main chemical elements which derived from air pollution and may be used as indicators over the period 1965–2020 in Harbin, while excluding those that were controlled by physiological processes in the tree, and (c) reconstruct the history of pollution in Harbin by comparing the tree-ring chemical composition of recent decades with that of previous decades, in trees growing in the highly polluted city of Harbin and in trees growing in a control site 90 km away from major pollution sources.

2. Materials and Methods
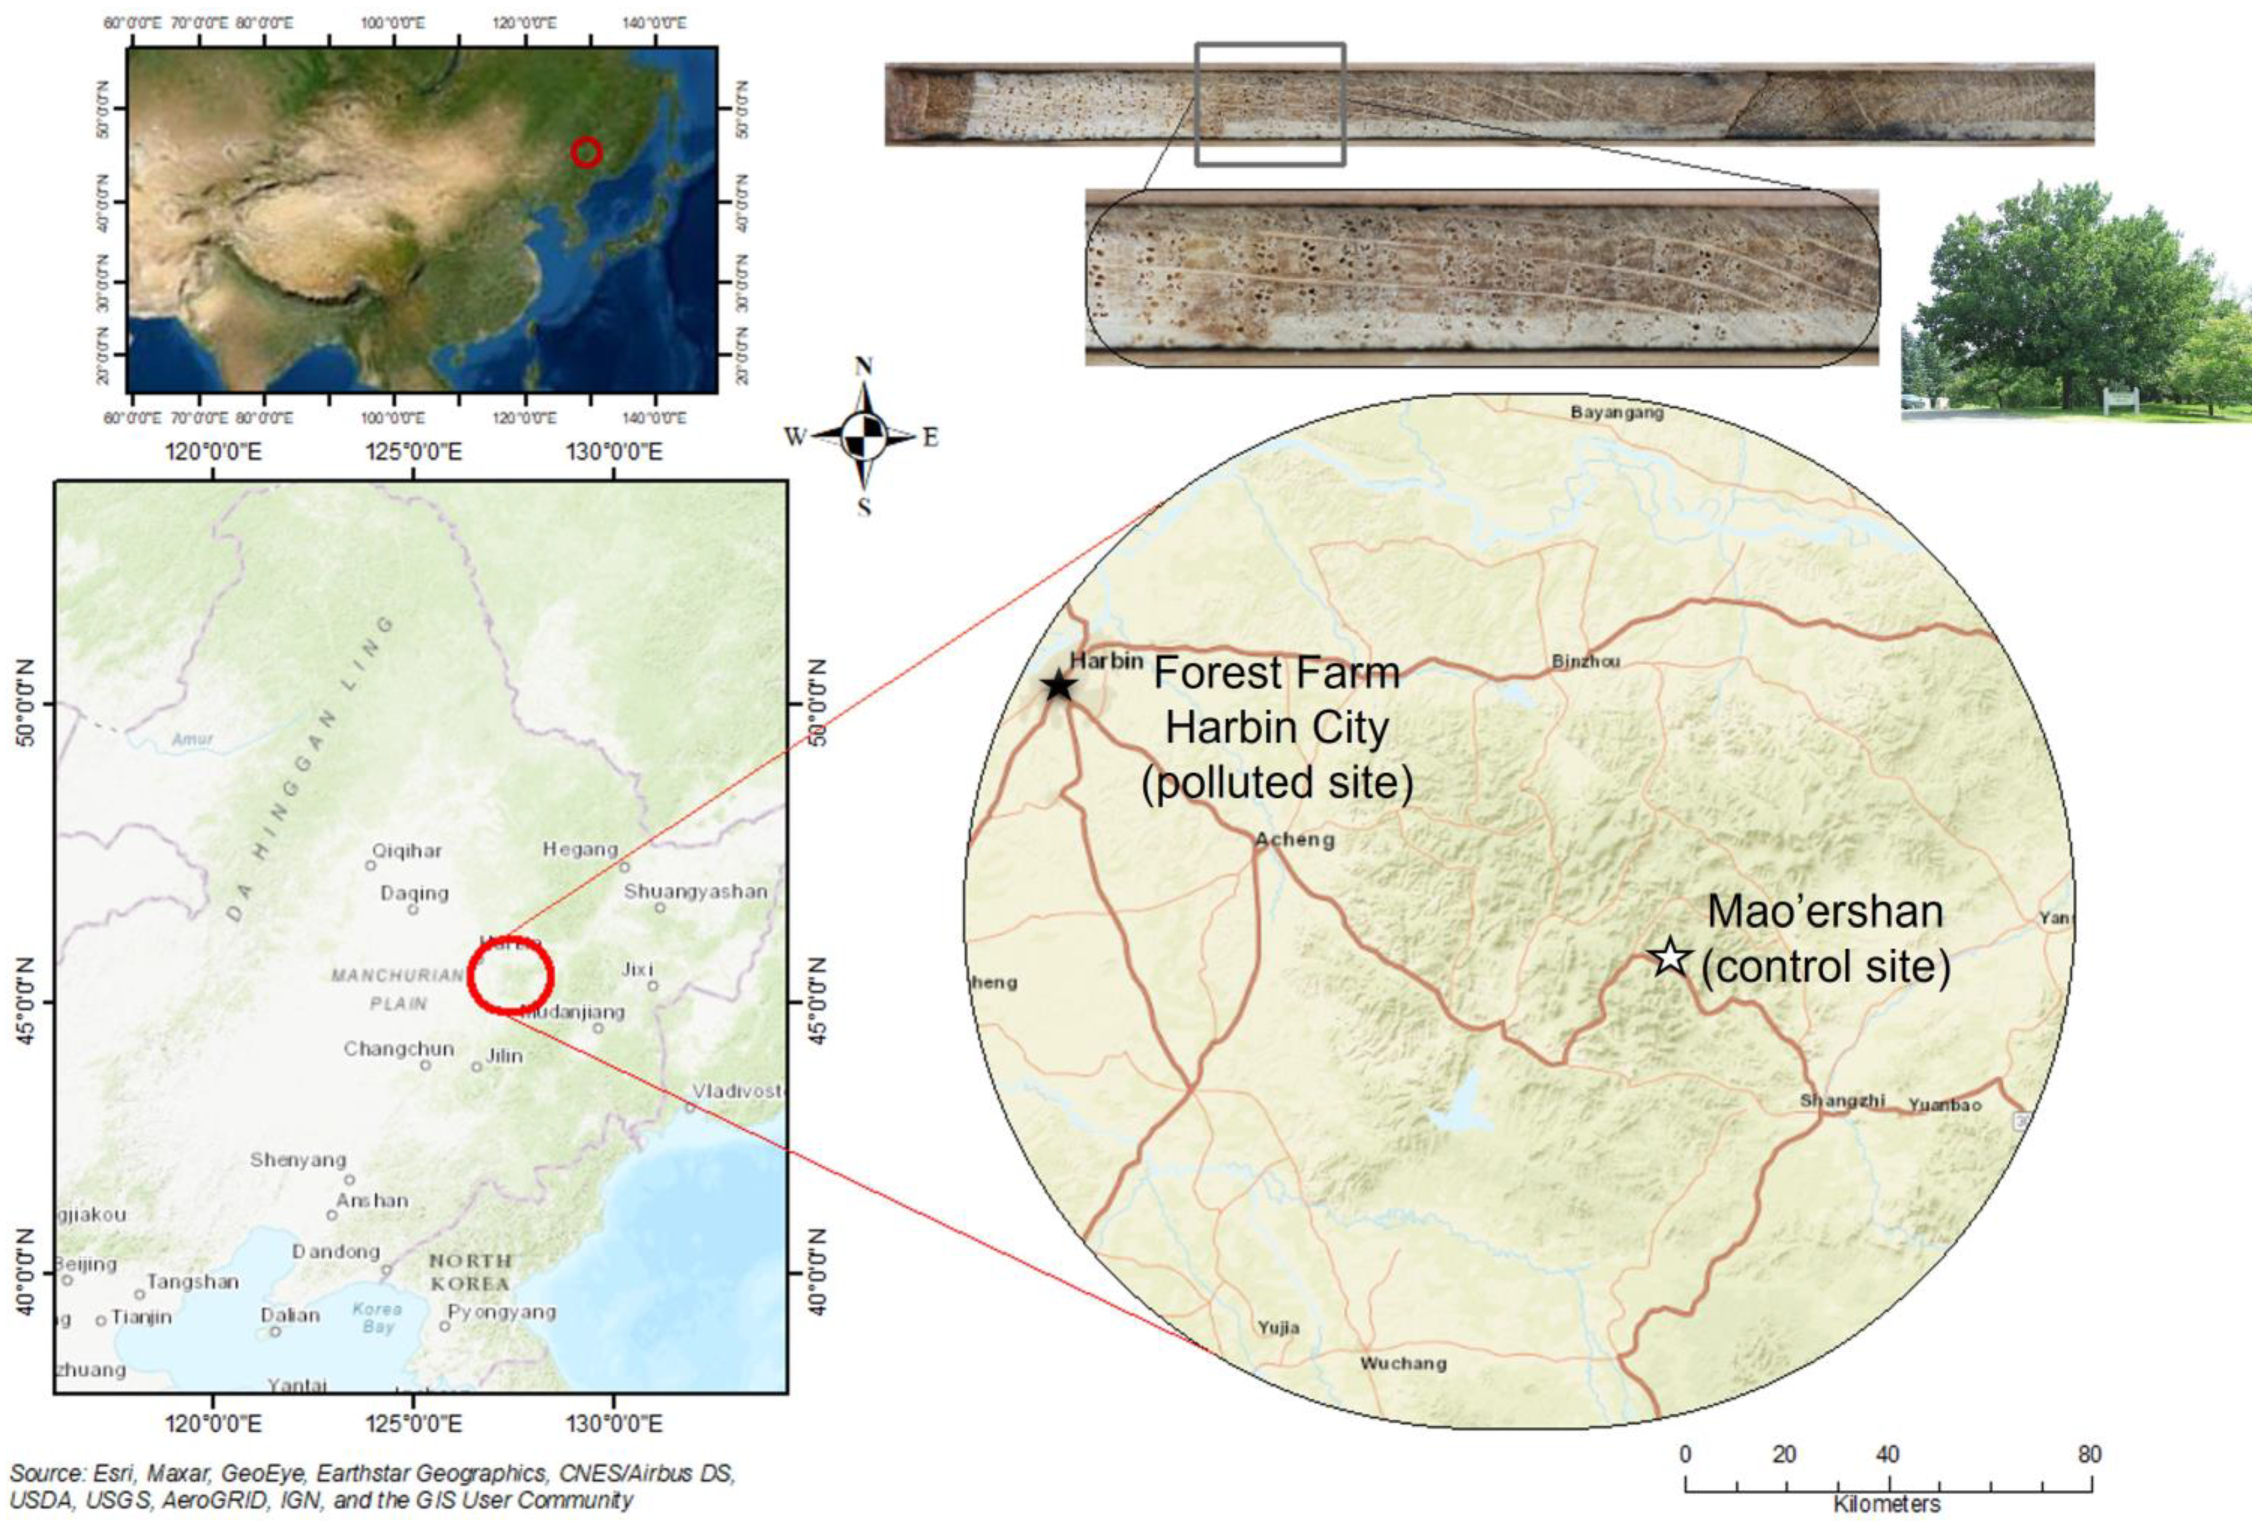
2.1. Study Area

The Forest Farm in Harbin city (45°43′20″, 126°38′07″, 150 m asl) and the Mao’ershan Forest Ecosystem Research Station (45°24′17″, 127°39′42″, 420 m asl), both of the Northeast Forestry University at Harbin, China, were chosen as polluted site and as control site, respectively (Figure 1). The mean annual minimum–maximum temperatures are −0.9–10.1 °C, and −2.8–9.8 °C, and mean annual amount of precipitation is 529 mm and 656 mm in Harbin and Mao’ershan, respectively. For the detailed site description of Mao’ershan, additional information can be found in [19]. As part of one of the main industrial centers of the northeast region of China, Harbin has heavy industries, large energy consumption and low energy utilization rate, and has been plagued by heavy metal contamination and serious pollution problems [18,20]. Harbin frequently suffers from brown haze episodes, where atmospheric PM increases dramatically, inducing low atmospheric visibility [21]. Vehicular emissions from cars, motorcycles and diesel-fueled heavy-duty trucks are the main source of NOx and PM2.5 in Harbin, accounting for more than 80% of the total emissions [2]. Other important sources of pollution that contribute to high PM10 concentrations include coal combustion, incinerators, steel and petrochemical industry, road dust, and secondary aerosols, i.e., secondary sulphate, secondary nitrate and secondary organic carbon [21]. Biomass burning, identified by K+ marker, is also an important emission source for cooking in winter, especially in rural sites [22]. Pollution levels are generally higher in winter and spring [4], but some trace elements such as As, Pb, S, Cd and Zn showed high pollution levels in all seasons, mainly deriving from traffic emissions [23].

2.2. Tree Ring Sampling and Ring-Width Measurement

Field sampling was conducted in March 2021 at the polluted and control sites. Two tree cores per tree were collected at breast height (1.3 m) with an increment borer (inner diameter: 5.15 mm; Haglöf, Dalarna, Sweden). Forty tree cores were collected at each site from 20 Q. mongolica, a native species from the northeastern Asian range. At each site, 20 cores from 20 trees were used for cross-dating, of which some were also used for elemental analyses. Broken, injured tree cores were discharged. Tree cores for cross-dating were air-dried and surface-prepared with a core-microtome [24]. Images of the cores were captured with a camera (Canon EOS 5DS R, Canon Inc., Tokyo, Japan) and multiple overlapping images were stitched into an overall composite image of the anatomical sample using the image-stitching software PTGui (New House Internet Services B.V., Rotterdam, NL). Tree ring widths were measured using the image analysis software CooRecorder 8.1 (Cybis Elektronik & Data AB) [25]. The final cross-dating was conducted using TsapWin (Rinntech, Heidelberg, Germany), and cross-dating quality was checked using COFECHA [26]. Long-term trends, mostly due to tree aging, were removed by fitting a cubic smoothing spline with a 50% frequency response cutoff at 30 years using the R package dplR [27]. The same was done for temperature and precipitation data (covered by climate data from the Harbin—45°45′, 126°46′, 142.3 m—and Shangzhi—45°13′, 127°58′, 189.7 m—weather stations, for polluted and control sites, respectively). Then, bootstrap correlations were calculated between each chronology and monthly temperature and precipitation for the period 1965–2020 using the R package treeclim [28].

2.3. LA-ICP-MS Determination of Chemical Elements

Chemical elements were detected in tree cores using LA-ICP-MS at the laboratory of the Institute of Geochemistry and Petrology (ETH, Zürich, Switzerland). Three tree cores from Mao’ershan and seven tree cores from Harbin, chosen from previously cross-dated tree cores which had the highest cross-dating statistical values, were prepared for the LA-ICP-MS elemental analyses. An unequal number of tree cores was chosen for each site because, on one side, we wanted to analyze as many tree cores as possible, specifically for the polluted site, to have statistically strong results. On the other side, we could not measure the same number of tree cores for the control site due to time constraints and costs required for the LA-ICP-MS analyses; instead, we agreed that data from three tree cores were statistically reliable. The tree cores were previously sectioned with a microtome and later mounted for insertion into the LA-ICP-MS instrument. Chemical composition of latewood was determined with a 5-year resolution ablating three spots (168 µm) per tree ring to have a more reliable signal and check for its intra-ring variability. Latewood was chosen because, in oak, it was shown to have a more uniform structure than earlywood, smaller vessels and less mobility of the elements [16]. A glass standard reference material (SRM) NIST 612 was ablated using single line patterns (laser settings: energy 3.5 J cm−2; spot size 43 μm; scan speed 3 μm s−1; shot frequency 10 Hz). However, due to the lack of a suitable reference material for wood, absolute concentration was not calculated, and the ratio between the element and 13C was taken as proxy for the element signal. Then, SILLS software [29] was used for data reduction and to perform the spike removal for all measured elements. The following isotopes were measured: 25Mg, 27Al, 29Si, 34S, 39K, 43Ca, 49Ti, 53Cr, 55Mn, 57Fe, 59Co, 62Ni, 65Cu, 66Zn, 75As, 88Sr, 205Tl, 208Pb and 209Bi.

2.4. Statistical Analyses

The normality of each chemical element was evaluated using the Shapiro–Wilk test at 95% confidence level (p ≤ 0.05). Spearman’s correlation coefficients (at p ≤ 0.05 values) were performed to evaluate the relationships of all chemical elements among the tree cores and to assess the relationship between the mean of all chemical elements at the Harbin site. The Mann–Kendall test was used to evaluate the significance of the temporal mean variation in the chemical elements at the Harbin and Mao’ershan sites. Box and Whisker plots and Tukey means of comparison test (at p ≤ 0.05 values) were used to determine which means were significantly different from others. The non-parametric Kruskal–Wallis test, evaluated at 95% confidence level (p ≤ 0.05), was used to determine which medians were significantly different from others when comparing each chemical signal between sites for two selected periods: period I (1965–2000 at Harbin and 1965–2005 at Mao’ershan) and period II (2005–2020 at Harbin and 2010–2020 at Mao’ershan), which correspond to the heartwood–sapwood boundary of the ring-width series from the study sites. Statistical analyses and graphic visualization were performed using the OriginPro Version 2020 (OriginLab Corporation, Northampton, MA, USA) scientific data analysis and graphing software, whereas the resultant Mann–Kendall test statistic was performed using the R package Kendall.

3. Results

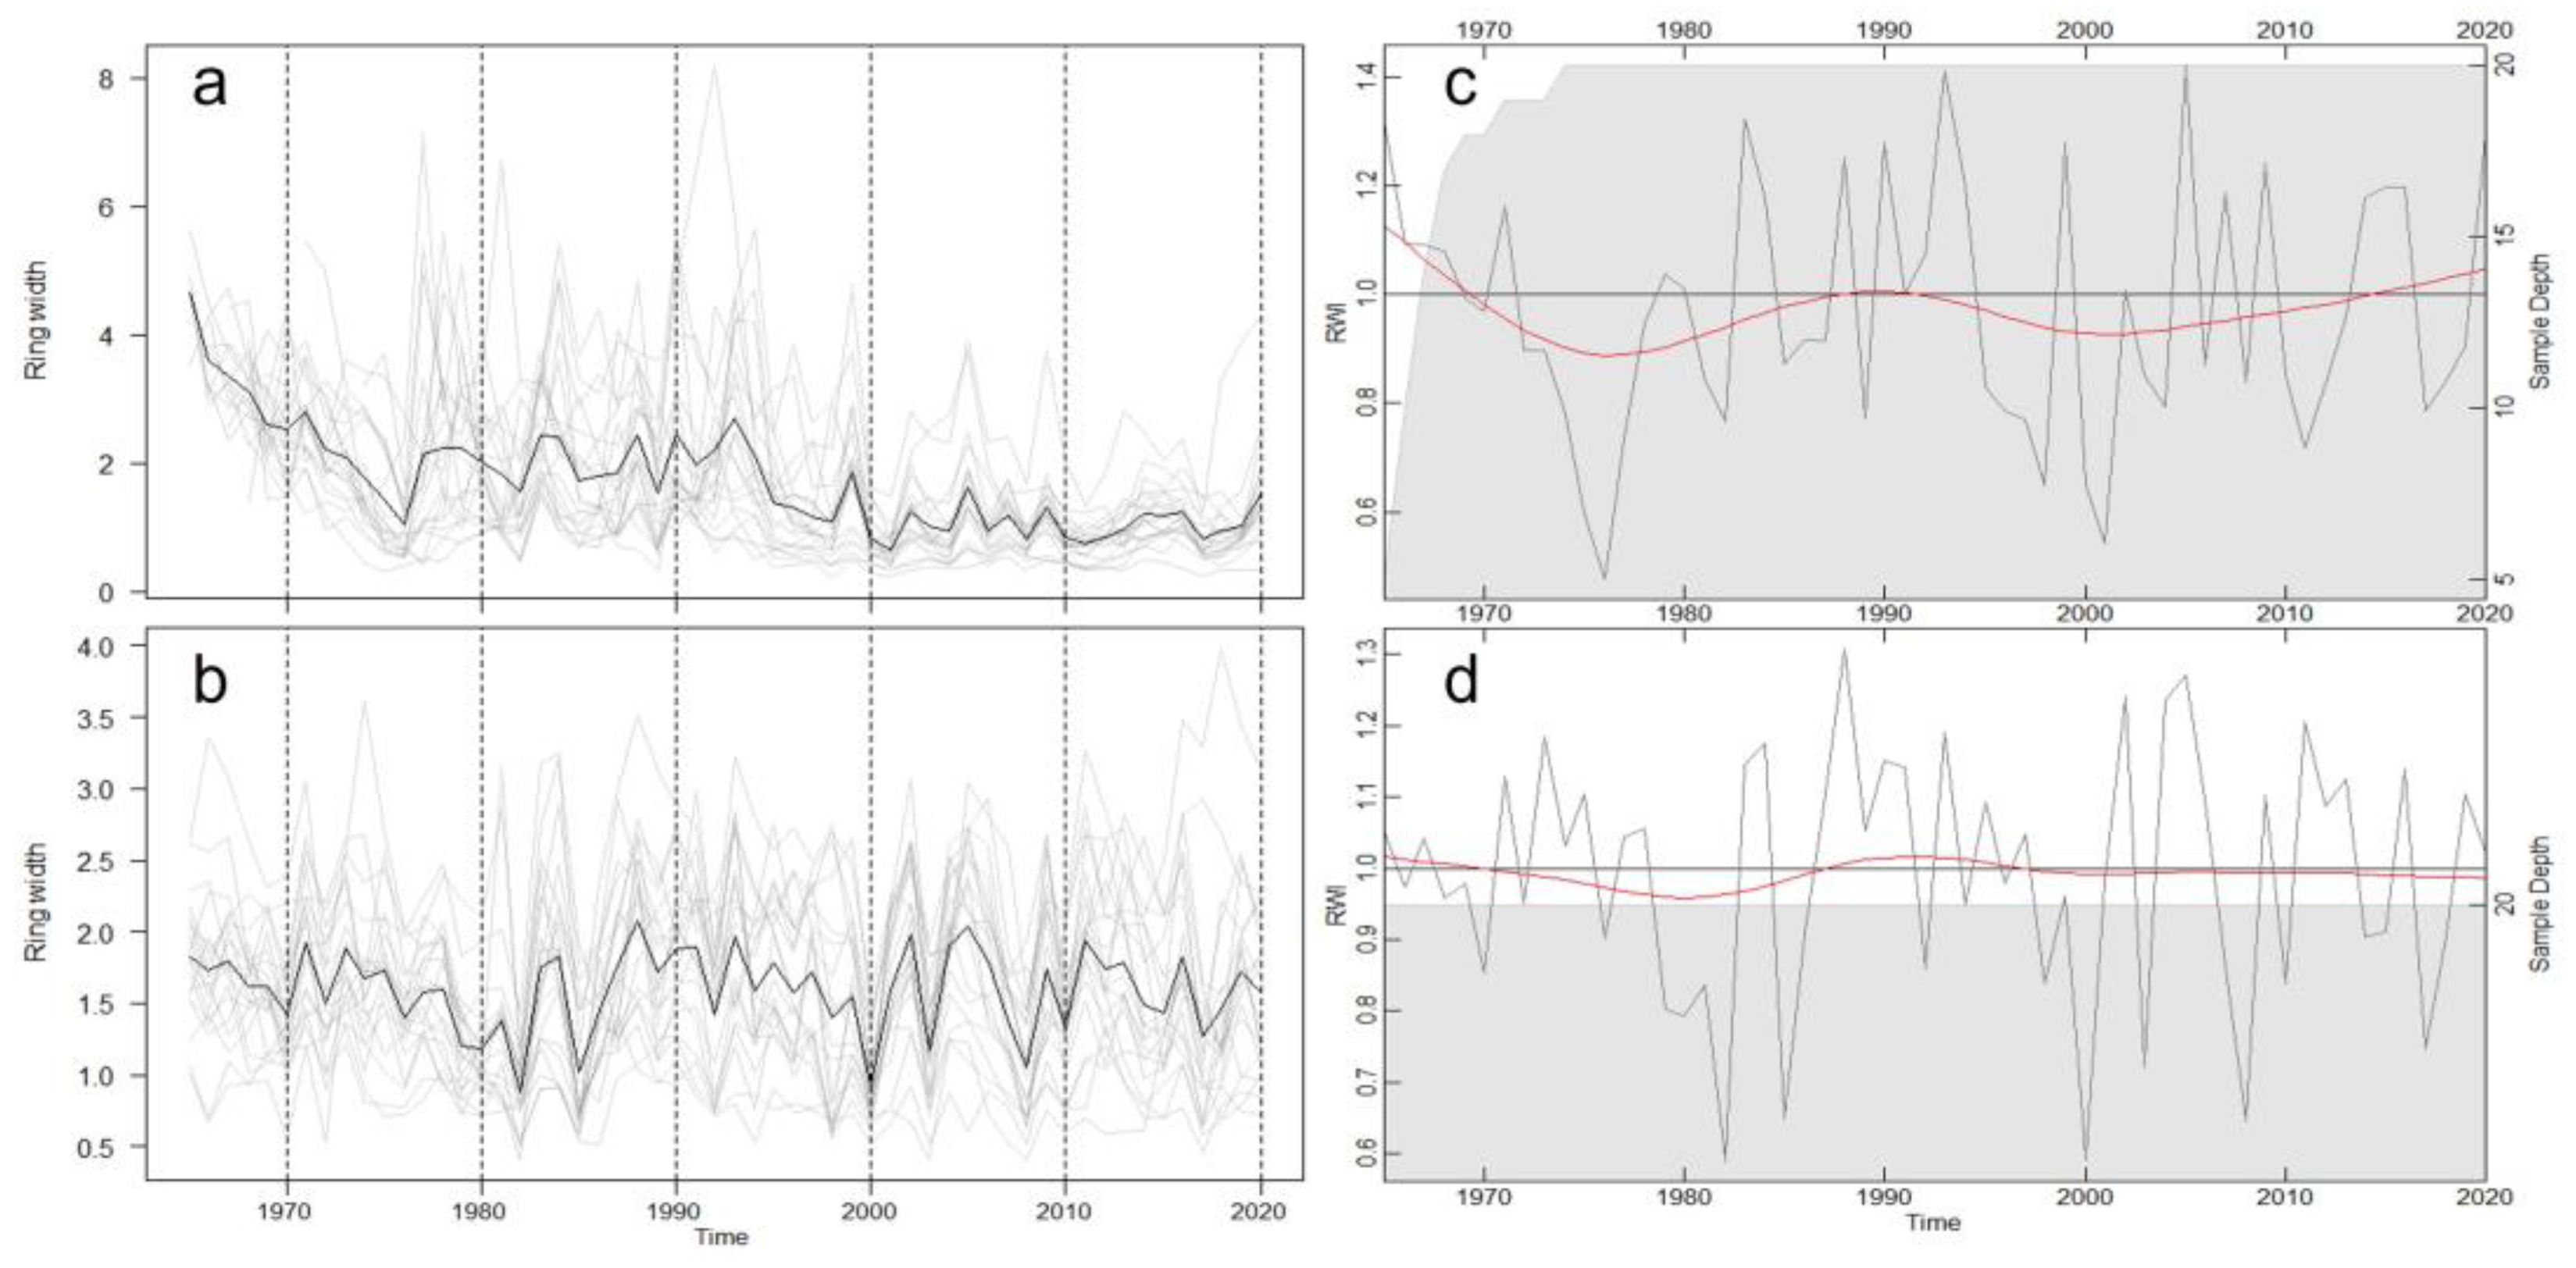
3.1. Ring-Width Chronologies

Mean ring-width chronology at Harbin and Mao’ershan sites are visible in Figure A1. The mean chronology was built using 20 trees per site, resulting in an Expressed Population Signal (EPS) > 0.90 (Table 1), indicating an acceptable level of coherence in dendrochronology [30]. Trees from Harbin were younger than those from Mao’ershan, with the latter dating back to the 1940s. However, for the purpose of this study, we only considered the annual growth from 1965 to 2020, which was common to the chronologies of both sites. Tree ring width correlation with temperature and precipitation were similar in both sites (see Figure S1 in the Supplementary Materials). The step of cross-dating is essential to assign each tree ring its exact year because the LA-ICP-MS analysis we performed relies on correct cross-dating (the chemical signal of the elements must be associated with the exact year which could correspond to a specific pollution event).

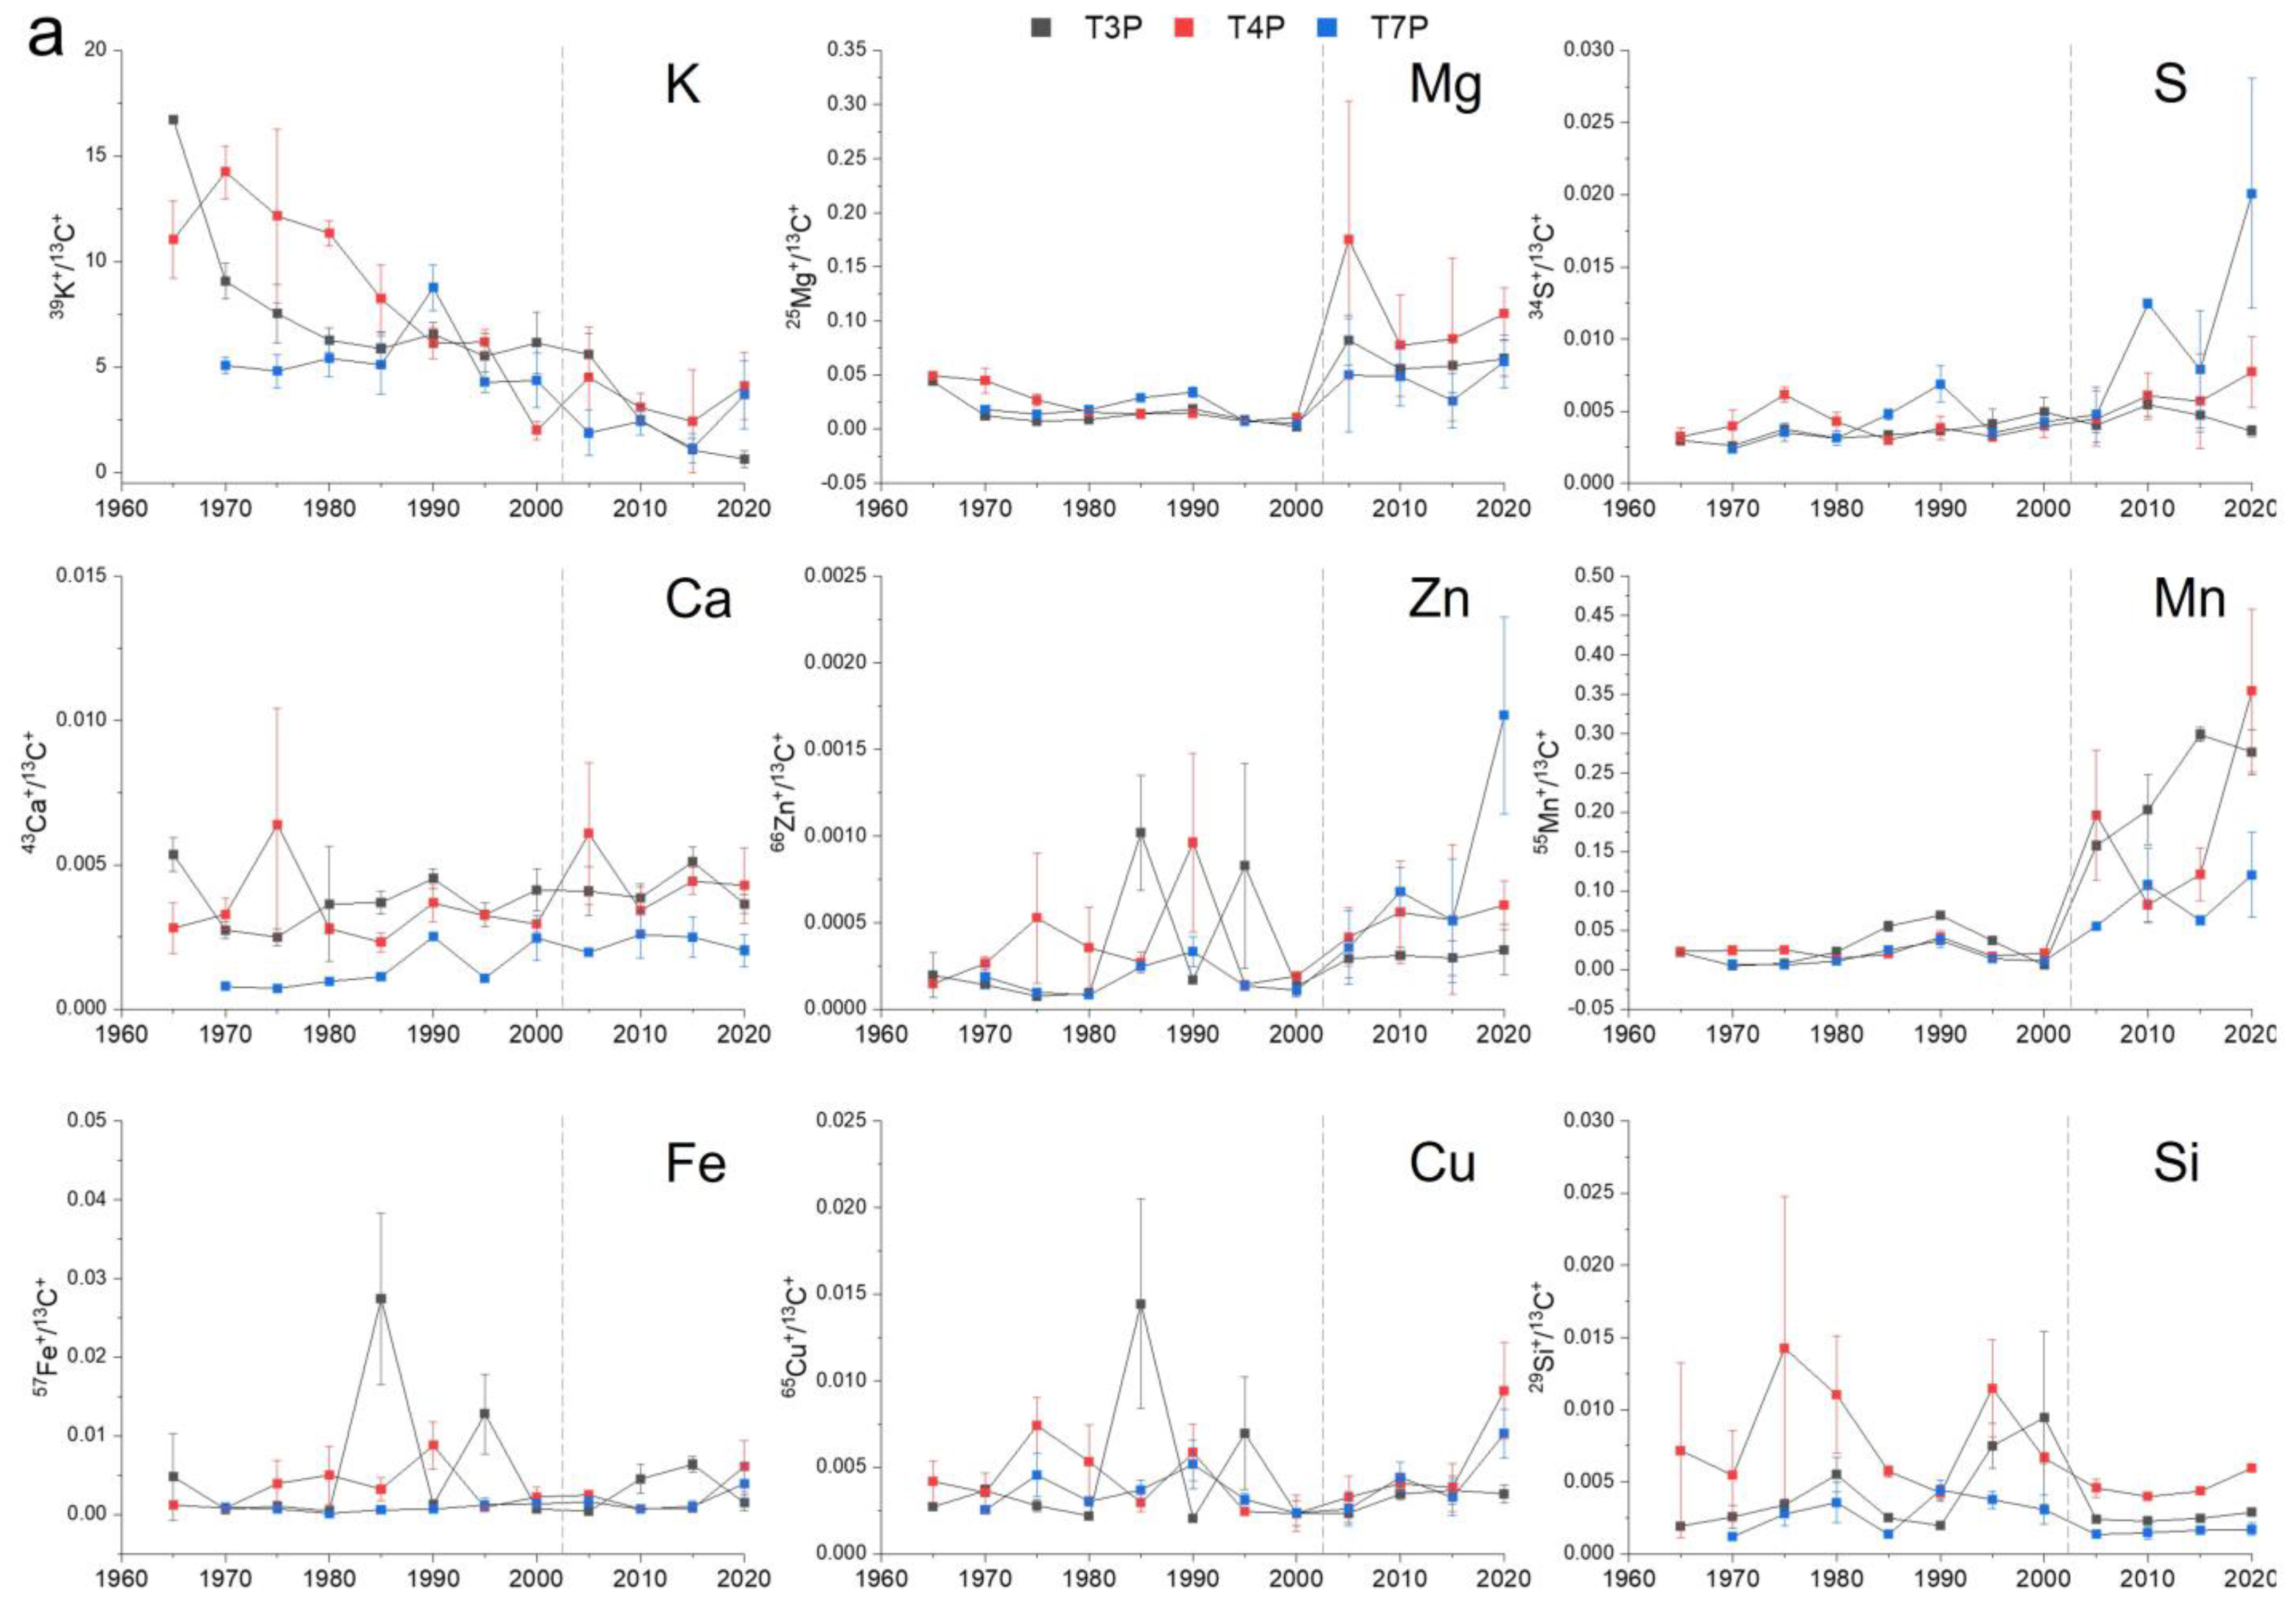
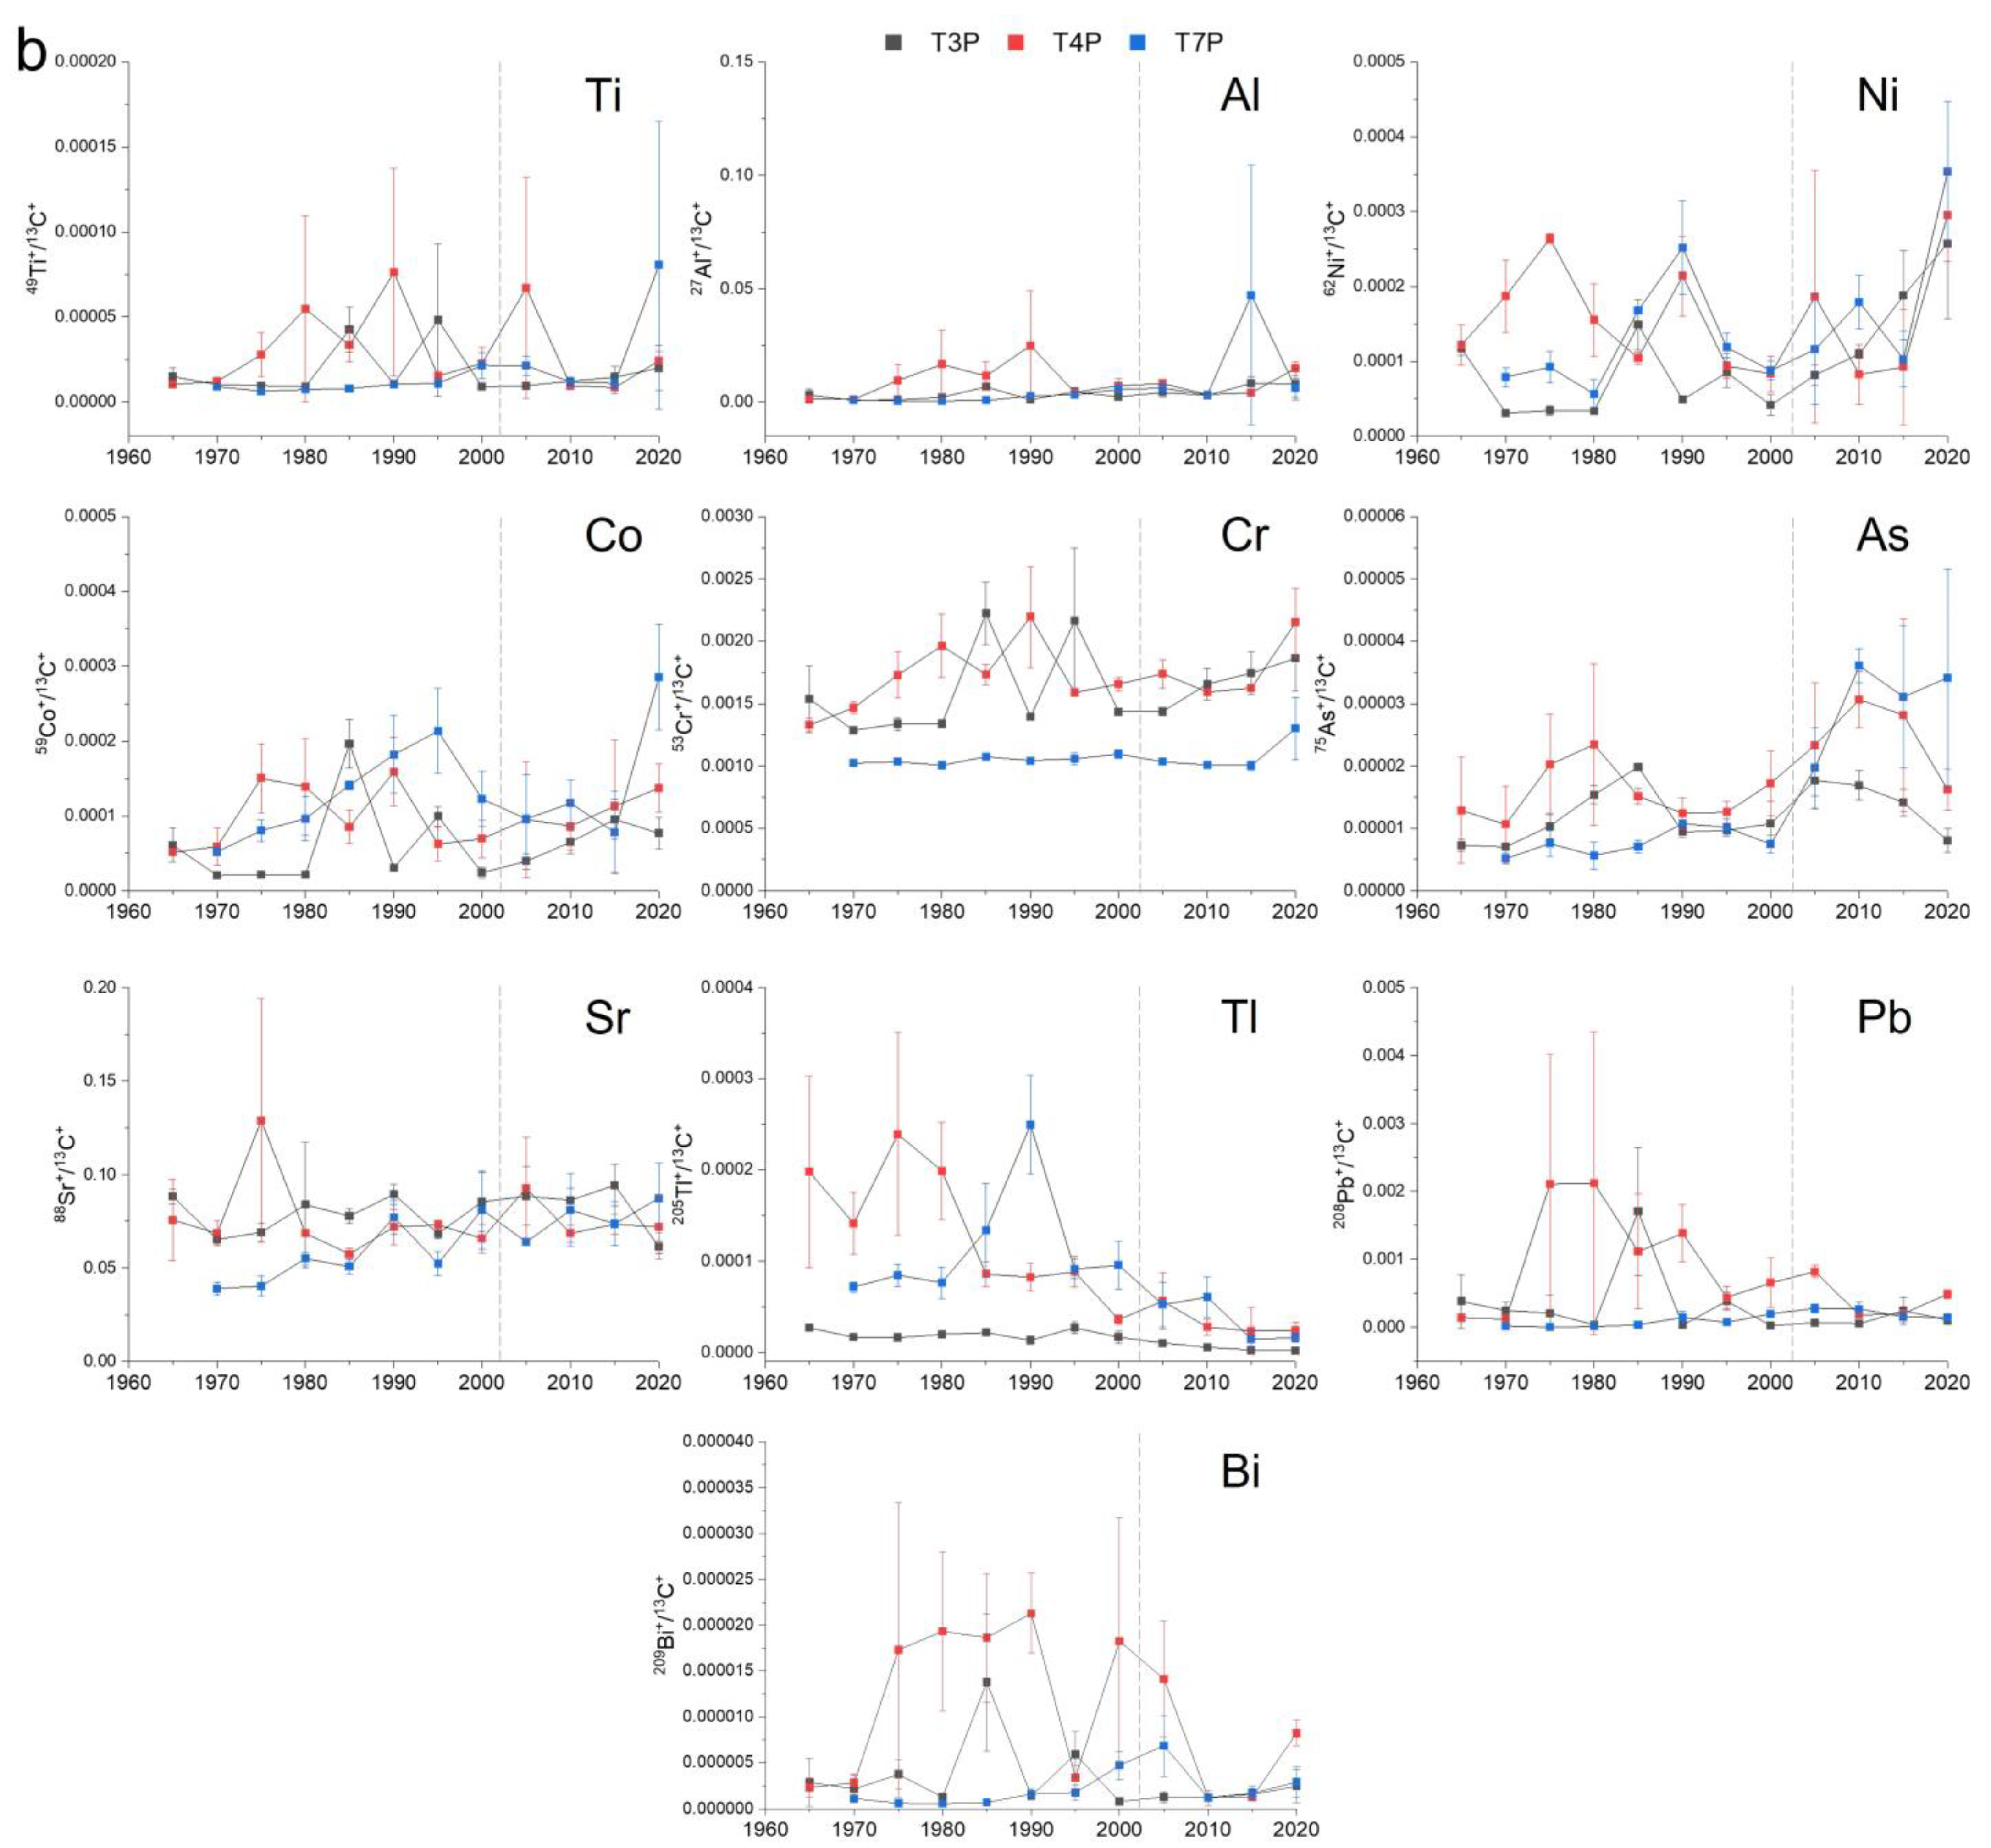
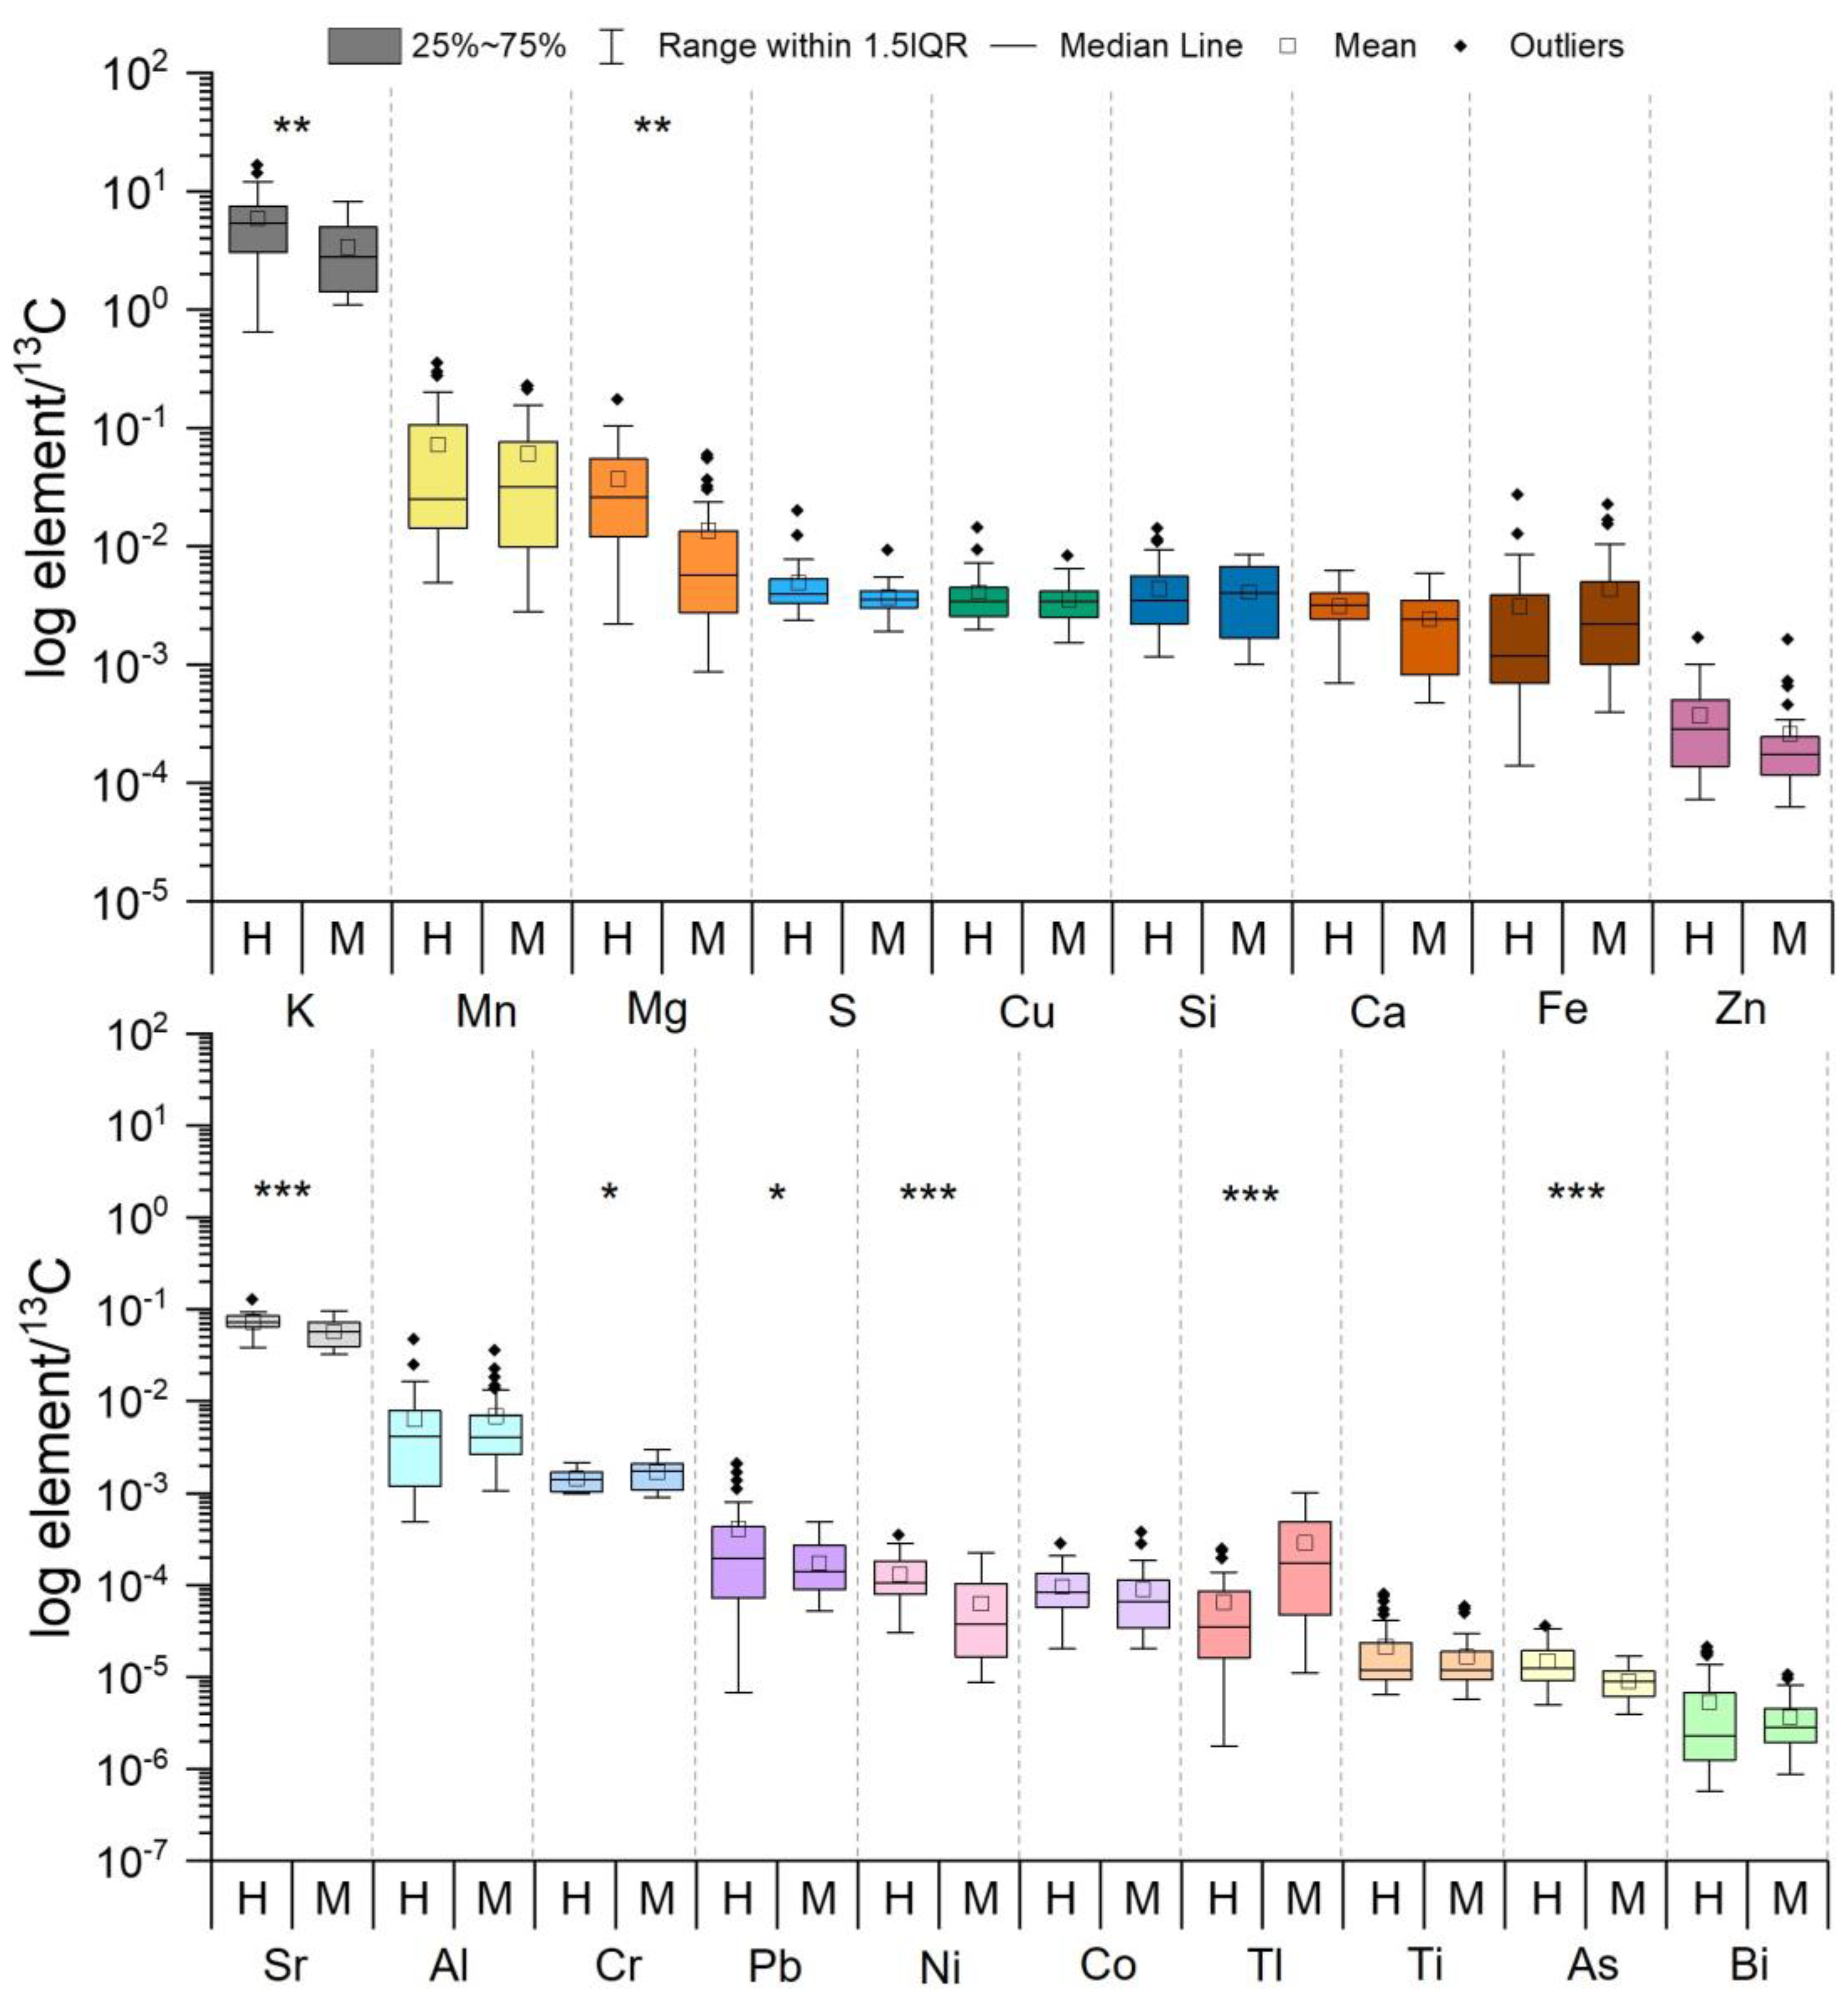
3.2. Intra-Ring and among-Tree Variability of Chemical Elements in Tree Rings

Laser ablation results from seven tree cores at the Harbin site were measured, but results from four tree cores were not considered because of physical injuries that probably caused the presence of a fungal infection, which we could not previously visualize. The chemical signal was altered and we could see changes in the Ca, Zn, Mg, Mn and S signals before and after the injury. Similar results were obtained by [31], where elevated concentrations of Ca, Mn, Cu and Zn in red maple were a result of fungal infection. Elevated K has also been identified in decay wood of willow infected by microorganisms [32]. Therefore, decayed or discolored wood should be avoided in dendrochemical studies of environmental monitoring [31,32]. Thus, data from only three cores were used to reconstruct the signal of environmental pollution. At the Harbin site, the temporal tree-ring distribution of the elements recorded in the latewood of three trees (T3P, T4P and T7P trees) can be visualized in Figure 2. The intra-ring variability of individual trees was relatively high in some elements and in some specific years, e.g., in T3P tree for Fe, Pb and Bi in 1985 and for Zn, Cu and Cr in 1985 and 1995; in T4P tree for K, Ca, Si, Sr in 1975, for Mg, Ti and Ni in 2005 and for As, Tl, Pb and Bi in 1975 and 1980; in T7P tree for S, Zn, Ti, Ni and As in 2020 and for Al and As in 2015. However, despite the intra-ring variability and different signal values among trees, the overall trend of elements is similar in all tree cores, as can be seen, for example, in Tl and K (negative trend), Ca and Cr (fairly constant trend over time), Sr (slightly increasing trend) and Ni and As (fluctuating trend).
Interestingly, in the heartwood (1965–2000), the intra-ring variability of some elements, such as Mg, Mn and S, was very low, whereas in the sapwood (2005–2020), their variation was uneven within the single ring, as well as among trees. However, this is not the case for Si, which behaved the opposite (high intra-ring variability in the heartwood, low in the sapwood). As seen in Figure 3, the heartwood–sapwood boundary of T3P, T4P and T7P trees is clearly marked by the sharp increase after 2000 in the Mg and Mn trends, recorded by all tree cores. Zinc and Cu also showed an increase from the heartwood–sapwood boundary towards the outmost rings; however, the intra-ring and among-tree variability in the heartwood was much higher than in Mg and Mn.
In order to evaluate the variability of the chemical elements recorded in the latewood by different trees, Spearman’s correlation coefficients, calculated for the whole tree cores (heartwood and sapwood), revealed a high significant correlation (p < 0.05) common to all trees only for Mg and Mn at the Harbin site (Table 2), which could explain the temporal trend of these elements and their physiological responses related to the sapwood–heartwood conversion. Besides Mg and Mn, significant positive correlations were found in K between T4P and T3P, in Cu between T4P and T7P, and in K, Al, Ca, Ni, Zn and Tl between T3P and T7P.

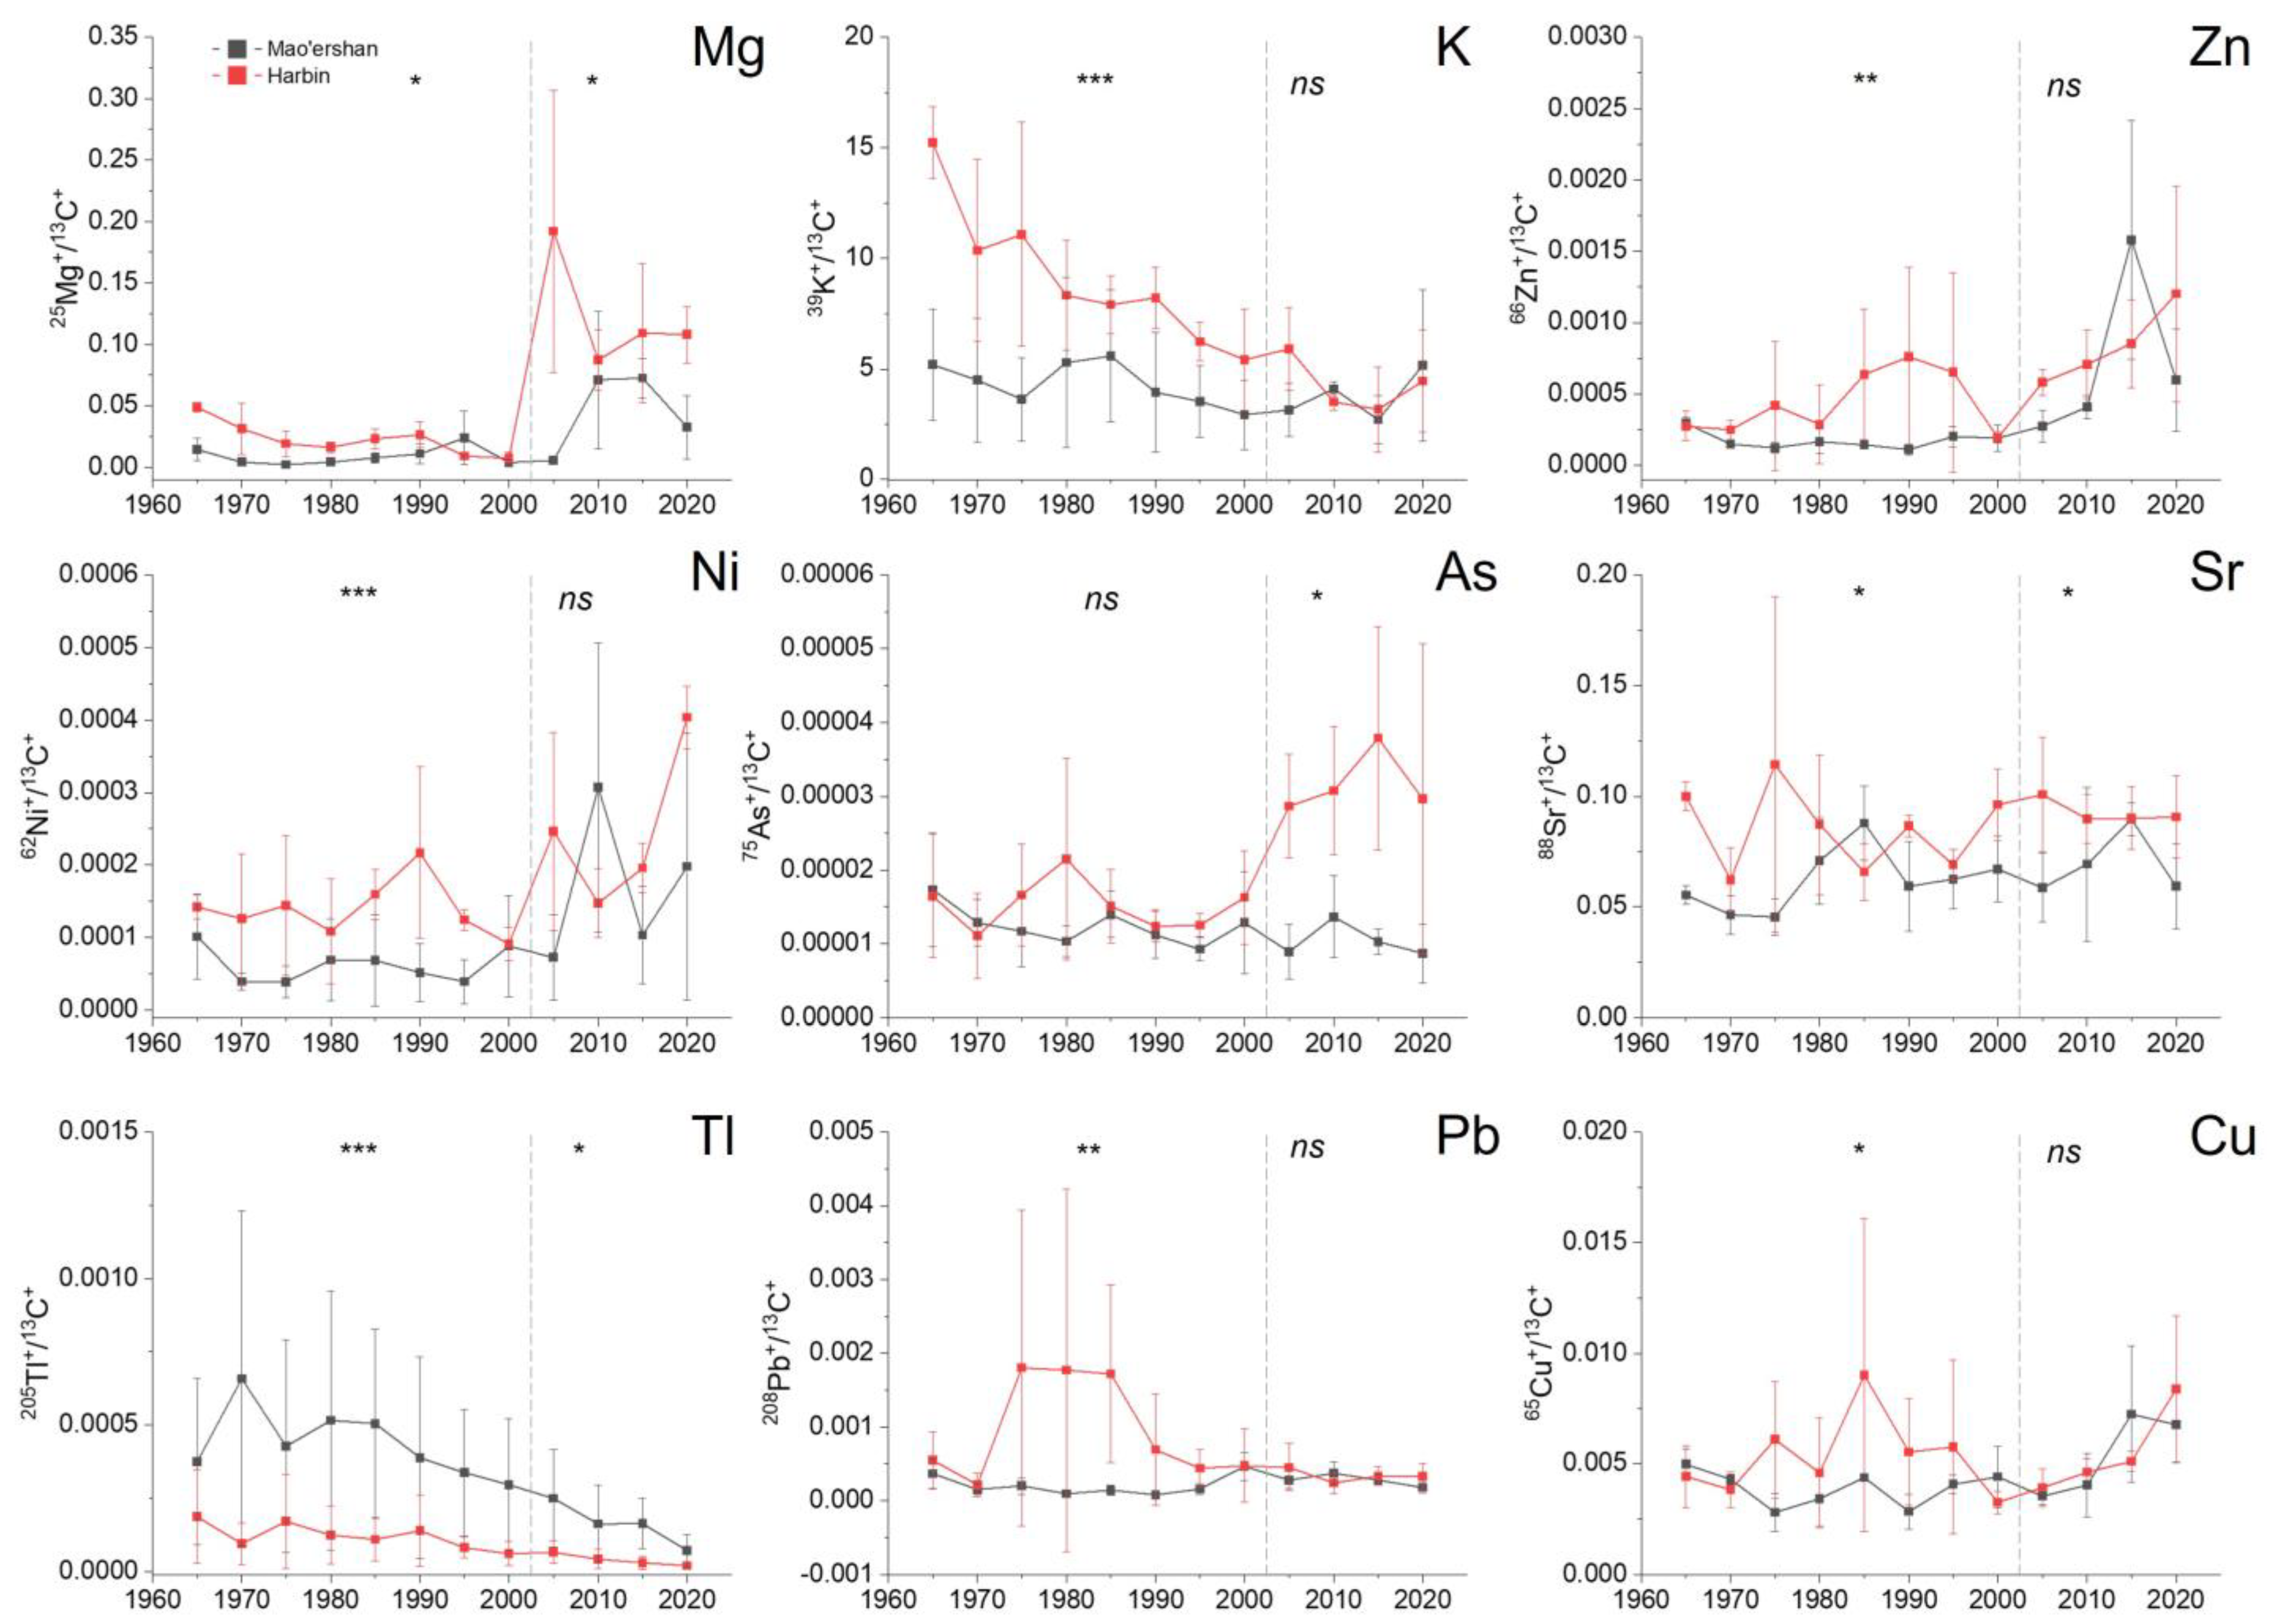
3.3. Differences in the Temporal Distribution of Chemical Elements between Polluted and Control Sites

Statistically (using Mann–Kendall 2-sided p values; Table 3), Mg and Mn showed positive trends, but the trend was significant at p = 0.004 only for Mn. Significant positive trends were found at the Harbin site for S (p < 0.001), Co, Zn and As (p = 0.02, p = 0.011 and p = 0.03, respectively), whereas K and Tl (p < 0.001) and Pb (p = 0.04) showed significant negative trends. The other elements showed positive non-significant trends, except for a weak non-significant negative trend for Si, Fe and Bi. On the other hand, statistically significant positive trends at the Mao’ershan site were found for S, Mn and Zn (p = 0.019, p = 0.011 and p = 0.03, respectively), whereas significant negative trends were found for Tl (p < 0.001), Fe and As (p = 0.011 and p = 0.03, respectively).
A correlation analysis (Spearman’s correlation coefficient) for the chemical elements in Harbin revealed that K, S, Mn, Co, Ni, Cu, Zn and As were the elements that most significantly correlated with each other and other elements (p < 0.05), whereas Mg, Al, Ca, Ti, Fe, Sr, Pb and Bi correlated more weakly with each other (see Table S2 in the Supplementary Materials). On the contrary, in Mao’ershan, Mg, Mn, S, Ni and Tl were the elements more strongly correlating with other elements (Table S2).
Figure 4 shows which chemical elements are significantly different when comparing their means between the Harbin and Mao’ershan sites. Tukey’s mean of comparisons test showed significant differences in Sr, Ni, Tl and As (p < 0.001), in K and Mg (p < 0.01), and in Cr and Pb (p < 0.05).
Temporal mean variation in Mg, K, Zn, Ni, As, Sr, Tl, Pb and Cu showed statistically significant differences (Kruskal–Wallis test at p ≤ 0.05) between the Harbin and Mao’ershan sites for the two evaluated periods (Figure 5). Significant differences in the heartwood were found for K, Ni and Tl (p < 0.001), for Zn and Pb (p = 0.005 and p = 0.002, respectively), and for Mg, Sr and Cu (p = 0.012, p = 0.016 and p = 0.03, respectively). On the other hand, significant differences in the sapwood were found only for Mg, As, Sr and Tl at p = 0.03.

4. Discussion

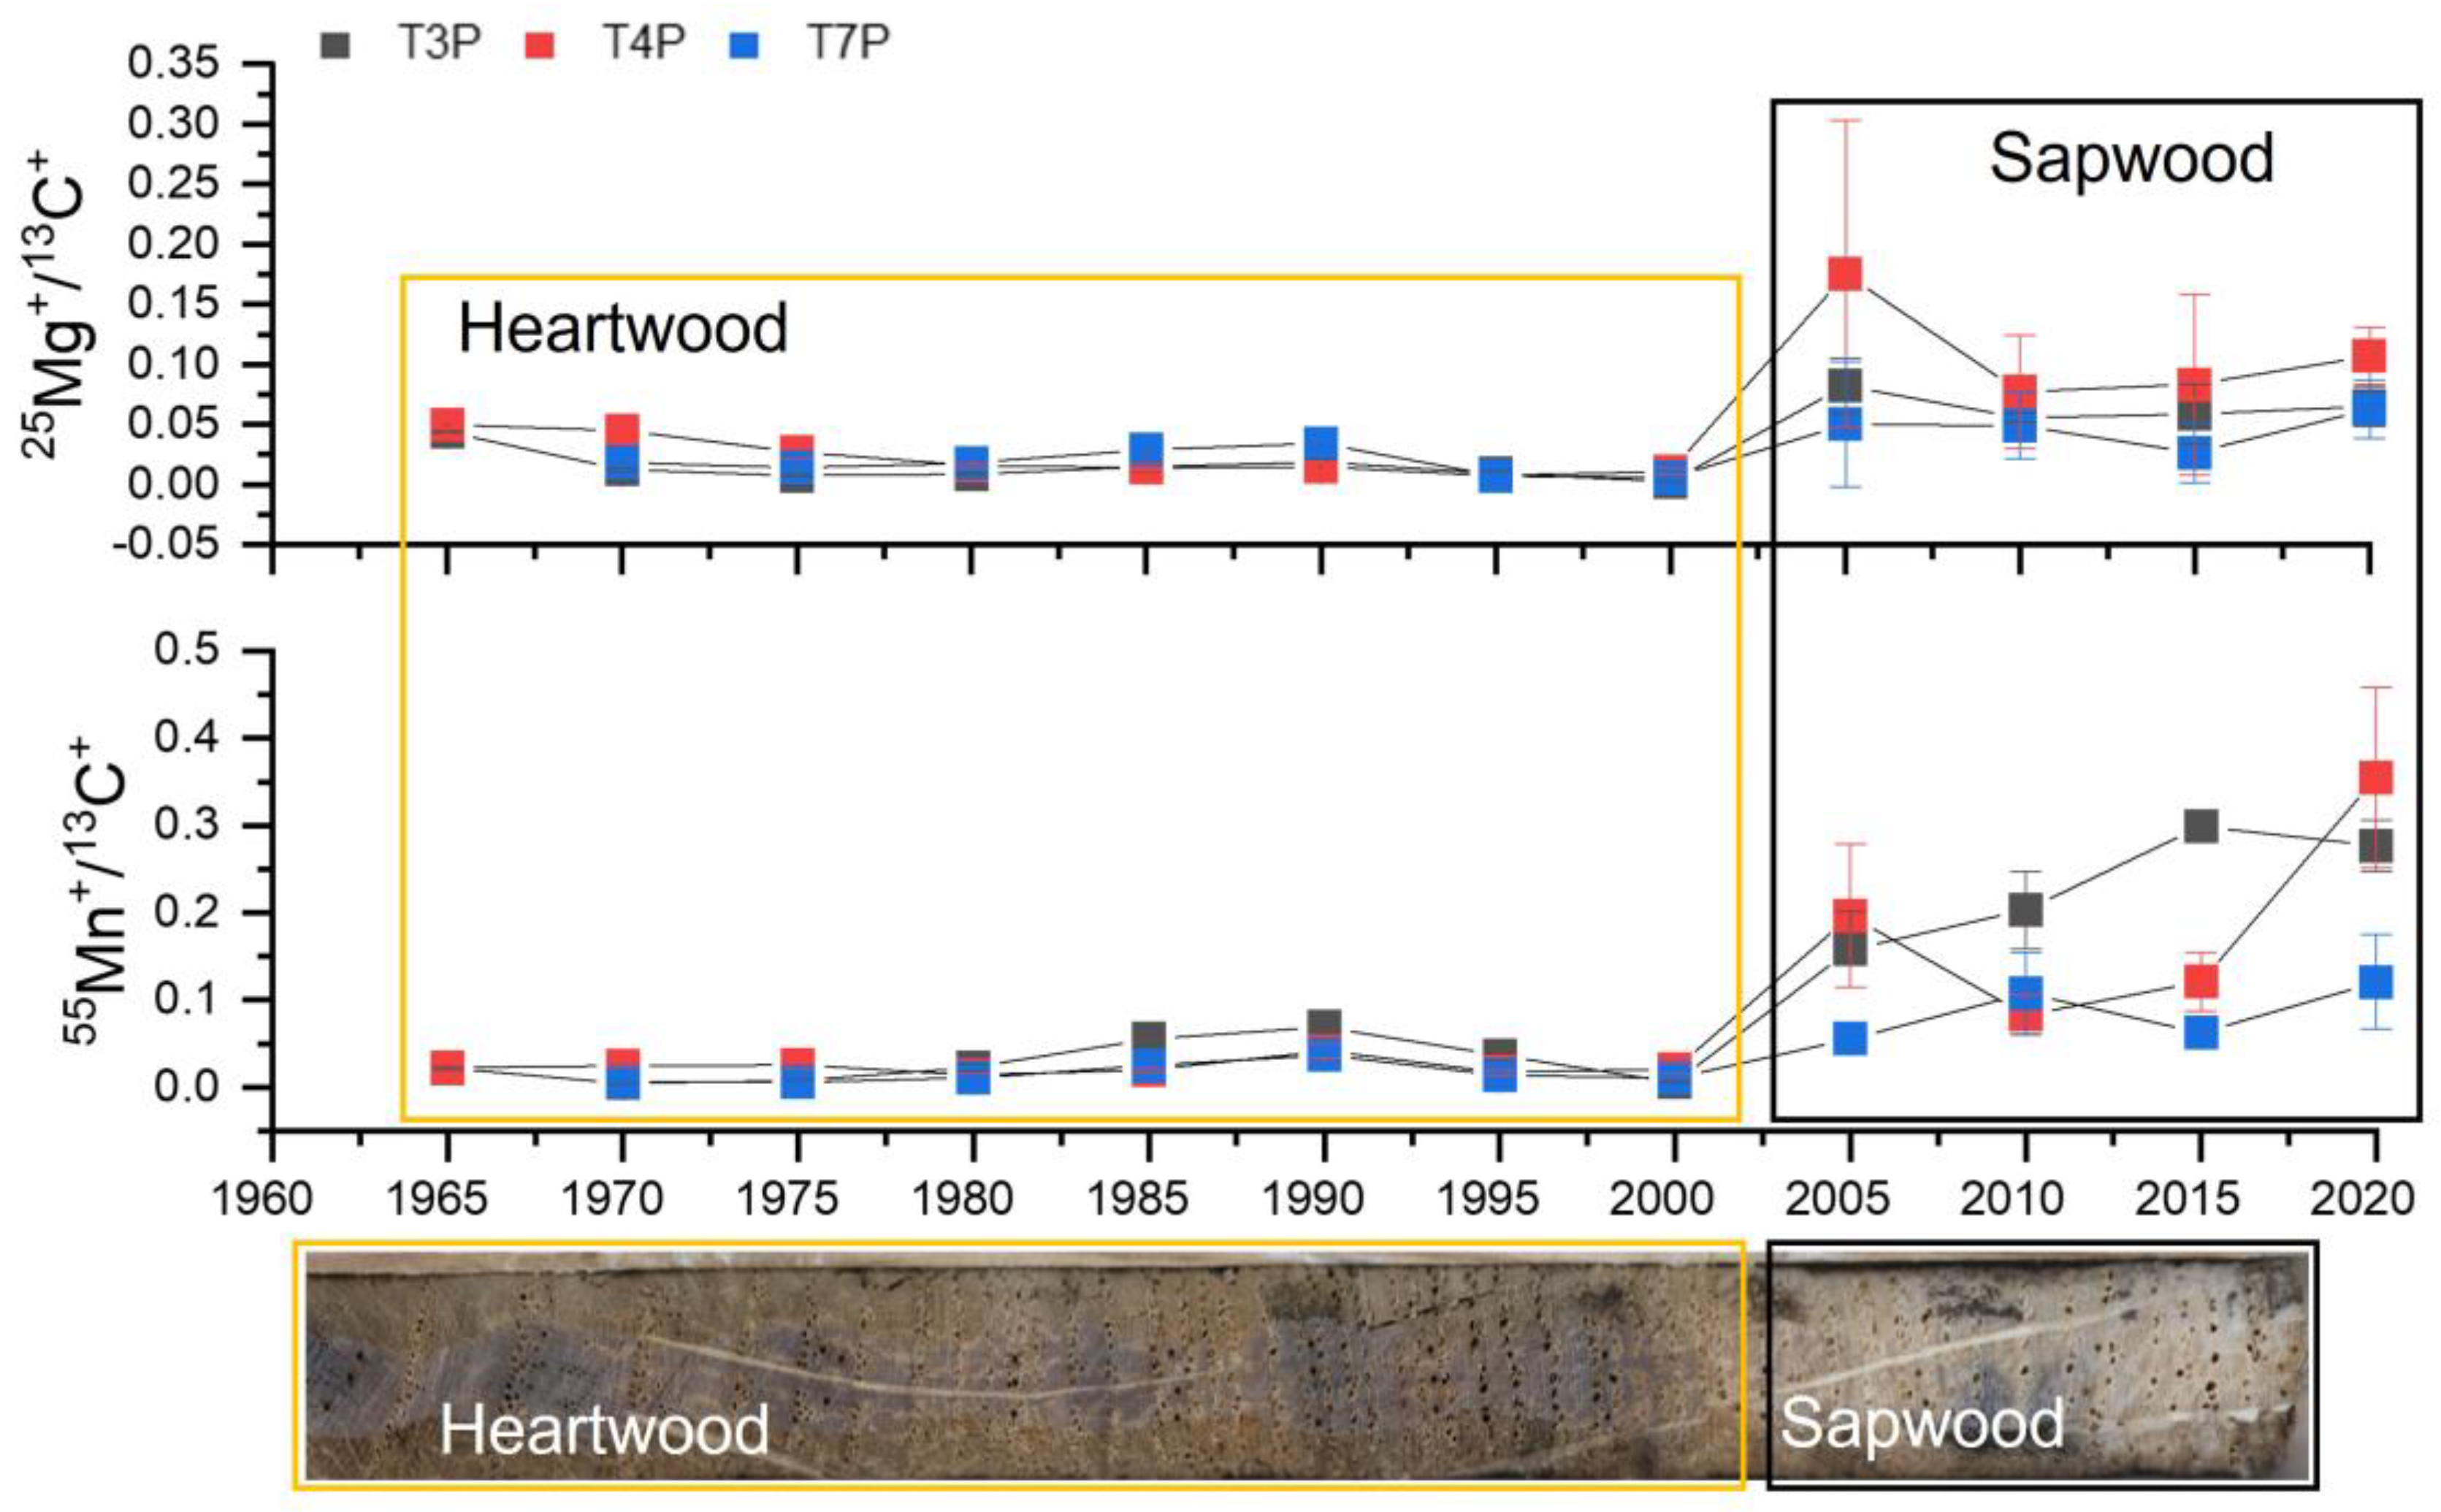
4.1. Temporal Distribution of Chemical Elements Related to the Tree Physiology and Wood Anatomy

The ablation of three spots per ring using LA-ICP-MS allowed us to have a statistically strong annual signal, which at the same time revealed a high intra-ring variability for most elements. Concentration peaks mostly occurred in T3P and T4P trees for Ca, Zn, Fe, Cu, Si and for most trace metals (Ti, Ni, As, Tl, Pb and Bi), especially in the heartwood during the 1980s and 1990s (Figure 2a,b). Chemical intra-ring variability can be caused by the presence of different cell types in the wood, i.e., fibers, parenchyma and vessel cell walls, as verified by scanning LA-ICP-MS on semi-porous tree rings of Tipuana tipu (Benth.) Kuntze [33], or caused by local aggregations of the respective elements [34]. Moreover, the variability among trees, i.e., the incorporation of nutrients, as well as of trace metals from various emission sources, is affected by root and leaf exposure, soil characteristics, and deposition pattern, and affects each tree individually [17]. In case of anthropogenic emissions, the distance and exposition of the trees to the contaminants are essential.
Trees’ physiological processes and the heartwood–sapwood transition may affect the element distributions in the stem [11]. It is common knowledge that generally most chemical elements have a higher concentration in the sapwood than in the heartwood [15] because of the presence of living parenchyma cells and the transport of nutrients in the water solution from the roots to the crown. Essential elements, such as Cu, P and Zn, tend to increase towards the outer rings to meet the metabolic needs of the cambium, whereas non-essential elements, such as Cd and Pb, show no radial tendency [13]. However, nutrient concentration profiles are highly species- and element-specific. Potassium and S most often have higher concentrations in the sapwood, whereas Ca, Mg and Mn often have higher concentration in the heartwood [12,35]. Three nutrient profiles have been described in the hardwoods [36]: (i) a gradual decrease from pith to cambium, (ii) a minimum at the heartwood–sapwood boundary region, and (iii) a maximum at the boundary region. In our study, the temporal variation in K is described by the first case, that of Mg, Mn, S, Zn and Cu by the second case, and that of Si by the third case (although Si had an overall significant negative trend) (Figure 2a). Calcium and Fe did not show any clear radial profile, although a gradual increase from pith to bark was described for Ca in, for example, Q. mongolica [37] and Larix decidua L. [15]. The decline of the element concentrations with tree age is related to the diminishing binding capabilities of the xylem [38]. On the other hand, a sharp increase after the heartwood–sapwood boundary could be attributed to the strong transport through the symplast in the outermost tree rings from senescing sapwood rings [32]. Potassium, a highly mobile element, showed the highest signal compared to all other chemical elements, despite gradually decreasing over time. Manganese is required in lignin biosynthesis; thus, a decline in Mn content is likely related to a lower requirement for lignin in the cell walls as tree ages [33]. Our results showed that Mn and Mg were strongly correlated, suggesting a common physiological use by the trees or coupled translocations related to the ion charges [15]. Consequently, their abrupt temporal variation after 2000 is associated with the sapwood–heartwood boundary formation and their redistribution in the wood (Figure 3). The same radial distribution patterns for Mg and Mn have been described in Quercus robur L. [32,35], Q. mongolica [37] and Pinus taeda L. [38], whereas K decreased or stayed constant in the heartwood after increasing in the sapwood, which could be related to the cellulose structure. The temporal variation in Zn and Cu in the tree rings of Q. mongolica appeared to be irregular and tree-dependent in the heartwood, but increased in the sapwood, as previously reported [13,39].
Unlike the essential nutrients in the wood, the concentration of most trace metals (e.g., Ti, Al, Ni, Cr, Tl, Pb and Bi) seemed to be linked to different uptake rates and environmental factors, rather than to physiological factors. These trace elements were present in relatively lower concentrations compared to essential nutrients and their temporal distribution was characterized by high intra-ring and among-tree variability (Figure 2b). They did not appear to be directly influenced by the heartwood–sapwood boundary, but increases in Co, Cr and Ni were observed in the outermost rings, most likely due to the sapwood flow (Figure 2b).
The element characteristics and concentrations can certainly be more complicated and influenced by many other factors, such as tree exposure to temporally variable pollution emissions in the environment. Thus, our results showed that most essential elements, i.e., S, Ca, Mn, Fe and Si, have a similar trend with no statistical difference between the two sites (Figure 4), most probably because they are mainly controlled by physiological processes specific to this tree species; thus, their concentrations cannot isolate the effect of pollution in Q. mongolica. On the contrary, some trace elements and other essential elements such as Mg, K, Zn and Cu, which can be also emitted in the environment as PM from anthropogenic activities, can be used for tracking environmental pollution, as discussed below.

4.2. Chemical Elements Related to Changes in Environmental Pollution

4.2.1. Identifying Chemical Elements as Pollution Indicators

In the present study, we were able to identify clear differences between the polluted site of Harbin and the control site of Mao’ershan for the following elements (Figure 4): Sr, Ni, Tl and As (p < 0.001), K and Mg (p < 0.01), and Cr and Pb (p < 0.05). Such differences were mainly found in the concentration of trace metals not of importance for plant physiological processes, but they were also found in the concentration of essential nutrients such as Mg, K and Zn, which are required for plant growth. Essential nutrients could have also been influenced by anthropogenic emissions. Except for Tl, trees growing in Harbin recorded a higher signal in these elements than the trees growing in Mao’ershan, for the period 1965–2020 (Figure 4). On the contrary, the distribution of other trace metals (i.e., Ti, Al and Co, Figure 2b) was similar in trees from both sites, meaning that they could have derived from natural sources, e.g., soil bedrock, rather than anthropogenic emissions.
To investigate the pollution history in Harbin, it was very important to choose comparable trees in polluted and control sites, i.e., possibly healthy trees of the same age and the same species. We also had to consider the heartwood–sapwood boundary when assessing differences between the sites, especially for those elements that change their trend from pith to bark, i.e., Mg and K. In our case, the heartwood–sapwood boundary occurred in the same transition years for all trees, allowing a reliable interpretation of the elements’ trend over time [11]. Lastly, we selected the ablated spot with the highest value among the three measured per single annual ring, in order not to “smooth” the signal by averaging high evidence of pollution (or ablation of a particle in the wood). Despite the fact that no-smoothing may be a source of artefacts, this methodological decision is trustworthy because the LA-ICP-MS data were previously processed for data reduction and spike removal; thus, the chance of having outliers is very low. Due to this, the abundance of Cr was no longer found to be statistically different between sites for the analyzed periods. Instead, Cu was found to show significant differences between the two sites, specifically in the heartwood (Figure 5). Therefore, the chemical elements that showed evidence of changes in environmental pollution over time were Mg, K, Zn, Cu, Ni, Pb, As, Sr and Tl, discussed further below.
Although Q. mongolica was found to be a suitable species for dendrochemical studies using LA-ICP-MS, comparison with other tree species could have been useful to broaden our understanding of the efficiency of heavy metal uptake in Harbin by different tree species and of the effects of wood anatomy and physiological processes on the elemental distribution in the tree rings. Moreover, data on the chemical composition of the atmosphere and soil over a long period of time would have been helpful to use for comparison with the LA-ICP-MS data and for a quantitative assessment of the elemental concentration in the tree rings.

4.2.2. Chemical Signals of Mg and K

Although Mg is an essential macronutrient for plants and has a similar radial distribution in trees growing at Harbin and Mao’ershan, significant differences between sites were found in both heartwood (before 2000; p = 0.012) and sapwood years (after 2000; p = 0.033). Higher Mg signals at the Harbin site from 2005 to 2020 could imply additional input or sources of Mg, absent at the Mao’ershan site. In fact, high loadings of Mg could derive from cement manufacturing processes and from construction sites in the highly urbanized Harbin City [4]. However, it is also possible that this difference may be caused by age-related xylem binding capabilities [38] because the trees in the polluted site were younger. As another essential macronutrient, K resulted to be significantly higher (p < 0.001) in Harbin than in Mao’ershan only in the heartwood years (1965–2000). Besides natural sources (e.g., crust or soil emission), anthropogenic sources of K could be mainly attributed to incinerators and burning abandoned biomass in the surrounding areas of Harbin [21,22]. Interestingly, a significant negative K trend was observed only in trees from Harbin, as previously described (Table 3). Although other studies have seen an increase in K towards the outermost rings, while decreasing or being constant in the heartwood [32,35,37], in our case this trend can only be observed in trees from the control site after the heartwood–sapwood boundary (from 2000 onwards) (Figure 5). Thus, our results suggest that the expected physiological abundance of K in Q. mongolica could have been masked or obfuscated by the high anthropogenic emissions of K in Harbin and their consequent decline over the years (either reaching same levels in the sapwood years as in Mao’ershan or vice versa), rather than explained by a decreasing trend in K from pith to bark due to physiological factors.

4.2.3. Chemical Signals of Zn, Cu, Ni and Pb

Significant higher signals were recorded in Harbin than in Mao’ershan for Cu (p = 0.034), Zn and Pb (p = 0.005 and p = 0.002, respectively), and Ni (p < 0.001) between the 1970s and the 1990s. No significant differences in Zn, Ni, Cu and Pb after 2000 between sites could be attributed to the success of reducing national PM emissions, as a result of the Air Pollution Prevention and Control Action Plan implemented by the Chinese government for the 2013–2017 period [3], or to the spread of air pollution from urban to rural areas. Although Zn and Cu are recognized as essential micronutrients for plant growth, they can be emitted in the environment as PM from anthropogenic activities, and thus they can accumulate in trees close to the pollution source. The main sources of Zn are automobile exhaust, zinc mining and its wastes, and galvanizing, whereas Ni, Cu and Pb are typically associated with the characteristics of road dust, with Pb also deriving from coal burning and automobile exhaust [4]. Zinc, Cu and Pb in the leaves of broad-leaved trees can potentially originate from atmospheric deposition onto leaves, and consequently can be taken up through the leaves, suggesting that broad-leaved trees play an important role in removing air pollution [6]. Strong significant positive correlations shown by Spearman’s correlation coefficient between Zn, Ni and Cu suggest common emission sources. Results for these elements are similar to those in [20]. Our results clearly show that no significant difference between Harbin and Mao’ershan for Pb after 2000 can be associated with the use of unleaded gasoline in China. In July 2000, Pb concentration in the atmosphere was below 0.013 g L−1, despite the increase in the number of vehicles [39]. A slight increase in Pb after 1995 is also visible in Mao’ershan, probably due to the rising numbers of vehicles that started to affect the control site. Although the degree of root uptake is supported for most elements, the uptake in Pb likely occurred by foliar uptake, since Pb is commonly encountered in a particulate form that could deposit onto leaf surfaces [10] and enter through the stomata [6]. As for soluble elements, such as Zn and most essential nutrients, they could penetrate the leaf cuticle [10].

4.2.4. Chemical Signal of As

Arsenic-contaminated groundwater has been a health threat in China since 1960 [40]. As China is the biggest producer of arsenic worldwide, arsenic emissions increased exponentially from 1990 to 2010, mainly driven by increasing applications in glass making, wood preservatives, batteries, semiconductors and alloys, or unintentional release from mining and coal combustion [41]. This increasing trend is recorded in the tree rings from Harbin, where there is a clear significant difference (p = 0.034) between sites in the As signal from 2005 to 2020 (Figure 5). Nevertheless, an increase in As was already remarkable after 1990 in Harbin, whereas at the Mao’ershan site the As signal stayed constant or slightly decreased over the years.

4.2.5. Chemical Signal of Sr

Strontium isotopes can be used as an indicator of Ca availability in trees [42] because they exhibit similar geochemical characteristics. As a matter of fact, a significant positive correlation between Sr and Ca was found in the polluted and control sites (r = 0.90 and r = 0.89, respectively). Moreover, Sr was significantly higher in Harbin than in Mao’ershan (p = 0.016 in the heartwood and p = 0.034 in the sapwood), with high peaks in 1975, 2000 and 2005. However, the variation in Sr was not remarkable between the two sites, probably because Sr has a low relevance to human activities [21].

4.2.6. Chemical Signal of Tl

Thallium pollution in China, similar to As pollution, has affected drinking water sources and, thus, triggered removal technologies for Tl-containing wastewater in the late 2000s [43]. Unexpectedly, Tl was the only element that recorded its highest signal in the Mao’ershan-growing trees, being significantly higher than in Harbin over the entire analyzed period (p < 0.001 in heartwood, p = 0.034 in sapwood). Coal burning and cement production are two important anthropogenic sources of Tl [43]. The highest levels of Tl being in the control site can most likely be explained by the presence of a quarry for cement production a few kilometers away from the sampling site. Alternatively, lower concentrations of Tl in Harbin City could be associated with the emission reduction measures. Significant negative correlations in control trees between Tl and Mg, S, Mn, Ni, Zn and Pb could reveal the affinity among these elements and additional sources of Tl dispersion in the soils and water (see Table S2). Surprisingly, Tl had a significant negative trend over the years in both sites, which is in contrast with the observed increasing Tl emissions in China. In a similar study, Tl patterns in Pinus sylvestris L. tree rings did not correspond to changes in Tl deposition, suggesting the lateral translocation of Tl in the sapwood and its accumulation at the heartwood–sapwood boundary [44]. In our study, several reasons could explain its trend: (i) high concentration of Tl in the 1980s when the cement production started because of depletion of the so-called “non-plant-available fractions” of Tl by hyperaccumulator plants, such as in the case of some Brassicaceae species [45]; (ii) occurrence of lateral translocation of Tl and its storage in the heartwood due to its high toxicity, when heartwood functions as waste storage [46]; (iii) biogeochemical affinity with K, Mg and Mn which could influence the transport of Tl in the tree rings [47]; (iv) implementation of Tl removal strategies (such as the use of Mn in adsorbing Tl from wastewater; in this case, Mn has a significant negative correlation with Tl), although such implementations only started in the 2000s [43]; and (v) a decline/improvement in the cement production of the quarry (unfortunately we have no data available to support this, but it is rather unlikely to be the case). Thus, our results cannot guarantee that the use of dendrochemistry for tracing the history of Tl is fully reliable; however, they demonstrated that Q. mongolica was accumulating this heavy metal, emitted from a pollution source of Tl, i.e., a cement quarry, which was closer to the trees at the control site than to the trees at the polluted site. Our finding also suggests that it is not easy to find a pollution-free control site in such areas, but it is important to be aware of the sources of pollutions and their emissions.

5. Conclusions

The dendrochemical analyses performed in this study using Q. mongolica tree rings from Harbin, northeastern China revealed that the temporal trend of some chemical elements is influenced by physiological factors, i.e., wood formation, environmental factors such as pollution, or both. In fact, trees’ physiological processes and the heartwood–sapwood transition affect the element distributions in the stem. Positive significant correlations in Mg and Mn among all trees strengthen their physiological role in the heartwood formation.
Our study confirmed that Harbin is more polluted than Mao’ershan, the control site. The chemical elements that showed evidence for changes in environmental pollution over time were Mg, K, Zn, Cu, Ni, Pb, As, Sr and Tl. All these elements, except for Tl, were significantly higher in Harbin than in Mao’ershan for the period 1965–2020. The signal of Zn, Ni, Cu and Pb in Harbin was high between the 1970s and the 1990s, whereas As showed a high increase from 2000 to 2020. A higher signal of Tl in Mao’ershan than in Harbin from 1965 to 2020 might be associated with emissions from a quarry for cement production close to the sampling site, but its temporal distribution is not fully reliable.
Dendrochemical analyses of Q. mongolica are a powerful tool to monitor the long-term history of pollution and to contribute to extending instrumental records of pollution back in time. It is also an efficient tool to reveal the successful application of emission reduction measures, as China’s urban air quality significantly improved after 2010. However, multiple complex factors, including lateral translocation and tree physiological and wood anatomical effects, as well as more and better data on air pollution and soil characteristics, must be considered in order to interpret the pollution signal in a more quantitative way.

Supplementary Materials

The following supporting information can be downloaded at: https://0-www-mdpi-com.brum.beds.ac.uk/article/10.3390/f14020187/s1; Figure S1: Monthly temperature (a, b) and precipitation (c, d), correlations with ring-width parameter from Mao’ershan (left) and Harbin (right). Both tree ring and instrumental data have been 30-year spline detrended. Dark grey bars indicate significant correlations at p ≤ 0.05.; Table S1: Examples of dendrochemical studies that investigated the trace metal concentration in different tree species across China; Table S2: Spearman’s correlation coefficients between elements in Mao’ershan and Harbin, that are significant at the 95% confidence level (p < 0.05), provided in bold and italic.

Author Contributions

Conceptualization, P.B., O.B., M.G., X.W. and P.C.; methodology, P.B., O.B. and M.G.; software, P.B. and M.G.; validation, P.B., O.B., M.G., X.W. and P.C.; formal analysis, P.B. and W.S.; investigation, P.B. and W.S.; resources, O.B., M.G., X.W. and P.C.; data curation, P.B.; writing—original draft preparation, P.B.; writing—review and editing, P.B., W.S., O.B., M.G., X.W. and P.C.; visualization, P.B.; supervision, project administration, funding acquisition, P.C. All authors have read and agreed to the published version of the manuscript.

Funding

This research was funded by the Swiss National Science Foundation program (SNSF), grant number 200021_182042.

Data Availability Statement

The data presented in this study are available on request from the corresponding author.

Acknowledgments

The authors would like to thank Binqing Zhao and Zecheng Chen for helping during the fieldwork, and Richard Peters for sharing the R scripts for detrending and climate correlations. P.B. wants to thank Paul Sheppard (University of Arizona) for his continuous support and encouragement.

Conflicts of Interest

The authors declare no conflict of interest.

Appendix A

Figure A1. Tree-ring width chronology from (a,c) Harbin (a, raw; c, detrended) and (b,d) Mao’ershan (b, raw; d, detrended). The tree-ring width chronologies were detrended with a 30-year spline to remove radial and height growth.
Forests 14 00187 g0a1

References

  1. Briffa, J.; Sinagra, E.; Blundell, R. Heavy metal pollution in the environment and their toxicological effects on humans. Heliyon 2020, 6, e04691. [Google Scholar] [CrossRef] [PubMed]
  2. Gao, C.; Gao, C.; Song, K.; Xing, Y.; Chen, W. Vehicle emissions inventory in high spatial–temporal resolution and emission reduction strategy in Harbin-Changchun Megalopolis. Process Saf. Environ. Prot. 2020, 138, 236–245. [Google Scholar] [CrossRef]
  3. Conibear, L.; Reddington, C.L.; Silver, B.J.; Chen, Y.; Arnold, S.R.; Spracklen, D.V. Emission Sector Impacts on Air Quality and Public Health in China from 2010–2020. GeoHealth 2022, 6, e2021GH000567. [Google Scholar] [CrossRef] [PubMed]
  4. Wang, Y.; Sun, Y.; Zhang, Z.; Cheng, Y. Spatiotemporal variation and source analysis of air pollutants in the Harbin-Changchun (HC) region of China during 2014–2020. Environ. Sci. Ecotechnol. 2021, 8, 100126. [Google Scholar] [CrossRef]
  5. Chen, L.; Liu, C.; Zhang, L.; Zou, R.; Zhang, Z. Variation in tree species ability to capture and retain airborne fine particulate matter (PM2. 5). Sci. Rep. 2017, 7, 3206. [Google Scholar] [CrossRef] [Green Version]
  6. Liang, J.; Fang, H.L.; Zhang, T.L.; Wang, X.X.; Liu, Y.D. Heavy metal in leaves of twelve plant species from seven different areas in Shanghai, China. Urban For. Urban Green. 2017, 27, 390–398. [Google Scholar] [CrossRef]
  7. Ballikaya, P.; Marshall, J.; Cherubini, P. Can tree-ring chemistry be used to monitor atmospheric nanoparticle contamination over time? Atmos. Environ. 2022, 268, 118781. [Google Scholar] [CrossRef]
  8. Cocozza, C.; Perone, A.; Giordano, C.; Salvatici, M.C.; Pignattelli, S.; Raio, A.; Schaub, M.; Sever, K.; Innes, J.L.; Tognetti, R.; et al. Silver nanoparticles enter the tree stem faster through leaves than through roots. Tree Physiol. 2019, 39, 1251–1261. [Google Scholar] [CrossRef]
  9. Ballikaya, P.; Brunner, I.; Cocozza, C.; Grolimund, D.; Kaegi, R.; Murazzi, M.E.; Schaub, M.; Schönbeck, L.C.; Sinnet, B.; Cherubini, P. First evidence of nanoparticle uptake through leaves and roots in beech (Fagus sylvatica L.) and pine (Pinus sylvestris L.). Tree Physiol. 2022, tpac117. [Google Scholar] [CrossRef]
  10. Lepp, N.W. The potential of tree-ring analysis for monitoring heavy metal pollution patterns. Environ. Pollut. 1975, 9, 49–61. [Google Scholar] [CrossRef]
  11. Hagemeyer, J. Trace metals in tree rings: What do they tell us. In Trace Elements—Their Distribution and Effects in the Environment; Markert, B., Friese, K., Eds.; Elsevier Science: Amsterdam, The Netherlands, 2000; Volume 4, pp. 375–385. [Google Scholar] [CrossRef]
  12. Cutter, B.E.; Guyette, R.P. Anatomical, chemical, and ecological factors affecting tree species choice in dendrochemistry studies. J. Environ. Qual. 1993, 22, 611–619. [Google Scholar] [CrossRef]
  13. Watmough, S.A. Monitoring historical changes in soil and atmospheric trace metal levels by dendrochemical analysis. Environ. Pollut. 1999, 106, 391–403. [Google Scholar] [CrossRef] [PubMed]
  14. Lévy, G.; Bréchet, C.; Becker, M. Element analysis of tree rings in pedunculate oak heartwood: An indicator of historical trends in the soil chemistry, related to atmospheric deposition. Ann. Sci. For. 1996, 53, 685–696. [Google Scholar] [CrossRef] [Green Version]
  15. Leonelli, G.; Battipaglia, G.; Cherubini, P.; Morra di Cella, U.; Pelfini, M. Chemical elements and heavy metals in European larch tree rings from remote and polluted sites in the European Alps. Geogr. Fis. Dinam. Quat. 2011, 34, 195–206. [Google Scholar] [CrossRef]
  16. Perone, A.; Cocozza, C.; Cherubini, P.; Bachmann, O.; Guillong, M.; Lasserre, B.; Marchetti, M.; Tognetti, R. Oak tree-rings record spatial-temporal pollution trends from different sources in Terni (Central Italy). Environ. Pollut. 2018, 233, 278–289. [Google Scholar] [CrossRef]
  17. Muñoz, A.A.; Klock-Barría, K.; Sheppard, P.R.; Aguilera-Betti, I.; Toledo-Guerrero, I.; Christie, D.A.; Gorena, T.; Gallardo, L.; González-Reyes, A.; Lara, A.; et al. Multidecadal environmental pollution in a mega-industrial area in central Chile registered by tree rings. Sci. Total Environ. 2019, 696, 133915. [Google Scholar] [CrossRef]
  18. Luo, Y.; Liu, S.; Che, L.; Yu, Y. Analysis of temporal spatial distribution characteristics of PM2.5 pollution and the influential meteorological factors using Big Data in Harbin, China. J. Air Waste Manag. Assoc. 2021, 71, 964–973. [Google Scholar] [CrossRef]
  19. Wang, C. Biomass allometric equations for 10 co-occurring tree species in Chinese temperate forests. For. Ecol. Manag. 2006, 222, 9–16. [Google Scholar] [CrossRef]
  20. Li, N.; Tian, Y.; Zhang, J.; Zuo, W.; Zhan, W.; Zhang, J. Heavy metal contamination status and source apportionment in sediments of Songhua River Harbin region, Northeast China. Environ. Sci. Pollut. Res. 2017, 24, 3214–3225. [Google Scholar] [CrossRef]
  21. Huang, L.; Yuan, C.S.; Wang, G.; Wang, K. Chemical characteristics and source apportionment of PM10 during a brown haze episode in Harbin, China. Particuology 2011, 9, 32–38. [Google Scholar] [CrossRef]
  22. Fang, W.; Song, W.; Liu, L.; Chen, G.; Ma, L.; Liang, Y.; Xu, Y.; Wang, X.; Ji, Y.; Zhuang, Y.; et al. Characteristics of indoor and outdoor fine particles in heating period at urban, suburban, and rural sites in Harbin, China. Environ. Sci. Pollut. Res. 2020, 27, 1825–1834. [Google Scholar] [CrossRef]
  23. Huang, L.; Wang, K.; Yuan, C.S.; Wang, G. Study on the seasonal variation and source apportionment of PM10 in Harbin, China. Aerosol Air Qual. Res. 2010, 10, 86–93. [Google Scholar] [CrossRef] [Green Version]
  24. Gärtner, H.; Nievergelt, D. The core-microtome. A new tool for surface preparation on cores and time series analysis of varying cell parameters. Dendrochronologia 2010, 28, 85–92. [Google Scholar] [CrossRef]
  25. Maxwell, R.S.; Larsson, L.A. Measuring tree-ring widths using the CooRecorder software application. Dendrochronologia 2021, 67, 125841. [Google Scholar] [CrossRef]
  26. Holmes, R.L. Computer-assisted quality control in tree-ring dating and measurement. Tree Ring Bull. 1983, 43, 69–78. [Google Scholar]
  27. Bunn, A.G. A dendrochronology program library in R (dplR). Dendrochronologia 2008, 26, 115–124. [Google Scholar] [CrossRef]
  28. Zang, C.; Biondi, F. treeclim: An R package for the numerical calibration of proxy-climate relationships. Ecography 2015, 38, 431–436. [Google Scholar] [CrossRef]
  29. Guillong, M.; Meier, D.L.; Allan, M.M.; Heinrich, C.A.; Yardley, B.W. Appendix A6: SILLS: A MATLAB-based program for the reduction of laser ablation ICP-MS data of homogeneous materials and inclusions. Mineral. Assoc. Can. Short Course 2008, 40, 328–333. [Google Scholar]
  30. Wigley, T.M.; Briffa, K.R.; Jones, P.D. On the average value of correlated time series, with applications in dendroclimatology and hydrometeorology. J. Appl. Meteorol. Climatol. 1984, 23, 201–213. [Google Scholar] [CrossRef]
  31. Watmough, S.A.; Hutchinson, T.C.; Evans, R.D. Development of solid calibration standards for trace elemental analyses of tree rings by laser ablation inductively coupled plasma-mass spectrometry. Environ. Sci. Technol. 1998, 32, 2185–2190. [Google Scholar] [CrossRef]
  32. Smith, K.T.; Balouet, J.C.; Shortle, W.C.; Chalot, M.; Beaujard, F.; Grudd, H.; Vroblesky, D.A.; Burken, J.G. Dendrochemical patterns of calcium, zinc, and potassium related to internal factors detected by energy dispersive X-ray fluorescence (EDXRF). Chemosphere 2014, 95, 58–62. [Google Scholar] [CrossRef] [PubMed]
  33. Locosselli, G.M.; Chacón-Madrid, K.; Arruda, M.A.Z.; de Camargo, E.P.; Moreira, T.C.L.; de André, C.D.S.; de André, P.F.; Singer, M.J.; Nascimento Saldiva, P.H.; Buckeridge, M.S. Tree rings reveal the reduction of Cd, Cu, Ni and Pb pollution in the central region of São Paulo, Brazil. Environ. Pollut. 2018, 242, 320–328. [Google Scholar] [CrossRef] [PubMed]
  34. Pirkkalainen, K.; Peura, M.; Leppänen, K.; Salmi, A.; Meriläinen, A.; Saranpää, P.; Serimaa, R. Simultaneous X-ray diffraction and X-ray fluorescence microanalysis on secondary xylem of Norway spruce. Wood Sci. Technol. 2012, 46, 1113–1125. [Google Scholar] [CrossRef]
  35. Penninckx, V.; Glineur, S.; Gruber, W.; Herbauts, J.; Meerts, P. Radial variations in wood mineral element concentrations: A comparison of beech and pedunculate oak from the Belgian Ardennes. Ann. For. Sci. 2001, 58, 253–260. [Google Scholar] [CrossRef]
  36. Taneda, K.; Ota, M.; Nagashima, M. The radial distribution and concentration of several chemical elements in woods of five Japanese species. Mokuzai Gakkaishi 1986, 32, 833–841. [Google Scholar]
  37. Chun, L.; Hui-yi, H. Tree-ring element analysis of Korean pine (Pinus koraiensis Sieb. et Zucc.) and Mongolian oak (Quercus mongolica Fisch. ex Turcz.) from Changbai Mountain, north-east China. Trees 1992, 6, 103–108. [Google Scholar] [CrossRef]
  38. Ortega Rodriguez, D.R.; de Carvalho, H.W.P.; Tomazello-Filho, M. Nutrient concentrations of 17-year-old Pinus taeda annual tree-rings analyzed by X-ray fluorescence microanalysis. Dendrochronologia 2018, 52, 67–79. [Google Scholar] [CrossRef]
  39. Liu, Y.; Ta, W.; Cherubini, P.; Liu, R.; Wang, Y.; Sun, C. Elements content in tree rings from Xi’an, China and environmental variations in the past 30 years. Sci. Total Environ. 2018, 619, 120–126. [Google Scholar] [CrossRef]
  40. Rodríguez-Lado, L.; Sun, G.; Berg, M.; Zhang, Q.; Xue, H.; Zheng, Q.; Johnson, C.A. Groundwater arsenic contamination throughout China. Science 2013, 341, 866–868. [Google Scholar] [CrossRef]
  41. Shi, Y.L.; Chen, W.Q.; Wu, S.L.; Zhu, Y.G. Anthropogenic cycles of arsenic in mainland China: 1990–2010. Environ. Sci. Technol. 2017, 51, 1670–1678. [Google Scholar] [CrossRef]
  42. Åberg, G.; Jacks, G.; Wickman, T.; Hamilton, P.J. Strontium isotopes in trees as an indicator for calcium availability. Catena 1990, 17, 1–11. [Google Scholar] [CrossRef]
  43. Liu, J.; Luo, X.; Sun, Y.; Tsang, D.C.; Qi, J.; Zhang, W.; Li, N.; Yin, M.; Wang, J.; Lippold, H.; et al. Thallium pollution in China and removal technologies for waters: A review. Environ. Int. 2019, 126, 771–790. [Google Scholar] [CrossRef] [PubMed]
  44. Vaněk, A.; Chrastný, V.; Teper, L.; Cabala, J.; Penížek, V.; Komárek, M. Distribution of thallium and accompanying metals in tree rings of Scots pine (Pinus sylvestris L.) from a smelter-affected area. J. Geochem. Explor. 2011, 108, 73–80. [Google Scholar] [CrossRef]
  45. Al-Najar, H.; Schulz, R.; Römheld, V. Effect of different cultivation techniques on thallium uptake of the Tl hyperaccumulator candytuft (Iberis intermedia) and Tl binding forms in the soil. In Plant Nutrition—Food Security and Sustainability of Agro-Ecosystems; Springer: Dordrecht, The Netherlands, 2001; pp. 470–471. [Google Scholar] [CrossRef]
  46. Stewart, C.M. Excretion and heartwood formation in living trees. Science 1966, 153, 1068–1074. [Google Scholar] [CrossRef]
  47. Wang, J.; Huang, Y.; Beiyuan, J.; Wei, X.; Qi, J.; Wang, L.; Fang, F.; Liu, J.; Cao, J.; Xiao, T. Thallium and potentially toxic elements distribution in pine needles, tree rings and soils around a pyrite mine and indication for environmental pollution. Sci. Total Environ. 2022, 828, 154346. [Google Scholar] [CrossRef] [PubMed]
  48. Kuang, Y.; Zhou, G.; Wen, D. Environmental bioindication of sulfur in tree rings of Masson pine (Pinus massoniana L.) in the Pearl River Delta of China. Front. For. China 2009, 4, 1–6. [Google Scholar] [CrossRef]
  49. Wu, S.; Zhou, S.; Li, X.; Johnson, W.C.; Zhang, H.; Shi, J. Heavy-metal accumulation trends in Yixing, China: An area of rapid economic development. Environ. Earth Sci. 2010, 61, 79–86. [Google Scholar] [CrossRef]
  50. Cui, M.; He, X.; Davi, N.; Chen, Z.; Zhang, X.; Peng, J.; Chen, W. Evidence of century-scale environmental changes: Trace element in tree-ring from Fuling Mausoleum Shenyang, China. Dendrochronologia 2013, 31, 1–8. [Google Scholar] [CrossRef]
  51. Hu, S.; Wang, X.; Yang, J. Interannual variation patterns of heavy metals concentrations in tree rings of Larix gmelinii near Xilin Lead-zinc Mine, Yichun of Northeast China. Chin. J. Appl. Ecol. 2013, 24, 1536–1544. (In Chinese) [Google Scholar]
  52. Xu, X.; Tong, L.; Stohlgren, T.J. Tree ring based Pb and Zn contamination history reconstruction in East China: A case study of Kalopanax septemlobus. Environ. Earth Sci. 2014, 71, 99–106. [Google Scholar] [CrossRef]
  53. Xu, J.; Jing, B.; Zhang, K.; Cui, Y.; Malkinson, D.; Kopel, D.; Song, K.; Da, L. Heavy metal contamination of soil and tree-ring in urban forest around highway in Shanghai, China. Hum. Ecol. Risk Assess. 2017, 23, 1745–1762. [Google Scholar] [CrossRef]
  54. Liu, Y.; Ta, W.; Bao, T.; Yang, Z.; Song, H.; Liu, N.; Wang, W.; Zhang, H.; Zhang, W.; An, Z. Trace elements in tree rings and their environmental effects: A case study in Xi’an City. Sci. China Ser. D Earth Sci. 2009, 52, 504–510. [Google Scholar] [CrossRef]
  55. Zhang, X. The history of pollution elements in Zhengzhou, China recorded by tree rings. Dendrochronologia 2019, 54, 71–77. [Google Scholar] [CrossRef]
  56. Zhao, X.; Hou, X.; Zhou, W. Atmospheric iodine (127I and 129I) record in spruce tree rings in the Northeast Qinghai-Tibet Plateau. Environ. Sci. Technol. 2019, 53(15), 8706–8714. [Google Scholar] [CrossRef] [PubMed] [Green Version]
  57. Chen, S.; Yao, Q.; Chen, X.; Liu, J.; Chen, D.; Ou, T.; Liu, J.; Dong, Z.; Zheng, Z.; Fang, K. Tree-ring recorded variations of 10 heavy metal elements over the past 168 years in Southeastern China. Elementa Sci. Anthrop. 2021, 9, 00075. [Google Scholar] [CrossRef]
  58. Zyskowski, E.; Wu, F.; Amarasiriwardena, D. Investigation of pollution history in XKS mining area in China using dendrochronology and LA-ICP-MS. Environ. Pollut. 2021, 269, 116107. [Google Scholar] [CrossRef]
  59. Kang, H.; Liu, X.; Guo, J.; Zhang, Q.; Wang, Y.; Huang, J.; Xu, G.; Ge, W.; Kang, S. Long-term mercury variations in tree rings of the permafrost forest, northeastern China. Sci. China Earth Sci. 2022, 1–11. [Google Scholar] [CrossRef]
Figure 1. Sampling sites in the northeast Heilongjiang Province (Harbin as polluted site—black star, Mao’ershan as control site—white star) and example of ring-porous Quercus mongolica tree core used in this study.
Forests 14 00187 g001
Figure 2. Elemental signal in Harbin recorded in the tree rings of three tree cores (T3P, T4P, T7P trees) from 1965 to 2020. The heartwood–sapwood boundary is delineated by a dashed line. Groups: (a) essential (macro- and micro-) nutrients, (b) trace metals. Data show the means ± standard deviation (n = 3).
Forests 14 00187 g002aForests 14 00187 g002b
Figure 3. Heartwood-sapwood boundary is related to Mg and Mn signal in three tree cores (T3P, T4P, T7P trees) from Harbin. One tree core of Q. mongolica was taken as representative to visualize the heartwood-sapwood color difference and relate it to the chemical signal of Mg and Mn. Data show the means ± standard deviation (n = 3).
Forests 14 00187 g003
Figure 4. Box and Whisker plots used to determine which means were significantly different from others at the Harbin and Mao’ershan sites. Grouped as essential nutrients on the upper plot, trace metals on the lower plot. For the p values from Tukey’s mean comparison test: “*” p < 0.05, “**” p < 0.01, “***” p < 0.001. H = Harbin, M = Mao’ershan.
Forests 14 00187 g004
Figure 5. Elemental signal in the Harbin and Mao’ershan sites from 1965 to 2020. The two periods used in the statistical analyses are delineated by a dashed line. Kruskal-Wallis p values for statistical differences within each element between sites are shown for the two periods: “*” p < 0.05, “**” p < 0.01, “***” p < 0.001, “ns” not significant. Data show the means calculated from the highest value measured per tree ring ± standard deviation (n = 3).
Forests 14 00187 g005
Table 1. Characteristics of the tree ring width chronology of Q. mongolica from Mao’ershan and Harbin sites. EPS = Expressed Population Signal.
SiteNr Dated SeriesNr MeasurementAvr Series LengthPeriodMean (Std dev) Series IntercorrelationMean (Std dev) AR1Rbar.totEPS
Mao’ershan 201120561965–20200.62 (0.076)0.41 (0.164)0.460.94
Harbin 20107953.951965–20200.54 (0.081)0.57 (0.15)0.390.93
Table 2. Spearman’s correlation coefficient to test significant correlations between the elemental signals determined in different tree cores from Harbin (T3P, T4P, T7P trees). Correlation coefficients calculated for the whole tree cores, which are significant at the 95% confidence level (p < 0.05), are provided in bold and italics. For the p values: “*” p < 0.05, “**” p < 0.01, “***” p < 0.001.
Harbin Site
Tree Core ID T3P T7P T3P
T4P T4P T7P
Elements Coeffp Coeffp Coeffp
Mg 0.818*** 0.740** 0.901***
Al 0.007 −0.095 0.654*
Si 0.535 0.301 0.318
S 0.378 0.544 0.434
K 0.741** 0.519 0.745**
Ca 0.032 0.122 0.855***
Ti −0.385 −0.260 0.065
Cr −0.140 0.264 0.343
Mn 0.650* 0.708** 0.923***
Fe −0.182 −0.169 −0.114
Co −0.027 −0.134 0.511
Ni −0.145 0.039 0.719**
Cu −0.469 0.571* 0.080
Zn −0.089 0.475 0.638*
As 0.398 0.273 0.130
Sr 0.215 −0.095 0.310
Tl 0.562 0.298 0.694*
Pb −0.285 −0.498 −0.394
Bi 0.007 −0.226 −0.335
Table 3. Mann–Kendall rank correlation test of chemical elements in Harbin and Mao’ershan. Positive Tau values indicate positive trends, while negative Tau values indicate negative trends. For the p values: “*” p < 0.05, “**” p < 0.01, “***” p < 0.001.
HarbinTau2-Sided
p Value
Mao’ershanTau2-Sided
p Value
Mg 0.1820.4506 Mg 0.4240.0641
Al 0.3330.1498 Al 0.1520.5371
Si −0.3940.0864 Si −0.3640.1147
S 0.8180.0002 *** S 0.5340.0194 *
K −0.8480.0001 *** K −0.3330.1498
Ca 0.2420.30367 Ca 0.2730.2437
Ti 0.3030.1926 Ti −0.060.837
Cr 0.1980.4094 Cr −0.290.216
Mn 0.6360.0049 ** Mn 0.5760.0111 *
Fe −0.060.837 Fe −0.5760.0111 *
Co 0.5150.0236 * Co 0.060.837
Ni 0.3640.1147 Ni 0.4240.0641
Cu 0.1520.5371 Cu 0.2420.3036
Zn 0.5760.0111 * Zn 0.4850.0333 *
As 0.4850.0335 * As −0.4850.0333 *
Sr 0.1520.5371 Sr 0.3330.1498
Tl −0.7880.0004 *** Tl −0.7580.0007 ***
Pb −0.4550.0467 * Pb 0.1520.5371
Bi −0.1520.5371 Bi −0.1520.5371
Disclaimer/Publisher’s Note: The statements, opinions and data contained in all publications are solely those of the individual author(s) and contributor(s) and not of MDPI and/or the editor(s). MDPI and/or the editor(s) disclaim responsibility for any injury to people or property resulting from any ideas, methods, instructions or products referred to in the content.

