
Effects of Thinning on Soil Organic Carbon Fractions and Soil Properties in Cunninghamia lanceolata Stands in Eastern China


1
East China Coastal Forest Ecosystem Long-Term Research Station, Institute of Subtropical Forestry, Chinese Academy of Forestry, Hangzhou 311400, China
2
School of Agricultural, Forestry, and Environmental Sciences, Clemson University, Clemson, SC 29634-0317, USA
*
Author to whom correspondence should be addressed.
Forests 2017, 8(6), 198; https://0-doi-org.brum.beds.ac.uk/10.3390/f8060198
Submission received: 30 April 2017
/
Revised: 30 May 2017
/
Accepted: 4 June 2017
/
Published: 7 June 2017
Abstract
:Soil organic carbon (SOC) fractions, along with soil properties, are greatly affected by forest management. In this study, three thinning treatments: control (conventional management mode), moderate thinning intensity and heavy thinning intensity, were applied in Chinese fir (Cunninghamia lanceolata) plantations in eastern China. The dissolved organic carbon (DOC), soil light fraction organic carbon (LFOC) and heavy fraction organic carbon (HFOC), total SOC, DOC/SOC and LFOC/HFOC were not affected by thinning treatments. In the heavy thinning treatment, soil bulk density decreased, and soil water holding capacity and porosity increased in the topsoil layers (0–10 cm and 10–20 cm). Total nitrogen, hydrolysable nitrogen, and zinc concentrations increased in the topsoil layers (0–20 cm) in the heavy thinning treatment compared to the control treatment, while the available potassium concentration reduced. The moderate thinning treatment had little effect on the soil physical and chemical properties. Moreover, the variation of SOC fractions was strongly correlated to soil physical and chemical properties. These results suggest that thinning has little effect on the total SOC and its fractions in one rotation of Chinese fir tree in eastern China. In contrast, however, results also suggest that thinning has a positive effect on soil quality, to a certain extent.
1. Introduction
Forest soils play an important role in maintaining the productivity and sustainability of forest ecosystems. Forest management practices might affect the stability and size of soil organic carbon (SOC) pools, as well as the soil properties, by changing environmental conditions and vegetative production [1,2,3]. Thinning is a general silvicultural practice. It alters the micro-environment within modified stands, temporarily enhancing soil nutrient availability and altering soil moisture, soil temperature, root distribution, and the microbial community [4,5]. Soil physical and chemical properties are influenced by the changes of stand environment, which correlates with thinning intensity, interval, and method [3,6]. The variations in soil properties after thinning have the potential to greatly impact the tree growth [3,7], site productivity [7], and soil carbon sequestration [8,9].
Soils contain a variety of organic carbon compounds, each with a different residence time [10,11]. Recently, SOC fractions, which were separated by physical methods, were widely used to study the changes in soil carbon pools in forest management [12,13]. The light fraction of SOC is comprised of slightly decomposed plant residues and animal tissues, and is readily affected by changes in management activities [14], and is commonly characterized by a rapid turnover. In contrast, the heavy fraction is stabilized due to its interaction with mineral surfaces, and contains more soil organic matter (SOM), but a slower turnover [15,16,17,18,19]. Thinning changes the environmental conditions in a given stand, and alters the inputs from the litter layers and roots. Thus, thinning might have a great impact on the light and heavy fractions of SOC in the soil. In recent years, there have been a number of studies on the short-term (<5 years) and long-term (>10 years) effects of thinning on soil respiration and SOC storage [13,20,21,22,23]. However, less information is available on the effects of thinning on SOC fractions in mineral soil.
Some studies have shown that thinning deteriorates soil properties, which leads to an increase in soil bulk density, a reduction in soil water holding capacity and porosity in a mixed natural forest in southeastern China [3], and a decrease of nitrogen, phosphorus, and potassium in a mixed plantation in northeastern China [24] and a Mediterranean forest in southeastern Spain [8]. Other studies have found that thinning has little effect on soil physical and chemical properties at Coram Experimental Forest in northwestern Montana [25]. In fact, soil nutrients can be removed when trees are thinned from the stand [9]. Although thinning enhances nutrient availability for remaining trees [26], net primary productivity (NPP) may be temporarily reduced because thinning led to insufficient light interception capacity for the site to be at full NPP [27]. Most of these studies, however, mainly focus on the short-term effects of thinning on soil properties. In contrast, much less is known about the effects of repeated thinnings on soil properties, over a longer time period [3].
Chinese fir (Cunninghamia lanceolata) is a fast-growing evergreen conifer with high timber quality, and it is one of the main tree species of afforestation in southern China [28]. Currently, the area of Chinese fir plantations is up to 9.11 million ha, which accounts for 30% of all plantations in China [29]. Typically, Chinese fir plantations used for industrial timber production are thinned once or twice during a rotation period (approximately 25 years) [28]. Previous studies have mainly focused on the effects of thinning on Chinese fir growth and timber yield [30,31], and several studies have focused on the short term impact of thinning on understory biodiversity [32,33], and soil properties [32,34]. To date, very little information is available on the effects of thinning on SOC fractions and soil properties, over a longer period of time. Understanding the variations in SOC fractions and soil properties is crucial for evaluating the stability of the SOC pool and the sustainability of forest production following a thinning treatment. The objectives of this study were to: (1) compare the changes in the light and heavy fractions in the SOC after 15 years of thinning; (2) determine the variation of soil physical and chemical properties; and (3) evaluate the changes in soil quality under different thinning regimes.
2. Materials and Methods
2.1. Site Description
The experiment was conducted in the Kaihua Forest Farm (118°25′ E, 29°09′ N, mean altitude 234 m), located in the southwest of Zhejiang Province, China. The stands in the experimental site were planted in 1991 with Chinese fir seedlings of clone cuttings, following the harvesting of the existing Pinus massoniana plantations. The stand density was 3000 trees ha−1 in the planted stands.
The study area had a subtropical marine monsoon climate. The average annual temperature and precipitation in the study area were 16.4 °C and 1814 mm, respectively, and the frost-free period was 252 days. The slope of the experimental area was approximately 20% in the planted stands, and all plots had a northeastern aspect. The soil type in the study area was orthic Acrisol [35].
2.2. Experimental Design
Nine plots (20 m × 20 m) were established at Chinese fir plantation in 1997. This experiment included three treatments and three replicates for each treatment. The traditional management model was used as a control, which was a single, light thinning (stand density, number of trees, reduced by approximately 15%) and this was conducted in the middle (the 14th year) of the rotation period (approximately 25 years). Moderate thinning was conducted in the seventh year (stand density reduced by 20%) and the 14th year (stand density reduced by 16%). Heavy thinning was also conducted in the seventh year (stand density reduced by 33%) and in the 14th year (stand density reduced by 18%). Usually, the canopy of thinned stands will be closed after 5–7 years following thinning. The stem bole was removed after harvesting each plot, and the logging residues were left in the stands.
2.3. Growth Measurements
The diameter at breast height and canopy coverage of all trees in each plot were measured in October of 2012 [30]. The basic characteristics of each stand are shown in Table 1. The diameter at breast height and tree height showed no significant difference among the three thinning treatments prior to the thinning experiments [30].
2.4. Soil Sampling and Measurements
Soil samples were taken at four soil depths of 0–10 cm, 10–20 cm, 20–40 cm and 40–60 cm, and collected randomly from five points in each plot using a soil auger (4 cm in diameter, Bowei Instruments, Shaoxing, China). The five soil cores of the same layer in each plot were mixed as one sample. Each soil sample was sieved through a 2-mm mesh. Approximately 100 g sieved soil (<2 mm) was stored at 4 °C for the analysis of soil dissolved organic carbon (DOC). The rest sieved soil was air-dried and ground for the determination of light fraction SOC (LFOC), heavy fraction SOC (HFOC), total SOC, nutrients, and pH.
To determine the DOC, 10 g of a fresh soil sample from each plot were extracted with 50 mL deionized water in a centrifuge tube by shaking the mixture for 30 min (250 times/min) on a reciprocal shaker. Then, the samples were centrifuged at 6000 r/min for 15 min. The supernatants were filtered with a 0.45 µm millipore membrane. The water extracted organic carbon was determined using a total organic carbon analyzer (TOC-Vcph, Shimadzu, Kyoto, Japan) [36].
The light and heavy fractions were separated by flotation on a NaI solution with a density of 1.70 g cm−3 using the method described by Janzen et al. [37]. Three 10 g subsamples of each soil (<2 mm) were weighed in a 100 mL plastic centrifuge tube, and 50 mL of NaI liquid solution was added to the tube. The tubes were shaken on a shaker for 30 min and then centrifuged at 1000 rpm for 15 min. The floating light fraction was collected through a membrane filter (0.45 µm) in a Büchner funnel. This process was repeated three to four times, until no floating material remained. After that, the material remaining at the bottom of the tube (the heavy fraction) was added to 50 mL of deionized water, shaken and centrifuged three times to wash. The light fraction on the filter paper was washed three times with 0.01 mol L−1 CaCl2 to remove the excess NaI, and was washed again three times with deionized water. Both the light fraction and heavy fraction were dried at 60 °C for 48 h, and weighed and finely ground for the determination of organic carbon. LFOC, HFOC, and total SOC were measured using the K2Cr2O7 method [36]. SOM was determined by SOC×1.724 [38]. Total nitrogen and alkali-hydrolysable nitrogen concentrations were determined using the Kjeldahl method and the alkali solution diffusion method, respectively. Total phosphorus and available phosphorus concentrations were determined using a UV-2450 spectrophotometer (Shimadzu, Kyoto, Japan). Total potassium and available potassium concentrations were measured using alkaline fusion-flame photometry with an AP1200 Flame Photometer (CANY Instrument, Shanghai, China). Total nitrogen, hydrolysable nitrogen, total phosphorus, available phosphorus, total potassium and available potassium were measured using the method described by Zhang et al. [39]. Phyto-available concentrations of calcium, magnesium, copper, zinc, iron, and manganese were determined using the method described by Hendershot et al. [40], with an atomic absorption spectrophotometer (iCE 3000 Series, Thermo Scientific, Rockford, USA). Soil pH was determined using a glass electrode potentiometer (Mettler Toledo Instruments, Shanghai, China) in a dilution of soil with a soil: water ratio of 1:2.5 [41].
To measure the soil physical properties, additional intact soil cores from each soil depth were taken randomly at five soil profiles in each plot, using stainless steel cylinders with a volume of 100 cm3 (5.03 cm internal diameter, 5 cm height) [30]. Soil physical variables, such as soil water content (%), maximum water holding capacity (%), capillary water holding capacity (%), minimum water holding capacity (%), bulk density (g cm−3), the total porosity (%), capillary porosity (%), and non-capillary porosity (%) were determined using the method described by Zhang et al. [39]. The soil temperature at 5 cm, 15 cm, 30 cm, and 50 cm, in each plot, was measured using an EC-300 portable digital soil temperature meter (Aquaterr Instruments & Automation, Costa Mesa, USA). Measurement of soil temperature was made at approximately two-week intervals during the period of August to October 2012. Clay (0–0.002 mm), silt (0.002–0.02 mm), and sand (0.02–2 mm) content was determined by laser analyzer Mastersizer 2000 (Malvern Instruments, Malvern, UK). For each plot, the average value of each parameter for each soil depth layer was calculated.
2.5. Data Analysis
A one-way ANOVA and post hoc Duncan’s test were used to identify the effects of thinning treatments on SOC fractions, as well as on the soil physical and chemical properties. The relationship between the SOC fractions and soil physical and chemical properties was tested using the Pearson correlation. The effects were considered to be significantly different if p < 0.05.
Soil fertility index (SFI) is a useful way to evaluate the whole soil fertility. It is determined using three main steps: (I) selecting soil indicators and determining their weight, (II) calculating these soil indicators’ membership values, and (III) integration of the indicator scores into an overall index of soil fertility. The SFI was determined according to the following equation [41]:
where Ti is the weight vector of i soil fertility indicator and P(zi) is the scoring result of each indicator.
Principal component analysis (PCA) was employed as a data reduction technique to screen the most appropriate indicators. It reduces the dimensionality of a data-set while limiting the loss of information. In this study, PCA was used to determine the weight for each indicator. The PCA was performed on the 32 chemical and physical soil attributes which were previously standardized. Standardized variables have unit-variance, hence the total variance in the PCA is equal to the number of observed variables (32 in our case). The relative contribution of a PC to the total variance is represented by its eigenvalue. A PC with an eigenvalue greater than 1.00 was selected. Component loadings, i.e., weights given to the variables under a particular PC, were used to operate the reduction of the number of variables. Only the variables with component loading >0.900 were selected within each PC. Thus, 16 soil indicators which were selected from 0–10 cm soil layer were used to develop SFI. Similarly, 12 soil indicators were selected from 10–20 cm soil layer, 22 soil indicators were selected from 20–40 cm soil layer, and 21 soil indicators were selected from 40–60 cm soil layer. The weights of the soil fertility indicators (Ti) were calculated by the component capacity score coefficient and the cumulative values of component capacity score coefficient [Equation (2)] [42].
where Ci is the component capacity score coefficient of i soil indicator.
Ascending and descending functions [Equations (3) and (4)] were used to calculate scoring results [P(zi)]. A descending function was used for bulk density, due to a higher bulk density usually indicates soil deterioration, and an ascending function was applied to other soil properties [43].
where zij is the value of the selected soil’s physical and chemical properties; zi max is the maximum values, and zi min are the minimum values of the ith soil indicator. All data were analyzed using SPSS 17.0 for Windows (IBM SPSS Statistics).
3. Results
3.1. SOC Fractions
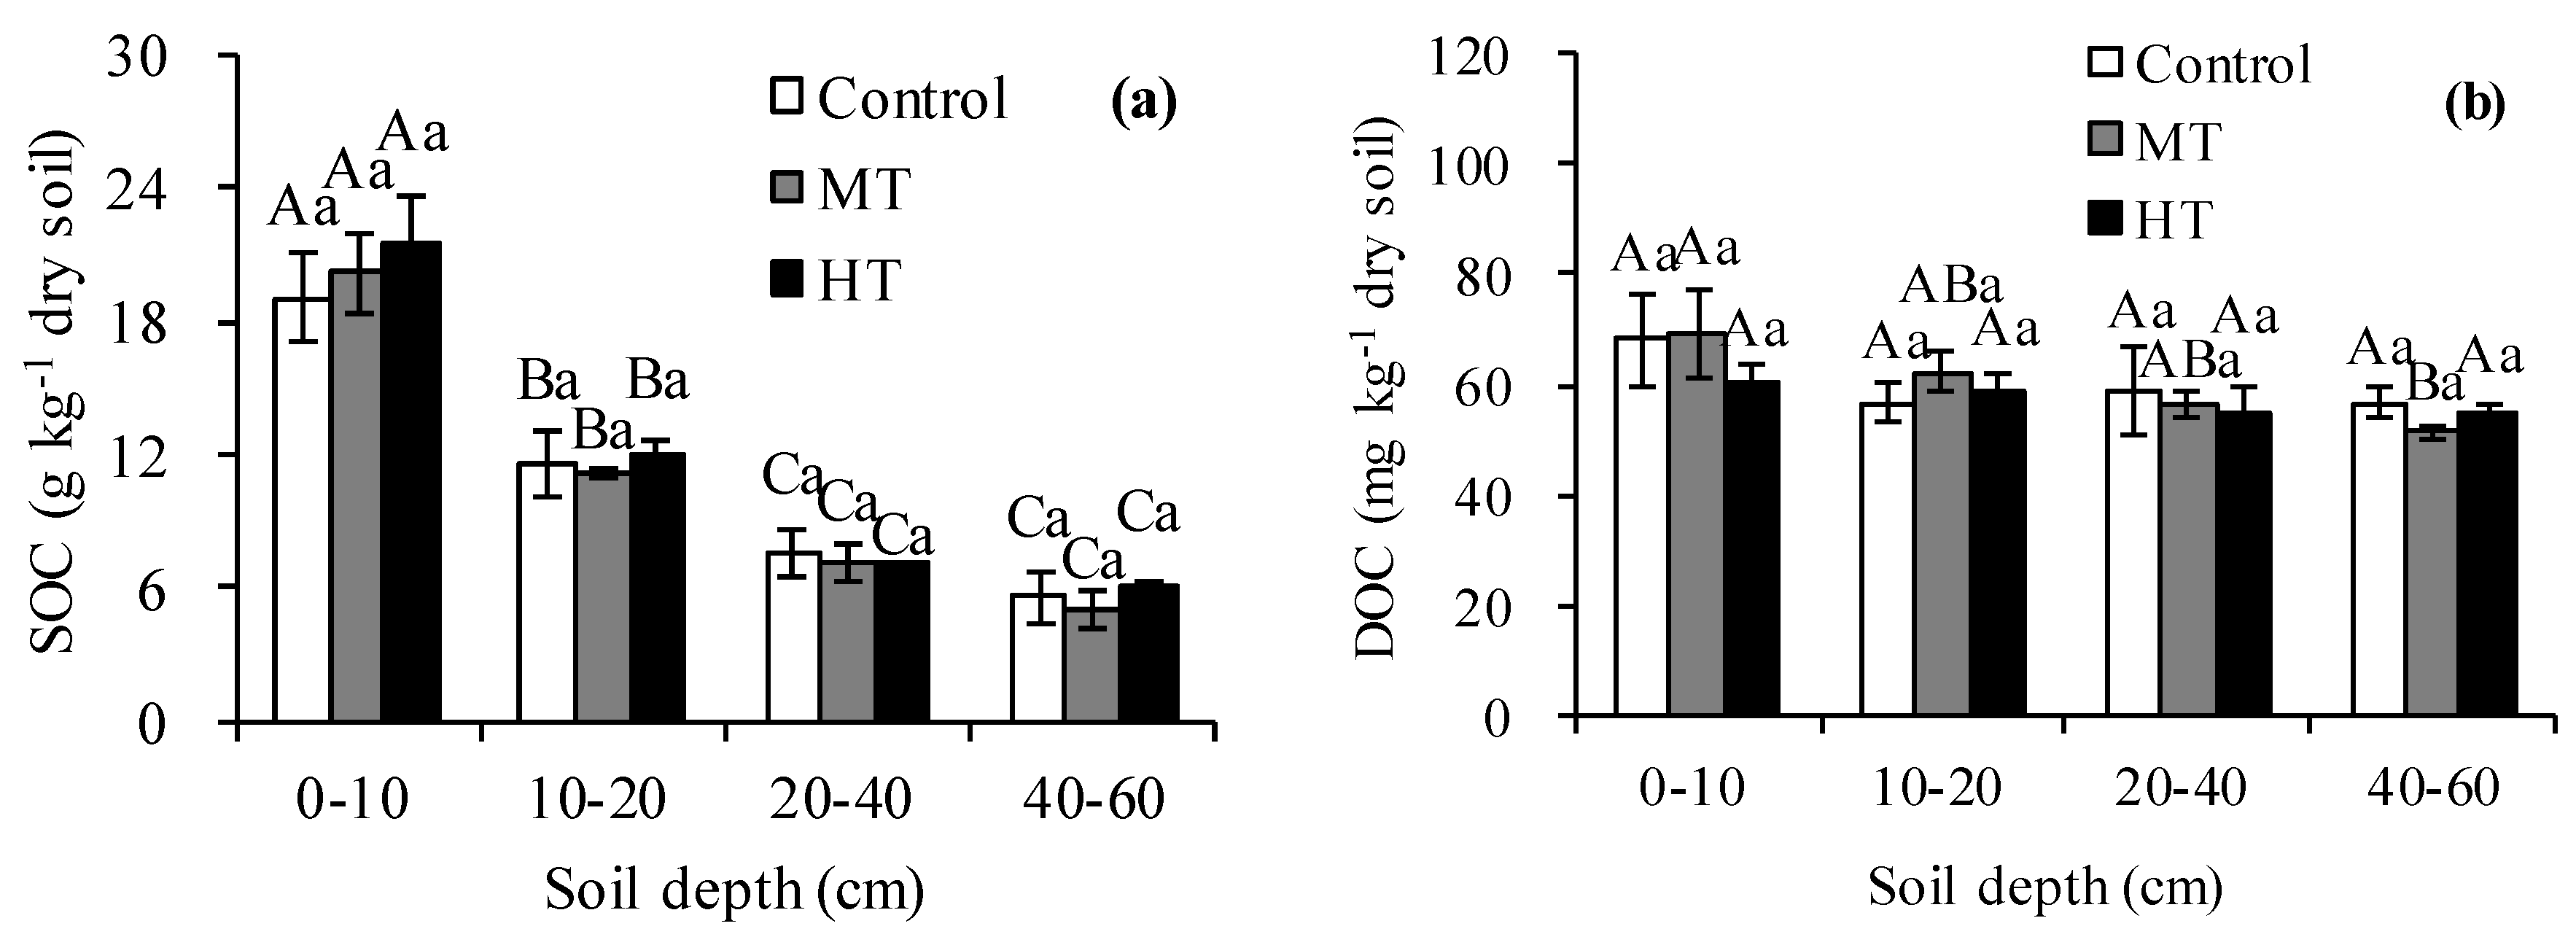
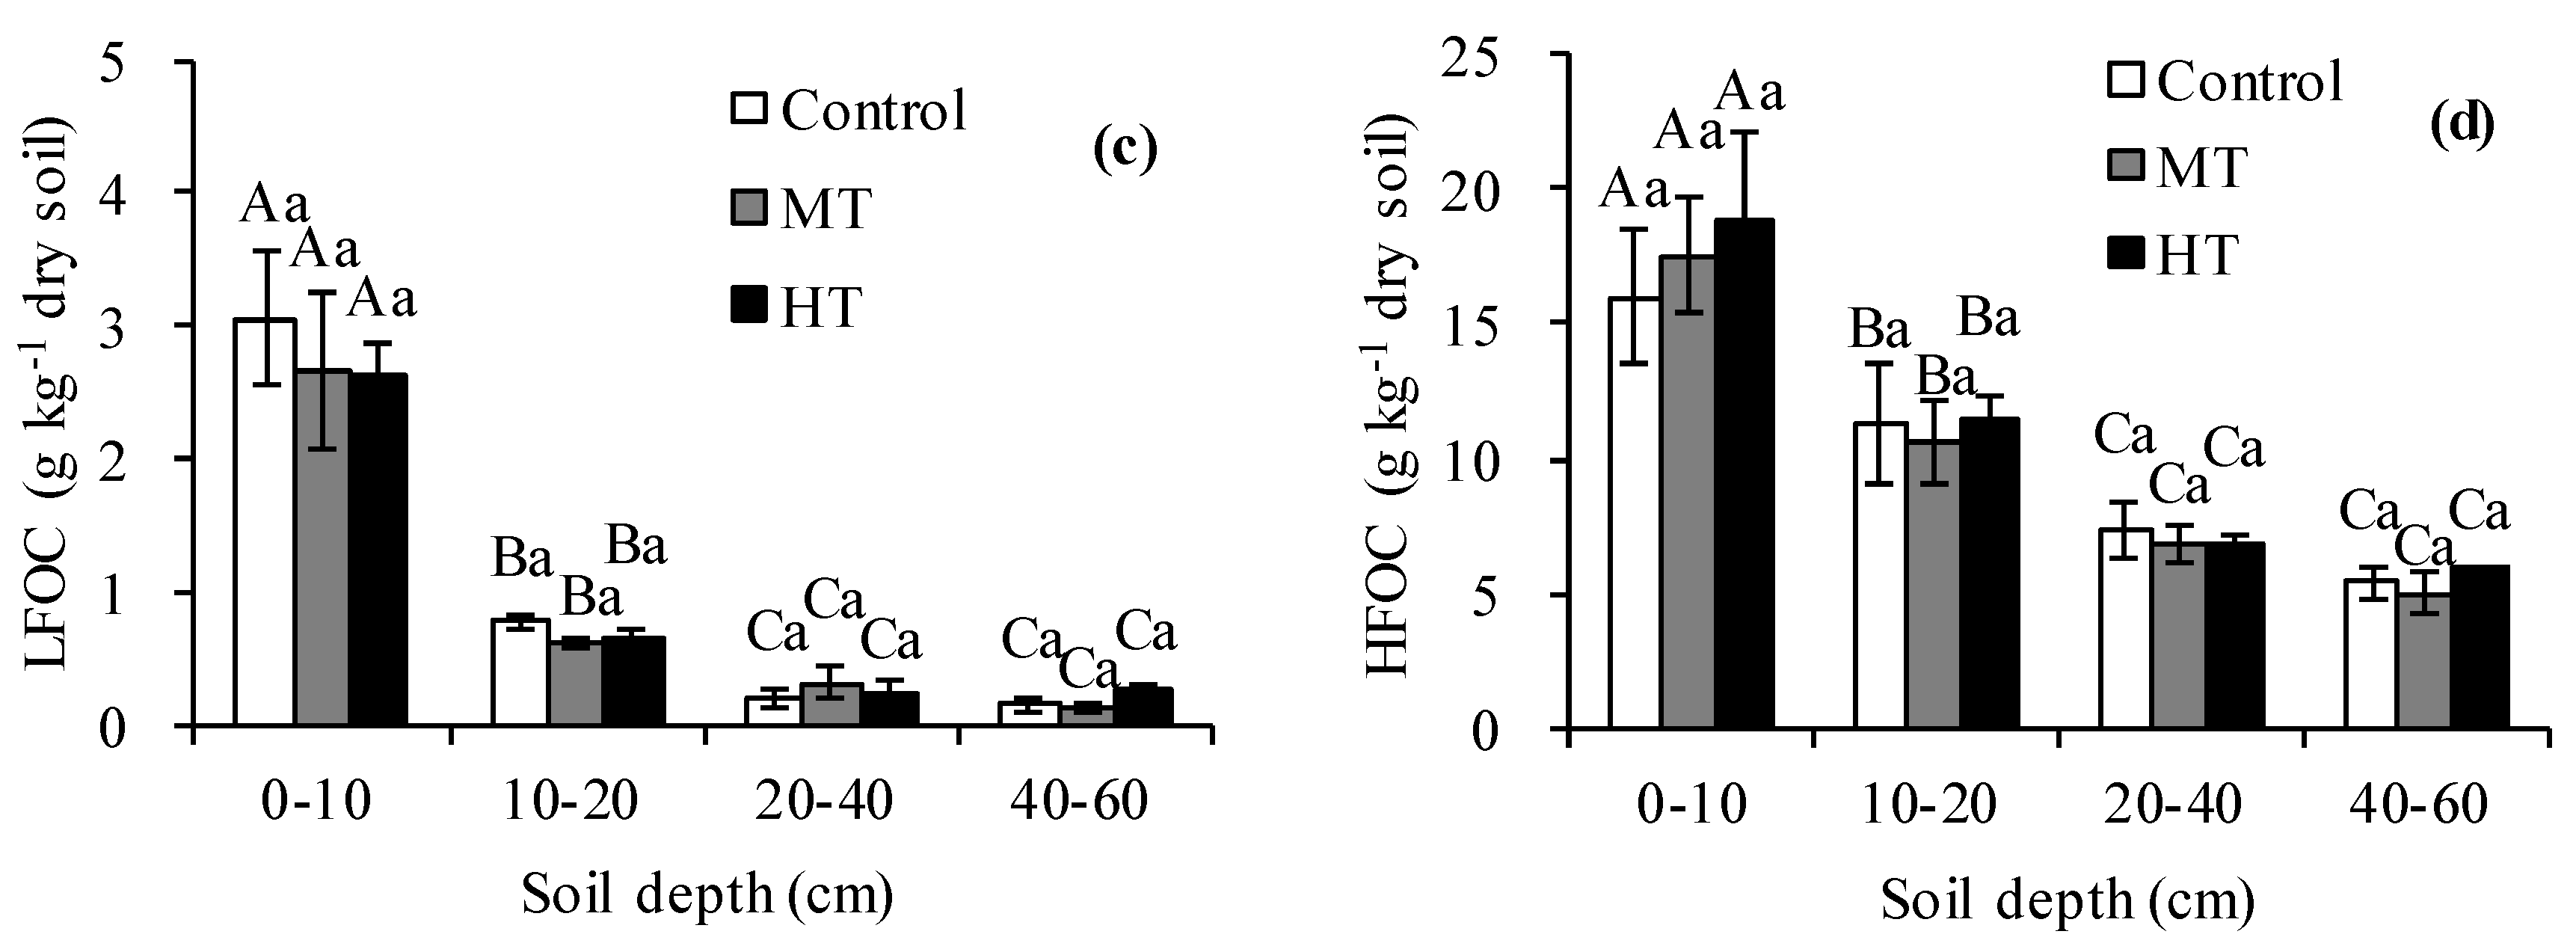
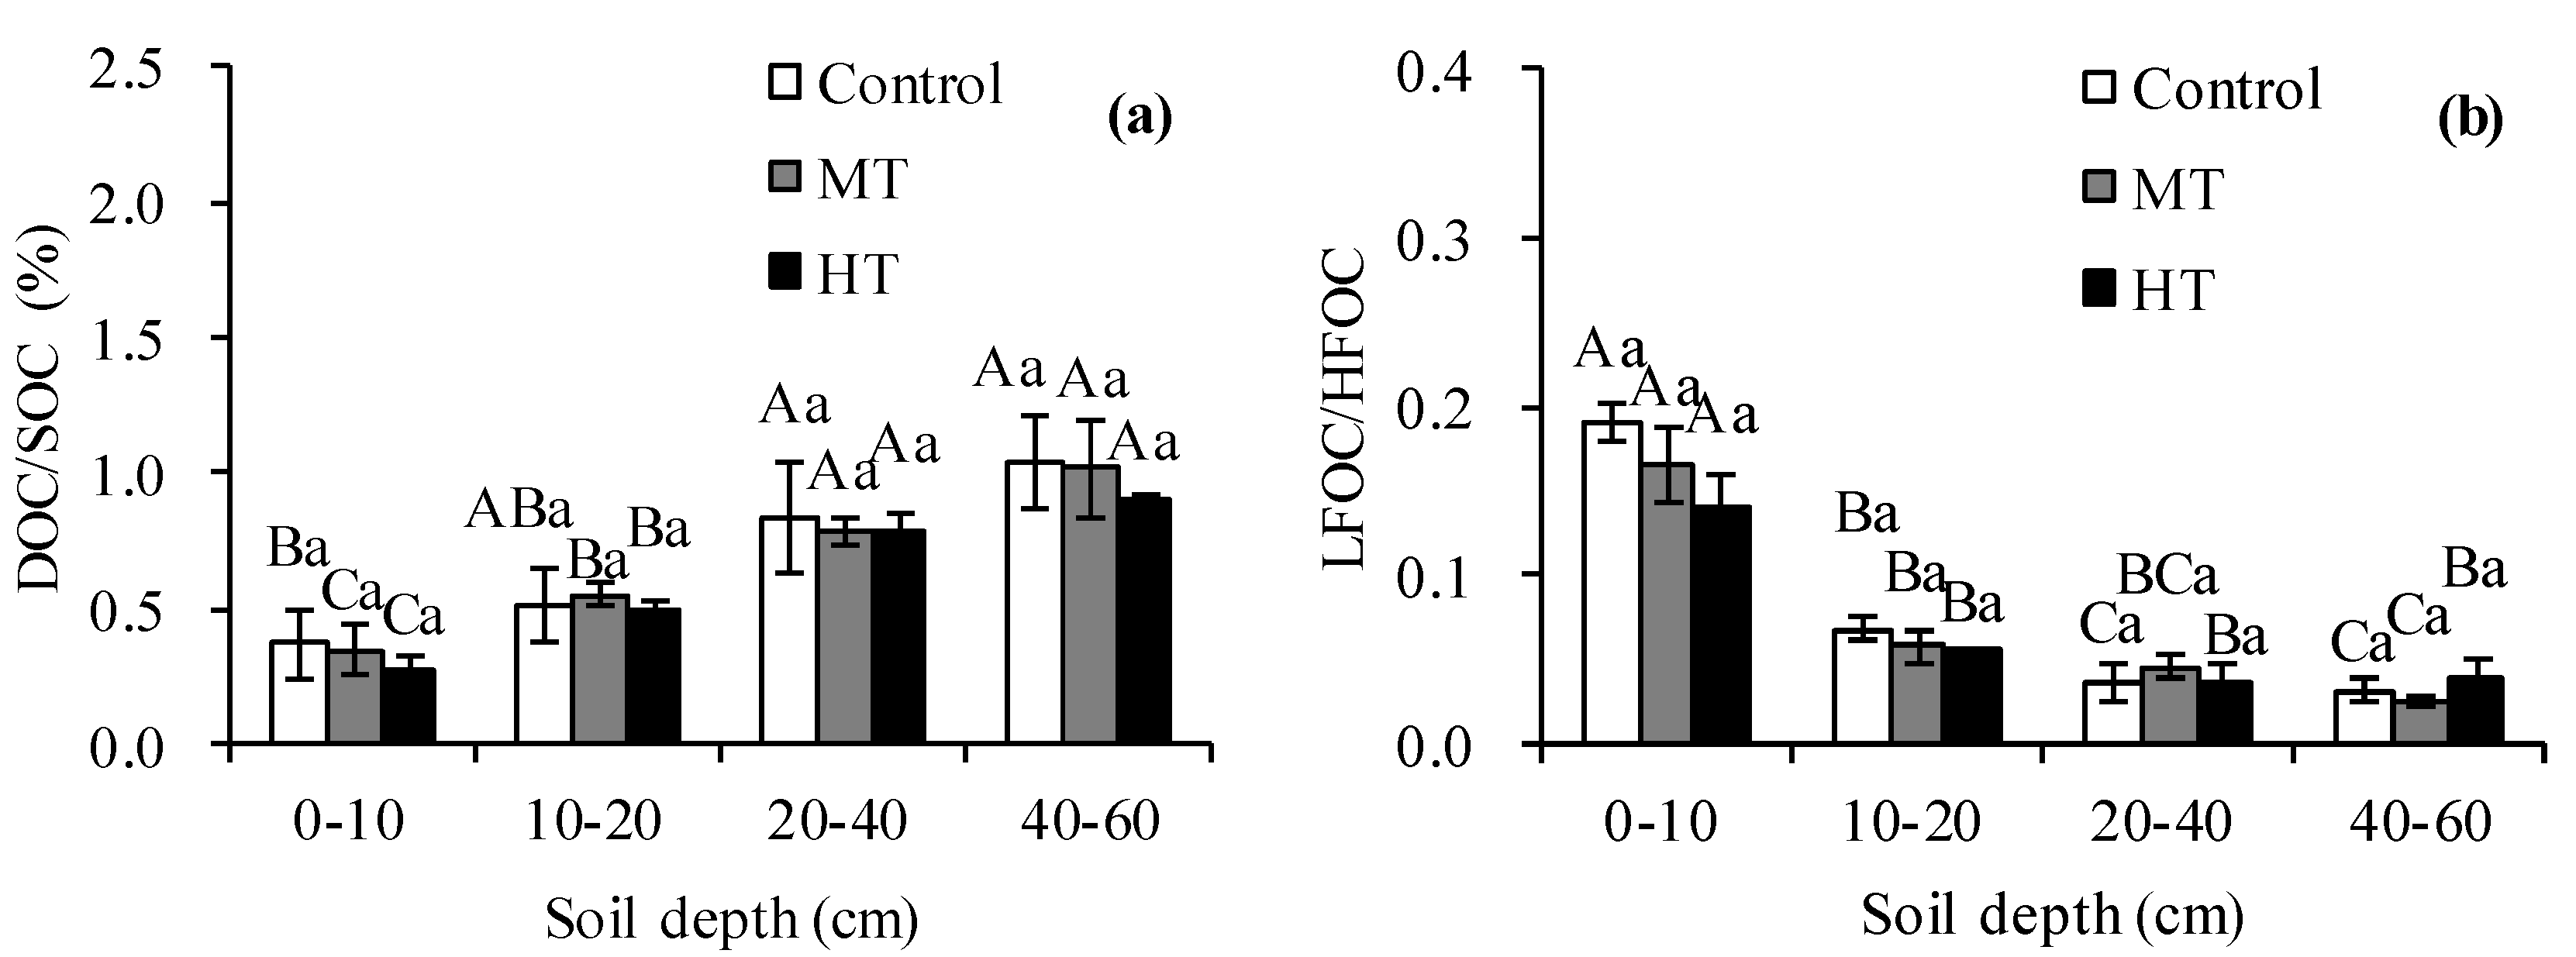
The concentrations of SOC, DOC, LFOC, HFOC, DOC/SOC ratios, and LFOC/HFOC ratios in the soil profiles, showed no significant differences among each of the three thinning treatments (p > 0.05) (Figure 1 and Figure 2). The values of these variables were significantly higher in the topsoil layer (0–20 cm) than those in the subsoil layer (20–60 cm) (p < 0.05). While DOC/SOC ratios increased with soil depth, they were markedly greater in the subsoil layer than they were in the topsoil layer (p < 0.05).
3.2. Soil Physical Properties
Bulk density in 0–10 cm and 10–20 cm soil layers markedly decreased in the heavy thinning treatment compared to the control treatment (p < 0.05), and no significant difference was observed between the moderate thinning and control treatments in the soil profile (p > 0.05) (Table S1). Capillary porosity, total porosity, and capillary water holding capacity in the 0–10 cm soil layer were higher in the heavy thinning treatments than in the control treatments (p < 0.05). These three variables showed no significant difference below 10 cm (p > 0.05). The capillary porosity, total porosity, and capillary water holding capacity showed no marked difference between the moderate thinning and control treatments (p > 0.05). No significant differences were found among the three treatments for maximum water holding capacity, minimum water holding capacity, non-capillary porosity, soil water content and soil temperature (Table S1). Soil mechanical composition also showed no significant difference among the three treatments.
3.3. Soil Chemical Properties
The variations of the soil chemical properties are shown in Table S2. The concentrations of the SOM, total phosphorus, total potassium, available potassium, calcium, and manganese were not significantly different between the three treatments (p > 0.05). Total nitrogen concentration in the 0–10 cm soil layer was significantly higher in the heavy thinning treatment than that in the control treatment (p < 0.05), and no significant difference was observed between the two treatments below 10 cm (p > 0.05). Hydrolysable nitrogen concentrations in the 0–10 cm and 10–20 cm soil layers were significantly higher in the heavy thinning treatment than that in the control treatment (p < 0.05). There was no significant difference between the moderate thinning and control treatments in the 0–60 cm soil profile (p > 0.05). Available potassium concentrations in the moderate and heavy thinning treatments were significantly lower than they were in the control treatment (p < 0.05), with the exception of the moderate treatment in the 0–10 cm soil layer, which showed no difference from the control treatment (p > 0.05).
The concentrations of copper, iron, and manganese showed no significant difference between the moderate or heavy thinning treatment, and the control treatment (p > 0.05). Zinc concentration was significantly higher in the heavy thinning treatment than in the control treatment throughout the soil profile, with exception of the 10–20 cm soil layer) (p < 0.05). Soil pH showed no significant difference among the three treatments (p > 0.05).
3.4. Correlation between SOC Fractions and Soil Properties
The SOC fractions were positively correlated with maximum water holding capacity, minimum water holding capacity, capillary water holding capacity, capillary porosity, non-capillary porosity, total porosity, soil temperature, and sand, and were negatively correlated with the bulk density, silt, and clay. For the soil chemical properties, total nitrogen, hydrolysable nitrogen, total phosphorus, available phosphorus, total potassium, available potassium, calcium, copper, iron, and manganese were positively correlated with the SOC fractions, but there was no a significant correlation between the SOC fractions and magnesium, zinc, and pH (with the exception of pH being negatively correlated to the DOC) (Table 2).
3.5. Soil Fertility Changes
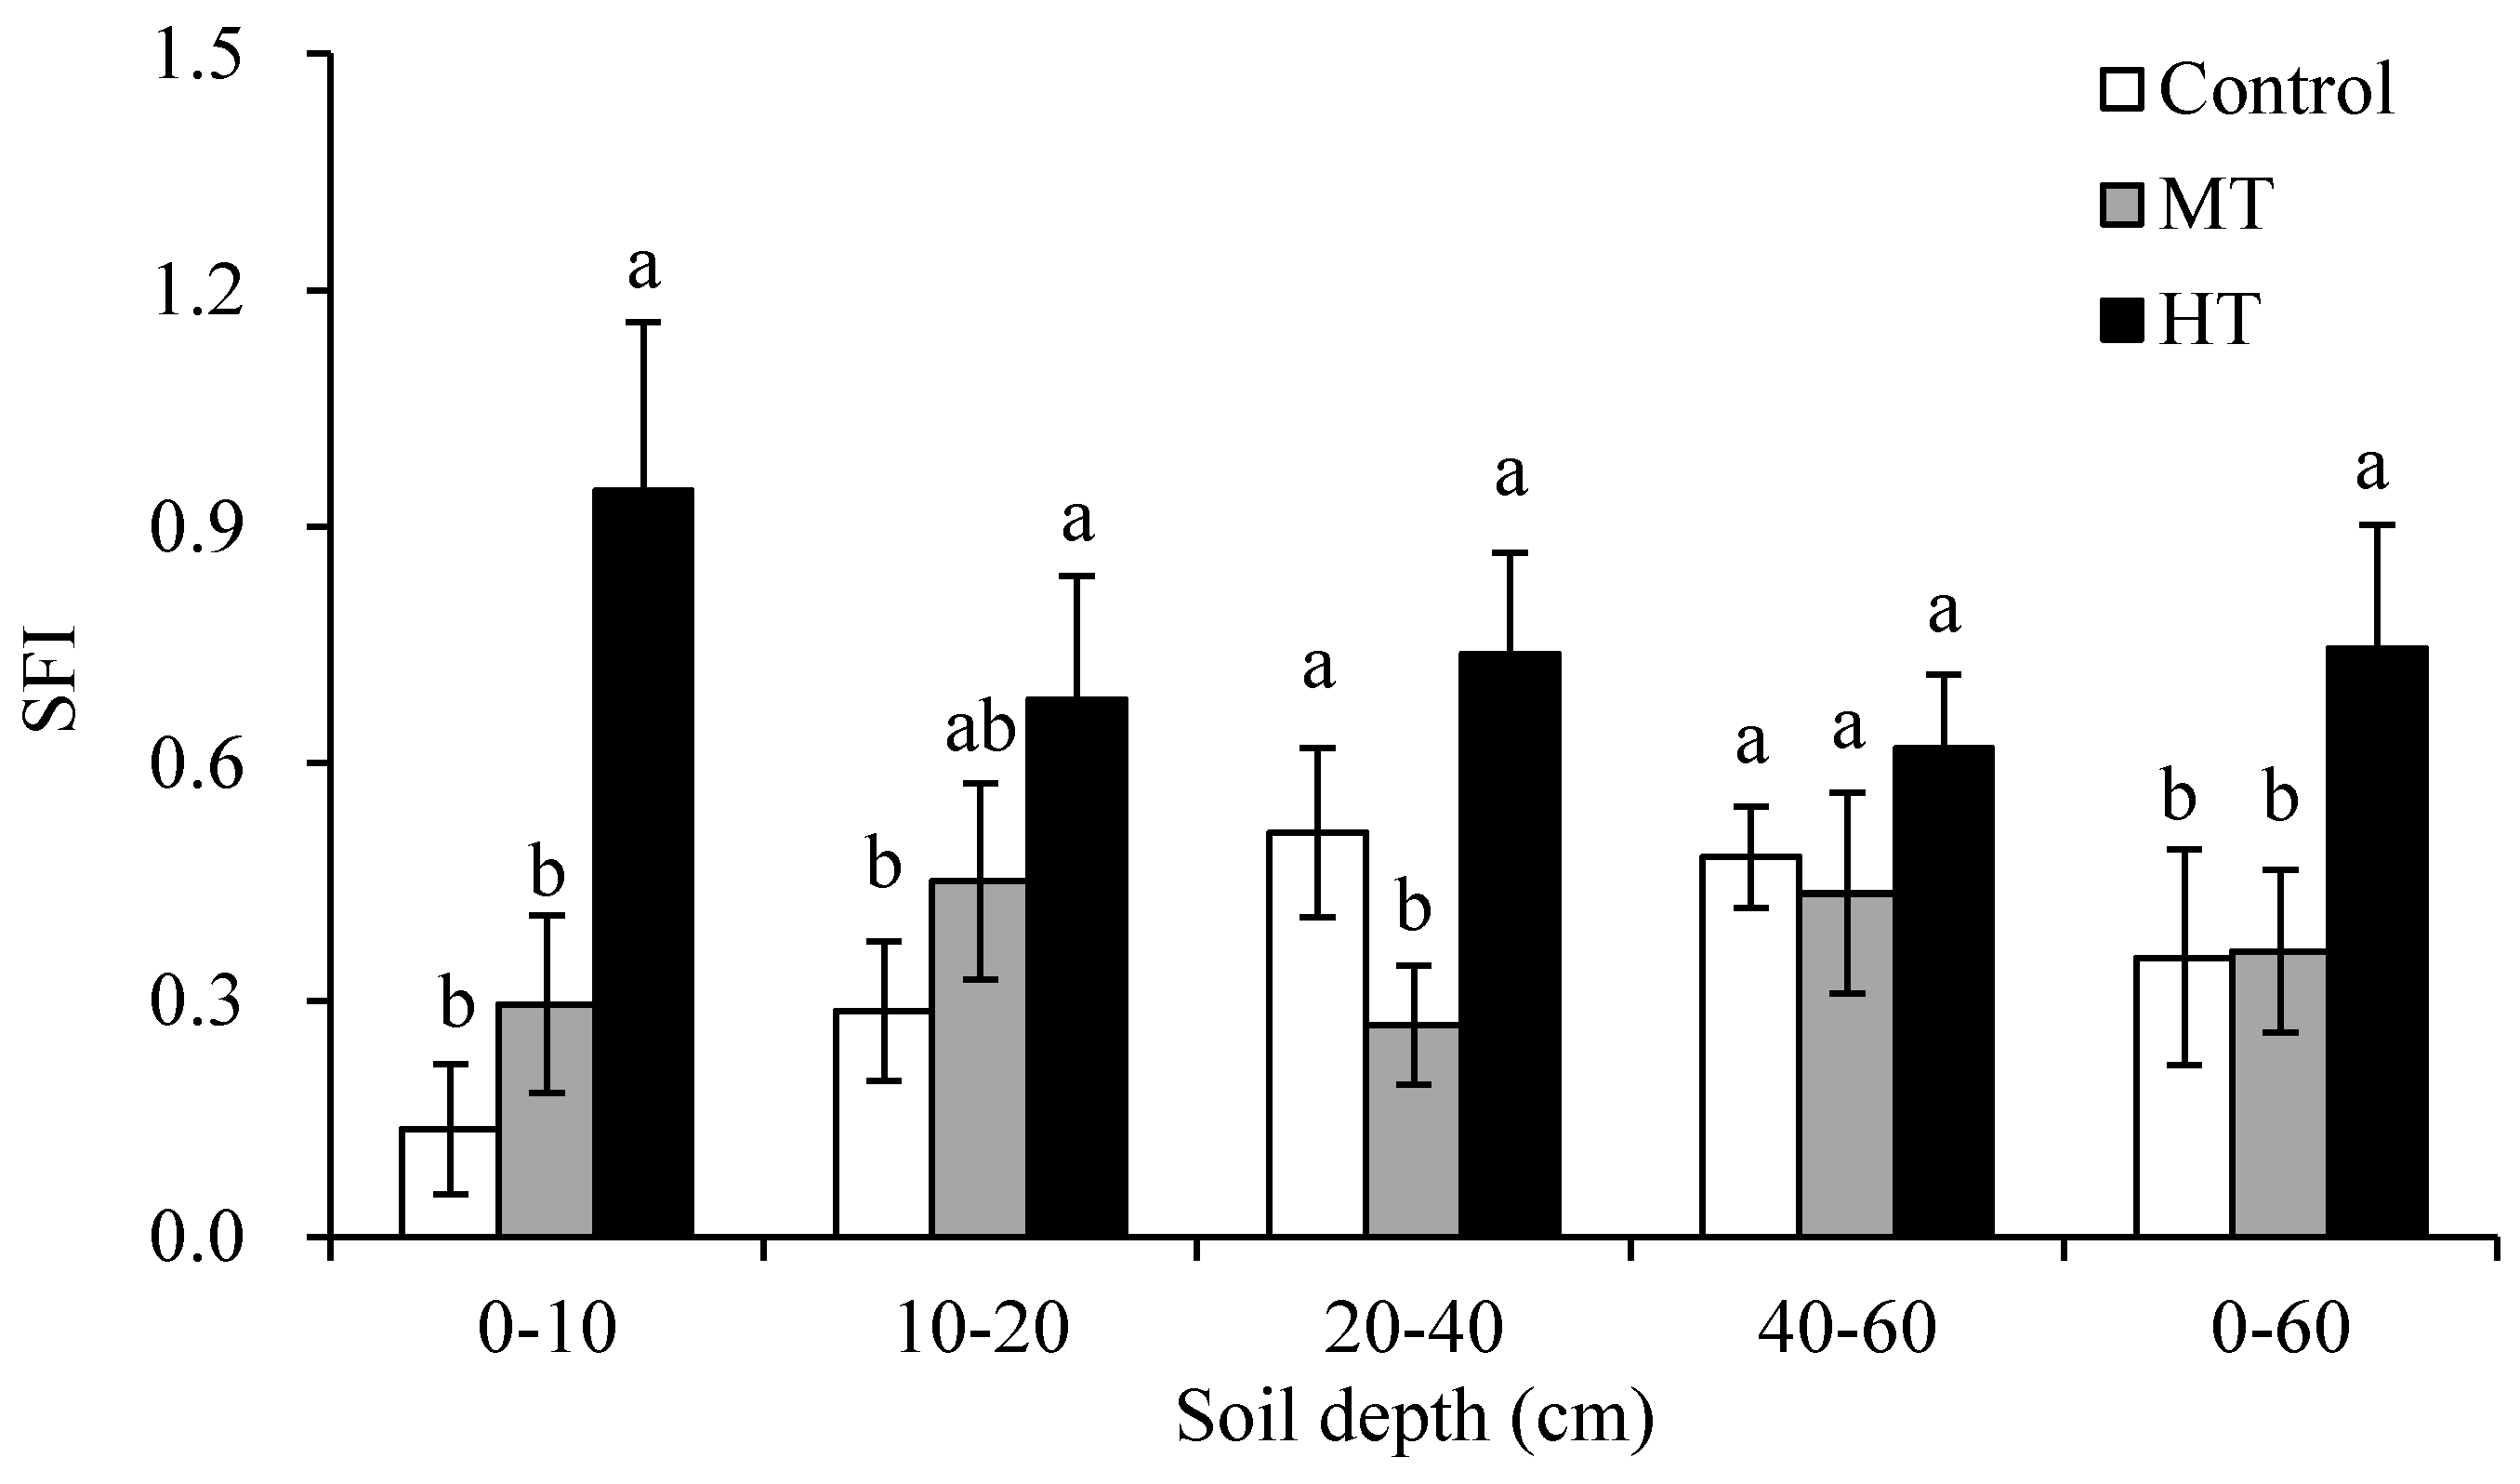
The changes of soil fertility index (SFI) at the three treatments are shown in Figure 3. With increasing thinning intensity, the SFI significantly increased in the 0–10 cm and 10–20 cm soil layers (p < 0.05). The SFI in the 20–40 cm soil layer markedly decreased in the moderate thinning treatment compared to the control treatment (p < 0.05), and no significant difference among the three treatments was observed in the 40–60 cm soil layer (p > 0.05). As a whole soil profile, the SFI was similar between the control and moderate thinning treatments, while the SFI was higher in the heavy thinning treatment than in the control treatment.
4. Discussion
4.1. Effect of Thinning on SOC Fractions
In this study, thinning showed no significant effects on the total SOC concentrations in the 0–60 cm soil layers, after 15 years of treatment. This result is consistent with findings reported in several previous studies. Jurgensen et al. [6] found that periodic thinnings had little impact on total soil carbon pools in a 134-year-old red pine (Pinus resinosa Ait.) forest in Minnesota, and a 104 year-old northern hardwood forest in Wisconsin. A long-term thinning experiment in a stand of Mediterranean maritime pine (Pinus pinaster Ait.) also showed no differences between the different thinning treatments in total soil carbon pool [44]. However, a meta-analysis of temperate forest harvest studies around the world by Nave et al. [45] revealed that harvest (including thinning) slightly reduced the amount of soil carbon. In their study, as time elapsed following harvest, the mineral soil carbon was reduced, but recovered over a period of 6–20 years following harvesting. Ruiz-Peinado et al. [44] reported that as the rotation time between thinning operations reached or exceeded eight years, the SOC stocks recovered. Litterfall and fine roots are major contributors to SOC [46]. In this study, total SOC concentrations were not affected by thinning treatments, which may be due to the similar litter inputs (biomass of litterfall and fine roots showed no difference among the treatments) and soil environmental conditions (especially soil temperature and soil water condition) in the moderate and heavy thinning plots, compared to the control plots (Table 1, Tables S1 and S2). Roig et al. [47] also indicated that litter fall production in a Mediterranean Pinus pinaster plantation in central Spain disappeared five years after thinning treatment, due to tree and crown growth. The light fraction of SOC is the primary component for SOC formation and it provides substrate for soil microorganisms [48,49]. The size range of LFOC depends on the tradeoff between litter inputs and decomposition [50]. In the present study, the LFOC concentration in each soil layer showed no significant difference among the three thinning treatments. In fact, the forest floor mass showed no difference among the three thinning treatments, and the soil temperature and moisture conditions were also similar (Table 1 and Table S1). This finding suggests that the annual input of litter and its decomposition rate may be similar between the three thinning treatments. Therefore, thinning intensity had less of an effect on the LFOC concentrations in the soil profile after 15 years treatment. Grady and Hart [51] showed that, after 15 years thinning, soil labile carbon did not differ between unmanaged and thinned ponderosa pine (Pinus ponderosa var. arizonica) forests in the USA.
The soil HFOC accounted for 84%–97% of the total SOC, which was not affected by thinning treatments. Recent studies of density fractions have indicated that the soluble decomposition products of LFOC are a possible source of HFOC, and that the formation and turnover of LFOC and HFOC are not completely independent of one another in the topsoil [52]. The LFOC/HFOC ratio also did not differ among the three thinning treatments in the study. Therefore, in the current study, long term thinning did not have an effect on the HFOC distribution in the soil profile in Chinese fir plantations. However, Huang et al. [2] reported that residue management following harvest impacted on the HFOC in Pinus radiata plantations in New Zealand. In their study, the HFOC was lower in the litterfall removal plots than in the stem−only harvest plots, over years 5–15. The increased HFOC, due to the increase of residue return, might have come from a greater input of stabilized carbon in the residue substrate. These results indicate that HFOC is a relatively stable carbon component and its variation depends, to a great extent, on the management intensity or magnitude of disturbance.
Some studies have suggested that DOC is involved in the formation of HFOC in the soil profile [53,54], and the transport of DOC through the topsoil contributes significantly to SOC accumulation in subsoils [55,56,57]. In our study, thinning intensity had no significant effect on DOC concentration, and the DOC/SOC ratio increased with soil depth in all three treatments. This may be favorable to SOC accumulation in subsoils, as the distribution of the DOC/SOC ratio was not affected by thinning treatments. The lack of differences in DOC and DOC/SOC ratio between each treatment may be related to similar soil environments and stand growth conditions observed among the different thinning treatments.
4.2. Effect of Thinning on Soil Physical Properties
Numerous studies have shown that soil physical properties, such as bulk density and soil hydraulic parameters, change with depth, following thinning [3,57,58,59]. However, most of these studies focused on the short-term impact of one thinning operation, on soil physical properties. Additionally, the thinning-related impacts on soil physical properties resulted mainly from compaction, due to the use of machinery during the thinning operations [57].
Tarpey et al. [60] observed that soil bulk density, penetration resistance, and saturated hydraulic conductivity increased as thinning intensity increased, in a red pine (Pinus resinosa) stand growing on a sandy soil, over a 57-year period. In contrast, few differences in these physical properties were detected between thinned and unthinned treatments in a northern hardwoods stand, growing on a rocky loam soil, in north-central Wisconsin, over a 50-year period. Bravo-Oviedo et al. [61] found that bulk density did not change among treatments in a Scots pine (Pinus sylvestris L.) stand after 40 years under a thinning treatment. In this study, bulk density noticeably decreased and capillary porosity, total porosity, and capillary water holding capacity increased in the surface soils (0–10 cm or 0–20 cm), in the heavy thinning treatment compared to the control treatment. The soil physical properties showed no significant difference between the moderate thinning and control treatments. The increase of soil porosity in surface soils in the heavy thinning treatment is likely related to root death of the removed trees, and root growth of the understory vegetation. Some studies found that the decomposition of plant roots can promote soil aeration and aggregation, and soil particles adhesion, which contribute to soil formation, development, and stability [49,62,63]. Compared with the control treatment, the heavy thinning treatment resulted in an understory biomass that increased by 46.4%, and a root biomass of Chinese fir that was reduced by 35.3% in the 0–10 cm soil depth (Table 1). With the improvement of soil porosity in the topsoil layer of the heavy thinning treatment compared to the control treatment, accordingly, the maximum water holding capacity and soil water content were slightly increased, however these were not statistically significant. This indicates that thinning has a minor effect on the improvement of soil water condition in Chinese fir plantation following 15 years of treatment.
4.3. Effect of Thinning on Soil Chemical Properties
Thinning changes the micro-environment, litter decomposition, and understory vegetation, which can consequently influence the variations of soil macro-elements and micro-elements. In this study, total nitrogen (0–10 cm) and hydrolysable nitrogen (0–20 cm) concentrations were significantly higher in the heavy thinning treatment compared to the control treatment. The increase of soil nitrogen concentrations in the shallow soil layers, under the heavy thinning treatment is likely related to the increased release of nitrogen in the litter decomposition [64]. This would be a result of the altered soil temperature, soil water content, and microbial activity after thinning [65]. Moreover, the biomass of understory vegetation in the heavy thinning treatment increased by 46.4% compared to the control treatment, and was a notable contribution to soil nutrients. Wall [66] reported that soil pH, phosphorus, potassium, calcium, and magnesium are the main soil indicators which impact on site productivity and forest sustainability following harvest. In this study, we found that only soil available potassium concentrations in the soil profile decreased in the moderate and heavy thinning treatments, compared to the control treatment. The soil total phosphorus and available phosphorus concentrations were less variable after thinning. This is likely due to phosphorus not easily being absorbed by plants, since the available phosphorus is fixed to metal ions, such as Fe3+ and Al3+ in southern forest soils [67,68]. The decrease of available potassium concentration after two rounds of thinning was partially attributable to its uptake by trees during the study time period. Moreover, eluviation resulted in a higher the loss of potassium from the soil profile after thinning, than other nutrients [3]. Bravo-Oviedo et al. [61] reported that repeated thinning did not alter pH, carbon, nitrogen, and other nutrients’ concentrations and stocks in mineral soil, in a Scots pine (Pinus sylvestris L.) stand after 40 years of treatment. However, Zhou et al. [3] found that soil chemical properties tended to deteriorate with an increase of high intensity thinning, in a natural mixed Chinese fir forest in southeast China, 15 years post-thinning. These different results may be related to tree age, site condition, and thinning regime.
A number of previous studies on the variation of soil nutrients after thinning have mainly focused on macro-elements [3,6,9,34,58], and paid little attention to the soil micro-elements. The results from this study showed that the majority of soil micro-elements showed no differences between the moderate or heavy thinning treatments and control treatments, and zinc concentration increased in the heavy thinning treatment. This can be attributed to litter inputs from the differing vegetation compositions of the understory, rather than the nutrient changes within the mineral soil itself. Entry et al. [69] reported that iron concentrations were reduced and zinc concentrations increased in the foliage of Douglas-fir (Pseudotsuga menziesii), in the thinned trees compared to the unthinned control. However, there is little information to support the relationship between the change of soil micro-elements and thinning. Therefore, more study on the variations of soil micro-elements in response to short term and long term thinning is needed.
The effects of thinning on soil fertility are a topic of interest to forest managers, as soil fertility is related to site productivity [70]. In this case, soil fertility (or SFI) improved in the top soil layers (0–20 cm), and less variation was observed in the subsoil layers, which depended on thinning intensities and soil depths. As we mentioned above, the improvement of soil fertility might be related to understory vegetation and litter input. Although many previous studies have reported the changes of soil physical [3,58,60], chemical [3,58], or biological [71,72] properties after thinning treatments, while they failed to evaluate the overall soil fertility status. Particularly, most of these studies mainly focused on carbon and nitrogen [73]. Therefore, more attention needs to be paid on research of soil fertility dynamics after thinning in future.
5. Conclusions
In this study, we found that no significant effect on soil labile carbon (light fraction carbon) and stable carbon (heavy fraction carbon) was detectable, following 15 years of thinning treatments. Therefore, thinning is unlikely to substantially affect mineral SOC pools in one Chinese fir stand rotation. However, some soil properties were altered after being thinned twice. In particularly, soil water holding capacity and soil nitrogen were markedly improved in the repeatedly thinned stands. The variation of these soil physical and chemical properties was observed in the heavy thinning intensity treatment, and mainly located in the shallow soil layers (0–20 cm). There were few changes in soil properties found below 20 cm. Overall, thinning has a positive effect on soil quality in Chinese fir plantations in eastern China.
Supplementary Materials
The following are available online at www.mdpi.com/1999-4907/8/6/198/s1, Table S1: Soil physical properties in different thinning treatments, Table S2: Soil chemical properties in different thinning treatments.
Acknowledgments
This project is supported by the National Natural Science Foundation of China (Grant No. 31300519), Natural Science Foundation of Zhejiang Province (LY12C16007), the Fundamental Research Funds for the Central Non-profit Research Institution of RISF-CAF” (CAFYBB2014QB013, RISF61257), and the China Scholarship Council.
Conflicts of Interest
The authors declare that they have no conflict of interest.
References
- Jandl, R.; Lindner, M.; Vesterdal, L.; Bauwens, B.; Baritz, R.; Hagedorn, F.; Johnson, D.W.; Minkkinen, K.; Byrne, K.A. How strongly can forest management influence soil carbon sequestration? Geoderma 2007, 137, 253–268. [Google Scholar] [CrossRef]
- Huang, Z.; Clinton, P.W.; Davis, M.R. Post-harvest residue management effects on recalcitrant carbon pools and plant biomarkers within the soil heavy fraction in Pinus radiata plantations. Soil Biol. Biochem. 2011, 43, 404–412. [Google Scholar] [CrossRef]
- Zhou, X.; Zhou, Y.; Zhou, C.; Wu, Z.; Zheng, L.; Hu, X.; Chen, H.; Gan, J. Effects of cutting intensity on soil physical and chemical properties in a mixed natural forest in southeastern China. Forests 2015, 6, 4495–4509. [Google Scholar] [CrossRef]
- Peterson, J.A.; Seiler, J.R.; Nowak, J.; Ginn, S.E.; Kreh, R.E. Growth and physiological responses of young loblolly pine stands to thinning. For. Sci. 1997, 43, 529–534. [Google Scholar]
- Tang, J.; Qi, Y.; Xu, M.; Misson, L.; Goldstei, A.H. Forest thinning and soil respiration in a ponderosa pine plantation in the Sierra Nevada. Tree Physiol. 2005, 25, 57–66. [Google Scholar] [CrossRef] [PubMed]
- Jurgensen, M.; Tarpey, R.; Pickens, J.; Kolka, R.; Palik, B. Long-term effect of silvicultural thinnings on soil carbon and nitrogen pools. Soil Sci. Soc. Am. J. 2012, 76, 1418–1425. [Google Scholar] [CrossRef]
- Nwaokorie, K.J.; Mbuya, O.S.; Grace, J.M., III. Impact of thinning on soil properties and biomass in Apalachicola national forest, Florida. In Proceedings of the 18th Biennial Southern Silvicultural Research Conference, Knoxville, TN, USA, 2–5 March 2015; Schweitzer, C.J., Clatterbuck, W.K., Oswalt, C.M., Eds.; e–Gen. Tech. Rep. SRS–212. U.S. Department of Agriculture, Forest Service, Southern Research Station: Asheville, NC, USA, 2016; p. 614. [Google Scholar]
- Baena, C.W.; Andrés-Abellán, M.; Lucas-Borja, M.E.; Martínez-García, E.; García-Morote, F.A.; Rubio, E.; López-Serrano, F.R. Thinning and recovery effects on soil properties in two sites of a Mediterranean forest, in Cuenca Mountain (South-eastern of Spain). For. Ecol. Manag. 2013, 308, 223–230. [Google Scholar] [CrossRef]
- Zhang, J.; Webster, J.; Young, D.H.; Fiddler, G.O. Effect of thinning and soil treatments on Pinus ponderosa plantations: 15-year results. For. Ecol. Manag. 2016, 368, 123–132. [Google Scholar] [CrossRef]
- Davidson, E.A.; Janssens, I.A. Temperature sensitivity of soil carbon decomposition and feedbacks to climate change. Nature 2006, 440, 165–173. [Google Scholar] [CrossRef] [PubMed]
- Von Lützow, M.; Kögel-Knabner, I.; Ekschmitt, K.; Flessa, H.; Guggenberger, G.; Matzner, E.; Marschner, B. SOM fractionation methods: Relevance to functional pools and to stabilization mechanisms. Soil Biol. Biochem. 2007, 39, 2183–2207. [Google Scholar] [CrossRef]
- Diochon, A.C.; Kellman, L. Physical fractionation of soil organic matter: Destabilization of deep soil carbon following harvesting of a temperate coniferous forest. J. Geophys. Res. Biogeosci. 2009, 114. [Google Scholar] [CrossRef]
- Wäldchen, J.; Schulze, E.D.; Schöning, I.; Schrumpf, M.; Sierra, C. The influence of changes in forest management over the past 200 years on present soil organic carbon stocks. For. Ecol. Manag. 2013, 289, 243–254. [Google Scholar] [CrossRef]
- Bremer, E.; Janzen, H.H.; Johnston, A.M. Sensitivity of total, light fraction and mineralizable organic matter to management practices in a Lethbridge soil. Can. J. Soil Sci. 1994, 74, 131–138. [Google Scholar] [CrossRef]
- Hassink, J. Density fractions of soil macroorganic matter and microbial biomass as predictors of C and N mineralization. Soil Biol. Biochem. 1995, 27, 1099–1108. [Google Scholar] [CrossRef]
- Wander, M.M.; Traina, S.J. Organic matter fractions from organically and conventionally managed soils: I. Carbon and nitrogen distribution. Soil Sci. Soc. Am. J. 1996, 60, 1081–1087. [Google Scholar] [CrossRef]
- Baisden, W.T.; Amundson, R.; Cook, A.C.; Brenner, D.L. Turnover and storage of C and N in five density fractions from California annual grassland surface soils. Glob. Biogeochem. Cycles 2002, 16, 4. [Google Scholar] [CrossRef]
- Six, J.; Conant, R.T.; Paul, E.A.; Paustian, K. Stabilization mechanisms of soil organic matter: Implications for C-saturation of soils. Plant Soil. 2002, 241, 155–176. [Google Scholar] [CrossRef]
- Crow, S.E.; Swanston, C.W.; Lajtha, K.; Brooks, J.R.; Keirstead, H. Density fractionation of forest soils: Methodological questions and interpretation of incubation results and turnover time in an ecosystem context. Biogeochemistry 2007, 85, 69–90. [Google Scholar] [CrossRef]
- Concilio, A.; Ma, S.; Li, Q.; Le, M.J.; Chen, J.; North, M.; Moorhead, D.; Jensen, R. Soil respiration response to prescribed burning and thinning in mixed-conifer and hardwood forests. Can. J. For. Res. 2005, 35, 1581–1591. [Google Scholar] [CrossRef]
- Hoover, C.M. Management impacts on forest floor and soil organic carbon in northern temperate forests of the US. Carbon Balance Manag. 2011, 6, 1. [Google Scholar] [CrossRef] [PubMed]
- Nilsen, P.; Strand, L.T. Thinning intensity effects on carbon and nitrogen stores and fluxes in a Norway spruce (Piceaabies (L.) Karst.) stand after 33 years. For. Ecol. Manag. 2008, 256, 201–208. [Google Scholar] [CrossRef]
- Kim, C.; Son, Y.; Lee, W.K.; Jeong, J.; Noh, N.J. Influences of forest tending works on carbon distribution and cycling in a Pinus densiflora S. et Z. stand in Korea. For. Ecol. Manag. 2009, 257, 1420–1426. [Google Scholar] [CrossRef]
- Zhang, Y.; Zeng, X.L.; Dong, X.B. Grey clustering evaluation of soil nutrients of a low-quality forest in the Xiaoxing’an mountain at different cutting intensities. J. Northeast For. Univ. 2014, 42, 21–24. (In Chinese) [Google Scholar]
- Jang, W.; Page-Dumroese, D.S.; Keyes, C.R. Long-term soil changes from forest harvesting and residue management in the northern rocky mountains. Soil Sci. Soc. Am. J. 2016, 727–741. [Google Scholar] [CrossRef]
- Smethurst, P.J.; Nambiar, E.K.S. Effects of slash and litter management on fluxes of nitrogen and tree growth in a young Pinusradiata plantation. Can. J. For. Res. 1990, 20, 1498–1507. [Google Scholar] [CrossRef]
- Ritchie, M.W.; Zhang, J.; Hamilton, T.A. Aboveground tree biomass for Pinusponderosa in Northeastern California. Forests 2013, 4, 179–196. [Google Scholar] [CrossRef]
- Yu, X.T. A summary of the studies on Chinese fir in 2000–2005 I. The research development on physiological ecology of Chinese fir. J. Fujian Coll. For. 2006, 26, 177–185, (In Chinese with English abstract). [Google Scholar]
- Lei, J.F. Forest Resources in China; China Forestry Publish House: Beijing, China, 2005; p. 172. [Google Scholar]
- Xu, J.L.; Mao, Y.M.; Zheng, C.Z.; Cheng, X.R.; Yu, M.K. Effect of thinning on growth and timber outturn in Cunninghamia lanceolata plantation. For. Res. 2014, 27, 99–107, (In Chinese with English abstract). [Google Scholar]
- Deng, S.P.; Jiang, M.S.; Chen, X.Y.; Xie, Y.Q. Changing rules of components of Cunninghamia lanceolata thinning wood in heat treating process. Scientia Silvae Sinicae 2009, 45, 121–126, (In Chinese with English abstract). [Google Scholar]
- Zhao, C.H.; Fang, X.; Tian, D.L.; Xiang, W.H. Effects of thinning on biomass of under-story, soil physical and chemical properties in Cunninghamia lanceolate plantation. J. Cent. South Univ. For. Technol. 2012, 32, 102–107, (In Chinese with English abstract). [Google Scholar]
- Cheng, X.; Xu, J.; Liu, J.; Yu, M. Effect of thinning on understory vegetation diversity and its nutrient stocks in Cunninghamia lanceolata plantation. Eco Environ. Sci. 2014, 23, 30–34, (In Chinese with English abstract). [Google Scholar]
- Zhang, D.H.; Ye, Z.F.; Fan, B.Y.; Wei, T.L. Influence of thinning on soil fertility in artificial forests. Chin. J. Appl. Ecol. 2001, 12, 672–676, (In Chinese with English abstract). [Google Scholar]
- IUSS Working Group WRB. World Reference Base for Soil Resources 2014, update 2015 International Soil Classification System for Naming Soils and Creating Legends for Soil Maps; World Soil Resources Reports No. 106; FAO: Rome, Italy, 2015. [Google Scholar]
- Liu, R.J.; Wu, Y.C.; Zhang, Y.; Li, Z.C.; Ma, S.J.; Wang, B.; Geri, L.T. Comparison of soil labile organic carbon in Chinese fir plantations and natural secondary forests in north subtropical areas of China. Chin. J. Plant Ecol. 2012, 36, 431–437, (In Chinese with English abstract). [Google Scholar] [CrossRef]
- Janzen, H.H.; Campbell, C.A.; Brandt, G.P.; Lafond, G.P.; Townley-Smith, L. Light-fraction organic matter in soils from long-term crop rotations. Soil Sci. Soc. Am. J. 1992, 56, 1799–1806. [Google Scholar] [CrossRef]
- Waksman, S.A.; Stevens, K.R. A critical study of the methods for determining the nature and abundance of soil organic matter. Soil Sci. 1930, 30, 97–116. [Google Scholar] [CrossRef]
- Zhang, W.R.; Yang, G.Y.; Tu, X.Y.; Zhang, P. Determination of forest soil water-physical properties. In China Criterion of Forest Technique; No. LY/T, 1215–1999; Standards Press of China: Beijing, China, 1999. (In Chinese) [Google Scholar]
- Hendershot, W.H.; Lalande, H.; Duquette, M. Soil reaction and exchangeable acidity. In Soil Sampling and Methods of Analysis; Carter, M.R., Ed.; Canadian Society of Soil Science, Lewis Publishers: Boca Raton, FL, USA, 1993; pp. 141–145. [Google Scholar]
- Zhang, Q.F.; Song, Y.C.; You, W.H. Relationship between plant community secondary succession and soil fertility in Tiantong, Zhejiang province. Acta Ecol. Sin. 1999, 2, 174–179, (In Chinese with English abstract). [Google Scholar]
- Fu, B.J.; Liu, S.L.; Chen, L.D.; Lu, Y.H.; Qiu, J. Soil quality regime in relation to land cover and slope position across a highly modified slope landscape. Ecol. Res. 2004, 19, 111–118. [Google Scholar] [CrossRef]
- Li, M.B.; Zhang, X.W. The assessment of soil fertility. In Soil Fertility Progress; Zhang, X.W., Ed.; Chinese Science and Technology Press: Beijing, China, 1991; pp. 221–234. (In Chinese) [Google Scholar]
- Ruiz-Peinado, R.; Bravo-Oviedo, A.; López-Senespleda, E.; Montero, G.; Río, M. Do thinnings influence biomass and soil carbon stocks in Mediterranean maritime pinewoods? Eur. J. For. Res. 2013, 132, 253. [Google Scholar] [CrossRef]
- Nave, L.E.; Vance, E.D.; Swanston, C.W.; Curtis, P.S. Harvest impacts on soil carbon storage in temperate forests. For. Ecol. Manag. 2010, 259, 857–866. [Google Scholar] [CrossRef]
- Laik, R.; Kumar, K.; Das, D.K.; Chaturvedi, O.P. Labile soil organic matter pools in a calciorthent after 18 years of afforestation by different plantations. Appl. Soil Ecol. 2009, 42, 71–78. [Google Scholar] [CrossRef]
- Roig, S.; del Río, M.; Canellas, I.; Montero, G. Litter fall in Mediterranean Pinus pinaster Ait. stands under different thinning regimes. For. Ecol. Manag. 2005, 206, 179–190. [Google Scholar] [CrossRef]
- Neff, J.C.; Townsend, A.R.; Gleixner, G.; Lehman, S.J.; Turnbull, J.; Bowman, W.D. Variable effects of nitrogen additions on the stability and turnover of soil carbon. Nature 2002, 419, 915–917. [Google Scholar] [CrossRef] [PubMed]
- Song, B.; Niu, S.; Zhang, Z.; Yang, H.; Li, L.; Wan, S. Light and heavy fractions of soil organic matter in response to climate warming and increased precipitation in a temperate steppe. PLoS ONE 2012, 7, e33217. [Google Scholar] [CrossRef] [PubMed]
- Gregorich, E.G.; Janzen, H.H. Storage of soil carbon in the light fraction and macroorganic matter. In Structure and Organic Matter Storage in Agricultural Soils; Carter, M.R., Stewart, B.A., Eds.; Lewis Publishers: Boca Raton, FL, USA, 1996; pp. 167–190. [Google Scholar]
- Grady, K.C.; Hart, S.C. Influences of thinning, prescribed burning, and wildfire on soil processes and properties in southwestern ponderosa pine forests: A retrospective study. For. Ecol. Manag. 2006, 234, 123–135. [Google Scholar] [CrossRef]
- Schrumpf, M.; Kaiser, K.; Guggenberger, G.; Persson, T.; Kögel-Knabner, I.; Schulze, E.-D. Storage and stability of organic carbon in soils as related to depth, occlusion within aggregates, and attachment to minerals. Biogeosciences 2013, 10, 1675–1691. [Google Scholar] [CrossRef]
- Masiello, C.A.; Chadwick, O.A.; Southon, J.; Torn, M.S.; Harden, J.W. Weathering controls on mechanisms of carbon storage in grassland soils. Glob. Biogeochem. Cycles 2004, 18, GB4023. [Google Scholar] [CrossRef]
- Baisden, W.T.; Parfitt, R.L. Bomb 14C enrichment indicates decadal C pool in deep soil? Biogeochemistry 2007, 85, 59–68. [Google Scholar] [CrossRef]
- Kalbitz, K.; Kaiser, K. Contribution of dissolved organic matter to carbon storage in forest mineral soils. J. Plant Nutr. Soil Sci. 2008, 171, 52–60. [Google Scholar] [CrossRef]
- Kaiser, K.; Kalbitz, K. Cycling downwards-dissolved organic matter in soils. Soil Biol. Biochem. 2012, 52, 29–32. [Google Scholar] [CrossRef]
- Page-Dumroese, D.S.; Jurgensen, M.; Terry, T. Maintaining soil productivity during forest or biomass-to-energy thinning harvests in the western United States. West. J. Appl. For. 2010, 25, 5–11. [Google Scholar]
- Zhao, K.; Hao, Y.; Jia, Z.; Ma, L.; Jia, F. Soil properties responding to Pinus tabulaeformis forest thinning in mountainous areas, Beijing. Adv. J. Food Sci. Technol. 2014, 6, 1219–1227. [Google Scholar]
- Chen, L.; Yuan, Z.; Shao, H.; Wang, D.; Mu, X. Effects of thinning intensities on soil infiltration and water storage capacity in a Chinese Pine-Oak mixed forest. Sci. World J. 2014, 2014, 268157. [Google Scholar] [CrossRef] [PubMed]
- Tarpey, R.A.; Jurgensen, M.F.; Palik, B.J.; Kolka, R.K. The long-term effects of silvicultural thinning and partial cutting on soil compaction in red pine (Pinus resinosa Ait.) and northern hardwood stands in the northern Great Lakes Region of the United States. Can. J. Soil Sci. 2008, 88, 849–857. [Google Scholar] [CrossRef]
- Bravo-Oviedo, A.; Ruiz-Peinado, R.; Modrego, P.; Alonso, R.; Montero, G. Forest thinning impact on carbon stock and soil condition in Southern European populations of P. sylvestris L. For. Ecol. Manag. 2015, 357, 259–267. [Google Scholar] [CrossRef]
- Verboom, W.H.; Pate, J.S. Bioengineering of soil profiles in semiarid ecosystems: The ‘phytotarium’ concept. A review. Plant Soil 2006, 289, 71–102. [Google Scholar] [CrossRef]
- Lambers, H.; Mougel, C.; Jaillard, B.; Hinsinger, P. Plant-microbe-soil interactions in the rhizosphere: An evolutionary perspective. Plant Soil 2009, 321, 83–115. [Google Scholar] [CrossRef]
- Fang, H.; Tian, D.; Kang, W. Nutrient study of understory vegetation in the thinned Chinese fir plantation II—Contents of nutrient in the soil and accumulation index of plants to the soil. J. Cent. South For. Univ. 1998, 18, 1–5, (In Chinese with English abstract). [Google Scholar]
- Vitousek, P.M.; Matson, P.A.; Van Cleve, K. Nitrogen availability and nitrification during succession: Primary, secondary, and old-field seres. Plant Soil 1989, 115, 229–239. [Google Scholar] [CrossRef]
- Wall, A. Risk analysis of effects of whole-tree harvesting on site productivity. For. Ecol. Manag. 2012, 282, 175–184. [Google Scholar] [CrossRef]
- Mc Guire, J.P.; Mitchell, R.J.; Moser, E.B.; Pecot, S.D.; Gjerstad, D.H.; Hedman, C.W. Gaps in a gappy forest: Plant resources, longleaf pine regeneration, and understory response to tree removal in longleaf pine savannas. Can. J. For. Res. 2001, 31, 765–778. [Google Scholar] [CrossRef]
- He, Z.; Liu, J.; Su, S.; Zheng, S.; Xu, D.; Wu, Z.; Hong, W.; Wang, J.L.M. Effects of forest gaps on soil properties in Castanopsis kawakamii nature forest. PLoS ONE 2015, 10, e0141203. [Google Scholar] [CrossRef] [PubMed]
- Entry, J.A.; Cromack, J.K.; Kelsey, R.G.; Martin, N.E. Response of Douglas-fir to infection by Armillaria ostoyae after thinning or thinning plus fertilization. Phytopathology 1991, 81, 682–689. [Google Scholar] [CrossRef]
- Powers, R.F. Forests for Energy: Can Productivity Be Sustained? An Overview and Personal Perspective. Int. J. For. Eng. 2012, 23, 7–14. [Google Scholar] [CrossRef]
- Lin, W.R.; Wang, P.H.; Chen, W.C.; Lai, C.M.; Winder, R.S. Responses of soil fungal populations and communities to the thinning of Cryptomeria japonica Forests. Microbes Environ. 2016, 31, 19–26. [Google Scholar] [CrossRef] [PubMed]
- Overby, S.T.; Owen, S.M.; Hart, S.C.; Neary, D.G.; Johnson, N.C. Soil microbial community resilience with tree thinning in a 40-year-old experimental ponderosa pine forest. Appl. Soil Ecol. 2015, 93, 1–10. [Google Scholar] [CrossRef]
- Johnson, D.W.; Curtis, P.S. Effects of forest management on soil C and N storage: Meta analysis. For. Ecol. Manag. 2001, 140, 227–238. [Google Scholar] [CrossRef]
Figure 1.
Concentrations of (a) soil organic carbon (SOC), (b) dissolved organic carbon (DOC), (c) light fraction organic carbon (LFOC), and (d) heavy fraction organic carbon (HFOC) under the three treatments, at different soil depths. Different lowercase letters denote a significant difference between the treatments at the same soil layer (p < 0.05), different capital letters to describe differences between soil depths (p < 0.05); Control—traditional management model, MT—moderate thinning, and HT—heavy thinning; n = 3, mean ± SD.


Figure 2.
(a) DOC/SOC ratios and (b) LFOC/HFOC ratios of the three treatments, at different soil depths. Different lowercase letters denote a significant difference between the treatments at the same soil layer (p < 0.05), different capital letters to describe differences between soil depths (p < 0.05); Control = traditional management model, MT = moderate thinning, and HT = heavy thinning; n = 3, mean ± SD.

Figure 3.
Soil fertility index (SFI) in the three treatments, at different soil depths and in the whole soil profile; Different letters denote a significant difference between treatments (p < 0.05); Control—traditional management model, MT—moderate thinning, and HT—heavy thinning, mean ± SD.
Figure 3.
Soil fertility index (SFI) in the three treatments, at different soil depths and in the whole soil profile; Different letters denote a significant difference between treatments (p < 0.05); Control—traditional management model, MT—moderate thinning, and HT—heavy thinning, mean ± SD.


Table 1.
Basic characteristics of the three thinning treatments; Control—traditional management model, MT—moderate thinning, and HT—heavy thinning; n = 3–15, mean ± SD.
Table 1.
Basic characteristics of the three thinning treatments; Control—traditional management model, MT—moderate thinning, and HT—heavy thinning; n = 3–15, mean ± SD.
| Treatments | Control | MT | HT |
|---|---|---|---|
| Before thinning | |||
| Stand age (a) | 7 | 7 | 7 |
| Tree density (tree ha−1) | 2490 ± 183 | 2680 ± 151 | 2550 ± 205 |
| Tree height (m) | 7.8 ± 0.5 | 8.1 ± 0.4 | 7.9 ± 0.4 |
| Diameter at breast height (cm) | 11.8 ± 0.4 | 11.5 ± 0.7 | 12.0 ± 0.6 |
| After thinning | |||
| Current age (a) | 22 | 22 | 22 |
| Tree density (tree ha−1) | 1985 ± 102 | 1530 ± 81 | 1334 ± 88 |
| Canopy coverage (%) | 98.3 ± 1.2 | 96.1 ± 1.5 | 93.5 ± 2.3 |
| Tree height (m) | 16.8 ± 0.7 | 17.2 ± 0.5 | 17.7 ± 0.4 |
| Diameter at breast height (cm) | 19.6 ± 0.4 | 21.5 ± 0.8 | 22.3 ± 0.9 |
| Stand volume (m3 ha−1) | 522.8 ± 29.6 | 492.4 ± 32.2 | 474.1 ± 35.7 |
| Arbor biomass (t ha−1) | 194.76 ± 15.29 | 172.55 ± 13.96 | 161.92 ± 9.82 |
| Understory vegetation biomass (t ha−1) | 1.25 ± 0.59 | 1.35 ± 0.80 | 1.83 ± 0.31 |
| Forest floor biomass (t ha−1) | 7.72 ± 1.06 | 7.20 ± 1.32 | 7.61 ± 0.39 |
| Fine root biomass (t ha−1) | |||
| 0–10 cm | 1.56 ± 0.15 | 1.15 ± 0.31 | 1.01 ± 0.28 |
| 10–20 cm | 1.94 ± 0.30 | 1.67 ± 0.24 | 1.85 ± 0.24 |
| 20–40 cm | 1.31 ± 0.25 | 1.61 ± 0.31 | 1.59 ± 0.19 |
| 40–60 cm | 1.57 ± 0.24 | 1.21 ± 0.12 | 1.00 ± 0.09 |
Table 2.
Correlation between SOC and its fractions and soil properties.
| SOC | DOC | LFOC | HFOC | DOC/SOC | LFOC/HFOC | |
|---|---|---|---|---|---|---|
| BD | −0.941 ** | −0.685 ** | −0.890 ** | −0.935 ** | 0.863 ** | −0.840 ** |
| MAWH | 0.968 ** | 0.768 ** | 0.955 ** | 0.954 ** | −0.876 ** | 0.925 ** |
| MIWH | 0.924 ** | 0.633 * | 0.849 ** | 0.924 ** | −0.848 ** | 0.791 ** |
| CWH | 0.923 ** | 0.628 * | 0.850 ** | 0.922 ** | −0.841 ** | 0.791 ** |
| CP | 0.943 ** | 0.674 * | 0.932 ** | 0.930 ** | −0.837 ** | 0.891 ** |
| NCP | 0.592 * | 0.278 | 0.415 | 0.621 * | −0.582 * | 0.344 |
| TPO | 0.937 ** | 0.649 * | 0.890 ** | 0.933 ** | −0.849 ** | 0.843 ** |
| SWC | −0.465 | −0.445 | −0.297 | −0.513 | 0.684 * | −0.370 |
| ST | 0.919 ** | 0.751 ** | 0.793 ** | 0.941 ** | −0.984 ** | 0.797 ** |
| silt | −0.779 ** | −0.617 * | −0.683 * | −0.794 ** | 0.787 ** | −0.675 * |
| clay | −0.790 ** | −0.723 ** | −0.674 * | −0.811 ** | 0.898 ** | −0.711 ** |
| sand | 0.798 ** | 0.655 * | 0.696 ** | 0.814 ** | −0.826 ** | 0.698 ** |
| SOM | 0.999 ** | 0.803 ** | 0.952 ** | 0.998 ** | −0.958 ** | 0.934 ** |
| TN | 0.902 ** | 0.647 * | 0.800 ** | 0.909 ** | −0.862 ** | 0.749 ** |
| TP | 0.340 | 0.087 | 0.327 | 0.327 | −0.200 | 0.250 |
| TK | −0.715 ** | −0.704 ** | −0.648 * | −0.726 ** | 0.742 ** | −0.654 * |
| AN | 0.976 ** | 0.757 ** | 0.898 ** | 0.979 ** | −0.943 ** | 0.868 ** |
| AP | 0.889 ** | 0.858 ** | 0.880 ** | 0.886 ** | −0.870 ** | 0.893 ** |
| AK | 0.967 ** | 0.861 ** | 0.944 ** | 0.962 ** | −0.933 ** | 0.937 ** |
| Ca | 0.750 ** | 0.734 ** | 0.685 * | 0.752 ** | −0.742 ** | 0.667 * |
| Mg | −0.330 | −0.375 | −0.228 | −0.347 | 0.388 | −0.243 |
| Mn | −0.581 * | −0.608 * | −0.530 | −0.595 * | 0.622 * | −0.555 * |
| Cu | −0.579 * | −0.681 * | −0.576 * | −0.573 * | 0.551 | −0.582 * |
| Zn | −0.083 | −0.459 | −0.222 | −0.053 | 0.009 | −0.262 |
| Fe | −0.637 * | −0.679 * | −0.602 * | −0.637 * | 0.617 * | −0.596 * |
| pH | −0.530 | −0.635 * | −0.457 | −0.541 | 0.539 | −0.480 |
* Significant correlation at 0.05 level; ** Significant correlation at 0.01 level. BD—bulk density, MAWH—maximum water holding capacity, CWH—capillary water holding capacity, MIWH—minimum water holding capacity, CP—capillary porosity, NCP—no-capillary porosity, TPO—total porosity, SWC—soil water content, ST—soil temperature, SOM—soil organic matter, TN—total nitrogen, AN—alkali-hydrolysable nitrogen, TP—total phosphorus, AP—available phosphorus, TK—total potassium, AK—available potassium, Ca—calcium, Mg—magnesium, Cu—copper, Zn—zinc, Fe—iron, Mn—manganese, pH—hydrogen ion concentration.
© 2017 by the authors. Licensee MDPI, Basel, Switzerland. This article is an open access article distributed under the terms and conditions of the Creative Commons Attribution (CC BY) license (http://creativecommons.org/licenses/by/4.0/).
Share and Cite
MDPI and ACS Style
Cheng, X.; Yu, M.; Wang, G.G. Effects of Thinning on Soil Organic Carbon Fractions and Soil Properties in Cunninghamia lanceolata Stands in Eastern China. Forests 2017, 8, 198. https://0-doi-org.brum.beds.ac.uk/10.3390/f8060198
AMA Style
Cheng X, Yu M, Wang GG. Effects of Thinning on Soil Organic Carbon Fractions and Soil Properties in Cunninghamia lanceolata Stands in Eastern China. Forests. 2017; 8(6):198. https://0-doi-org.brum.beds.ac.uk/10.3390/f8060198
Chicago/Turabian StyleCheng, Xiangrong, Mukui Yu, and G. Geoff Wang. 2017. "Effects of Thinning on Soil Organic Carbon Fractions and Soil Properties in Cunninghamia lanceolata Stands in Eastern China" Forests 8, no. 6: 198. https://0-doi-org.brum.beds.ac.uk/10.3390/f8060198
Note that from the first issue of 2016, this journal uses article numbers instead of page numbers. See further details here.