Article

Non-Structural Carbohydrate Dynamics in Leaves and Branches of Pinus massoniana (Lamb.) Following 3-Year Rainfall Exclusion

1
College of Life Sciences, Fujian Normal University, Fuzhou 350117, China
2
College of Ecological Environment and Urban Construction, Fujian University of Technology, Fuzhou 350118, China
3
Fujian Provincial Key Laboratory for Plant Eco-physiology, Fujian Normal University, Fuzhou 350007, China
4
School of Geographical Sciences, Fujian Normal University, Fuzhou 350007, China
5
Department of Basic Medical Science, Fujian Medical University, Fuzhou 350004, China
*
Author to whom correspondence should be addressed.
Submission received: 17 May 2018 / Revised: 31 May 2018 / Accepted: 31 May 2018 / Published: 1 June 2018
(This article belongs to the Special Issue Physiological Responses to Abiotic and Biotic Stress in Forest Trees)

Abstract

:
Drought-induced tree mortality is an increasing and global ecological problem. Stored non-structural carbohydrates (NSCs) may be a key determinant of drought resistance, but most existing studies are temporally limited. In this study, a 3-year 100% rainfall exclusion manipulation experiment was conducted to evaluate the response of NSC dynamics to drought stress in 25-year-old Pinus massoniana leaves and branches. The results showed: (1) compared with the control condition, leaf NSC concentration in the drought treatment increased 90% in the early stage (days 115–542) (p < 0.05), and then decreased 15% in the late stage (days 542–1032), which was attributed to water limitation instead of phenology; (2) the response of leaf NSCs to drought was more significant than branch NSCs, demonstrating a time lag effect; and (3) the response of P. massoniana to mild drought stress was to increase the soluble sugars and starch in the early stage, followed by an increase in soluble sugars caused by decreasing starch in the later stress period. Considering these results, mid-term drought stress had no significant effect on the total NSC concentration in P. massoniana, removing carbon storage as a potential adaptation to drought stress.

1. Introduction

The frequency and intensity of tree mortality associated with drought is increasing globally [1,2,3]. As an important part of forest ecosystems, increased tree mortality could lead to worldwide large-scale forest die-off [4,5]. Such widespread events would have long-term impacts on ecosystem structure and functioning [2,6], as well as forest carbon storage capacity [7]. Severe and recurrent drought events have been identified as a major contributing factor to forest decline and mortality, resulting in feedback to atmospheric carbon dioxide (CO2) and climate [8,9]. Despite a growing research interest surrounding the physiology of drought-induced tree mortality [10], our current understanding of the adaptive mechanisms remains poor, limiting our ability to predict widespread mortality events, their feedback in the future climate system, and the impact on ecosystem services provided to humans [11,12,13].
In existing studies, McDowell [14] formalized two non-exclusive hypotheses of hydraulic failure and carbon starvation to explain the impact of drought stress on water and carbon cycling. The hydraulic-failure hypothesis predicts that intense drought quickly reduces soil moisture and increases evaporative demand, causing the plant’s water potential to fall below a critical level. This results in the cavitation of xylem conduits and rhizosphere, stopping the flow of water and desiccating plant tissues, eventually causing cellular death [15]. When droughts are less intense but prolonged, carbon starvation occurs. The carbon starvation hypothesis predicts that preventing desiccation via stomatal closure causes a decrease in the photosynthetic uptake of carbon, but the continued demand for carbohydrates to maintain metabolism depletes carbohydrate reserves [14,16]. Studies have attempted to verify this hypothesis, but the results were inconsistent due to differences in tree species, drought intensity and duration, as well as differences in measurement methods [1,17,18]. However, a growing number of studies are demonstrating an association between carbon reserve depletion and drought-induced mortality in different tree species [1,17,19,20,21,22].
Accumulated and stored non-structural carbohydrates (NSCs), as the primary products of photosynthesis, support growth and normal metabolism [23]. NSCs mainly consist of soluble sugars (e.g., sucrose, glucose, and fructose) and immobile starch. The dynamics of NSC storage are related to the balance between carbon source and carbon sink. After NSC compounds are assimilated during photosynthesis, the products are passively allocated first to metabolism, then to new tissue growth. When all demands for carbon have been met, the remaining carbon is stored. Stored NSCs provide an essential carbon pool buffer when demand for growth and maintenance exceeds the supply provided by photosynthesis. For example, this pool is essential in the dormant season, in response to environmental stress, as well as during other carbon deficit conditions to help to maintain hydraulic conductivity [16,24]. The role of NSCs as a buffer has been supported by previous studies [14,16,25]. However, due to differences in drought properties as well as tree size, age, tissue, and species, the lack of agreement among these studies about the effects of drought on NSC dynamics supports the need for further investigation [1,25] to better understand and predict forest ecosystem responses to global climate scenarios.
Different levels of drought intensity may induce different NSC dynamics in trees [14]. The following studies emphasized the influence of drought progression on NSC dynamics [26]. In the early stages of drought, NSCs may increase because cell turgor pressure reduces plant growth ahead of photosynthetic decline, as well as when a carbohydrate imbalance occurs between supply and demand [26,27,28]. Previous research found that photosynthesis was more sensitive to drought stress than respiration [29,30]. Thus, as drought conditions developed, carbohydrates produced by photosynthesis could no longer meet the need of respiration, and stored NSC compounds began to be consumed, leading to a decrease in NSCs. When the concentration of NSCs dropped to a certain level and failed to meet the demands of plant physiological metabolism, trees faced the risk of mortality [26]. However, most of the previous studies tended to measure NSC dynamics of seedlings in growing seasons under varying water supplies by carrying out short-term experiments [9,25,27,31,32,33]. Either no reduction or even increases in carbohydrate reserves were found under short-term drought stress [8,19,33]. A model used to estimate carbohydrate reserves determined that reserves should decline under exceptionally long-term drought stress [26,34]. The limited timeframe in the short-term experiments restricted the analysis of the carbohydrates dynamics caused by climate change. So, there is a lack of mid- or long-term drought-induced NSC dynamics experiments in adult trees, which are particularly critical for the prediction of tree and forest responses to future climate conditions.
Different tree tissues have different NSC concentrations as a result of drought stress. Carbon storage in different tissues depends on the role each of these parameters plays in response to drought stress [31,35,36]. Galiano et al. [37] found that trees subjected to severe drought could recover rapidly depending on their storage organs (e.g., lignotubers). As the main site of photosynthesis, leaves have stronger carbon assimilation ability, and became one of the main carbon sources to meet the carbon demand. The distribution in NSC concentration was related to the distance to the leaves (carbon source). The tissues near the carbon source were preferable for NSC to those far from the carbon source [38]. So, the distribution of NSCs in leaves and branches gradually became a research focus. Hartman et al. [1] examined NSC concentrations under drought conditions and found that leaves and branches showed little difference. Other studies that focused on different species or different tissues reported variable conclusions [39,40]. A study showed that mortality caused by drought may not be defined by the organism, but by the tree tissue [1]. As such, the concentration of NSCs stored in different tissues may provide a comprehensive understanding of the response of trees to drought stress, helping to predict the impact of future global climate change on forest ecosystem carbon cycling.
To better understand the responses to precipitation reduction of plant-stored NSC concentration dynamics, and to reveal the effects of drought stress on plant carbon supply status, we conducted a 3-year rainfall exclusion experiment from April 2013 to January 2016 in Chang Ting county, Fujian province, China. Here, we measured the concentration of stored NSCs in leaves and branches of adult Pinus massoniana (Lamb.), which is widely used for afforestation in Chang Ting country, grown in both control (natural) conditions and drought (100% rainfall exclusion) treatments. We aimed to (1) determine the effect of mid-term drought on the concentration and composition of NSCs; (2) characterize the seasonal dynamics in NSC concentration over the study period; and (3) study the relationship between NSCs, their composition, and soil moisture content.

2. Materials and Methods
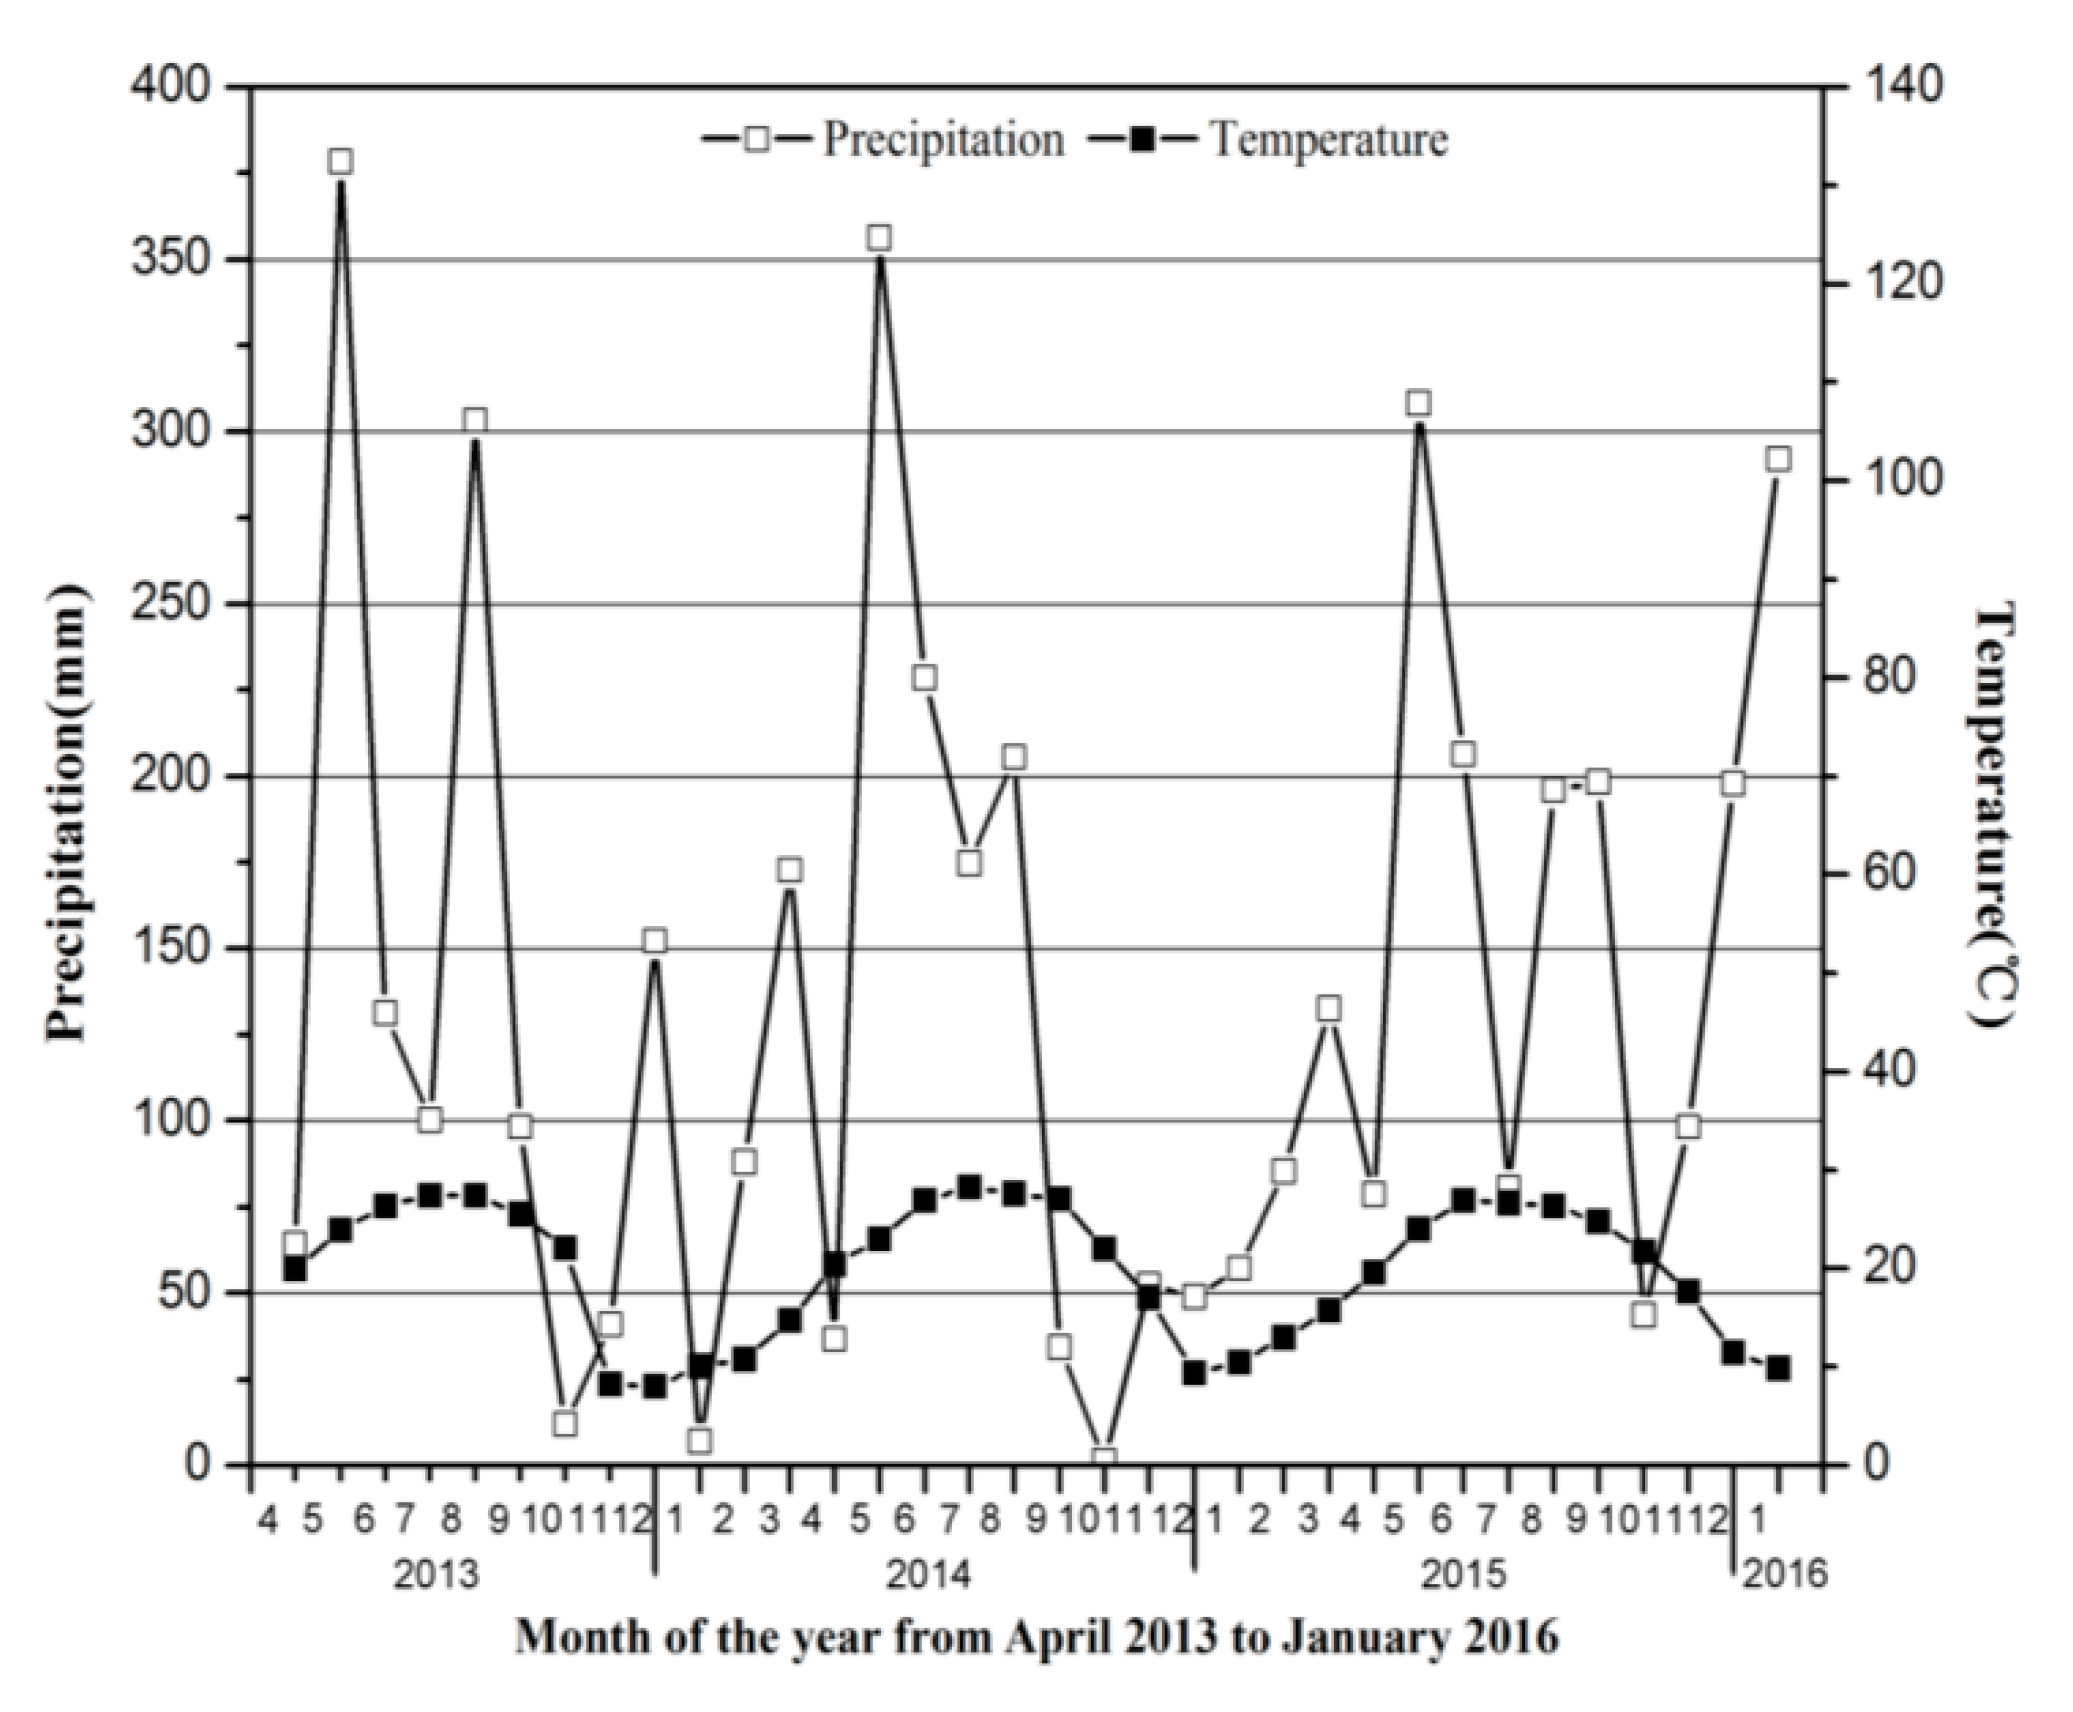
2.1. Study Site

The study site was located in the town of HeTian, in Southeast Chang Ting, FuJian province, China (116°18′–116°31′ E, 25°33′–25°48′ N; 310 m asl), which is one of the regions in Fujian province experiencing serious soil erosion. The climate is characterized as subtropical monsoon with distinguishing wet (March to September) and dry (October to February) seasons. The study site had a mean annual rainfall of 1737 mm, which mainly fell from May to July, and a mean annual temperature between 17.5 and 18.8 °C. The lowest recorded temperature was −7.8 °C, and the highest recorded temperature was 39.8 °C from April 2013 to January 2016. Climate data were collected every 15 min from an automatic meteorological station installed at the study site to monitor temperature, precipitation (Figure 1), and soil moisture content (Figure 2). According to Figure 1, we used the linear combination of the two most important climatic factors (precipitation and temperature) to define the aridity condition, called the Bagnouls–Gaussen diagram [41]. The climate was defined as arid when the value of precipitation was lower than the double value of the mean temperature, “P-2T”. As illustrated by Figure 1, the hydric balance inverted when the precipitation point was below the temperature. Thus, the results estimated that only October 2013, January 2014, April 2014, September 2014, October 2014, and October 2015 experienced soil water deficiency between April 2013 and January 2016. Therefore, we concluded that there was no aridity at the study site, which could be considered as a control group. The main soil type of this study site was red soil, derived from medium-to-coarse crystalline granite. Most of the soil exposed the soil core (B layer), the parent material layer (C layer), and the mother rock (D layer). Vegetation cover in the study area was low. The dominant species were P. massoniana, Dicranopteris dichotoma (Thunb.) Bernh., and less shrub and grass vegetation occurred under the forest.

2.2. Experimental Design

A 3-year rainfall exclusion experiment under natural setting were running in the study area since April 2013. We set up four 20 × 20 m sample plots facing southwest on a 30° slope at 333 m above sea level. Inside these four sample plots, we had 42 adult P. massoniana individuals, nearly 25 years old, with 10 or 11 P. massoniana individuals in each sample, which were seeded by aircraft in the 1990s. On average, the P. massoniana individuals were 4.2 cm in diameter at breast height (DBH), 2.4 m in height, with a leaf length of 8.5 cm. Two assigned plots received a drought treatment. To avoid the influence of slope on sampling, these two plots included one from up-slope and the other from down-slope. The drought treatment, which was achieved by fixing 4 m of transparent ultraviolet (UV) paint wave tile (light transmittance 90%), installed parallel to the terrain so that rainfall could flow down the slope. PVC strips did not produce changes in environment temperature or humidity. In addition, an 80-cm deep ditch lined with aluminum was dug along the entire top edge of the drought treatment plots to prevent surface runoff inflow. The drought treatment resulted in decreased soil moisture over the 3-year period.

2.3. Leaf Water Potential

To test the effectiveness of the rainfall exclusion on plant water status, leaf water potentials were measured at dawn (Ψd) nearly once per month from April 2013 to March 2014 with a WP4 dew-point potential meter (Decagon Device, Pullman, WA, USA). The six target individuals, which included three from the up-slope plot and three from the down-slope plot were chosen from each treatment. Two south-facing braches from the upper and middle parts of each tree crown with healthy leaves were collected from each individual, immediately placed in a cold closet (0–4 °C), then taken to the laboratory to determine the leaf water potentials.

2.4. Sampling Methods

After 115 days of continuous 100% rainfall exclusion, three individuals 4.2 cm in diameter and 2.4 m in height within the center of each plot, to avoid the border effect (n = 12), were randomly selected. The six individuals from each treatment included three from the up-slope plot and three from the down-slope plot. Plant sampling dates were chosen according to the main climatic drivers at the study site. The sampling days were as follows: day 115 (18 August 2013, late summer), day 185 (27 October 2013 autumn), day 256 (6 January 2014, winter), day 332 (23 March 2014, spring), day 467 (1 August 2014, late summer), day 542 (15 October 2014, autumn), day 638 (30 December 2014, winter), day 738 (9 April 2015, spring), day 861 (10 August 2015, late summer), day 941 (29 October 2015, autumn), and day 1032 (28 January 2016, winter). On 28 January 2016, we found that two sampled individuals in the drought treatment had died, and decided to terminate the experiment. In all cases, leaves and branches were collected from each sampled individual to measure the concentrations of stored NSCs. To minimize diurnal variability in NSCs, four small branches exposed to the sun were always collected between 9:00 and 11:00 a.m., from the southeast and northwest direction of the upper and middle parts of each tree crown, above which we selected well-developed leaves. Leaf samples were 8.3 to 8.6 cm in length and branch samples were 0.3 to 0.5 cm in diameter (with bark removed). Samples were mixed to create one leaf sample and one branch sample. All the samples were immediately stored in a cold closet (0–4 °C) prior to performing laboratory analyses. To minimize continued enzymatic activity, all samples were microwaved at 800 W for 5 min, then dried at 65 °C for 48 h until a constant weight was reached. Leaf and branch samples (with bark removed) were ball-milled to a fine powder (Tissuelyser-24, Shanghai, China) for analysis.

2.5. NSC Analysis

We measured NSC concentration using the sum of soluble sugar and starch concentrations using the anthrone method [42] with some minor modifications. A 0.05 g subsample of ground tissue was placed in a 10 mL centrifuge tube, and 5 mL of distilled water was added. The sample was then subjected to 80 W ultrasonic disruption at normal atmospheric temperature for 30 min. The mixture was incubated at 100 °C in a water bath for 10 min and then cooled. The sample was then centrifuged at 4000 r/min for 20 min. The supernatant, after three extractions, was used for soluble sugar determination.
Starch was extracted from the residue at the top of the centrifuge tube, then 1.5 mL of 9.2 M HClO4 and 3.5 mL of distilled water were added to the mixture and left to sit overnight. The following day, the sample was subjected to a boiling water bath for 10 min. After cooling to room temperature, the sample was centrifuged at 4000 r/min for 20 min. After three extractions, the supernatant was used for starch determination.
Both the soluble sugar and starch concentrations were determined based on the absorbance at 625 nm using the same anthrone reagent in a spectrophotometer (TU1901, Persee, Beijing, China) [42]. Finally, the corresponding content was deduced using the formula ( y = M   ×   V 1   ×   V 2 W   ×   C ), where y is the soluble sugar or starch concentration expressed as mg/g, M is the glucose concentration determined from the standard curve, V1 is the sample extraction volume, V2 is the extract volume at color development, W is the sample weight, and C is the dilution ratio at color development.

2.6. Statistical Analyses

All results are reported as mean ± standard deviation (SD) for the six replicates. We used repeated measures of analysis of variance (ANOVA) to study the effects of treatment and time on the amount of stored NSCs and their composition. One-way ANOVA was used to detect the effects of different treatments on the above indices. Single linear regression models were used to compare the relationships among NSCs, soluble sugar, starch concentration, and the ratio of soluble sugar to starch for the soil moisture content. Significance and high significance levels for all tests were set at p < 0.05 and p < 0.01, respectively. All statistical analyses were performed using SPSS 19.0 (SPSS Inc., Chicago, IL, USA). Diagrams were drawn using Origin 8.0 software.

3. Results

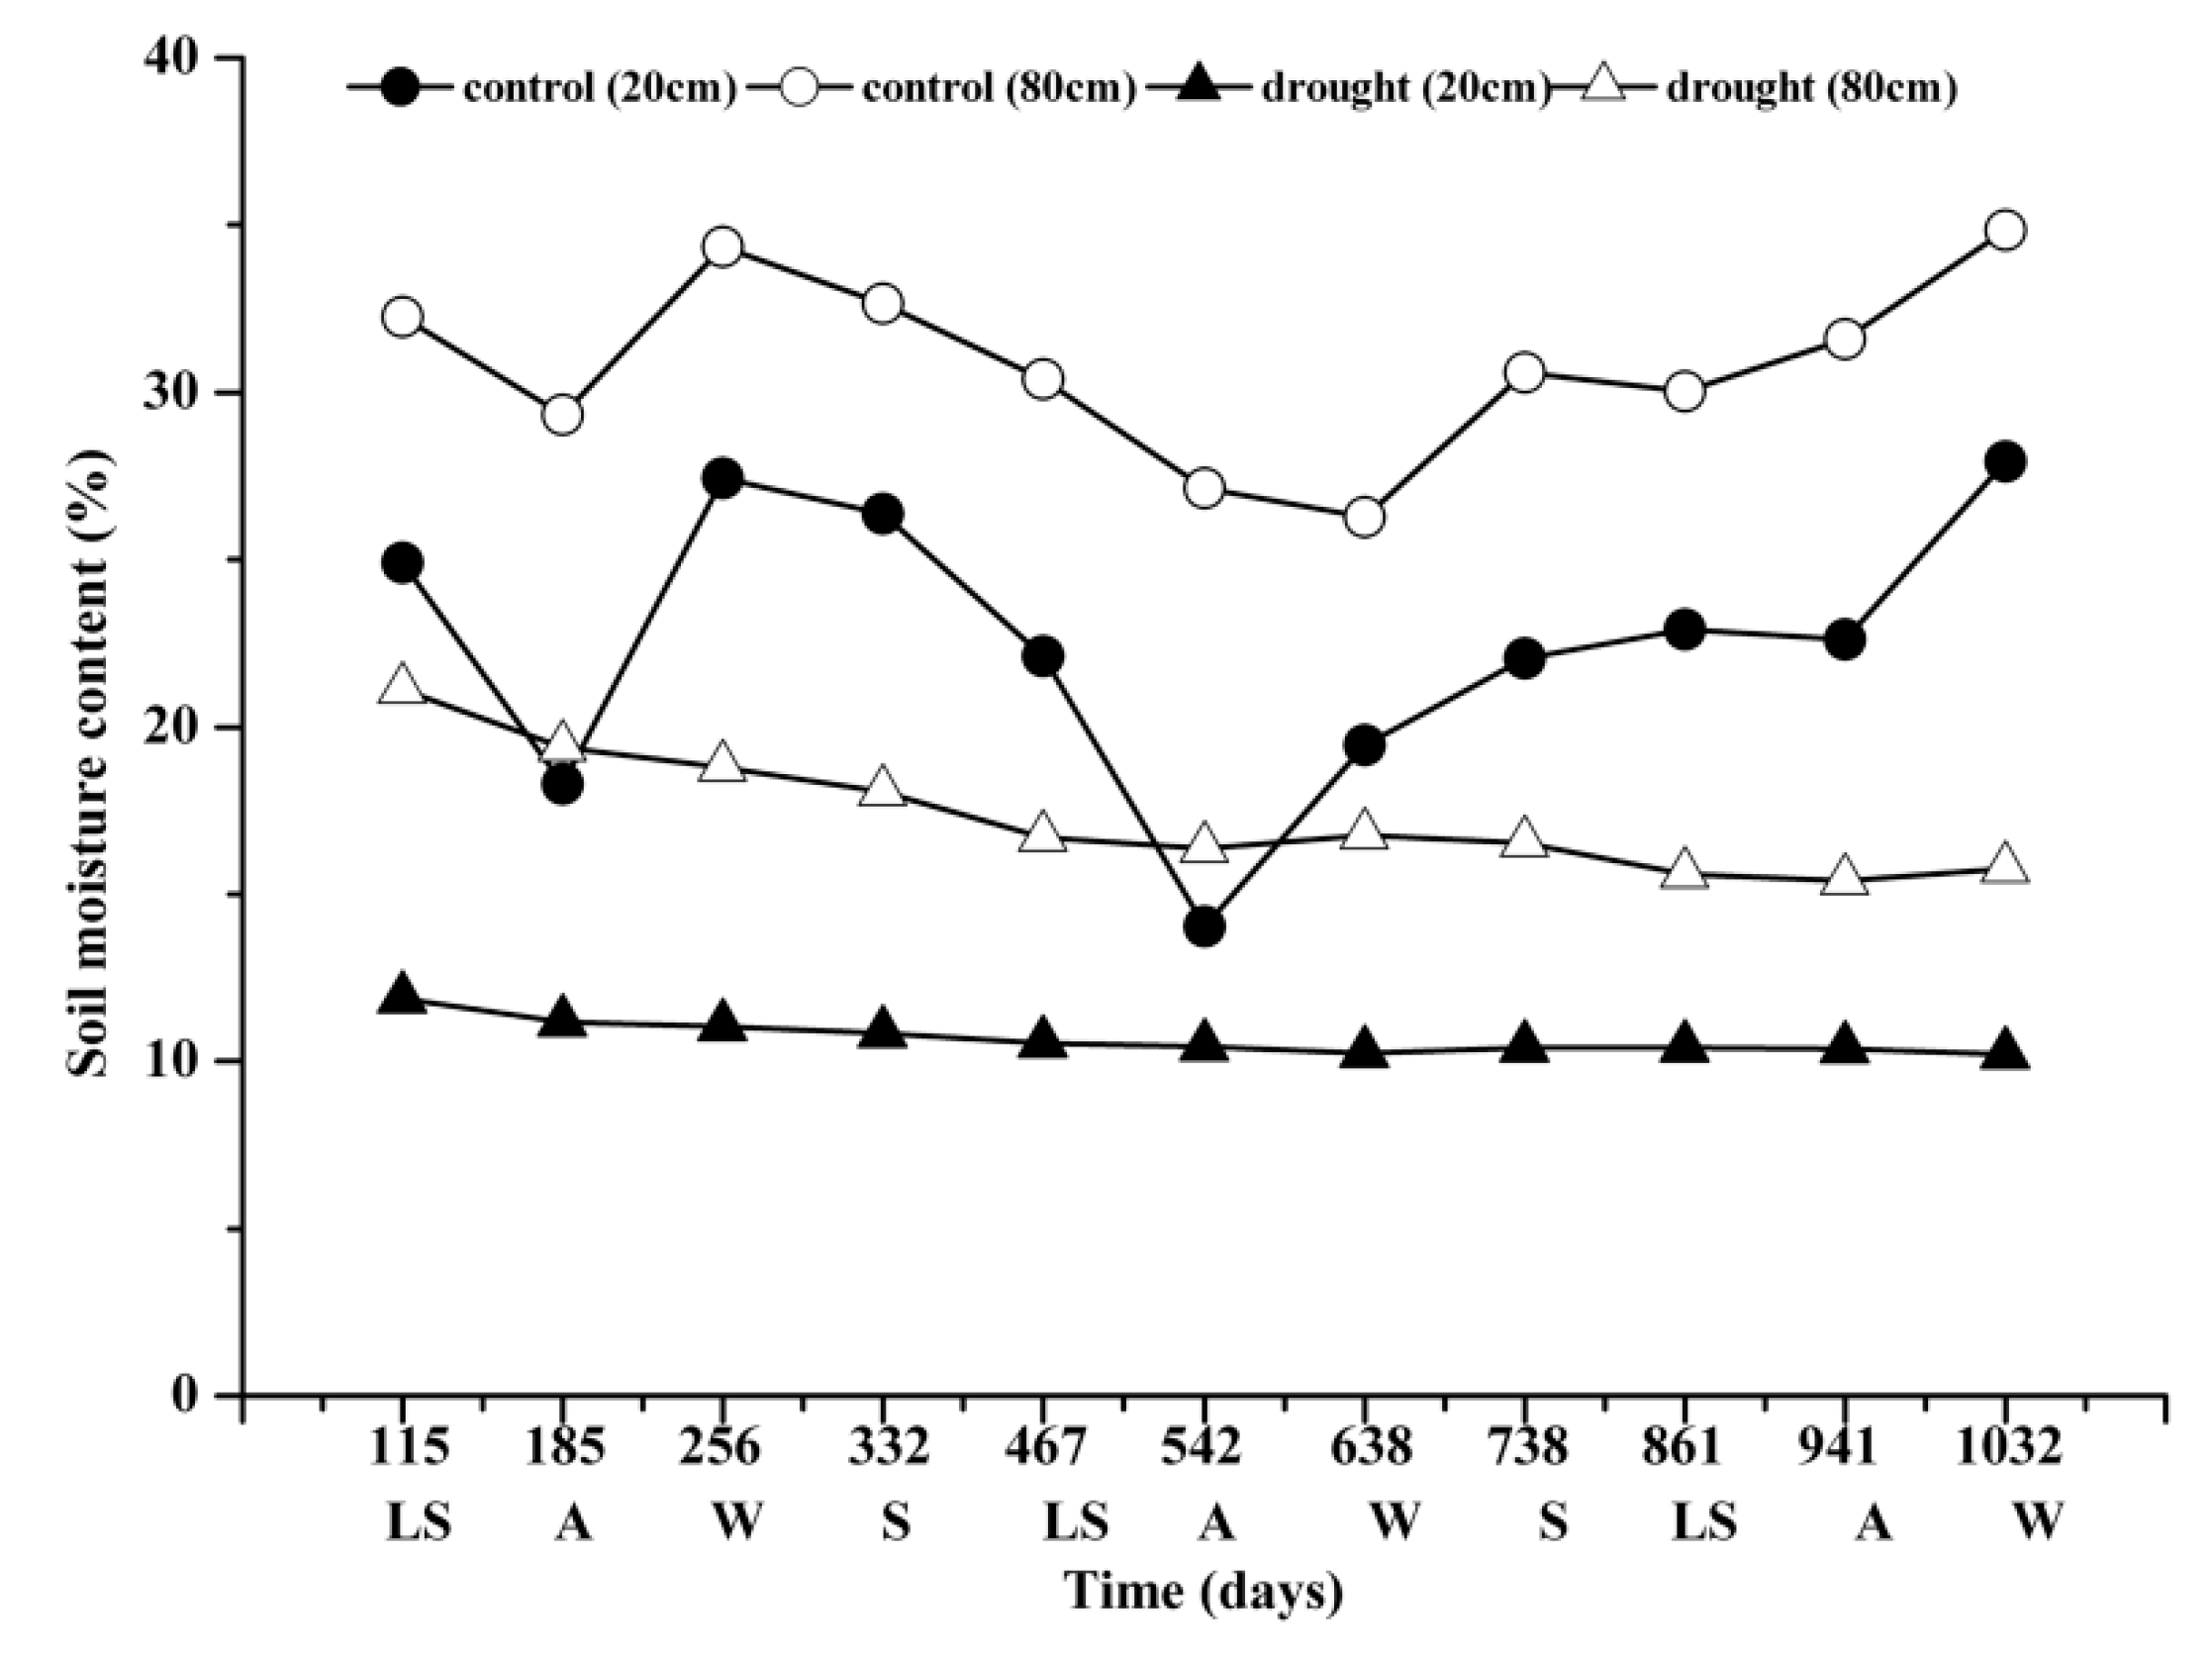
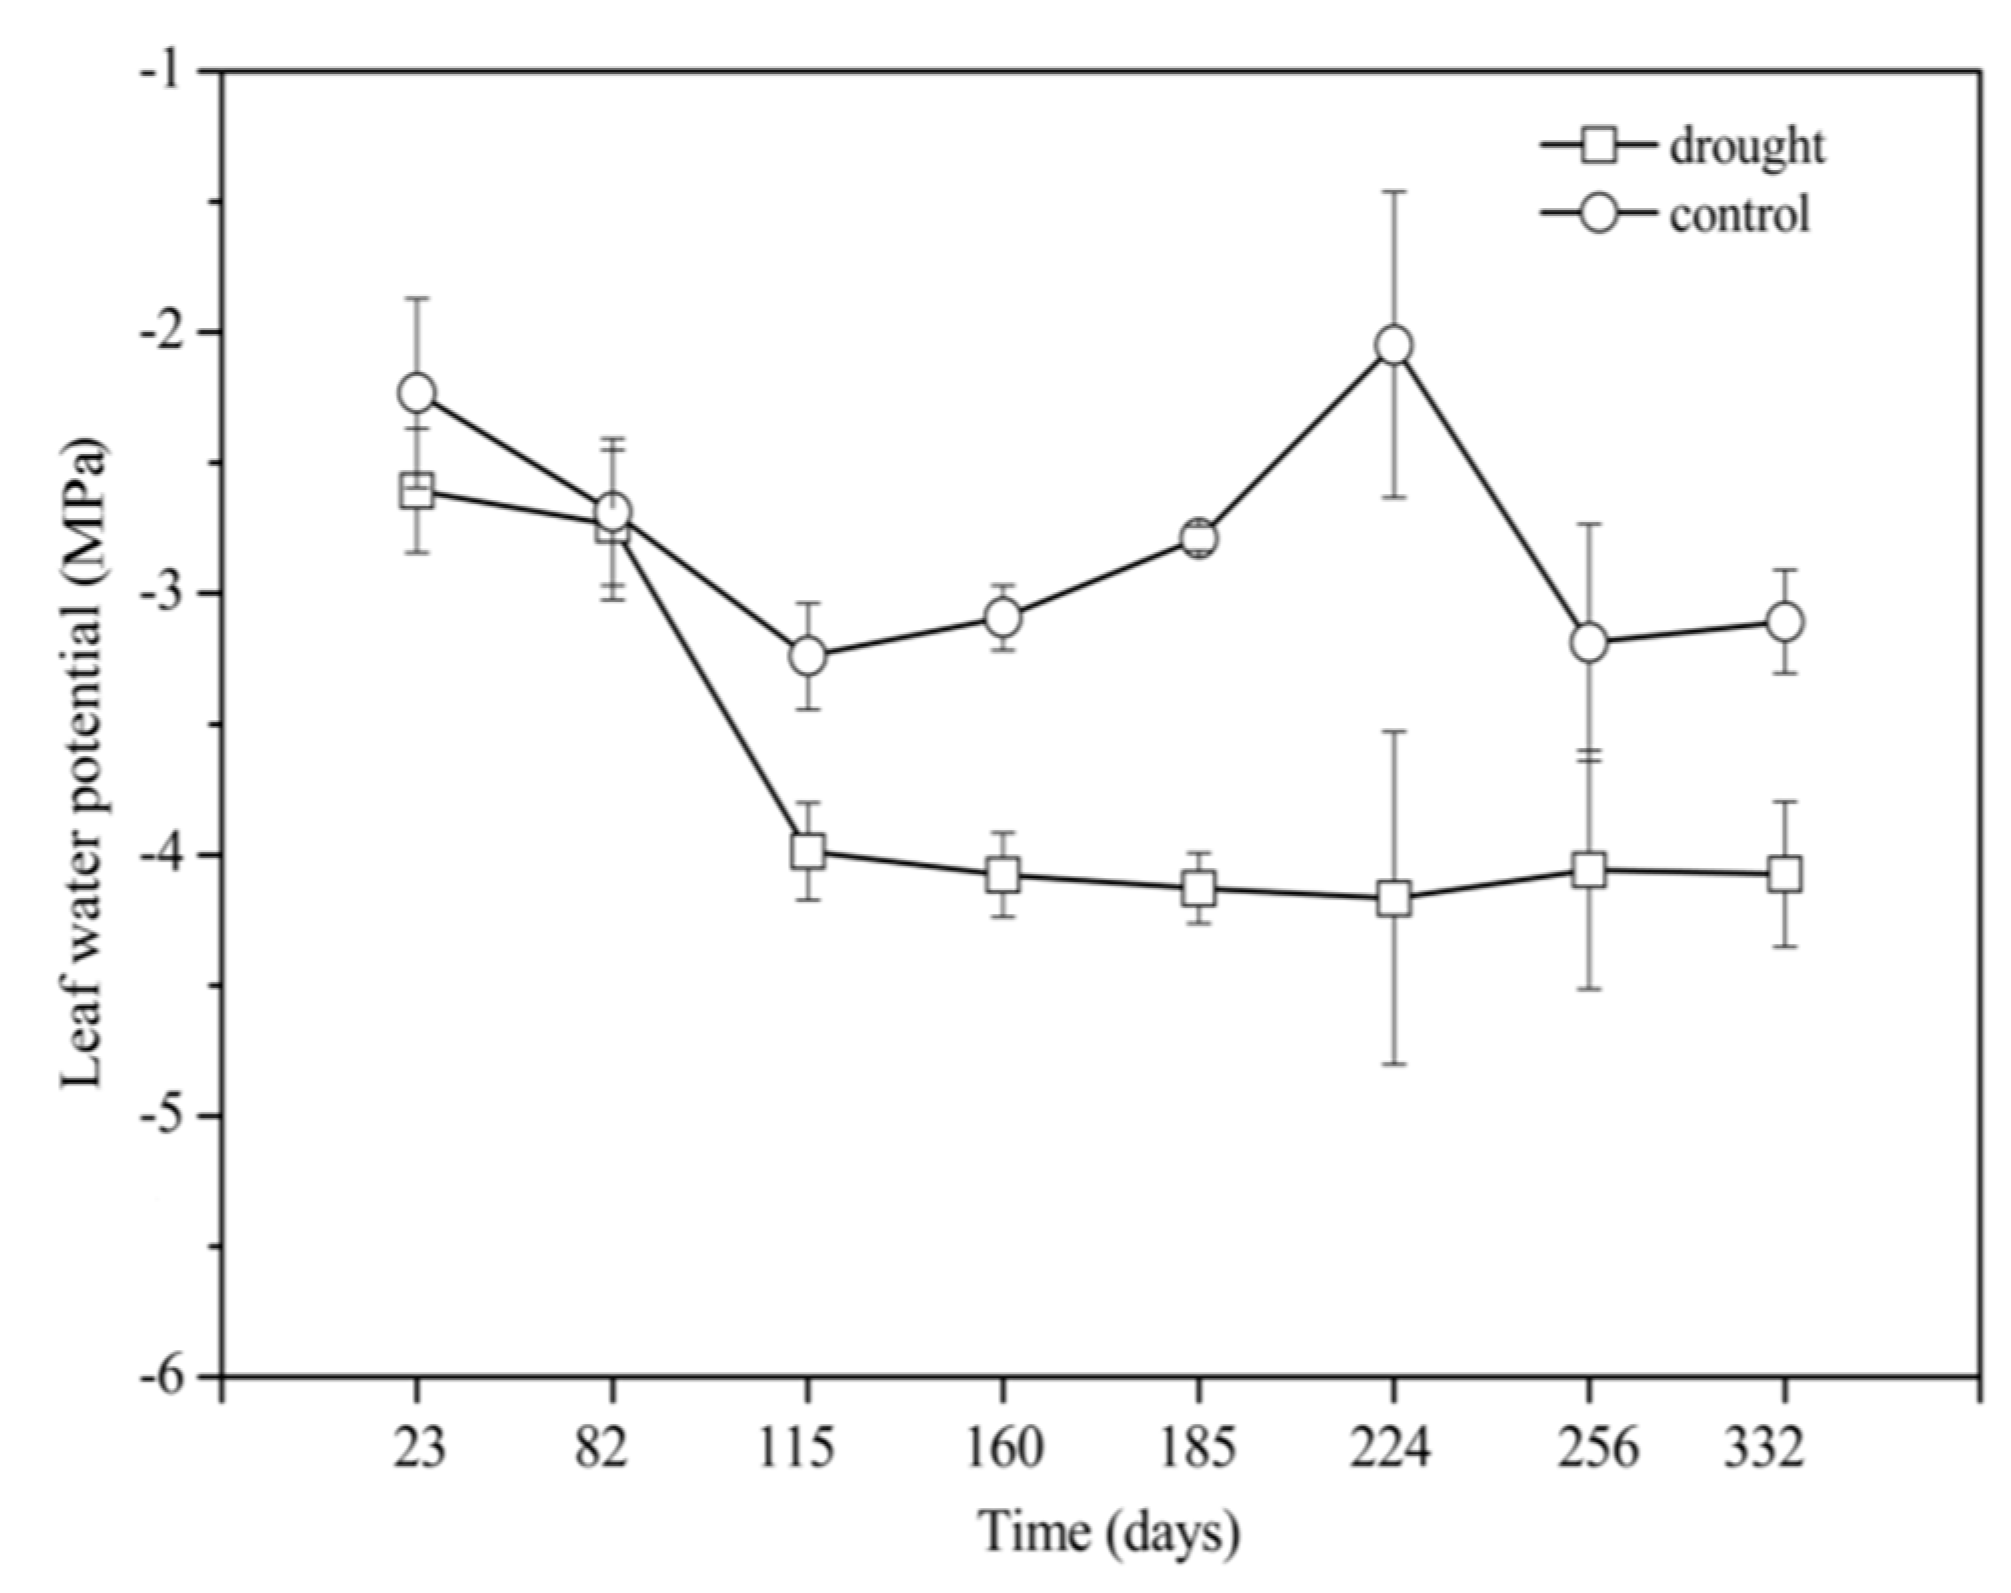
3.1. Soil Moisture Content and Leaf Water Potential During Mid-Term Drought

Soil moisture content differed between drought and control treatments. During the 1032 days of continuous monitoring, the soil moisture content at 20 and 80 cm depths of the control treatment was significantly higher than the corresponding soil moisture in the drought group, by 11.87% and 13.54%, respectively (Figure 2). Nevertheless, the average soil moisture content in the drought group, 10.69% at 20 cm depth and 17.31% at 80 cm depth, appeared to be able to meet the demands of a normal metabolism. We proposed two mechanisms to explain this phenomenon: (1) moderate slope limited the degree of drying due to below-ground flow; and (2) complete stomatal closure occurred under drought conditions at the beginning of the experiment. Overall, with 1737 mm annual rainfall at the study site, the experiment might be defined as mild drought [43]. Mild drought conditions are more representative of the real scenarios that are expected under natural conditions. In order to check the effects of rainfall exclusion on P. massoniana, leaf water potentials were analyzed. The effect of increasing drought on Ψd is seen in Figure 3. From April 2013 to March 2014, Ψd in the drought group decreased over the course of the experiment. The mean value of Ψd (−3.73 MPa) in the drought group was significantly lower than that in the control group (Ψd: −2.80 MPa) (p < 0.05; Figure 3), suggesting that soil water availability was different between different treatments.
Then in the control treatment, soil moisture content at depths of both 20 and 80 cm showed significant seasonal fluctuations (p < 0.01; Figure 2). In the drought group, soil moisture content at depths of both 20 and 80 cm were significantly lower than that of the control group at day 115 (p < 0.01; Figure 2). The remaining study period (days 185–1032) showed very little fluctuation in soil moisture content (Figure 2).

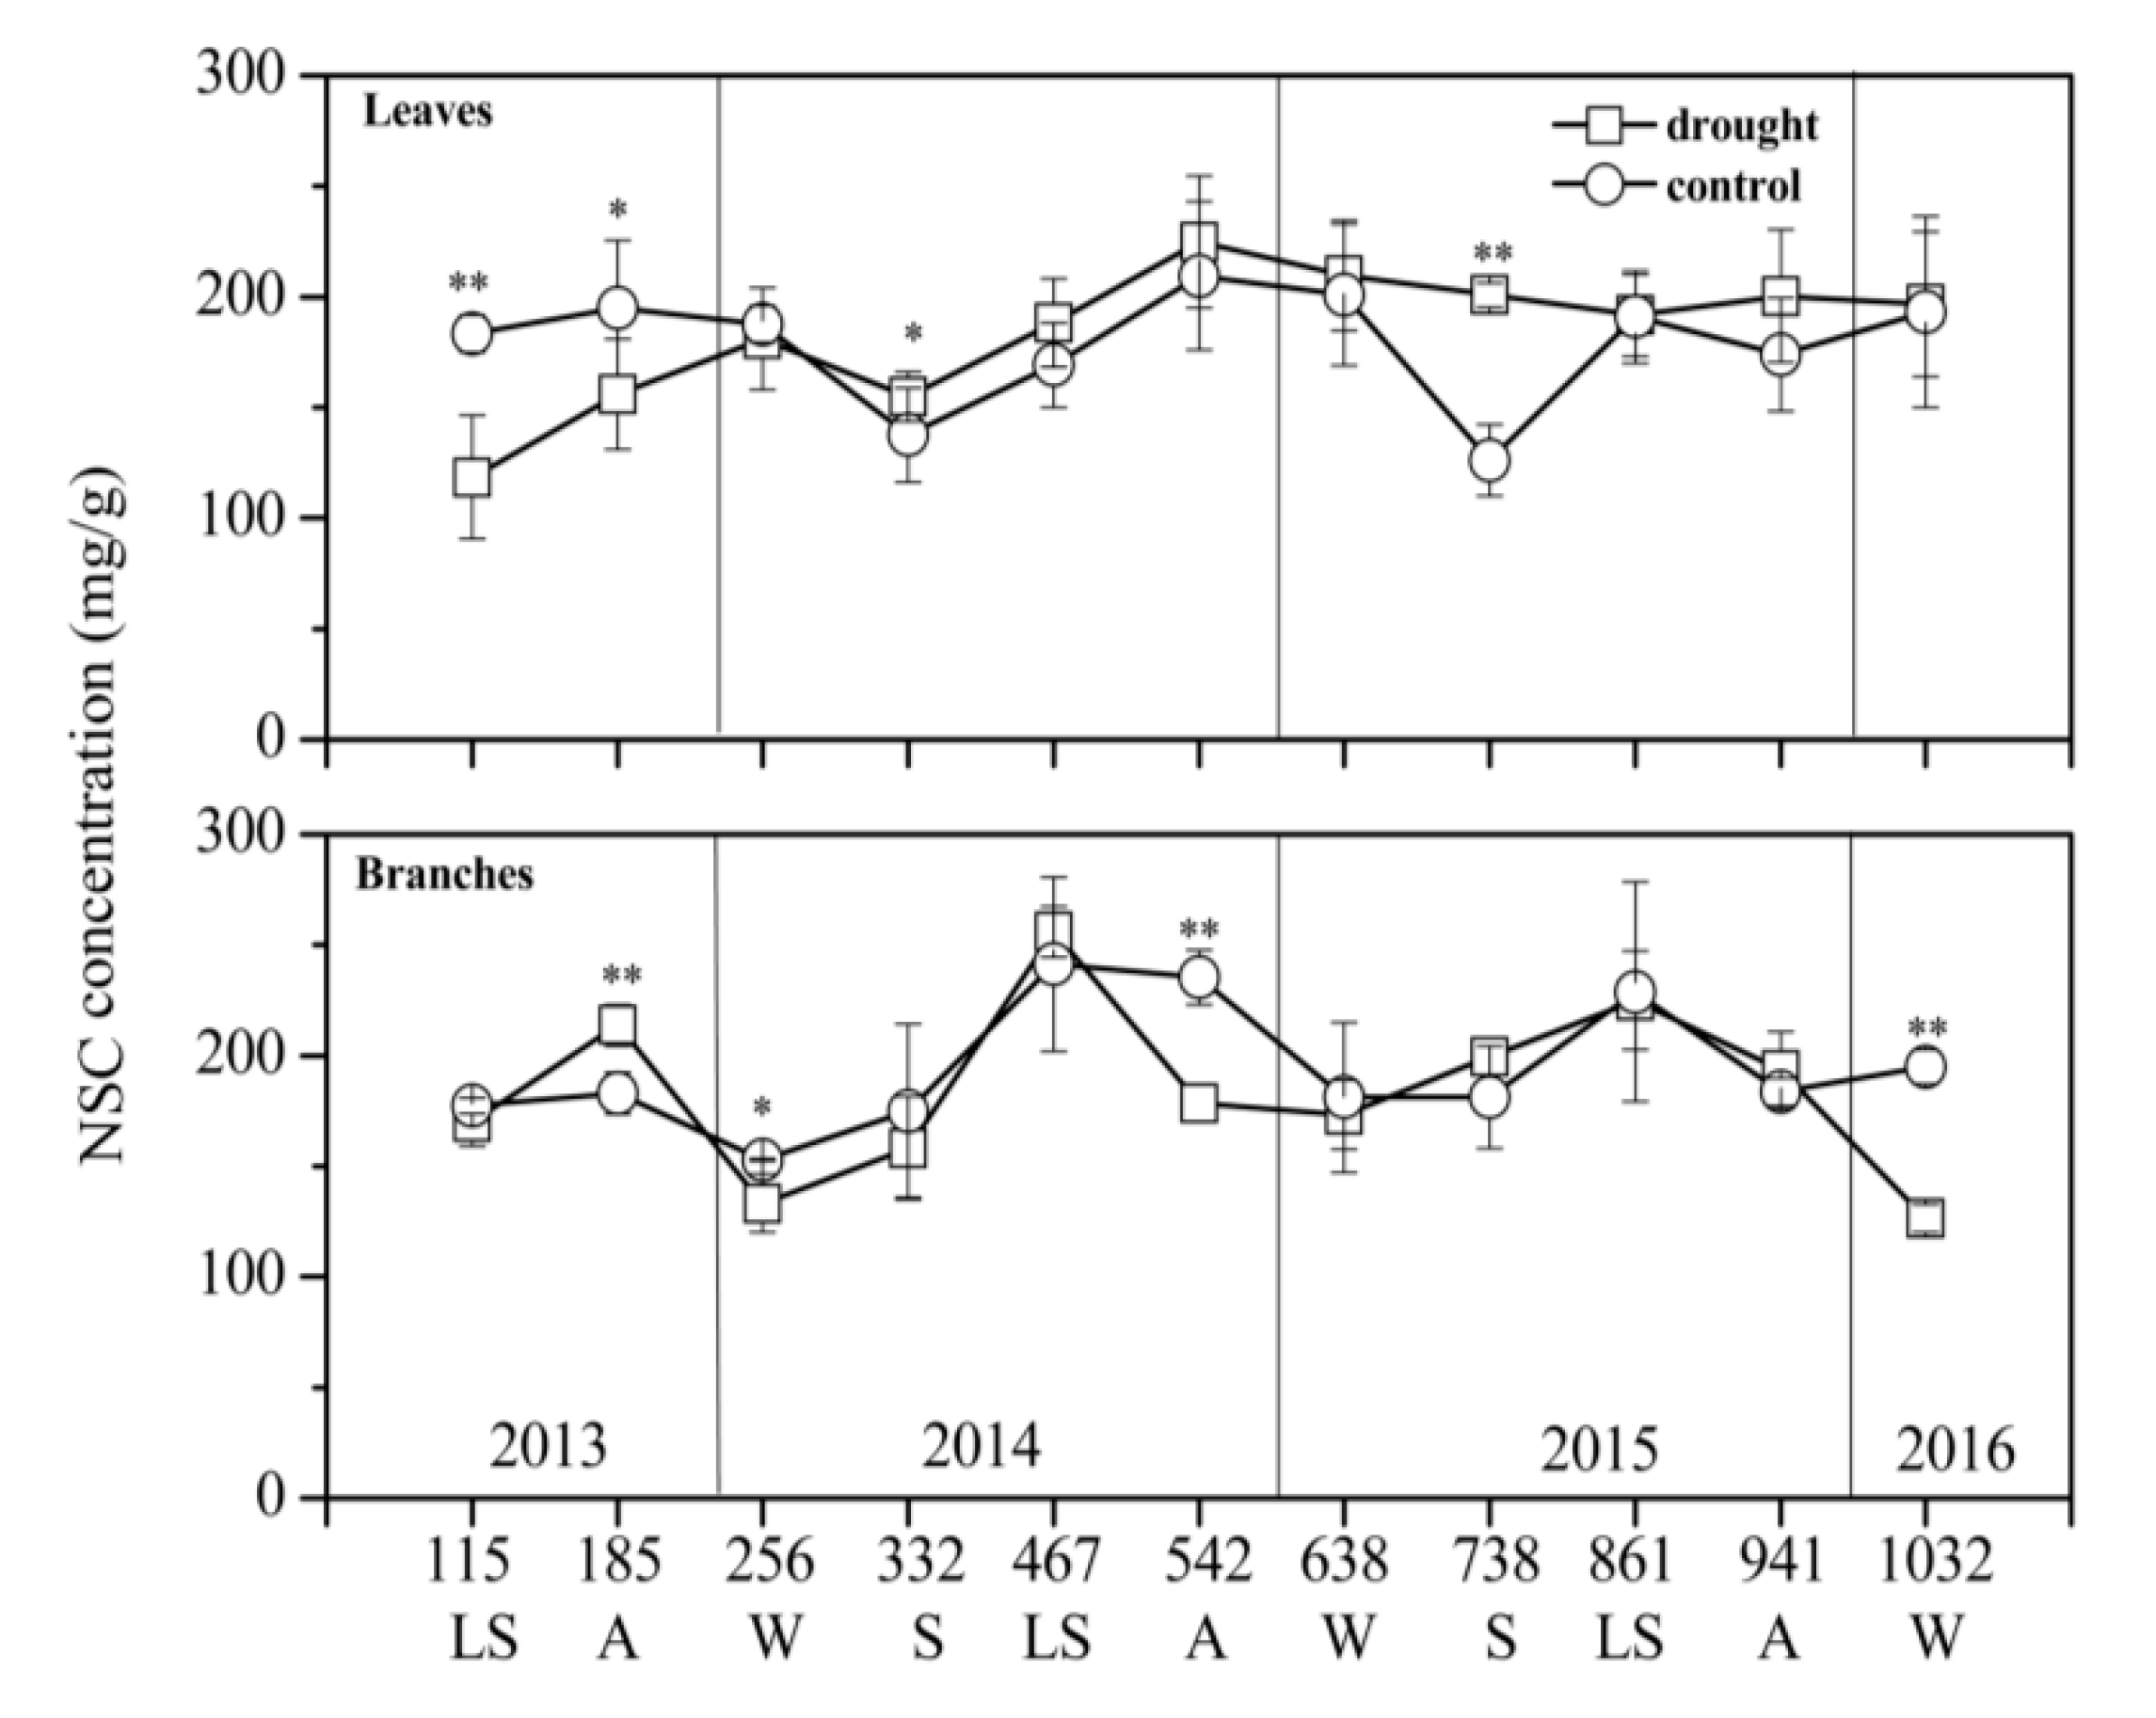
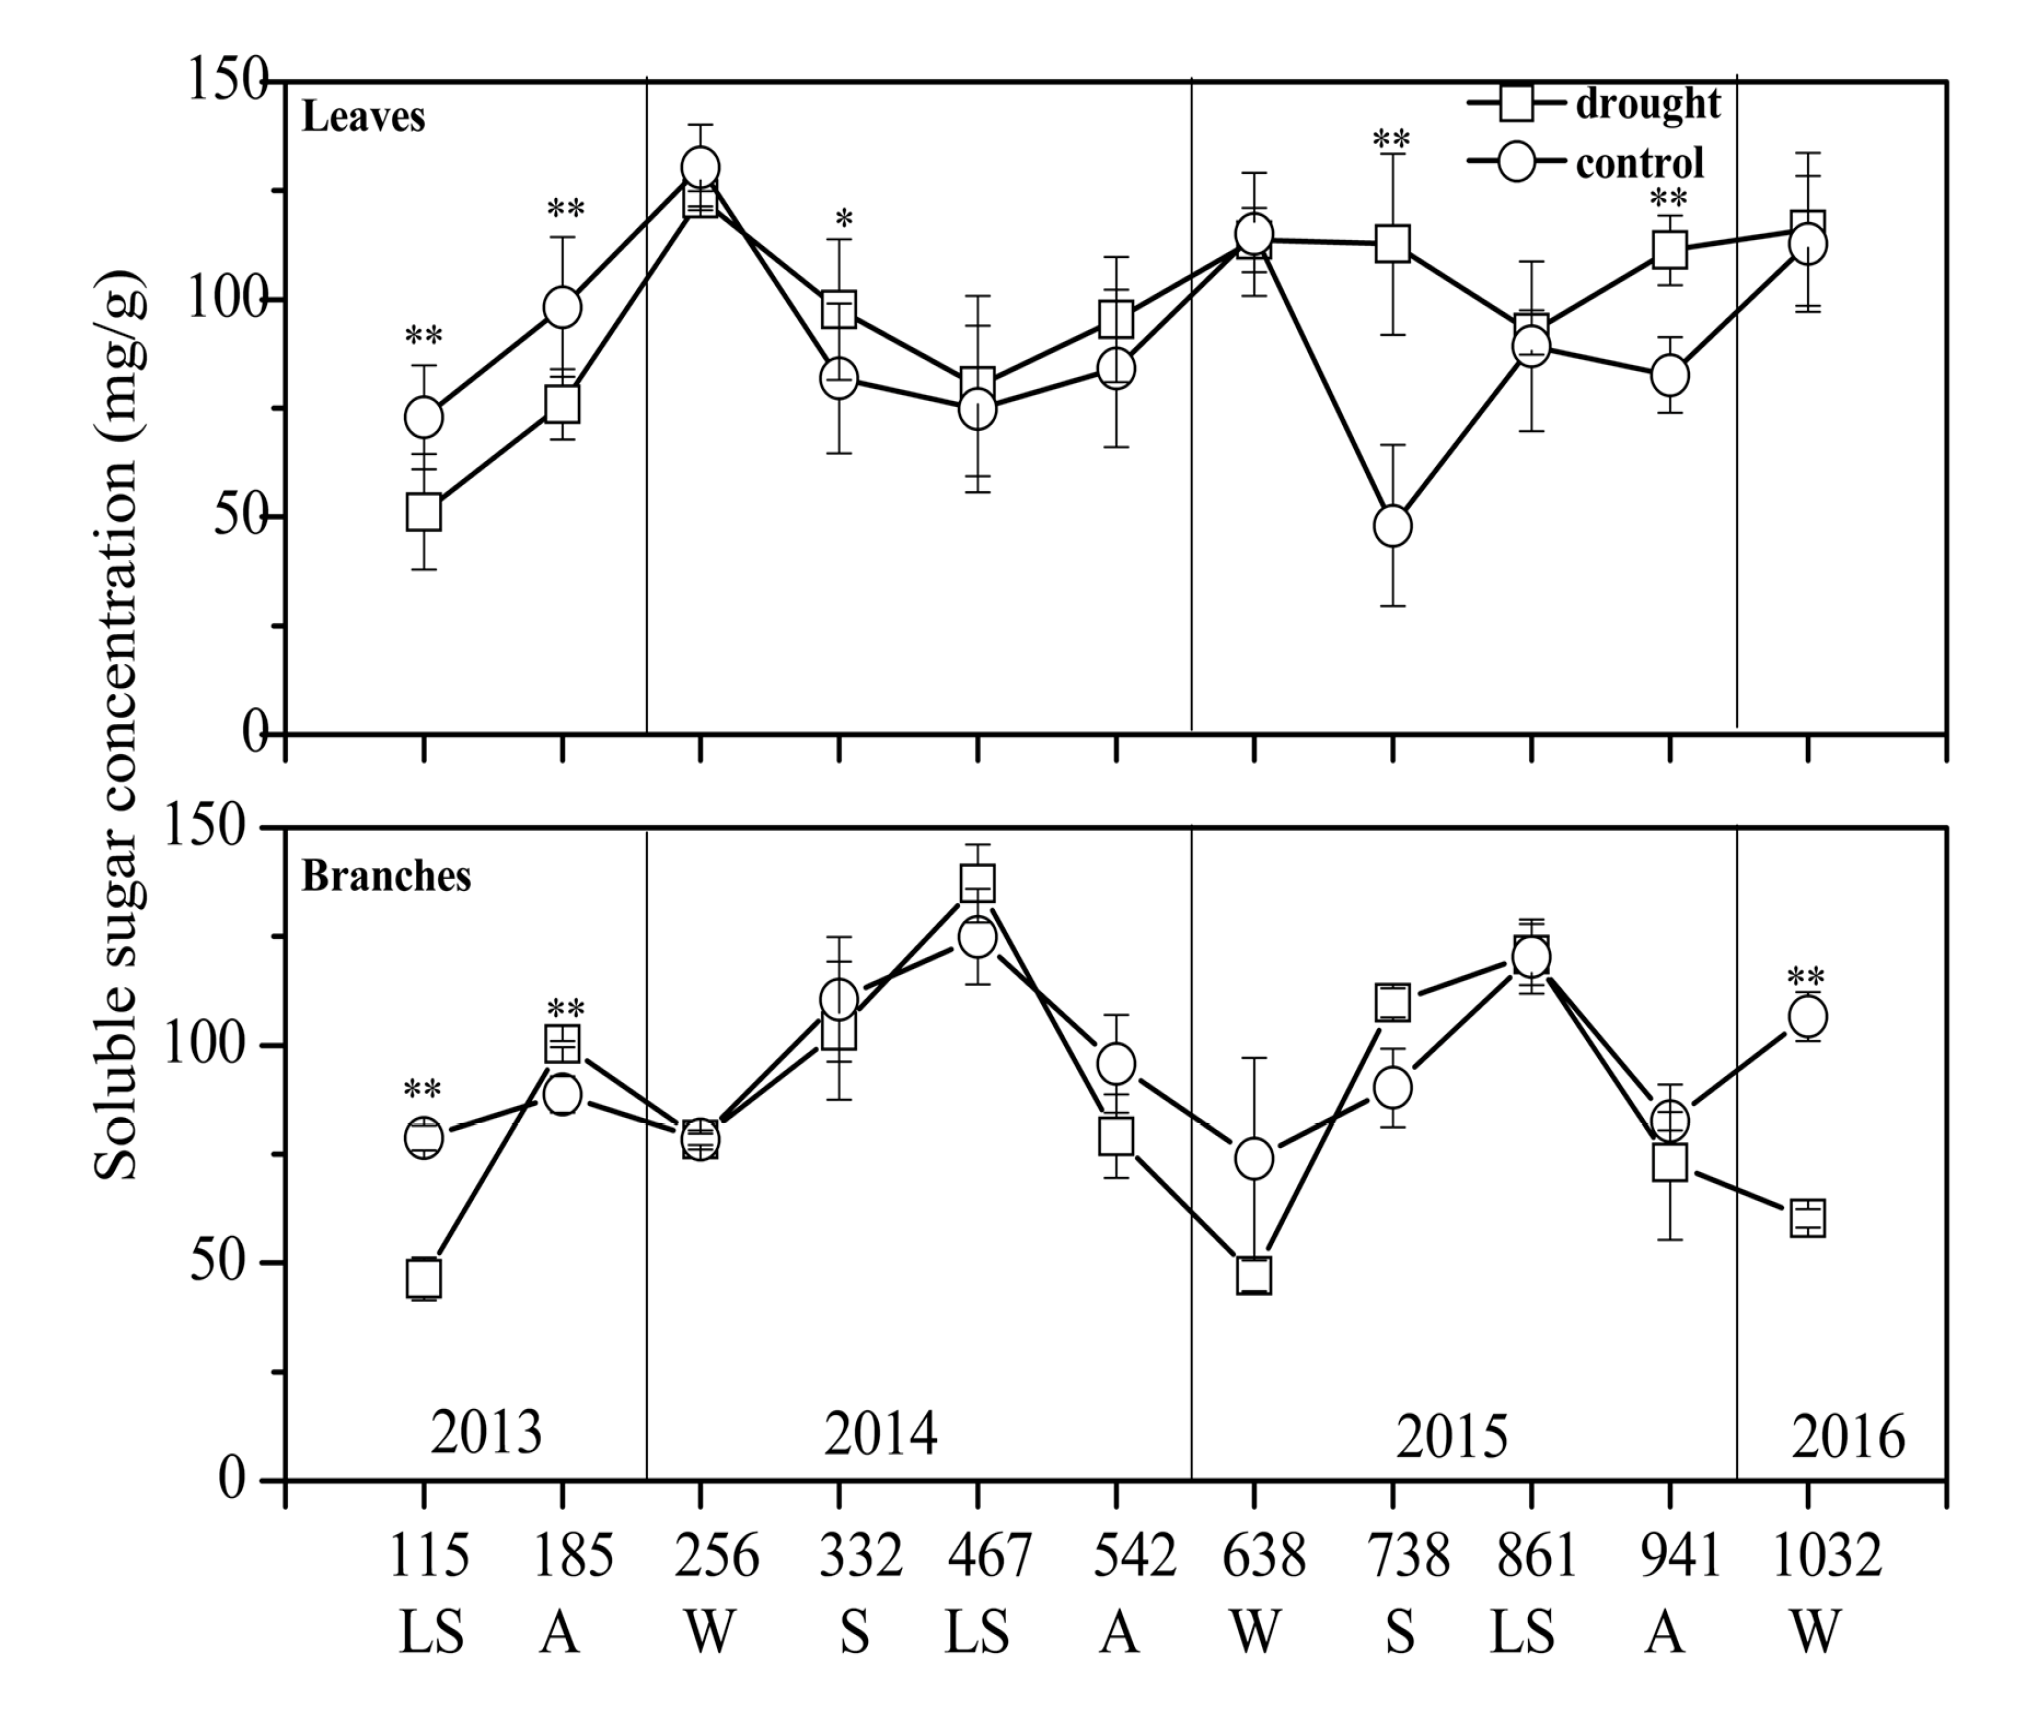
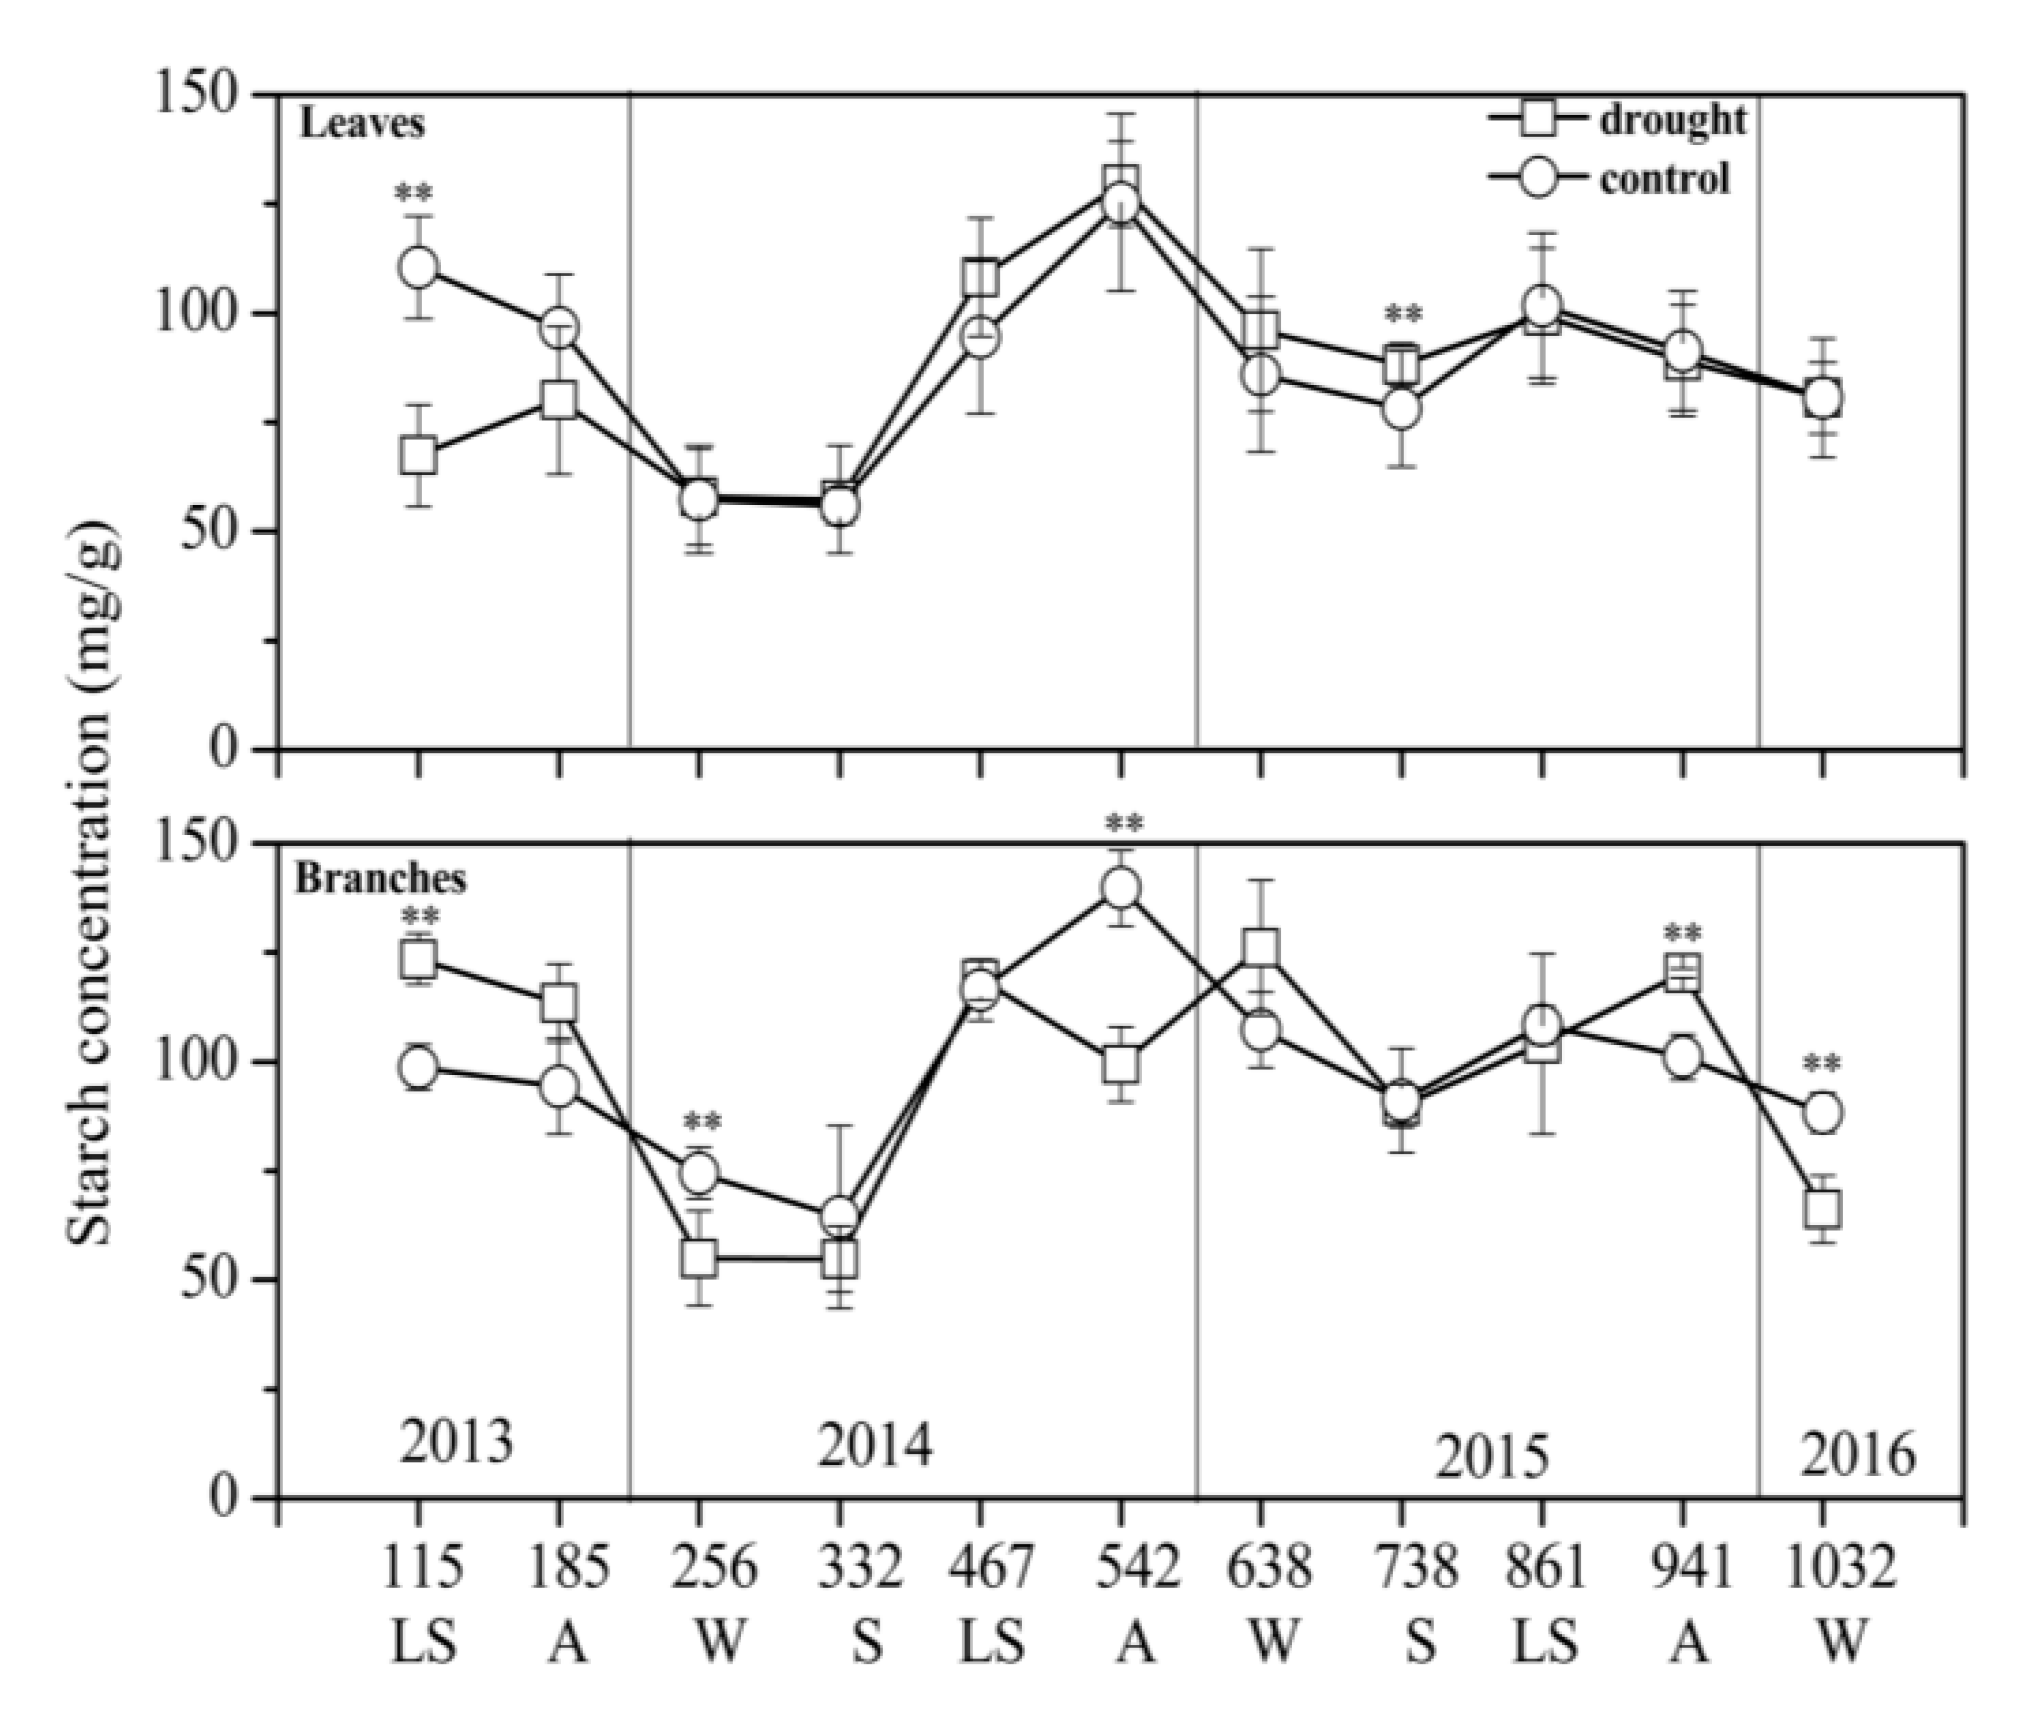
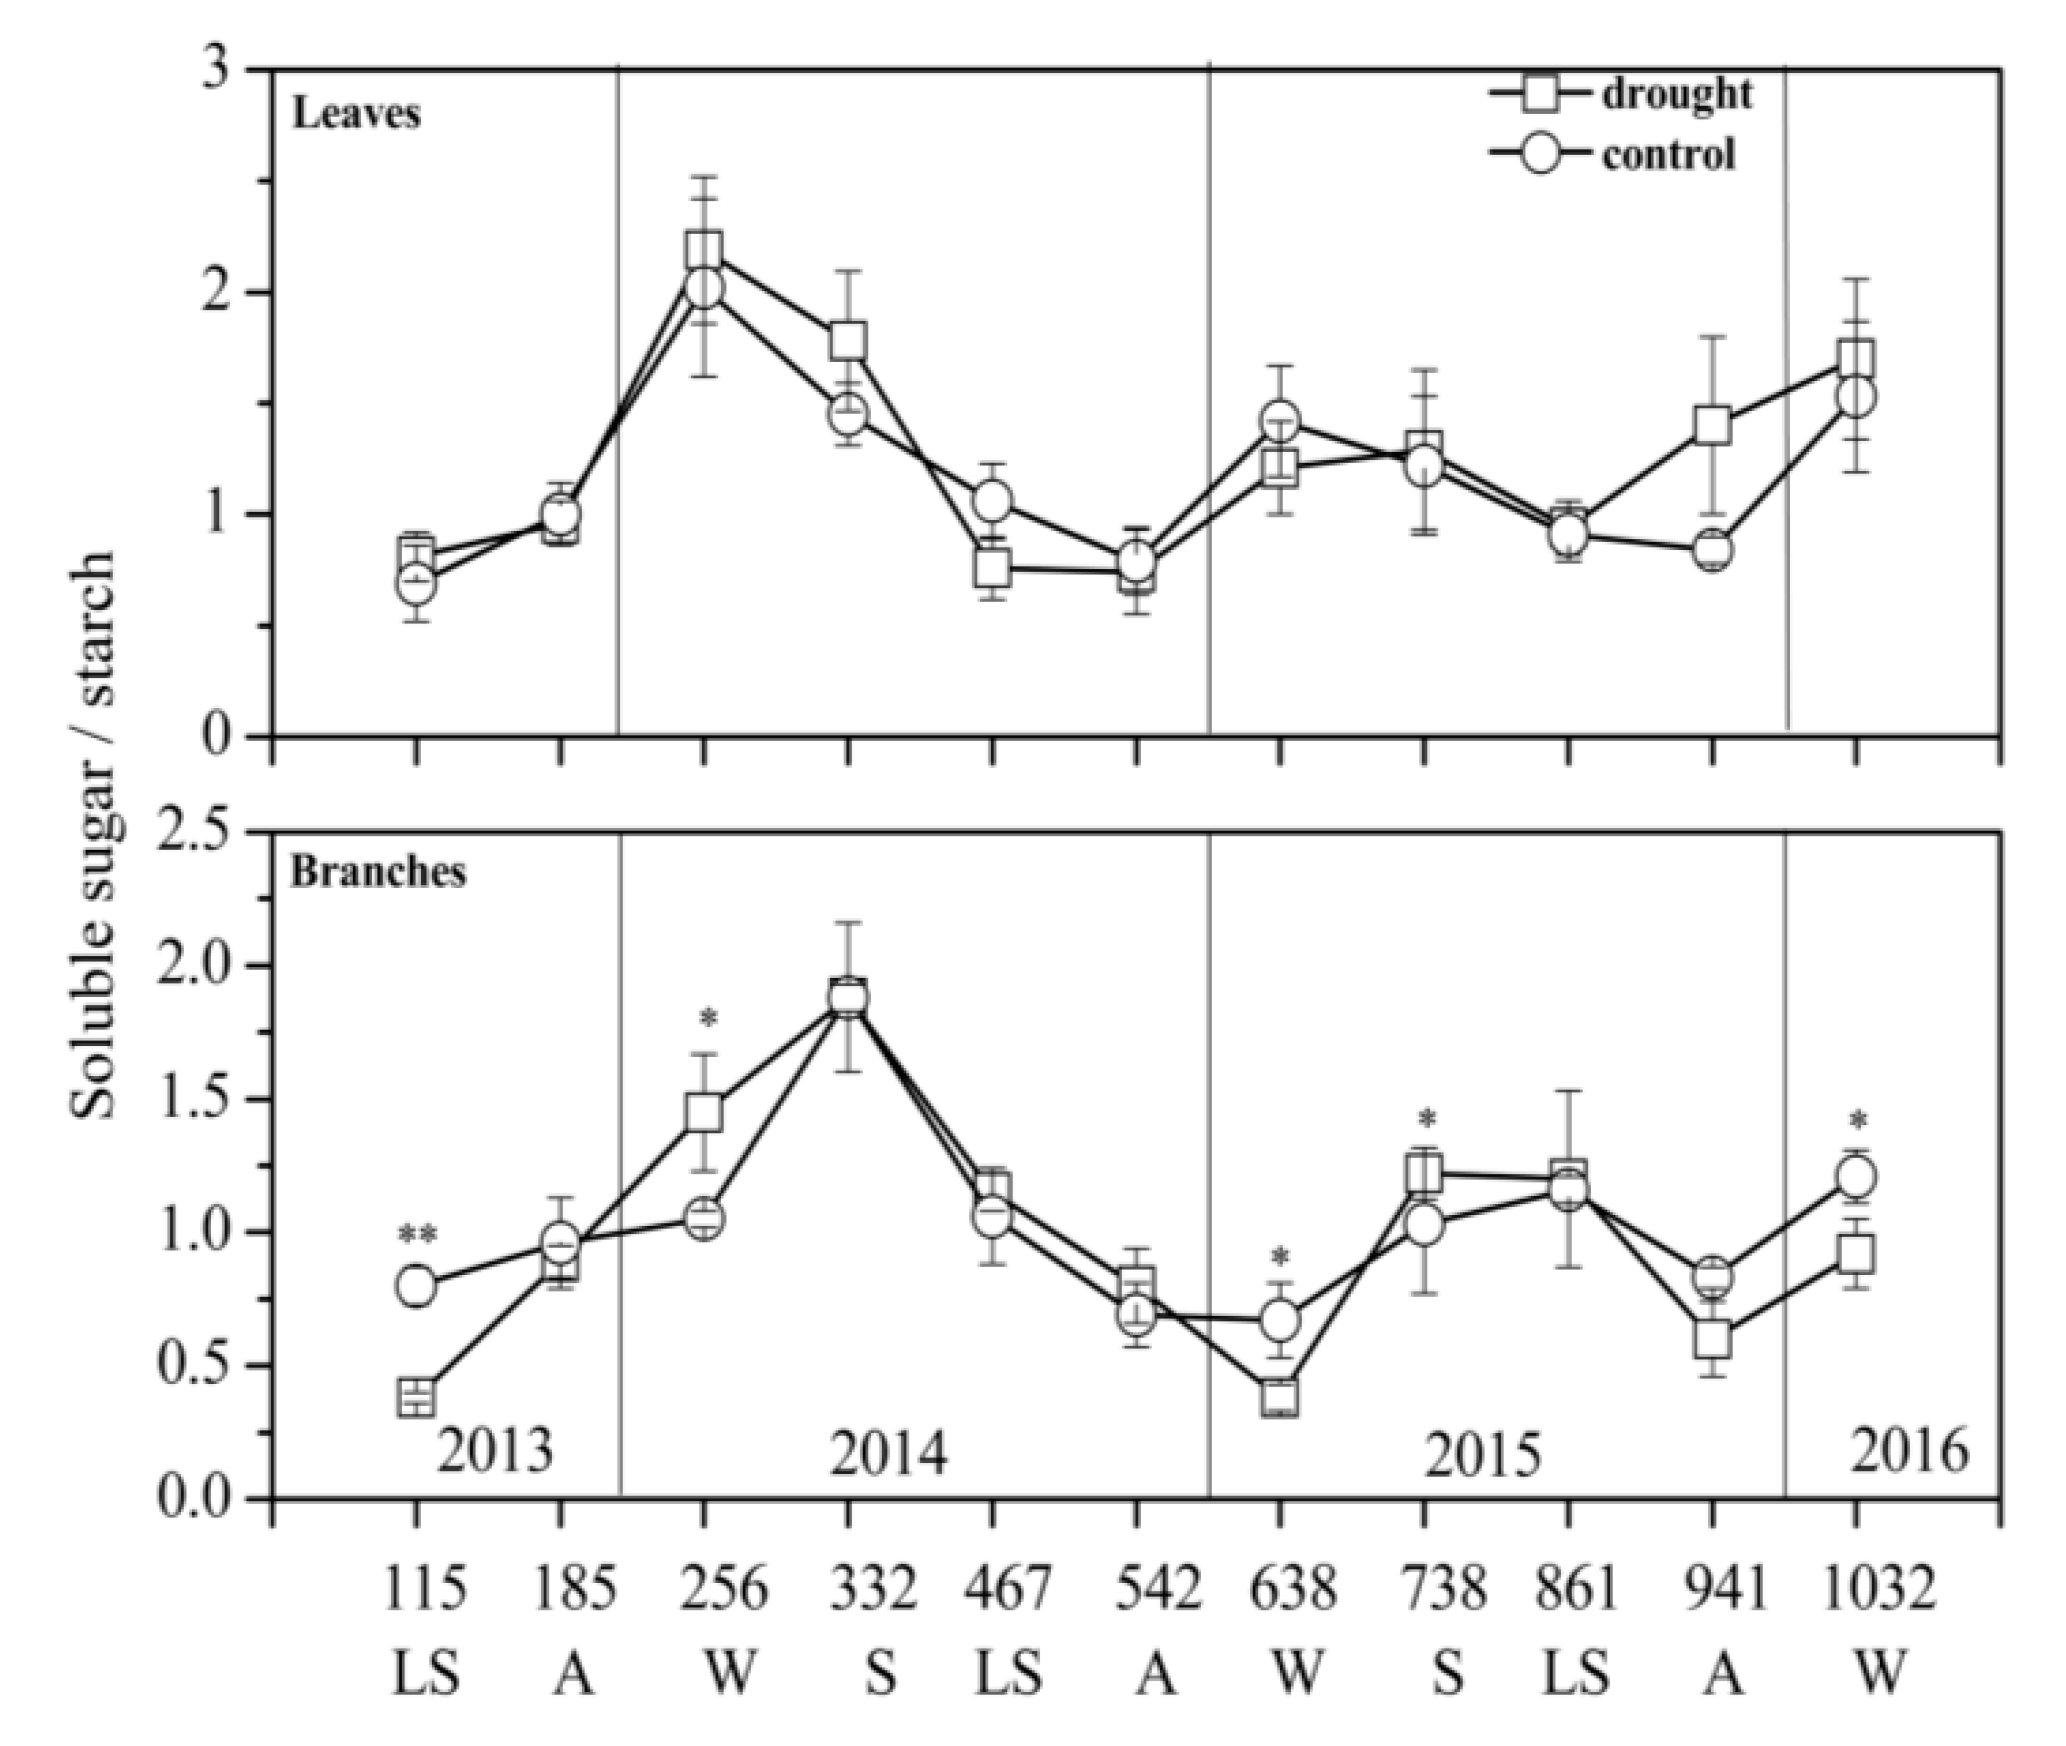
3.2. NSC Concentration and Composition in Different Treatments

Between treatments, the mean NSC concentration in the leaves in the drought group (183.91 mg/g) was somewhat higher than the control group (178.87 mg/g). The mean NSC concentration in the branches in the drought group (184.32 mg/g) was slightly lower than the control group (194.11 mg/g). No significant differences were found between the control and drought groups for either tissue type over the course of the study period. However, different treatments had different NSC dynamics: in the control treatment, total leaf NSC concentration showed substantial seasonal variability from 2013 to 2016 (Figure 4). In both 2013 and 2014 from spring through autumn, a gradual upward trend in total leaf NSC concentration was observed. The peak leaf NSC concentration value was observed on days 185 (27 October 2013, autumn) and 542 (15 October 2014, autumn) (Figure 4). The peak leaf NSC concentration in 2015 was observed in summer, and the seasonal dynamics differed from 2013 and 2014 (Figure 4). In the drought group, total leaf NSC concentration increased significantly in the early stages (days 115–542) (p < 0.05), then decreased in the late stages (days 542–1032) of the experimental period (Figure 4).
As for the branches, the control group also showed seasonal dynamics, with an annual peak in summer or autumn, and a valley in spring or winter. The branch NSC concentration dynamics of different treatments across three years differed from those of the leaves (Figure 4). From day 115 to day 467, the branches of the drought group displayed the same trend as the control group. From day 467 to day 542, NSC concentration decreased significantly (p < 0.05; Figure 4), then generally increased after declining in the drought group.
The effects of drought, sampling time, and their interaction on the soluble sugar concentration, starch concentration, NSC concentration, and the ratio of soluble sugar to starch were obvious (Table 1). The average concentration of soluble sugar in the leaves was 97.21 mg/g in the drought group and 89.98 mg/g in the control group, which is an increase of about 8.02%. Soluble sugar concentration in the leaves of the drought group was significantly lower than in the control group in the early stages of rainfall exclusion (p < 0.05; days 115–256). The gradual upward trend in the soluble sugar concentration of the drought group between days 256 and 1032 was greater than observed in the control group (Figure 5). However, the average leaf starch concentration decreased by 2.46% in the drought group compared to the control group (Figure 6). Leaf starch concentration in the drought group showed a trend of increasing first, then decreasing rapidly (Figure 6). The ratio of soluble sugar to starch in the drought group increased significantly with the increase in isolation time (p < 0.05; Figure 7), which had significant seasonal dynamics in the control group (p < 0.05; Figure 7). The effect of season on branch starch in the control group was not significant, but treatment effects were significant for soluble sugar concentration (p < 0.01; Figure 5 and Figure 6; Table 1).

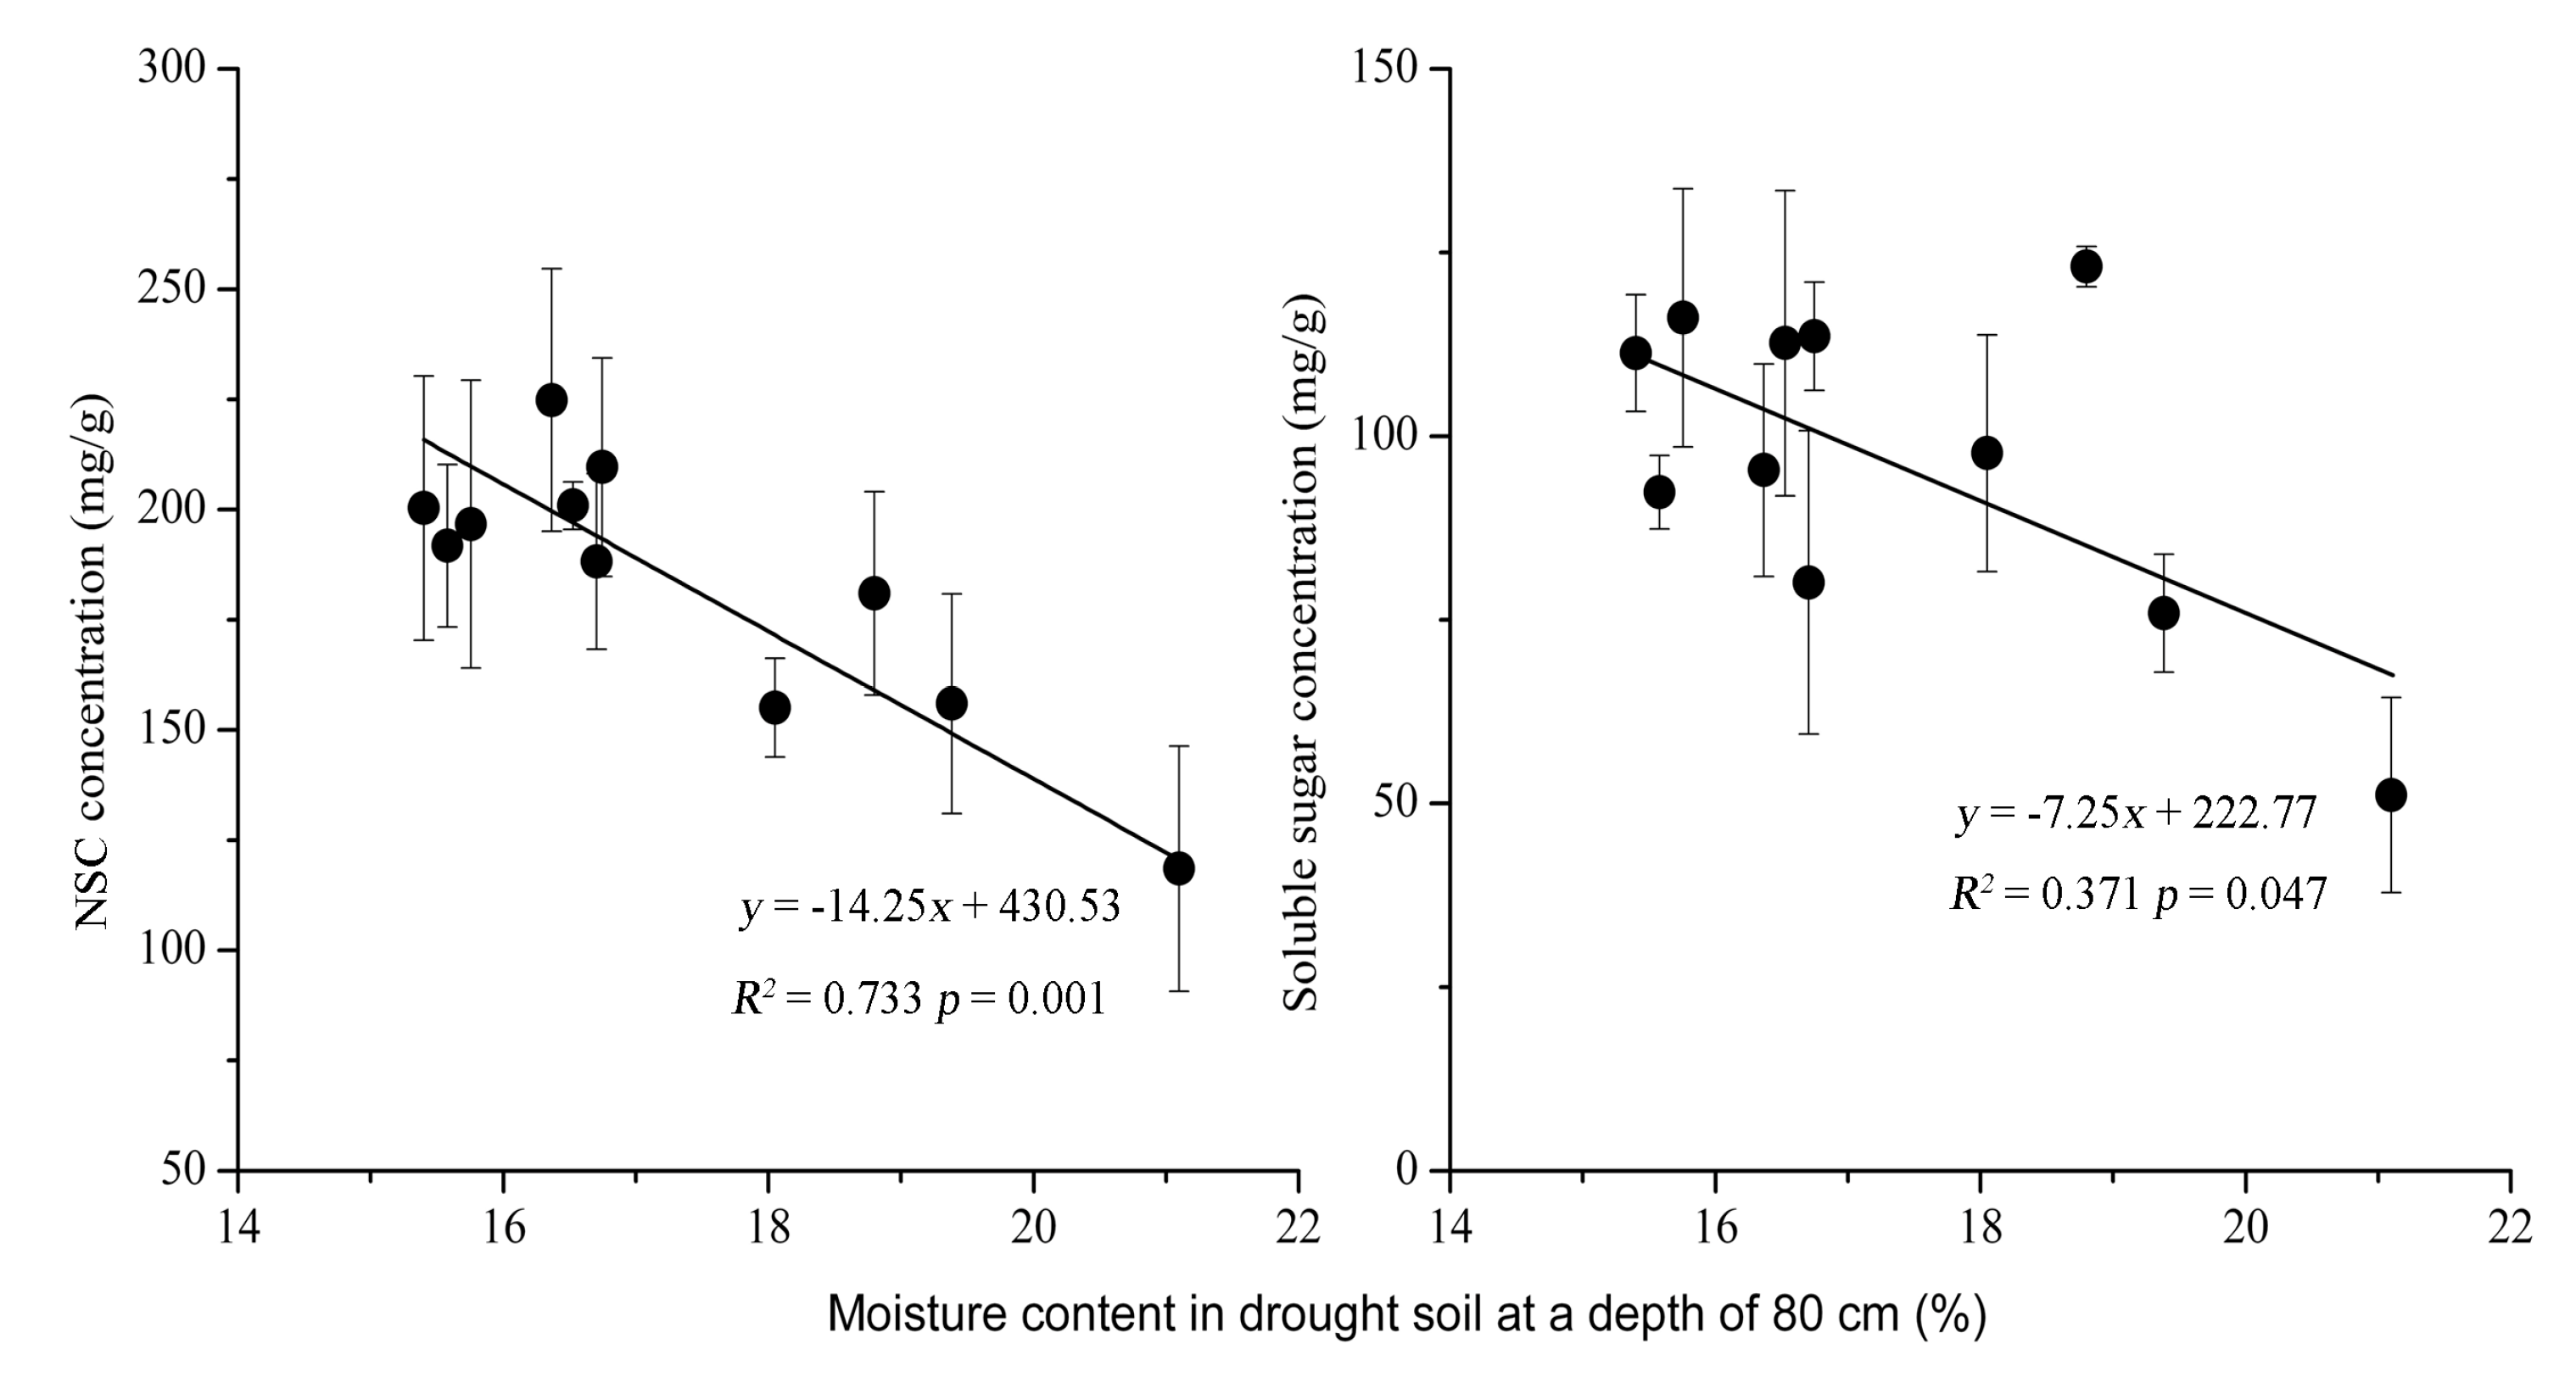
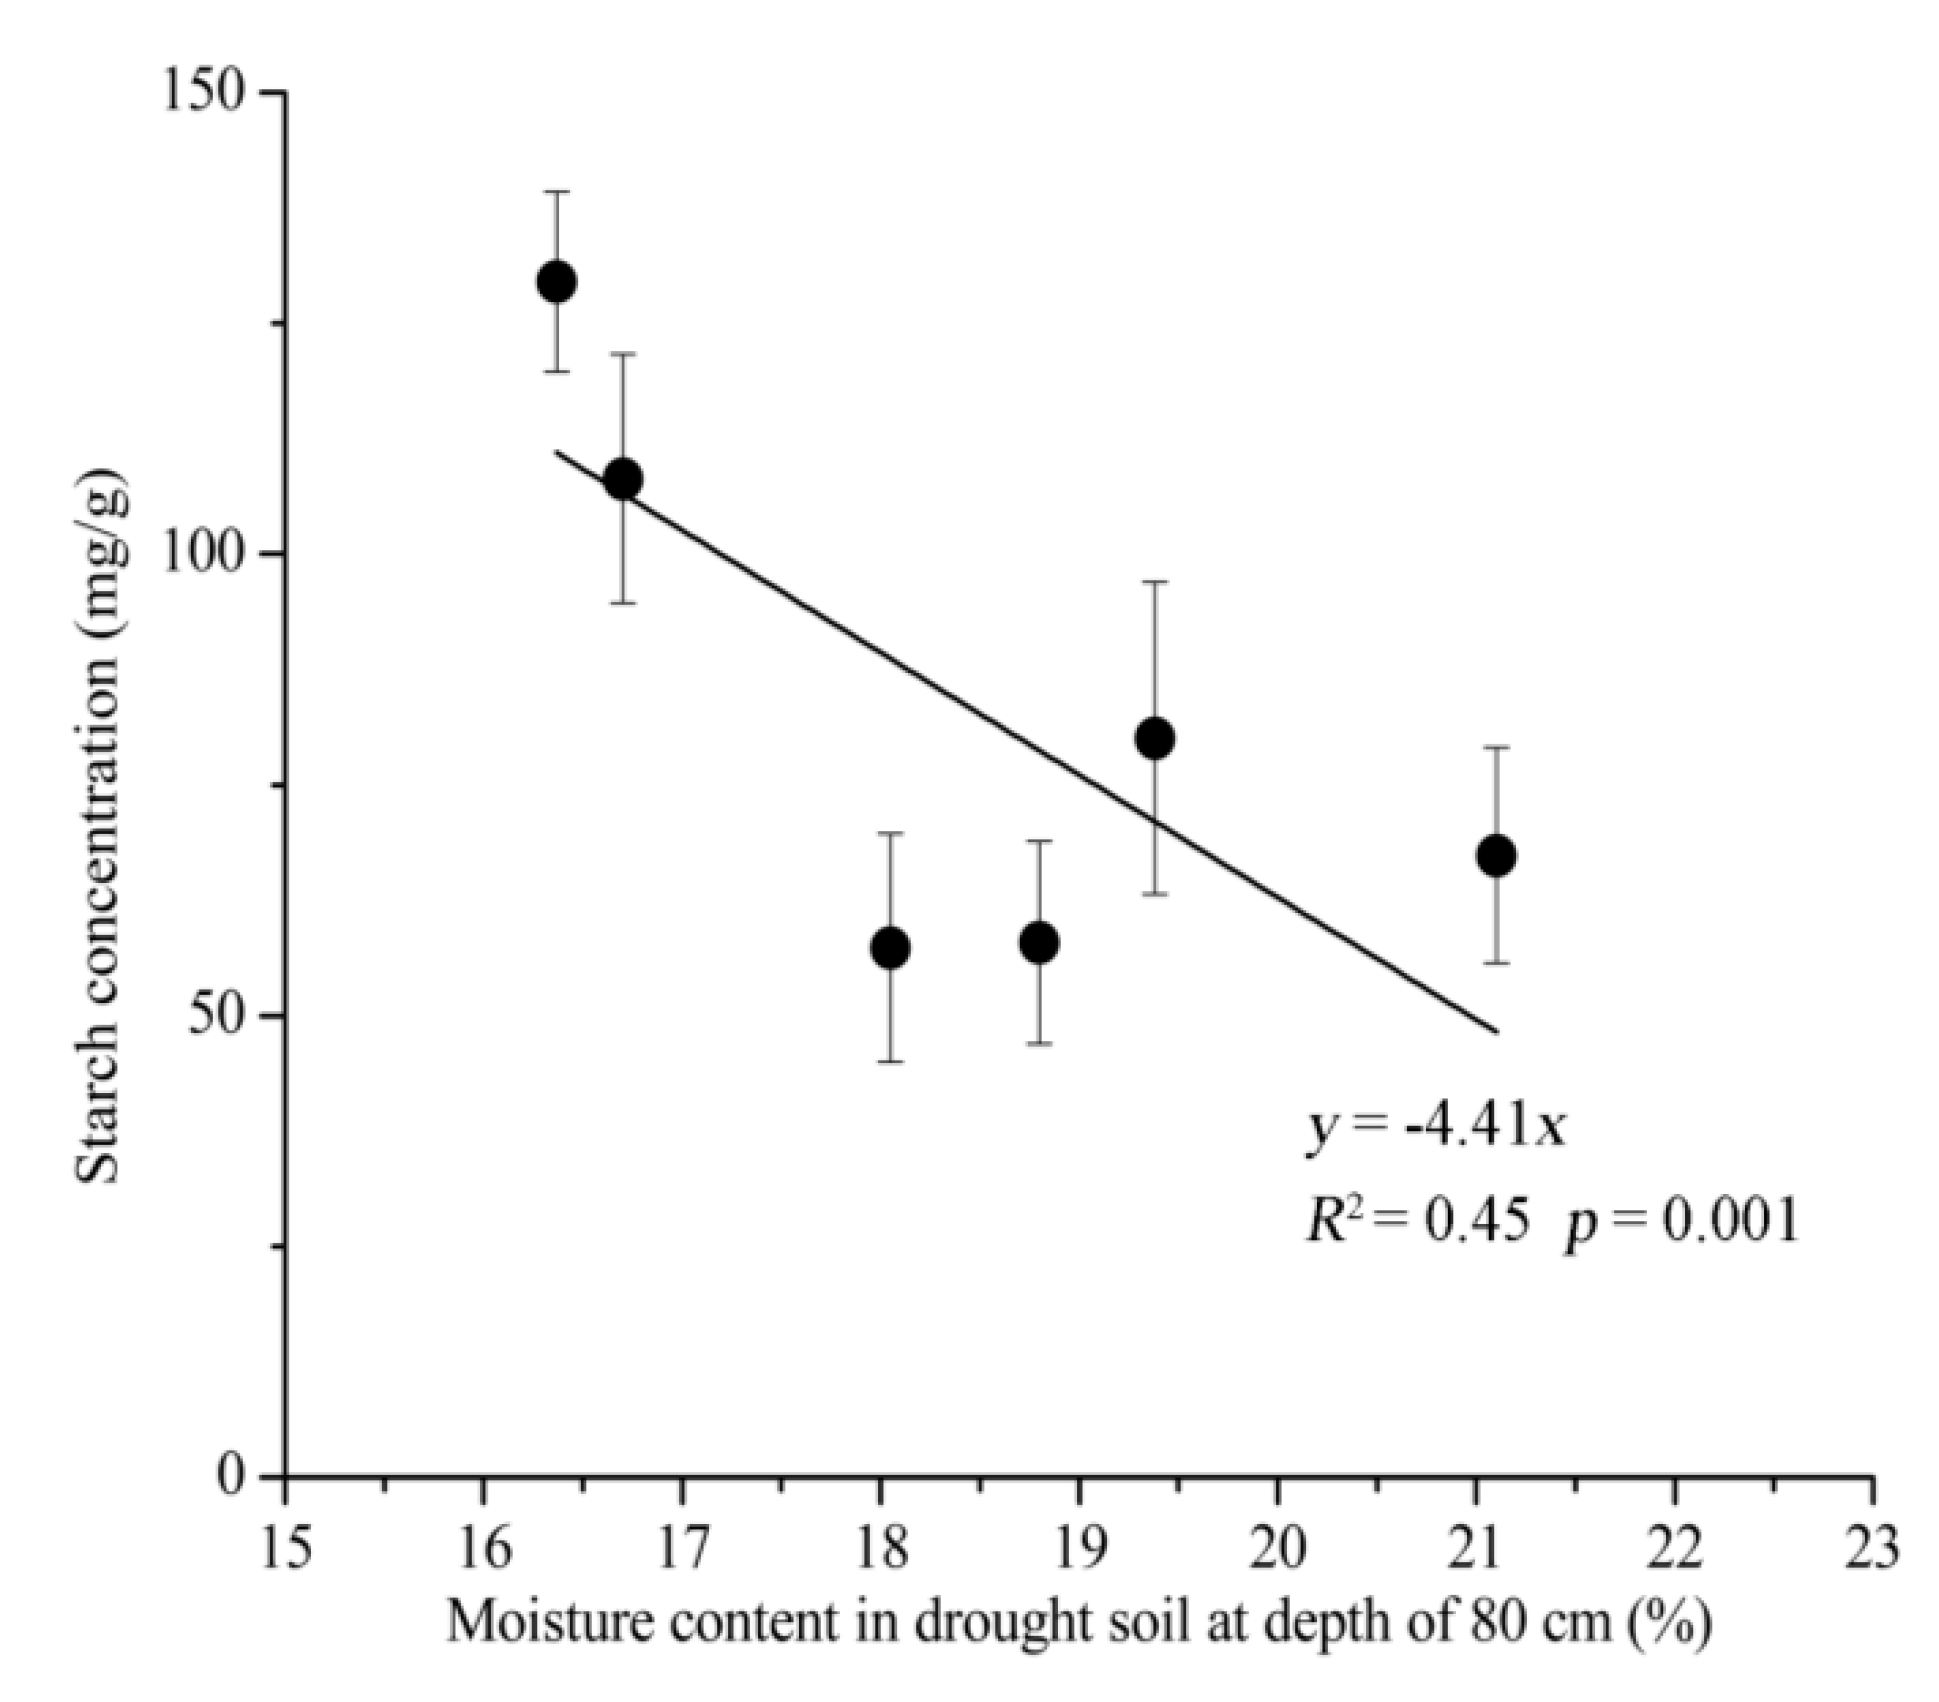
3.3. Relationship between NSC and Soil Moisture Content

In this study, negative linear correlations were found between deep soil (80 cm) moisture content and leaf NSC concentrations, and soluble sugar concentration in the drought treatment, respectively (p < 0.05; Figure 8). Leaf starch concentrations from days 115–542 showed negative linear correlations with deep soil (80 cm) (p < 0.05; Figure 9). While leaf starch concentration from days 638–1032 showed positive linear correlations with deep soil (80 cm) moisture content, the relationships were not significant, which is different from leaf starch concentration for days 115–1032.

4. Discussion

4.1. Drought Effect on NSC Concentration

NSCs are considered one of the most critical aspects for tree survival under drought conditions [44]. Our study analyzed the time dynamics of NSCs in P. massoniana leaves and branches over a 3-year period, comparing six trees subjected to a drought treatment with six control trees. We found a common phenomenon: mild drought did not significantly alter carbon allocation to leaf and branch NSCs. Mild drought stress may lead to a slowdown in growth before any effects are observed on a carbohydrate level [31,33]. An important result of this drought simulation on leaf NSC dynamics was that NSC concentration significantly increased 89.73% in the early stages of drought (days 115–542) and decreased 14.7% in the late stages (days 542–1032), which was consistent with the conclusions provided by McDowell [26]. The reasons for this phenomenon are that in the early stages of drought stress, cellular turgidity restricted plant growth before photosynthesis decreased [45], and an imbalance in carbohydrate supply and demand caused an NSC surplus [27,28]. With continued drought and having a higher sensitivity to drought, photosynthesis decreased prior to respiration and carbohydrates produced by photosynthesis could no longer meet the normal physiological metabolic demands of trees, resulting in the consumption of stored NSCs [11,26,46].
From days 115 to 467, the P. massoniana in-branch NSC concentration in the drought treatment was similar to the control group, which decreased significantly. Compared with leaves, the NSC difference between treatments was observed from the beginning of the experiment, and the branches demonstrated a time lag phenomenon. This phenomenon suggests a reduced sensitivity of the branches to drought compared to leaves [47]. Branches may represent a carbon pool, promoting plant survival in a stressed environment.
When analyzing the leaf NSC seasonal dynamics, we found that phenology influenced NSCs, as indicated by the seasonal patterns of the control treatment [48]. The leaf NSC concentration in the control treatment gradually increased during the growing season, peaking when soil moisture content was lowest. This trend aligns with the standard conceptual model for NSCs, which states that the pool was depleted when demand exceeded supply and increased when the supply exceeded demand [49]. We propose three aspects to explain these phenomena: (1) NSCs increased during the growing season because the production of photoassimilates exceeded metabolic and growth demand for carbon; (2) carbohydrates draw down during the dormant season, when photosynthesis decreases and reserves are used to provide the energy required for normal metabolism [23,27]; and (3) during the growing season when water is deficient, the secondary metabolic processes that synthesize structural material were weakened and NSCs increased, resulting in peak NSC concentration during the dry season [36,50,51]. In terms of branches, the control group demonstrated a seasonal trend, but the consistency was not as obvious as for the leaves. Our sampling of leaf and branch NSCs provided an incomplete picture of the whole-tree NSC budget, but as the important tissues assimilating carbon, the leaves and branches could serve as an indicator of the NSC status of the entire tree.

4.2. Sugar Transfer and Transformation under Drought Stress

Transfer and transformation of NSCs in plants is an important adaptation mechanism to drought stress [24,52]. In our study, continued drought stress led to the increase in soluble sugar concentrations in leaves, and there was a significant negative linear correlation with soil moisture content. Many studies have agreed with this conclusion and stated that soluble sugar is an important aspect that helps adjust the osmotic potential of plant cells according to the available soil moisture [53]. The integrity of the conduit and a certain turgidity must be maintained to ensure the normal functioning of plant physiological processes under drought conditions [24]. When the soluble sugar concentration was low, starch was converted into sugar in order to resist stress [54]. However, a significant negative linear correlation between starch concentration and soil moisture content was observed from days 115–542, which is contrary to the results of many other studies [55,56,57]. Therefore, we further analyzed our results and found a positive linear correlation, although non-significant between days 638 and 1032. We have two reasons for analyzing this phenomenon: (1) In Chang Ting county, which is experiencing extensive soil erosion and is considered a severely degraded ecosystem, P. massoniana was a pioneer species for regional reforestation in the region. After nearly 25 years of cultivation, a unique ecological adaptation mechanism has developed: at the beginning of the mild drought, plant growth slows down, but the water retention in leaves can still maintain normal photosynthesis. Leaves act as carbon sources by assimilating carbon, and a normal metabolism is maintained, then many of the remaining carbohydrates are stored to resist stress enhancement at a later time. Owing to this, P. massoniana could maintain normal functioning [55,56,57] in the later period by decomposing starch to increase soluble sugar and the concentration of osmotic substances. (2) In the period between days 638 and 1032, the decrease of starch content was not significant. This may have occurred because this experimental period was during a mid-term drought, and as the isolation time increased, the decrease in starch became significant. However, up to now, the mid-term and long-term responses of stored NSC reserves to drought remained unclear.
Soluble sugar was not only used to resist stress, but also to adapt to changes influenced by seasonality. Analysis of the ratio of soluble sugar to starch in leaves and branches between different treatments showed that seasons affected the NSC storage dynamics. The ratio for P. massoniana leaves was similar to that reported for evergreen plants in China [58]. From summer to autumn, more starch was accumulated and converted into soluble sugar in winter and early spring to compensate for the loss of carbon due to decreasing photosynthetic capacity. However, few studies have been conducted on the branches; the ratio of soluble sugar to starch of branches was lower than found for Larix gmelinii [47]. Because of differences in terms of the length of the studies, no comparable data was available.

5. Conclusions

Drought events were associated a minimal NSC concentration change, potentially affecting the capacity of individuals to recover during mid-term mild drought [37]. In the sampled adult trees, a phenomenon where starch was transferred to soluble sugar to cope with drought stress was observed. During the drought process, leaves were the first to react, followed by branches, which showed a time lag effect. Our results highlight the importance of mid-term experiments to fully understand drought response, as our results differed from short-term studies [59]. Future global climate changes will directly affect NSC concentrations in plants, which in turn will affect physiological and biochemical processes [35,60]. Therefore, a better understanding of the controls and mechanisms of drought resistance is crucial for accurate predictions and mitigation strategies.

Author Contributions

T.L., H.Z. and J.Z. designed the experiment; T.L. and H.Z. carried out the field experiment; T.L. and J.W. performed the experiments in the lab; T.L. analyzed data; T.L. wrote the manuscript. T.L., Z.H. and J.W. revised and improved the manuscript.

Acknowledgments

This work was supported by National Natural Science Foundation of China (General Program: 31270659, 31200460) and the Natural Science Foundation of Fujian Province of China (Grant NO. 2016J01142). We thank Xiao-hui Zhong for her assistance in the field and lab. Then, we would also like to thank Alison Beamish at the University of British Columbia for her assistance with English language and grammatical editing of the manuscript.

Conflicts of Interest

The authors declare no conflict of interest.

References

  1. Hartmann, H.; Ziegler, W.; Trumbore, S.; Knapp, A. Lethal drought leads to reduction in nonstructural carbohydrates in Norway spruce tree roots but not in the canopy. Funct. Ecol. 2013, 27, 413–427. [Google Scholar] [CrossRef] [Green Version]
  2. Choat, B.; Jansen, S.; Brodribb, T.J.; Cochard, H.; Delzon, S.; Bhaskar, R.; Bucci, S.J.; Feild, T.S.; Gleason, S.M.; Hacke, U.G.; et al. Global convergence in the vulnerability of forests to drought. Nature 2012, 491, 752–755. [Google Scholar] [CrossRef] [PubMed] [Green Version]
  3. Malone, S. Monitoring Changes in Water Use Efficiency to Understand Drought Induced Tree Mortality. Forests 2017, 8, 365. [Google Scholar] [CrossRef]
  4. Peng, C.; Ma, Z.; Lei, X.; Zhu, Q.; Chen, H.; Wang, W.; Liu, S.; Li, W.; Fang, X.; Zhou, X. A drought-induced pervasive increase in tree mortality across Canada’s boreal forests. Nat. Clim. Chang. 2011, 1, 467–471. [Google Scholar] [CrossRef]
  5. Allen, C.D.; Macalady, A.K.; Chenchouni, H.; Bachelet, D.; McDowell, N.; Vennetier, M.; Kitzberger, T.; Rigling, A.; Breshears, D.D.; Hogg, E.H.; et al. A global overview of drought and heat-induced tree mortality reveals emerging climate change risks for forests. For. Ecol. Manag. 2010, 259, 660–684. [Google Scholar] [CrossRef]
  6. Breshears, D.D.; Allen, C.D. The importance of rapid, disturbance-induced losses in carbon management and sequestration. Glob. Ecol. Biogeogr. 2002, 11, 1–5. [Google Scholar] [CrossRef]
  7. Kuptz, D.; Fleischmann, F.; Matyssek, R.; Grams, T.E.E. Seasonal patterns of carbon allocation to respiratory pools in 60-yr-old deciduous (Fagus sylvatica) and evergreen (Picea abies) trees assessed via whole-tree stable carbon isotope labeling. New Phytol. 2011, 191, 160–172. [Google Scholar] [CrossRef] [PubMed]
  8. Anderegg, W.R.L.; Kane, J.M.; Anderegg, L.D.L. Consequences of widespread tree mortality triggered by drought and temperature stress. Nat. Clim. Chang. 2012, 3, 30–36. [Google Scholar] [CrossRef]
  9. Anderegg, W.R.L.; Anderegg, L.D.L. Hydraulic and carbohydrate changes in experimental drought-induced mortality of saplings in two conifer species. Tree Physiol. 2013, 33, 252–260. [Google Scholar] [CrossRef] [PubMed] [Green Version]
  10. Sloan, J.L.; Jacobs, D.F. Leaf physiology and sugar concentrations of transplanted Quercus rubra seedlings in relation to nutrient and water availability. New For. 2012, 43, 779–790. [Google Scholar] [CrossRef]
  11. Sevanto, S.; McDowell, N.G.; Dickman, L.T.; Pangle, R.; Pockman, W.T. How do trees die? A test of the hydraulic failure and carbon starvation hypotheses. Plant Cell Environ. 2014, 37, 153–161. [Google Scholar] [CrossRef] [PubMed]
  12. McDowell, N.G.; Ryan, M.G.; Zeppel, M.J.B.; Tissue, D.T. Feature: Improving our knowledge of drought-induced forest mortality through experiments, observations, and modeling. New Phytol. 2013, 200, 289–293. [Google Scholar] [CrossRef] [PubMed] [Green Version]
  13. Dai, G.; Yang, J.; Huang, C.; Sun, C.; Jia, L.; Ma, L. The Effects of Climate Change on the Development of Tree Plantations for Biodiesel Production in China. Forests 2017, 8, 207. [Google Scholar] [CrossRef]
  14. McDowell, N.; Pockman, W.T.; Allen, C.D.; Breshears, D.D.; Cobb, N.; Kolb, T.; Plaut, J.; Sperry, J.; West, A.; Williams, D.G.; et al. Mechanisms of plant survival and mortality during drought: Why do some plants survive while others succumb to drought? New Phytol. 2008, 178, 719–739. [Google Scholar] [CrossRef] [PubMed]
  15. Sperry, J.S. Hydraulic constraints on plant gas exchange. Agric. For. Meteorol. 2000, 104, 13–23. [Google Scholar] [CrossRef]
  16. Adams, H.D.; Guardiola-Claramonte, M.; Barron-Gafford, G.A.; Villegas, J.C.; Breshears, D.D.; Zou, C.B.; Troch, P.A.; Huxman, T.E. Temperature sensitivity of drought-induced tree mortality portends increased regional die-off under global-change-type drought. Proc. Natl. Acad. Sci. USA 2009, 106, 7063–7066. [Google Scholar] [CrossRef] [PubMed] [Green Version]
  17. Mitchell, P.J.; O’Grady, A.P.; Tissue, D.T.; White, D.A.; Ottenschlaeger, M.L.; Pinkard, E.A. Drought response strategies define the relative contributions of hydraulic dysfunction and carbohydrate depletion during tree mortality. New Phytol. 2013, 197, 862–872. [Google Scholar] [CrossRef] [PubMed]
  18. Nardini, A.; Battistuzzo, M.; Savi, T. Shoot desiccation and hydraulic failure in temperate woody angiosperms during an extreme summer drought. New Phytol. 2013, 200, 322–329. [Google Scholar] [CrossRef] [PubMed] [Green Version]
  19. Galvez, D.A.; Landhäusser, S.M.; Tyree, M.T. Low root reserve accumulation during drought may lead to winter mortality in poplar seedlings. New Phytol. 2013, 198, 139–148. [Google Scholar] [CrossRef] [PubMed] [Green Version]
  20. Piper, F.I. Drought induces opposite changes in the concentration of non-structural carbohydrates of two evergreen Nothofagus species of differential drought resistance. Ann. For. Sci. 2011, 68, 415–424. [Google Scholar] [CrossRef]
  21. Galiano, L.; Martínez-Vilalta, J.; Lloret, F. Carbon reserves and canopy defoliation determine the recovery of Scots pine 4 yr after a drought episode. New Phytol. 2011, 190, 750–759. [Google Scholar] [CrossRef] [PubMed] [Green Version]
  22. Adams, H.D.; Zeppel, M.J.; Anderegg, W.R.; Hartmann, H.; Landhäusser, S.M.; Tissue, D.T.; Huxman, T.E.; Hudson, P.J.; Franz, T.E.; Allen, C.D.; et al. A multi-species synthesis of physiological mechanisms in drought-induced tree mortality. Nat. Ecol. Evol. 2017, 1, 1285–1291. [Google Scholar] [CrossRef] [PubMed] [Green Version]
  23. Chapin, F.S.; Schulze, E.; Mooney, H.A. The Ecology and Economics of Storage in Plants. Annu. Rev. Ecol. Syst. 1990, 21, 423–447. [Google Scholar] [CrossRef]
  24. Sala, A.; Woodruff, D.R.; Meinzer, F.C. Carbon dynamics in trees: Feast or famine? Tree Physiol. 2012, 32, 764–775. [Google Scholar] [CrossRef] [PubMed]
  25. Sala, A.; Piper, F.; Hoch, G. Physiological mechanisms of drought-induced tree mortality are far from being resolved. New Phytol. 2010, 186, 274–281. [Google Scholar] [CrossRef] [PubMed] [Green Version]
  26. McDowell, N.G.; Beerling, D.J.; Breshears, D.D.; Fisher, R.A.; Raffa, K.F.; Stitt, M. The interdependence of mechanisms underlying climate-driven vegetation mortality. Trends Ecol. Evol. 2011, 26, 523–532. [Google Scholar] [CrossRef] [PubMed]
  27. Korner, C. Carbon limitation in trees. J. Ecol. 2003, 91, 4–17. [Google Scholar] [CrossRef] [Green Version]
  28. Ayub, G.; Smith, R.A.; Tissue, D.T.; Atkin, O.K. Impacts of drought on leaf respiration in darkness and light in Eucalyptus saligna exposed to industrial-age atmospheric CO2 and growth temperature. New Phytol. 2011, 190, 1003–1018. [Google Scholar] [CrossRef] [PubMed]
  29. McCree, K.J.; Kallsen, C.E.; Richardson, S.G. Carbon Balance of Sorghum Plants during Osmotic Adjustment to Water Stress. Plant Physiol. 1984, 76, 898–902. [Google Scholar] [CrossRef] [PubMed] [Green Version]
  30. McDowell, N.G. Mechanisms Linking Drought, Hydraulics, Carbon Metabolism, and Vegetation Mortality. Plant Physiol. 2011, 155, 1051–1059. [Google Scholar] [CrossRef] [PubMed] [Green Version]
  31. Millard, P.; Sommerkorn, M.; Grelet, G.-A. Environmental change and carbon limitation in trees: A biochemical, ecophysiological and ecosystem appraisal. New Phytol. 2007, 175, 11–28. [Google Scholar] [CrossRef] [PubMed]
  32. Regier, N.; Streb, S.; Cocozza, C.; Schaub, M.; Cherubini, P.; Zeeman, S.C.; Frey, B. Drought tolerance of two black poplar (Populus nigra L.) clones: Contribution of carbohydrates and oxidative stress defence. Plant Cell Environ. 2009, 32, 1724–1736. [Google Scholar] [CrossRef] [PubMed]
  33. Woodruff, D.R.; Meinzer, F.C. Water stress, shoot growth and storage of non-structural carbohydrates along a tree height gradient in a tall conifer. Plant Cell Environ. 2011, 34, 1920–1930. [Google Scholar] [CrossRef] [PubMed] [Green Version]
  34. Quentin, A.G.; Pinkard, E.A.; Ryan, M.G.; Tissue, D.T.; Baggett, L.S.; Adams, H.D.; Maillard, P.; Marchand, J.; Landhäusser, S.M.; Lacointe, A.; et al. Non-structural carbohydrates in woody plants compared among laboratories. Tree Physiol. 2015, 35, 1146–1165. [Google Scholar] [CrossRef] [PubMed]
  35. Hoch, G.; Richter, A.; Korner, C. Non-structural carbon compounds in temperate forest trees. Plant Cell Environ. 2003, 26, 1067–1081. [Google Scholar] [CrossRef] [Green Version]
  36. Würth, M.K.R.; Peláez-Riedl, S.; Wright, S.J.; Körner, C. Non-structural carbohydrate pools in a tropical forest. Oecologia 2004, 143, 11–24. [Google Scholar] [CrossRef] [PubMed] [Green Version]
  37. Galiano, L.; Martinez-Vilalta, J.; Sabate, S.; Lloret, F. Determinants of drought effects on crown condition and their relationship with depletion of carbon reserves in a Mediterranean holm oak forest. Tree Physiol. 2012, 32, 478–489. [Google Scholar] [CrossRef] [PubMed]
  38. Lacointe, A.; Kajji, A.; Daudet, F.-A.; Archer, P.; Frossard, J.-S.; Saint-Joanis, B.; Vandame, M. Mobilization of carbon reserves in young walnut trees. Acta Bot. Gallica 1993, 140, 435–441. [Google Scholar] [CrossRef] [Green Version]
  39. Ryan, M.G. Tree responses to drought. Tree Physiol. 2011, 31, 237–239. [Google Scholar] [CrossRef] [PubMed] [Green Version]
  40. Dietze, M.C.; Sala, A.; Carbone, M.S.; Czimczik, C.I.; Mantooth, J.A.; Richardson, A.D.; Vargas, R. Nonstructural Carbon in Woody Plants. Annu. Rev. Plant Biol. 2014, 65, 667–687. [Google Scholar] [CrossRef] [PubMed] [Green Version]
  41. Boschetto, R.G.; Mohamed, R.M.; Arrigotti, J. Vulnerability to Desertification in a Sub-Saharan. Region: A First Local Assessment in Five Villages, of Southern Region of Malawi. Ital. J. Agron. 2010, 3, 91–101. [Google Scholar] [CrossRef]
  42. Yemm, E.W.; Willis, A.J. The estimation of carbohydrates in plant extracts by anthrone. Biochem. J. 1954, 57, 508–514. [Google Scholar] [CrossRef] [PubMed] [Green Version]
  43. Zhang, T.; Cao, Y.; Chen, Y.; Liu, G. Non-structural carbohydrate dynamics in Robinia pseudoacacia saplings under three levels of continuous drought stress. Trees 2015, 29, 1837–1849. [Google Scholar] [CrossRef]
  44. Rosas, T.; Galiano, L.; Ogaya, R.; Peñuelas, J.; Martínez-Vilalta, J. Dynamics of non-structural carbohydrates in three Mediterranean woody species following long-term experimental drought. Front. Plant Sci. 2013, 4, 400. [Google Scholar] [CrossRef] [PubMed]
  45. Bogeat-Triboulot, M.B.; Brosche, M.; Renaut, J.; Jouve, L.; Le Thiec, D.; Fayyaz, P.; Vinocur, B.; Witters, E.; Laukens, K.; Teichmann, T.; et al. Gradual Soil Water Depletion Results in Reversible Changes of Gene Expression, Protein Profiles, Ecophysiology, and Growth Performance in Populus euphratica, a Poplar Growing in Arid Regions. Plant Physiol. 2006, 143, 876–892. [Google Scholar] [CrossRef] [PubMed] [Green Version]
  46. Klein, T.; Rotenberg, E.; Cohen-Hilaleh, E.; Raz-Yaseef, N.; Tatarinov, F.; Preisler, Y.; Ogée, J.; Cohen, S.; Yakir, D. Quantifying transpirable soil water and its relations to tree water use dynamics in a water-limited pine forest. Ecohydrology 2014, 7, 409–419. [Google Scholar] [CrossRef]
  47. Du, Y.; Han, Y.; Wang, C.K. The influence of drought on non-structural carbohydrates in the needles and twigs of Larix gmelinii. Acta Ecol. Sin. 2014, 34, 6090–6099. (In Chinese) [Google Scholar]
  48. Martínez-Vilalta, J.; Sala, A.; Asensio, D.; Galiano, L.; Hoch, G.; Palacio, S.; Piper, F.I.; Lloret, F. Dynamics of non-structural carbohydrates in terrestrial plants: A global synthesis. Ecol. Monogr. 2016, 86, 495–516. [Google Scholar] [CrossRef]
  49. Richardson, A.D.; Carbone, M.S.; Keenan, T.F.; Czimczik, C.I.; Hollinger, D.Y.; Murakami, P.; Schaberg, P.G.; Xu, X. Seasonal dynamics and age of stemwood nonstructural carbohydrates in temperate forest trees. New Phytol. 2013, 197, 850–861. [Google Scholar] [CrossRef] [PubMed]
  50. Tissue, D.T.; Wright, S.J. Effect of Seasonal Water Availability on Phenology and the Annual Shoot Carbohydrate Cycle of Tropical Forest Shrubs. Funct. Ecol. 1995, 9, 518–527. [Google Scholar] [CrossRef]
  51. Latt, C.R.; Nair, P.K.R.; Kang, B.T. Reserve carbohydrate levels in the boles and structural roots of five multipurpose tree species in a seasonally dry tropical climate. For. Ecol. Manag. 2001, 146, 145–158. [Google Scholar] [CrossRef]
  52. Zeppel, M.J.B.; Adams, H.D.; Anderegg, W.R.L. Mechanistic causes of tree drought mortality: Recent results, unresolved questions and future research needs. New Phytol. 2011, 192, 800–803. [Google Scholar] [CrossRef] [PubMed]
  53. Iannucci, A.; Russo, M.; Arena, L.; Di Fonzo, N.; Martiniello, P. Water deficit effects on osmotic adjustment and solute accumulation in leaves of annual clovers. Eur. J. Agron. 2002, 16, 111–122. [Google Scholar] [CrossRef]
  54. Nguyen, P.V.; Dickmann, D.I.; Pregitzer, K.S.; Hendrick, R. Late-season changes in allocation of starch and sugar to shoots, coarse roots, and fine roots in two hybrid poplar clones. Tree Physiol. 1990, 7, 95–105. [Google Scholar] [CrossRef] [PubMed]
  55. Fischer, C.; Höll, W. Food reserves of Scots pine (Pinus sylvestris L.). Trees 1991, 5, 187–195. [Google Scholar] [CrossRef]
  56. Zwiazek, J.J. Cell wall changes in white spruce (Picea glauca) needles subjected to repeated drought stress. Physiol. Plant. 1991, 82, 513–518. [Google Scholar] [CrossRef]
  57. Amundson, R.G.; Kohut, R.J.; Laurence, J.A.; Fellows, S.; Colavito, L.J. Moderate water stress alters carbohydrate content and cold tolerance of red spruce foliage. Environ. Exp. Bot. 1993, 33, 383–390. [Google Scholar] [CrossRef]
  58. Li, N.; He, N.; Yu, G. Non-structural carbohydrates in leaves of tree species from four typical forest in China. Acta Bot. Boreal-Occident. Sin. 2015, 35, 1846–1854. (In Chinese) [Google Scholar]
  59. Hollister, R.D.; Webber, P.J.; Tweedie, C.E. The response of Alaskan arctic tundra to experimental warming: Differences between short- and long-term responses. Glob. Chang. Biol. 2005, 11, 525–536. [Google Scholar] [CrossRef]
  60. Ericsson, T.; Rytter, L.; Vapaavuori, E. Physiology of carbon allocation in trees. Biomass Bioenergy 1996, 11, 115–127. [Google Scholar] [CrossRef]
Figure 1. Bagnouls–Gaussen bio-climatic diagram.
Forests 09 00315 g001
Figure 2. Relative change in daily average soil moisture content across the study period from August 2013 to January 2016 in the control and drought plots. Samples were collected in late summer (LS), autumn (A), winter (W), and late spring (S).
Forests 09 00315 g002
Figure 3. Monthly patterns of dawn leaf water potentials from April 2013 to March 2014.
Forests 09 00315 g003
Figure 4. Non-structural carbohydrates (NSCs) in the leaves and branches of Pinus massoniana under control and drought treatments (mean ± SD). Samples were collected in late summer (LS), autumn (A), winter (W), and late spring (S) from 2013 to 2016. Variables marked with asterisks indicate a significant difference between the control and drought groups (** p < 0.01, * p < 0.05).
Forests 09 00315 g004
Figure 5. Soluble sugar concentrations in the leaves and branches of Pinus massoniana under control and drought treatments (mean ± SD). Samples were collected in late summer (LS), autumn (A), winter (W), and spring (S) from 2013 to 2016. Variables marked with asterisks indicate a significant difference between the control and drought groups (** p < 0.01, * p < 0.05).
Forests 09 00315 g005
Figure 6. Starch concentrations in the leaves and branches of Pinus massoniana under control and drought treatments (mean ± SD). Samples were collected in late summer (LS), autumn (A), winter (W), and late spring (S) from 2013 to 2016. Variables marked with asterisks indicate a significant difference between the control and drought groups (** p < 0.01, * p < 0.05).
Forests 09 00315 g006
Figure 7. The ratio of soluble sugar to starch in leaves and branches of Pinus massoniana under control and drought treatments (mean ± SD). Samples were collected in late summer (LS), autumn (A), winter (W), and late spring (S) from 2013 to 2016. Variables marked with asterisks indicate a significant difference between the control and drought groups (** p < 0.01, * p < 0.05).
Forests 09 00315 g007
Figure 8. Relationships between NSC concentrations and soluble sugar in leaves and deep soil (80 cm) moisture content in the drought treatment.
Forests 09 00315 g008
Figure 9. Relationships between concentrations of starch in leaves and deep soil (80 cm) moisture content in the drought treatment for days 115–542.
Forests 09 00315 g009
Table 1. Repeated measures analysis of variance (ANOVA) of nonstructural carbohydrate (NSC) concentration and composition by treatment and sampling date.
NSC ComponentSource of VariationsLeavesBranches
dfFpdfFp
NSCTreatment10.0060.94113.6360.063
Time104.9910.0001013.8770.000
Treatment × time101.7020.100103.6070.001
Soluble sugarTreatment10.0440.83412.8960.093
Time103.6440.000107.0260.000
Treatment × time101.0830.383101.4720.165
StarchTreatment10.8700.35510.0540.817
Time1012.7380.0001022.2530.000
Treatment × time102.0700.041105.1910.000
Soluble sugar/starchTreatment10.8420.36110.2480.620
Time107.6680.000106.8720.000
Treatment × time100.6340.780100.7140.708

