Article

Effects of Stand Structure, Browsing, and Biophysical Conditions on Regeneration Following Mountain Pine Beetle in Mixed Lodgepole Pine and Aspen Forests of the Southern Rockies

by
Kristen A. Pelz
1,* and
Frederick W. Smith
2
1
Rocky Mountain Research Station, USDA Forest Service, Fort Collins, CO 80526, USA
2
Department of Forest and Rangeland Stewardship, Colorado State University (Retired), Fort Collins, CO 80523, USA
*
Author to whom correspondence should be addressed.
Submission received: 13 August 2018 / Revised: 27 August 2018 / Accepted: 27 August 2018 / Published: 30 August 2018

Abstract

:
Aspen (Populus tremuloides) and lodgepole pine (Pinus contorta var. latifolia) co-occur in the southern Rocky Mountains (USA), where mountain pine beetle (MPB, Dendroctonus ponderosae) has caused extensive lodgepole pine mortality since the late 1990s. Both species excel in post-disturbance high-light environments, but lodgepole pine has generally been thought to establish poorly on undisturbed seedbeds, and aspen suckering may be inhibited by intact aspen overstory. We ask whether lodgepole pine and aspen will regenerate in sufficient quantities to revegetate these forests. We visited a random sample of aspen and lodgepole pine stands across the affected landscape in northern Colorado and southern Wyoming to measure regeneration and overstory mortality. Lodgepole pine regeneration is occurring in 85% of stands, and most stands have >550 stems ha−1. The median aspen sucker density was 6175 stems ha−1. Surprisingly, neither lodgepole pine nor aspen regeneration density was related to overstory mortality level. Animal damage is currently affecting aspen in these forests. Over 50% of stands had damage to 60% or more of their suckers, but 30% of stands had <20% of their stems damaged. Browsed stems were significantly shorter for their ages and were shorter than the 2.5-m height threshold for possible elk browsing. However, the results suggest that sufficient quantities of down lodgepole pine may protect aspen from damage and allow aspen to successfully recruit to the overstory. Multiple regression analysis showed that down lodgepole pine basal area, followed by browsing pressure, were the most important predictors of sucker height and the proportion of suckers browsed. Although 15% of stands had no lodgepole pine regeneration, aspen and lodgepole pine forests are generally regenerating despite animal browsing on aspen. This study is the first to present a regional perspective on regeneration in MPB-affected lodgepole pine and aspen forests, and overall, intervention does not seem necessary to ensure a mix of both species in the future.

1. Introduction

Both lodgepole pine (Pinus contorta var. latifolia Dougl. Ex. Loud.) and aspen (Populus tremuloides Michx.) are known to regenerate and dominate stands following disturbances such as wildfire and clearcut logging [1,2,3,4]. Both species are shade-intolerant and grow quickly in open environments. Where high mountain pine beetle (MPB, Dendroctonus ponderosae Hopkins)-caused mortality of lodgepole pine has occurred overstory density is substantially reduced, which may provide enough light for the successful recruitment of both species to a new overstory. However, it is uncertain how these species will respond to post-outbreak conditions in northern Colorado where mixed lodgepole pine and aspen stands cover over 250,000 acres [5].
Following beetle-caused overstory mortality seed availability and substrate may limit lodgepole pine regeneration despite the availability of high light. The lack of mineral soil was long thought to limit lodgepole pine regeneration [6,7], but some studies have shown ample lodgepole pine recruitment in post-beetle stands [8]. The lack of seed has also been hypothesized to limit regeneration, though recent work indicates that this is unlikely [7]. Although lodgepole pine has serotinous cones that remain closed until opened by heat (keeping seed from the forest floor until fire), non-serotinous cones are usually present in stands [9], and even closed cones will open following tree mortality. Viable seeds from dead trees will fall for >9 years after an outbreak [7].
Aspen sucker densities often exceed 10,000 stems ha−1 following clearfell harvests and stand-replacing fires and can exceed 1,000,000 stems ha−1 [2,10,11]. Suckering response is strongly related to mortality of overstory aspen due to the loss of sucker-suppressing auxin production and its subsequent transport to roots [4,12]. It is not clear if mortality of lodgepole pine will trigger a large increase in sucker density. In many intact stands sucker densities are often around 2500 ha−1 [2]. Bartos and Campbell [13] have suggested that stands with less than 1250 stems ha−1 between 5 and 15 feet tall are at risk for loss.
Regardless of MPB effect on sucker density, a decline in aspen health could reduce the regeneration capacity of aspen. Widespread aspen mortality in the southern Rockies, first observed in 2004, coincided with the recent MPB epidemic and drought. Early signs of this dieback, sometimes called “sudden aspen decline”, were partial canopy mortality and small, chlorotic leaves. This eventually led to tree mortality across >200,000 ha in Colorado, was accompanied by root mortality and a low regeneration response [14]. The onset of the dieback was largely caused by drought and site factors associated with moisture stress, such as slope position, low annual precipitation, and high temperatures [14,15]. The reduced vigor and regeneration capacity of aspen due to drought-related decline may reduce the ability of clones to grow suckers in response to overstory loss caused by the bark beetles.
Factors that limit growth of aspen and recruitment to the overstory will determine if aspen becomes a major part of the forest where sprouting does occur. Light is a major determinant of growth; even minor shading has substantial effects on growth rates, and aspen often die under >50% canopy cover [16]. Where high MPB-caused forest mortality occurs and few live trees remain, large canopy gaps may provide high-light conditions favoring fast growth [17,18]. Damage due to browsing could preclude aspen recruitment. Aspen stems are often damaged by wild ungulates, such as elk (Cervus canadensis Erxleben) and deer (Odocoileus spp.), and by domestic livestock. Studies have shown that aspen recruitment is unlikely when animals consistently remove ≥40% of annual growth [19,20]. There is evidence that this may be occurring in forests affected by the recent MPB outbreak. In Rocky Mountain National Park, approximately 75% of suckers under MPB-affected canopies were browsed in 2007 [21], and suckers were fewer, if not gone entirely, when plots were re-surveyed three years later [22]. Variation in animal numbers across the landscape or stand conditions that reduce animal use may result in lowered browsing pressure and better recruitment in some areas. For example, following a 1970s spruce beetle outbreak in Utah, aspen only successfully recruited in areas with rocky lava substrate that were not used by domestic cattle [23].
Forests of mixed lodgepole pine and aspen cover a large portion of the area affected by recent MPB-mortality. In this study, we ask if these species are regenerating at sufficient densities to restock these beetle-affected forests across northern Colorado and central Wyoming. We visited stands across this area to measure regeneration and overstory mortality. We expected that with increased mortality, there would be higher aspen and lodgepole pine density due to greater light reaching the forest floor. We also ask if ungulate browsing will prohibit aspen recruitment success. We measured aspen sucker damage and height and compared these values with cattle grazing and wild animal densities to assess the effects of animals on such recruitment.

2. Materials and Methods

2.1. Study Area

Our study area included north-central Colorado and the extreme south of Wyoming (between 39.6 and 41.0 degrees N and 106.0 and 106.7 degrees W). Valley bottoms in the study area are dominated by grass and shrublands. Lodgepole pine and aspen dominate the forested areas at lower elevations and on southern aspects, with increasing spruce and fir at higher elevations and northern aspects. The area has a continental climate, and the majority of precipitation falls as winter snow, with much of the remainder falling during thunderstorms beginning in mid-summer [24].

2.2. Site Selections

Forest stands with >5 and <40 m2 ha−1 aspen and lodgepole pine basal areas (n = 691) were identified using inventory data from the Medicine Bow-Routt, Arapaho, Roosevelt, and White River National Forests. From these 691 stands, we chose stands with 10–15 m2 ha−1 aspen basal areas and <5 m2 ha−1 basal areas of species other than aspen and lodgepole pine. These stands were stratified into 3 groups based on pre-MPB lodgepole pine basal areas: stands with 10–20, 20–30, and 30–40 m2 ha−1. We randomly chose a set of stands from each group for sampling that were visited in the field to ensure that they were not harvested and that the inventory data was correct. Thirty-three stands were selected for sampling. Elevation ranged from 2580 to 2030 m and averaged 2780 m. Mean total precipitation at the study stands was approximately 560 mm annually, with a range from 400 to 730 mm (from 30-year climate normals [1981–2010] with an 800 m resolution) (PRISM Climate Group). Mean annual maximum temperature (the maximum daily temperature averaged over month and then year) was approximately 9.6 °C and ranged from 7.3 to 11.3 °C. Mean annual minimum temperature (the minimum daily temperature averaged over month and then year) was approximately −5.4 °C and ranged from −3.0 to −6.9 °C.

2.3. Field Data Collection

A set of 4–6 plot centers, 50 m apart, was installed on a grid in each stand at the end of the growing season in 2012 and 2013. The basal area of overstory trees by species was recorded at each plot using a 4.6 m2 ha−1 prism in a variable radius plot. Tree status (live, dead, beetle-killed) was recorded for each overstory tree. Tree seedlings/sprouts and saplings (trees ≥2 cm tall and <2.5 cm diameter at breast height; dbh) were tallied by height class in 3.6-m radius plots. Damage to aspen sprouts/saplings was recorded; damage to pine regeneration was rare and was not recorded. Two samples of each aspen sprout size class were measured for height and aged to establish an age-height relationship. Pellet groups were recorded by animal species (elk, deer, moose, and domestic cattle) in each plot. Aspect and slope were recorded for each plot. We identified the approximate year of onset of epidemic MPB activity in each stand using Forest Service aerial detection survey data from 1996–2012 [25]. Widespread MPB-caused mortality began between 2001 and 2006 in all stands.

2.4. Animal Use Information

Many public lands in the study area are leased for cattle grazing, and all areas are used by wild ungulates. We obtained information about grazing activity (Yes or No) by allotment in the year of sampling at all the sites (2012 for 9 stands, 2013 for 24 stands). We calculated a wild browsing index from Colorado Department of Wildlife data. We obtained elk and deer population estimates at the finest scale possible, either at the data analysis unit (DAU) or the game management unit (GMU). We standardized animal numbers by hectares of summer habitat in each GMU or DAU. Elk and mule deer densities were converted to animal unit equivalents (AUE), using a factor of 0.2 for mule deer and 0.6 for elk [26].

2.5. Topographic and Landform Data

Aspect and slope were recorded for each plot and averaged to the stand level. We derived a topographic wetness index (TWI) from a digital elevation model (DEM) from the National Elevation Dataset [27] with the equation TWI = ln (As/tan β), where As is the cumulative upslope area that drains through the cell divided by the contour width and β is the slope [28]. TWI has a long record of use in hydrology and has been used extensively in vegetation studies in the last decade [29,30,31,32,33].

2.6. Statistical Analysis
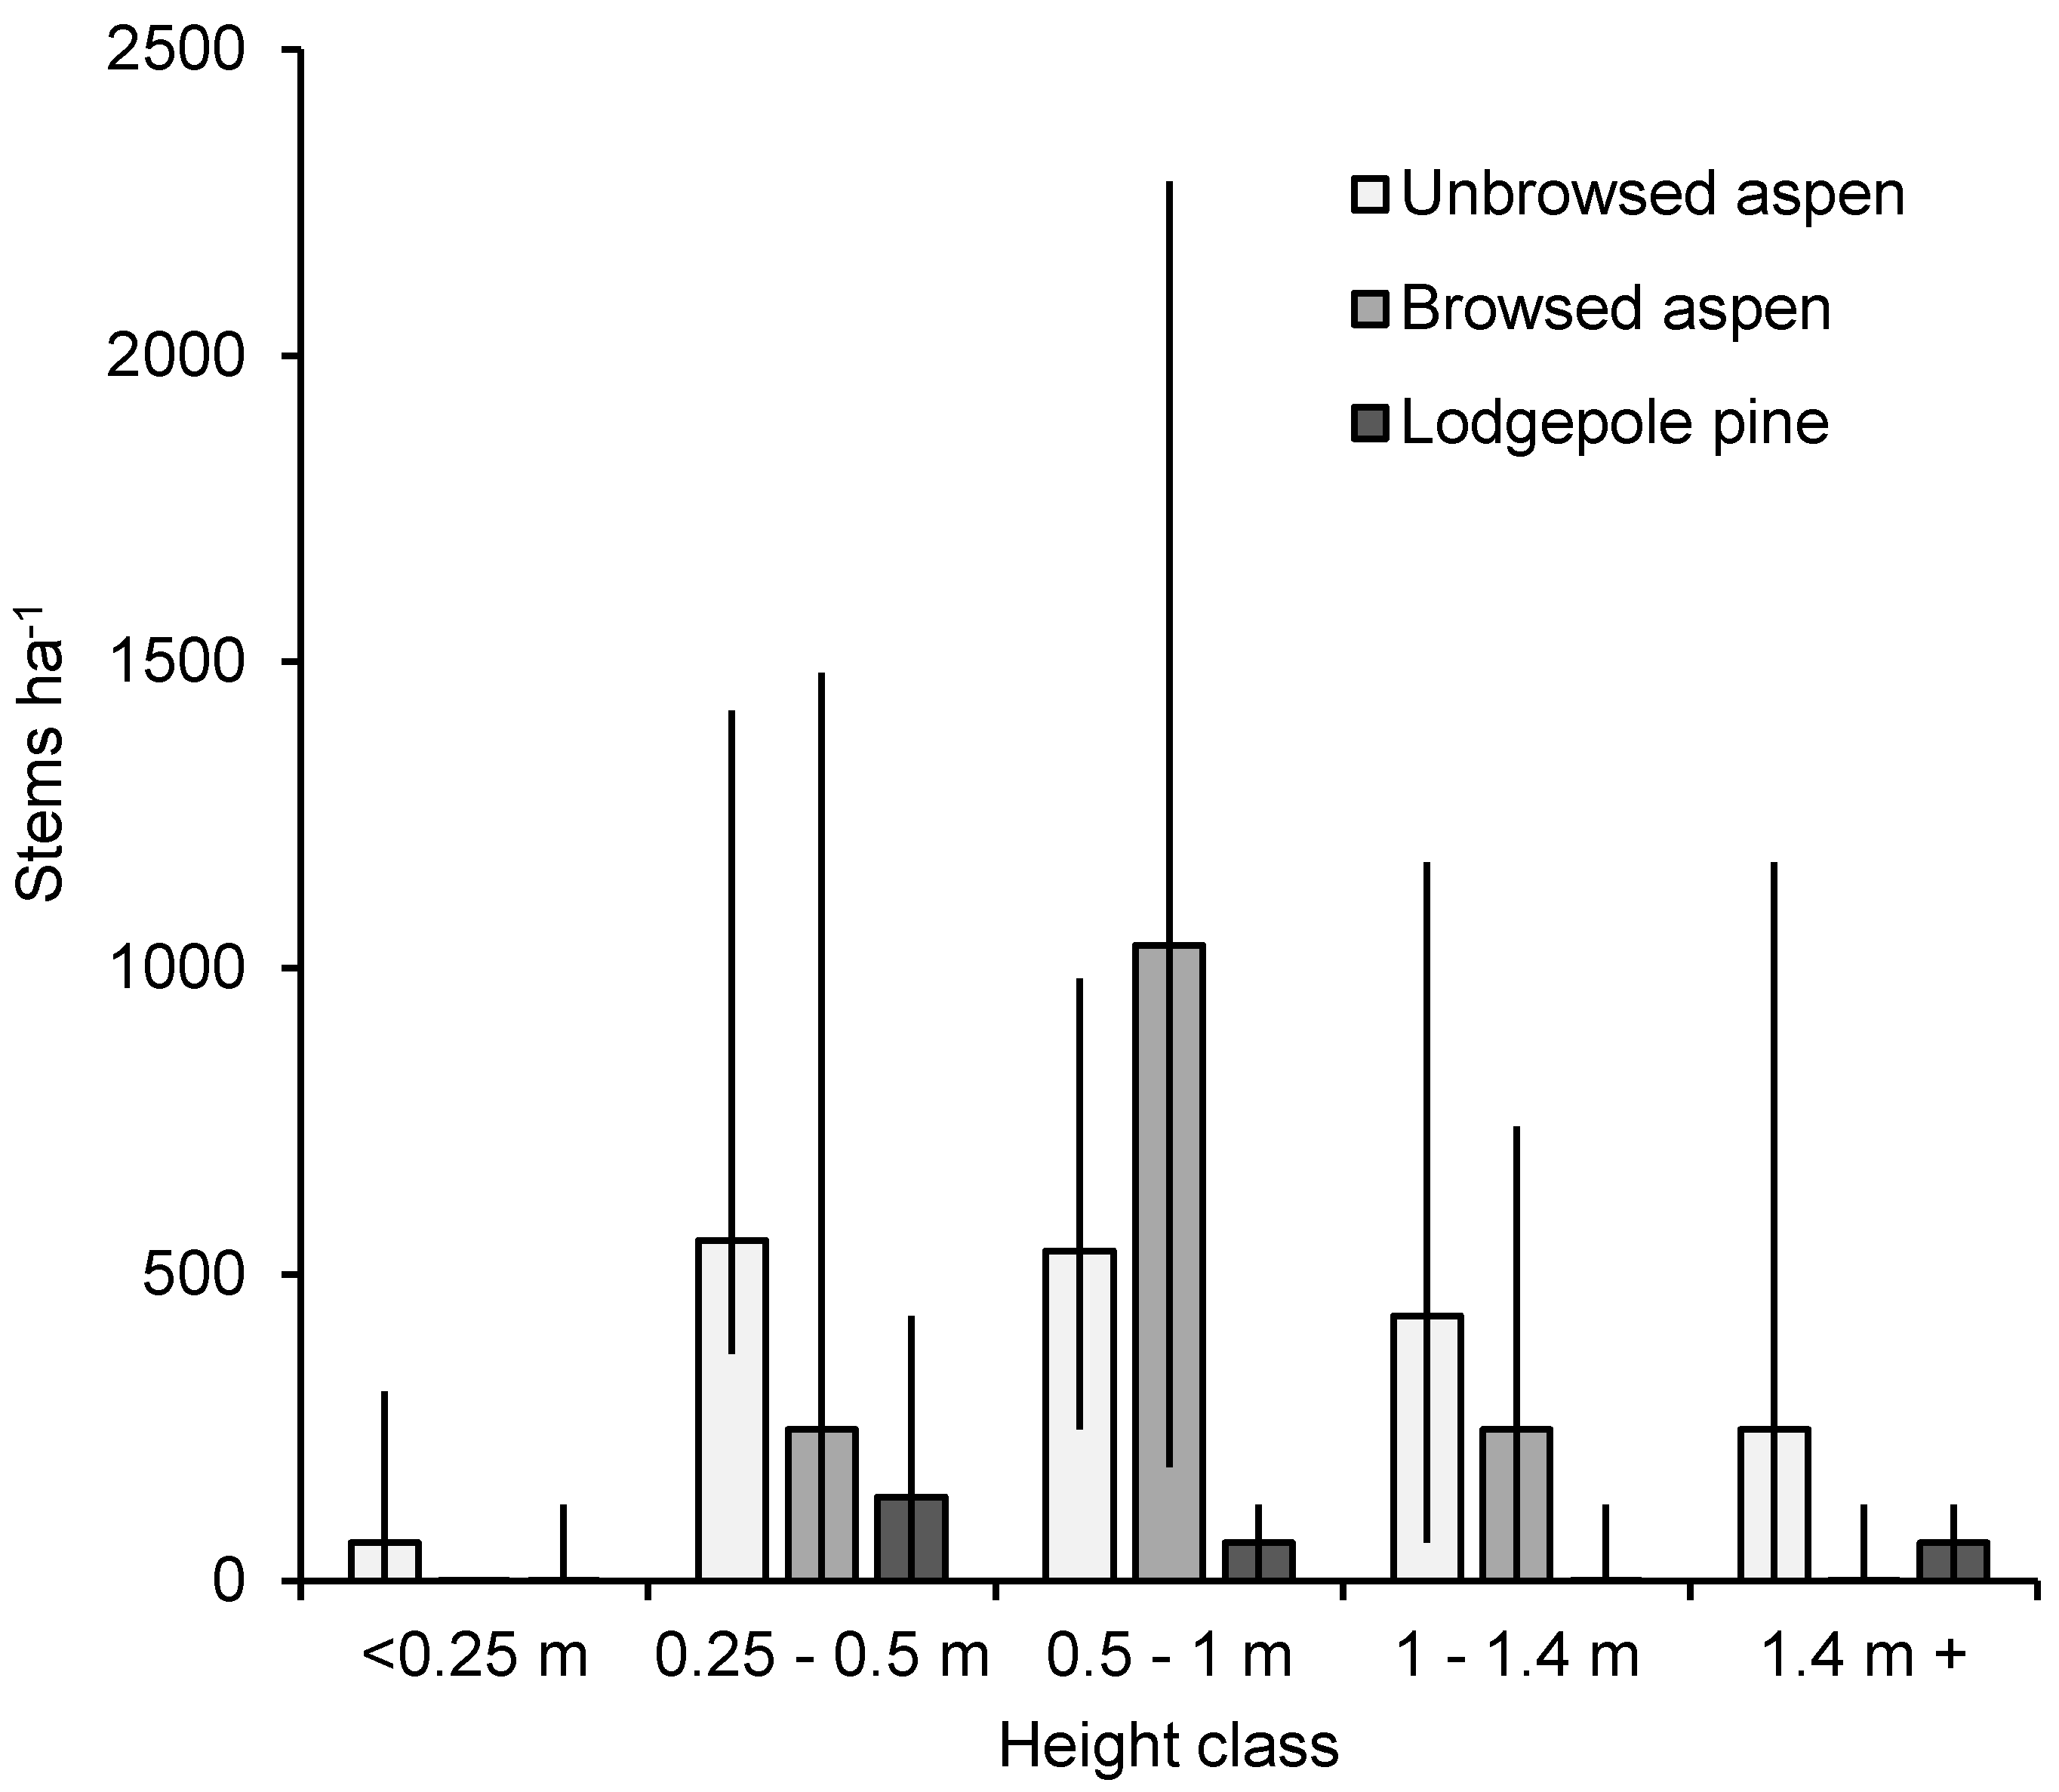
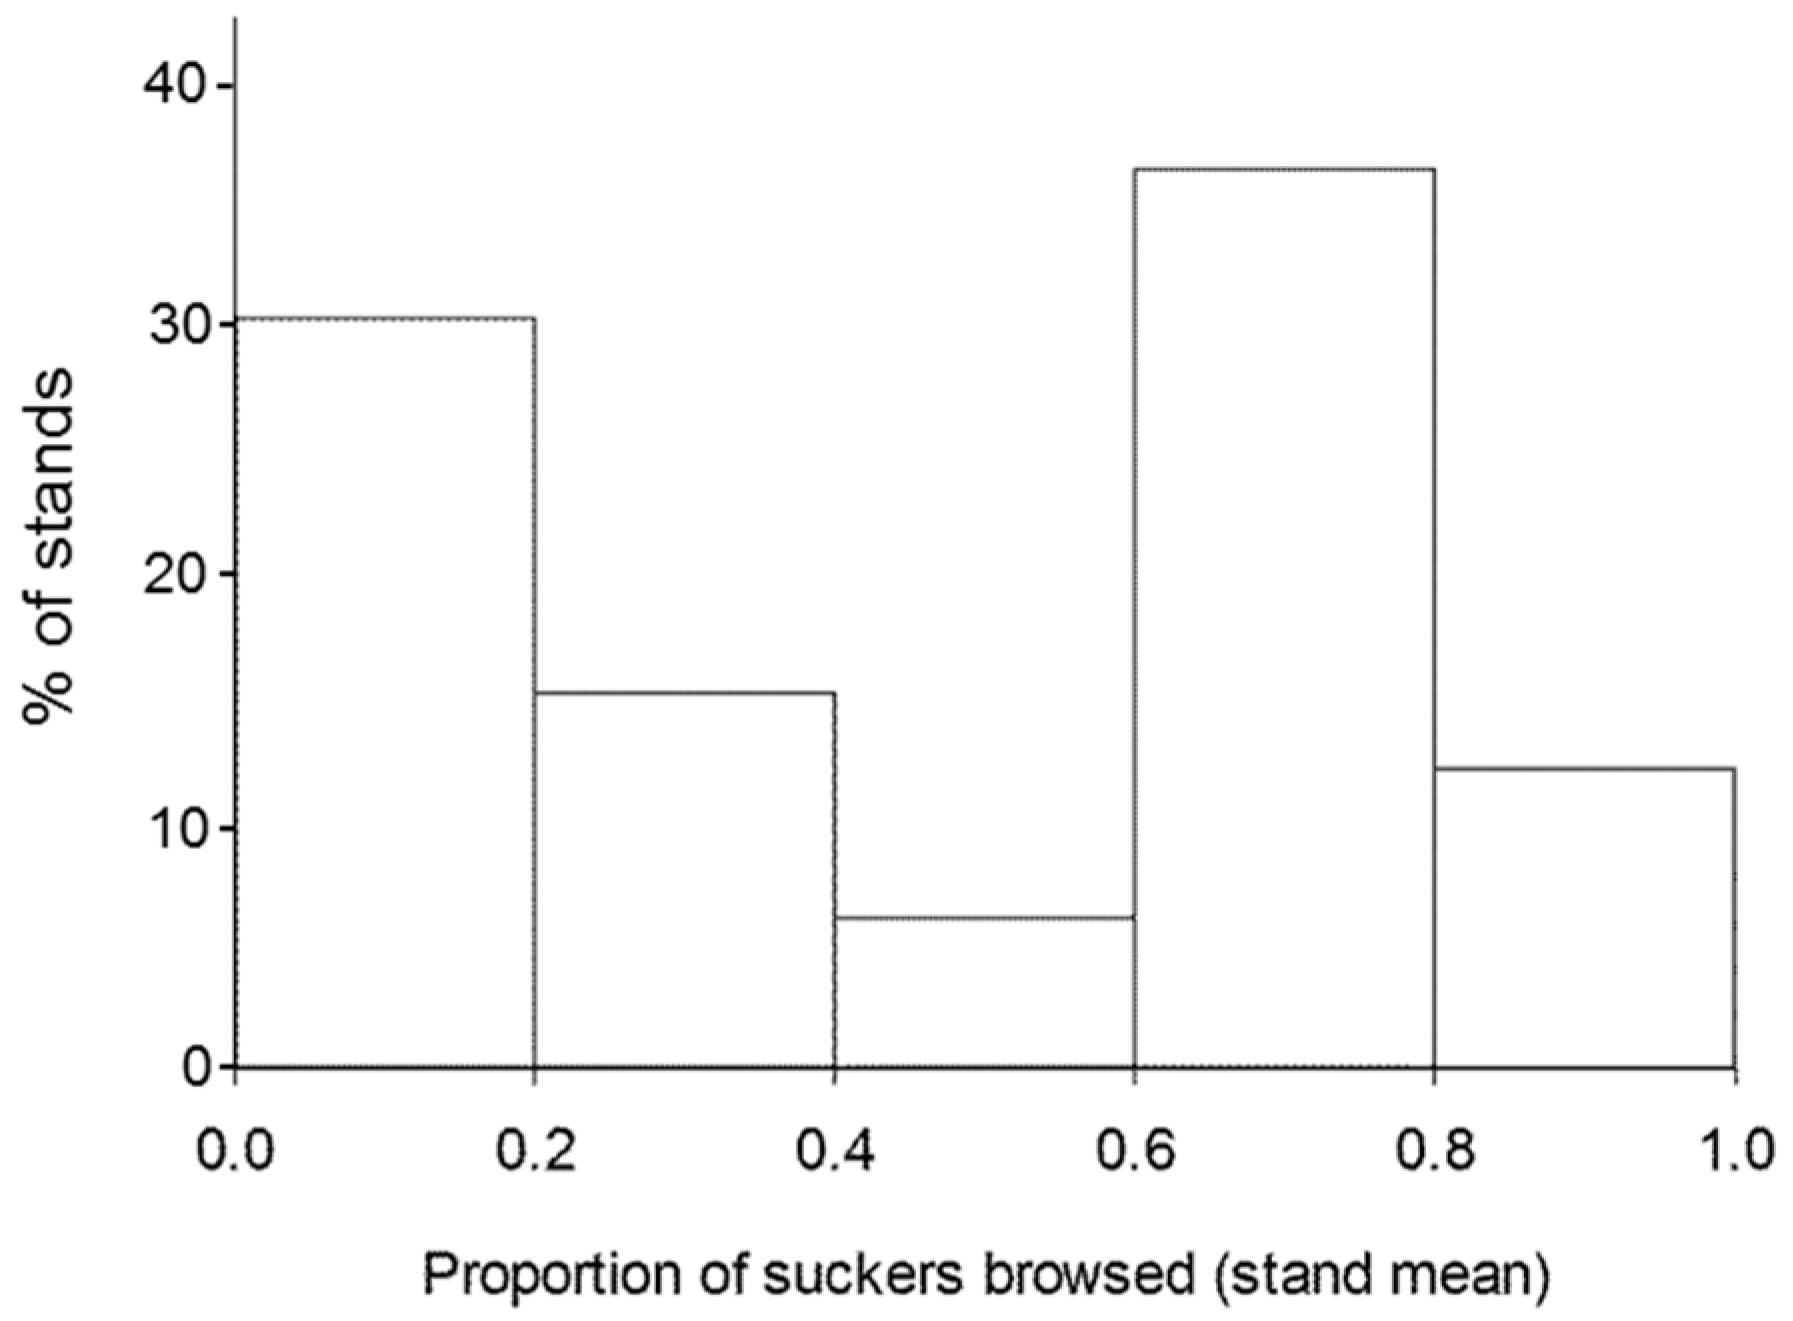
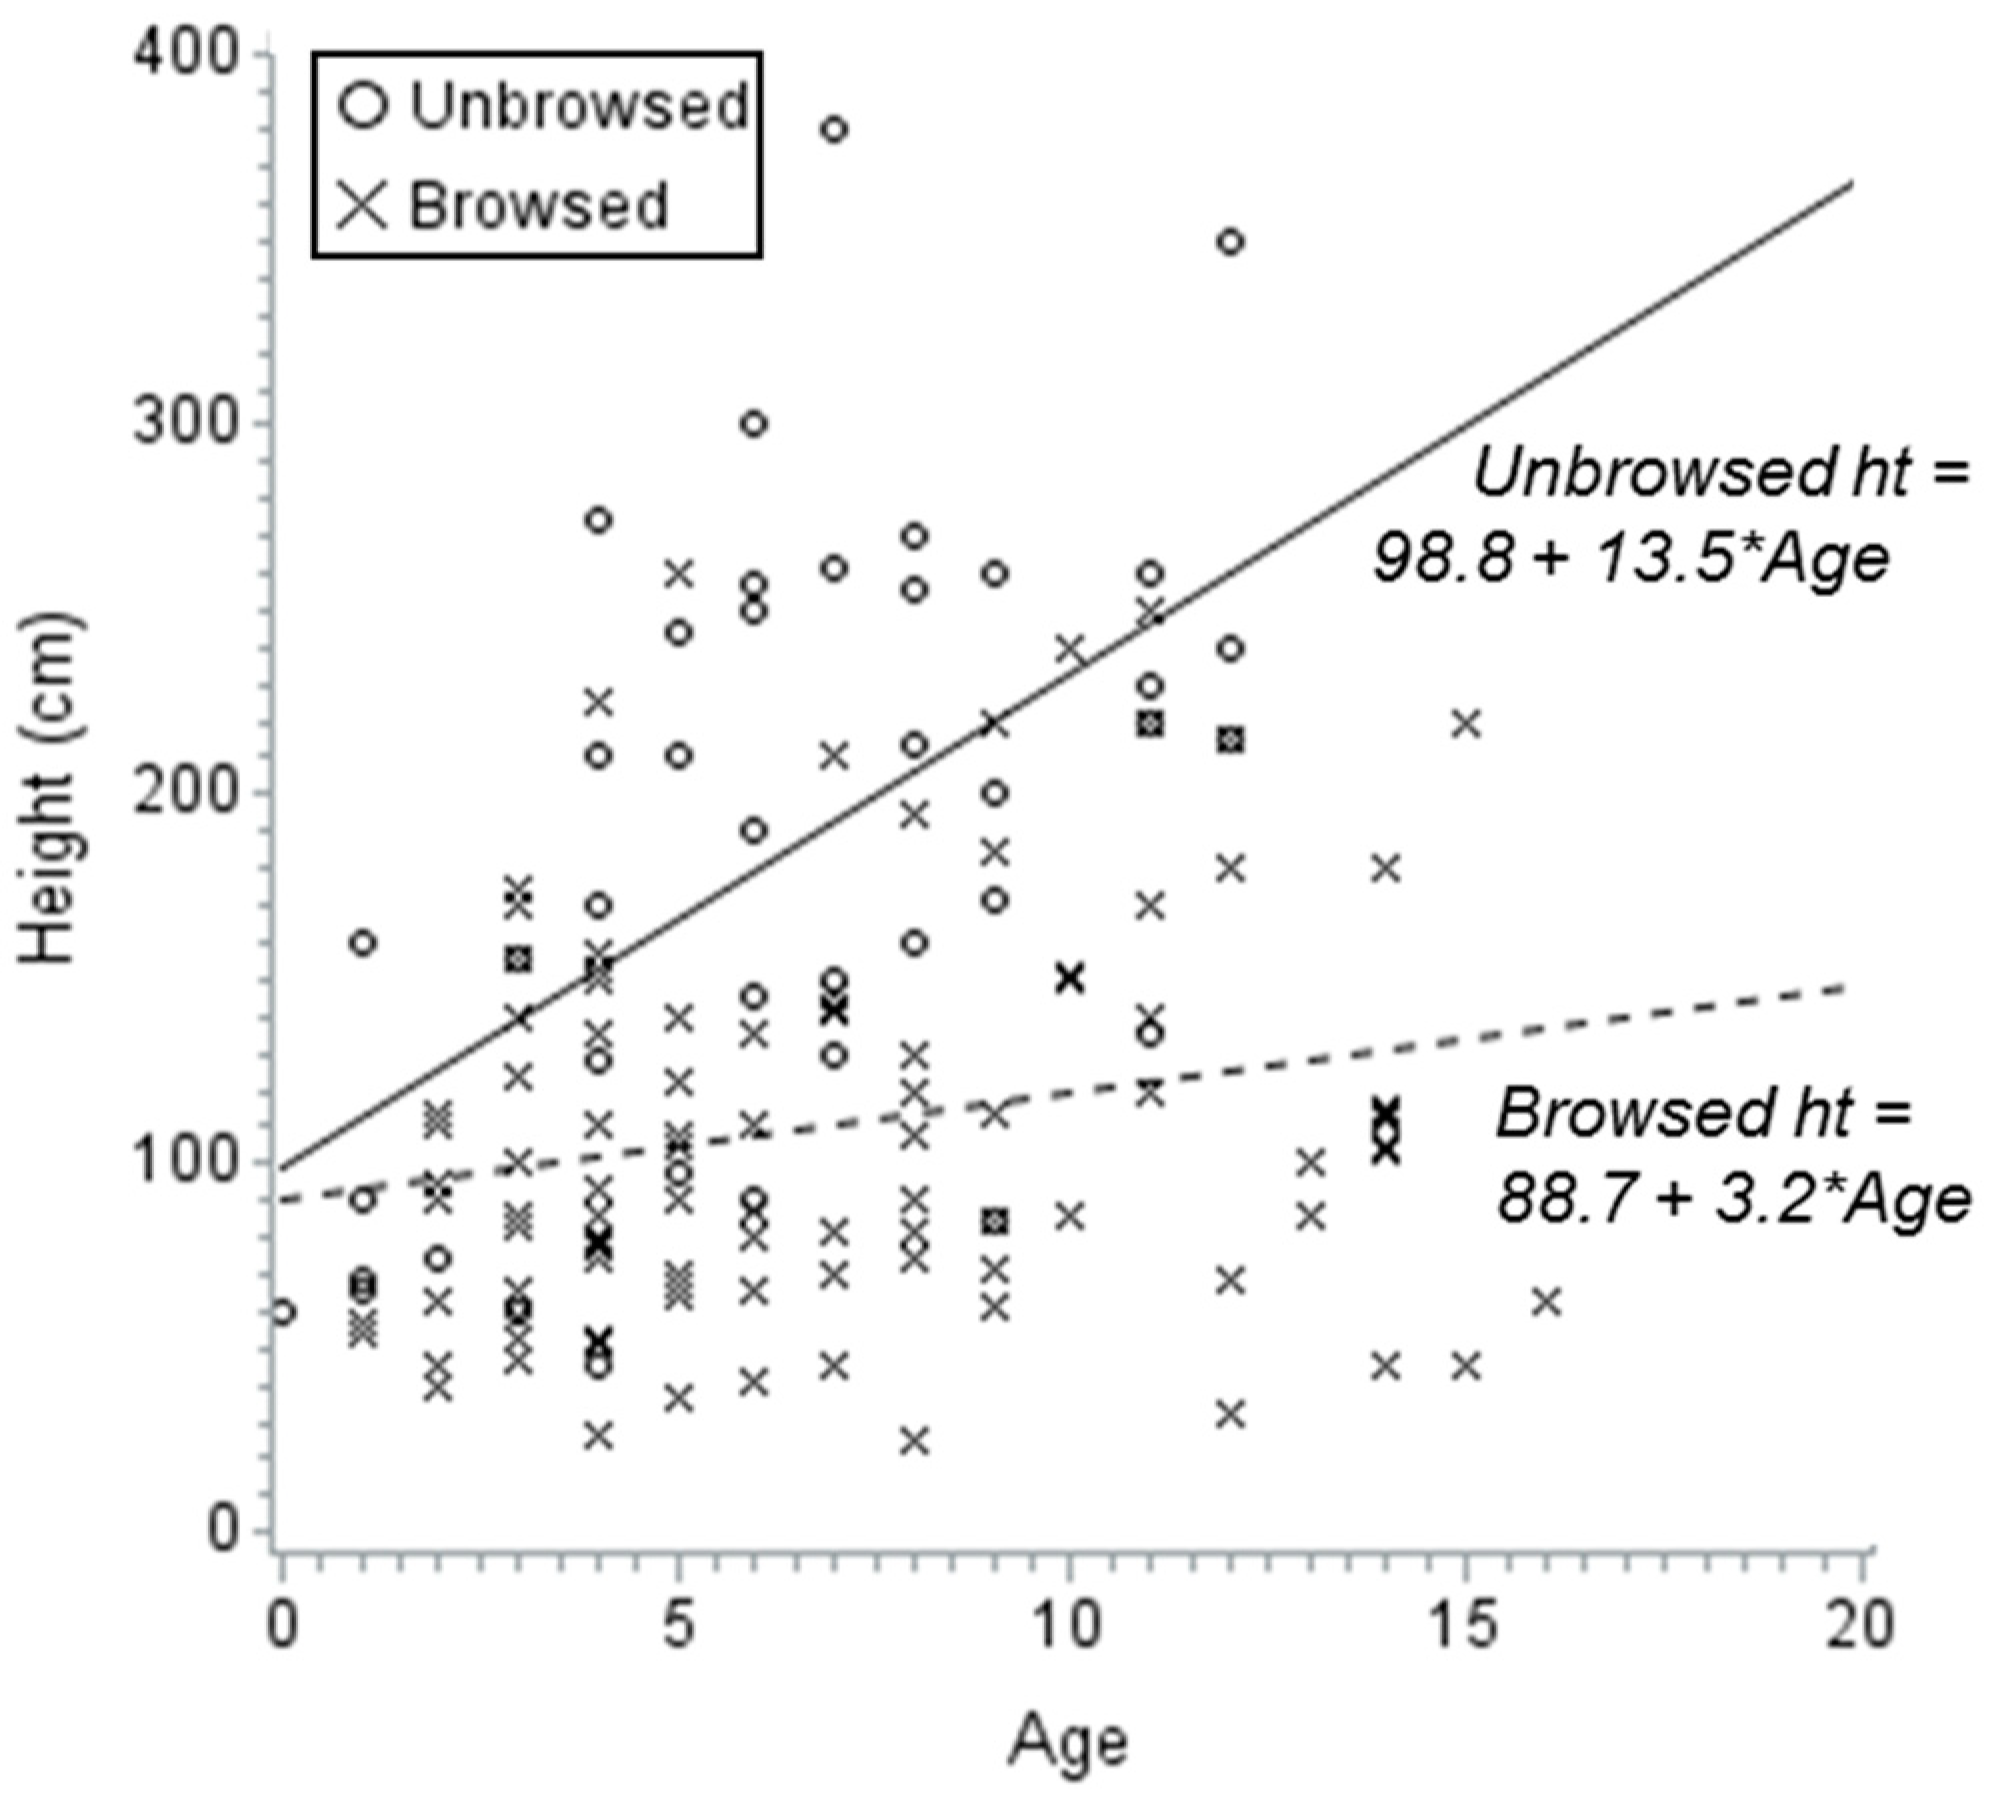
Tree basal area (m2 ha−1), regeneration density (stems ha−1), mean sucker height (cm), plot maximum sucker height (cm), and proportion of suckers browsed were summarized at the stand level. To determine if relationships existed between regeneration density (aspen sucker density or lodgepole pine density) or height (sucker mean height or sucker maximum height) and independent variables (pre-MPB live basal area [m2 ha−1], basal area killed by MPB [m2 ha−1], live aspen basal area [m2 ha−1], dead and down aspen basal area [m2 ha−1], down lodgepole pine basal area [m2 ha−1], time since onset of MPB epidemic [years], slope [percent], aspect, average annual precipitation [cm], mean annual maximum temperature [°C], topographic wetness index, grazing status [Yes or No], and wild browsing index [AUE ha−1 summer habitat]; all averaged to stand level), we first did a Spearman’s rank correlation test. We also assessed the relationship between proportion of suckers browsed with independent variables we hypothesized would affect animal activity (basal area killed by MPB, live aspen basal area, down lodgepole pine basal area, slope, domestic grazing status, and wild browsing index) with the same test. Where significant (α = 0.1) correlations were identified, we performed a more conservative linear regression analysis for the continuous variables. Dependent and independent variables were transformed, if necessary, to meet the assumptions of normality. Observations with high leverage (Cook’s D > 0.5) were removed. We tested the effect of grazing status, a categorical variable (grazed in year of sampling: Yes or No), on aspen sucker mean height, maximum height, and proportion of suckers browsed with an ANOVA.
We then used Akaike’s information criterion, adjusted for a small sample size (sample-size corrected Akaike Information Criterion; AICC), to select the most parsimonious multiple regression model to explain variation in each of the four dependent variables. We built models stepwise, with α = 0.1 for leaving or entering the model, by adding all independent variables with significant regression relationships or ANOVAs, starting from greatest to least adjusted R2. When stepwise selection kept multiple variables in the model, we added terms for interactions among independent variables. Models were assessed for collinearity of the predictor variables; no violations were found [34].

3. Results

Live and dead basal area was highly variable in the sampled stands (Table 1). All stands had dead lodgepole pine and some component of live aspen. There was a median of 7.6 m2 of live basal area ha−1 (median values are reported unless indicated otherwise), approximately half in aspen and half in lodgepole pine. MPB-caused mortality level varied among stands; standing dead lodgepole pine basal area ranged from 3.3 to 34.8 m2 ha−1, with a median of 21.8 m2 ha−1. A total of 70% of stands had fallen, MPB-killed trees. Dead aspen was present in all but four stands, with 2.2 m2 ha−1 standing and 2.2 m2 ha−1 down. Fir and/or spruce overstory was present in only six stands, with no more than 2.2 m2 ha−1 in any stand.
Understory (trees ≥2 cm tall and <2.5 cm dbh) density of aspen and lodgepole pine was high in most stands, with median stem densities of 556 ha−1 pine and >6000 ha−1 aspen (Table 1). Aspen and lodgepole pine understory density was highly variable among stands and size classes. Aspen understory density ranged from 1167 to nearly 27,000 ha−1. Two-thirds of stands had sucker densities between 3000 and 10,000 stems ha−1; five stands had densities <3000 stems ha−1, and six had >10,000 stems ha−1. Unbrowsed aspen stem densities were relatively evenly distributed across size classes, while browsed aspen stems were mostly 0.25–1 m tall (Figure 1). Five stands had no lodgepole pine understory, and three stands had <250 stems ha−1, but 21 stands had 250–2000 stems ha−1, and four stands had >2000 stems ha−1 (Table 1). Lodgepole pine understory was mostly ≤1 m tall (Figure 2). Fir and spruce understory densities were below 100 stems ha−1 in the majority of stands, but six stands had 1000 ha−1–3600 ha−1.
Proportion of aspen suckers browsed in each stand varied widely. Less than 20% of suckers were browsed in ~30% of sampled stands (Figure 2). However, browse rates were between 60–100% in the majority (>50%) of stands. The age–height relationship of sampled aspen shows that browsing damage had an effect on height of aspen stems (Figure 3). The relationship was moderately strong for unbrowsed stems (R2 = 0.29, P < 0.01) but weak for browsed stems (R2 = 0.07, P < 0.01). Unbrowsed aspen stems were significantly taller for their age than browsed stems.
Spearman’s rank correlation tests identified several potential predictor variables for regression analysis. There were significant (α = 0.1) correlations among regeneration density and height (mean aspen density, lodgepole pine density, mean aspen sucker height, and maximum aspen sucker height) and all variables listed in Table 2, and proportion of suckers browsed was related to all variables shown in Table 3. MPB-killed basal area was not related to aspen sucker density (rs = −0.17, P = 0.36) or lodgepole pine regeneration density (rs = 0.25, P = 0.16). MPB-killed basal area had mixed relationships with sucker heights and proportions of suckers browsed. It had no relationship to aspen sucker mean height (rs = −0.22, P = 0.21) but was negatively related to maximum height (rs = −0.31, P = 0.07) and more strongly related to proportion of suckers browsed (rs = 0.36, P = 0.04).
Down lodgepole pine basal area, maximum temperature, precipitation, and wild browsing index had the strongest correlations with regeneration density and height variables. Regression analysis showed that down pine basal area explained a substantial amount of variation in mean (Adj. R2 = 0.49) and maximum sucker height (Adj. R2 = 0.39; Table 2). Mean and maximum aspen height were also related to maximum temperature, wild browsing index, and precipitation, which all had adjusted R2 > 0.15. Down basal area was the strongest predictor of aspen density. The relationship of the down basal area to aspen density was weaker (Adj. R2 = 0.23) than its relationship with aspen height (both mean and maximum). Mean annual temperature also explained variation in aspen density (Adj. R2 = 0.20). Lodgepole pine density was somewhat explained by live lodgepole pine density (Adj. R2 = 0.23) and weakly explained by TWI (Adj. R2 = 0.11; Table 2).
In the initial Spearman’s rank correlation test to screen for potential predictor variables, proportion of suckers browsed was negatively correlated with down lodgepole pine and live aspen basal area and positively correlated with wild browsing and MPB-killed basal area (all Ps < 0.05). Regression analysis showed that down lodgepole pine basal area had a strong negative relationship with proportion of suckers browsed (Adj. R2 = 0.46, P < 0.01), a moderate positive relationship with MPB-killed basal area (Adj. R2 = 0.25, P < 0.01), and a relatively weak relationship with wild browsing index (Adj. R2 = 0.16, P = 0.01). Live aspen basal area had no effect on browsing rate (Adj. R2 = −0.03, P = 0.94; Table 3).
Grazing status had significant effects on mean height, maximum height, and proportion of suckers browsed. The effect of grazing was clearest on maximum sucker height, with average maximum heights of 234 cm in ungrazed stands but 152 cm in grazed stands (F = 8.64, P < 0.01). The effects on mean height (90 cm in grazed, 115 cm in ungrazed, F = 3.66, P = 0.06) and proportion of suckers browsed (0.55 in grazed, 0.27 in ungrazed, F = 3.07, P = 0.08) were smaller and significance of the effects less certain.
The multiple regression model selection showed that one to three variables were the most important predictors of regeneration density, height, or proportion of suckers browsed. The model predicting mean aspen sucker density included down lodgepole pine basal area (β = −0.25 ± 0.09, P < 0.01) and live aspen basal area (β = −0.27 ± 0.13, P = 0.05) but was only moderate in strength, with an adjusted R2 of 0.29 (AICC = 80.7). Lodgepole pine regeneration density was explained best by live lodgepole pine basal area alone (β = 1.49 ± 0.46, P < 0.01); this relationship was relatively weak (Adj. R2 = 0.23, AICC = 157.7). Mean sucker height had the strongest model of all (as measured by greatest Adj. R2 and lowest AICC) and included down lodgepole pine basal area (β = 0.14 ± 0.03, P < 0.01) and wild browsing index (β = −49.8 ± 17.3, P < 0.01) as predictor variables (Adj. R2= 0.54, AICC = 9.3). Maximum sucker height had two models with nearly equivalent AICC values. The first included down lodgepole (β = 0.15 ± 0.05, P < 0.01) and wild browsing (β = −46.7 ± 24.2, P = 0.06) (Adj. R2 = 0.36, AICC = 29.6), and the slightly stronger model (Adj. R2 = 0.43, AICC = 29.2) included down lodgepole (β = 0.13 ± 0.04, P < 0.01), wild browsing (β = −47.2 ± 22.8, P = 0.05), and TWI (β = −0.49 ± 0.22, P = 0.04). Proportion of suckers browsed had the second strongest model, with an adjusted R2 of 0.50 (AICC = 17.47). It included down lodgepole (β = −0.18 ± 0.04, P < 0.01) and wild browsing index (β = 36.8 ± 19.8, P = 0.07).

4. Discussion

Mixed lodgepole pine and aspen forests affected by MPB are regenerating and the densities suggest that the majority will remain mixed forests of both species in the future. Lodgepole pine regeneration is occurring in 85% of stands, with densities above 550 stems ha−1 in the majority of stands, and recruitment is likely to continue for several more years [35]. Aspen regeneration is also occurring and median densities are above 6000 stems ha−1, though one stand had less than <1200 stems ha−1, which may be a cause for concern [13]. Aspen sucker densities were not as high as would be expected following disturbances that kill overstory aspen and were not much above sucker densities reported from intact aspen stands [2,36].
Forest mortality or live basal area had little relationship to regeneration. Contrary to our expectations, neither lodgepole pine nor aspen density was related to MPB-killed basal area. Time since onset of outbreak-level MPB mortality was also not related to regeneration density or height. Down lodgepole pine basal area was the only forest structure variable with a major influence on the aspen density or height. This relationship was strongest for mean aspen sucker height and proportion of aspen suckers browsed.
Damage by ungulates is affecting aspen. The maximum height of our browsed suckers was about 2.6 m—near the 2.5-m threshold below which stems are especially susceptible to elk damage [37]. The final multiple regression models for the aspen height and proportion of suckers browsed included wild browsing index, indicating that wild ungulates are impacting aspen. Maximum sucker height in stands grazed by cattle was nearly 1 m shorter than in ungrazed areas. However, cattle grazing status was not included as a term in final models. Further investigation of the relative impacts of various animals on aspen regeneration is warranted.
Our results indicate that there is more aspen browsing in areas with greater MPB-caused mortality but less browsing where there are high densities of fallen dead trees. There is evidence that land use by herbivores intensifies with forest mortality level [38], perhaps due to increased understory production and nutrition of forage [39,40]. However, the importance of down lodgepole pine basal area in the height and proportion browsed models suggests that beetle-killed trees, once fallen, are providing protection to aspen suckers. Protection by downed logs has also been reported elsewhere [41,42]. Some studies have suggested that this protection may not be enough to allow stem recruitment to the overstory in very high browsing intensity situations [43] or where there is relatively little aspen on the landscape [37]. The extensive impacts of MPB disturbance and the widespread aspen presence in north-central Colorado may be enough to reduce the overall pressure on suckers [11]. Therefore, although browsing affected aspen regeneration height, in the long term, it may be unlikely to limit recruitment across the MPB-affected landscape.
Aspen density and height did have relationships with climate variables, though they were not included in the final multiple regression models. Maximum temperature was negatively related to aspen density but positively related to height, while precipitation was positively related to aspen density but negatively related to height. These different directions of the relationships of these variables to density and height were surprising but not entirely unsupported. The increase in aspen height with temperature makes sense, because aspen growth is strongly related to temperature [4,43], while lower sucker density with higher temperatures could be due to climate-related aspen decline, root mortality, and reduced regeneration capacity. Similarly, aspen density may have declined with moisture, because drought is tied to aspen decline [14,15]. Although we expected aspen growth to increase with precipitation it declined. A plausible reason could be that waterlogged soils can reduce growth and make aspen more susceptible to pathogens [44,45]. However, reduced growth with soil moisture could be because precipitation increases as temperature decreases along an elevation gradient in the southern Rockies, and decreasing temperatures were related to decreased height. Overall, we suggest that these relationships be interpreted cautiously, because they were not included in the final model of regeneration.
Despite the abundance of new recruits of both aspen and lodgepole pine in most areas, regeneration may be insufficient to result in a future forest in a small portion of stands surveyed. A total of five (15%) of our stands had no lodgepole pine regeneration present. Field photos and notes indicate that they had dense grass and sedge cover, which has been tied to low pine seedling recruitment [1,46]. It is possible that lodgepole present could be overtopped by more dense aspen and therefore not recruit successfully to the overstory. Heavy browsing damage to aspen in many areas is also cause for concern. A total of 12% of our stands had browsing damage to >80% of their aspen stems, and 39% had damage to 60–80% of their aspen stems. These areas may have little aspen recruitment if trees do not fall before sucker mortality occurs or if fallen tree density is insufficient to provide a barrier to animal use.

5. Conclusions

Throughout the area most affected by MPB in the southern Rockies, lodgepole pine and aspen are regenerating. Although 15% of our stands had no lodgepole regeneration, in most stands suitable lodgepole pine stocking is already present, and regeneration densities are likely to increase for several more years [35], though dense aspen could outcompete lodgepole pine. Most stands had 6000 aspen stems ha−1 or greater, though one stand did have <1200 aspen stems ha−1. Although browsing is currently reducing aspen height, our results suggest that ongoing fall of MPB-killed snags may protect suckers and allow successful overstory recruitment in many areas. This study is the first to present a regional perspective on regeneration in MPB-affected lodgepole pine and aspen forests, and in general, intervention does not seem necessary to ensure a mix of both species in the future.

Author Contributions

Conceptualization, K.A.P. and F.W.S.; Methodology K.A.P., F.W.S., and Z.Z.; Formal Analysis, K.A.P. and F.W.S.; Resources, F.W.S.; Original Draft Preparation, K.A.P.; Review and Editing of Manuscript, K.A.P. and F.W.S.; and Funding Acquisition, F.W.S.

Funding

Funding for this research was provided by the Department of Forest and Rangeland Stewardship, Colorado State University.

Conflicts of Interest

The authors declare no conflicts of interest.

References

  1. Lotan, J.E.; Critchfield, W.B. Pinus contorta Doug. ex. Loud.—Lodgepole Pine. In Silvics of North America: Conifers; Burns, R.M., Honkala, B.H., Eds.; USDA Forest Service: Washington, DC, USA, 1990; Volume 1, pp. 302–315. [Google Scholar]
  2. Crouch, G.L. Aspen regeneration after commercial clearcutting in southwestern Colorado. J. For. 1983, 83, 316–319. [Google Scholar]
  3. Perala, D.A. Populus tremuloicies Michx. - Quaking Aspen. In Silvics of North America: Hardwoods; Burns, R.M., Honkala, B.H., Eds.; USDA Forest Service: Washington, DC, USA, 1990; Volume 2, pp. 555–569. [Google Scholar]
  4. Frey, B.; Lieffers, V.; Landhausser, S.; Comeau, P.; Greenway, K. An analysis of sucker regeneration of trembling aspen. Can. J. For. Res. 2003, 33, 1169–1179. [Google Scholar] [CrossRef]
  5. Miles, P.D. Forest Inventory EVALIDator Web-Application Version 1.6.0.03. Available online: http://apps.fs.fed.us/Evalidator/evalidator.jsp (accessed on 22 January 2015).
  6. Astrup, R.; Coates, K.D.; Hall, E. Recruitment limitation in forests: Lessons from an unprecedented mountain pine beetle epidemic. For. Ecol. Manag. 2008, 256, 1743–1750. [Google Scholar] [CrossRef]
  7. Teste, F.P.; Lieffers, V.J.; Landhäusser, S.M. Seed release in serotinous lodgepole pine forests after mountain pine beetle outbreak. Ecol. Appl. 2011, 21, 150–162. [Google Scholar] [CrossRef] [PubMed]
  8. Collins, B.J.; Rhoades, C.C.; Hubbard, R.M.; Battaglia, M.A. Tree regeneration and future stand development after bark beetle infestation and harvesting in Colorado lodgepole pine forests. For. Ecol. Manag. 2011, 261, 2168–2745. [Google Scholar] [CrossRef]
  9. Tinker, D.B.; Romme, W.H.; Hargrove, W.W.; Gardner, R.H.; Turner, M.G. Landscape-scale heterogeneity in lodgepole pine serotiny. Can. J. For. Res. 1994, 24, 897–903. [Google Scholar] [CrossRef]
  10. Shepperd, W.D. Initial Growth, Development, and Clonal Dynamics of Regenerated Aspen in the Rocky Mountains; USDA Forest Service: Fort Collins, CO, USA, 1993.
  11. Smith, E.A.; O’Loughlin, D.; Buck, J.R.; St. Clair, S.B. The influences of conifer succession, physiographic conditions and herbivory on quaking aspen regeneration after fire. For. Ecol. Manag. 2011, 262, 325–330. [Google Scholar] [CrossRef]
  12. Farmer, R.E. Effect of light intensity on growth of Populus tremuloides. For. Sci. 1962, 8, 403–410. [Google Scholar]
  13. Bartos, D.L.; Campbell, R.B. Decline of quaking aspen in the interior west-examples from Utah. Rangelands 1998, 20, 17–24. [Google Scholar]
  14. Worrall, J.J.; Marchetti, S.B.; Egeland, L.; Mask, R.A.; Eager, T.; Howell, B. Effects and etiology of sudden aspen decline in southwestern Colorado, USA. For. Ecol. Manag. 2010, 260, 638–648. [Google Scholar] [CrossRef]
  15. Rehfeldt, G.E.; Ferguson, D.E.; Crookston, N.L. Aspen, climate, and sudden decline in western USA. For. Ecol. Manag. 2009, 258, 2353–2364. [Google Scholar] [CrossRef]
  16. Huffman, R.D.; Fajvan, M.A.; Wood, P.B. Effects of residual overstory on aspen development in Minnesota. Can. J. For. Res. 1999, 29, 284–289. [Google Scholar] [CrossRef]
  17. Groot, A.; Man, R.; Wood, J. Spatial and temporal patterns of Populus tremuloides regeneration in small forest openings in northern Ontario. For. Chron. 2009, 85, 548–557. [Google Scholar] [CrossRef]
  18. Calder, W.J.; Horn, K.J.; St. Clair, S.B. Conifer expansion reduces the competitive ability and herbivore defense of aspen by modifying light environment and soil chemistry. Tree Phys. 2011, 31, 582–591. [Google Scholar] [CrossRef] [PubMed] [Green Version]
  19. Ripple, W.J.; Beschta, R.L. Restoring Yellowstone’s aspen with wolves. Biol. Cons. 2007, 138, 514–519. [Google Scholar] [CrossRef]
  20. Zeigenfuss, L.C.; Binkley, D.; Tuskan, G.A.; Romme, W.H.; Yin, T.; DiFazio, S.; Singer, F.J. Aspen Ecology in Rocky Mountain National Park: Age Distribution, Genetics, and the Effects of Elk Herbivory; U.S. Geological Survey: Reston, VA, USA, 2008.
  21. Nelson, K.N. The effect of mountain pine beetle caused mortality on subalpine forest stand and landscape structure in Rocky Mountain National Park, CO. Master’s Thesis, Colorado State University, Fort Collins, CO, USA, December 2009. [Google Scholar]
  22. Renwick, K.M. The interactive effects of climate and disturbance on tree species distributions. Ph.D. Thesis, Colorado State University, Fort Collins, CO, USA, May 2009. [Google Scholar]
  23. DeRose, R.J.; Long, J.N. Regeneration response and seedling bank dynamics on a Dendroctonus rufipennis-killed Picea engelmannii landscape. J. Veg. Sci. 2010, 21, 377–387. [Google Scholar] [CrossRef]
  24. Doesken, N.J.; Pielke Sr, R.A.; Bliss, O.A.P. Climate of Colorado, Climatography of the United States No. 60. Available online: http://climate.colostate.edu/pdfs/climateofcoloradoNo.60.pdf (accessed on 29 August 2018).
  25. USDA Forest Service. Forest insect and disease aerial survey data, Rocky Mountain Region. Available online: https://www.fs.usda.gov/detail/r2/forest-grasslandhealth/?cid=fsbdev3_041629 (accessed on 29 August 2018).
  26. USDA Natural Resources Conservation Service. National Range and Pasture Handbook; USDA Natural Resources Conservation Service: Washington, DC, USA, 2003.
  27. U.S. Geological Survey. National Elevation Dataset (NED), 2nd ed.; U.S. Geological Survey: Sioux Falls, SD, USA, 2009.
  28. Bevin, K.J.; Kirkby, M.J. A physically based, variable contributing area model of basin hydrology. Hydrol. Sci. Bull. 1979, 24, 43–69. [Google Scholar] [CrossRef]
  29. Franklin, J. Enhancing a regional vegetation map with predictive models of dominant plant species in chaparral. Appl. Veg. Sci. 2002, 5, 135–146. [Google Scholar] [CrossRef]
  30. Parolo, G.; Rossi, G.; Ferrarini, A. Toward improved species niche modelling: Arnica montana in the Alps as a case study. J. Appl. Ecol. 2008, 45, 1410–1418. [Google Scholar] [CrossRef]
  31. Evans, J.S.; Cushman, S.A. Gradient modeling of conifer species using random forests. Land. Ecol. 2009, 24, 673–683. [Google Scholar] [CrossRef]
  32. Dirnbock, T.; Hobbs, R.J.; Lambeck, R.J.; Caccetta, P.A. Vegetation distribution in relation to topographically driven processes in southwestern Australia. Appl. Veg. Sci. 2002, 5, 147–158. [Google Scholar] [CrossRef]
  33. Bader, M.Y.; Ruijten, J.J.A. A topography based model of forest cover at the alpine tree line in the tropical Andes. J. Biogeogr. 2008, 35, 711–723. [Google Scholar] [CrossRef]
  34. Burnham, K.P.; Anderson, D.R. Model Selection And Multimodel Inference: A Practical Information-Theoretic Approach; Springer: New York, NY, USA, 1998. [Google Scholar]
  35. Amoroso, M.M.; Coates, K.D.; Astrup, R. Stand recovery and self-organization following large-scale mountain pine beetle induced canopy mortality in northern forests. For. Ecol. Manag. 2013, 310, 300–311. [Google Scholar] [CrossRef]
  36. Binkley, D. Age distribution of aspen in Rocky Mountain National Park, USA. For. Ecol. Manag. 2008, 255, 797–802. [Google Scholar] [CrossRef]
  37. Romme, W.H.; Turner, M.G.; Wallace, L.L.; Walker, J.S. Aspen, elk, and fire in northern Yellowstone National Park. Ecology 1995, 76, 2097–2106. [Google Scholar] [CrossRef]
  38. Relva, M.A.; Westerholm, C.L.; Kitzberger, T. Effects of introduced ungulates on forest understory communities in northern Patagonia are modified by timing and severity of stand mortality. Plant Ecol. 2009, 201, 11–22. [Google Scholar] [CrossRef]
  39. Griffin, J.M.; Turner, M.G. Changes to the N cycle following bark beetle outbreaks in two contrasting conifer types. Oecologia 2012, 170, 551–565. [Google Scholar] [CrossRef] [PubMed]
  40. Stone, W.E.; Wolfe, M.L. Response of understory vegetation to variable tree mortality following a mountain pine beetle epidemic in lodgepole pine stands in northern Utah. Vegetatio 1996, 122, 1–12. [Google Scholar] [CrossRef] [Green Version]
  41. Ripple, W.J.; Larsen, E.J. The role of postfire coarse woody debris in aspen regeneration. West. J. Appl. For. 2001, 16, 61–64. [Google Scholar]
  42. De Chantal, M.; Granstrom, A. Aggregations of dead wood after wildfire act as browsing refugia for seedlings of Populus tremula and Salix caprea. For. Ecol. Manag. 2007, 250, 3–8. [Google Scholar] [CrossRef]
  43. Forester, J.D.; Anderson, D.P.; Turner, M.G. Do high-density patches of coarse wood and regenerating saplings create browsing refugia fore aspen (Populus tremuloides Michx.) in Yellowstone National Park (USA)? For. Ecol. Manag. 2007, 253, 211–219. [Google Scholar] [CrossRef]
  44. Bates, P.C.; Blinn, C.R.; Alm, A.A. A survey of the harvesting histories of some poorly regenerated aspen stands in northern Minnesota. In Proceedings of the Aspen Symposium ’89; Adams, R.D., Ed.; USDA Forest Service: St. Paul, MN, USA, 1990; pp. 221–230. [Google Scholar]
  45. Dudley, M.M.; Burns, K.S.; Jacobi, W.R. Aspen mortality in the Colorado and southern Wyoming Rocky Mountains: Extent, severity, and causal factors. For. Ecol. Manag. 2015, 353, 240–259. [Google Scholar] [CrossRef] [Green Version]
  46. Stahelin, R. Factors influencing natural restocking of high altitude burns by coniferous trees in the central Rocky Mountains. Ecology 1943, 24, 19–30. [Google Scholar] [CrossRef]
Figure 1. Understory stem density for unbrowsed aspen, browsed aspen, and lodgepole pine in the sampled stands. The bars show medians; the whiskers show the 1st–3rd quartile range. Data include all stems up to 2.5 cm in diameter at breast height.
Forests 09 00525 g001
Figure 2. Distribution of proportion of suckers browsed across stands (n = 33).
Forests 09 00525 g002
Figure 3. Height and age relationship for unbrowsed (solid line) and browsed (dotted line) aspen suckers <2.5 cm dbh. The relationship was moderately strong for unbrowsed stems (R2 = 0.29, P < 0.01) but weak for browsed stems (R2 = 0.07, P < 0.01). Data include 41 unbrowsed and 109 browsed stems. Symbols appear darker when multiple values are in nearly the same position.
Forests 09 00525 g003
Table 1. Summary of basal area and understory tree density in sampled stands (n = 33).
MedianMinimumMaximum
Basal area m2 ha1
LIVE 7.61.137.0
Pine 3.30.022.9
Aspen 2.21.114.2
Fir+Spruce 0.00.02.2
DEAD 21.84.434.8
PineStanding20.73.334.8
Down3.30.024.0
AspenStanding2.20.010.5
Down2.20.013.1
Fir + SpruceStanding0.00.00.9
Down0.00.00.0
Density ha1
UNDERSTORY (Stems <2.5 cm diameter at breast height)
Pine 55607040
Aspen 6175116726861
Fir + Spruce 6203520
Table 2. Results of linear regression analysis of regeneration density (aspen and lodgepole pine), height (aspen), and independent variables. Independent variables are listed in order of the strength of their relationship with the response variable (as measured by adjusted R2). All independent variables shown had a significant (α < 0.1) Spearman’s rank correlation with the response variable. Signs (+ or −) indicate if regression relationship is positive or negative. All variables met assumptions of normality; all variables were log-transformed except for mean annual precipitation and wild browsing index. MPB: mountain pine beetle.
Response VariableIndependent Variable+/−Adjusted R2P
Mean aspen densityDown lodgepole pine0.220.0038
Mean annual maximum temperature0.200.0051
Live aspen0.110.0323
Dead and down aspen0.110.0351
Mean annual precipitation+0.070.0791
Mean lodgepole densityLive lodgepole pine basal area+0.230.0027
Topographic Wetness Index+0.110.0349
Time since onset of MPB epidemic0.020.2206
Down lodgepole pine−0.020.5497
Mean aspen sucker heightDown lodgepole pine+0.49<0.0001
Maximum temperature+0.38<0.0001
Wild animal density0.270.0012
Mean annual precipitation0.230.0027
Time since onset of MPB epidemic+0.060.0970
Maximum aspen sucker heightDown lodgepole pine+0.39<0.0001
Mean annual precipitation0.280.0012
Mean annual maximum temperature+0.270.0010
Wild animal density0.170.0109
Topographic Wetness Index0.120.0287
Live aspen basal area0.090.0483
MPB-killed basal area0.060.0882
Table 3. Results of linear regression analysis between proportion of suckers browsed (in each stand) and independent variables. All independent variables shown had a significant (α < 0.1) Spearman’s rank correlation with proportion of suckers browsed. Signs (+ or −) indicate if regression relationship is positive or negative. All variables met assumptions of normality. Proportion of suckers browsed was transformed with an arcsine square-root transformation. All independent variables were log-transformed except for wild browsing index.
Response VariableIndependent Variable+/−Adjusted R2P
Proportion of suckers browsedDown lodgepole pine basal area0.46<0.0001
MPB-killed basal area+0.250.0027
Wild animal density+0.160.0111
Live aspen basal area−0.030.9437

