Unravelling the Functional Diversity of the Soil Microbial Community of Chinese Fir Plantations of Different Densities

1
Research Institute of Forestry, Chinese Academy of Forestry, Beijing 100091, China
2
State Key Laboratory of Tree Genetics and Breeding, Chinese Academy of Forestry, Beijing 100091, China
3
Key Laboratory of Tree Breeding and Cultivation of State Forestry Administration, Chinese Academy of Forestry, Beijing 100091, China
4
Research Institute of Forest Ecology, Environment and Protection, Chinese Academy of Forestry, Beijing 100091, China
*
Author to whom correspondence should be addressed.
Forests 2018, 9(9), 532; https://0-doi-org.brum.beds.ac.uk/10.3390/f9090532
Submission received: 26 July 2018
/
Revised: 17 August 2018
/
Accepted: 30 August 2018
/
Published: 31 August 2018
(This article belongs to the Section Forest Ecology and Management)
Abstract
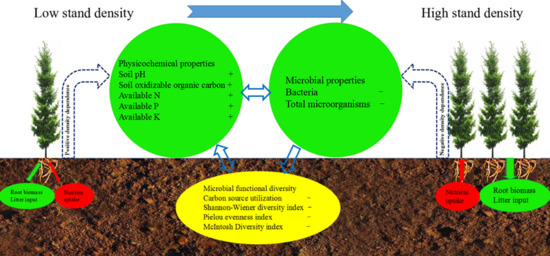
:The structure and function of forest ecosystems are directly or indirectly affected by their stand density. However, what effect the density of Chinese fir plantations has on the functional diversity of the soil microbial community remains unclear. The microbial metabolic functional diversity of soils sampled at the topsoil (0–20 cm) of 35-year-old Chinese fir plantations of five initial densities (D1: 1667 stems∙hm−2, D2: 3333 stems∙hm−2, D3: 5000 stems∙hm−2, D4: 6667 stems∙hm−2, and D5: 10,000 stems∙hm−2) was studied by using Biolog ECO technology. The results showed that the soil pH, oxidizable organic carbon (SOOC), available N (AN), available P (AP), and available K (AK) contents all showed a gradual increase from D1 to D4 and a decrease from D4 to D5, while the number of culturable bacteria and total microorganisms, the average well color development (AWCD) values for the single carbon substrate and six types of carbon sources used by the microbial community, as well as the Shannon-Wiener diversity index (H’), Pielou evenness index (J), and McIntosh Diversity Index (U), were the opposite, suggesting that low-densities favored C and N mineralization and the nutrient cycle. The density of Chinese fir plantations had a significant effect on the use of carbohydrates, amino acids, carboxylic acids, and phenolic acids by the soil microbial community, but it had no significant effect on the use of polymers (p < 0.05). Principal component analysis (PCA) revealed that carbohydrates, polymers, and phenolic acids were sensitive carbon sources that caused differences in the metabolic functions of soil microbial communities in Chinese fir plantations. Redundancy analysis (RDA) showed that physicochemical factors have a significant influence on the metabolic function of soil microbial communities (RDA1 and RDA2 explained >85% variance). The changes in density affected the soil physicochemical properties, the composition, and the metabolic functional diversity of microbial communities in Chinese fir plantations, which is certainly useful for the stand density regulation of Chinese fir plantations.
1. Introduction
As one of the important compositions in the forest soil ecosystem, soil microorganisms play an important role in the degradation of organic matter, nutrient conversion, and energy flow [1,2]. In addition, soil microorganisms can serve as indicators of soil health [3], on-site tree planting conditions, and soil toxicology [4], as soil microbes are most sensitive to changes in the soil microenvironment [5,6]. Although many studies of soil microbes have been conducted, the functions of most micro-organisms are still unclear, because only about 1% of micro-organisms can be isolated, cultured, and identified [7].
In recent years, Biolog ECO technology has been widely used to determine the functional diversity of different types of soil microbial communities [8]. This technique is based on the principle that culturable microbial communities [9] use a carbon substrate in a microplate to develop a color reaction with a redox dye to obtain the physiological characteristics of the microbial community [10] and functional diversity [11].
Stand density not only directly affects plant growth [12], but also indirectly affects the composition of undergrowth vegetation and the function of the soil ecosystem by changing the canopy density and root distribution [13,14]. Several studies have reported that stand density may be an important factor in plant-soil feedback [15,16,17,18]. Stand density can affect nutrient cycling in forest ecosystems. For example, when the stand density of Larix olgensis was 840 stems·hm−2, it was more conducive to increasing the soil nutrient content and maintaining the soil fertility [19]. When the density of Pinus massoniana was 1500 stems·hm−2, the soil organic matter, total nitrogen, and total phosphorus content were higher than the other densities, and soil acidification was obvious [20]. Barron-Gafford et al. [21] reported that the nitrogen concentration of the trunk, fine roots, and leaves showed a downward trend with the increase of the density of Pinus taeda and Pinus elliottii.
Chinese fir (Cunninghamia lanceolata) plantations, with a planting area of 8.95 million hectares and a stock volume of 625 million cubic meters, represent a typical forest ecosystem in subtropical China [22], which is extremely important for environmental greening, soil and water conservation, and ecological construction [23,24]. Some studies have shown that the decline in soil fertility of Chinese fir plantations was related to an excessive afforestation density [25]. The content of hydrolyzed nitrogen and total calcium increased first and then decreased with the increase of density, while the contents of total phosphorus, total potassium, and available potassium were the opposite in Chinese fir plantations [26].
To date, the effect of the stand density of Chinese fir plantations on the composition and functional activity of the soil microbial community is still unknown. Therefore, the purpose of this study was to analyze the metabolic functional diversity of density-driven soil microbial communities using Biolog ECO technology, which is useful for exploring the changes in soil biotic and abiotic properties driven by the density and the management of forest stands of Chinese fir plantations.
2. Materials and Methods
2.1. Profile of the Study Site and Soil Collection
The experimental area was situated in Weimin Forest Farm (117°43′ E, 27°05′ N), Fujian Province, China. The region is characterized by a subtropical monsoon climate with a mean annual temperature, precipitation, and relative humidity of 19.4 °C, 1712 mm, and 82%, respectively. In the spring of 1982, the experimental forest was planted with afforestation, and three blocks were designed by randomized block experiments. Each block consisted of five densities—2 m × 3 m (D1), 2 m × 1.5 m (D2), 2 m × 1 m (D3), 1 m × 1.5 m (D4), and 1 m × 1 m (D5) (that is, D1 with a density of 1667 stems∙hm−2, D2 with a density of 3333 stems∙hm−2, D3 with a density of 5000 stems∙hm−2, D4 with a density of 6667 stems∙hm−2, and D5 with a density of 10,000 stems∙hm−2)—and an area of 600 m2 per plot. Two rows of the same density of tape were designed around each plot. The elevation of the plot is between 277–385 m; the parent material is granite; the soil type is red soil; the slope is between 25–35 degrees; and the aspect is southeast, south, and east. All the plantations in this study have not been thinned. The initial density and existing density of the sampling plots are shown in Table 1. In May 2017, eight soil cores of a 5 cm diameter and 20 cm depth, more than 1 m away from the tree position, were taken from each plot by the “S-sampling” method. Then, soil cores were mixed well, stored at 4 °C in a portable refrigerator, transported to the laboratory, and passed through a 2 mm sieve to remove plant tissues, roots, and rocks before processing. At the same time, 500 g of each sample was stored in soil bags, transported to the laboratory, air-dried, ground, sieved, and analyzed for soil physical and chemical properties.
2.2. Soil Physicochemical Analysis
Soil moisture content (SM) was measured by oven-drying samples at 105 °C for 24 h. Soil pH was determined in distilled water (1:5 soil to water). Soil bulk density (BD), organic matter (OM), total N (TN), and alkali hydrolysis N (AN) contents were determined according to soil physical and chemical analysis [27]. The OM content was determined by the K2Cr2O7-H2SO4 oxidation method [28]. Soil oxidizable organic carbon (SOOC) content was measured by KMnO4 oxidation [29]. We weighed the soil sample containing 15 mg of carbon, added 25 mL of 333 mmol/L KMnO4, shook it at 180 rpm for 1 h, and then centrifuged it at 4000 rpm for 5 min. SOOC content was determined in distilled water (1:250 supernatant to water) by spectrophotometry. TN and AN content were determined by the Kjeldahl method using a 2300 Kjeltec Analyzer Unit (FOSS, Hilleroed, Denmark) and the alkaline hydrolysis method, respectively. The extraction method for available P (AP) and available K (AK) was conducted according to the soil physical and chemical analysis [27]. AP was extracted from 2.5 g of soil using 25 mL solution of a mixture of 0.03 mol/L NH4F and 0.025 mol/L HCl. AK was extracted from 2.5 g of soil using 25 mL solution of 1 mol/L NH4Ac (pH = 7.0). The concentrations of AP and AK were quantified using an ICAP (Spectro Analytical Instruments, Spectro Arcos ICP, Kleve, Germany).
2.3. Soil Microbial Flora and Metabolic Activity Analysis
The number of culturable bacteria, fungi, and actinomycetes in the soil was determined using a dilution plate method. Bacteria, fungi and actinomycetes were isolated and cultured using beef extract peptone medium, Gao 1 medium, and Martin’s medium, respectively. The amount of the three types of micro-organisms was quantified using the following procedures: 30 g of fresh soil was added to 270 mL of sterile water, shaken, and diluted to a concentration of 10−1 g·mL−1. Then, 30 mL of the above soil suspension was added to 270 mL of sterile water, shaken, and diluted to a concentration of 10−2 g·mL−1. The above procedure was repeated and the soil suspension was diluted to a concentration of 10−3, 10−4, and 10−5 g·mL−1, respectively. A soil suspension concentration of 10−3, 10−4, and 10−5 g·mL−1 was selected for the cultivation of bacteria; 10−1, 10−2, and 10−3 g·mL−1 for fungi; and 10−2, 10−3, and 10−4 g·mL−1 for actinomycetes. The soil suspension was pipetted at a rate of 0.1 mL and coated on the corresponding medium, with three replicates for each gradient. Plates with a total of 30–300 colonies were selected for counting, with each group taking the average of the replicates. The sum of bacteria, fungi, and actinomycetes was added as the total amount of micro-organisms.
A Biolog-ECO microplate (Biolog ECO plateTM) (Biolog Inc., Hayward, CA, USA) with 31 carbon substrates was used to analyze the metabolic characteristics of the soil microbial communities. The inoculation solution for the microplate was prepared according to Classen et al. [30]. Fresh soil (equivalent to 30 g dry soil) was added to a flask containing 270 mL of sterile 0.85% NaCl solution and shaken at 180 rpm for 30 min. Next, 3 mL of the supernatant with a concentration of 10−1 g·mL−1 was pipetted into 27 mL of NaCl solution. Then, 3 mL of the solution with a concentration of 10−2 g·mL−1 was added to 27 mL of NaCl solution. We added 150 μL of the soil solution with a concentration of 10−3 g·mL−1 to each well of the ECO plate. The inoculated ECO plates were placed in a thermostatic incubator at 28 °C. The value of the wavelength at 590 nm (color + turbidity) and 750 nm (turbidity) was read on a MicroLogTM microplate reader (version 4.20.05; Biolog Inc., Hayward, CA, USA) at 24 h, 48 h, 72 h, 96 h, 120 h, 144 h, and 168 h. Microbial community metabolic activity was expressed as the value at 590 nm minus the value at 750 nm.
2.4. Statistic Analysis
The formulas for the calculation of the average well color development (AWCD) and diversity index are shown in Table 2. A one-factor analysis of variance (ANOVA) was conducted using SPSS (version 21; International Business Machines Corp., Armonk, NY, USA). Principal component analysis (PCA) was conducted by (C-R) (C is the difference of the two-band optical density of each carbon source well; R is the optical density value of the control well) at 72 h in R. Redundancy discriminate analysis (RDA) was conducted using a Bray-Curtis distance matrices plot calculated by (C-R) (C is the difference of the two-band optical density of each carbon source well; R is the optical density value of the control well) at 168 h with the ‘vegan’ package in R.
3. Results
3.1. Soil Physicochemical Properties
The density of Chinese fir plantations influenced the soil physicochemical properties (Table 3). The density from D1 to D4 of Chinese fir plantations positively affected the soil pH, SOOC, AN, AP, and AK contents, while the density from D4 to D5 was the opposite (Table 3). The pH, SOOC, AP, and AK contents in D4 were significantly higher than those in D1 and D2, while SM, BD, OM, TN, and AN contents did not significantly differ among the five densities of Chinese fir plantations (p < 0.05, Table 3).
3.2. Soil Microbial Flora and Metabolic Activities
The densities of Chinese fir plantations had significant effects on the amount of fungi and actinomycete (p < 0.05, Table 4). Fungi and actinomycete quantities were all highest in D4 and lowest in D2 (p < 0.05, Table 4). The influence of the density of Chinese fir plantations on bacteria and total microorganism quantity was not significant, although the number of these groups first decreased gradually from D1 to D4, and then increased from D4 to D5 due to density effects (p < 0.05, Table 4).
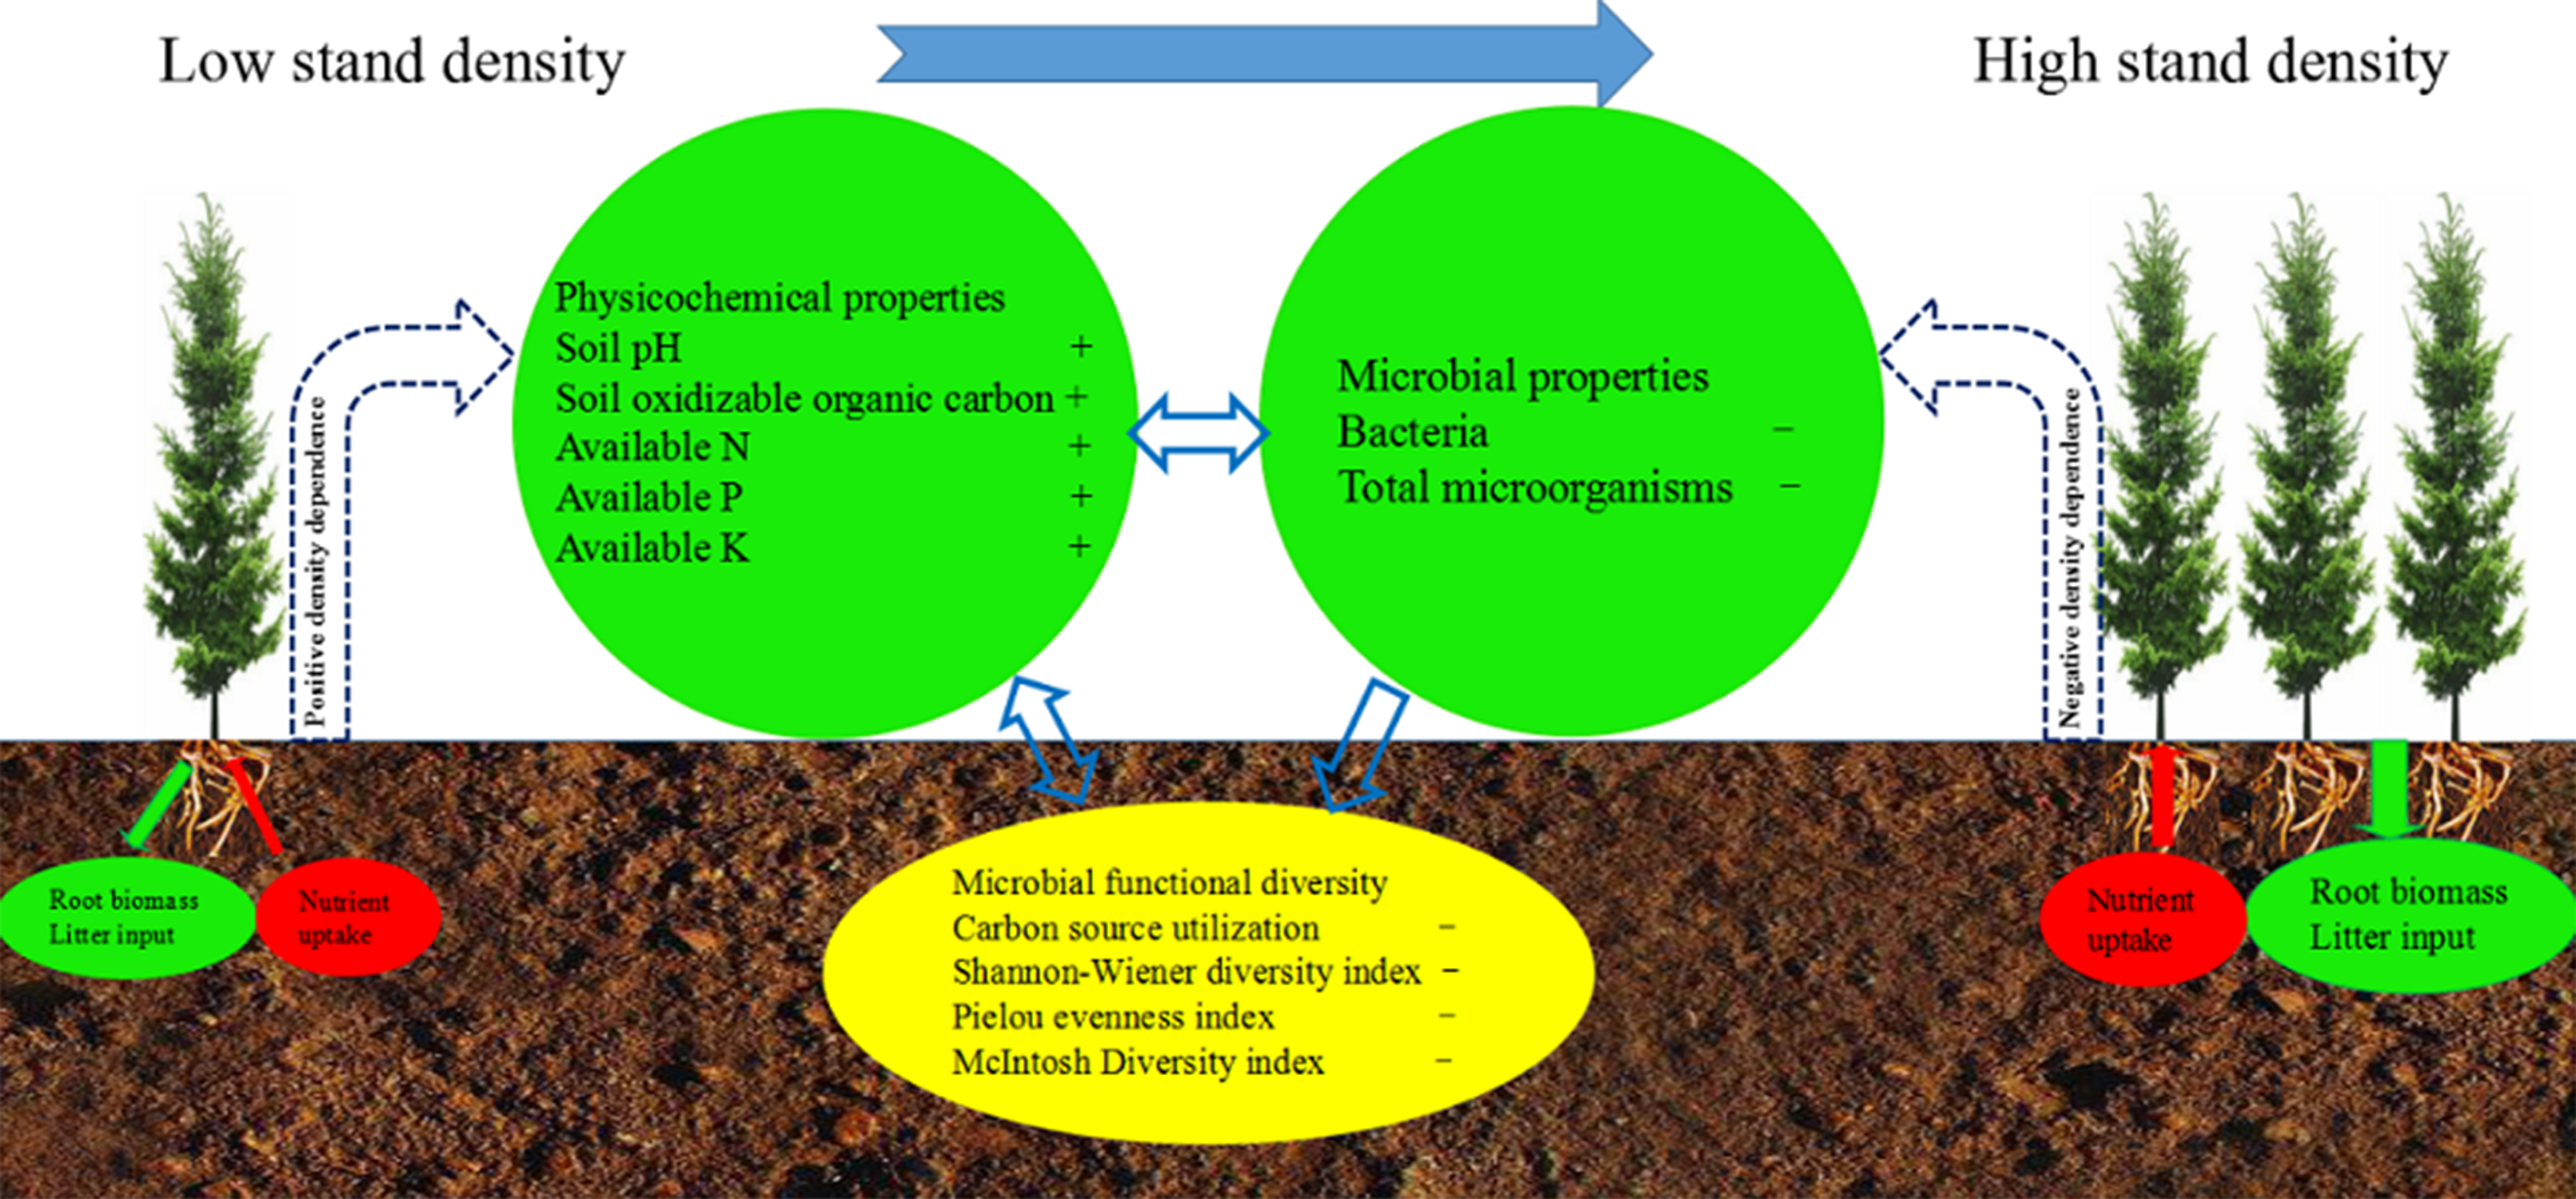
The metabolic activities of the soil microbial community in five densities all gradually increased with the increase of incubation time (Figure 1). The AWCD values in all samples were <0.1 within the first 24 h, which suggests that the soil microbial community of Chinese fir plantations of different densities had a low utilization rate of carbon substrates in this period (Figure 1), which is in line with the 0–24 h of incubation considered to be the lag phase. The slope of the curve of AWCD reached the maximum in 24–96 h, indicating that the exponential phase of the AWCD curve for the use of carbon substrates by the soil microbial community was 24–96 h of incubation, and the soil microbial community had the highest utilization rate of carbon substrates at this stage, while the utilization rate of carbon substrates by the soil microbial community showed a downward trend after 96 h of incubation (Figure 1). During the 0–168 h incubation period, the AWCD values were in the order of D1 > D2 > D3 > D5 > D4, which indicates that the metabolic capacity of the soil microbial community was in the order of D1 > D2 > D3 > D5 > D4 (Figure 1).
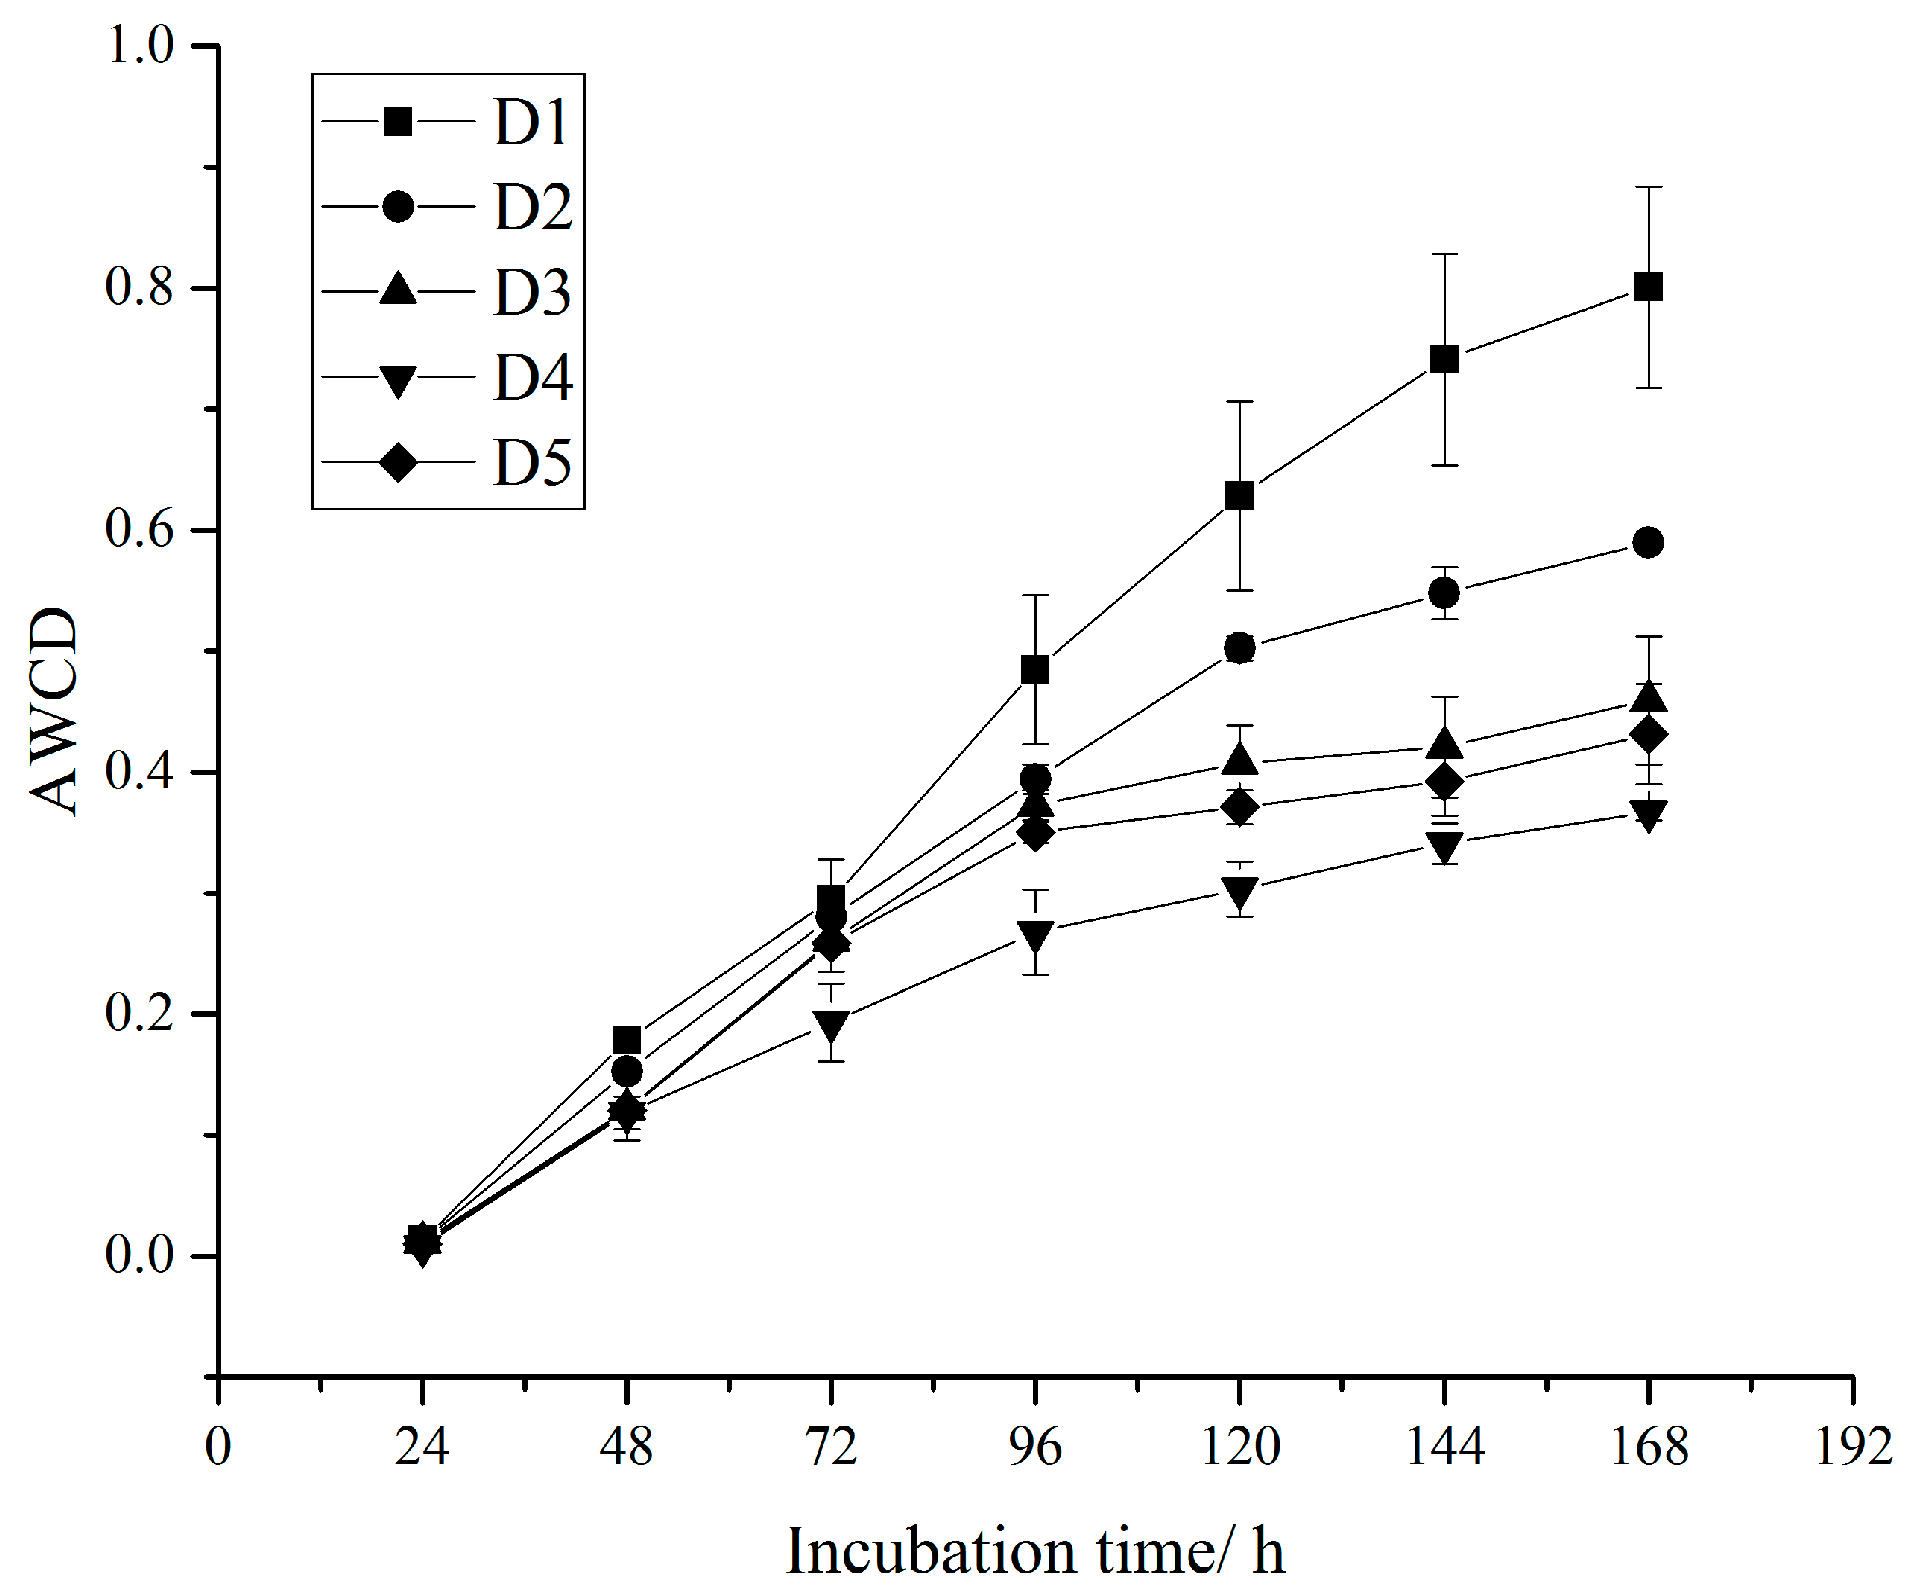
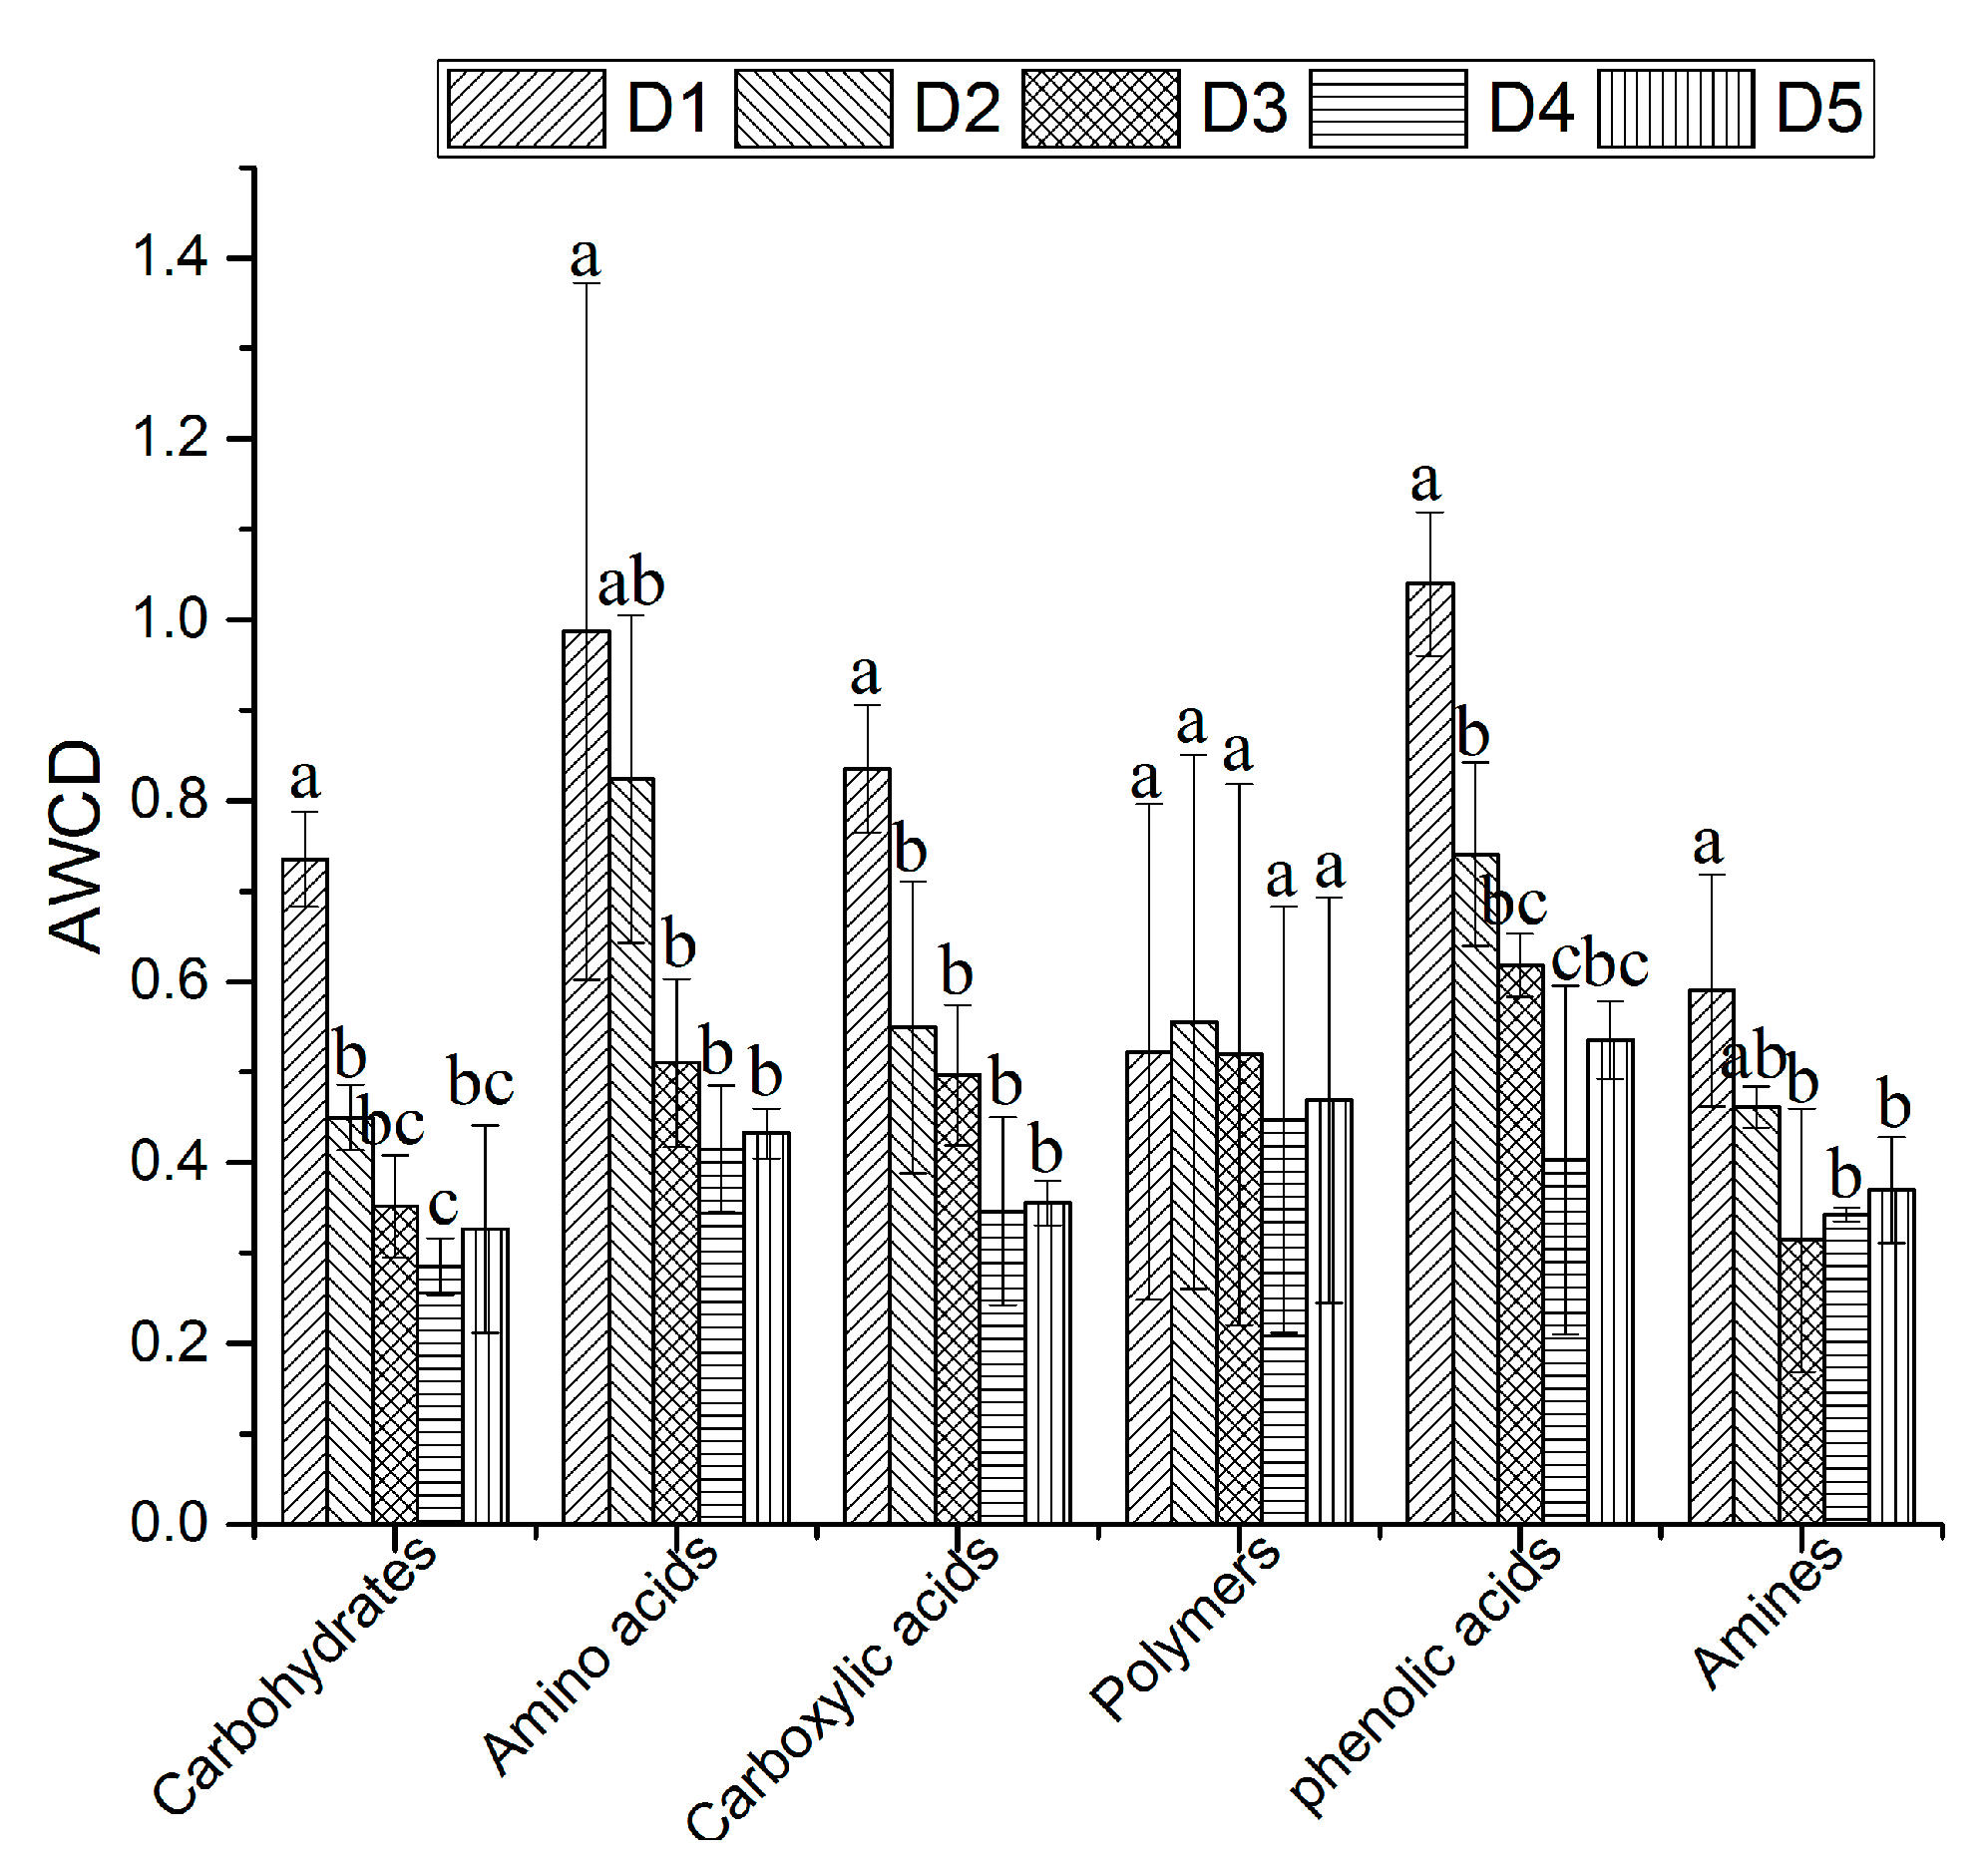
Thirty-one carbon substrates can be categorized into six types: carbohydrates, amino acids, carboxylic acids, polymers, phenolic acids, and amines [36]. The use of carbohydrates, amino acids, carboxylic acids, and phenolic acids all remarkably decreased from D1 to D4 and showed the trend D1 > D2 > D3 > D5 > D4, while the differences in the use of polymers were not statistically significant, and the use of amines first significantly decreased from D1 to D3 and then slowly increased from D3 to D5 (Figure 2). In D1, the intensity of the utilization of amino acids and phenolic acids was significantly higher than that of polymers and amines, and in D2, the intensity of the utilization of amino acids was significantly higher than that of carbohydrates and amines, while in D3, D4, and D5, the AWCD values did not differ among the six types of carbon substrates by the microbial community (p < 0.05, Figure 2).
The diversity index can reflect the richness and evenness of soil microbial communities [37]. To compare the differences in soil microbial community diversity between five densities of Chinese fir plantations, we calculated five diversity indices of each sample at 72 h. H’, J, and U in D4 were significantly lower than those in the other four densities and showed the trend D1 > D2 > D3 > D5 > D4, while D and E were similar between the five densities (p < 0.05, Table 5).
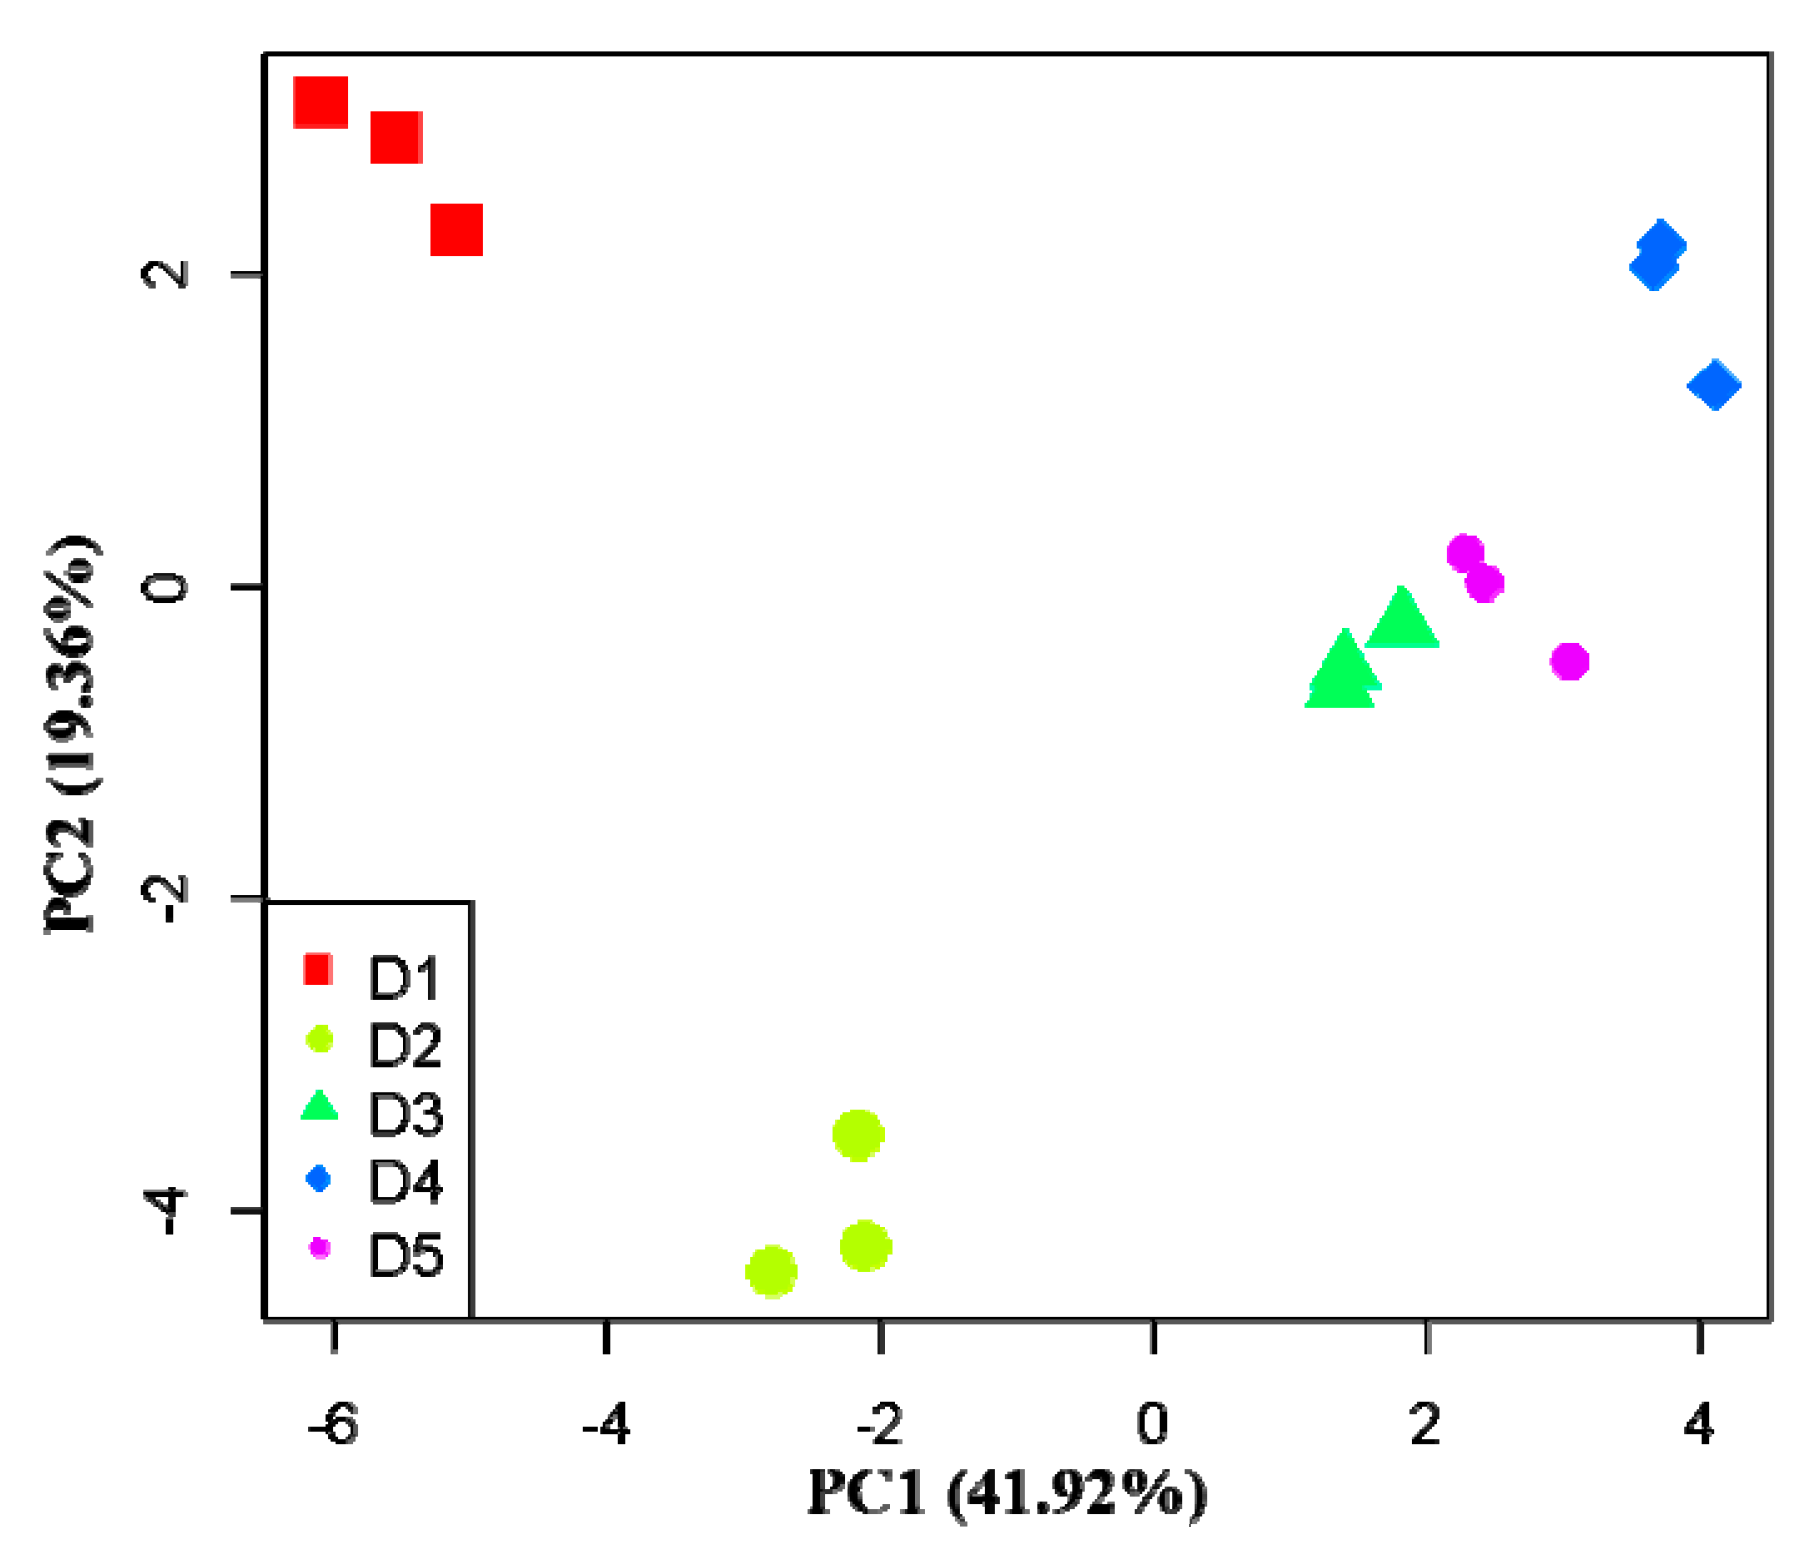
The variance contribution ratios of the first two principal components were 41.92% and 19.36%, respectively, and the cumulative contribution ratio was 61.28%, which suggests that the variation mainly comes from the first and second principal component (Figure 3). According to the carbon substrates with larger absolute load values (>1) and the order of the absolute value, in the first principal component, α-d-lactose, β-methyl-d-glucoside, α-cyclodextrin, d-xylose, glycogen, γ-hydroxybutyric acid, α-ketobutyric acid, α-d-glucose-1-phosphate, I-erythritol, 2-hydroxybenzoic acid, l-threonine, d-cellobiose, glycyl-l-glutamic acid, d-malic acid, and d,l-α-glycerol phosphate had positive correlations with PC1, whereas Tween 40, d-galacturonic acid, l-asparagine, Tween 80, d-mannitol, N-acetyl-d-glucosamine, d-glucosaminic acid, l-serine, pyruvic acid methyl ester, and 4-hydroxybenzoic acid had negative correlations with PC1 (Table 6). In the second principal component, l-serine, d-cellobiose, Tween 80, and phenylethylamine were positively correlated with PC2, while d,l-α-glycerol phosphate, N-acetyl-d-glucosamine, d-malic acid, d-glucosaminic acid, and d-mannitol were negatively correlated with PC2 (Table 6). In PC1, the average value of the absolute load value was in the order of polymers > phenolic acids > carbohydrates > amino acids > carboxylic acids > amines (Table 6). In PC2, the order was carbohydrates > amines > amino acids > polymers > carboxylic acids > phenolic acids (Table 6). This indicates that carbohydrates, polymers, and phenolic acids were sensitive carbon sources that made the ecological functions of soil microbial communities in Chinese fir plantations different. In addition, several carbon sources, including d-mannitol, N-acetyl-d-glucosamine, d-glucosaminic acid, d-cellobiose, d,l-α-glycerol phosphate, l-serine, d-malic acid, and Tween 80 were good indicators for distinguishing soil samples of Chinese fir plantations of different densities.
3.3. Effects of Physicochemical Factors on Carbon Substrates Utilization
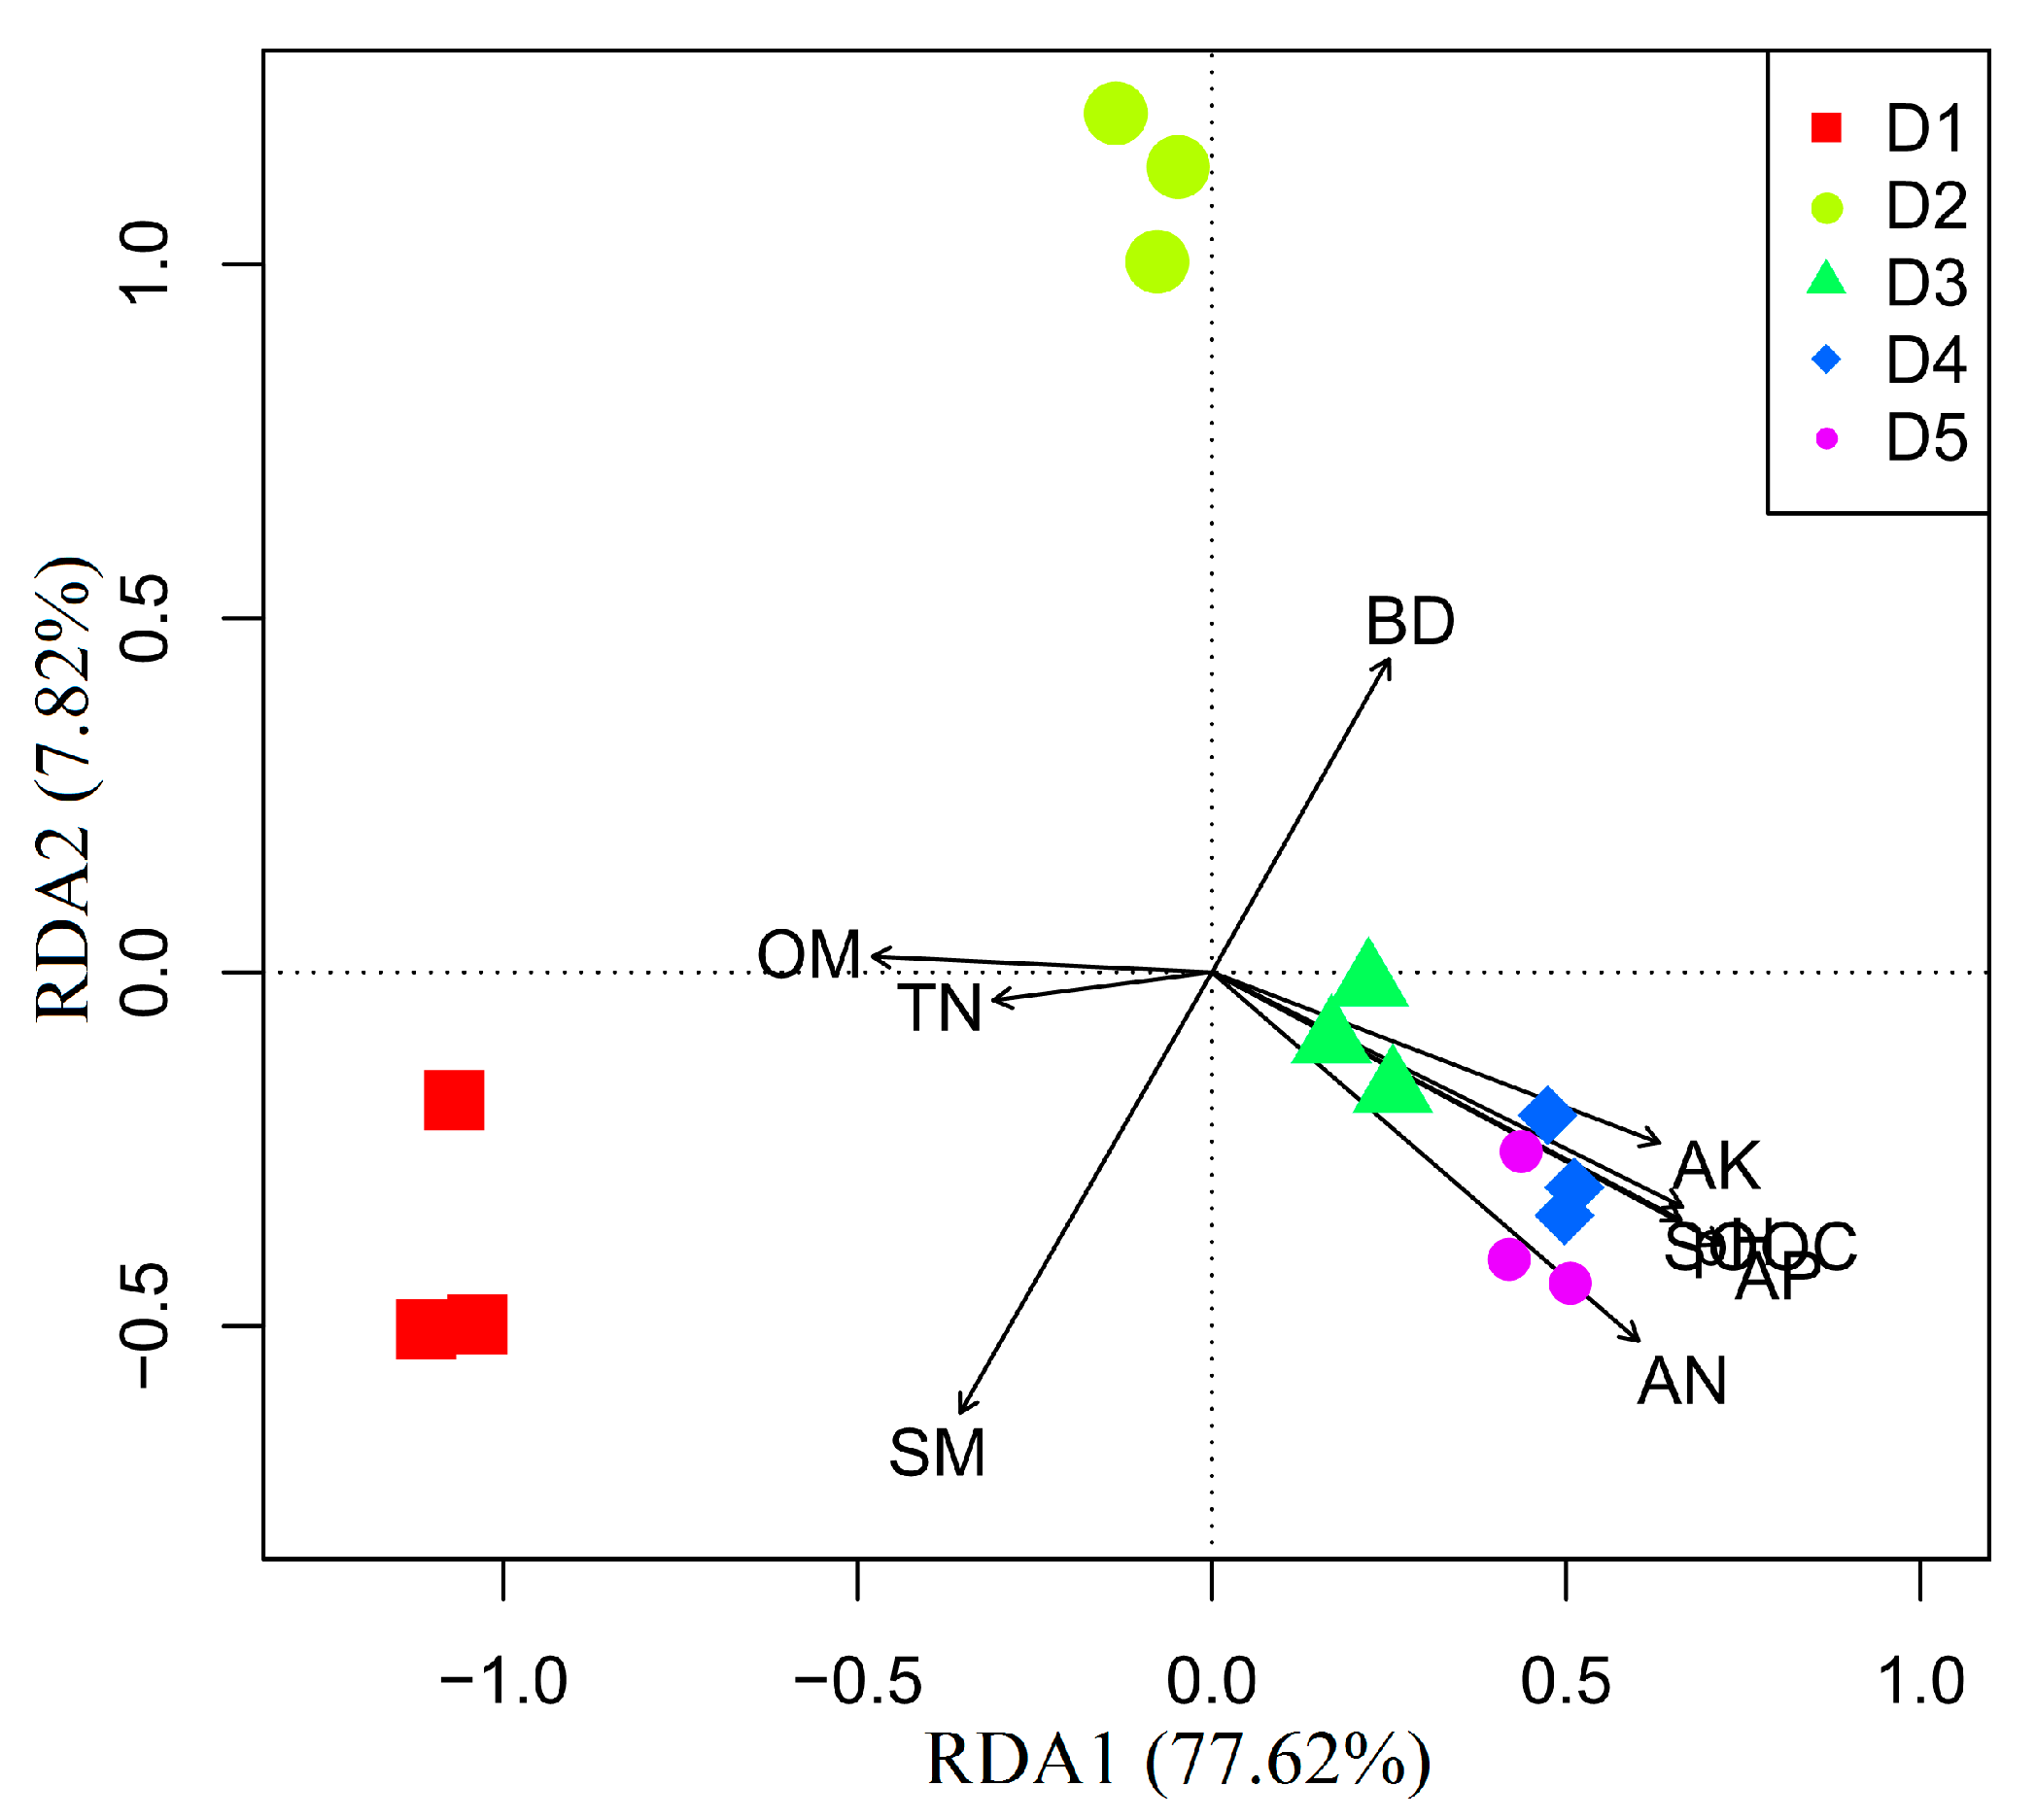
Redundancy analysis (RDA) demonstrated the density variability of Chinese fir plantations in microbial community metabolic activity, as RDA1 (77.62% of variance) and RDA2 (7.82% variance) distinguished samples collected at five density Chinese fir plantations (Figure 4). This suggests that the correlations between the AWCD values and nine soil physicochemical factors were highly significant (explained >85% of the variance, Figure 4).
4. Discussion
4.1. Shift in the Soil Physicochemical Factors
In this study, the influences of the density of Chinese fir plantations on the soil pH, SOOC, AP, and AK contents were significant, but the influences on SM, BD, OM, TN, and AN contents were the opposite (Table 3). We found that the soil pH, SOOC, AN, AP, and AK content gradually increased with the increases of the density of Chinese fir plantations from D1 to D4, which was mainly due to the fact that the litter content increases with the increase of the density, resulting in an increase in nutrient retention. Another important reason is the density-dependent death of Chinese fir, which is similar to other tree species [18]. Tong et al. [38] reported that the higher the initial density of the Chinese fir plantation, the shorter the natural sparseness that occurred, and the natural sparseness occurred in the 16th year when the initial density was 1667 plants·hm−2. As plant densities increase, the species-specific soil pathogens and intraspecific competition intensity also increase, thus reducing the nutrient uptake and viability of plant species [39,40]. Wei et al. [41] reported that plant–soil feedback had a significant negative impact on Anthoxanthum odoratum and Centaurea jacea plantation growth. However, the effect of density on OM and TN content was not significant, which was probably because OM and TN contents were not only affected by litter content, but also by multiple factors, such as soil parent material and plant absorption and reuse [20,26]. SOOC content gradually increased with the increase of density from D1 to D4, maybe because roots are densely distributed in dense plantations [26]. Interestingly, the nutrient content in D5 was lower than that in D4, which, because we investigated the existing densities of the five density plantations when sampling and found that the existing density of D5 was lower than D4 and D3 and higher than D2 and D1, suggested that soil physicochemical properties are affected by both the initial density and existing density.
4.2. Shift in Soil Microbial Flora and Metabolic Activities
Soils from Chinese fir plantations of different densities not only had distinct microbial numbers, metabolic activities, and diversities (Table 4 and Table 5), but also had distinct carbon substrate utilization patterns based on Biolog ECO plate results (Figure 1, Figure 2 and Figure 3). Under normal circumstances, the lag phase of the AWCD value curve of the soil microbial community using carbon substrates is 0–24 h of incubation, and the exponential phase is 24–72 h of incubation; the AWCD values of most samples show near saturation after 192 h incubation [42]. Our results were similar to this conclusion. In the present study, we found that the intensities of the utilization of carbohydrates, amino acids, carboxylic acids, and phenolic acids were all in the order of D1 > D2 > D3 > D5 > D4 (Figure 2), indicating that low-density Chinese fir plantations favored C, N, and P mineralization [43], which may be due to the fact that the high planting density of Chinese fir plantations reduces the utilization efficiency of the microbial community in the soil, because a high planting density can reduce biomass production and change the resource utilization efficiency in the soil [13,14,44,45]. This is in line with micro-organisms which can control decomposition to affect nutrient availability in plant-soil feedback systems, which indirectly influences plant performance [46,47]. Although the utilization rate of six carbon sources by the soil microbial community varied with density, the utilization rate of amino acid and phenolic acid by soil microbial communities was higher than that of the other four carbon sources in five densities, suggesting that there are some dominant micro-organism species that preferentially use amino acids and phenolic acids in the soil of Chinese fir plantations.
The diversity index can be used as an indicator of microbial community richness and evenness [37]. The Shannon-Wiener diversity index (H’), Simpson dominance index (D), and McIntosh diversity index (U) were used to evaluate the abundance, dominance, and multidimensional spatial uniformity of microbial communities in soils, respectively [35,48]. In general, the greater the value of the diversity index, the higher the richness or evenness of the microbial community. However, a single diversity index cannot fully represent the functional diversity of a community [49,50]. We found that H’, J, and U were in the order of D1 > D2 > D3 > D5 > D4, but D and E were similar between the five densities (Table 5), which may indicate that the composition and relative abundance of dominant species are almost unaffected by density in each of the microbial communities, although density drives changes in the functional diversity of microbial communities. The changes in metabolic function and diversity of soil microbial communities may be caused by root exudates, soil physical and chemical properties, and the composition of understory vegetation in Chinese fir plantations of different densities [51,52,53,54].
In the PCA, the difference in functional diversity of soil microbial communities is represented by the distance between the samples: the smaller the distance, the more similar the metabolic function [55,56]. As shown in Figure 3, the distance between D3 and D5 was the smallest, and the distance between D1 and the other four density samples and between D2 and the other four density samples was larger, indicating that the functional diversity of the soil microbial community between D3 and D5 is similar, while greater differences can be seen in the functional diversity of soil microbial communities between a low density (D1 and D2) and high density (D4), which suggests that, as the density of Chinese fir plantations changed, the metabolic functions of the plantations also changed. The results showed that carbohydrates, polymers, and phenolic acids were sensitive carbon sources, which is inconsistent with the results of studies in other types of soils [37,57], probably because of the differences in soil physicochemical and environmental factors and vegetation types.
4.3. Effects of Physicochemical Factors on Functional Diversity of Microbial Community
The soil pH had an important influence on the microbial community, indirectly affecting its metabolic functions, diversity, and richness [58,59,60,61], which has been proven in Canadian forest research [61]. Several studies have shown that pH, N, and K elements can promote microbial growth and the utilization of carbon sources by the microbial community [62,63]. Our results are inconsistent with the above, which may be related to the vegetation types and the growth stage of the selected Chinese fir plantation. In this study, the selected 35-year-old Chinese fir plantation was in the mature forest stage, and the nutrient return was greater than the absorption at this stage, which led to the increase of nutrient content with density and the inconsistency with the metabolic function of the microbial community.
In this study, the values of physicochemical factors in D5 were all smaller than D4, and the values of AWCD and the diversity index were both greater than D4, which is opposite to the change of these factors from D1 to D4. This indicates that the physical and chemical properties and microbial composition and functional diversity in the soil are affected by the initial density and the existing density. However, Biolog ECO plates can only measure the functional diversity of culturable microbial communities, while cultivable micro-organisms only account for about 1% of the total microbial population. Therefore, functional diversity based on Biolog ECO analysis does not necessarily fully represent the functional diversity of the microbial community. Despite this, our research provides a theoretical basis for exploring the density-driven changes of soil microbial communities in Chinese fir plantations, at least in mature forest stages (>30 years old).
5. Conclusions
This study revealed that the density of Chinese fir plantations can directly or indirectly drive changes in soil physical and chemical properties, the quantity of cultivatable micro-organisms, and the community functional diversity in topsoil (0–20 cm), which provides more theoretical support for the fact that the forest density is a factor that causes plant-soil feedback. The results showed that the soil pH, SOOC, AN, AP, and AK contents positively responded to changes in density from D1 to D4 and negatively responded to density from D4 to D5 when the Chinese fir plantation was at least 35 years old, while the number of culturable bacteria and total micro-organisms; the intensity of utilization of carbon sources by culturable microbial communities; and the H’, J, and U diversity index were the opposite. These results indicate that low-density (D1 and D2) Chinese fir plantations are more conducive to the mineralization of C and N in the soil during the mature forest stage (>30 years old). To maintain a good soil ecosystem function, we suggest that the stand density of Chinese fir plantations should be controlled below 2800 stems·hm−2, at least in the mature forest stage. This may suggest that the planting of the stand may have an optimum density for soil fertility maintenance and rotation, and that a high density in ecosystems where plant-soil feedback is caused by density not only destroys the maintenance of soil fertility, but also reduces plant survival and nutrient uptake. However, this study also needs to be confirmed in other stages of growth of Chinese fir plantations, as the mature forest stage does not necessarily represent the young and middle-aged forest stages.
Author Contributions
Conceptualization, C.W. and R.J.; Methodology, C.W. and R.J.; Software, C.W. and L.X.; Validation, C.W., L.X., Y.D., Y.W., and R.J.; Formal Analysis, C.W. and L.X.; Investigation, C.W., Y.D., and R.J.; Resources, C.W. and R.J.; Data Curation, C.W.; Writing-Original Draft Preparation, C.W.; Writing-Review & Editing, C.W., L.X., and R.J.; Visualization, C.W.; Supervision, R.J.; Project Administration, C.W.; Funding Acquisition, R.J.
Funding
This research was funded by State Key Research Development Program of China (Grant number 2016YFD0600300). This study is a part of the project entitled “Study on efficient cultivation technology of Chinese fir plantation”.
Acknowledgments
This work is supported by The National Key Research and Development Program of China (2016YFD0600300).
Conflicts of Interest
The authors declare no conflict of interest.
References
- Mummey, D.L.; Stahl, P.D.; Buyer, J.S. Microbial biomarkers as an indicator of ecosystem recovery following surface mine reclamation. Appl. Soil Ecol. 2002, 21, 251–259. [Google Scholar] [CrossRef]
- Zhang, Y.Y.; Qu, L.Y.; Chen, L.D. An Amendment on Information Extraction of Biolog EcoPlateTM. Microbiology 2009, 36, 1083–1091. [Google Scholar]
- Harris, J.A. Measurements of the soil microbial community for estimating the success of rest oration. Eur. J. Soil Sci. 2003, 54, 801–808. [Google Scholar] [CrossRef]
- Wu, C.W.; Zhao, L.P. Technologies on soil microbiology diversity. Chin. Agric. Sci. Bull. 2011, 27, 231–235. [Google Scholar]
- Carter, M.R.; Gregorich, E.G.; Angers, D.A.; Beare, M.H.; Sparling, G.P.; Wardle, D.A.; Voroney, R.P. Interpretation of microbial biomass measurements for soil quality assessment in humid temperate regions. Can. J. Soil Sci. 1999, 79, 507–520. [Google Scholar] [CrossRef] [Green Version]
- Winding, A.; Hund-Rinke, K.; Rutgers, M. The use of microorganisms in ecological soil classification and assessment concepts. Ecotoxicol. Environ. Saf. 2005, 62, 230–248. [Google Scholar] [CrossRef] [PubMed]
- Crecchio, C.; Gelsomino, A.; Ambrosoli, R.; Minati, J.L.; Ruggiero, P. Functional and molecular responses of soil microbial communities under differing soil management practices. Soil Biol. Biochem. 2004, 36, 1873–1883. [Google Scholar] [CrossRef]
- Oren, A.; Steinberger, Y. Catabolic profles of soil fungal communities along a geographic climatic gradient in Israel. Soil Biol. Biochem. 2008, 40, 2578–2587. [Google Scholar] [CrossRef]
- Smalla, K.; Wachtendorf, U.; Heuer, H.; Liu, W.T.; Forney, L. Analysis of biolog gn substrate utilization patterns by microbial communities. Appl. Environ. Microbiol. 1998, 64, 1220–1225. [Google Scholar] [PubMed]
- Garland, J.L.; Mills, A. Classification and characterisation of heterotrophic microbial communities on the basis of patterns of community-level sole-carbon-source utilization. Appl. Environ. Microbiol. 1991, 57, 2351–2359. [Google Scholar] [PubMed]
- Zak, J.C.; Willig, M.R.; Moorhead, D.L.; Wildman, H.G. Functional diversity of microbial communities: A quantitative approach. Soil Biol. Biochem. 1994, 26, 1101–1108. [Google Scholar] [CrossRef]
- Ji, L.B.; Shu, D.W. Influence of stand density of cunninghamia lanceolate on stand growth. For. Inv. Plan. 2017, 42, 135–137. [Google Scholar]
- Chen, J.; Duan, B.L.; Wang, M.L.; Korpelainen, H.; Li, C.Y. Intra- and inter-sexual competition of Populus cathayana under different watering regimes. Funct. Ecol. 2014, 28, 124–136. [Google Scholar] [CrossRef]
- Dybzinski, R.; Farrior, C.E.; Ollinger, S.; Pacala, S.W. Interspecific vs intraspecific patterns in leaf nitrogen of forest trees across nitrogen availability gradients. New Phytol. 2013, 200, 112–121. [Google Scholar] [CrossRef] [PubMed] [Green Version]
- Bell, T.; Freckleton, R.P.; Lewis, O.T. Plant pathogens drive density-dependent seedling mortality in a tropical tree. Ecol. Lett. 2006, 9, 569–574. [Google Scholar] [CrossRef] [PubMed]
- Terborgh, J. Enemies maintain hyperdiverse tropical forests. Am. Nat. 2012, 179, 303–314. [Google Scholar] [CrossRef] [PubMed]
- Kos, M.; Veendrick, J.; Bezemer, T.M. Local variation inconspecific plant density influences plant-soil feedback in a natural grassland. Basic Appl. Ecol. 2013, 14, 506–514. [Google Scholar] [CrossRef]
- Comita, L.S.; Queenborough, S.A.; Murphy, S.J.; Eck, J.L.; Xu, K.; Krishnadas, M.; Beckman, N.; Zhu, Y. Testing predictions of the Janzen–Connell hypothesis: A meta-analysis of experimental evidence for distance-and density-dependent seed and seedling survival. J. Ecol. 2014, 102, 845–856. [Google Scholar] [CrossRef] [PubMed]
- Liu, L.; Wang, H.Y.; Yang, X.J.; Li, X.; Ren, L.N. Soil organic carbon and nutrients in natural Larix olgensis at different stand densities. J. Northeast For. Univ. 2013, 41, 51–55. [Google Scholar]
- Zhao, R.D.; Fan, J.B.; He, Y.Q.; Song, C.L.; Tu, R.F.; Tan, B.C. Effects of stand density on soil nutrients and enzyme activity under Pinus massoniana forest. Soils 2012, 44, 297–301. [Google Scholar]
- Barron-Gafford, G.A.; Will, R.E.; Burkes, E.C. Nutrient concentrations and contents and their relation to stem growth of intensively managed Pinus taeda and Pinus elliottii stands of different planting densities. For. Sci. 2003, 49, 291–300. [Google Scholar]
- Chen, H. Phosphatase activity and P fractions in soils of an 18-year-old Chinese fir (Cunninghamia lanceolata) plantation. For. Ecol. Manag. 2003, 178, 301–310. [Google Scholar] [CrossRef]
- Chen, H.H. Effects of density regulation on undergrowth vegetation and soil fertility of Cunninghamia lanceolata plantation. Sci. Silvae Sin. 2017, 28, 88–90. [Google Scholar]
- Tian, D.L.; Xiang, W.H.; Chen, X.Y.; Yan, W.D.; Fang, X.; Kang, W.X.; Dan, X.W.; Peng, C.H.; Peng, Y.Y. A long-term evaluation of biomass production in first and second rotations of Chinese fir plantations at the same site. Forestry 2011, 84, 411–418. [Google Scholar] [CrossRef] [Green Version]
- Fu, X.; Wang, J.; Di, Y.; Wang, H. Differences in fine-root biomass of trees and understory vegetation among stand types in subtropical forests. PLoS ONE 2015, 10, e0128894. [Google Scholar] [CrossRef] [PubMed]
- Du, H.L. Density Effect of Soil Nutrientand Stoichiometry of Cunninghamia lanceolata Plantationsin Naxi, Sichuan Province; Chinese Academy of Forestry: Beijing, China, 2017; pp. 15–16. [Google Scholar]
- Institute of Soil Science, Chinese Academy of Sciences. Soil Physical and Chemical Analysis; Shanghai Scientific & Technical Publishers: Shanghai, China, 1978. [Google Scholar]
- Nelson, D.W.; Sommers, L.E. Total carbon, organic carbon and organic matter. In Methods of Soil Analysis; Page, A.L., Miller, R.H., Keeney, D.R., Eds.; America Society of Agronomy: Madison, WI, USA, 1982; pp. 539–579. ISBN 0891188266. [Google Scholar]
- Tirol-Padre, A.; Ladha, J.K. Assessing the reliability of permanganate-oxidizable carbon as an index of soil labile carbon. Soil Sci. Soc. Am. J. 2004, 68, 969–978. [Google Scholar] [CrossRef]
- Classen, A.T.; Boyle, S.I.; Haskins, K.E.; Overby, S.T.; Hart, S.C. Community-level physiological profiles of bacteria and fungi: Plate type and incubation temperature influences on contrasting soils. FEMS Microbiol. Ecol. 2003, 44, 319–328. [Google Scholar] [CrossRef]
- Degens, B.P.; Schipper, L.A.; Sparling, G.P.; Vukovic, M.V. Decreases in organic C reserves in soils can reduce the catabolic diversity of soil microbial communities. Soil Biol. Biochem. 2000, 32, 189–196. [Google Scholar] [CrossRef]
- Shannon, C.E. A mathematical theory of communication. Bell Syst. Tech. J. 1948, 27, 379–423. [Google Scholar] [CrossRef]
- Pielou, E.C. Mathematical ecology. J. Anim. Ecol. 1975, 47, 347–351. [Google Scholar]
- Simpson, E.H. Measurement of diversity. Nature 1949, 163–688. [Google Scholar] [CrossRef]
- Yang, Y.H.; Yao, J.; Hu, X.M. Effect of pesticide pollution against functional microbial diversity in soil. J. Microbiol. 2000, 20, 23–25. [Google Scholar]
- Choi, K.H.; Dobbs, F.C. Comparison of two kinds of Biolog micro-plates (GN and ECO) in their ability to distinguish among aquatic microbial communities. J. Microbiol. Meth. 1993, 36, 203–213. [Google Scholar] [CrossRef]
- Lu, S.B.; Zhang, Y.J.; Chen, C.R.; Xu, Z.H.; Guo, X.M. Analysis of functional differences between soil bacterial communities in three different types of forest soils based on biology fingerprint. Acta Pedol. Sin. 2013, 50, 618–623. [Google Scholar]
- Tong, S.Z.; Sheng, W.T.; Zhang, J.G. Study on density effect of Chinese Fir plantation. For. Res. 2002, 15, 66–75. [Google Scholar]
- Bagchi, R.; Swinfield, T.; Gallery, R.E.; Lewis, O.T.; Gripenberg, S.; Narayan, L.; Freckleton, R.P. Testing the JanzenConnell mechanism: Pathogens cause overcompensating density dependence in a tropical tree. Ecol. Lett. 2010, 13, 1262–1269. [Google Scholar] [CrossRef] [PubMed]
- Dudenhöffer, J.H.; Ebeling, A.; Klein, A.M.; Wagg, C. Beyond biomass: Soil feedbacks are transient over plant life stages and alter fitness. J. Ecol. 2018, 106, 230–241. [Google Scholar] [CrossRef]
- Wei, X.; Bezemer, T.M.; Berendse, F. Density-dependency and plant-soil feedback: Former plant abundance influences competitive interactions between two grassland plant species through plant-soil feedbacks. Plant Soil 2018, 428, 1–12. [Google Scholar]
- Qu, Y.D.; Su, Z.Y.; Peng, G.X.; Liu, G. Soil microbial functional diversity in a montane evergreen broadleaved forest of Chebaling following the huge ice storm in south China. Acta Ecol. Sin. 2009, 29, 6156–6164. [Google Scholar]
- Tian, Q.; Wang, X.; Wang, D.; Wang, M.; Liao, C.; Yang, X. Decoupled linkage between soil carbon and nitrogen mineralization among soil depths in a subtropical mixed forest. Soil Biol. Biochem. 2017, 109, 135–144. [Google Scholar] [CrossRef]
- Mediavilla, S.; Escudero, A.; Heilmeier, H. Internal leaf anatomy and photosynthetic resource-use efficiency: Interspecific and intraspecific comparisons. Tree Physiol. 2001, 21, 251–259. [Google Scholar] [CrossRef] [PubMed]
- Wang, L.W.; Showalter, A.M.; Ungar, I.A. Effects of intraspecific competition on growth and photosynthesis of Atriplex prostrata. Aquat. Bot. 2005, 83, 187–192. [Google Scholar] [CrossRef]
- Miki, T. Microbe-mediated plant–soil feedback and its roles in a changing world. Ecol. Res. 2012, 27, 509–520. [Google Scholar] [CrossRef]
- Miki, T.; Ushio, M.; Fukui, S.; Kondoh, M. Functional diversity of microbial decomposers facilitates plant coexistence in a plant-microbe-soil feedback model. Proc. Natl. Acad. Sci. USA 2010, 107, 14251–14256. [Google Scholar] [CrossRef] [PubMed] [Green Version]
- Shen, W.S.; Lin, X.G.; Zhang, H.Y.; Yin, R.; Duan, Z.Q.; Shi, W.M. Microbial activity and functional diversity in soils used for the commercial production of cucumbers and tomatoes in polytunnel greenhouse, under different fertilization. Acta Ecol. Sin. 2008, 28, 2685–2686. [Google Scholar]
- Acosta-Martínez, V.; Dowd, S.E.; Sun, Y.; Wester, D.; Allen, V. Pyrosequencing analysis for characterization of soil bacterial populations as affected by an integrated livestock-cotton production system. Appl. Soil. Ecol. 2010, 45, 13–25. [Google Scholar] [CrossRef]
- Kennedy, A.C. Microbial diversity in agroecosystem quality. In Biodiversity in Agroecosystems; Collins, W.W., Qualset, C.O., Eds.; CRC Press: Boca Raton, FL, USA, 1999; pp. 1–17. ISBN 978-1-13802-781-7. [Google Scholar]
- Wang, S.L.; Chen, L.C.; Liao, L.P.; Huang, Z.Q. Effects of three kinds of allelochemicals on growth of Chinese fir seedlings. Chin. J. Appl. Environ. Biol. 2002, 8, 588–591. [Google Scholar]
- Wang, Q.; Shi, C.J.; Zhou, D.Q.; Liu, Y.J.; Wang, B.Y.; Sun, J.X. Promotion effect of recycled water irrigation on microorganism quantity in urban greenspace soil. J. Southwest For. Univ. 2012, 32, 12–16. [Google Scholar]
- Zhao, G.C.; Liang, J.; Dan, Y.J.; Wang, J.; Qin, Y.; Zhang, W.H. Review of studies on relationship between soil microbes and plants. J. Southwest For. Univ. 2011, 31, 83–87. [Google Scholar]
- Zhao, W.N.; Wang, Y.X.; Chen, Q.B.; Nie, L.; Yang, Y.Y. Effect of soil physical-chemical properties and microorganism quantity on enzyme activity in natural evergreen broad-leaved forest by path analysis. J. Northeast For. Univ. 2016, 44, 75–80. [Google Scholar]
- Grove, J.A.; Kautola, H.; Javadpour, S.; Moo-Young, M.; Anderson, W.A. Assessmentof changes in the microorganism community in a biofilter. Biochem. Eng. J. 2004, 18, 111–114. [Google Scholar] [CrossRef]
- Hadwin, A.M.; Del Rio, L.F.; Pinto, L.J.; Painter, M.; Routledge, R.; Moore, M.M. Microbial communities in wetlands of the Athabasca oil sands: Geneticand metabolic characterization. FEMS Microbiol. Ecol. 2006, 55, 68–78. [Google Scholar] [CrossRef] [PubMed]
- Zhen, H.; Ou, Y.Z.; Fang, Z.G.; Zhao, T.Q. Application of BIOLOG to study on soil microbial community functional diversity. Acta Pedol. Sin. 2004, 41, 456–461. [Google Scholar]
- Jonathan, Z.K.; John, A.B. High incidence of halotolerant bacteria in Pacifc hydrothermal-vent and pelagic environments. FEMS Microbiol. Ecol. 2000, 32, 249–260. [Google Scholar]
- O’Donnell, A.G.; Seasman, M.; Macrae, A.; Waite, I.; Davies, J.T. Plants and fertilizers as drivers of change in microbial community structure and function in soils. Plant Soil 2001, 232, 135–145. [Google Scholar] [CrossRef]
- Fierer, N.; Jackson, R.B. The diversity and biogeography of soil bacterial communities. Proc. Natl. Acad. Sci. USA 2006, 103, 626–631. [Google Scholar] [CrossRef] [PubMed] [Green Version]
- Lauber, C.L.; Hamady, M.; Knight, R.; Fierer, N. Pyrosequencing-based assessment of soil pH as a predictor of soil bacterial community structure at the continental scale. Appl. Environ. Microbiol. 2009, 75, 5111–5120. [Google Scholar] [CrossRef] [PubMed]
- White, C.; Tardif, J.C.; Adkins, A.; Staniforth, R. Functional diversity of microbial communities in the mixed boreal plain forest of central Canada. Soil Biol. Biochem. 2005, 37, 1359–1372. [Google Scholar] [CrossRef]
- Lu, S.; Zhang, X.; Tan, Y.; Liu, H.L.; Tian, Z.P.; Zeng, G.P. Dynamics between soil microorganism and soil character actors during Carthamus tinctorius growth periods. Pratacult. Sci. 2011, 28, 2084–2091. [Google Scholar]
Figure 1.
Average well color development (AWCD) changes during incubation of the soil microbial community in different densities.
Figure 1.
Average well color development (AWCD) changes during incubation of the soil microbial community in different densities.

Figure 2.
AWCD changes during the incubation of the soil microbial community in different densities for six types of carbon sources. The different letters on the bar represent significant differences at p < 0.05.
Figure 2.
AWCD changes during the incubation of the soil microbial community in different densities for six types of carbon sources. The different letters on the bar represent significant differences at p < 0.05.

Figure 3.
Principal analysis of the function diversity of the soil microbial community at different densities.
Figure 3.
Principal analysis of the function diversity of the soil microbial community at different densities.

Figure 4.
Redundancy analysis (RDA) results of microbial community. Abbreviations: SM: soil moisture; BD: soil bulk density; OM: soil organic matter; SOOC: soil oxidizable organic carbon; TN: total N; AN: alkali available N; AP: available P; AK: available K.
Figure 4.
Redundancy analysis (RDA) results of microbial community. Abbreviations: SM: soil moisture; BD: soil bulk density; OM: soil organic matter; SOOC: soil oxidizable organic carbon; TN: total N; AN: alkali available N; AP: available P; AK: available K.


Table 1.
Initial density and existing density of sampling plots.
| Density | D1 | D2 | D3 | D4 | D5 |
|---|---|---|---|---|---|
| Initial density (stems∙hm−2) | 1667 | 3333 | 5000 | 6667 | 10,000 |
| Existing density (stems∙hm−2) | 1578 | 2294 | 2617 | 2789 | 2461 |
Table 2.
Formulas for the calculation of average well color development (AWCD), Shannon diversity (H’), Pielou evenness index (J), Simpson dominance index (D), McIntosh diversity index (U), and McIntosh evenness (E).
Table 2.
Formulas for the calculation of average well color development (AWCD), Shannon diversity (H’), Pielou evenness index (J), Simpson dominance index (D), McIntosh diversity index (U), and McIntosh evenness (E).
| Index | Formula | Definitions | Reference |
|---|---|---|---|
| Average well color development (AWCD) | C is the difference of the two-band optical density of each carbon source well; R is the optical density value of the control well; n is the number of carbon source species in the medium (31 in this study) | [31] | |
| Shannon-Wiener diversity index (H’) | H’ = −ΣPi ln Pi | Pi represents the ratio of the absorbance in the i-th non-control well to the sum of the absorbance of all non-control wells | [32] |
| Pielou evenness index (J) | S is the total number of carbon sources utilized | [33] | |
| Simpson dominance index (D) | D = 1 − ∑Pi2. | [34] | |
| McIntosh diversity index (U) | ni is the (C − R) value of the i-th well | [35] | |
| McIntosh evenness index (E) | N is the sum of the (C − R) values | [35] |
Table 3.
Soil physicochemical characteristics in the different density soils.
| Density | pH | SM | BD | OM | SOOC | TN | AN | AP | AK |
|---|---|---|---|---|---|---|---|---|---|
| (%) | (g/cm3) | (g/kg) | (g/kg) | (g/kg) | (mg/kg) | (mg/kg) | (mg/kg) | ||
| D1 | 5.04 ± 0.02b | 35.72 ± 2.31a | 1.29 ± 0.08a | 42.80 ± 2.60a | 5.02 ± 0.63c | 1.61 ± 0.05a | 133.00 ± 4.04a | 2.09 ± 0.57b | 78.61 ± 4.23b |
| D2 | 5.07 ± 0.02b | 30.92 ± 2.62a | 1.34 ± 0.08a | 41.32 ± 2.53a | 5.27 ± 0.91c | 1.56 ± 0.04a | 129.85 ± 6.17a | 2.15 ± 0.28b | 85.96 ± 5.24ab |
| D3 | 5.29 ± 0.01ab | 32.37 ± 1.49a | 1.32 ± 0.03a | 41.55 ± 1.64a | 7.61 ± 0.16a | 1.55 ± 0.04a | 140.23 ± 7.12a | 2.53 ± 0.53ab | 109.24 ± 6.25a |
| D4 | 5.49 ± 0.02a | 34.23 ± 0.58a | 1.31 ± 0.01a | 41.53 ± 0.69a | 7.63 ± 0.84a | 1.57 ± 0.09a | 148.40 ± 4.45a | 2.68 ± 0.18a | 126.24 ± 5.28a |
| D5 | 5.27 ± 0.04ab | 32.61 ± 1.96a | 1.31 ± 0.05a | 39.47 ± 1.46a | 6.67 ± 0.61b | 1.52 ± 0.05a | 143.77 ± 10.17a | 2.67 ± 0.60a | 95.97 ± 6.24ab |
Note: Significant differences between the five density soils were determined using one-way ANOVA followed by Duncan’s multiple range test at p < 0.05. Different lowercase letters represent significant differences between different densities. The data are shown as the means ± SD (n = 3). Abbreviations: SM: soil moisture; BD: soil bulk density; OM: soil organic matter; SOOC: soil oxidizable organic carbon; TN: total N; AN: alkali available N; AP: available P; AK: available K.
Table 4.
Soil bacteria, fungi, actinomycete, and total microbe quantities in different densities.
| Density | Bacteria Quantity (107 cfu/g) | Fungi Quantity (105 cfu/g) | Actinomycete Quantity (106 cfu/g) | Total Microbe Quantity (107 cfu/g) |
|---|---|---|---|---|
| D1 | 3.13 ± 0.09a | 1.07 ± 0.05a | 2.77 ± 0.21ab | 3.42 ± 0.11a |
| D2 | 2.87 ± 0.57a | 0.57 ± 0.01c | 2.30 ± 0.08c | 3.10 ± 0.58a |
| D3 | 2.67 ± 0.50a | 0.70 ± 0.02bc | 2.40 ± 0.33bc | 2.91 ± 0.51a |
| D4 | 2.50 ± 0.33a | 1.17 ± 0.17a | 3.07 ± 0.09a | 2.82 ± 0.33a |
| D5 | 2.77 ± 0.17a | 0.97 ± 0.01ab | 2.33 ± 0.12c | 3.01 ± 0.18a |
Note: Significant differences between the five density soils were determined using one-way ANOVA followed by Duncan’s multiple range test at p < 0.05. Different lowercase letters represent significant differences between different densities. The data are shown as the means ± SD (n = 3).
Table 5.
Functional diversity of the microbial community.
| Density | H’ | J | D | U | E |
|---|---|---|---|---|---|
| D1 | 2.41 ± 0.21a | 0.71 ± 0.06a | 0.97 ± 0.01a | 2.24 ± 0.01a | 0.92 ± 0.01a |
| D2 | 2.39 ± 0.26a | 0.70 ± 0.07a | 0.97 ± 0.01a | 2.08 ± 0.01b | 0.93 ± 0.01a |
| D3 | 2.24 ± 0.21a | 0.66 ± 0.06a | 0.97 ± 0.01a | 1.98 ± 0.05c | 0.93 ± 0.01a |
| D4 | 1.75 ± 0.14b | 0.52 ± 0.04b | 0.98 ± 0.01a | 1.50 ± 0.04d | 0.92 ± 0.01a |
| D5 | 2.21 ± 0.17a | 0.65 ± 0.05a | 0.98 ± 0.01a | 1.94 ± 0.06c | 0.93 ± 0.01a |
Note: Significant differences between the five densities of soils were determined using one-way ANOVA followed by Duncan’s multiple range test at p < 0.05. Different lowercase letters represent significant differences between different densities. The data are shown as the means ± SD (n = 3). Abbreviations: H’: Shannon–Wiener diversity index; J: Pielou evenness index; D: Simpson dominance index; U: McIntosh diversity index; E: McIntosh evenness index.
Table 6.
Relationship between eigenvectors from the PCA of the single carbon substrate and microbial activity in Chinese fir plantation soils.
Table 6.
Relationship between eigenvectors from the PCA of the single carbon substrate and microbial activity in Chinese fir plantation soils.
| Carbon Substrate Type | Carbon Substrate | PC1 (41.92%) | PC2 (19.36%) |
|---|---|---|---|
| Carbohydrates | β-Methyl-d-Glucoside | 4.026 | −0.021 |
| d-Galactonic Acid Lactone | 0.415 | 0.730 | |
| d-Xylose | 3.943 | −0.080 | |
| d-Galacturonic Acid | −7.138 | −0.718 | |
| I-Erythritol | 2.777 | 0.323 | |
| d-Mannitol | −4.342 | −1.166 | |
| N-Acetyl-d-Glucosamine | −4.099 | −1.845 | |
| d-Glucosaminic Acid | −3.179 | −1.229 | |
| d-Cellobiose | 2.295 | 2.074 | |
| α-d-Glucose-1-Phosphate | 3.178 | −0.972 | |
| α-d-Lactose | 4.026 | −0.085 | |
| d,l-α-Glycerol Phosphate | 1.131 | −1.952 | |
| Average value of absolute load value | 3.379 | 0.933 | |
| Anmino acids | l-Arginine | −0.712 | 0.297 |
| l-Asparagine | −6.310 | −0.365 | |
| l-Phenylalanine | −0.186 | −0.132 | |
| l-Serine | −2.994 | 2.193 | |
| l-Threonine | 2.511 | −0.557 | |
| Glycyl-l-Glutamic Acid | 2.213 | −0.046 | |
| Average value of absolute load value | 2.488 | 0.598 | |
| Carboxylic acids | Pyruvic Acid Methyl Ester | −2.524 | 0.078 |
| γ-Hydroxybutyric Acid | 3.400 | 0.169 | |
| Itaconic Acid | 0.534 | 0.755 | |
| α-Ketobutyric Acid | 3.338 | −0.268 | |
| d-Malic Acid | 1.651 | −1.369 | |
| Average value of absolute load value | 2.289 | 0.528 | |
| Polymers | Tween 40 | −8.441 | 0.682 |
| Tween 80 | −5.183 | 1.450 | |
| α-Cyclodextrin | 4.015 | −0.071 | |
| Glycogen | 3.726 | −0.121 | |
| Average value of absolute load value | 5.341 | 0.581 | |
| Phenolic acids | 2-Hydroxybenzoic Acid | 2.632 | 0.117 |
| 4-Hydroxybenzoic Acid | −1.800 | 0.404 | |
| Average value of absolute load value | 3.532 | 0.261 | |
| Amines | Phenylethylamine | 0.757 | 1.400 |
| Putrescine | 0.338 | 0.325 | |
| Average value of absolute load value | 0.548 | 0.913 |
© 2018 by the authors. Licensee MDPI, Basel, Switzerland. This article is an open access article distributed under the terms and conditions of the Creative Commons Attribution (CC BY) license (http://creativecommons.org/licenses/by/4.0/).
Share and Cite
MDPI and ACS Style
Wang, C.; Xue, L.; Dong, Y.; Wei, Y.; Jiao, R. Unravelling the Functional Diversity of the Soil Microbial Community of Chinese Fir Plantations of Different Densities. Forests 2018, 9, 532. https://0-doi-org.brum.beds.ac.uk/10.3390/f9090532
AMA Style
Wang C, Xue L, Dong Y, Wei Y, Jiao R. Unravelling the Functional Diversity of the Soil Microbial Community of Chinese Fir Plantations of Different Densities. Forests. 2018; 9(9):532. https://0-doi-org.brum.beds.ac.uk/10.3390/f9090532
Chicago/Turabian StyleWang, Chaoqun, Lin Xue, Yuhong Dong, Yihui Wei, and Ruzhen Jiao. 2018. "Unravelling the Functional Diversity of the Soil Microbial Community of Chinese Fir Plantations of Different Densities" Forests 9, no. 9: 532. https://0-doi-org.brum.beds.ac.uk/10.3390/f9090532
Note that from the first issue of 2016, this journal uses article numbers instead of page numbers. See further details here.