Article

Influence of Spatiotemporal Dynamics on the Fine-Scale Spatial Genetic Structure of Differently Managed Picea abies Stands

1
Institute of Biosciences and BioResources, National Research Council (CNR), Via Madonna del Piano 10, 50019 Sesto Fiorentino (FI), Italy
2
Department DISAFA, Università degli Studi di Torino, Largo Braccini 2, 10095 Grugliasco, Italy
3
Department of Chemistry, Life Sciences and Environmental Sustainability, University of Parma, Parco Area delle Scienze 11/A, 43124 Parma, Italy
*
Author to whom correspondence should be addressed.
Submission received: 21 August 2018 / Revised: 18 September 2018 / Accepted: 9 October 2018 / Published: 10 October 2018
(This article belongs to the Special Issue Forest Landscape Ecology: Linking Past, Present, and Future Data)

Abstract

:
The tandem analysis of dendrochronological and genetic data is piquing forest ecologists’ interest and represents a promising approach for studying the temporal development of genetic structure in forest tree populations. Such multidisciplinary approach can help elucidate to what extent different management practices have impacted the fine-scale spatial genetic structure of forest stands through time. In this study, we jointly analysed spatial, age and genetic data from three differently managed Norway spruce permanent plots to assess: (1) possible differences among plots in the spatial distribution of individuals and their genetic structure due to different management practices, and (2) whether modifications in the age structure influenced the fine-scale spatial genetic structure within each permanent plot. With these aims, we genetically characterized at five nuclear microsatellite markers a large subset (328) of all the trees for which spatial and age data were collected (1472). We found that different management practices determined a similar spatial structure in terms of trees’ ages (r < 25 m in all plots) and neutral genetic diversity (Sp ranging from 0.002 to 0.004). Hot spots and cold spots of trees’ age were not statistically different in terms of genetic diversity, and trees’ age was not statistically different among the genetic clusters detected. On the other hand, the spatial distribution of individuals was significantly clustered up to 22 m only in the wooded pasture plot. Our main findings show that forest land use and management can indeed determine markedly different spatial layouts of Norway spruce individuals but do not produce strong distortions in the spatial structure of age and genetic parameters.

1. Introduction

Forest management practices (e.g., clear-cut, seed tree, and shelterwood systems) often result in even-aged stands with homogeneous spatial distribution of stems [1]. On the other hand, unmanaged and abandoned forests generally exhibit higher diversity in stand structure in both its vertical and horizontal components (e.g., Motta et al. [2]), and such heterogeneity is often due to forest regeneration clumping in canopy gaps [3]. The possible genetic consequences of commonly used forest management practices have been explored to a lesser extent. A clear negative impact of management on genetic diversity and its spatial arrangement has seldom been shown [4,5,6,7,8]. In most cases, no effect or a weak effect on genetic parameters was found (reviewed by Kavaliauskas et al. [9]). In particular, the genetic consequences of management practices were demonstrated to be species-specific [9] or, within the same species, even population-specific [4,10,11].
Tree populations can buffer, or at least delay, the effects of disturbances because of typically high gene flow and long life cycles determining a large overlap among generations [9,12]. However, there is increasing evidence that possible genetic consequences of disturbances might be more nuanced than the simple signals looked for so far, such as the loss of genetic diversity and increased differentiation among populations [13]. Recent literature about a widely studied and economically important species, Fagus sylvatica L., has indeed shown how management practices can subtly affect the spatial component of genetic structure [11,14,15]. Since forest management immediately and heavily affects the spatial distribution of trees (e.g., Lamedica et al. [16]), such subtle genetic signals in the first generations after human intervention could likely represent an intermediate step between disturbance and the onset of more relevant alterations in the fine-scale spatial genetic structure (SGS) of managed stands. On the other hand, the effects of forest management on the temporal component of genetic structure have been rarely explored, usually by comparing genetic diversity among different cohorts of individuals in managed vs. unmanaged stands (e.g., Marquardt et al. [8]; Westergren et al. [17]). Such a clear-cut subdivision into cohorts potentially makes it difficult to disentangle the effects of management from those of other factors that affect regeneration survival, such as the interplay between seed dispersal and density-dependent mortality [18].
The study of the temporal component of genetic structure would require to assess the age of individuals sampled for genetic analyses [19]. In the available literature, a handful of studies combine dendrochronological and genetic data. By merging such levels of information, the accumulation of genetic diversity and the development of genetic differentiation over time [20], as well as the influence of genetic vs. abiotic determinants on tree growth [21,22,23,24], were studied. Such a multidisciplinary approach would also make it possible to assess possible temporal changes in the genetic structure of managed forest stands. This could be done, for example, by comparing genetic parameters for cohorts of adult trees established before and after disturbance events detected through the study of abrupt changes in tree radial growth patterns [25]. Another option would be treating cambial age as a continuous variable to be correlated with individual genetic parameters. Indeed, dendrochronological data have already been used to assess the effects of temporal processes on ecophysiological traits, from tree growth to xylem functional traits [26,27,28].
Forest management inherently changes temporal dynamics of forest tree populations [29,30,31] and, in turn, temporal dynamics can have a large influence on the distribution of genetic diversity [19,20,32]. Therefore, combining spatial, genetic and dendrochronological data at the individual level can represent a step forward in understanding the consequences of forest management, outdoing discipline-based conclusions towards a multidisciplinary assessment of disturbance-induced modifications. Here, we embrace such an approach to investigate whether spatiotemporal dynamics shaped by past management affect fine-scale SGS in Norway spruce (Picea abies (L.) Karst.). To this aim, we took advantage of dendrochronological data collected for all individuals present within three 1-ha plots in the subalpine forest of Paneveggio (Eastern Alps, Italy). These permanent plots were established in 1993 to study the effect of different levels of forest management on several characteristics of stand structure [29,33,34]. We genetically characterized, with nuclear microsatellite markers (nSSRs), a large subset of trees to assess: (1) possible differences among plots in the spatial distribution of individuals and their genetic structure due to different management practices, and (2) whether modifications in the age structure influenced the fine-scale SGS within each permanent plot.

2. Materials and Methods

2.1. Study Area

The study area is located in the Paneveggio forest (latitude 46°18′ N, longitude 11°45′ E) along the Valbona valley, and it is part of the Paneveggio-Pale di S.Martino Natural Park (Trentino, Italy). The vegetation in the whole Valbona valley is a typical subalpine Norway spruce forest classified as Homogyno-Piceetum subalpinum myrtilletosum [35]. The forest was heavily grazed by cattle until the early 1970s, while nowadays it hosts a high density of wild ungulates [36]. The three 1-ha permanent plots where dendrochronological and genetic data were collected span from the lower part of the Paneveggio forest to the timberline, and were selected to represent the most common forest structures (i.e., closed canopy mature forest and open subalpine forest) and past land use (i.e., managed dense forest and grazed open forest) in this area. In the first stand (VB1), close to the forest road, thinning and harvesting operations ended in 1984. The second stand (VB2) was sporadically managed for wood production until 1948, and developed without anthropogenic influence during recent decades. The third stand (VB3) is located at the upper limit of the pure spruce forest within an area used for grazing until the 1950s [29]. VB1, VB2 and VB3 stands are characterized by similar tree densities (479, 541 and 452 trees ha−1), while they substantially differ in regeneration abundance (scarce in VB1, absent in VB2 and abundant in VB3) and in age structure (Table 1). In fact, VB1 and VB2 are monolayered stands established around 1820–1840 and 1790–1820, respectively, while VB3 is a multilayered stand with a few individuals older than 200 years but most of the trees between 45 and 65 years [29].

2.2. Sampling Strategy and Genotyping

A total of 328 individuals (97 in VB1, 114 in VB2 and 117 in VB3), randomly distributed within the three plots, were sampled for genetic analyses among the 1472 individuals for which dendrochronological data were available (Figure 1 and Table 1). Genomic DNA was extracted from about 70 mg of needle tissue, using Qiagen Plant DNeasy 96 isolation kit and Macherey-Nagel Nucleovac Vacuum Manifold. All individuals were genotyped with five nSSRs (SpAGG03, SpAC03, EATC1B02, EATC2B02 and EATC1E03) developed by Scotti et al. [37] and Pfeiffer et al. [38], following the PCR conditions described in Piotti et al. [39]. An automatic capillary sequencer CEQ8000 Beckman Coulter was used for sizing microsatellite alleles.

2.3. Spatial Data Analysis

Inverse distance weighted (IDW) interpolation on tree age was used to obtain a surface dataset (raster) with a spatial resolution of 1 m. This simple geostatistical tool allowed a first description of the spatial structure of tree ages within the studied stands. In IDW interpolation, the local influence (weight) of each measured tree diminishes as a function of distance.
Point pattern analysis (PPA) was used to assess tree spatial patterns within the permanent plots at different spatial scales (from 1 to 50 m). Univariate pair-correlation function (g(r)) on stem-mapped trees was contrasted against the complete spatial randomness (CSR) null model to account for first-order effects. Mark correlation analysis with the normalized Moran’s I-mark statistic with a single quantitative mark (tree age) was used to assess the within-stand spatial pattern of tree age at different spatial scales (from 1 to 50 m). Moran’s I type summary statistic (Imm(r)), a spatial variant of the classical Pearson correlation coefficient [40,41], was used to test for positive or negative correlations between tree ages. A positive correlation means that trees that are closely located have similar ages and negative correlation means that points that are closely located have different ages. In all PPAs, the 95% CI was computed from 1000 Monte Carlo simulations [42,43] and a goodness-of-fit (GoF) test for null hypothesis was performed [44]. All analyses were done applying a 1 m lag distance and a maximum distance of 50 m with the grid-based software Programita [43], adopting a grid size of 1 m2 and a ring width of 5 m.
To obtain a spatial localization of tree groups with similar age, an approach based on the local index of spatial association (LISA) was used. In particular, the spatiotemporal patterns of tree recruitment were described with the Getis-Ord Gi*(d) index [45], using tree age as a quantitative variable. LISA statistics can detect a local clustering around individual locations improving results from inferences where a single measure of global association (e.g., Moran’s I) can provide little meaningful information [16,46]. All local Gi*(d) analyses were computed with the Rookcase Excel add-in [47].

2.4. Genetic Data Analysis

Standard genetic parameters describing within-population genetic variation (Na, Ar100 and HE) and genetic differentiation (FST and GST) were estimated by GenAlEx [48] and hp-rare [49]. Differences in genetic diversity parameters among stands were tested by two-way ANOVA in R [50] considering as factors the locus and the stand.
Fine-scale SGS was investigated by both classical spatial autocorrelation analysis and Bayesian clustering. Spatial autocorrelation analysis was based on Loiselle et al. [51] pair-wise kinship coefficients (Fij) calculated by using the software SPAGeDi 1.4 [52]. Statistical significance of mean kinship coefficients was tested in each distance class by (i) estimating 95% CI around mean Fij values by jackknifing loci (5000 cycles), and (ii) random shuffling (5000 times) of individual geographic locations to define the upper and lower bounds of the 95% CI of the distribution under the null hypothesis that Fij and pair-wise geographical distances are uncorrelated. Analyses were run using the even sample size option based on 12 distance classes with an equal number of pairs per class. The Sp statistic was used to measure the intensity of SGS [53]. Sp is computed as:
Sp = bF/(F1 − 1)
where bF is the regression slope of all pairwise Fij values against the geographical distances among individuals, and F1 is the average kinship coefficient of the first distance class (i.e., 0–20 m). The statistical significance of F1 and bF was tested-based by permuting individual geographic coordinates 5000 times.
To assess the presence of subtle spatial signals in the genetic structure of the three stands, the spatially explicit Bayesian clustering algorithm implemented in the R package Geneland v. 4.0.2 [54,55] was used. This analysis aims at (i) finding the optimal number of genetic clusters in which sampled individuals can be divided and (ii) quantifying the probability (q-value) of each individual to belong to each of the identified genetic clusters. The program was run including both spatial and genetic information. The spatial model with correlated allele frequencies was used. The maximum number of clusters was set to 20 with 10 runs per each number of clusters tested. The highest median number of clusters of the 10 runs was chosen as the most representative one. Each analysis was run for 2 × 10⁶ iterations with a thinning value of 1000. The possible presence of genotyping errors was taken into account including the filter.null.alleles module.

2.5. Relationship between Age and Fine-Scale SGS

The spatial relationship between trees’ age and fine-scale SGS was tested with two different approaches. First, we compared the age distribution of the different genetic clusters after having categorically assigned each tree to the most likely one. ANOVA tests were run with age as independent variable and the genetic cluster as categorical dependent variable. Then, to fully exploit the large dendrochronological dataset and the individual array of q-values from Bayesian clustering (i.e., the array of probability for each individual to belong to detected genetic clusters), the spatial relationship between trees’ age and the vector of q-values was assessed by correlation analyses between raster layers in a GIS environment. IDW interpolation was applied both to trees’ age and genetic cluster membership obtaining a co-registered 1 m resolution raster (104 pixels per stand) with coupled age-genetic information. The possible spatial autocorrelation issue was tackled by applying a randomization test randomly extracting 102 pixels from the interpolated dataset at each of 103 cycles. At each cycle, the correlation between age and q-values was tested, obtaining a distribution of correlation coefficients for each genetic cluster.
In each plot, it was also tested whether hot spots and cold spots of trees’ age were characterized by differences in genetic diversity parameters (HE and Ar100) through two-way ANOVA tests (as described above).

3. Results

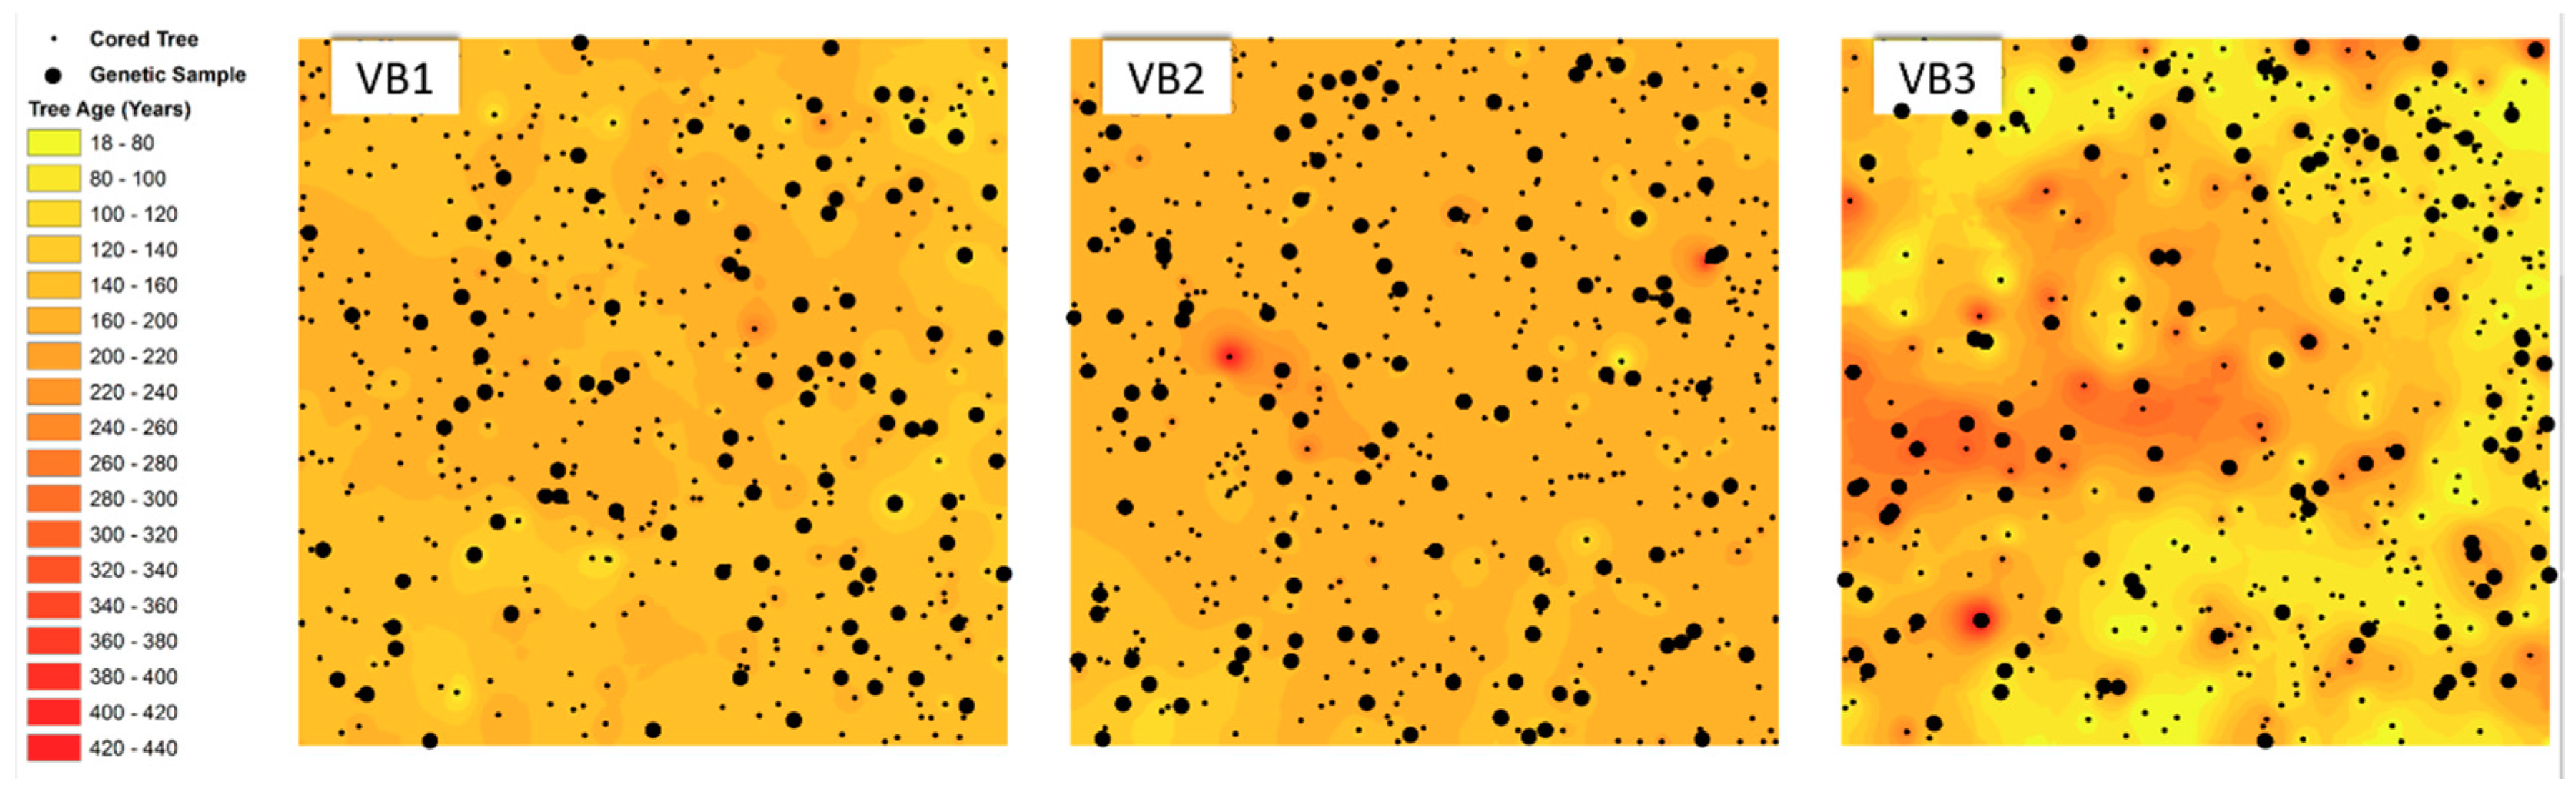
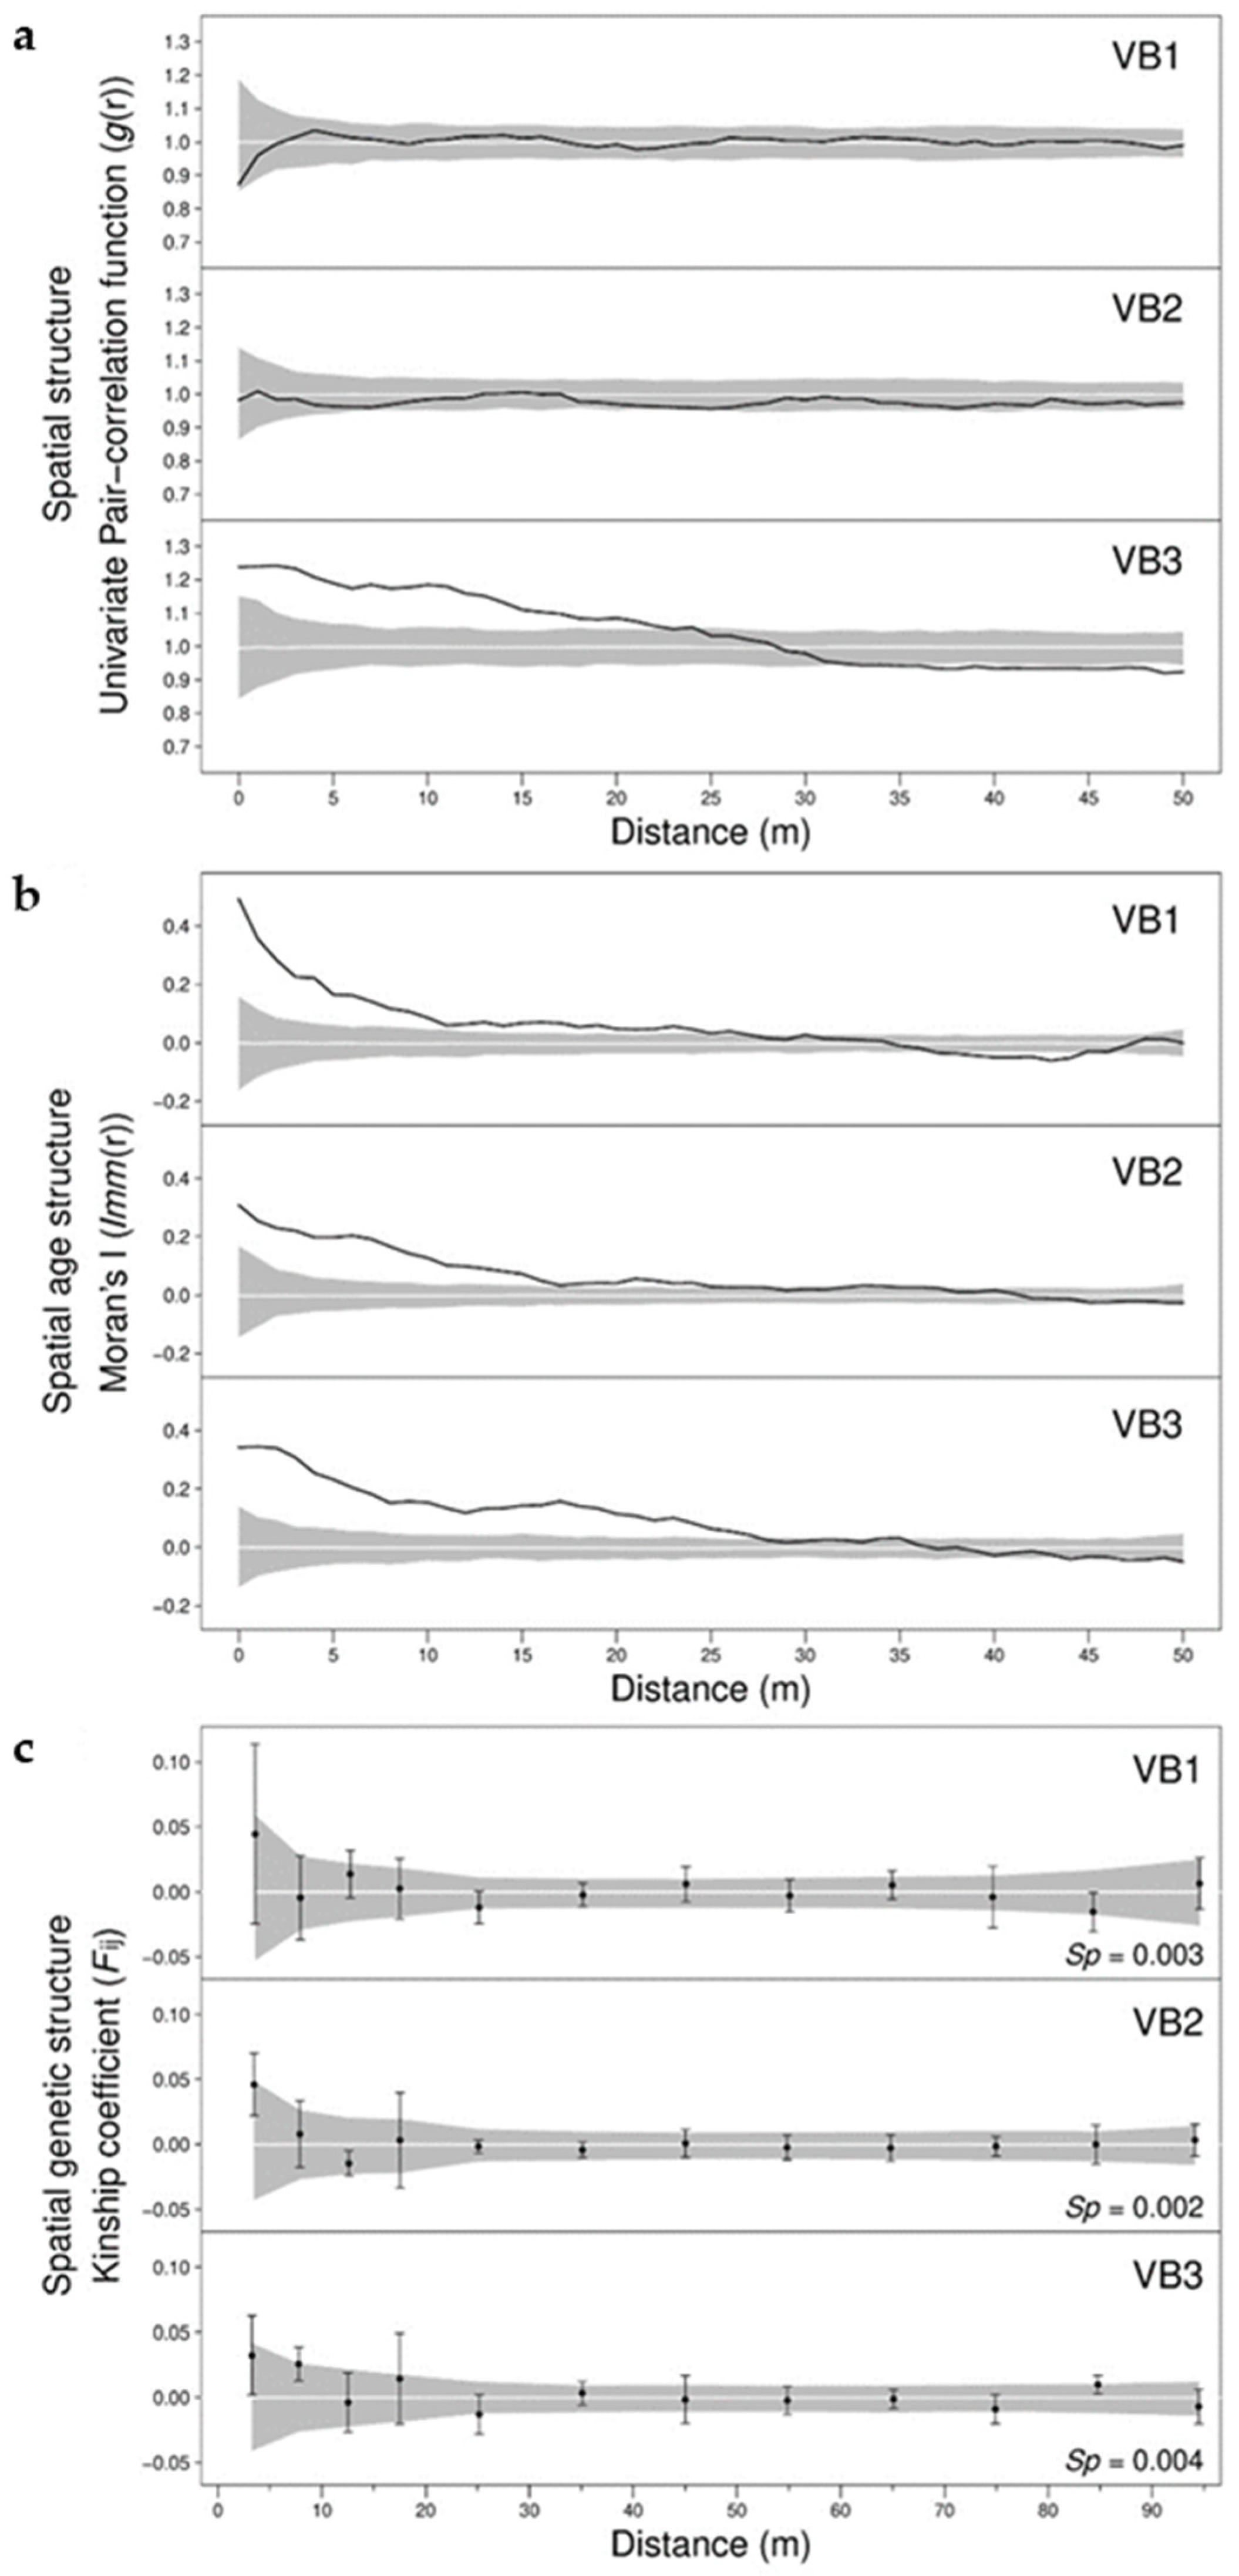
3.1. Spatial Distribution of Individual Age

The spatial interpolation on stem-mapped trees by using tree age as z-variable showed a gradient from a homogeneous pattern (VB1) to a heterogeneous one (VB3). At VB3, a few older trees were sparsely distributed within the plot, and several younger trees filled the open areas between them (Figure 1).
Considering only the spatial pattern of stem-mapped trees (Figure 2a) the only plot showing a departure from the CSR null model was VB3, which showed significant clustered distribution up to 22 m (GoF: p < 0.001). Including the age of trees in the analysis of point pattern (Figure 2b), a significant (GoF: p < 0.001) positive spatial correlation between trees of similar ages at short distances (r < 25 m) was found in all stands.
The local Gi*(d) statistic, rasterized on the maps of the three stands (Figure 3), allowed us to identify groups of even-aged trees that are older (hot spots) or younger (cold spots) than the mean stand age, depicting the spatiotemporal pattern of adult trees at VB1, VB2, and VB3. A patchy surface pattern was found in all stands, where trees established in different age cohorts in groups of variable patch size (2–63 m-wide). The larger significant groups were present at VB3 (up to 63 m-wide), where different cohorts were generally well separated.

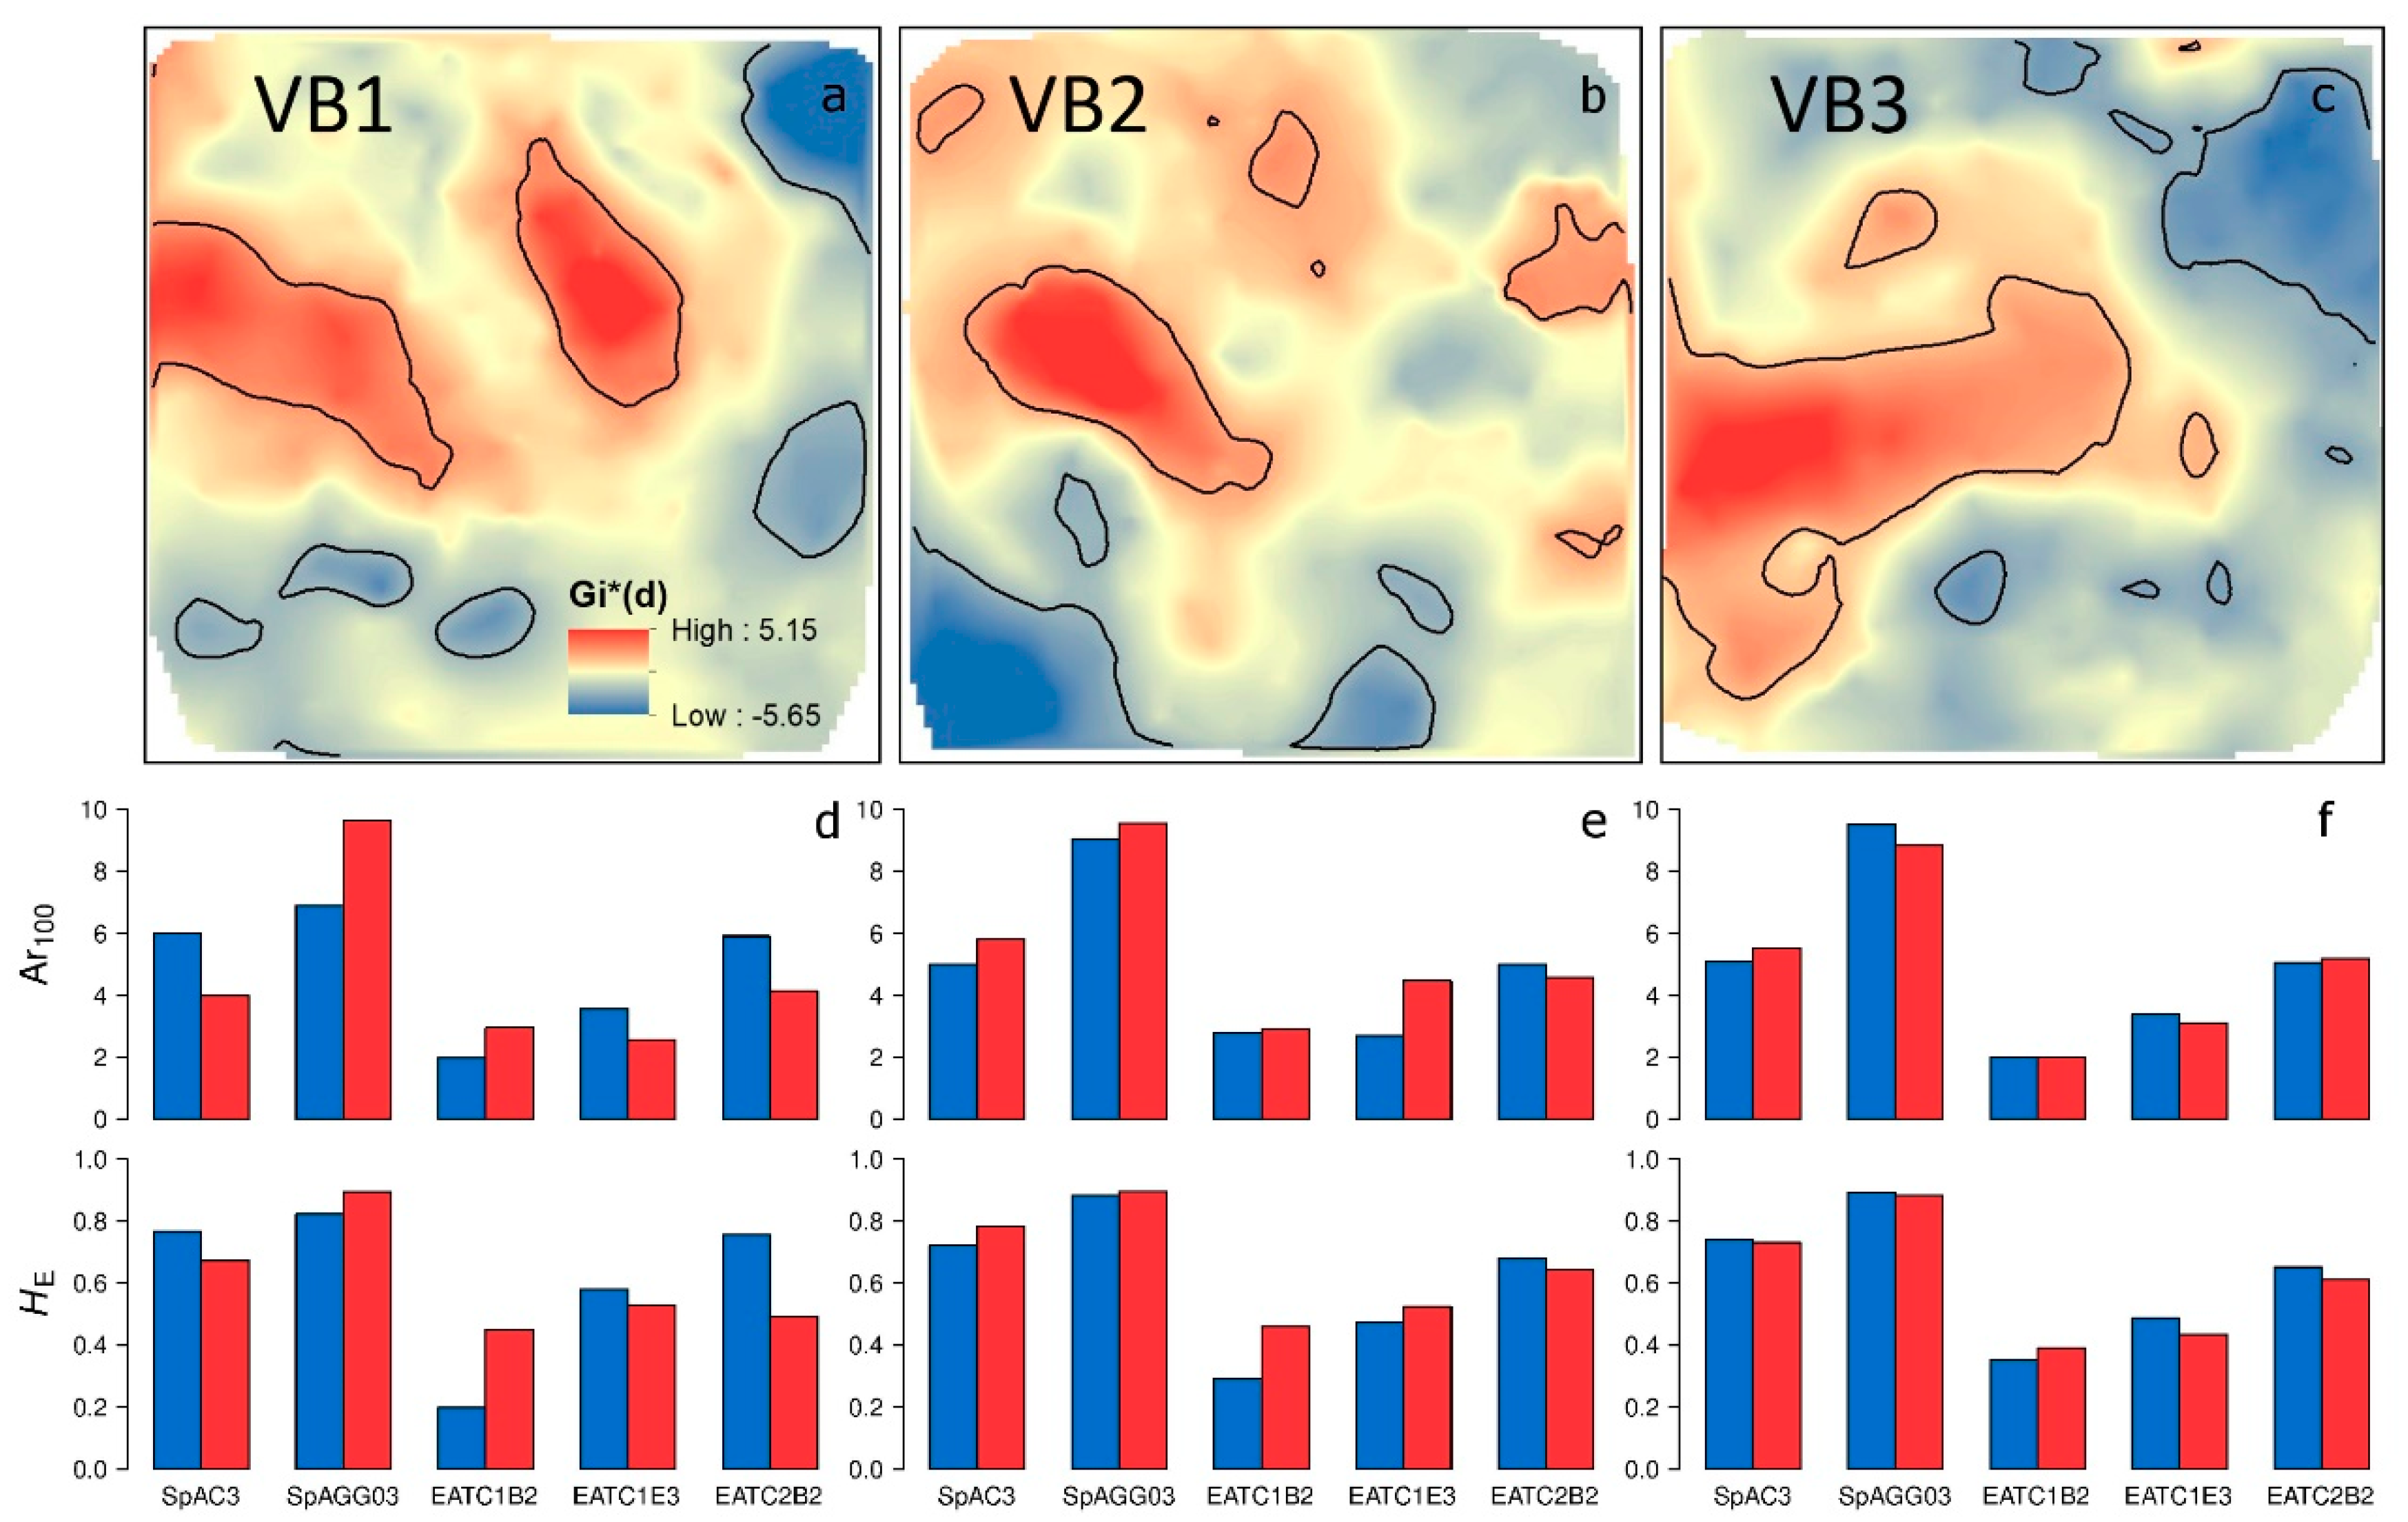
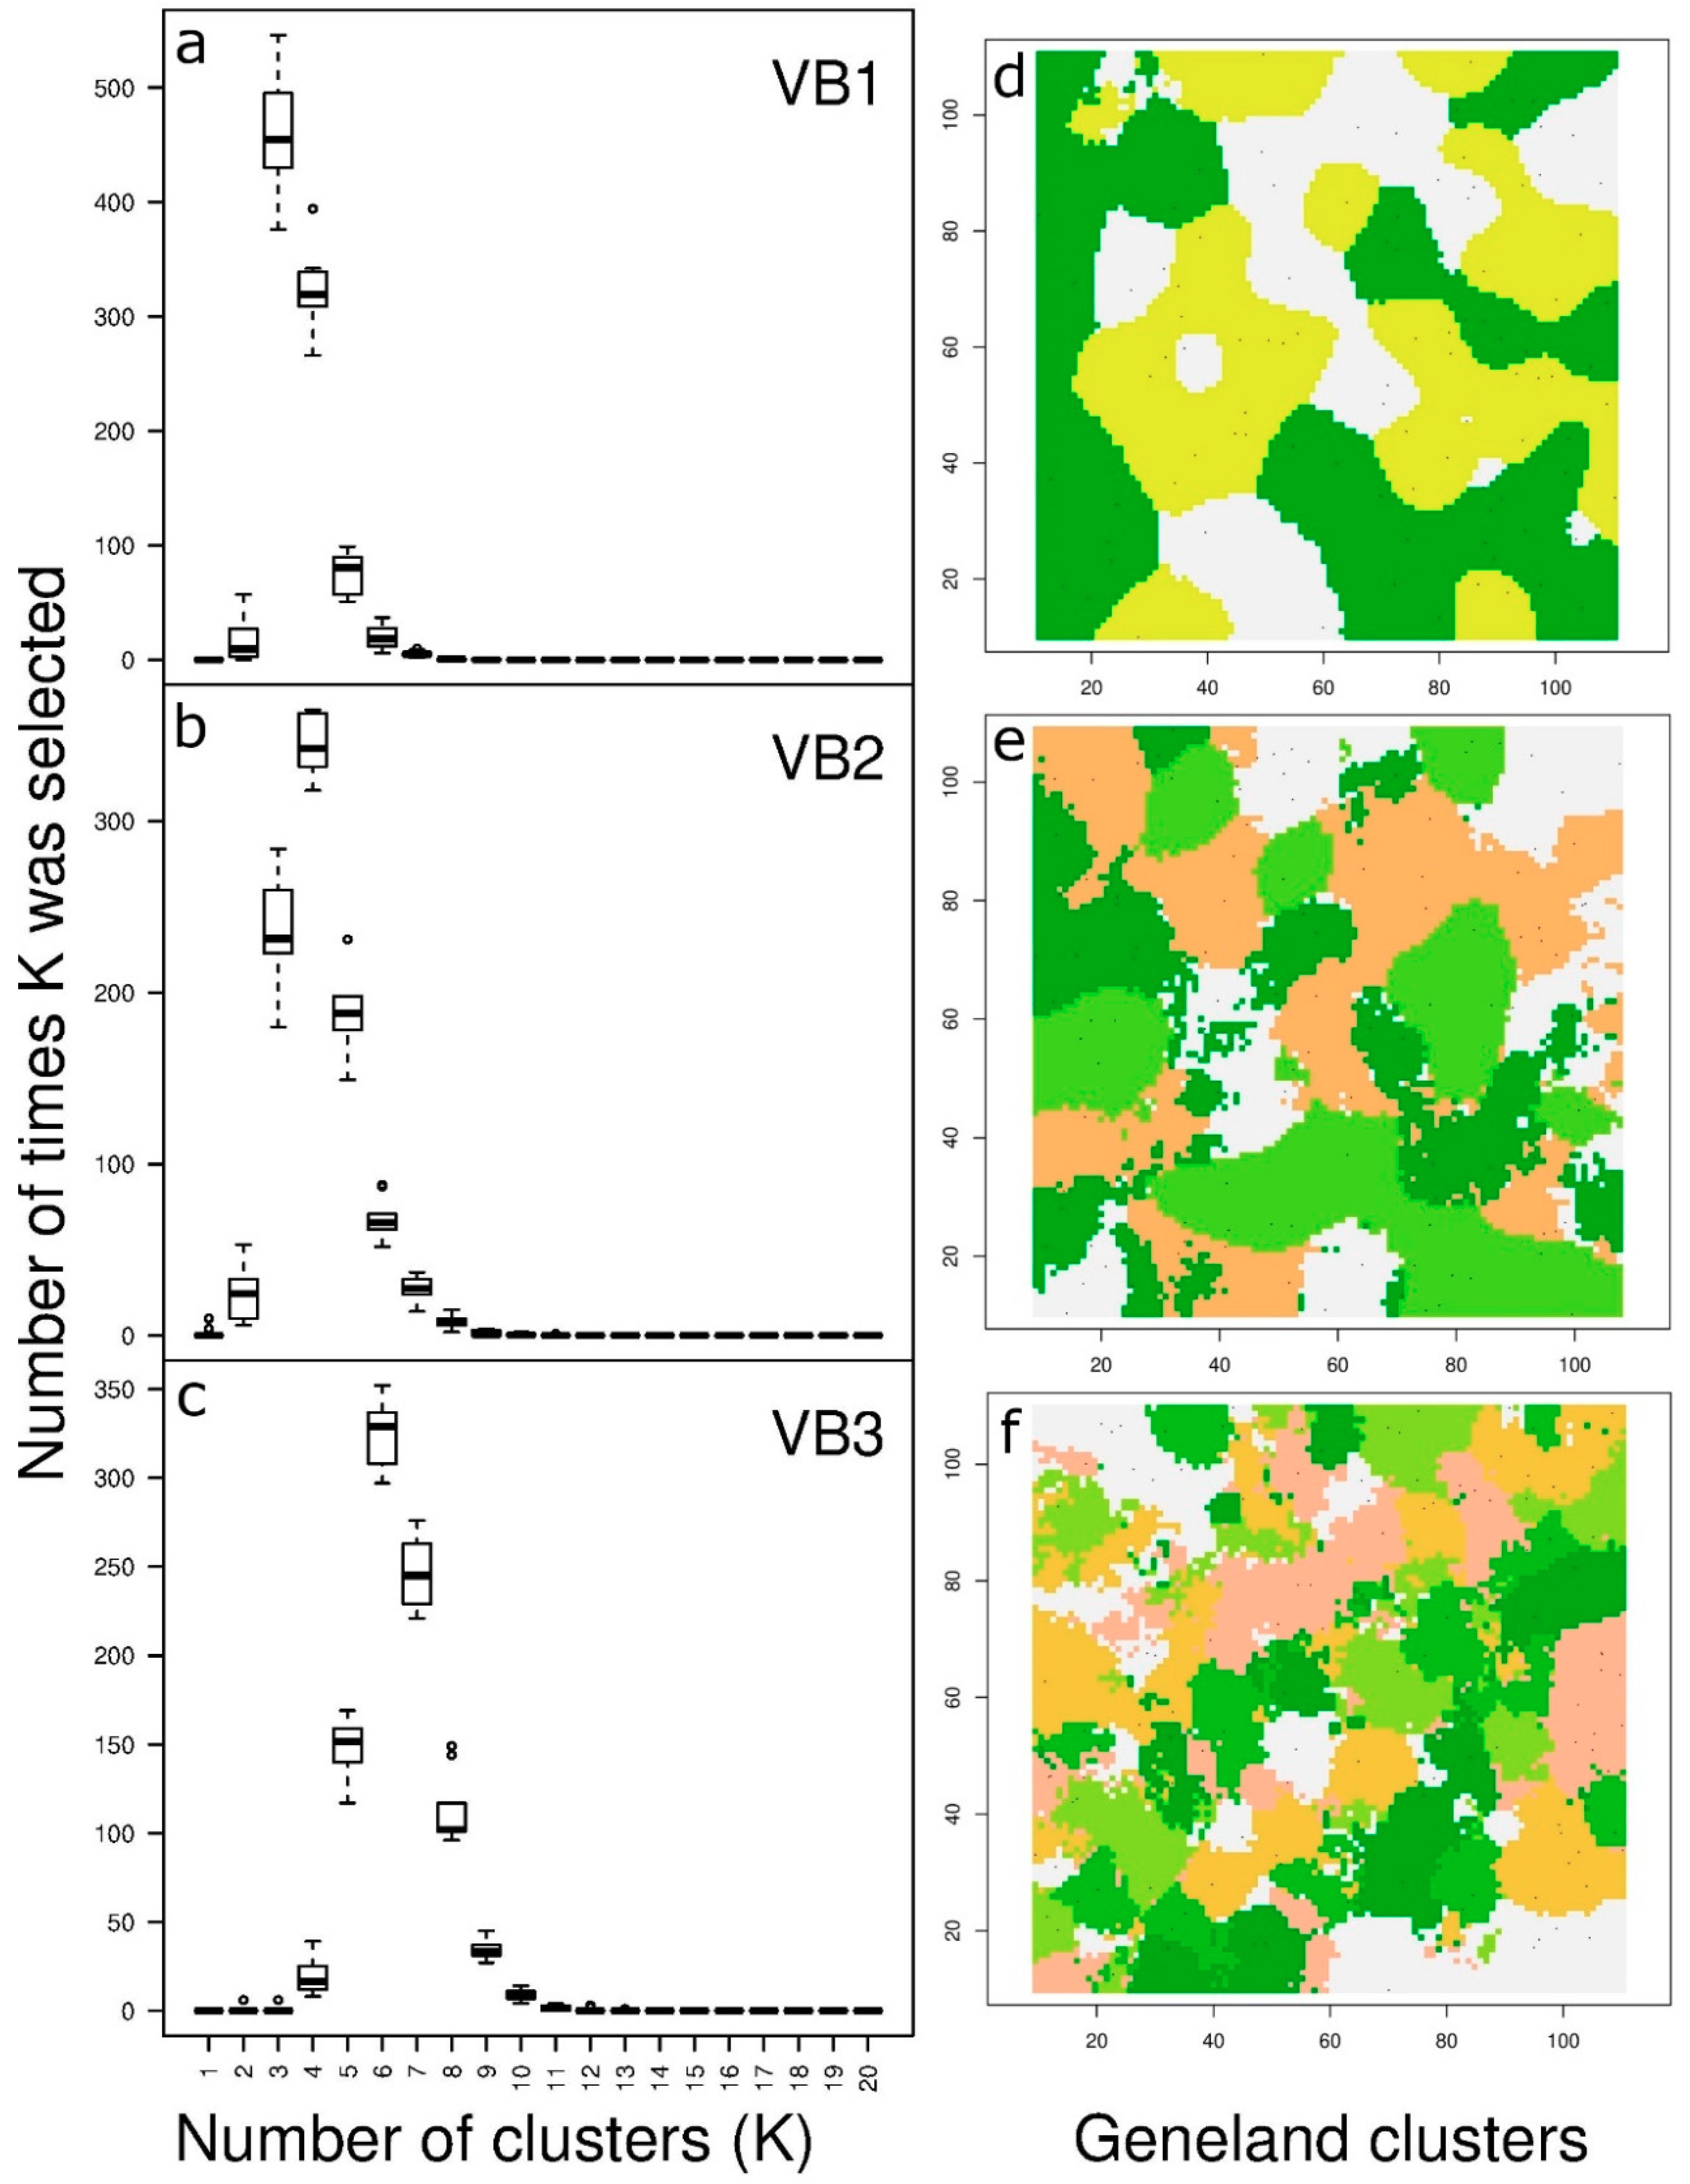
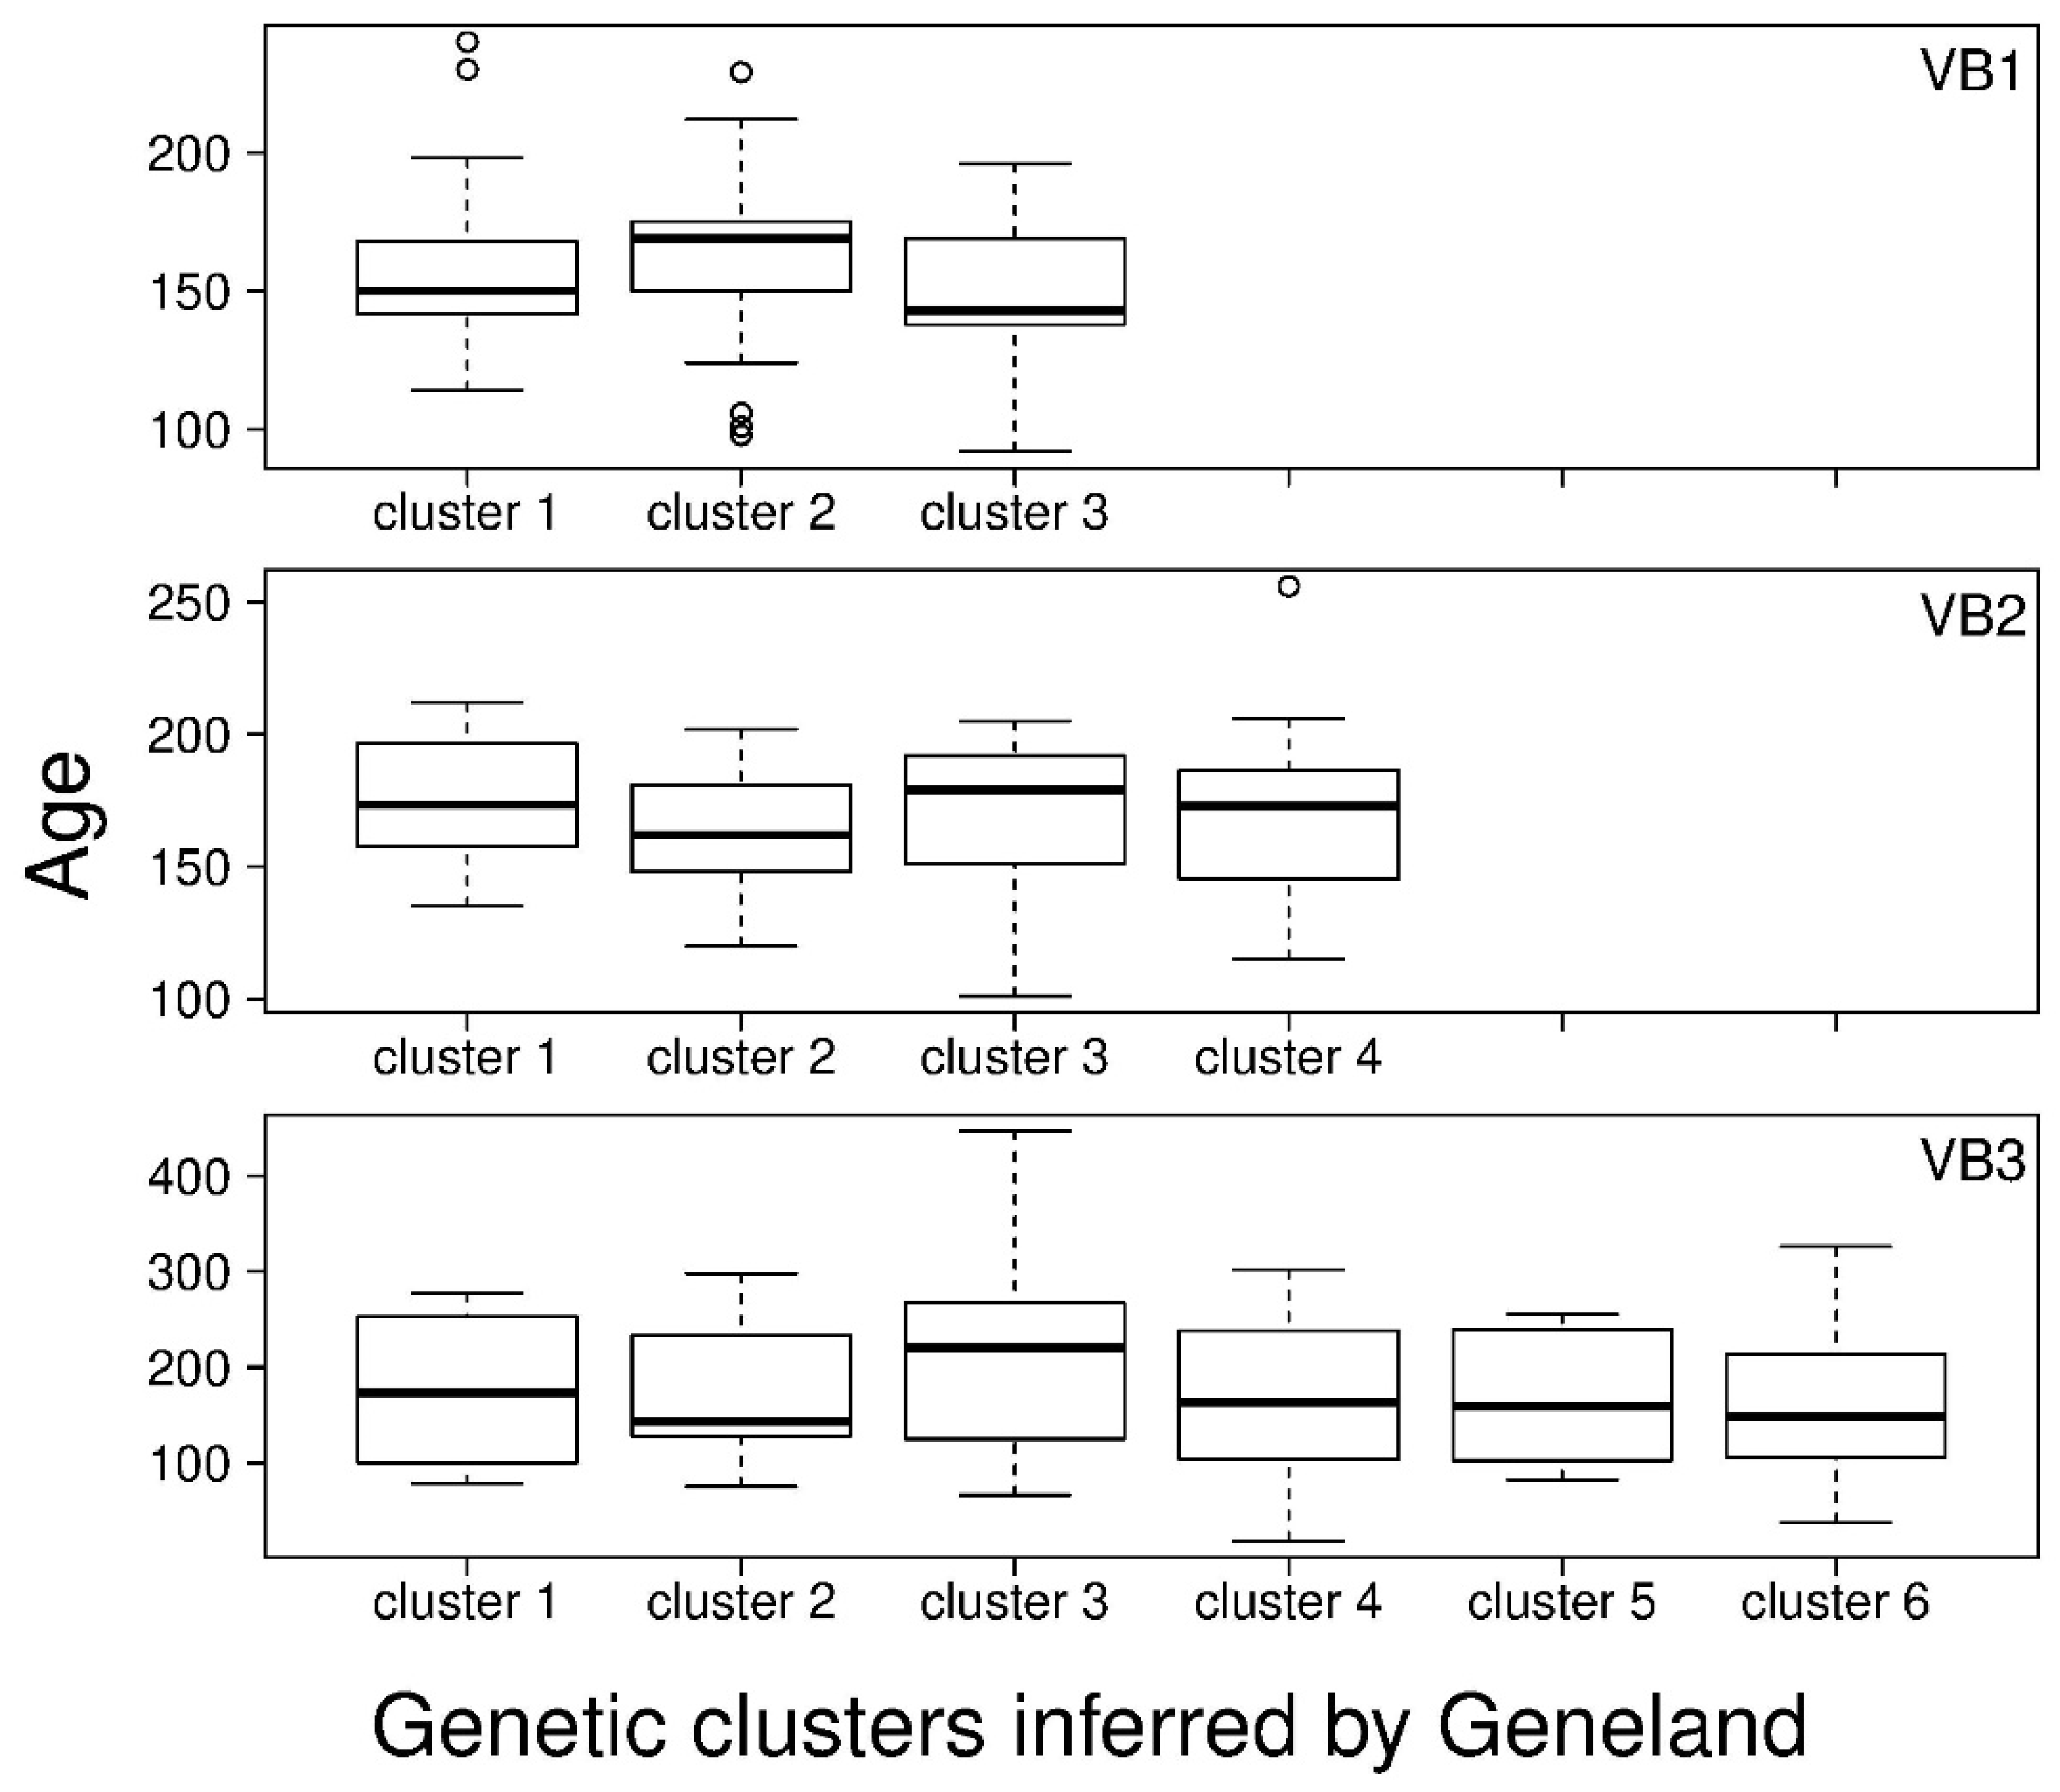
3.2. Spatial Distribution of Genetic Variation

Parameters summarizing genetic diversity in the three stands are presented in Table 1. Genetic diversity was very similar among the three plots, two-way ANOVAs did not detect any statistically significant difference in genetic diversity as measured by Na, HE and Ar100. Genetic differentiation indexes showed an absence of genetic structure among stands, with the highest pair-wise FST and GST values equal to 0.004.
Spatial autocorrelograms and low values of the Sp parameter showed an absence of stand-wise, spatially regular SGS in all stands (Figure 2c). On the other hand, Bayesian clustering showed the presence of a cryptic fine-scale SGS overlooked by spatial autocorrelation. Three, four and six differentiated genetic clusters were detected in VB1, VB2 and VB3, respectively (Figure 4 and Figure S1–S3), with pair-wise FST values between genetic clusters ranging from 0.028 (cluster 1 vs. cluster 3 in VB2) to 0.292 (cluster 1 vs. cluster 2 in VB3, Tables S1–S3).

3.3. Relationship between Age and Fine-Scale SGS

The age structure had a marginal influence on the fine-scale SGS and, more generally, on the spatial distribution of genetic diversity. Age was not statistically different among the genetic clusters detected by Bayesian analysis in all plots, as assessed by ANOVA tests (Figure 5). At a finer scale, the randomization test run to assess possible correlations between individual tree age and membership to genetic clusters showed that the distribution of correlation coefficients was never statistically different from zero (Figure S4). In addition, hot spots and cold spots of trees’ age were not different in terms of genetic diversity (Figure 3). Statistically significant differences between hot and cold spots were not found in any two-way ANOVA test.

4. Discussion

By jointly analysing spatial, age and genetic data from three Norway spruce permanent plots in the Eastern Alps, we found that different management practices determined a similar spatial structure in terms of trees’ ages and neutral genetic diversity but different clumping patterns. Our main finding shows that forest land use and management can indeed determine markedly different spatial layouts of Norway spruce individuals but do not produce strong distortions in the spatial structure of age and genetic parameters.

4.1. Influence of Forest Management on the Spatial and Age Structure

Stem-mapped data on permanent plots has become a standard survey procedure in forest ecological studies aimed at describing and interpreting complex forest structures and fine-scale ecological processes (e.g., Moeur [3]). Stem-mapped trees are a prerequisite to assess spatial patterns at multiple spatial scales and are fundamental reference data in long-term ecological research. They guarantee spatially explicit data, making it possible to explore possible relationships between individual characteristics and biotic and abiotic conditions. In general, the spatial component of these data makes straightforward the overlay of geographic layers obtained from different data sources, as the geographic layer of individual genotypes.
The spatial arrangement of trees was similarly random in the two managed stands (VB1 and VB2), conversely it was clumped in the abandoned wood pasture (VB3). This was probably due to several concurrent factors, both related to past management and site characteristics. Thinning operations had a homogenization effect on the spatial structure of the managed stands at lower elevations, while the presence of open areas in the wood pasture favoured a spatially aggregated infilling regeneration process. This mechanism could also explain why we observed slightly larger groups of trees with similar age in the wood pasture. Forest management and succession dynamics are not the only important drivers determining the spatial pattern of regenerating trees. At higher elevations, the harsh conditions and the high heterogeneity of site conditions are important limiting factors that create favourable and unfavourable sites for forest regeneration [56,57,58,59], leading to heterogeneous spatial patterns. Another possible explanation of the clumped distribution of younger trees at VB3 is the short repulsion distance between regeneration and mature trees that is often observed in forest tree species [46,60,61].

4.2. Influence of Forest Management on the Fine-Scale Spatial Genetic Structure

Recent reviews about the impact of management practices on forest genetic resources highlighted how human intervention may directly influence the genetic layout of managed stands [9,62,63]. Although a formal comparison of genetic diversity between managed and unmanaged stands of Norway spruce is virtually impossible in the Italian Alps due to the lack of unmanaged forests, our data showed negligible differences in genetic diversity and SGS among plots that have had a different recent history of forest management. The main difference in terms of recent forest management history is between VB3, a former wooden pasture, and VB1–VB2, both established about 200 years ago after a shelterwood felling and managed until 1984 and 1948, respectively [64]. A possible disadvantage of shelterwood management with respect to wood pastures is that natural regeneration originates mainly from a single seed year, determining that only a subset of adult trees could contribute to the post-intervention generation [9]. However, it is generally expected that such possible negative genetic consequences of forest management have an effective impact when effective population size is small and/or gene dispersal is spatially restricted [62] and, therefore, we would not expect to detect marked genetic consequences of management in wind-dispersed species capable of extensive dispersal such as Norway spruce [39].
The homogenizing effect in space and time of extensive gene flow clearly emerged from the absence of genetic differentiation among stands found in our study, which confirms what was found in previous genetic investigation along Norway spruce altitudinal transects [21,65,66]. Available literature on anemophilous species generally showed low to negligible impact of forest management on genetic diversity and SGS [11]. In Fagus sylvatica (L.), one of the species for which more studies about the genetic consequences of management are available, only subtle differences in genetic parameters emerged when comparing managed and unmanaged stands [11,14,15,17]. For instance, Piotti et al. [11] showed that summary genetic parameters were not affected by management history, but a general reduction in the complexity of the fine-scale SGS was observed when comparing managed and unmanaged stands. In our study, by explicitly including spatial information, we forced Bayesian clustering to detect the slightest signals of spatial clustering of genotypes. However, also using such an approach, we were able to find only slight differences among stands. The most evident one emerges when inspecting the individual distributions of q-values within each plot (Figure S1). Individuals were clearly assigned to inferred genetic clusters only in VB1. In VB1, thinning and harvesting operations ended only in 1984, and the last major growth release dates back to 1920, 100 years later than in the other managed plot, VB2 [29]. Such marked genetic structure, not related to spatial and temporal processes, might be the last signature of forest management not yet erased by extensive gene flow.

4.3. Effect of Spatiotemporal Dynamics on the Fine-Scale Spatial Genetic Structure

The tandem analysis of dendrochronological and genetic data has raised much interest in recent literature [67]. Potential applications span from studying the temporal development of genetic structure and differentiation [20] to individual- and population-based association genetic studies in common garden experiments as well as in natural conditions [23,68,69]. So far, the temporal genetic structure of forest trees has been usually investigated by comparing genetic parameters among cohorts (typically, adults vs. juveniles, e.g., Westergren et al. [17] and Leonarduzzi et al. [70]) and very few studies have fully exploited the information potentially hidden in a detailed characterization of individual age to study within- and among-population dynamics. Troupin et al. [19] followed the dynamics of successive cohorts in a Pinus halepensis population over time, dating each tree by analysing aerial photos of the study site and collecting tree-ring data. Such an approach allowed them to trace in detail the demographic history of an expanding population and its genetic consequences. Lesser et al. [20] combined dendrochronological and genetic data to reconstruct the temporal development of genetic diversity and differentiation in small, disjunct Pinus ponderosa populations over a 500-year period. Our experimental setup allowed us to study temporal processes within three Norway spruce plots that had experienced different management histories. The main result emerging from combining spatialized age and genetic data is that past forest management influenced the spatial clumping of individuals but produced a similar spatial arrangements of age cohorts and genotypes. The marked spatial structure of individual age in the three investigated plots might create the conditions for a limited parental contribution to different cohorts (i.e., the few neighbouring trees around gaps disproportionately contributing to regeneration [9]) leading to the development of a spatial genetic structure. Our results showed that, if there was any, such a bottleneck effect did not leave traceable signs on the current spatial distribution of genetic variation. No correlation between age and the weak genetic clustering detected was found, neither were levels of genetic variation different between hot and cold spots of individual tree age.

5. Conclusions

Our investigation definitely shows that highly outcrossing species capable of long-distance dispersal, such as Norway spruce, likely reshuffle genetic variation at a high pace, regardless of the levels of disturbance. Nonetheless, our study provides a methodological framework to distil information from combining genetic and dendrochronological data in forest tree species. It has promising application in describing the consequences of fine-scale demographic events, such as those determined by forest management practices. Studying the temporal development of SGS can be particularly useful to assess whether forest management impacts the spatial distribution of genetic diversity in species with lower effective population size and dispersal capabilities than Norway spruce.

Supplementary Materials

The following are available online at https://0-www-mdpi-com.brum.beds.ac.uk/1999-4907/9/10/622/s1, Figures S1, S2, and S3: Spatial distribution of q-values in VB1, VB2, and VB3, respectively. Figure S4: Distributions of randomized correlation coefficients between tree’s age and q-values for each genetic cluster. Tables S1, S2, and S3: Pair-wise FST values between genetic clusters inferred by Bayesian clustering in VB1, VB2, and VB3, respectively.

Author Contributions

Conceptualization, A.P., R.M. and S.L.; Data Curation, A.P., R.B., R.M., P.P. and S.L.; Formal Analysis, A.P., M.G., C.A., R.B., R.M., P.P. and S.L.; Methodology, A.P., M.G., C.A., R.B., R.M., P.P. and S.L.; Writing—Original Draft, A.P., M.G. and C.A.; Writing—Review & Editing, A.P., M.G., C.A., R.B., R.M., P.P. and S.L.

Funding

This research was funded by the Italian Ministry of Education, Universities and Research through the project MURST COFIN 2002 ‘Foreste di alta quota delle Alpi e degli Appennini: strutture, fattori limitanti, adattamenti fisiologici e dinamiche passate, presenti e future’.

Acknowledgments

We thank the Autonomous Province of Trento and the Parco Naturale Paneveggio-Pale di S. Martino for technical and logistic support and Marta Scalfi, Giuseppe Storti and Paolo Menozzi fot their help in various stages of the work.

Conflicts of Interest

The authors declare no conflict of interest.

References

  1. Franklin, J.F.; Lindenmayer, D.; Thornburgh, D.; van Pelt, R.; Chen, J.; Spies, T.A.; Carey, A.B.; Shaw, D.C.; Berg, D.R.; Harmon, M.E.; et al. Disturbances and structural development of natural forest ecosystems with silvicultural implications, using Douglas-fir forests as an example. For. Ecol. Manag. 2002, 155, 399–423. [Google Scholar] [CrossRef]
  2. Motta, R.; Garbarino, M.; Berretti, R.; Meloni, F.; Nosenzo, A.; Vacchiano, G. Development of old-growth characteristics in uneven-aged forests of the Italian Alps. Eur. J. For. Res. 2015, 134, 19–31. [Google Scholar] [CrossRef]
  3. Moeur, M. Characterizing spatial patterns of trees using stem-mapped data. For. Sci. 1993, 39, 756–775. [Google Scholar]
  4. Adams, W.T.; Zuo, J.; Shimizu, J.Y.; Tappeiner, J.C. Impact of alternative regeneration methods on genetic diversity in coastal Douglas-fir. For. Sci. 1998, 44, 390–396. [Google Scholar]
  5. Rajora, O.P. Genetic biodiversity impacts of silvicultural practices and phenotypic selection in white spruce. Theor. Appl. Genet. 1999, 99, 954–961. [Google Scholar] [CrossRef]
  6. Epperson, B.K.; Chung, M.G. Spatial genetic structure of allozyme polymorphisms within populations of Pinus strobus (Pinaceae). Am. J. Bot. 2001, 88, 1006–1010. [Google Scholar] [CrossRef] [PubMed]
  7. Marquardt, P.E.; Epperson, B.K. Spatial and population genetic structure of microsatellites in white pine. Mol. Ecol. 2004, 13, 3305–3315. [Google Scholar] [CrossRef] [PubMed]
  8. Marquardt, P.E.; Echt, C.S.; Epperson, B.K.; Pubanz, D.M. Genetic structure, diversity, and inbreeding of eastern white pine under different management conditions. Can. J. For. Res. 2007, 37, 2652–2662. [Google Scholar] [CrossRef]
  9. Kavaliauskas, D.; Fussi, B.; Westergren, M.; Aravanopoulos, F.; Finzgar, D.; Baier, R.; Alizoti, P.; Bozic, G.; Avramidou, E.; Konnert, M.; et al. The interplay between forest management practices, genetic monitoring, and other long-term monitoring systems. Forests 2018, 9, 133. [Google Scholar] [CrossRef]
  10. Neale, D.B. Genetic implications of shelterwood regeneration of Douglas-fir in Southwest Oregon. For. Sci. 1985, 15, 995–1005. [Google Scholar]
  11. Piotti, A.; Leonardi, S.; Heuertz, M.; Buiteveld, J.; Geburek, T.; Gerber, S.; Kramer, K.; Vettori, C.; Vendramin, G.G. Within-population genetic structure in beech (Fagus sylvatica L.) stands characterized by different disturbance histories: Does forest management simplify population substructure? PLoS ONE 2013, 8, e73391. [Google Scholar] [CrossRef] [PubMed]
  12. Piotti, A. The genetic consequences of habitat fragmentation: The case of forests. iForest—Biogeosci. For. 2009, 2, 75–76. [Google Scholar] [CrossRef]
  13. Lowe, A.J.; Cavers, S.; Boshier, D.; Breed, M.F.; Hollingsworth, P.M. The resilience of forest fragmentation genetics—No longer a paradox—We were just looking in the wrong place. Heredity 2015, 115, 97–99. [Google Scholar] [CrossRef] [PubMed]
  14. Rajendra, K.C.; Seifert, S.; Prinz, K.; Gailing, O.; Finkeldey, R. Subtle human impacts on neutral genetic diversity and spatial patterns of genetic variation in European beech (Fagus sylvatica). For. Ecol. Manag. 2014, 319, 138–149. [Google Scholar] [CrossRef]
  15. Sjölund, M.J.; Jump, A.S. Coppice management of forests impacts spatial genetic structure but not genetic diversity in European beech (Fagus sylvatica L.). For. Ecol. Manag. 2015, 336, 65–71. [Google Scholar] [CrossRef]
  16. Lamedica, S.; Lingua, E.; Popa, I.; Motta, R.; Carrer, M. Spatial structure in four Norway spruce stands with different management history in the Alps and Carpathians. Silva Fenn. 2011, 45, 865–873. [Google Scholar] [CrossRef]
  17. Westergren, M.; Bozic, G.; Ferreira, A.; Kraigher, H. Insignificant effect of management using irregular shelterwood system on the genetic diversity of European beech (Fagus sylvatica L.): A case study of managed stand and old growth forest in Slovenia. For. Ecol. Manag. 2015, 335, 51–59. [Google Scholar] [CrossRef]
  18. Bontemps, A.; Klein, E.K.; Oddou-Muratorio, S. Shift of spatial patterns during early recruitment in Fagus sylvatica: Evidence from seed dispersal estimates based on genotypic data. For. Ecol. Manag. 2013, 305, 67–76. [Google Scholar] [CrossRef]
  19. Troupin, D.; Nathan, R.; Vendramin, G.G. Analysis of spatial genetic structure in an expanding Pinus halepensis population reveals development of fine-scale genetic clustering over time. Mol. Ecol. 2006, 15, 3617–3630. [Google Scholar] [CrossRef] [PubMed]
  20. Lesser, M.R.; Parchman, T.L.; Jackson, S.T. Development of genetic diversity, differentiation and structure over 500 years in four ponderosa pine populations. Mol. Ecol. 2013, 22, 2640–2652. [Google Scholar] [CrossRef] [PubMed]
  21. King, G.M.; Gugerli, F.; Fonti, P.; Frank, D.C. Tree growth response along an elevational gradient: Climate or genetics? Oecologia 2013, 173, 1587–1600. [Google Scholar] [CrossRef] [PubMed]
  22. Bosela, M.; Popa, I.; Gömöry, D.; Longauer, R.; Tobin, B.; Kyncl, J.; Kyncl, T.; Nechita, C.; Petráš, R.; Sidor, C.G.; et al. Effects of post-glacial phylogeny and genetic diversity on the growth variability and climate sensitivity of European silver fir. J. Ecol. 2016, 104, 716–724. [Google Scholar] [CrossRef]
  23. Heer, K.; Behringer, D.; Piermattei, A.; Bässler, C.; Brandl, R.; Fady, B.; Jehl, H.; Liepelt, S.; Lorch, S.; Piotti, A.; et al. Linking dendroecology and association genetics in natural populations: Stress responses archived in tree rings associate with SNP genotypes in silver fir (Abies alba Mill.). Mol. Ecol. 2018, 27, 1428–1438. [Google Scholar] [CrossRef] [PubMed]
  24. Avanzi, C.; Piermattei, A.; Piotti, A.; Büntgen, U.; Heer, K.; Opgenoorth, L.; Spanu, I.; Urbinati, C.; Vendramin, G.G.; Leonardi, S. Disentangling the effects of spatial proximity and genetic similarity on individual growth performances in Norway spruce natural populations. Sci. Total Environ. 2019, 650, 493–504. [Google Scholar] [CrossRef] [PubMed]
  25. Lorimer, C.G.; Frelich, L.E. A methodology for estimating canopy disturbance frequency and intensity in dense temperate forests. Can. J. For. Res. 1989, 19, 651–663. [Google Scholar] [CrossRef]
  26. Carrer, M.; Urbinati, C. Age-dependent tree-ring growth responses to climate in Larix decidua and Pinus cembra. Ecology 2004, 85, 730–740. [Google Scholar] [CrossRef]
  27. Primicia, I.; Camarero, J.J.; Janda, P.; Čada, V.; Morrissey, R.C.; Trotsiuk, V.; Bače, R.; Teodosiu, M.; Svoboda, M. Age, competition, disturbance and elevation effects on tree and stand growth response of primary Picea abies forest to climate. For. Ecol. Manag. 2015, 354, 77–86. [Google Scholar] [CrossRef]
  28. Rita, A.; Borghetti, M.; Todaro, L.; Saracino, A. Interpreting the Climatic Effects on Xylem Functional Traits in Two Mediterranean Oak Species: The Role of Extreme Climatic Events. Front. Plant Sci. 2016, 7, 1–11. [Google Scholar] [CrossRef] [PubMed] [Green Version]
  29. Motta, R.; Nola, P.; Piussi, P. Structure and stand development in three subalpine Norway spruce (Picea abies (L.) Karst.) stands in Paneveggio (Trento, Italy). Glob. Ecol. Biogeogr. 1999, 8, 455–471. [Google Scholar] [CrossRef]
  30. Duncker, P.S.; Barreiro, S.M.; Hengeveld, G.M.; Lind, T.; Mason, W.L.; Ambrozy, S. Classification of Forest Management Approaches: A New Conceptual Framework and Its Applicability to European Forestry. Ecol. Soc. 2012, 17, 51. [Google Scholar] [CrossRef]
  31. Altman, J.; Hédl, R.; Szabó, P.; Mazůrek, P.; Riedl, V.; Müllerová, J.; Kopecký, M.; Doležal, J. Tree-rings mirror management legacy: Dramatic response of standard oaks to past coppicing in Central Europe. PLoS ONE 2013, 8, 1–11. [Google Scholar] [CrossRef] [PubMed]
  32. Austerlitz, F.; Mariette, S.; Machon, N.; Gouyon, P.H.; Godelle, B. Effects of colonization process on genetic diversity: Differences between annual plant and tree species. Genetics 2000, 154, 1309–1321. [Google Scholar] [PubMed]
  33. Motta, R. Old-growth forests and silviculture in the Italian Alps: The case-study of the strict reserve of Paneveggio (TN). Plant Biosyst. 2002, 136, 223–231. [Google Scholar] [CrossRef]
  34. Motta, R.; Nola, P.; Piussi, P. Long-term investigations in a strict forest reserve in the eastern Italian Alps: Spatio-temporal origin and development in two multi-layered subalpine stands. J. Ecol. 2002, 90, 495–507. [Google Scholar] [CrossRef]
  35. Di Tommaso, P.L. Contributo ad una tipologia floristicoecologica della foresta di Paneveggio (Trento). Versante meridionale. Ann. Accad. Ital. Sci. For. 1983, 32, 287–315. [Google Scholar]
  36. Motta, R.; Nola, P. Fraying damages in the subalpine forest of Paneveggio (Trento, Italy): A dendroecological approach. For. Ecol. Manag. 1996, 88, 81–86. [Google Scholar] [CrossRef]
  37. Scotti, I.; Paglia, G.P.; Magni, F.; Morgante, M. Efficient development of dinucleotide microsatellite markers in Norway spruce (Picea abies Karst.) through dot-blot selection. Theor. Appl. Genet. 2002, 104, 1035–1041. [Google Scholar] [CrossRef] [PubMed]
  38. Pfeiffer, A.; Olivieri, A.; Morgante, M. Identification and characterization of microsatellites in Norway spruce (Picea abies K.). Genome 1997, 40, 411–419. [Google Scholar] [CrossRef] [PubMed]
  39. Piotti, A.; Leonardi, S.; Piovani, P.; Scalfi, M.; Menozzi, P. Spruce colonization at treeline: Where do those seeds come from. Heredity 2009, 103, 136–145. [Google Scholar] [CrossRef] [PubMed]
  40. Shimatani, K. Point processes for fine-scale spatial genetics and molecular ecology. Biom. J. 2002, 44, 325–352. [Google Scholar] [CrossRef]
  41. Wiegand, T.; Moloney, K.A. Handbook of Spatial Point-pattern Analysis in Ecology; Chapman and Hall/CRC: New York, NY, USA, 2014. [Google Scholar]
  42. Stoyan, D.; Stoyan, H. Fractals, Random Shapes, and Point Fields: Methods of Geometrical Statistics; Wiley: Chichester, UK, 1994. [Google Scholar]
  43. Wiegand, T.; Moloney, K.A. Rings, circles, and null-models for point pattern analysis in ecology. Oikos 2004, 104, 209–229. [Google Scholar] [CrossRef] [Green Version]
  44. Diggle, P.J. Statistical Analysis of Spatial Point Patterns; Edward Arnold: London, UK, 2003. [Google Scholar]
  45. Getis, A.; Ord, J.K. The analysis of spatial association by use of distance statistics. Geogr. Anal. 1992, 24, 189–206. [Google Scholar] [CrossRef]
  46. Carrer, M.; Soraruf, L.; Lingua, E. Convergent space-time tree regeneration patterns along an elevation gradient at high altitude in the Alps. For. Ecol. Manag. 2013, 304, 1–9. [Google Scholar] [CrossRef]
  47. Sawada, M. Rookcase: An Excel 97/2000 Visual Basic (VB) add-in for exploring global and local spatial autocorrelation. Bull. Ecol. Soc. Am. 1999, 80, 231–234. [Google Scholar]
  48. Peakall, R.; Smouse, P.E. GenAlEx 6.5: Genetic analysis in Excel. Population genetic software for teaching and research—An update. Bioinformatics 2012, 28, 2537–2539. [Google Scholar] [CrossRef] [PubMed]
  49. Kalinowski, S.T. hp-rare 1.0: A computer program for performing rarefaction on measures of allelic richness. Mol. Ecol. Notes 2005, 5, 187–189. [Google Scholar] [CrossRef]
  50. R Core Team. R: A Language and Environment for Statistical Computing; R Foundation for Statistical Computing: Vienna, Austria, 2018. [Google Scholar]
  51. Loiselle, B.A.; Sork, V.L.; Nason, J.; Graham, C. Spatial genetic structure of a tropical understory shrub, Psychotria officinalis (Rubiaceae). Am. J. Bot. 1995, 82, 1420–1425. [Google Scholar] [CrossRef]
  52. Hardy, O.J.; Vekemans, X. SPAGeDi: A versatile computer program to analyse spatial genetic structure at the individual or population levels. Mol. Ecol. Notes 2002, 2, 618–620. [Google Scholar] [CrossRef]
  53. Vekemans, X.; Hardy, O.J. New insights from fine-scale spatial genetic structure analyses in plant populations. Mol. Ecol. 2004, 13, 921–935. [Google Scholar] [CrossRef] [PubMed]
  54. Guillot, G.; Mortier, F.; Estoup, A. Geneland: A computer package for landscape genetics. Mol. Ecol. Notes 2005, 5, 712–715. [Google Scholar] [CrossRef]
  55. Guillot, G.; Santos, F.; Estoup, A. Analysing georeferenced population genetics data with Geneland: A new algorithm to deal with null alleles and a friendly graphical user interface. Bioinformatics 2008, 24, 1406–1407. [Google Scholar] [CrossRef] [PubMed]
  56. Schoenenberger, W.; Kuhn, N.; Laessig, R. Research Objectives and Projects on Windthrow Areas in Switzerland; AGRIS: Zurich, Switzerland, 1995. [Google Scholar]
  57. Motta, R.; Lingua, E. Human impact on size, age, and spatial structure in a mixed European larch and Swiss stone pine forest in the Western Italian Alps. Can. J. For. Res. 2005, 35, 1809–1820. [Google Scholar] [CrossRef]
  58. Resler, L.M.; Butler, D.R.; Malanson, G.P. Topographic shelter and conifer establishment and mortality in an alpine environment, Glacier National Park, Montana. Phys. Geogr. 2005, 26, 112–125. [Google Scholar] [CrossRef]
  59. Maher, E.L.; Germino, M.J. Microsite differentiation among conifer species during seedling establishment at alpine treeline. Ecoscience 2006, 13, 334–341. [Google Scholar] [CrossRef] [Green Version]
  60. Kuuluvainen, T. Gap disturbance, ground microtopography, and the regeneration dynamics of boreal coniferous forests in Finland: A review. Ann. Zool. Fenn. 1994, 31, 35–51. [Google Scholar]
  61. Holtmeier, F.K. Mountain Timberlines: Ecology, Patchiness, and Dynamics; Springer Science & Business Media: Berlin, Germany, 2009; Volume 36. [Google Scholar]
  62. Ratnam, W.; Rajora, O.P.; Finkeldey, R.; Aravanopoulos, F.; Bouvet, J.-M.; Vaillancourt, R.E.; Kanashiro, M.; Fady, B.; Tomita, M.; Vinson, C. Genetic effects of forest management practices: Global synthesis and perspectives. For. Ecol. Manag. 2014, 333, 52–65. [Google Scholar] [CrossRef]
  63. Aravanopoulos, F. Do silviculture and forest management affect the genetic diversity and structure of long-impacted forest tree populations? Forests 2018, 9, 355. [Google Scholar] [CrossRef]
  64. Motta, R.; Berretti, R.; Castagneri, D.; Lingua, E.; Nola, P.; Vacchiano, G. Stand and coarse woody debris dynamics in subalpine Norway spruce forests withdrawn from regular management. Ann. For. Sci. 2010, 67, 803. [Google Scholar] [CrossRef]
  65. Maghuly, F.; Pinsker, W.; Praznik, W.; Fluch, S. Genetic diversity in managed subpopulations of Norway spruce [Picea abies (L.) Karst.]. For. Ecol. Manag. 2006, 222, 266–271. [Google Scholar] [CrossRef]
  66. Unger, G.M.; Konrad, H.; Geburek, T. Does spatial genetic structure increase with altitude? An answer from Picea abies in Tyrol, Austria. Plant Syst. Evol. 2011, 292, 133–141. [Google Scholar] [CrossRef]
  67. Evans, M.E.K.; Gugger, P.F.; Lynch, A.M.; Guiterman, C.H.; Fowler, J.C.; Klesse, S.; Riordan, E.C. Dendroecology meets genomics in the common garden: New insights into climate adaptation. New Phytol. 2018, 218, 401–403. [Google Scholar] [CrossRef] [PubMed]
  68. Trujillo-Moya, C.; George, J.-P.; Fluch, S.; Geburek, T.; Grabner, M.; Karanitsch-Ackerl, S.; Konrad, H.; Mayer, K.; Sehr, E.M.; Wischnitzki, E.; et al. Drought sensitivity of Norway spruce at the species’ warmest fringe: Quantitative and molecular analysis reveals high genetic variation among and within provenances. G3: Genes Genomes Genet. 2018, 8, 1225–1245. [Google Scholar] [CrossRef] [PubMed]
  69. Housset, J.M.; Nadeau, S.; Isabel, N.; Depardieu, C.; Duchesne, I.; Lenz, P.; Girardin, M.P. Tree rings provide a new class of phenotypes for genetic associations that foster insights into adaptation of conifers to climate change. New Phytol. 2018, 218, 630–645. [Google Scholar] [CrossRef] [PubMed] [Green Version]
  70. Leonarduzzi, C.; Piotti, A.; Spanu, I.; Vendramin, G.G. Effective gene flow in a historically fragmented area at the southern edge of silver fir (Abies alba Mill.) distribution. Tree Genet. Genomes 2016, 12, 95. [Google Scholar] [CrossRef]
Figure 1. Sampling design adopted in the three 1-ha permanent plots (VB1, VB2 and VB3). Small dots represent mapped trees (DBH > 7.5 cm) while large dots represent trees sampled for genetic analyses. IDW interpolated age data are used as background.
Forests 09 00622 g001
Figure 2. (a) Univariate pair-correlation function (g(r)) on stem-mapped trees; (b) mark correlation analysis on trees’ age based on the normalized Moran’s I-mark statistic (Imm(r)); (c) spatial autocorrelograms of the kinship coefficients Fij by Loiselle et al. [51] using even distance classes. The dark grey area represents the 95% CI around the null hypothesis (i.e., absence of spatial genetic structure), while black lines around mean Fij values are the 95% CIs estimated by jackknifing loci.
Forests 09 00622 g002
Figure 3. Interpolated and z-transformed local Gi*(d) values computed for tree age for 10 m distance interval at (a) VB1, (b) VB2 and (c) VB3. Red and blue areas are hot spots (i.e., groups of trees with age higher than the average within the plot) and cold spots (i.e., groups of trees with age lower than the average within the plot), respectively. Colour scale is proportional to the value of the local Gi*(d) index. Bold contour lines indicate significant clusters (p < 0.005). Values of genetic diversity parameters (HE and Ar100) at each locus for individuals within hot and cold spots at (d) VB1, (e) VB2 and (f) VB3.
Forests 09 00622 g003
Figure 4. Distributions of results from the 10 repetitions of Geneland analyses for (a) VB1, (b) VB2 and (c) VB3. The highest median number of clusters of the 10 repetitions was chosen as the most representative one for each plot (K = 3 in VB1, K = 4 in VB2, K = 6 in VB3). Maps representing the categorical assignment of individuals to inferred genetic clusters for (d) VB1, (e) VB2 and (f) VB3.
Forests 09 00622 g004
Figure 5. Age distribution within the genetic clusters inferred by Bayesian clustering in the three 1-ha plots.
Forests 09 00622 g005
Table 1. Characteristics of the three 1-ha stands investigated and genetic parameters estimated on the subsamples of individuals for genetic analyses.
PlotN Spatial Analysis 1N Genetic AnalysisElevation (m a.s.l.)Regeneration Density (n ha−1)Past ManagementLast InterventionNaHEAr100
VB1479971695935Wood production1984100.648.87
VB2541114181530Wood production194811.40.649.34
VB345211718653010Wood pasture192910.60.649.21
1 All trees present within the 1-ha stand were sampled, thus it also represents adult tree density (n ha−1).

