Article

Anatomical and Chemical Responses of Eastern White Pine (Pinus strobus L.) to Blue-Stain (Ophiostoma minus) Inoculation

1
Department of Forestry and Horticulture, The Connecticut Agricultural Experiment Station, New Haven, CT 06504, USA
2
Department of Chemistry and Biochemistry, Central Connecticut State University, New Britain, CT 06050, USA
3
Department of Forestry and Wood Technology, Faculty of Agriculture, Alexandria University, EL-Shatby, 21545 Alexandria, Egypt
*
Author to whom correspondence should be addressed.
Submission received: 30 September 2018 / Revised: 28 October 2018 / Accepted: 2 November 2018 / Published: 6 November 2018

Abstract

:
The increases in temperature have recently allowed the southern pine beetle (Dendroctonus frontalis Zimm.; SPB) and its associated fungi to expand its natural range to northern pine forests. In this study, vigorous eastern white pine mature trees were used to evaluate constitutive and induced response to the southern pine beetle, using O. minus as a proxy. We evaluated histological and chemical changes in P. strobus in response to the fungus at 28- and 65-days post inoculation (dpi). Inoculation with O. minus resulted in an induced defense response as evidenced by the increased production of traumatic resin duct, and lesion development surrounding the site of infection. Starch granules accumulated in the epithelial cells surrounding the resin ducts of inoculated trees. Chemical analyses showed that among phloem phenolics, epi/catechin and three unknown compounds were significantly upregulated at 28 dpi due to fungal inoculation. Several phloem terpenoids (α-pinene, β-myrcene, limonene, terpinolene and β-pinene) were significantly increased in inoculated trees compared to controls at both, 28- and 65-dpi. Continuous production of these terpenoids (up to 65 dpi) can be energetically costly for P. strobus as carbohydrate reserves fund monoterpene synthesis, reducing carbon availability necessary for tree development. Induced phenolics along with monoterpenes production and traumatic resin ducts observed in these trees, suggests that vigorous white pine may sustain endemic populations of southern pine beetle and vectored fungi.

1. Introduction

The southern pine beetle (SPB) is one of the most damaging agents of conifers in the United States, changing forest dynamics and structure [1]. The insect bores under the bark of the host tree allowing its associated fungus to colonize the phloem and overwhelm the tree defense system. The geographical range of SPB extends from the southern United States, north to New Jersey, Delaware, Pennsylvania and Ohio. However, it appears that a warming climate has allowed this insect to expand its range into northern areas where beetles had previously been precluded by cold temperatures [2]. The beetles moved from New Jersey to Long Island (NY) in 2014, infesting approximately 3500 acres, and were later found in Connecticut in 2015 where they attacked Pitch (Pinus rigida Mill), Red (P. resinosa Ait.), Scots (P. sylvestris L.) and Eastern White Pine (P. strobus L.), and to lesser extent Norway spruce (Picea abies L. Karst).
The SPB possess a high genetic plasticity and can sustain epidemics in non-traditional hosts [1,3]. Though the primary SPB hosts are loblolly (P. taeda L.) and shortleaf (P. echinate Mill) pine, these beetles can also kill pitch and eastern white pine populations [1,4]. SPB is now spreading rapidly into northern areas creating the potential for widespread disruption of eastern white pine forests of southern New England and pitch pine forests in coastal Massachusetts and Rhode Island.
The SPB kills several pine species by mass attack, aided by a complex combination of visual, abiotic, and chemical cues. Several fungi, including Ophiostoma minus (Hedgcock) H. & P. Sydow, the most abundant associate carried phoretically on the D. frontalis exoskeleton, and by phoretic mites (Tarsonemus spp.) [5,6] helps during the process. In fact, the role of O. minus during SPB colonization is considerably complex and controversial. Some studies suggest this fungus can be antagonistic to the SPB at the larval stage [7], while other studies have shown that this fungus is involved in the beetle success in the early stages of the attack due to its rapid growth and phloem colonization that compromises host defenses [8,9]. O. minus is more aggressive than its counterparts in terms of competing for resources within the phloem, developing along phloem and sapwood [5,8,10]. Although the presence of O. minus does not seem to be absolutely necessary to kill a tree [11], it was shown to be pathogenic and has caused mortality of Scots and loblolly pine [12].
As bark beetles and associated fungi rapidly invade pine trees, constitutive and induced defense responses become crucial for their survival. Previous studies have shown that constitutive resin flow, biosynthesis of terpenes and fungistatic phenolic compounds along with anatomical changes in the plant cells surrounding the site of infection are central to the defense system [13,14,15,16,17]. While there are similarities in conifer responses to bark beetles, considerable differences between pine species have been previously reported (i.e., monoterpene levels, oleoresin formation capacity and time of induction). Those differences are linked to the historical association of the trees with beetle populations, inherent responses elicited after attack, climate and/or evolutionary landscape [18,19,20,21]. Likewise, geographical variation can significantly alter phenolic/terpenoids composition within and between conifer species [22,23,24].
We hypothesize that chemical and anatomical responses of eastern white pine to O. minus inoculation differ based on geographical and climatic conditions. There are only a few studies that have focused on the response mechanisms in eastern white pines to the southern pine beetle attack (i.e., [25,26]). Thus, we evaluated anatomical and chemical responses of mature eastern white pine to the SPB-vectored fungus O. minus in Southbury CT, Northeast USA Given the moderate pathogenicity and fast growth of O. minus and its capacity to rapidly colonize the phloem, and for regulatory reasons to avoid SPB spread, we used fungal inoculation to mimic SPB attack.
Specifically, our objectives were (i) to evaluate resin duct production capacity after fungal colonization in the phloem; and (ii) to assess constitutive and induced monoterpenes and phenolics in the inner bark against fungal colonization.

2. Materials and Methods

2.1. Field Study

The study was conducted in approximately 40-year-old planted eastern white pine, located in Southbury CT, Northeast USA (41°28′33.9″ N, 73°12′04.8″ W; elevation ~ 102 m). Twenty-two healthy pine trees, with similar size and diameter at breast height (DBH, 48 ± 14 cm) were used in a randomized experiment design with two treatments, control (non-inoculated) and O. minus inoculated at two heights 140 cm (bottom) and 180 cm (top), to study the defense response of eastern white pine to the SPB-vectored fungus.
Trees were inoculated with O. minus derived from cultures originated from naturally SPB attacked pitch pine (Pinus rigida Mill) (40°51′25.7″ N, 72°35′14.8″ W; elevation ~ 8 m) in June 2015. SPB infested bark/phloem was collected and brought to the laboratory for fungal spore collection, isolation and further identification. Fungal spores were grown and maintained in agar media until further molecular characterization. Once O. minus was identified twelve healthy white pine trees were inoculated on 17 May 2016. Inoculations were performed according to Arango-Velez et al. [27]. In brief, the outer bark was perforated with a cordless drill (~5 mm dia) every 7–8 cm around the circumference of each tree, at both heights (bottom and top) for a total of 150 inoculums m−2. Each inoculation corresponded to a 5 mm disk extracted from actively growing fungus on malt extract agar within a petri dish. Each hole was then plugged with a dowel rod, the ring of inoculums wrapped with Parafilm® strips, and a 2-mm screen was placed to reduce environmental contamination. Trees were subjected to two treatments (10 control and 12 inoculated) and two sample collection times (28 & 65 dpi). Previous studies have shown that artificial wound did not impact the overall outcome, hence it was not considered in our study (see [8,28]).
The two time points (28 and 65 dpi) were chosen to test if induced responses to fungal attack were maintained throughout. For each time point, 5 controls and 6 inoculated trees were harvested. The experiment was conducted from May through July 2016.

2.2. Sample Collection

On sampling days, tree bolts were cut at 40 cm above and below inoculation areas. Tree core borer samples of 5 mm width and 5–8 cm length were collected adjacent to the inoculation sites in each cardinal direction for anatomical and histochemical analyses. Phloem samples from above and below (top and bottom) inoculation holes were collected to quantify induced phenols and terpene levels within the reaction zone. Collected phloem was immediately frozen in liquid nitrogen. Phloem tissue was then ground in liquid nitrogen using a Mixer Mill 301 (Retsch, Hean, Germany) at 30 Hz for 30 s, and stored at −80 °C until further analysis.

2.3. Fungal Identification by DNA Sequence Analysis

To identify the blue-stain species used for our study, DNA sequence analysis was performed on fungal spores collected from SPB-attacked pitch pine. Spores collected from bark/phloem samples were grown during 8 weeks in agar media (2.5% MEA), and a single spore was transferred to broth media and grown at 28 °C for 5 days; media was then centrifuged and spores ground in liquid nitrogen for DNA extraction. Fungal DNA was extracted using GeneJet Plant Genomic DNA Purification Mini Kit (Thermo Scientific, Vilnius, Lithuania), and amplified using ITS5 (universal: 5′-GGAAGTAAAAGTCGTAACAAGG-3′) [29] and LR1 (universal: 5′-GGTTGGTTTCTTTTCCT-3′) [30]. Sequencing was performed at W.M. Keck Foundation DNA sequencing Facility at Yale University on an ABI 3730xL DNA analyzer and ABI BigDye Terminator cycle sequencing (Applied Biosystems). Sequence data was assembled using CAPS3 Sequence Assembly Program [31]. Alignment of DNA was carried out using ClustalW program [32] and compared with NCBI databank using BLAST program [33] (NCBI Submission # 1982966). Sequence analysis in GenBank confirmed this fungus as Ophiostoma minus with 99% identity to O. minus strain CFL873 (ID: KC305144.1).

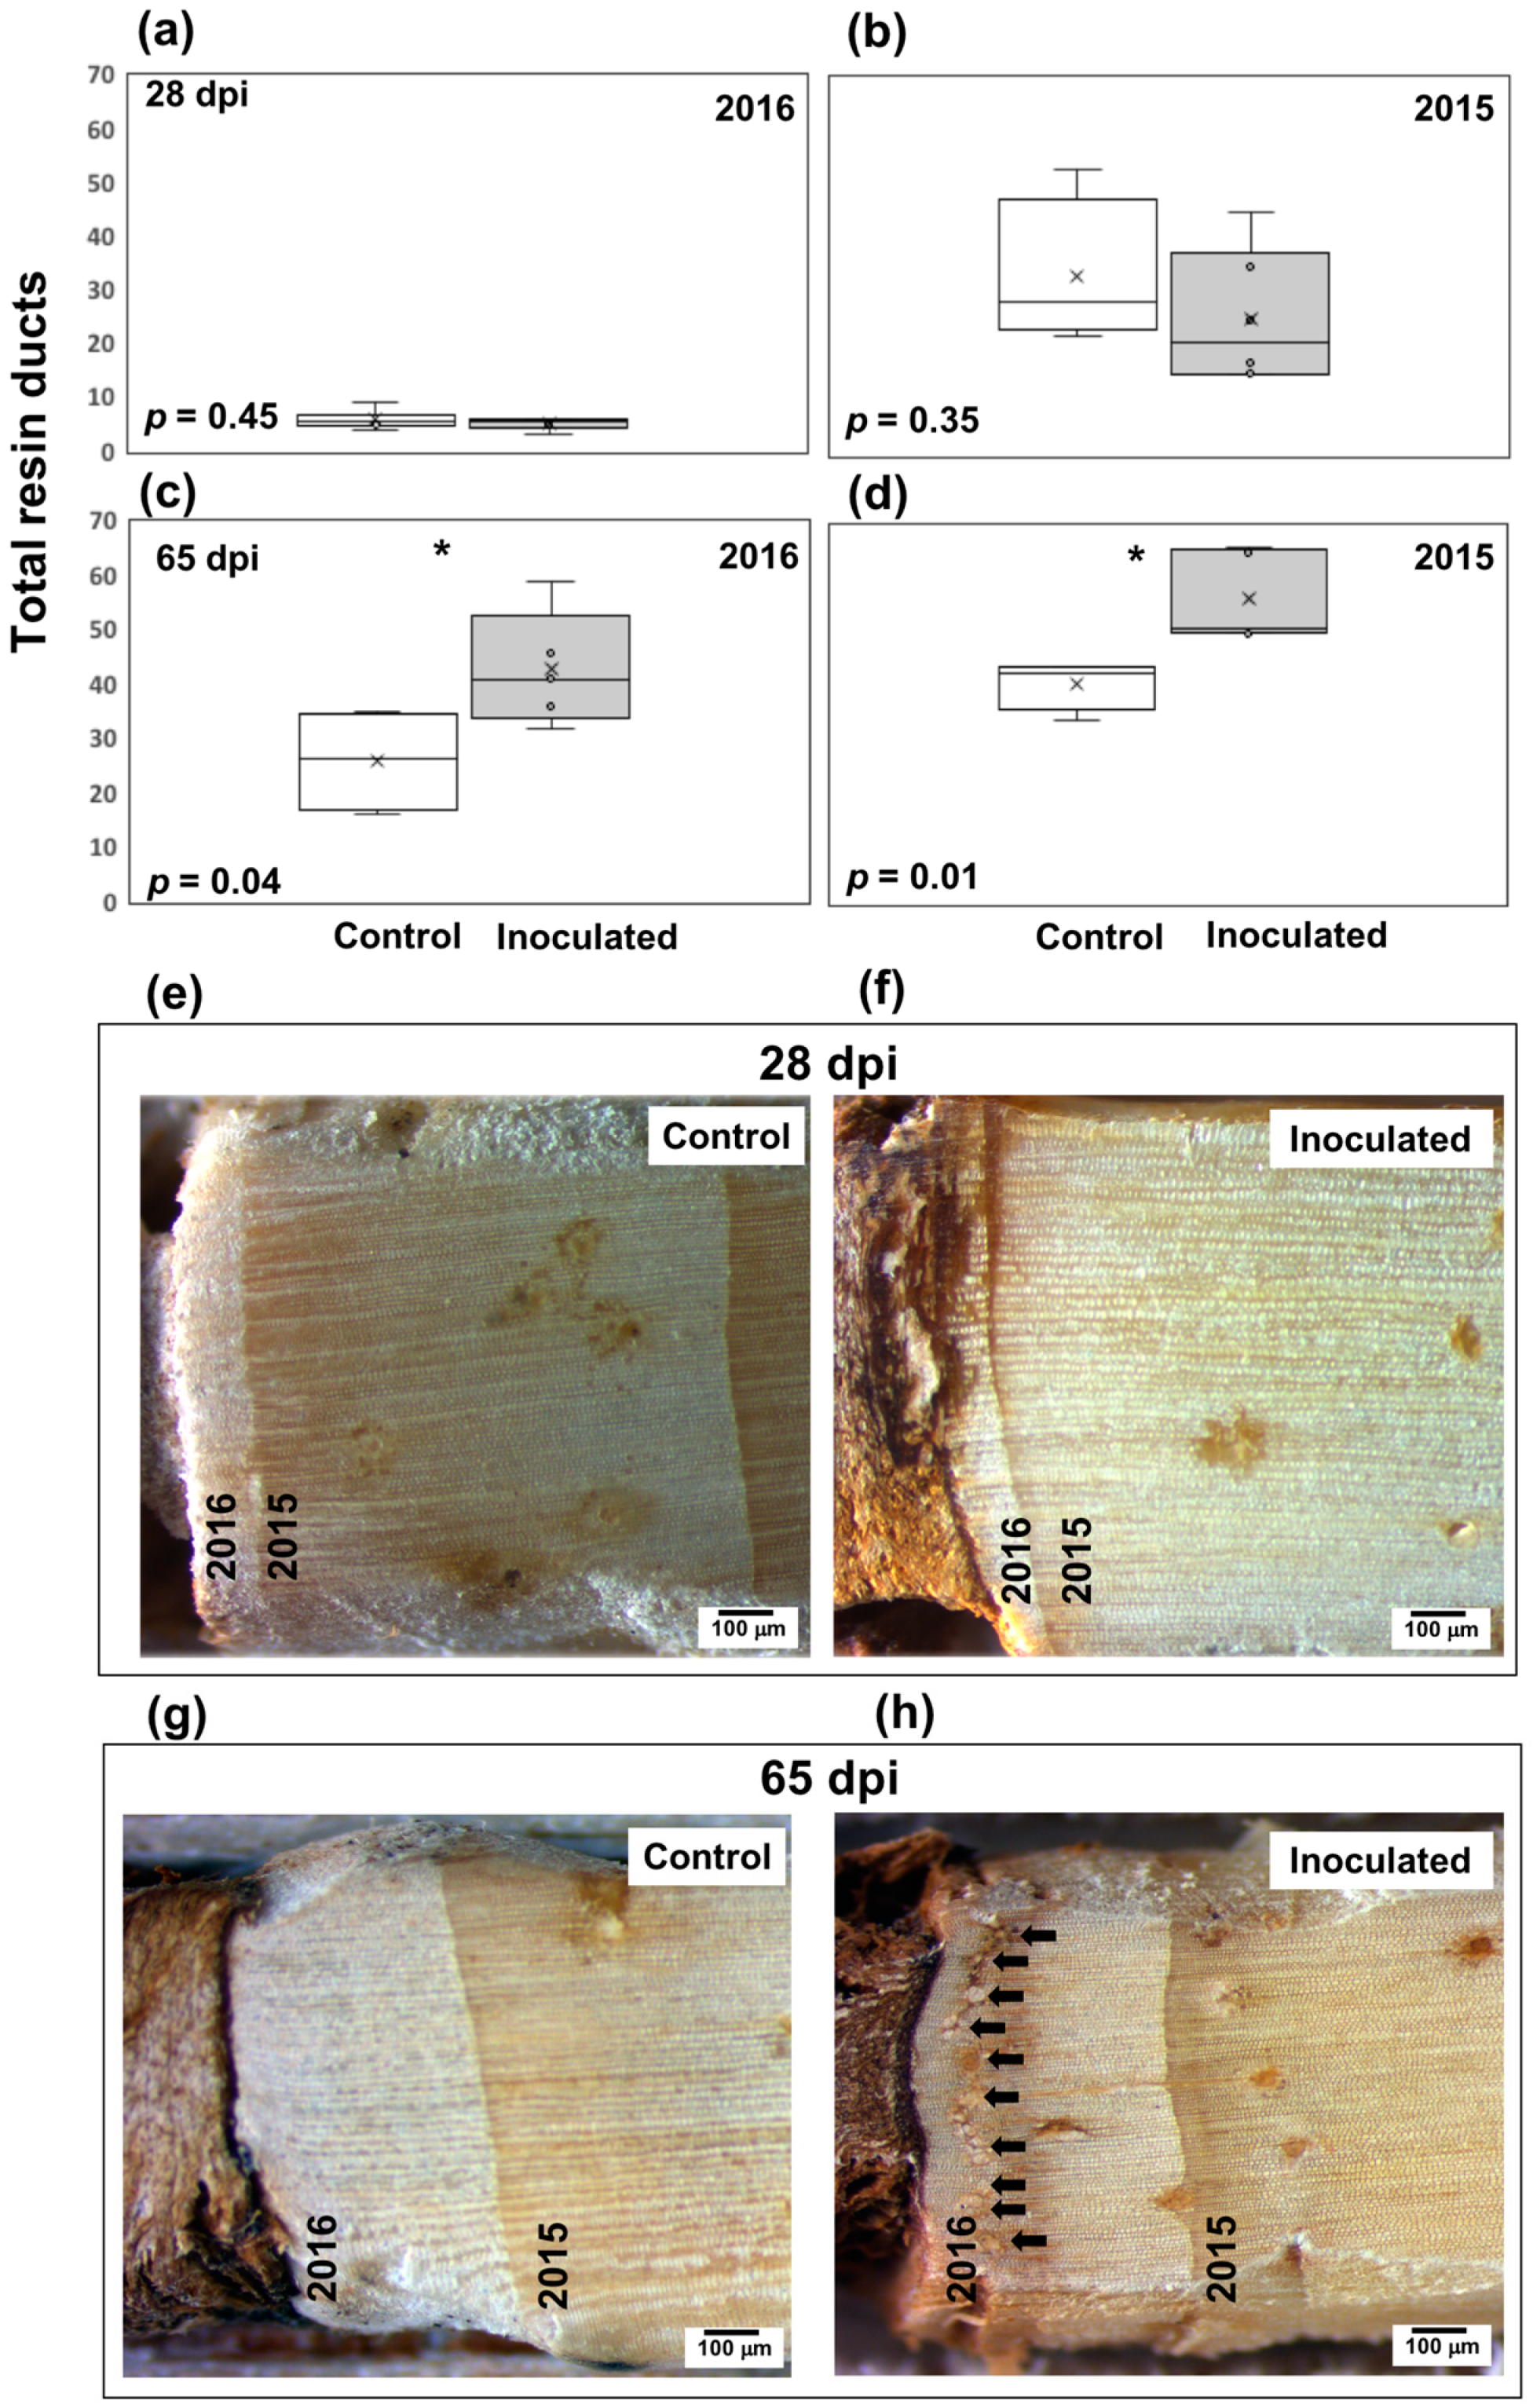
2.4. Resin Canal Traits

Quantification of resin ducts can be used to assess tree defense response [34]. Therefore, resin canals corresponding to the last two years (2015–2016) were measured from dried, mounted, and sanded 4.3 mm wide × 5–8 cm long increment core samples (Haglöf Inc., Långsele, Sweden). Briefly, increment core samples from each cardinal direction were secured in labeled plastic increment core trays (Forestry Supplies, Inc., Jackson, MS, USA), dried at 50 °C for 72–96 h, mounted and glued into grooved wooden increment core trays. Surface preparation of core samples were carefully sanded (100 to 2000 grit sanding paper 3M) following dendrochronological methods as described in Stokes and Smiley [35]. Five to ten images per sample were captured using a Zeiss Axiocam ERc 5s Rev. 2.0 (Carl Zeiss Microscopy GmbH, Göttingen, Germany) digital camera mounted on a Zeiss Discovery V8 stereoscope with the 1.6× objective. Number and size of secondary resin canals were recorded using Zen 2 software program (Zeiss Inc., Jena, Germany).

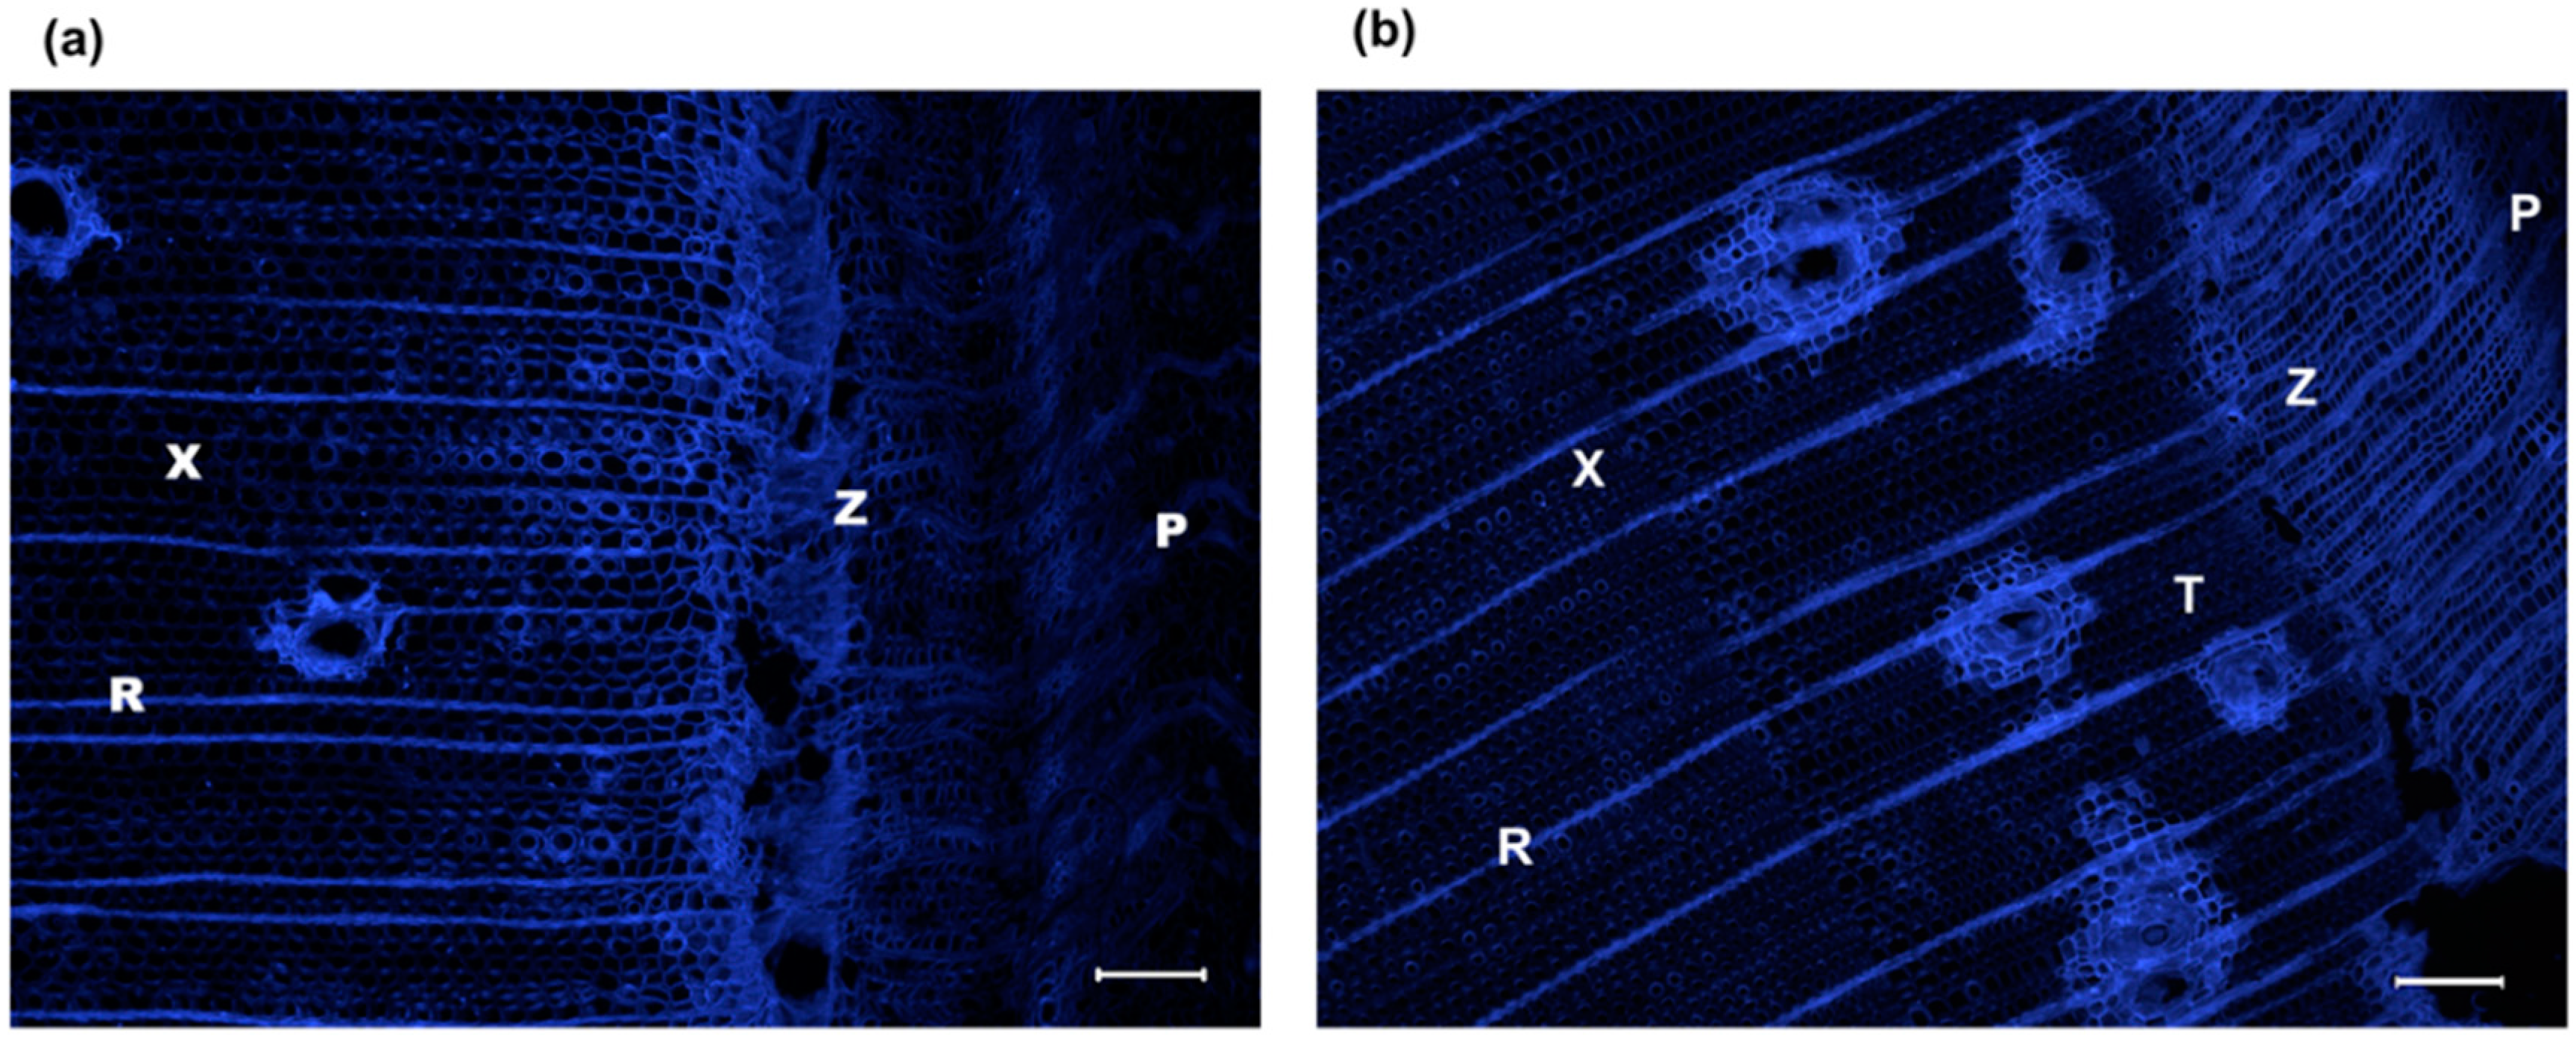
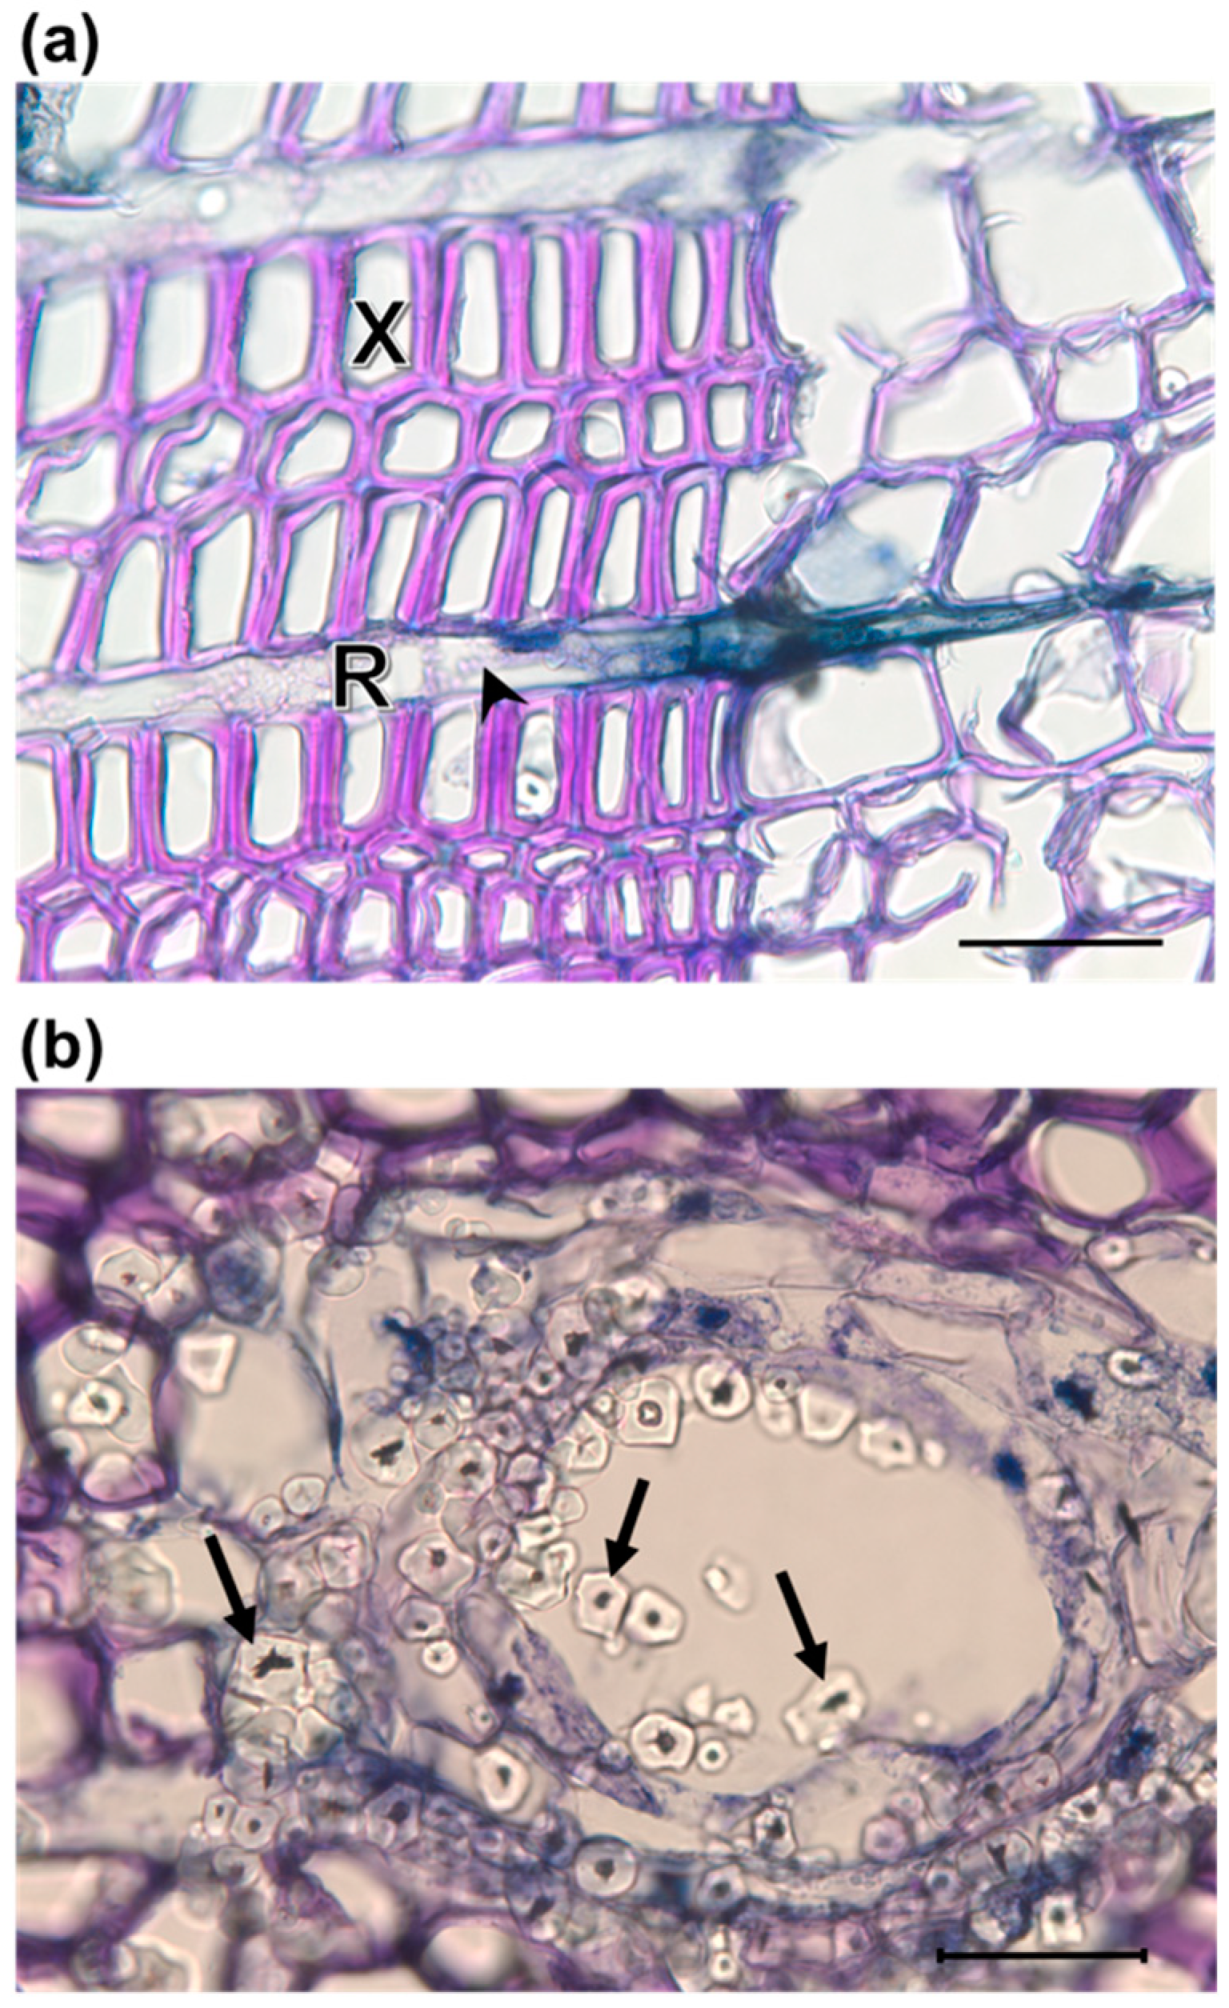
2.5. Detection of Fungus and Anatomical Traits for Plant Defense

Induced defense involves anatomical changes of specialized cells that produce chemicals (e.g., resins and phenolics) with known defensive properties. Bark and wood core samples (5-mm diameter) from each cardinal coordinate were taken and soaked in a solution of 95% ethanol and 50% glycerol (3:1 ratio, v/v) for a minimum of 18 h at 28 °C. Bark and wood sections (8–15 m thick) were cut with a G.S.L.1 microtome (Eidgenössische Forschungsanstalt für Wald, Schnee und Landschaft (WSL), Bir-mensdorf, Zürich, Switzerland). Samples were then soaked in distilled water and placed on a hot plate for 3–5 min. For histochemical analysis, sections were stained with 1% Rhodamine blue counterstained with 0.15% Methyl green in 0.2 M phosphate buffer pH 8.0, which allow the detection of O. minus [36]. Calcofluor white M2R (1 mg mL−1; Sigma Aldrich, Milwaukee, WI, USA), a fluorescent apoplastic dye, was used to stain suberized cell walls. The fluorescence of calcofluour white was detected at excitation of 400 nm and within emission range of 430–440 nm (blue). Slides were mounted on a mixture of Histoclear and Canada balsam (2:1 ratio). All the images were captured using a SPOT RT3 camera (Micro-Tech Optical, Inc., Bloomflied, CT, USA) accompanied with a compatible software.

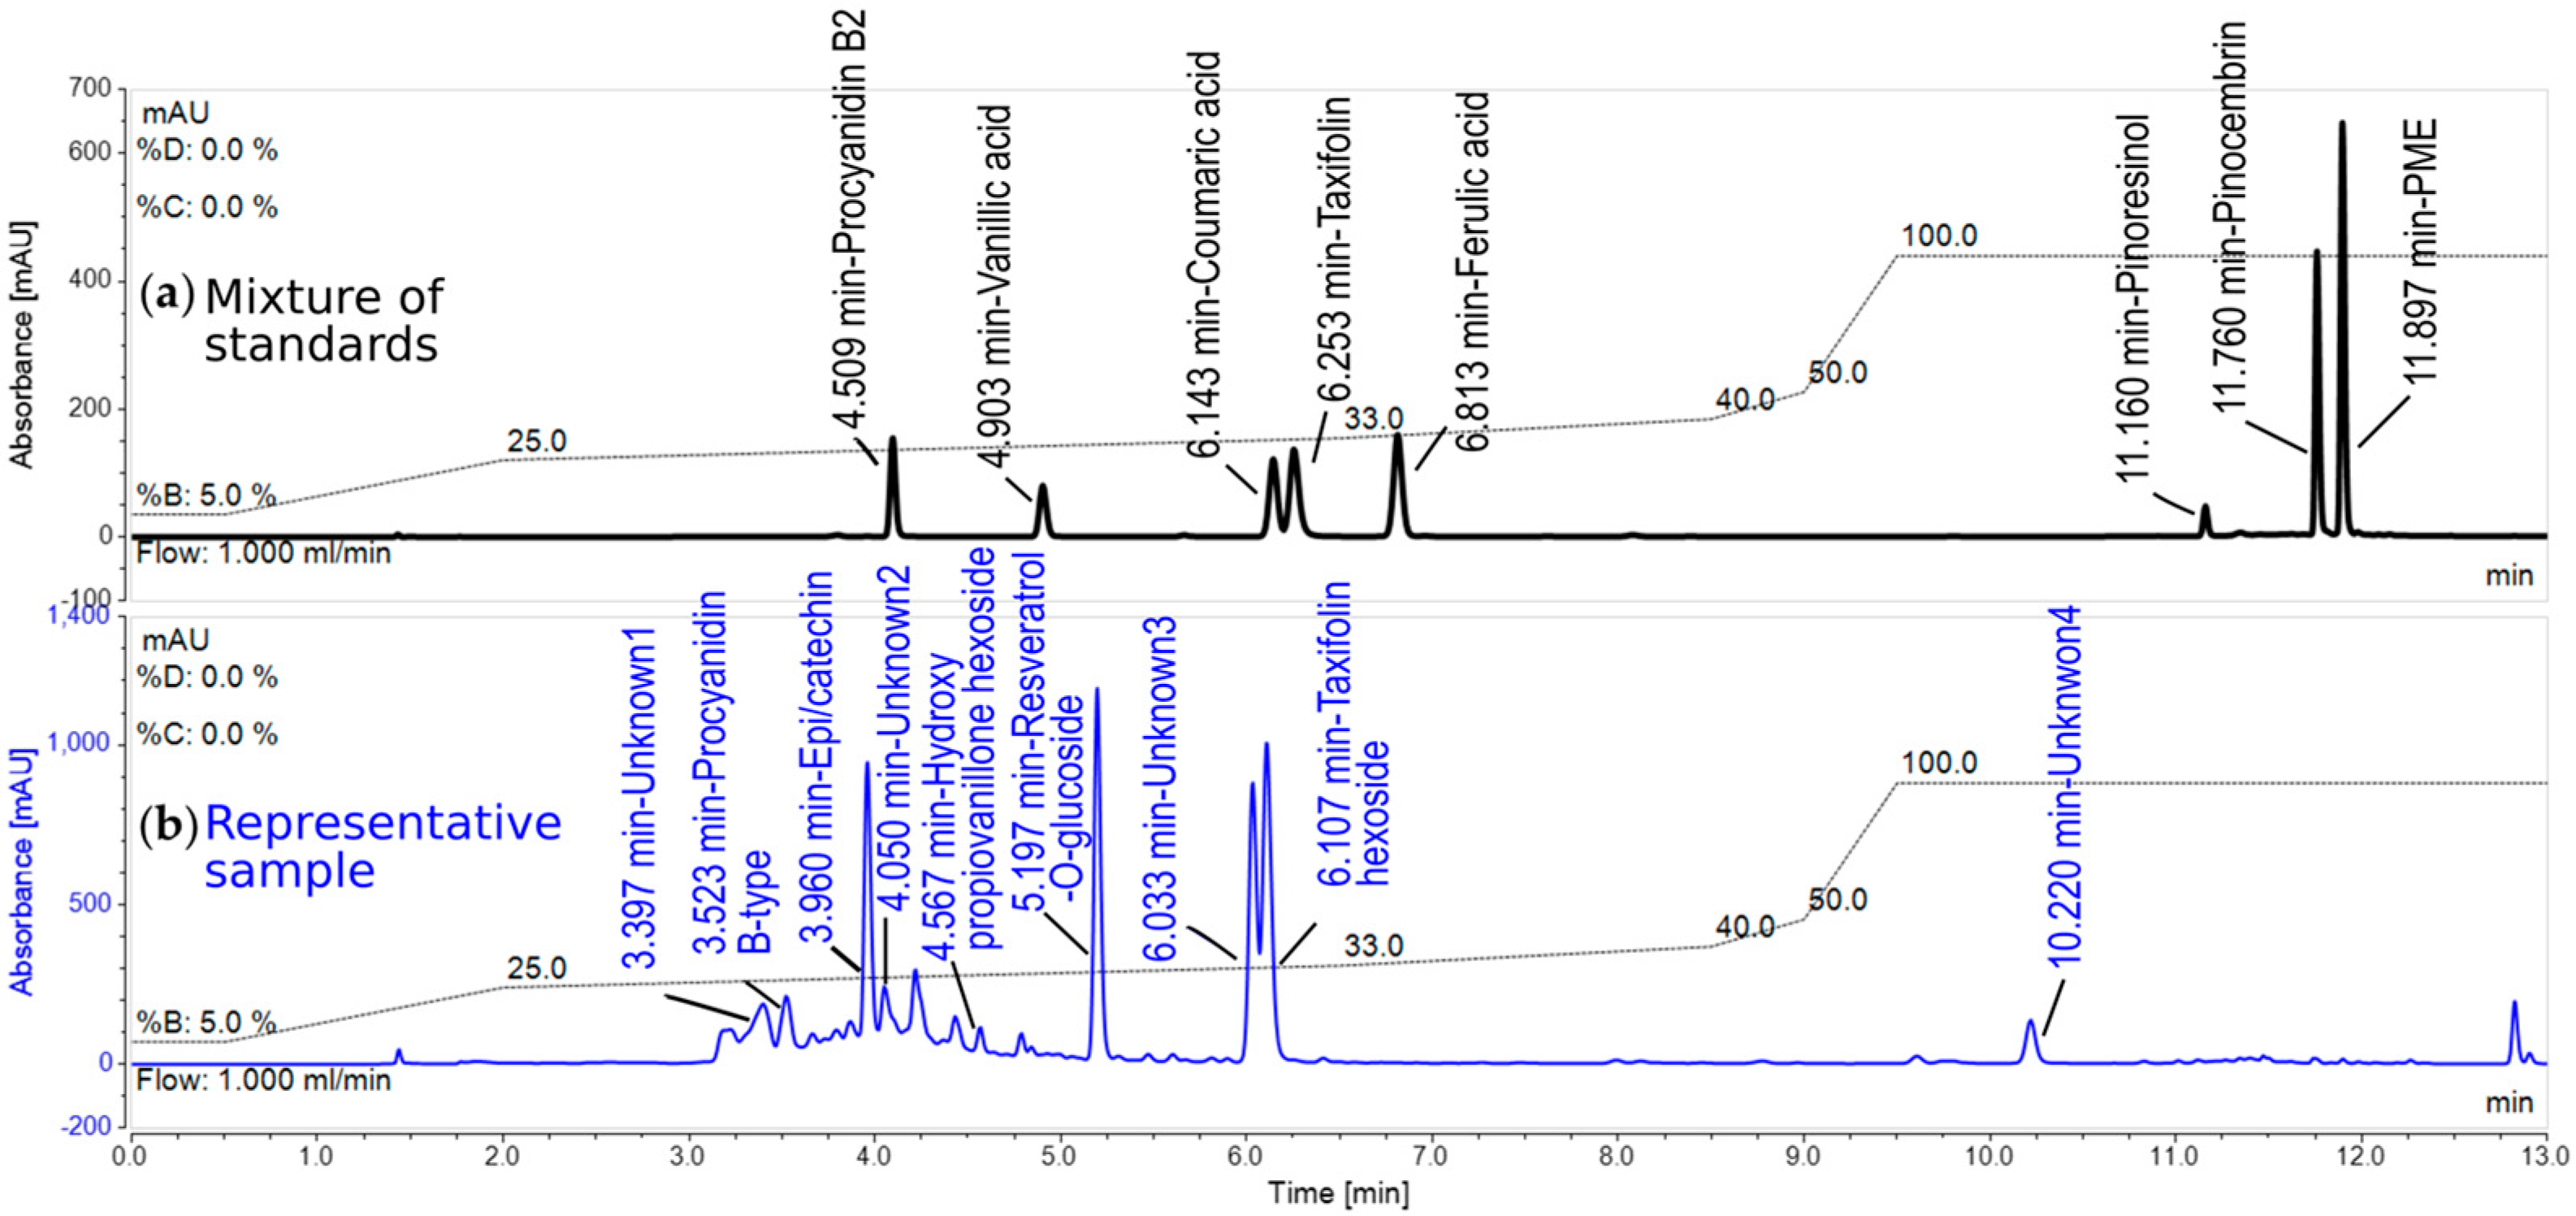
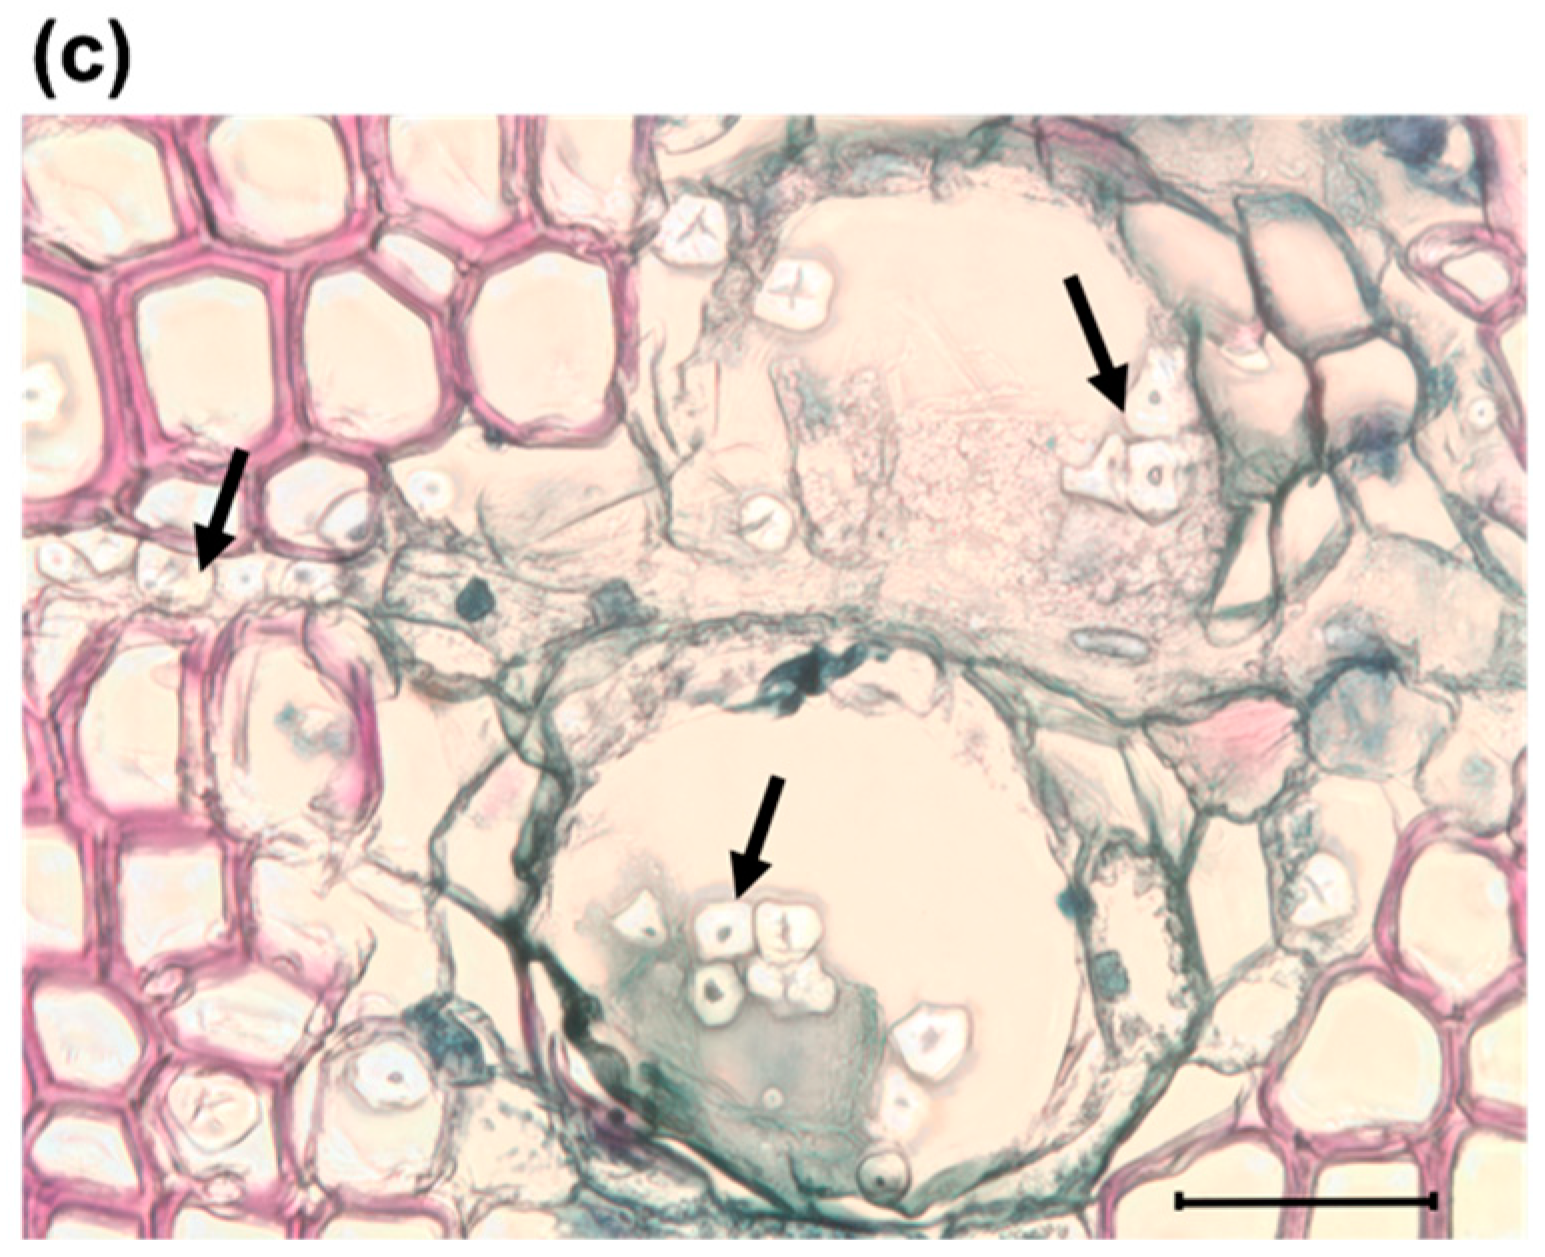
2.6. Analysis of Phenolic Compounds

For phenolic compounds extraction, 1.00 mL of ice-cold methanol was added to 100 ± 2 mg ground phloem tissue samples. Samples were sonicated for 30 min and centrifuged at 13,000 rpm (Eppendorf Accuspin Micro, Fisher Scientific, Pittsburgh, PA, USA) for 10 min. The supernatant was transferred to a 2.0 mL centrifuge tube and stored on ice. Extracts were syringe filtered (0.2 µM, PTFE, Thermo Fisher Scientific, Waltham, MA, USA) and stored for further analyses. An aliquot of 250 µL was transferred into a 450 µL capacity glass insert and placed into a 2 mL HPLC vial (Fisher Scientific, Pittsburgh, PA, USA) for chromatography analyses. Extracted tissue samples and the HPLC vials were stored in −80 °C prior to analysis.
Changes in phenolic compounds were analyzed using electrospray ionization liquid chromatography—photodiode array—tandem mass spectrometry (ESI-LC-PDA-MSn) (Thermo Fisher Ultimate 3000 Rapid Separation Liquid Chromatography (RSLC) connected to a Thermo Fisher Orbitrap mass analyzer, Waltham, MA, USA). Phenolic metabolites were then quantified using a separate Thermo Ultimate 3000 series RSLC system equipped with a temperature controlled autosampler, column oven and an Ultimate 3000 series photodiode array detector (Thermo Fisher Scientific). Detailed description of the operating conditions of LC-MSn and LC-PDA can be found in the supplemental section.
Based on previously identified compounds [37] and LC-MSn studies, a mixture of eight commercially available authentic phenolic standards were injected: procyanidin B2, vanillic acid, p-coumaric acid, taxifolin, ferulic acid, pinoresinol, pinocembrin and pinosylvin monomethyl ether. The mixture of compounds was serially diluted and each concentration level was injected in triplicate to the RSLC. Three out of eight compounds were used for true quantification while six of the phenolic metabolites found in the test samples were quantified using a semi-quantitative method. Chromatographic profiles of both a standard and a representative sample are presented in Figure 1. Procyanidin B2, p-coumaric acid, and taxifolin calibration curves were prepared using a least square method (Figure S1). A mid-level standard (250 µM) was run after every 8th sample to ensure robustness of the method. The PDA detector was set to collect all spectra between 220 nm and 390 nm. A post-run processing was carried out using Chromeleon 7.2 with a peak area cut-off 0.135 (mAU × Time).
Putative identification of the peaks from the unknown samples was performed using the retention time, a spectral pattern match with the authentic standards (or between the samples receiving differential treatments) and MSn fragmentation (Figure S2 and Table S1). Putatively identified compounds were presented in nmoles gm−1 FW (fresh weight). In those cases where standards were not available or not run (e.g., resveratrol-di-o-glucoside, epi/catechin and unknown (unk) 1–4), chromatographic peak areas were compared. Check standard peak area varied randomly between 3.75% and 7.50%.

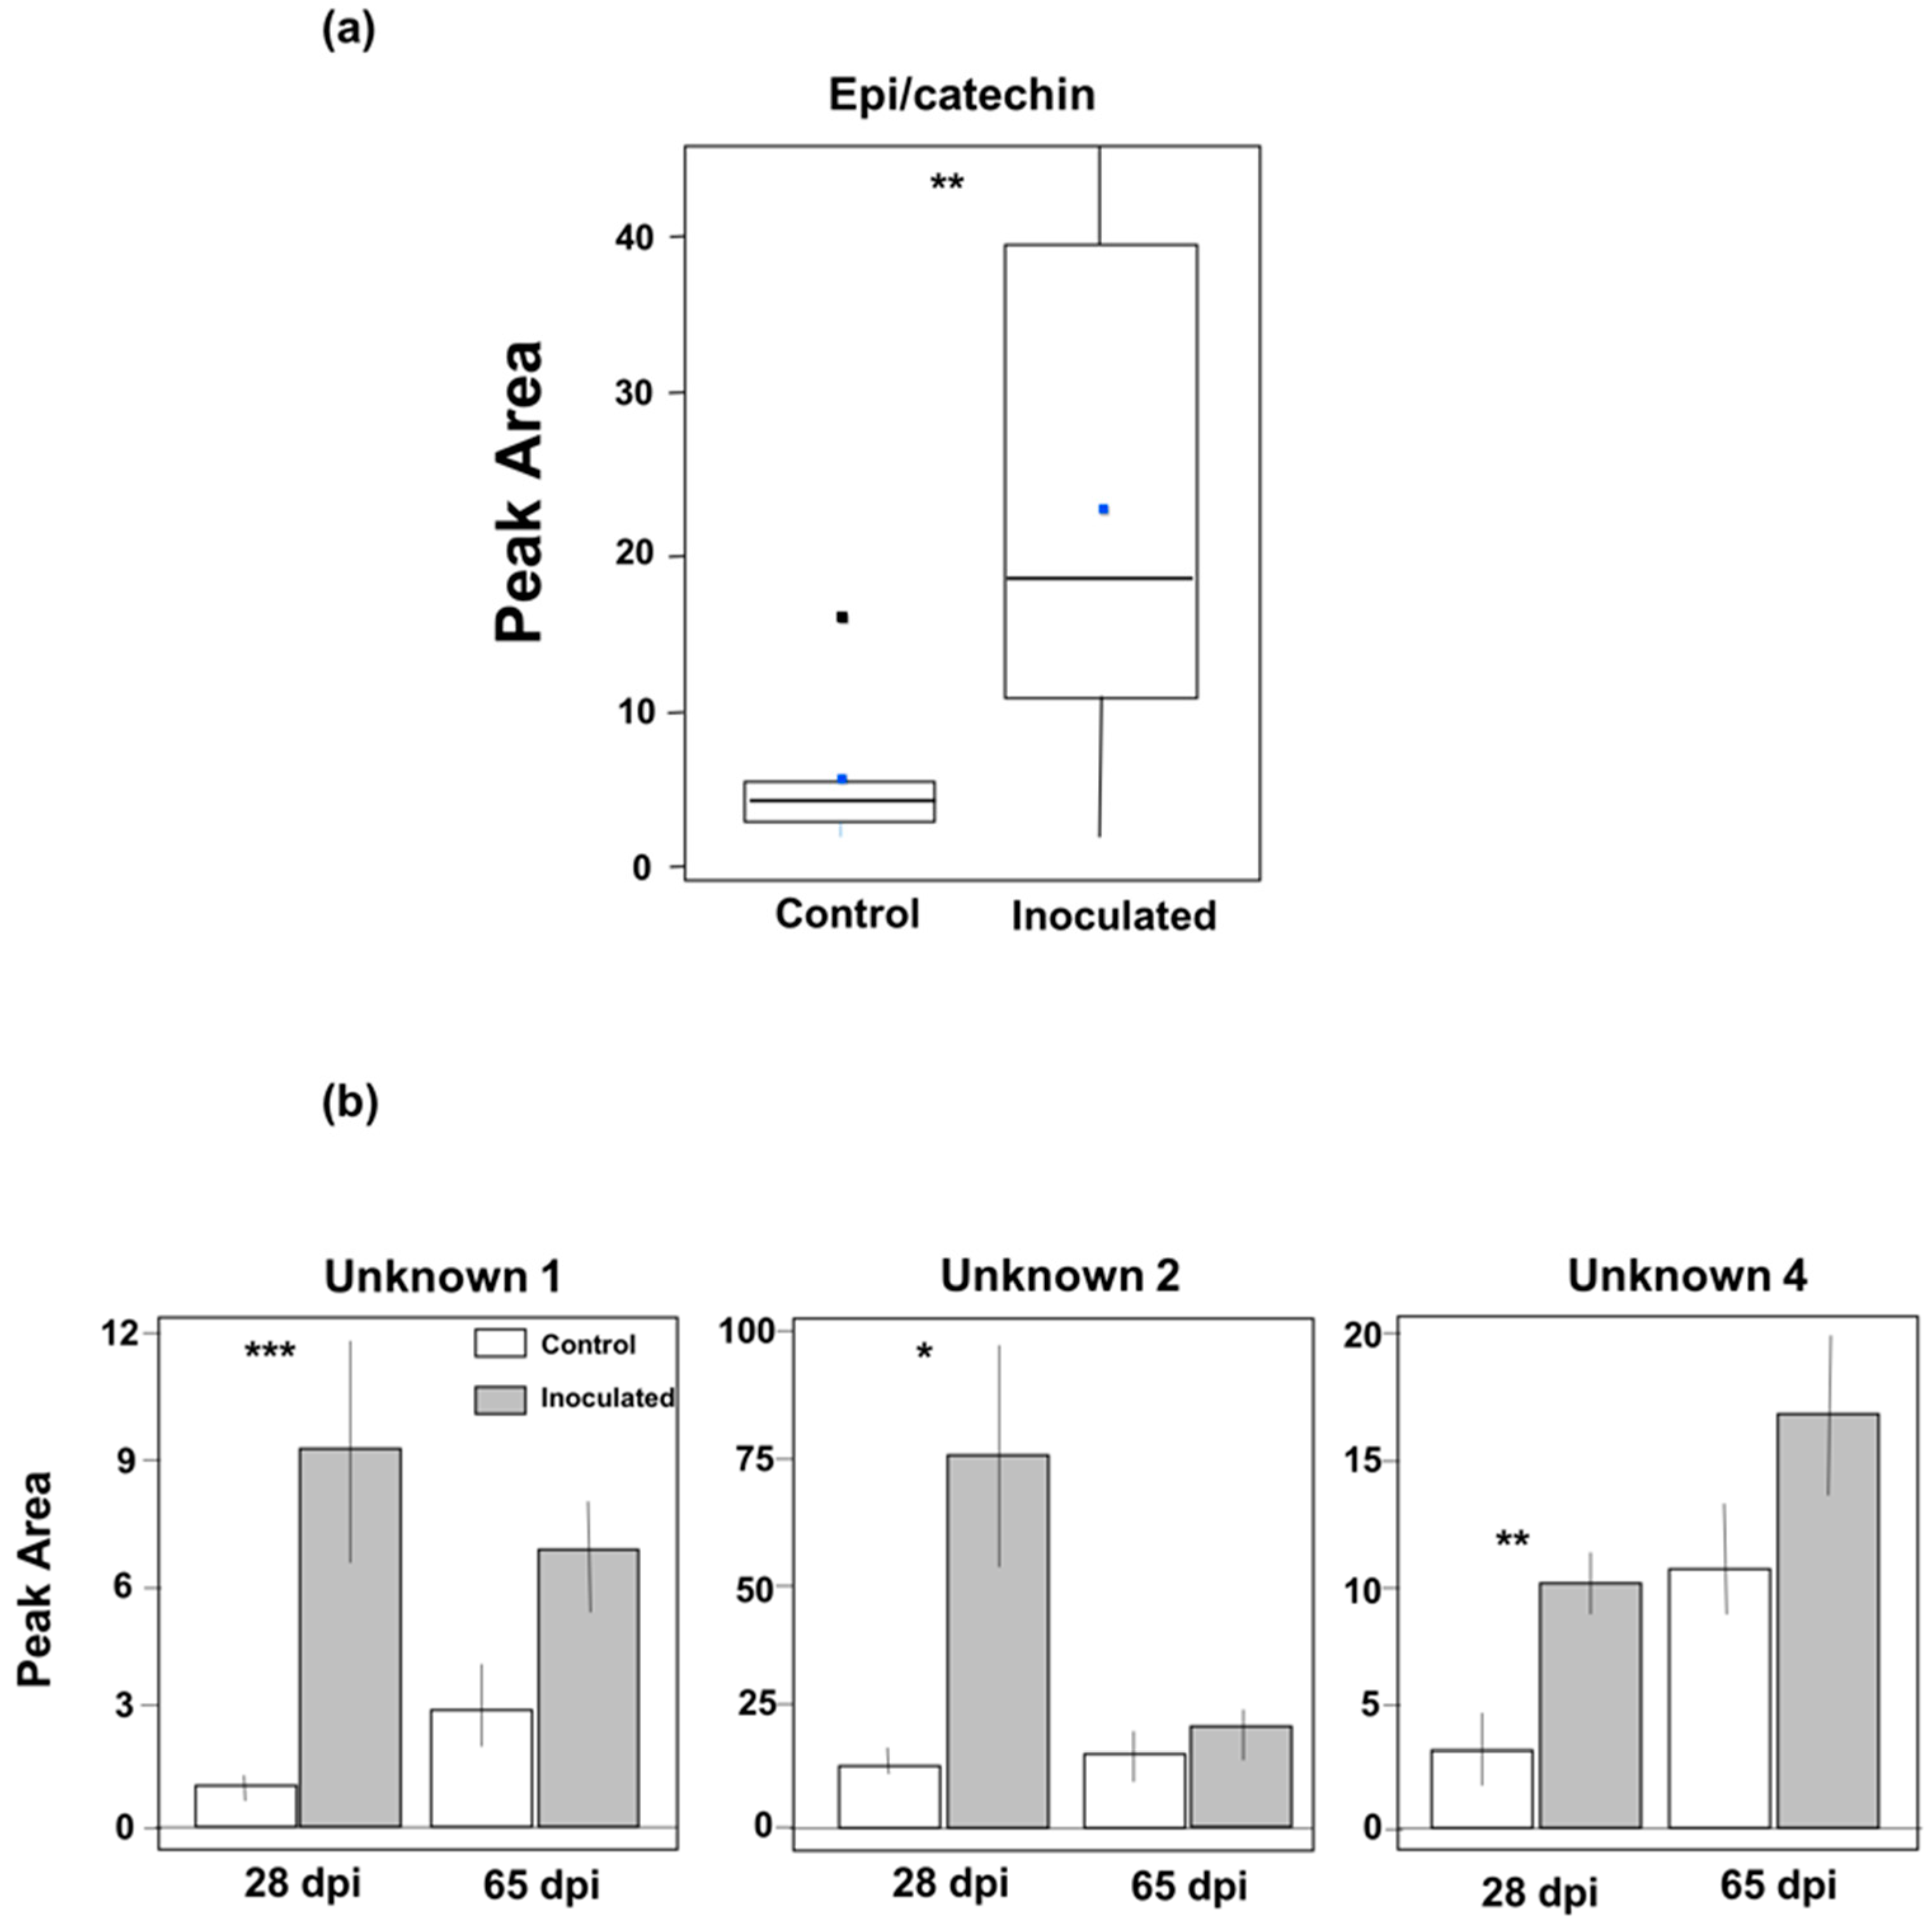
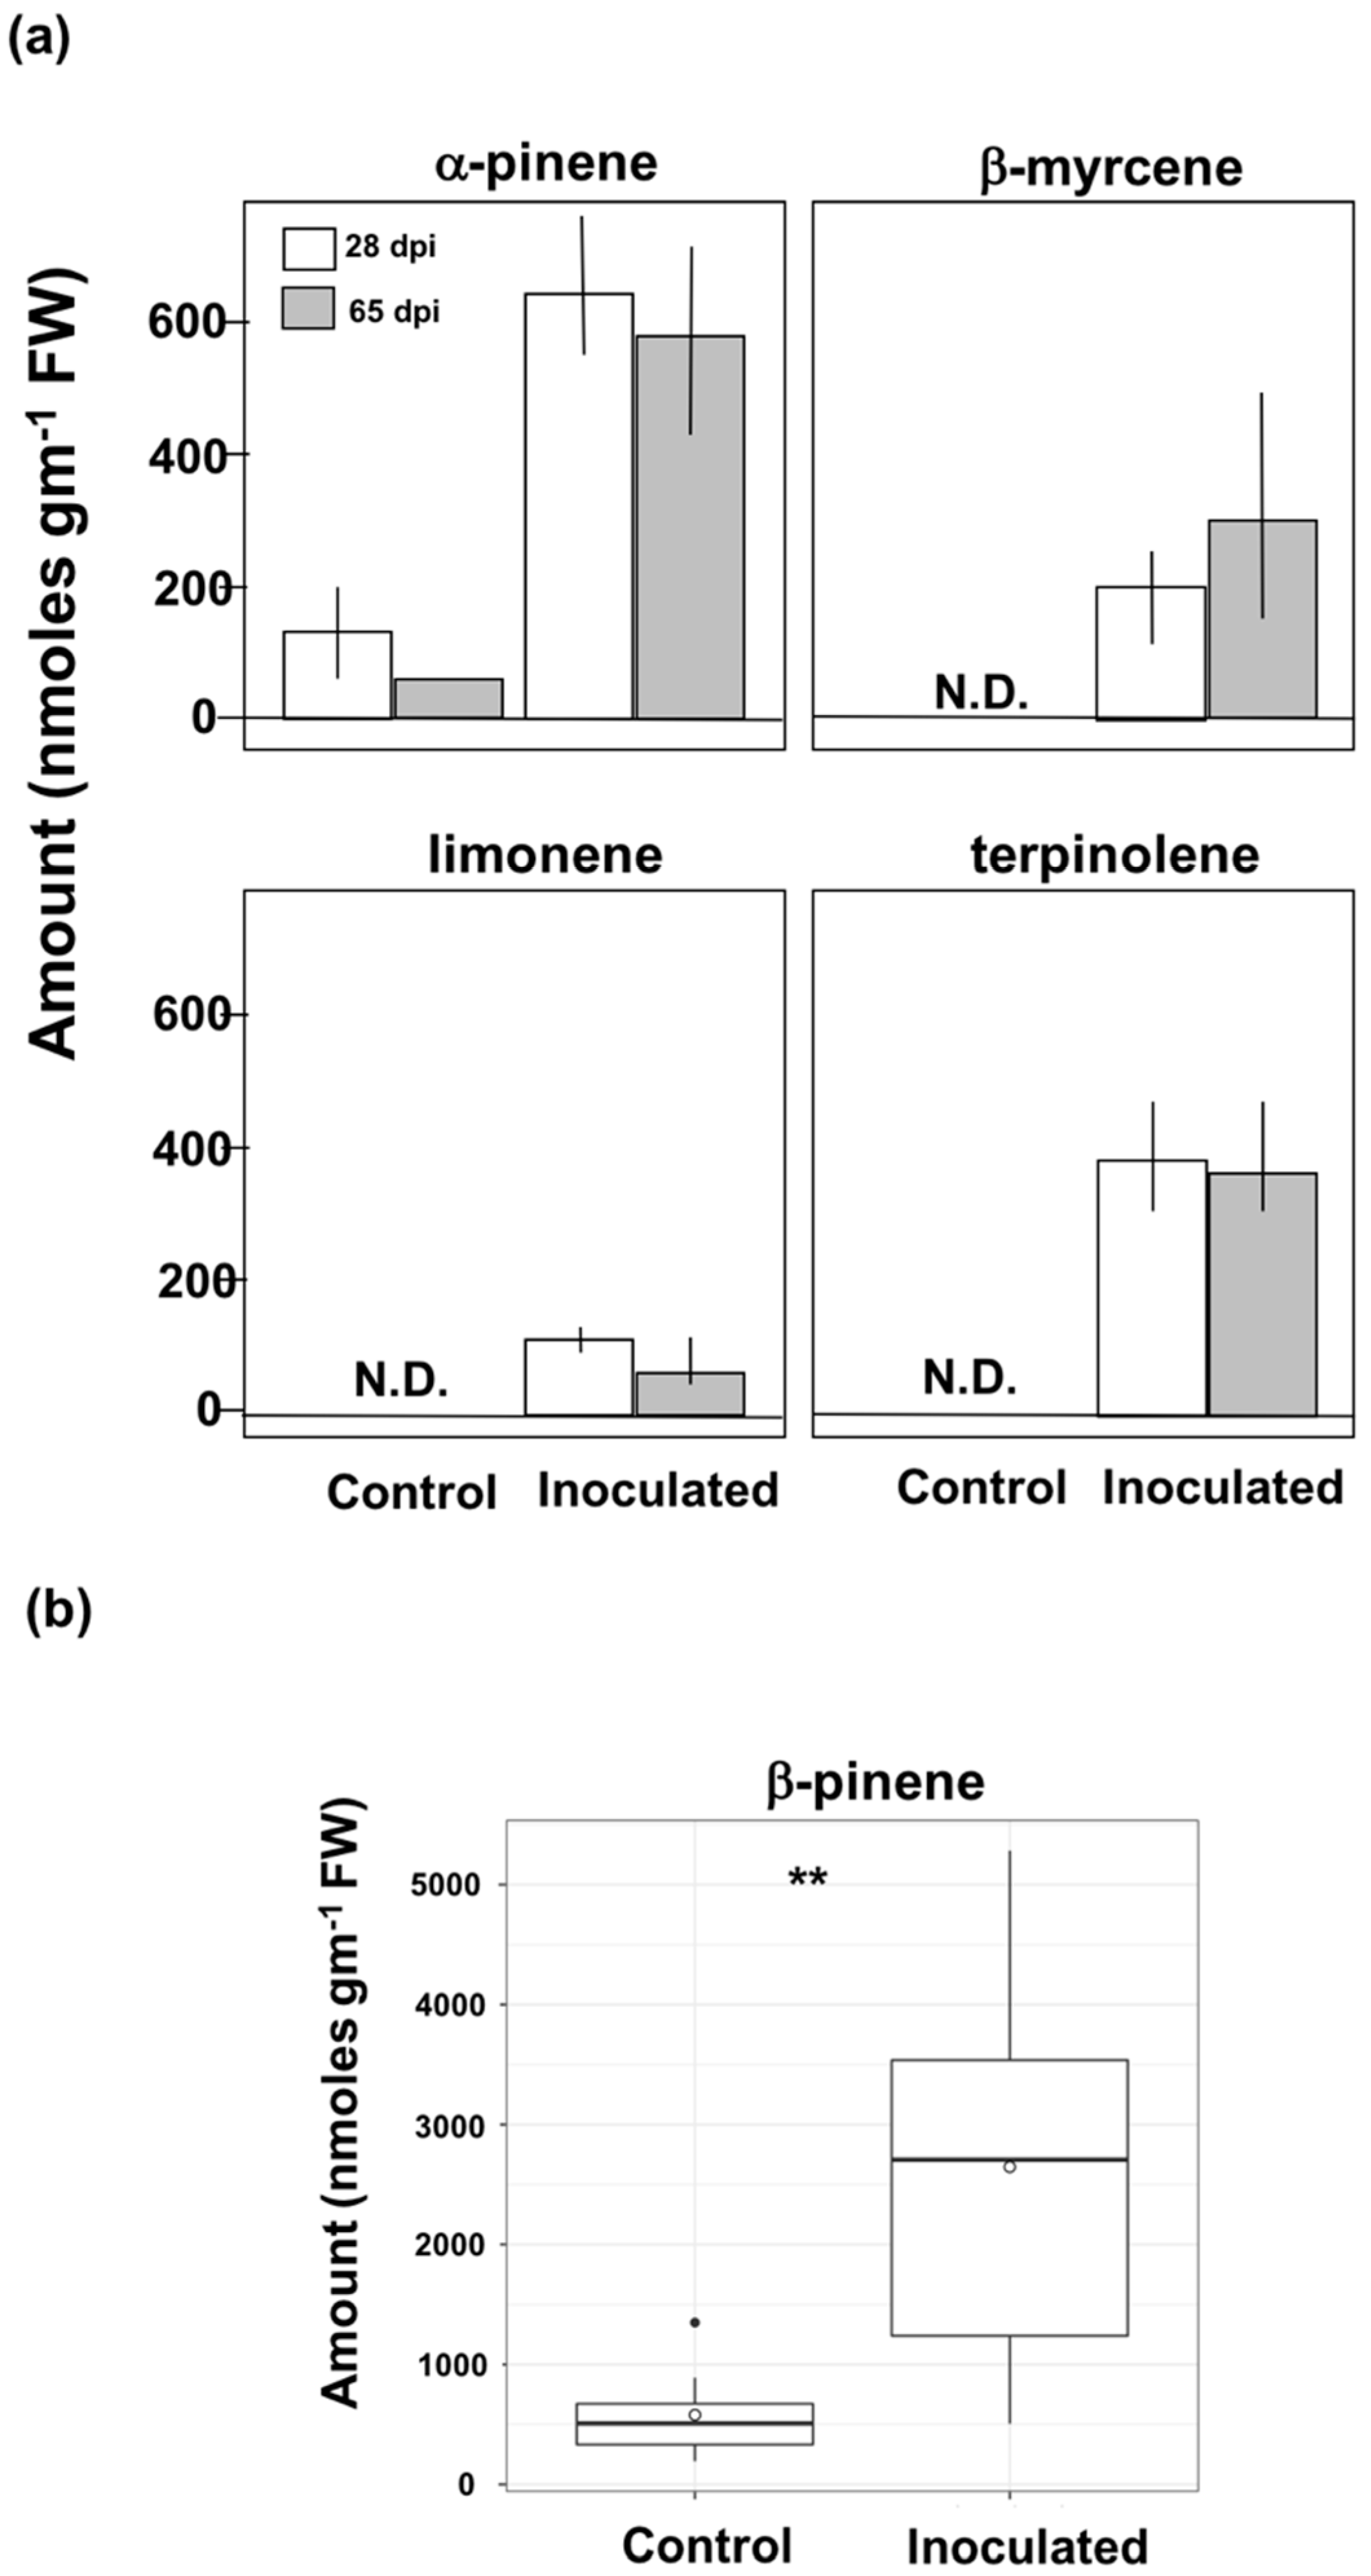
2.7. Analysis of Terpenoids

Analyses of the most common and biologically important monoterpenes were performed using the following standards: para-cymene (p-cymene), α-pinene, β-pinene, β-myrcene, terpinolene and limonene (Sigma-Aldrich, St. Louis, MO, USA). 100 ± 2 mg fresh phloem ground tissue was extracted in a 1.5 mL microcentrifuge tube (Fisher Scientific, Waltham, MA, USA) using two successive extractions of 500 µL n-hexane containing 50 µM p-cymene (Sigma-Aldrich, St Louis, MO, USA, 99.5%) as an internal standard. 500 µL of n-hexane was added to the tissue, agitated for 30 s, left overnight at 4 °C and centrifuged the following day at 13,500 rpm for 10 min. This process was repeated once more before filtering the combined supernatants using 0.2 µM, 17 mm Target 2 syringe filter (Fisher Scientific, Pittsburgh, PA, USA) to remove any solid particulate. For GC-MS analysis, a 750 µL sample was transferred to a crimped top glass vial (Chrom Tech Inc., Apple Valley, MN, USA) and stored at −60 °C until analysis.
Analyses were performed using an Agilent 6890 GC system connected to a CTC PAL liquid autosampler and 5973 mass selective detector (Agilent Technologies, Santa Clara, CA, USA). Separation of the monoterpenes was carried out using ZB-WAX (30 m × 0.25 mm × 0.25 µM) column (Phenomenex Inc., Torrance, CA, USA). Analysis conditions were modified from Raffa and Smalley [28] and optimized for the current model. Analyses were carried out in splitless mode and conditions were as follows: 1 mL min−1 constant flow (carrier gas), injector temperature 250 °C, transfer line temperature 290 °C, MS source temperature 250 °C, MS quad temperature 200 °C, mass range 50–450 Da (m/z). Initial oven temperature started at 60 °C and increased linearly up to 150 °C at 10 °C min−1 rate, then 5 °C min−1 rate to a final temperature of 220 °C and held for 3 min (total run time 26 min). For each standard mixture and sample run, a 2 µL sample was injected into the GC. A mixture of eight high purity standards was injected into the GC in triplicates at a concentration of 5, 10, and 20 µM. After 4 samples, a blank hexane and a mid-level standard mix (check standard) were injected to compute method variability.
Five out of eight monoterpenes (α-pinene, β-pinene, β-myrcene, limonene and terpinolene) were determined from the samples by comparing their retention times and mass spectral matches with the authentic standards. A three-point calibration curve for each of these five monoterpenes are presented in Figure S3. The absolute quantity was determined by using total ion chromatogram and considered the ratio of peak areas of the monoterpenes to p-cymene peak area (internal standard). The absolute amount of the monoterpenes was expressed as nmol g−1 FW. The data were acquired using Chemstation software (Agilent Technologies) while the analyses were carried out using ACD/MS Workbook Suite (2012, build: 59972) (ACD Labs, Toronto, ON, Canada) with an automated peak picking criterion of peak width 1 and peak height 0.1.

2.8. Statistical Analyses

A t-test was performed to compare the effects of O. minus inoculated versus non-inoculated control trees on resin duct quantity and size at each time point. Significant differences between means were evaluated performed with Sigma Plot 11 software package (SPSS, Chicago, IL, USA) after testing for normality.
Phenolic compound and terpenoid analysis were carried out using R (R Development Core Team [38]). Data visualization was performed using “ggplot2” package version in R [39]. For the analysis, treatment (control and inoculated) and time point (dpi), were considered as independent variables while “nmol gm−1 FW” and “peak area” were set as response variables.
To compare the effects of position of fungal inoculation (top or bottom) on trees, non-parametric Mann-Witney U tests or Wilcoxon signed rank tests (where limited number controls were present) were performed for each compound. One-way analysis of variance (ANOVA) was performed to model the effect of fungal inoculation and time point. A non-parametric Kruskal-Wallis test was performed on epi/catechin and β-pinene. All analyses were conducted at α ≤ 0.05 level and Tukey’s HSD post-hoc analyses were conducted using “agricolae” package in R [40].

3. Results

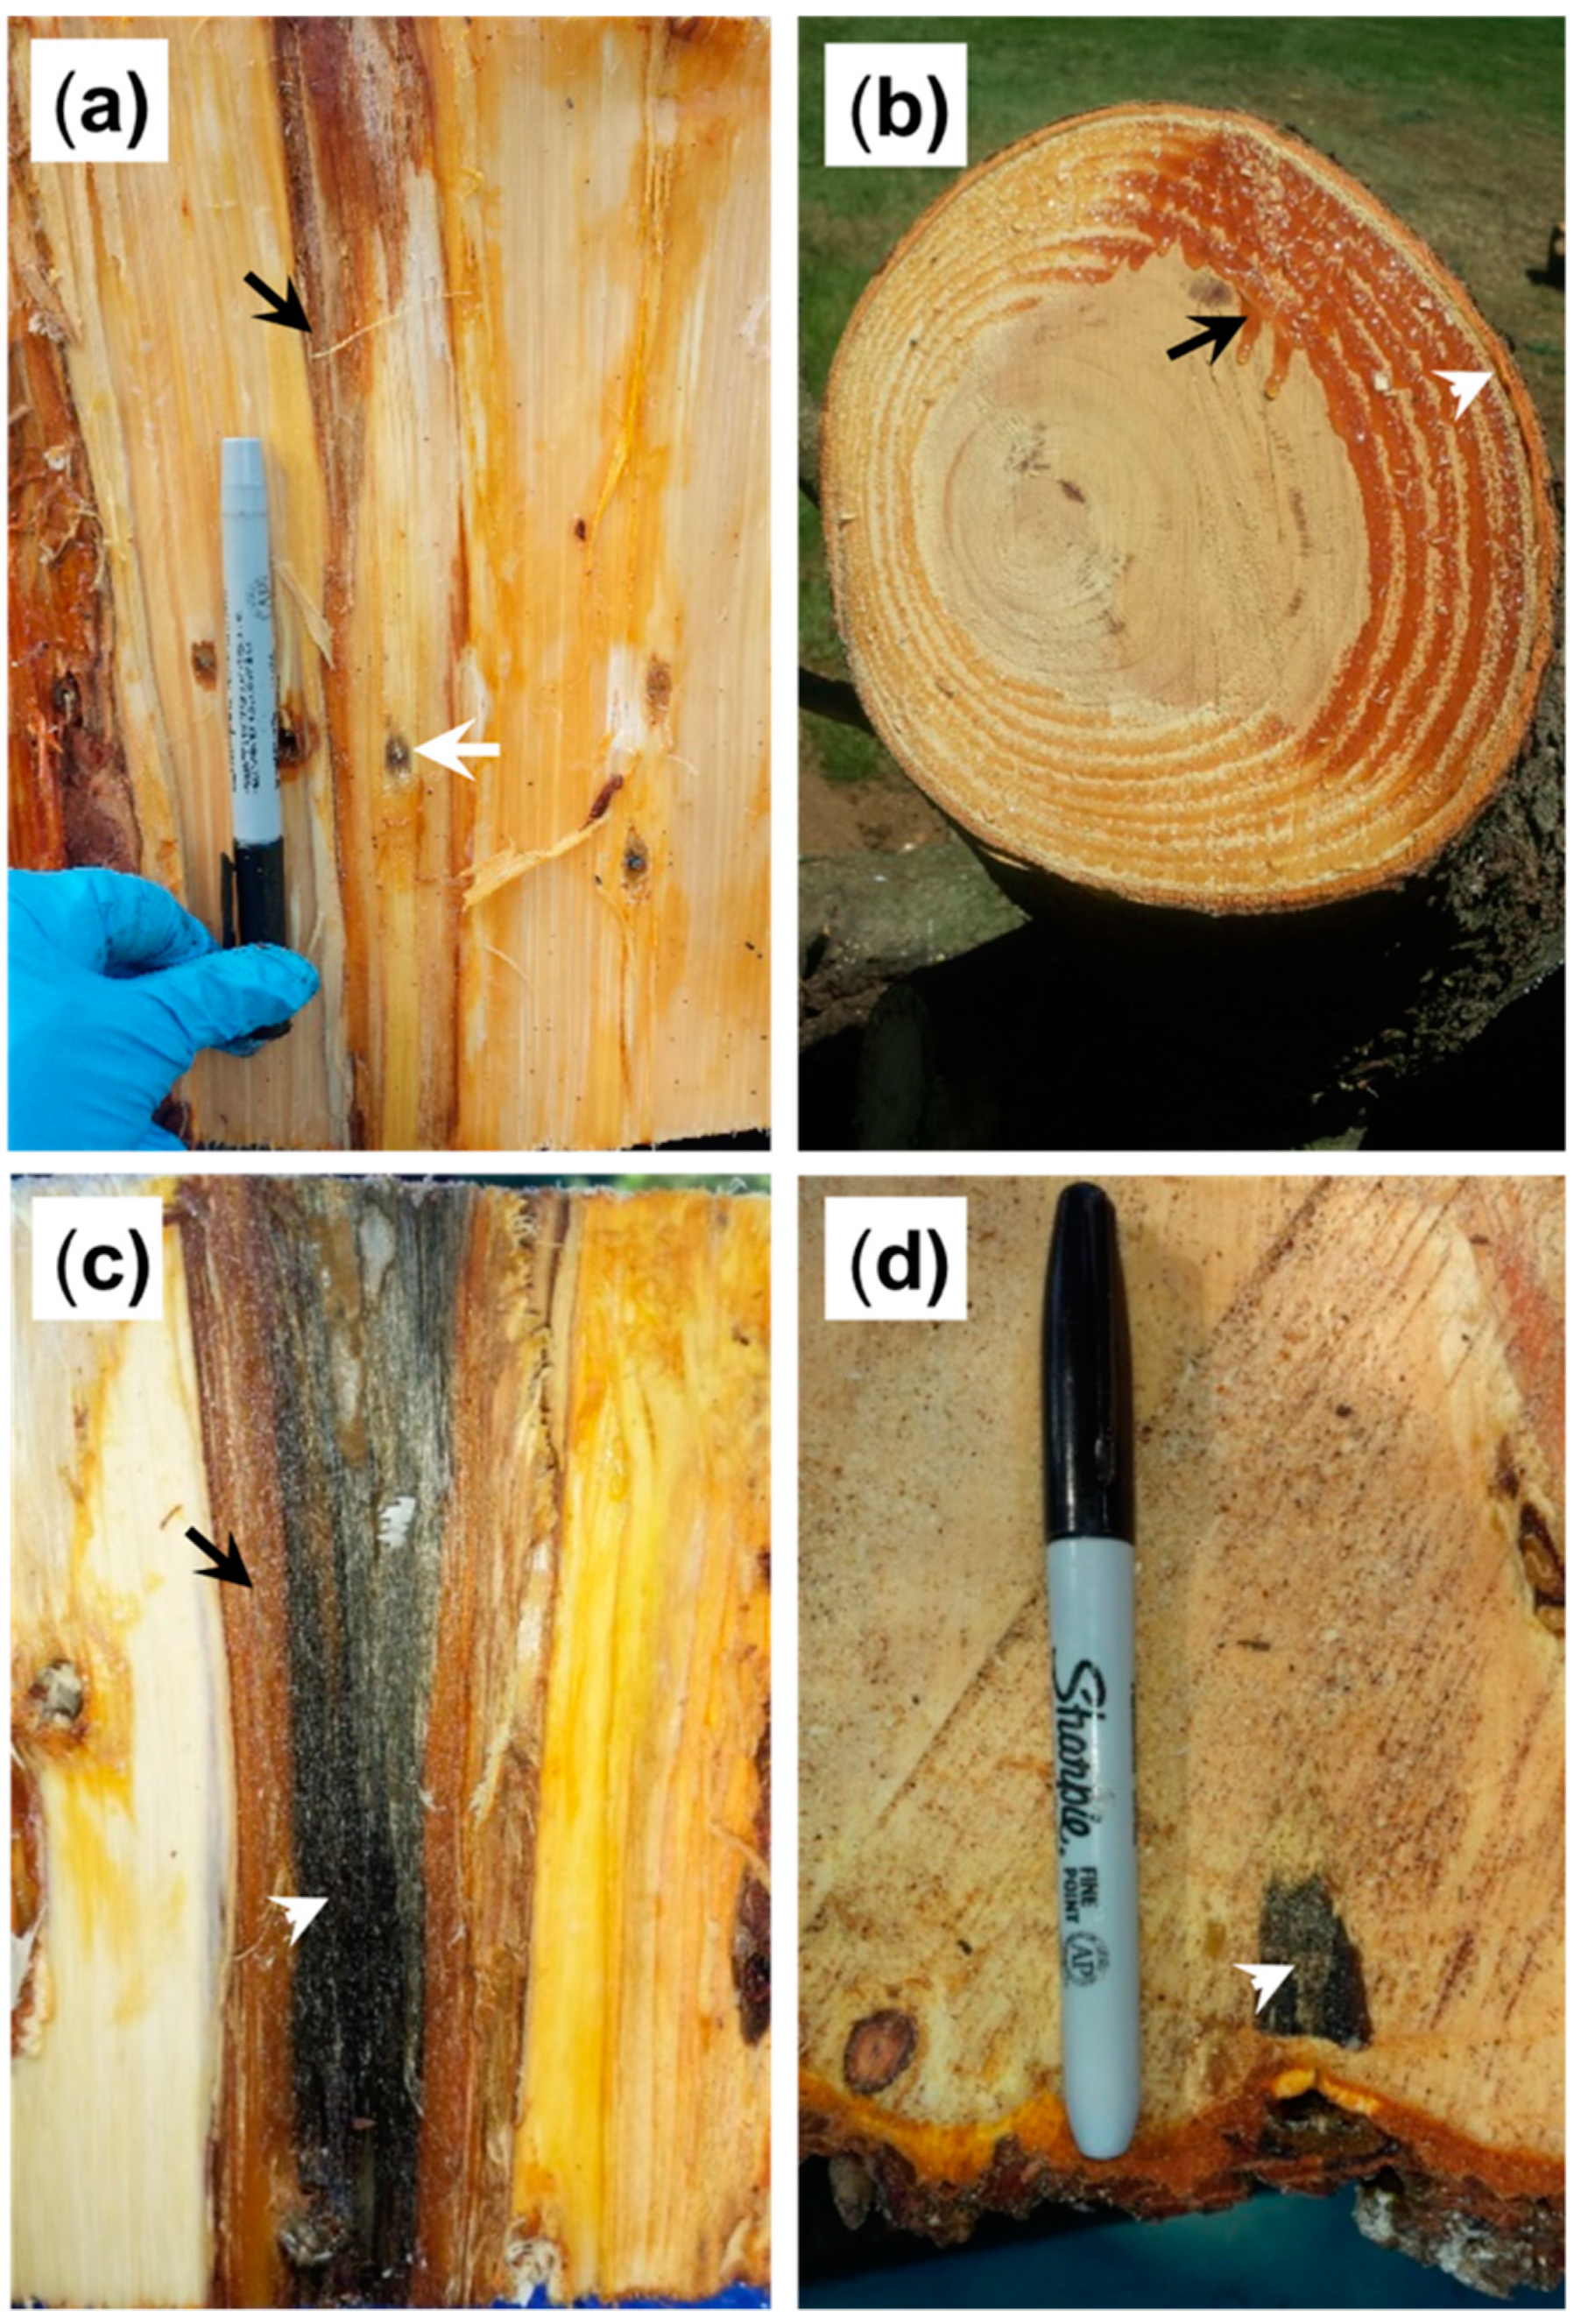
3.1. Anatomical Responses to Fungal Inoculation

Fungal inoculations in mature eastern white pine not only rendered induced lesions in the phloem and secondary xylem (Figure 2), but also produced a large amount of resin across several years of tree growth and around the inoculum area at 28 and 65 dpi (Figure 2a–c). Two types of resin, constitutive (primary) and induced (secondary) from the living parenchyma cell of xylem rays and phloem were distinguished in response to the blue stain fungi.
Although the blue-stain was visible in some areas in the phloem tissue, it was not observed in the sapwood immediately adjacent to the inoculation hole at 28 dpi (Figure 2b). At 65 dpi, blue-stain developed both horizontally and vertically on the sapwood (Figure 2c,d). The resin-filled reaction zone can also be observed by the brownish coloration along both sides of the blue-stain (Figure 2c). Although P. strobus induced a lesion around fungal inoculation, there was a continual progression of the fungus along the secondary xylem (Figure 2d). Unfortunately, at 28 dpi, lesions surpassed the sampled bolt area (100 cm long) making quantitative estimation of lesion length impossible. The characteristic shape of discolored wood and hence that of reaction zones are the result of fungal penetration which increases near the cambium as it colonizes the tree first longitudinally and then transversely (Figure 2c,d).
Further analyses of bark and wood anatomy, in their most recent 2 years of radial growth, showed an induced response of inoculated white pines with increased resin duct formation at 65 dpi during 2016 (t = −2.49 (df = 7), p = 0.04) and 2015 (t = −3.32 (df = 7), p = 0.01) (Figure 3). Formation of traumatic resin ducts was not observed in either control or inoculated trees at 28 dpi (Figure 3e,f). At 65 dpi vascular cambium switched from producing normal xylem cells (Figure 3g) to coalescing traumatic resin ducts (Figure 3h). Resin duct size was also measured but was not significantly different between control and inoculated trees (data not shown).
A close-up view of bark and wood samples stained with calcofluor white showed fluorescing traumatic resin ducts (TRD) near the cambial zone at 65 dpi (Figure 4). Traumatic resin ducts are usually localized to the area around the wound, and the number of ducts and their distribution are influenced by the severity of the wound. Our data shows that the traumatic resin ducts have the same anatomy as those produced intermittently in normal xylem.
Rhodamine blue and methyl green were used to visualize fungal presence. At 65 dpi the presence of fungal hyphae was observed in cell rays of secondary parenchyma cells (Figure 5a). Along with the fungal hyphae, several starch granules in resin ducts-associated secretory epithelial cells, parenchyma cells, and ray parenchyma cells immediately adjacent to the RDs in the xylem of infected tissues, were also noticeable (Figure 5b). Only very few granules were observed in axial xylem duct-associated cells in control trees (Figure 5c).

3.2. Induction of Phenolic Metabolites and Terpenoids

Based on peak selection and integration parameters, a total of ten peaks were considered for analysis. A list of putatively identified compounds are presented in Figure 1 and Table S1. Initial chemical analyses were performed on both top and bottom phloem tissues close to the inoculation hole. Individual phenolics and monoterpenes showed that samples collected from top and bottom were not statistically different; therefore, responses for each compound were averaged per tree.
The effect of fungal inoculation and time point (28 and 65 dpi) was modeled for each phenolic compound, using, one-way ANOVA. Interaction represents significant changes in metabolite concentrations due to interaction of fungal presence in trees for a given time. Both main effects were significant for procyanidin B-type (p1,17 = 0.03), unk1 (p1,15 = 0.005), unk2 (p1,16 = 0.023) and unk4 (p1,17 = 0.008); however, interaction treatment × dpi was only significant for unk2 (p1,16 = 0.04) (Table S2). Furthermore, we used a factor level mean comparison post-hoc analysis to model each significant main effect in case of non-significant interaction [41]. Constitutive levels of p-coumaric acid (a.k.a. coumaric acid) was below detection limit in most cases, so, statistical analyses were not conducted (Figure S4). Inoculated trees exhibited a slightly higher taxifolin hexoside content compared to control; however, these differences were not significant (Figure S5).
Fungal inoculation significantly increased the amount of epi/catechin in trees (2.75 fold) (χ2 = 6.66 (df = 1), p = 0.01) (Figure 6a and Table S3); however, these increases were not observed over time (Table S4). A Tukey post-hoc analysis resulted in statistical differences for unk1, unk2, and unk4 (Figure 6b). While a significant induction of unk1 (8 fold), unk2 (5 fold) and unk4 (2 fold) were observed at 28 dpi, the effect seems attenuated at 65 dpi (Figure 6b). Hydroxypropiovanillone hexoside, resveratrol-O-glucoside, and unknown 3 were not significantly different in response to inoculation with O. minus (Table S2).
For terpene analyses samples from top and bottom were also combined. Monoterpene concentrations in control trees were low and often below detection limit. However, quantitative analyses shown that terpinolene, α-pinene, β-myrcene, and limonene were induced due to fungal inoculation (Figure 7a). Significant increases (4.4-fold) were observed in β-pinene due to fungal inoculation (χ2 = 9.52 (df = 1), p = 0.002) (Figure 7b and Table S5).

4. Discussion

4.1. Anatomical Responses to O. minus

O. minus had the capacity to extend in the sapwood of eastern white pine demonstrating its level of fungal pathogenicity and ability to compromise the resistance of this species. As suggested in previous reports, O. minus grows rapidly to gain access to food and produce fruiting bodies, while exploiting tree defenses [9]. O. minus has also been involved in facilitating initial beetle establishment by depleting resin flow rate [8]. In our study, O. minus inoculated eastern white pine showed resin accumulation along with lesion formation around the inoculation area. Despite resin antimicrobial activity, O. minus progression was observed at 65 dpi along the tree sapwood, indicating moderate aggressiveness and ability to surpass constitutive defenses. In the context of blue-stain and conifers, lesions are interpreted as measure of effective compartmentalization, while more terpenoids, phenolics, and resins are synthesized and secreted into the reaction zone to kill the fungal pathogen [42,43,44]. The lesion developed by eastern white pine is a response to try to confine fungal growth, though the blue stain observed at 65 dpi can be attributed to the aggressiveness of O. minus to colonize the tree phloem.
Consistent with the lesion development, anatomical analyses showed that P. strobus comprise a greater quantity of preformed resin ducts followed by induced traumatic resin ducts. It has been shown that formation of TRDs are crucial for tree resistance to bark beetles [45,46] and that traumatic duct develops in approximately 2 weeks for several species [45]. Late development (65 dpi) of P. strobus TRDs might compromise a rapid and effective defensive barrier to invasion/infection at earlier stages of beetle attack. Resin production has been considered as a primary defense response in conifer xylem, especially in pines [47]. Resin impregnation in P. strobus suggests a constitutive mechanism of this species to limit beetle/fungal colonization. However, pine species that are relying on resin-based defenses can be more susceptible to tree-killing bark beetles as compared to species in the non-Pinaceae group which rarely suffer from bark beetle attacks [42,45]. As demonstrated in other pine-beetle interactions [48], starch accumulation in inoculated P. strobus can be an indicator of carbohydrate availability for C-based defense chemicals.

4.2. Phenolics and Terpenoids Involved in Eastern White Pine Induced Response

Epi/catechin, unk1, 2 and 4 were significantly induced by O. minus inoculation. Similar studies have shown that flavonoids including flavan-3-ols are involved in defense against pathogens [49,50]. In Picea abies, significant increase of (+) catechin was observed upon inoculation with a bark-beetle vectored fungus [22]. In this study, we observed induction of three unknown compounds of which unk 1 and 4 seem structurally related (MS1–MS4); although they have different retention times (3.40 min vs, 10.22 min) and PDA spectrum (Table S1 and Figure S2). All three compounds were significantly increased at 28 dpi, indicating a strong induced response against the fungal attack. The interaction between fungal inoculation and dpi was significant for unk2 indicating that the metabolite concentration is altered over time. Significant increases of unknown phenolic compounds at 28 dpi can partly explain P. strobus tolerance response to aggressive O. minus, and warrants further study.
Constitutive amount of β-myrcene, limonene and terpinolene were below detection limit; however, fungal inoculation significantly induced the production of these compounds. In addition, significant increases in β-pinene suggests that O. minus colonization could be limited perhaps due to combined induction of these monoterpenes. Limonene is the most toxic monoterpene implicated in resistance to both insects and disease agents in southern pines [17,51]. Similarly, Raffa and Berryman [52] showed that β-myrcene, limonene and terpinolene in combination with α- and β-pinene are directly toxic to D. frontalis adults in loblolly pine. The implication of a long-term (65 dpi) induced monoterpenes response can be both beneficial and deleterious to P. strobus; as induction of β-myrcene and β-pinene may promote beetle aggregation [53,54], fostering future beetle attacks. Additionally, as carbohydrate reserves fund monoterpene synthesis [47], prolonged monoterpene production can eventually deplete carbon availability necessary for tree growth.

5. Conclusions

Recent expansion of the southern pine beetle into areas previously unsuitable for this insect has brought interest in understanding how northern pine species will respond to unforeseen beetle attack. We observed that eastern white pine possesses pre-formed resin ducts in previous years’ growth, which allowed this species to induce a hypersensitive resin-filled response. Traumatic resin duct production took several weeks and might not be advantageous for P. strobus under mass attack since SPB infestations can be completed in a few days. However, it could act as a physical barrier during recurrent attacks. As formation of TRDs represent a major investment disrupting normal cambium activity and putting heavy demands on limited plant resources, in epidemic beetle populations and/or recurrent beetle attacks, constant resin production, might affect P. strobus development by inducing (1) hydraulic failure by tracheid occlusion due to resin accumulation, and/or (2) heavily drawing on the carbon budget of the tree. Though response to beetle populations will depend on the attack density and the overall physiological condition of the tree. Production of phenolics and terpenoids are similarly costly and generally at the expense of growth. It is not yet clear as to why some of the induced metabolites concentrations are maintained for 65 days but we predict that the plants are shifting and allocating resources to defend themselves against fungal invasion. Under endemic beetle populations, the use of the resin reservoir orchestrated with anatomical barriers, terpenoids and phenolics can be advantageous for P. strobus survival.

Supplementary Materials

The following are available online at https://0-www-mdpi-com.brum.beds.ac.uk/1999-4907/9/11/690/s1, Figure S1: Standard calibration curves for phenolic compound quantitation, Figure S2: Spectrum of each compound considered for analysis from RSLC—PDA, Figure S3: Calibration curves used for P. strobus monoterpene quantification, Figure S4: Comparison of p-coumaric acid for control and O. minus inoculated trees at 28- and 65-days post inoculation (dpi). Bars represent the standard error of the mean. Control n = 2 and inoculated n = 4–6, Figure S5: Comparison of taxifolin hexoside and procyanidin dimer (B-type) for control and O. minus inoculated trees at 28- and 65-days post inoculation (dpi). Inoculation is marginally insignificant (p = 0.06) for taxifolin hexoside but significant for procyanidin dimer (B-type) (p = 0.03), Table S1: Chromatographic, mass spectral, photodiode array and putative identities of phenolic compounds obtained from phloem tissue of P. strobus, Table S2: Statistical analysis to model the effect of treatment and collection time on each compound. For taxifolin hexoside and procyanidin B-type we used response variable absolute amount (nmol g−1 FW). For resveratrol-O-glucoside thru Unk4, we used peak area as a response variable (p < 0.05 highlighted in bold). p-coumaric acid did not have enough replicates for the control trees therefore no statistical analysis was performed, Table S3: Non-parametric Kruskal-Wallis test for Epi/catechin comparing control versus O. minus inoculated trees, Table S4: Non-parametric Kruskal-Wallis test for Epi/catechin comparing dpi, Table S5: Effect of O. minus inoculation on β-pinene in P. strobus.

Author Contributions

A.A.V. designed the research and led the field work; K.B., M.T.P., J.B., S.C. and A.A.V. analyzed the data; S.C., W.E.K., A.A.V. contributed to the writing of the manuscript.

Funding

This research was funded by McIntire-Stennis Grant CONH-0583 (A.A.V.), American Association of University Professors (AAUP) grant (ARCHAJ and ARCHKK), and Minority Recruitment and Retention Committee (AAUP MRRC) grant (AMCHAK) (S.C.).

Acknowledgments

We thank Mark Austin and Richard Sullivan for administrative and logistical support with the experimental site. Special thanks to Brian Loftus and Leah Franzluebbers for their valuable help with the lab work. Daniel J. Puralewski, Amanda Massa, Scott Hultgren, Michael Dziadzio, Endora Abreu, Ryan Funai and Justin Peschke for their help with the experiment setup, and wet chemistry. Neil Schultes for his support with the sequencing analyses. Steve Eyles for his help with phenolics and terpenoids analysis and Krishna Saha for his help with statistical methods.

Conflicts of Interest

The authors declare no conflict of interest.

References

  1. Nowak, J.T.; Klepzig, K.D.; Coyle, D.R.; Carothers, W.A.; Gandhi, K.J.K. Southern pine beetles in central hardwood forests: Frequency, spatial extent, and changes to forest structure. In Natural Disturbances and Historic Range of Variation: Type, Frequency, Severity, and Post-Disturbance Structure in Central Hardwood Forests; Greenberg, C.H., Collins, B.S., Eds.; Springer: Cham, Switzerland, 2016; pp. 73–88. [Google Scholar]
  2. Dodds, K.J.; Aoki, C.F.; Arango-Velez, A.; Cancelliere, J.; D’Amato, A.W.; DiGirolomo, M.F.; Rabaglia, R.J. Expansion of southern pine beetle into northeastern forests: Management and impact of a primary bark beetle in a new region. J. For. 2018, 116, 178–191. [Google Scholar] [CrossRef]
  3. Raffa, K.F.; Aukema, B.H.; Bentz, B.J.; Carroll, A.L.; Hicke, J.A.; Kolb, T.E. Responses of tree-killing bark beetles to a changing climate. Clim. Chang. Insect Pests 2015, 173–201. [Google Scholar] [CrossRef]
  4. Asaro, C.; Nowak, J.T.; Elledge, A. Why have southern pine beetle outbreaks declined in the southeastern U.S. with the expansion of intensive pine silviculture? A brief review of hypotheses. For. Ecol. Manag. 2017, 391, 338–348. [Google Scholar] [CrossRef]
  5. Bridges, J.R.; Moser, J.C. Role of two phoretic mites in transmission of bluestain fungus, Ceratocystis minor. Ecol. Entomol. 1983, 8, 9–12. [Google Scholar] [CrossRef]
  6. Bridges, J.R.; Moser, J.C. Relationship of phoretic mites (Acari: Tarsonemidae) to the bluestaining fungus, Ceratocystis minor, in trees infested by southern pine beetle (Coleoptera: Scolytidae). Environ. Entomol. 1986, 15, 951–953. [Google Scholar] [CrossRef]
  7. Barras, S.J. Antagonism between Dendroctonus frontalis and the fungus Ceratocystis minor. Ann. Entomol. Soc. Am. 1970, 63, 1187–1190. [Google Scholar] [CrossRef]
  8. Klepzig, K.D.; Robison, D.J.; Fowler, G.; Minchin, P.R.; Hain, F.P.; Allen, H.L. Effects of mass inoculation on induced oleoresin response in intensively managed loblolly pine. Tree Physiol. 2005, 25, 681–688. [Google Scholar] [CrossRef] [PubMed] [Green Version]
  9. Lieutier, F.; Yart, A.; Salle, A. Stimulation of tree defenses by Ophiostomatoid fungi can explain attack success of bark beetles on conifers. Ann. For. Sci. 2009, 66, 801. [Google Scholar] [CrossRef]
  10. Klepzig, K.D.; Wilkens, R.T. Competitive interactions among symbiotic fungi of the mountain pine beetle. Appl. Environ. Microbiol. 1997, 63, 621–627. [Google Scholar] [PubMed]
  11. Bridges, J.R.; Nettleton, W.A.; Connor, M.D. Southern pine beetle (Coleoptera: Scolytidae) infestations without the bluestain fungus, Ceratocystis minor. J. Econ. Entomol. 1985, 78, 325–327. [Google Scholar] [CrossRef]
  12. Basham, H.G. Wilt loblolly pine inoculated with blue-stain fungi of the genus Ceratocystis. Phytopathology 1970, 60, 750–754. [Google Scholar] [CrossRef]
  13. Arango-Velez, A.; El Kayal, W.; Copeland, C.C.J.; Zaharia, L.I.; Lusebrink, I.; Cooke, J.E.K. Differences in defence responses of Pinus contorta and Pinus banksiana to the mountain pine beetle fungal associate Grosmannia clavigera are affected by water deficit. Plant Cell Environ. 2016, 39, 726–744. [Google Scholar] [CrossRef] [PubMed]
  14. Bohlmann, J. Pine terpenoid defences in the mountain pine beetle epidemic and in other conifer pest interactions: Specialized enemies are eating holes into a diverse, dynamic and durable defence system. Tree Physiol. 2012, 32, 943–945. [Google Scholar] [CrossRef] [PubMed]
  15. Franceschi, V.R.; Krokene, P.; Krekling, T.; Christiansen, E. Phloem parenchyma cells are involved in local and distant defense responses to fungal inoculation or bark-beetle attack in Norway spruce (Pinaceae). Am. J. Bot. 2000, 87, 314–326. [Google Scholar] [CrossRef] [PubMed]
  16. Lippert, D.; Chowrira, S.; Ralph, S.G.; Zhuang, J.; Aeschliman, D.; Ritland, C.; Ritland, K.; Bohlmann, J. Conifer defense against insects: Proteome analysis of Sitka spruce (Picea sitchensis) bark induced by mechanical wounding or feeding by white pine weevils (Pissodes strobi). Proteomics 2007, 7, 248–270. [Google Scholar] [CrossRef] [PubMed]
  17. Raffa, K.F.; Aukema, B.; Erbilgin, N.; Klepzig, K.D.; Wallin, K.F. Interactions among conifer terpenoids and bark beetles across multiple levels of scale: An attempt to understand links between population patterns and physiological processes. Recent Adv. Phytochem. 2005, 39, 79–118. [Google Scholar]
  18. Aukema, B.H.; Powell, J.S.; Clayton, M.K.; Raffa, K.F. Variation in complex semiochemical signals arising from insects and host plants. Environ. Entomol. 2010, 39, 874–882. [Google Scholar] [CrossRef] [PubMed]
  19. Boone, C.K.; Aukema, B.H.; Bohlmann, J.; Carroll, A.L.; Raffa, K.F. Efficacy of tree defense physiology varies with bark beetle population density: A basis for positive feedback in eruptive species. Can. J. For. Res. 2011, 1188, 1174–1188. [Google Scholar] [CrossRef]
  20. Mason, C.J.; Klepzig, K.D.; Kopper, B.J.; Kersten, P.J.; Illman, B.L.; Raffa, K.F. Contrasting patterns of diterpene acid induction by red pine and white spruce to simulated bark beetle attack, and interspecific differences in sensitivity among fungal associates. J. Chem. Ecol. 2015, 41, 524–532. [Google Scholar] [CrossRef] [PubMed]
  21. Rosenberger, D.W.; Venette, R.C.; Maddox, M.P.; Aukema, B.H. Colonization behaviors of mountain pine beetle on novel hosts: Implications for range expansion into Northeastern North America. PLoS ONE 2017, 12, e0176269. [Google Scholar] [CrossRef] [PubMed]
  22. Lieutier, F.; Brignolas, F.; Sauvard, D.; Yart, A.; Galet, C.; Brunet, M.; Van De Sype, H. Intra- and inter-provenance variability in phloem phenols of Picea abies and relationship to a bark beetle-associated fungus. Tree Physiol. 2003, 23, 247–256. [Google Scholar] [CrossRef] [PubMed]
  23. Nerg, A.A.; Kainulainen, P.; Vuorinen, M.; Hanso, M.; Holopainen, J.K.; Kurkela, T. Seasonal and geographical variation of terpenes, resin acids and total phenolics in nursery grown seedlings of scots pine (Pinus sylvestris L.). New Phytol. 2008, 128, 703–713. [Google Scholar] [CrossRef]
  24. Mason, C.J.; Keefover-Ring, K.; Villari, C.; Klutsch, J.G.; Cook, S.; Bonello, P.; Erbilgin, N.; Raffa, K.F.; Townsend, P.A. Anatomical defenses against bark beetles relate to degree of historical exposure between species and are allocated independently of chemical defenses within trees. Plant Cell Environ. 2018. [Google Scholar] [CrossRef]
  25. Cook, S.P.; Hain, F.P. Qualitative examination of the hypersensitive response of loblolly pine, Pinus taeda L., inoculated with 2 fungal associates of the southern pine-beetle, Dendroctonus frontalis Zimmermann (Coleoptera, Scolytidae). Environ. Entomol. 1985, 14, 396–400. [Google Scholar] [CrossRef]
  26. Cook, S.P.; Hain, F.P. Defensive mechanisms of Loblolly pine and Shortleaf pine against attack by southern pine beetle, Dendroctonus frontalis Zimmermann, and its fungal associate, Ceratocystis minor. Chem. Ecol. 1986, 12, 1397–1406. [Google Scholar] [CrossRef] [PubMed]
  27. Arango-Velez, A.; González, L.M.G.; Meents, M.J.; El Kayal, W.; Cooke, B.J.; Linsky, J.; Lusebrink, I.; Cooke, J.E.K. Influence of water deficit on the molecular responses of Pinus contorta × Pinus banksiana mature trees to infection by the mountain pine beetle fungal associate, Grosmannia clavigera. Tree Physiol. 2013, 34, 1220–1239. [Google Scholar] [CrossRef] [PubMed]
  28. Raffa, K.F.; Smalley, E.B. Interaction of pre-attack and induced monoterpene concentrations in host conifer defense against bark beetle-fungal complexes. Oecologia 1995, 102, 285–295. [Google Scholar] [CrossRef] [PubMed]
  29. White, T.J.; Bruns, T.; Lee, S.; Taylor, J.W. Amplification and direct sequencing of fungal ribosomal RNA genes for phylogenetics. In PCR Protocols: A Guide to Methods and Applications; Innis, M.A., Gelfand, D.H., Sninsky, J.J., White, T.J., Eds.; Academic Press, Inc.: New York, NY, USA, 1990; pp. 315–322. [Google Scholar]
  30. Vilgalys, R.; Hester, M. Rapid genetic identification and mapping of enzymatically amplified ribosomal DNA from several cryptococcus species. J. Bacteriol. 1990, 172, 4238–4246. [Google Scholar] [CrossRef] [PubMed]
  31. Huang, X.; Madan, A. CAP3: A DNA sequence assembly program. Genome Res. 1999, 868–877. [Google Scholar] [CrossRef]
  32. Larkin, M.A.; Blackshields, G.; Brown, N.P.; Chenna, R.; Mcgettigan, P.A.; McWilliam, H.; Valentin, F.; Wallace, I.M.; Wilm, A.; Lopez, R.; et al. Clustal W and Clustal X version 2.0. Bioinformatics 2007, 23, 2947–2948. [Google Scholar] [CrossRef] [PubMed] [Green Version]
  33. Johnson, M.; Zaretskaya, I.; Raytselis, Y.; Merezhuk, Y.; Mcginnis, S.; Madden, T.L. NCBI BLAST: A better web interface. Nucleic Acid Res. 2008, 36, 5–9. [Google Scholar] [CrossRef] [PubMed]
  34. Ferrenberg, S.; Kane, J.M.; Mitton, J.B. Resin duct characteristics associated with tree resistance to bark beetles across lodgepole and limber pines. Oecologia 2014, 174, 1283–1292. [Google Scholar] [CrossRef] [PubMed]
  35. Stokes, M.A.; Smiley, T.L. An Introduction to Tree Ring Dating; The University of Chicago Press: Chicago, IL, USA, 1968. [Google Scholar]
  36. Pearce, R.B. Staining fungal hyphae in wood. Trans. Br. Mycol. Soc. 1984, 82, 564–567. [Google Scholar] [CrossRef]
  37. Villari, C.; Battisti, A.; Chakraborty, S.; Michelozzi, M.; Bonello, P.; Faccoli, M. Nutritional and pathogenic fungi associated with the pine engraver beetle trigger comparable defenses in Scots pine. Tree Physiol. 2012, 32, 867–879. [Google Scholar] [CrossRef] [PubMed] [Green Version]
  38. R Development Core Team. R Foundation for Statistical Computing. Available online: https://www.r-project.org (accessed on 30 September 2018).
  39. Wickham, H. ggplot2: Elegant Graphics for Data Analysis; Springer: New York, NY, USA, 2009. [Google Scholar]
  40. De Mendiburu, F. Statistical Procedures for Agricultural Research. Available online: http://CRAN.R-project.org/package=agricolae (accessed on 30 September 2018).
  41. Wei, J.; Carrol, R.J.; Harden, K.K.; Wu, G. Comparisons of treatment means when factors do not interact in two-factorial studies. Amino Acids 2012, 42, 2031–2035. [Google Scholar] [CrossRef] [PubMed]
  42. Hudgins, J.W.; Christiansen, E.; Franceschi, V.R. Induction of anatomically based defense responses in stems of diverse conifers by methyl jasmonate: A phylogenetic perspective. Tree Physiol. 2004, 24, 251–264. [Google Scholar] [CrossRef] [PubMed]
  43. Pearce, B.R.B. Tansley Review No. 87 Antimicrobial defences in the wood of living trees. New Phytol. 1996, 132, 203–233. [Google Scholar] [CrossRef]
  44. Stephen, F.M.; Paine, T.D. Seasonal patterns of host tree resistance to fungal associates of the southern pine beetle. J. Appl. Entomol. 1985, 99, 113–122. [Google Scholar]
  45. Franceschi, V.R.; Krokene, P.; Christiansen, E.; Krekling, T. Anatomical and chemical defenses of conifer bark against bark beetles and other pests. New Phytol. 2005, 167, 353–375. [Google Scholar] [CrossRef] [PubMed]
  46. Krokene, P.; Solheim, H.; Krekling, T.; Christiansen, E. Inducible anatomical defense responses in Norway spruce stems and their possible role in induced resistance. Tree Physiol. 2003, 23, 191–197. [Google Scholar] [CrossRef] [PubMed] [Green Version]
  47. Trapp, S.; Croteau, R. Defensive resin biosynthesis in conifers. Annu. Rev. Plant Physiol. Plant Mol. Biol. 2001, 52, 689–724. [Google Scholar] [CrossRef] [PubMed]
  48. Goodsman, D.W.; Lusebrink, I.; Landhäusser, S.M.; Erbilgin, N.; Lieffers, V.J. Variation in carbon availability, defense chemistry and susceptibility to fungal invasion along the stems of mature trees. New Phytol. 2013, 197, 586–594. [Google Scholar] [CrossRef] [PubMed]
  49. Bonello, P.; Blodgett, J.T. Pinus nigraSphaeropsis sapinea as a model pathosystem to investigate local and systemic effects of fungal infection of pines. Physiol. Mol. Plant Pathol. 2003, 63, 249–261. [Google Scholar] [CrossRef]
  50. Bonello, P.; Heller, W.; Sandermann, H. Ozone effects on root-disease susceptibility and defence responses in mycorrhizal and non-mycorrhizal seedlings of Scots pine (Pinus sylvestris L.). New Phytol. 1993, 12, 653–663. [Google Scholar] [CrossRef]
  51. Keefover-Ring, K.; Trowbridge, A.; Mason, C.J.; Raffa, K.F. Rapid induction of multiple terpenoid groups by ponderosa pine in response to bark beetle-associated fungi. J. Chem. Ecol. 2016, 42, 1–12. [Google Scholar] [CrossRef] [PubMed]
  52. Raffa, K.F.; Berryman, A.A. Interacting selective pressures in conifer-bark beetle systems: A basis for reciprocal adaptations? Am. Nat. 1987, 129, 234–236. [Google Scholar] [CrossRef]
  53. Cale, J.A.; Muskens, M.; Najar, A.; Ishangulyyeva, G.; Hussain, A.; Kanekar, S.S.; Klutsch, J.G.; Taft, S.; Erbilgin, N. Rapid monoterpene induction promotes the susceptibility of a novel host pine to mountain pine beetle colonization but not to beetlevectored fungi. Tree Physiol. 2017, 37, 1597–1610. [Google Scholar] [CrossRef] [PubMed]
  54. Clark, E.L.; Huber, D.P.W.; Carroll, A.L. The legacy of attack: Implications of high phloem resin monoterpene levels in lodgepole pines following mass attack by mountain pine beetle, Dendroctonus ponderosae; Hopkins. Environ. Entomol. 2012, 41, 392–398. [Google Scholar] [CrossRef] [PubMed]
Figure 1. Annotated chromatogram depicting (a) mixture of authentic standards (top) and (b) a representative sample (bottom) (trace 280 nm). Peaks are labeled in the chromatogram. Ferulic acid, pinocembrin and pinosylvin monomethyl ether (PME) peaks were not considered for quantitation in the sample as their peak areas were either negligible or absent. Consequently, the mentioned compounds did not pass the peak area cut-off. Constitutive levels of p-coumaric acid were low and statistical analyses were not conducted (Figure S4). Gradient profile is overlaid on the chromatogram for easy visualization.
Forests 09 00690 g001
Figure 2. (a) Lesion (black arrow) in eastern white pine following inoculation (white arrow) with O. minus after 28 dpi; (b) cross-section of a stem of an inoculated tree showing resin produced in sapwood (black arrow) and signs of blue-stain between bark and sapwood (white arrowhead) after 28 dpi; (c) blue-stain (white arrowhead) and lesion response (black arrow) developed following inoculation with O. minus after 65 dpi; (d) transversal view of an inoculated tree showing blue-stain (white arrowhead) in sapwood after 65 dpi.
Forests 09 00690 g002
Figure 3. Resin duct counts from the last two growing years of P. strobus at 28 (a,b) and 65 (c,d) dpi during 2016 and 2015 respectively. Values were averaged across the four cardinal points. Significant differences are indicated by an asterisk; boxes show median and 1st and 3rd quartiles, and whiskers indicate 1.5 inter-quartile range. (eh) Core samples (5 mm wide) of non-inoculated control and O. minus inoculated trees at 28 (top panels) and 65 (bottom panels) dpi. Black arrows show traumatic resin ducts at 65 dpi. Magnification 1.6×. Scale bar 100 m.
Forests 09 00690 g003
Figure 4. Transverse section of (a) non-inoculated control and (b) O. minus inoculated P. strobus stem stained with calcofluor at 65 dpi. Tangential rows of induced traumatic resin ducts are observed in the xylem of inoculated trees. Abbreviations: P, phloem; T, traumatic resin ducts; R, ray cells; X, xylem; Z, cambial zone. Magnification 5×. Scale bar 100 m.
Forests 09 00690 g004
Figure 5. Transverse section of P. strobus sapwood stained with rhodamine B and methyl green (a) O. minus inoculated trees after 65 dpi showing fungal hyphae (arrowhead) in xylem rays. (b) Inoculated trees showing several starch granules (black arrows) in resin ducts and (c) Control (non-inoculated). Magnification 40×; scale bar 50 m. Abbreviations: X, xylem; R, ray parenchyma.
Forests 09 00690 g005aForests 09 00690 g005b
Figure 6. Effect of O. minus inoculation on individual phenolic metabolites in phloem tissue of P. strobus. (a) Median value Epi/catechin (n = 7–11). Significant differences are indicated by an asterisk (*** p ≤ 0.001; ** p ≤ 0.01; * p ≤ 0.05); boxes show median and 1st and 3rd quartiles, and whiskers indicate 1.5 interquartile range. (b) Individual unknown compounds significantly induced due to fungal inoculation at 28 dpi. Error bar indicates Mean ± SE, (n = 3–6).
Forests 09 00690 g006
Figure 7. O. minus induced changes in phloem terpenoids of eastern white pine. (a) Individual monoterpene amount (nmol gm−1 FW) (Mean ± SE, n = 3–10). (b) β-pinene amount (nmol gm−1 FW) (n = 8–12) and is significantly increased due to fungal attack (** p ≤ 0.01); boxes show median, 1st and 3rd quartiles, and whiskers indicate 1.5 interquartile range.
Forests 09 00690 g007

