Assessing Spatial Equity and Accessibility of Public Green Spaces in Aleppo City, Syria


1
Department of Geography, Justus Liebig University of Giessen, 35390 Giessen, Germany
2
Department of Geography, College of Arts, Imam Abdulrahman Bin Faisal University, P.O. Box 1982 Dammam 31441, Kingdom of Saudi Arabia
*
Author to whom correspondence should be addressed.
Forests 2018, 9(11), 706; https://0-doi-org.brum.beds.ac.uk/10.3390/f9110706
Submission received: 17 September 2018
/
Revised: 28 October 2018
/
Accepted: 12 November 2018
/
Published: 14 November 2018
(This article belongs to the Section Forest Ecology and Management)
Abstract
:This paper examines the accessibility of urban green spaces within the Syrian city of Aleppo before the civil war using an environmental justice approach by indicating the current state of the parameters proximity and quantity in relation to the socioeconomic status of the inhabitants. Therefore, we conducted the average nearest neighbour analysis, facilities over and under coverage analysis, network analysis and a one-way analysis of variance (ANOVA) test followed by a post-hoc Tukey honestly significant difference (HSD) test. The findings clearly indicate that the spatial pattern of the distribution of public parks facilities was significantly clustered (p-value < 0.0001), with a z-score of −16.4. Several neighbourhoods within the western and central parts of the city were identified to have a higher density of facilities, while the majority of the neighbourhoods located in the marginal parts in eastern Aleppo (low income) lack access to urban green spaces. The hierarchy-wise analysis reveals a strong deficit of urban green spaces at lower hierarchies, for example pocket parks and neighbourhood parks, while access to quarter parks and district parks is high. The urban green spaces at higher hierarchies are located in high and middle socioeconomic status areas. Regarding social segregation in park distribution and their accessibility, the data showed that high income neighbourhoods enjoy a significantly higher percentage of park facilities. The approach presented in this paper offers a generic method for the future development of public green spaces for balanced and sustainable planning.
1. Introduction
Spatial equity to public park is an important measure of sustainability and therefore, sustainable cities should seek to offer equitable access to public facilities and amenities to all cohorts of their population [1,2,3]. In cities of the developing world like Syria, unplanned and informal settlements are increasingly affected by social and spatial inequality, resource consumption and environmental degradation [3]. Spatial expansion of Aleppo city has caused spatial changes in social structure. Migration from villages and small towns surrounding the city of Aleppo, especially in the east and south of Aleppo city in 1970–2010 due to climate change, comprised mainly of workers, has caused tremendous changes in the social structure and social polarization in the neighbourhoods [4].
Accessibility is one of the chief factors influencing the frequent use of urban green spaces and improving the people’s quality of life [5,6,7,8,9]. Generally, we can define accessibility as the “ease with which a resident can reach a given destination” (p. 181) [10]. To measure accessibility, we refer to Rigolon (2016) and Rigolon et al. (2018), which demonstrate that accessibility can be measured by the three parameters proximity, quantity/acreage and quality of urban green spaces [11,12]. Park proximity is defined as “a geographic unit’s distance to the closest park, regardless of the park’s size and amenities”, whereas “park acreage metrics describe the number or size of parks and recreational facilities within a geographical unit (for example a neighbourhood)” (p. 162) [12]. The parameter park quality “comprises metrics that depict park amenities, maintenance levels, and crime safety” (p. 162) [12]. In this paper, we work with the parameters proximity and quantity/acreage to examine spatial equity of urban green spaces in Aleppo. For the parameter proximity we use the network analysis and for quantity/acreage we use the facilities under and over coverage analysis as well as the one-way analysis of variance (ANOVA). The used approaches as systemised by Talen (2003) are container, coverage and travel cost [10].
Green spaces have a great number of positive impacts on cities and their inhabitants: they reduce stress, increase positive emotions, restore attention, affect self-regulation, and produce positive and restorative experiences. They offer space for (psychological) recreation and social interaction [7,13,14,15]. By increasing the amount of contact within a neighbourhood, the feeling of community and attachment to communities is increased [7,13]. Green spaces also have a big impact on physical health. By encouraging people to be physically more active and offering the space to move, green spaces substantially increase longevity in addition to enhancing human capacity for the physical and spiritual restoration of residents of urban areas [13,16,17,18]. Geographic information system (GIS) has a potential role in assessing the geographic distribution of green spaces services, in particular evaluating the effectiveness of public green spaces facility coverage relative to population density. For instance, average nearest neighbour as a spatial statistical tool has been used to identify clustered, dispersed, and random distribution of public green spaces facilities [19].
As the above-mentioned benefits are important for urban residents, inequity in access to urban green spaces is considered an environmental justice issue [18]. As Rigolon et al. state, “access to high-quality, safe urban green space is an issue of environmental justice because of the benefits that green space can bring to communities and because of documented socioeconomic and racial-ethnic disparities in its provision” (p. 2) [11]. In this paper, we use the term equity or fairness of distribution of urban green spaces rather than equality, as equity takes into account needs, merits and choices of the population and is therefore the more suitable term for investigating in urban parks [20]. The term equity is deeply connected with sustainability. Along with the environment and economy, equity forms the three fundamental aims on which a sustainable development, understood to be green, profitable and fair, depends [21]. This “planner’s triangle” (p. 296) or “triangle of conflicting goals” (p. 298) forms the basis of conflicts in the planning of cities and is therefore crucial for this study [21].
A lot of research has been conducted concerning environmental hazards, but in recent decades, research is aiming more at environmental amenities, especially parks [22]. Environmental justice has been and sometime still is seen only as distributional justice, however, environmental justice not only includes distributional, but also social and institutional aspects of inequities [20]. Schlosberg (2004) defines it as the “equitable geographic distributions of environmental threats and resources as a result of fair decision-making processes to locate threats and resources” (p. 161) [12,23]. Therefore, different societal groups (e.g., children) tend to be more or less affected by lacking facilities and thus experience more or less environmental injustice [22].
There has been a lot of research on the topic of access to public green spaces in cities all over the world [8,24,25,26,27,28,29], however, there has been little emphasis on cities in the Near East as well as there is generally less emphasis on the Global South than the Global North [11]. However, research on environmental justice in Global South cities has recently increased and it was found that important additional challenges occur in Global South cities, which tend to increase environmental injustice (e.g., informal settlements, post-colonialism, larger wealth inequities than in the Global North, pollution and high rates of population growth) [11]. In Global South cities, inequities according urban green spaces occur in particular concerning proximity, quantity and quality [11]. Most of the studies done in Global South cities show that high-socioeconomic status groups are advantaged in park quantity the same way as in Global North cities, whereas in park proximity inequities are more widely distributed than in Global North cities. Studies conducted for park quality show that Global South cities tend to have more nuances of inequity than Global North cities. Generally, results are more mixed than in Global North cities, sometimes revealing that some low-socioeconomic status groups enjoy better access to urban green spaces [11].
After reviewing the analysis methods of previous studies on the topic of green spaces, we found that there are a lot of indicators to measure the distribution, but also the physical characteristics of green spaces. To give a short overview of the great number of possible indicators, the most important for this study are outlined here: starting from basic measurement strategies, de la Barrera states that “the most widely used indicator to assess green spaces is their total area in respect to the total population” (p. 212) [8]. However, many researchers criticize this mode of measurement, because it only measures the relation between the area of green spaces and the number of inhabitants and does not take into account the spatial distribution of green spaces [28]. Therefore, indicators must be found to measure the spatial distribution more accurately. The accessibility of green spaces seems to be a useful tool, to achieve a realistic and reliable picture [5]. This is normally measured through a variety of GIS-based methodologies, sometimes combined with social surveys, using the above-mentioned parameters [8]. Accessibility to green spaces depends on the spatial distribution within the city (proximity), the number and size of parks within a neighbourhood (quantity/acreage), the amenities, maintenance and security situation (quality) as well as the shape of the green space and the connection to streets in different directions [8,11,12]. Simple distance indicators and proximity indicators are a methodology which is widely used [5]. Simple distance indicators measure the number of people at fixed distances from each green space that can have access to each green space [5]. Proximity indicators measure the number of people at fixed distances from each green space and weight them with their distance from green spaces [5]. Moreover, we can differentiate between simple buffering methods and network analysis methods [24,28]. While simple buffering only measures the area in a given distance radius around each green space, network analysis methods take into account the possible restrictions for pedestrians e.g., physical barriers to reach the green space [14,28]. Thus, network analysis methods are a better tool to achieve a more detailed picture [5,28].
The size and shape of green spaces are other indicators which are widely used. These indicators are important because as the size of a green space increases, the magnitude and diversity of e.g., ecosystem service increases [8]. “For cultural services, larger green spaces allow various activities and thereby facilitate the simultaneous presence of different users” (p. 213), states de la Barrera [8].
The city of Aleppo grew in the 1970s and early 1990s largely through migration from small towns and rural areas mostly from eastern and north-eastern Syria. Land grabbing or squatting was prevalent in the 1970s to 1990s. Both privately and public owned land have been squatted. The most obtrusive impact has been the encroachment on government and municipal land destined for public use such as public green parks or the construction of service and amenity buildings [30].
The goal of the present paper is to understand, analyse and describe the accessibility of urban green spaces within the city core of Aleppo using an environmental justice approach by indicating the pre-war state of the parameters proximity and quantity in relation to the socioeconomic status of the inhabitants. Therefore, we developed the following research questions:
- Are urban green spaces in Aleppo distributed dispersed, random or clustered? (Proximity)
- Which are areas of low and high coverage of urban green spaces? (Quantity/Acreage)
- How accessible are urban green spaces to inhabitants? (Proximity)
- How are urban green spaces distributed in relation to the socioeconomic status of the neighbourhoods? (Quantity/Acreage)
The average nearest neighbour analysis addresses research question 1, facilities over and under coverage analysis question 2, the network analysis question 3 and the ANOVA test and post-hoc Tukey test question 4.
2. Materials and Methods
2.1. Study Area
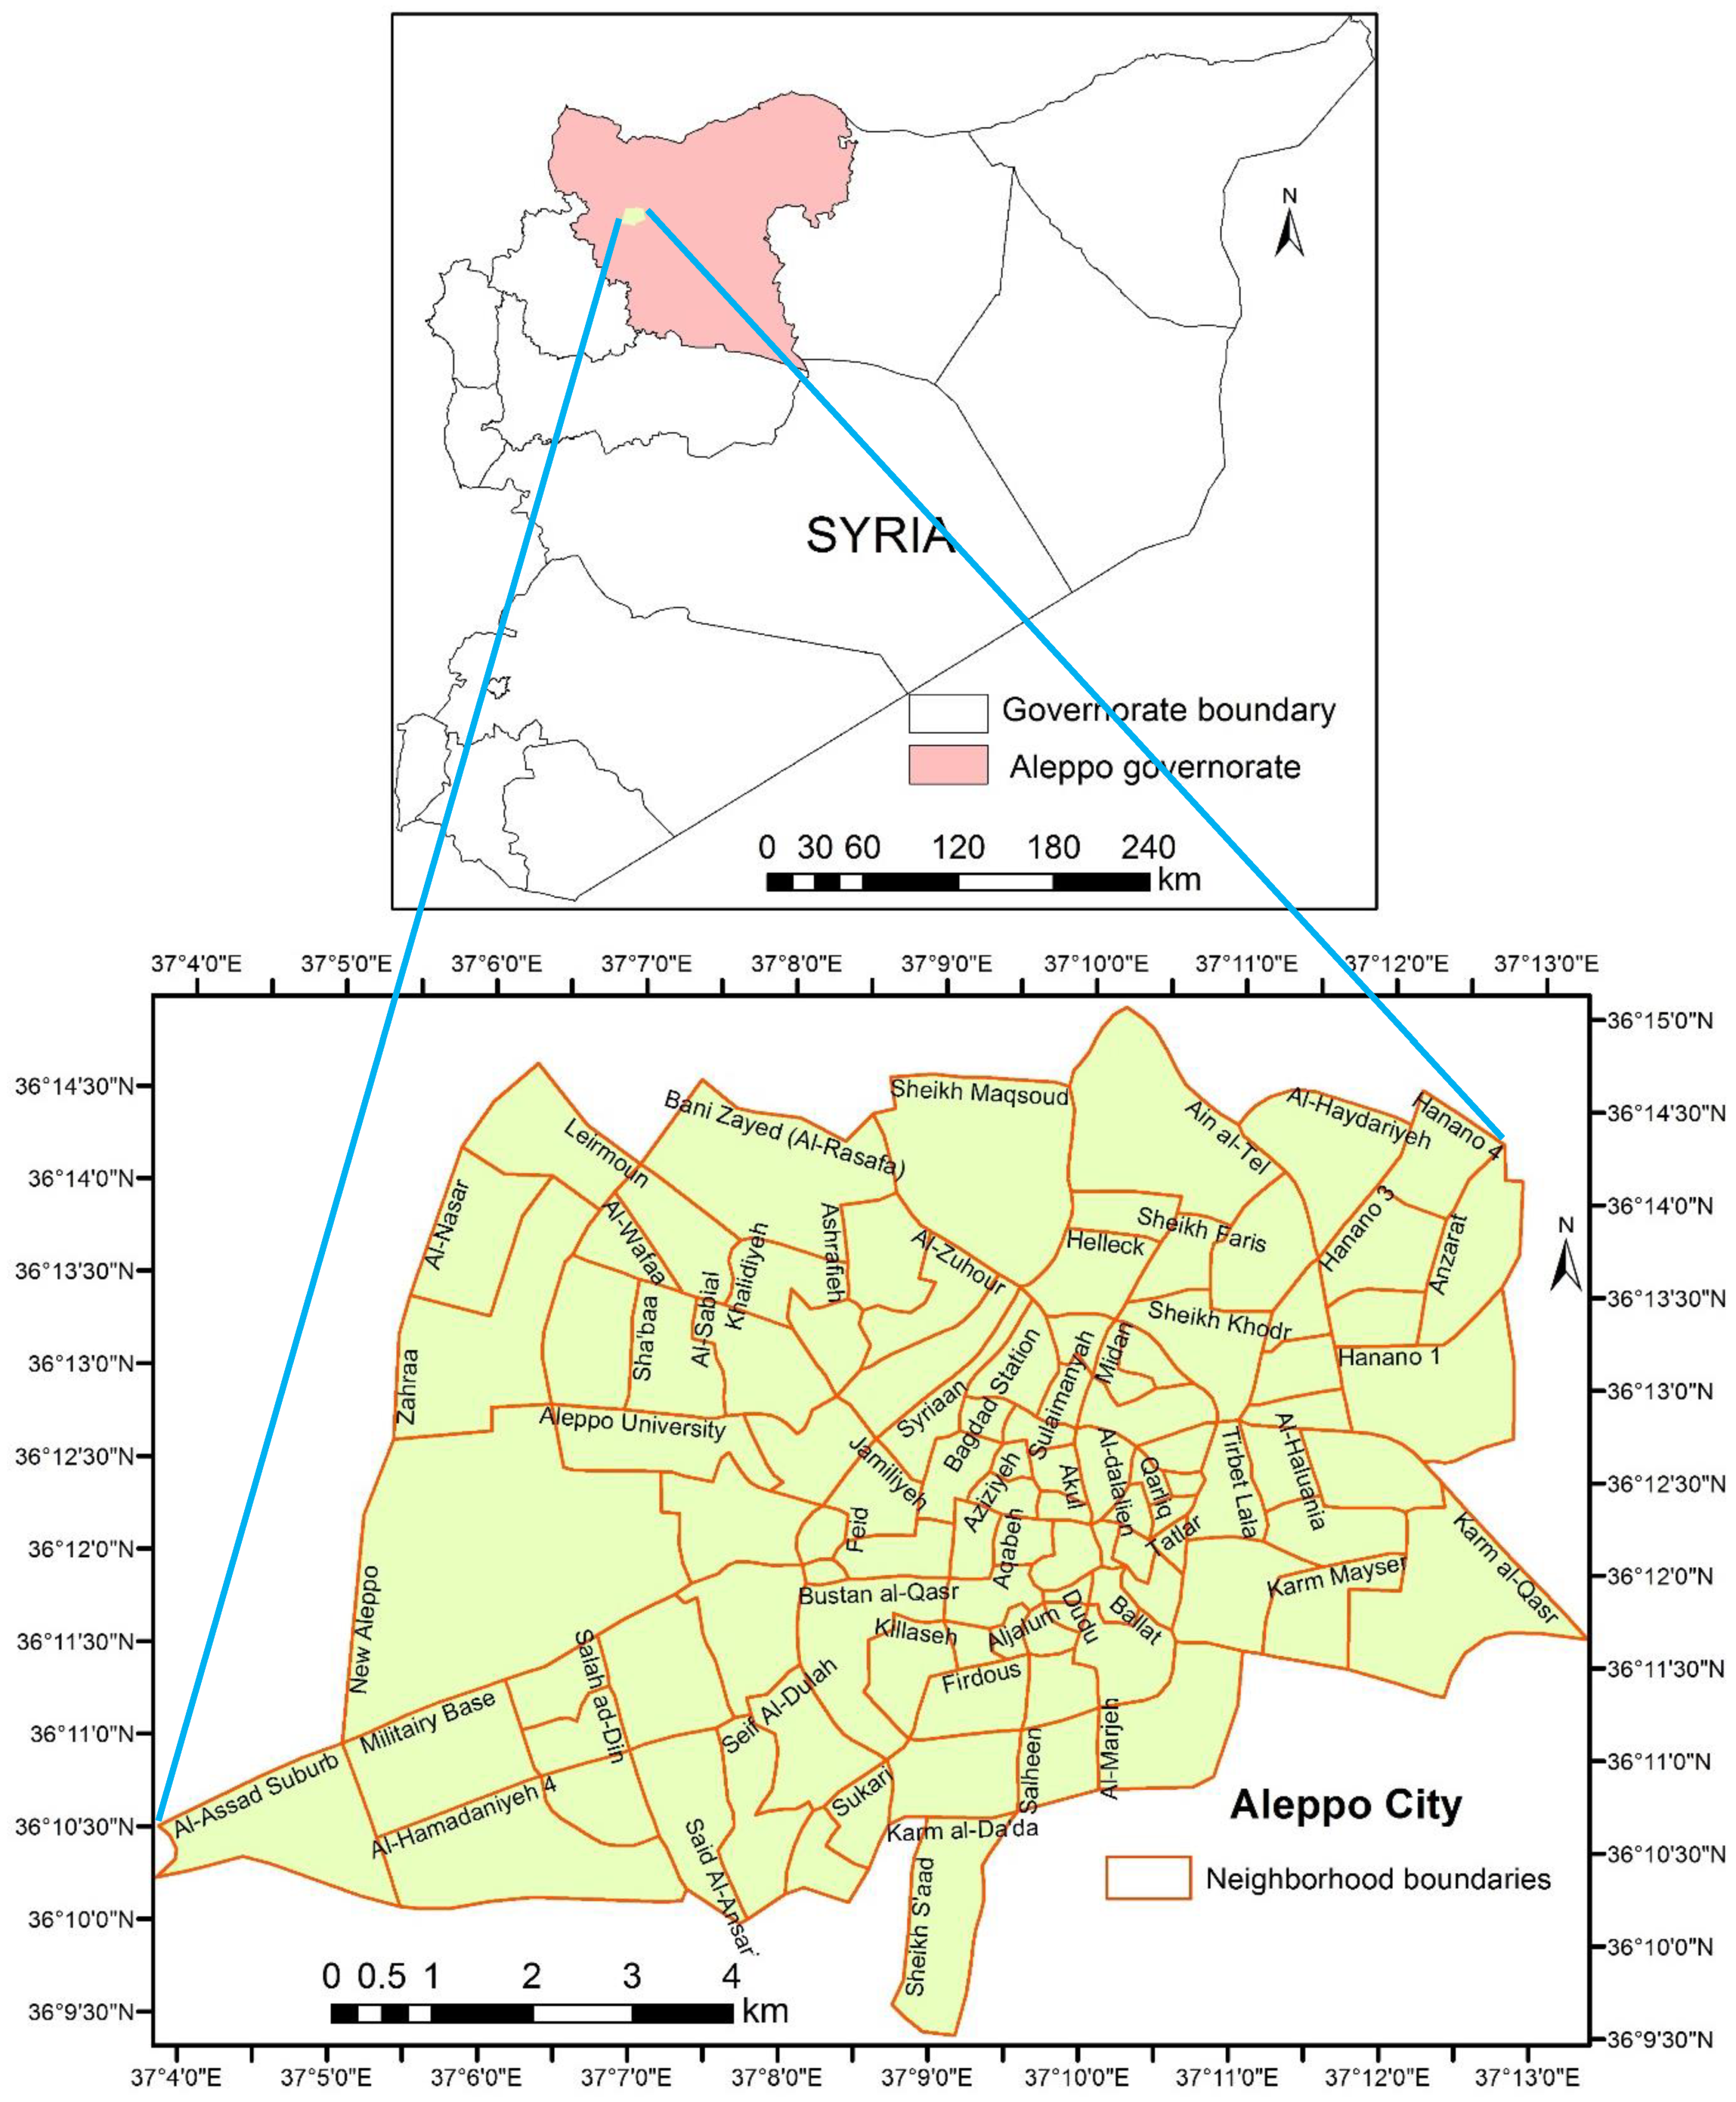
The study was carried out in the city of Aleppo in the northern area of Syria. It lies between Longitudes 47°32′ E and 37°40′ E and Latitudes 35°15′ N and 35°35′ N. Aleppo is the largest city in Syria and serves as the capital of the Aleppo Governorate (Figure 1). In the 2004 census by the Central Bureau of Statistics, the City of Aleppo had a population of 2.18 million [31] and has an estimated population of 3 million as of 2009 [32]. The city has enjoyed a strong economy as a capital industry and trade hub, with historic and collaborative commercial relations with neighbouring countries.
Aleppo City is subdivided into seven sectors each of which includes a number of neighbourhoods. The city of Aleppo is a unique urban fabric (Figure 1). The neighbourhoods range from traditional-oriented (ancient city) to conventional modern-design and informal settlements. Forty percent of the city population live in informal areas, as Aleppo has been the most attractive city for rural migrants and has grown rapidly during the last decades [3].
Developing a green space strategy is a good opportunity for improving the quality of life in Syrian cities and provide the inhabitants with appropriate access to public green space as one basic strategy in a master plan. The old city is made up primarily of residential, commercial, administrative, public, and historical areas. There is no large public park within the borders of the old city. Approximately 60% are residential old-style Arabic houses, made up of a courtyard (1/3 of the lot) and one- to two-story buildings around the courtyard facing inwards. There is little to no opening onto the outside streets in order to preserve privacy. The courtyard typically has a fountain in the centre and, depending on the weather, is where family members carry out various daily activities. There are two district parks near to the border of the old city. To the West is Bab Qinnesrine park, and to the East is Karm al Tahhan park.
2.2. Data and Methods
To define the extent of the study area, the population per neighbourhood based on the census data of 2008, as well as Macro-scale data about neighbourhoods like boundaries of the neighbourhoods, green spaces, streets, crosswalks, overpasses, and underpasses, were taken from GIS data provided by the service for spatial data of Aleppo Governorate Council [33] and Open Street Map and were imported into ARCGIS 10.2.2. Open Street Map data was used to put a scheme of the city underneath our data and to compare green space data to green spaces in Open Street Map data. Population data of 2008 had to be used due to the impossibility of generating current data in civil war conditions. Regarding the use of Open Street Map data, other studies have already shown that accuracy decreases from city centers to the periphery [34,35,36]. Moreover, Open Street Map claims itself that data may sometimes only be partial [37]. This is especially important for the analysis of green spaces in the peripheral areas of Aleppo and has been considered accordingly.
The maps of the green areas issued by the Aleppo Municipality were compared with data issued by OpenStreetMap to ensure that all the type of public parks were identified. However, in some neighborhoods we had difficulty distinguishing the public and private green areas, so we consulted with local students. The task of the students was to distinguish if those areas were parks or private gardens and to take pictures of the gardens for verifiability. This work was done in the neighbourhoods that were accessible, but about the neighbourhoods that could not be reached, several experts were asked. Those were people, who have lived in Aleppo and have worked for a long time in the social, health and environmental field. Information from the students as well as from the experts as used to adjust the green space data.
According to the data used, it has to be stated that the possibility to measure accessibility to urban green spaces depends on the quality as well as the source of data. The higher the spatial resolution of data, the better small urban green spaces are displayed and can be analysed [10]. To avoid bias from the sources, we checked our data using Google Earth and Google Maps for size, shape and function of public parks.
We consider urban green spaces a public commodity that is provided without profit to all members of a society, allows free access to all residents and where people can get together without restrictions. Due to this, fruit trees have not been considered as comprising green spaces since they are normally part of the agricultural land rather than the city green space used for recreation. Neither have hedges, rows of trees, and small traffic squares been considered, because they often represent street greenery, for example for avenues, which are beautiful to look at, but generally do not represent places where people get together [25]. Also, green spaces of restricted access such as private gardens, large stadiums, and institutional gardens, were excluded; considering their supplying of ecosystem services, these places nonetheless improve the urban quality of life [8,38,39].
At first, we had to prepare the data, which includes to check and adjust the neighbourhood boundaries and names, where needed. The next step was to classify the park data according to the hierarchical park levels shown in Table 1. Afterwards we joined the socioeconomic data to the polygon shapefile and classified the neighbourhoods according to their socioeconomic status into low, middle and high socioeconomic status neighbourhoods. Following this step, we conducted the average nearest neighbour method in order to investigate if the spatial pattern of urban green spaces in Aleppo is clustered, dispersed or random. We then prepared our park data for conducting the network analysis. Park buffers were created for each hierarchical level of parks separately using the network analysis. The specific distances of the hierarchical levels were applied from the edges of park polygons. After doing so, we computed the percentage of public park facilities in the neighbourhoods and conducted the one-way ANOVA test and the Tukey post-hoc test to test and verify our results. We then created graphs for the individual hierarchical levels of the parks and for the socio-economic characteristics of the neighborhoods.
The neighbourhoods have a high variation in demographic characteristics such as household size, working for population, the number of children below 0–6 years, population density, and income and education levels. Spatial expansion of Aleppo has caused spatial changes in social structure. Migration from small towns and villages surrounding the city of Aleppo is comprised mainly of workers and unskilled people. This migration process has led to a growth of informal settlements in east and north Aleppo, especially after the increase in drought years in the last two decades. This has caused tremendous changes in social structure giving the neighbourhoods a high variation of demographic characteristics.
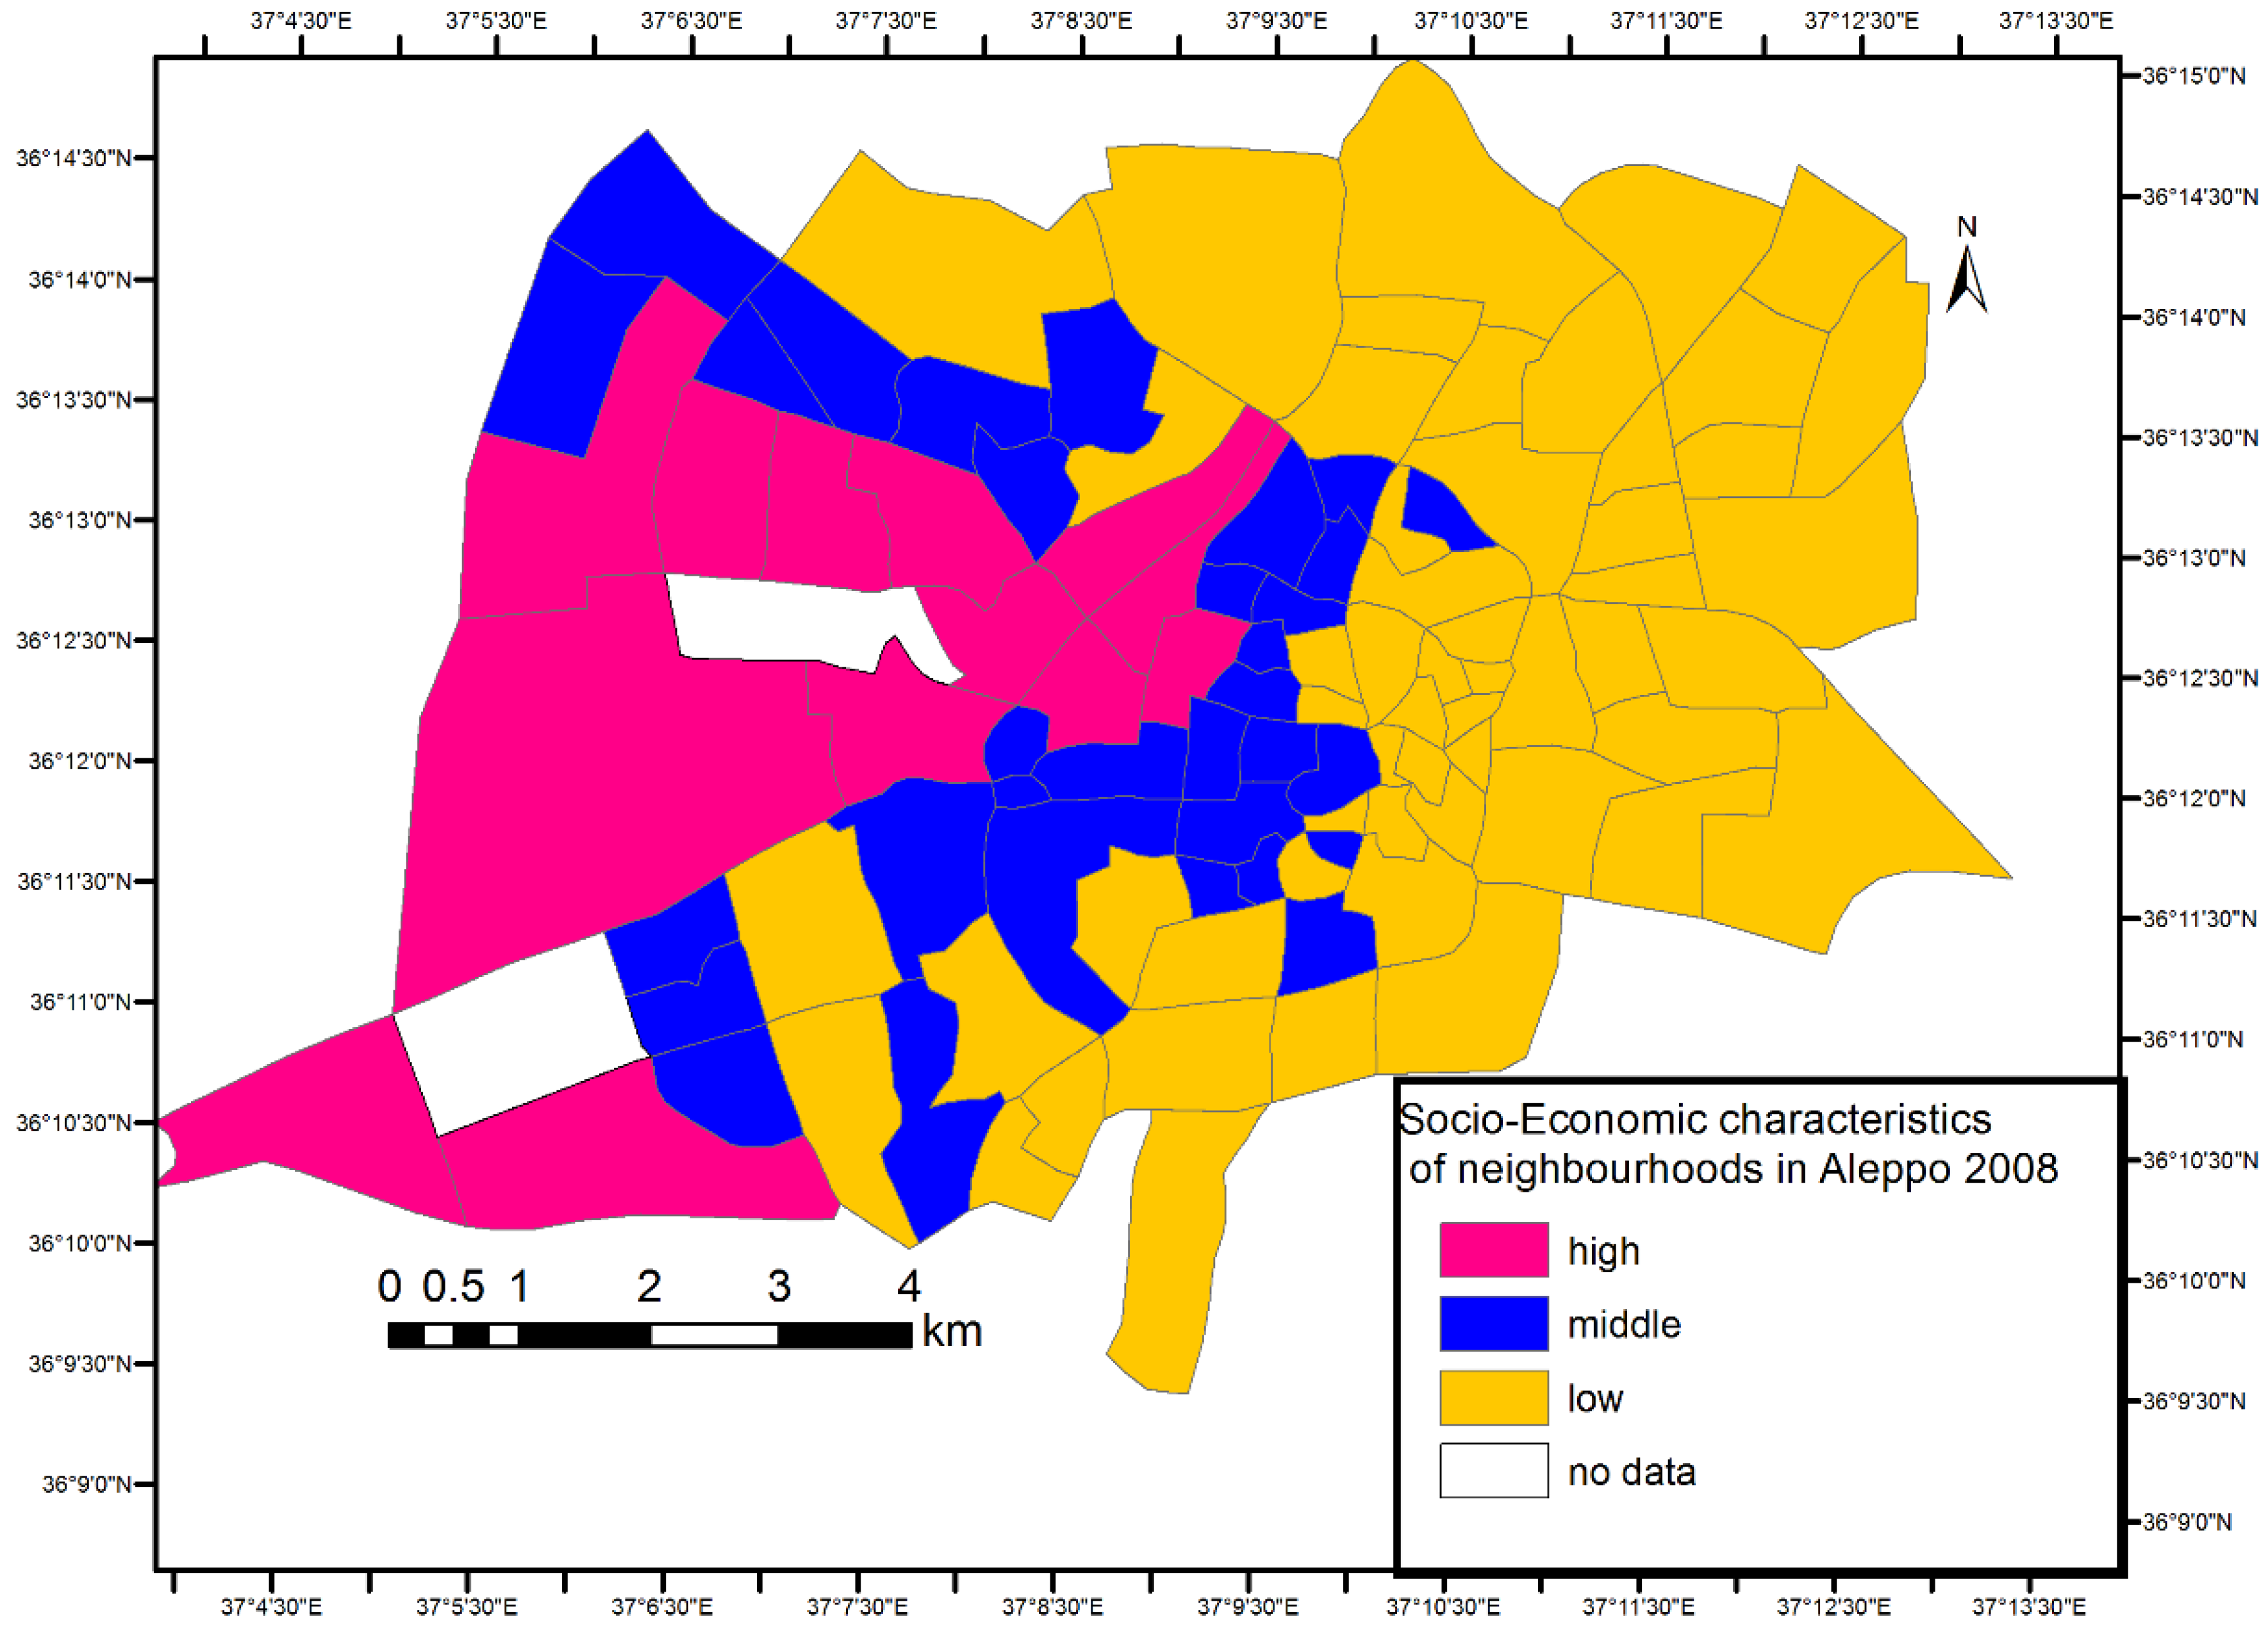
To identify socially segregated areas according to socioeconomic groups (Table 2, Figure 2), we used the results of the studies by German Agency for Technical Cooperation (GTZ) [4,30] census data from 2004 [40], and municipal plans from 2009 and 2012 [41,42]. The data used for the social classification were education, occupation, household dimension, income [40], building type and property sizes from a map of the municipality of Aleppo 2012 and a map of informal settlements [4].
There are three main factors that social scientists generally use to calculate the socioeconomic status (education, income and occupation) [43]. There are three main factors that social scientists generally use to calculate the socioeconomic status (education, income and occupation). The modified Kuppuswamy scale is generally used to measure socioeconomic status in urban and societies. The Kuppuswamy scale was developed by Kuppuswamy in 1976 and is based on a composite score considering the education and occupation of the head of the family along with monthly income of the family, which results a score of 3–29 [44]. This scale categorizes the study populations into low (3–10 score), middle (11–24 score), and high (25–29) socioeconomic status.
Using this data, the socioeconomic groups have been broken down into three categories: high, middle, and low income. Figure 2 shows the classification of social status and indicates that the northeast, east, and southeast areas of Aleppo are occupied by the lower status social groups, and the old city and northwest by middle and part of southeast, and west and large area of the centre of city are occupied by inhabitants of high social status. The white areas (no data) represent the inner-city military base and the campus of the University of Aleppo.
2.3. Establishing the Categorization of Urban Parks
To analyse the accessibility of parks, it was first necessary to classify them according to their size and importance. Varying hierarchical levels and standards for accessibility to urban public green spaces have been adopted by different city councils in different countries with different terminology.
The first challenge in this study was to determine the standards for public parks in the study area. An extensive search was carried out in the published literature for Syrian standards; however, no accessibility standards in terms of the service area or maximum distance by the relevant authorities were found. In order to understand these specific regional standards in comparison to the international standards, the study reviewed public parks standards in other countries. For instance, London defines accessibility in terms of maximum walking distance, US and Iranian systems define accessibility in terms of service radius, the Korean system defines accessibility in terms of catchment distance, and the Belgian system conceives of accessibility in terms of maximum distance from home [29]. This is the distance which people are willing to walk or drive for using urban green spaces at different hierarchical levels.
Distance is often mentioned as the main environmental factor influencing the use of a green space as the size of the green space, presence of facilities, and possibilities for activities are also considered to have an influence on the use of an urban green space.
Some of these standards specify travel distance between dwellings and nearest public green space (accessibility standards), where the allowed travel distance increases in line with the increase of green space area, however, this criterion differs from one country to another. For example, in the American, English and Korean system, the distance at the lowest hierarchy of parks is identified as 300–400 m, 300 m and 250 m respectively [26,45]. Handley et al. (2003) used the distances to the nearest public green space as 300 m to a 2 ha local park or 20 ha within 2 km [46]. Breuste and Rahimi (2015) used radians 200 m to pocket park and 1200–1500 m to regional parks [47]. However, it has been argued that a distance of 300–400 m is not a sufficient criterion for children of primary school age due to increased motorized traffic for the security of their wards [26].
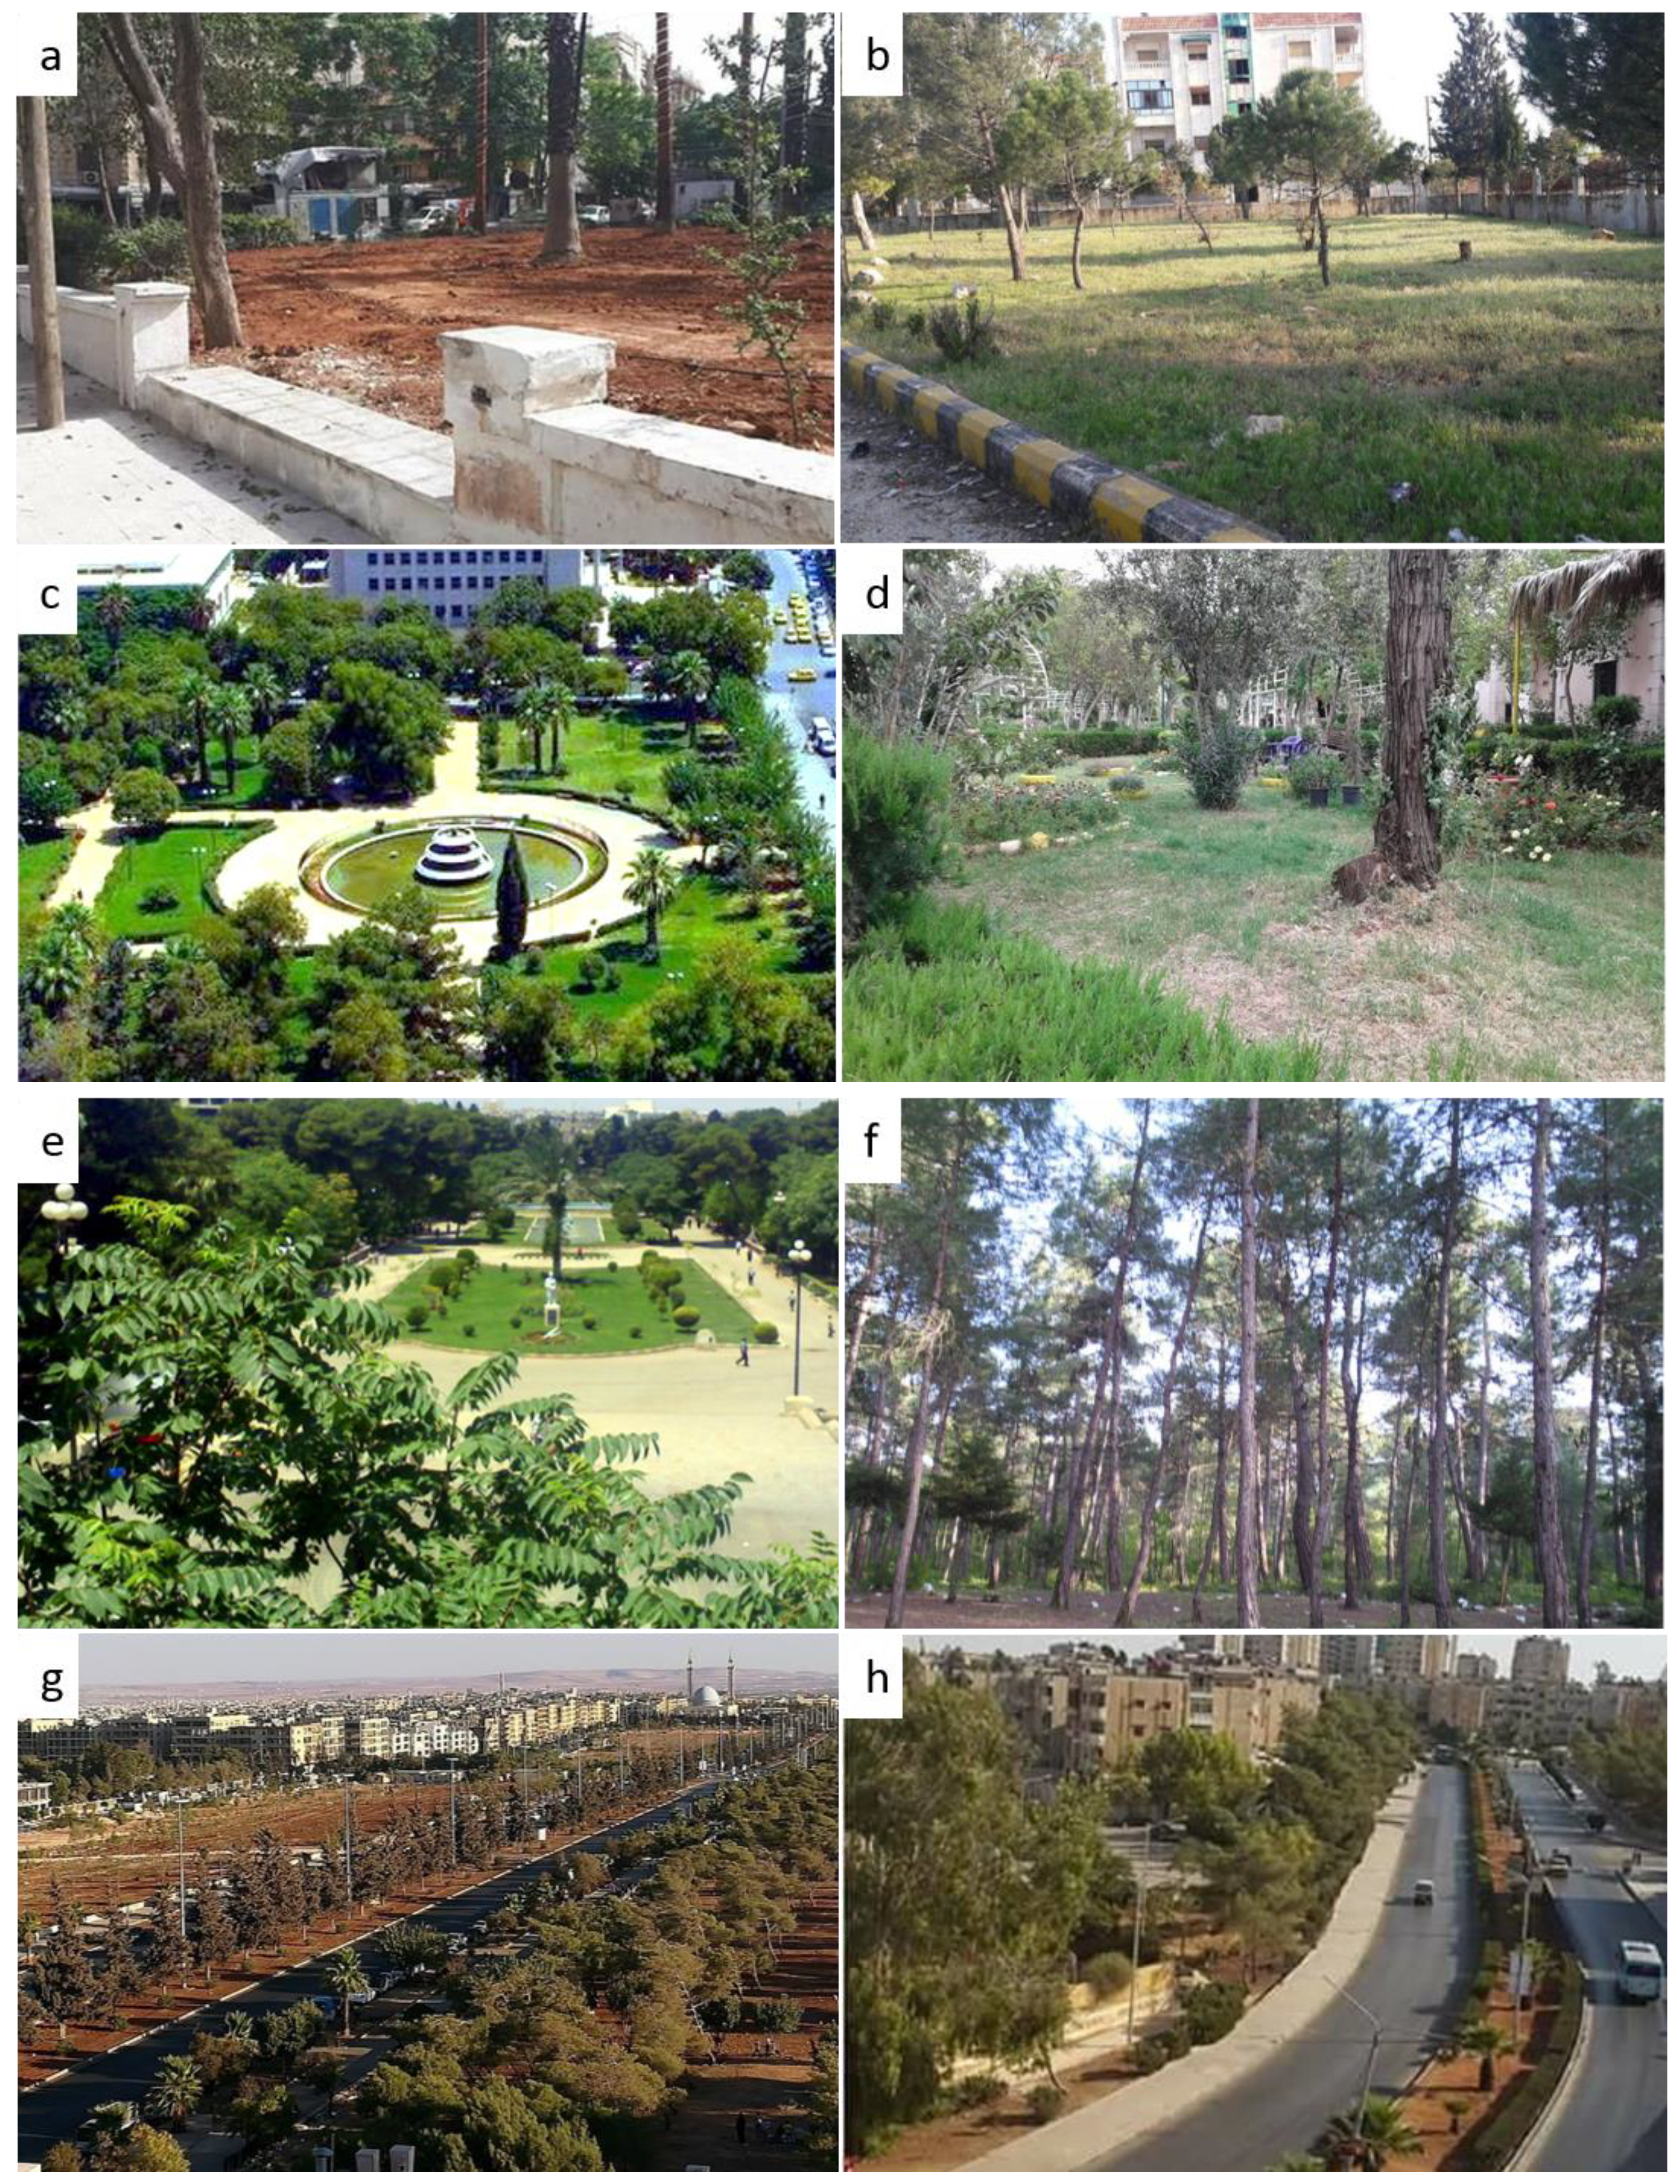
In order to decide on a classification system for Aleppo, experts were asked. Those were people, who have lived in Aleppo and have worked for a long time in the social, health and environmental field. It was then decided to use the categorization system of urban parks in Aleppo outlined in Table 2. Examples of parks on the classified hierarchical levels in Aleppo can be found in Figure 3.
2.4. The Average Nearest Neighbour
The average nearest neighbour is a measure of the distances between each point and the closest point to it. It compares these two expected values for a random sample of points from a complete hypothetical random distribution and shows if it is regularly dispersed (probably planned), randomly dispersed, or clustered. The average nearest neighbour ratio is determined as the observed average distance divided by the expected average distance. The index (average nearest neighbour ratio) is thus less than the average for a hypothetical random distribution (less than one). In contrast, if the average distance is greater than a hypothetical random distribution, the spatial pattern of features is considered dispersed [48]. The value of the index ranges from 0 (clustered pattern) to 1 (randomly dispersed pattern) to 2.15 (regularly dispersed /uniform pattern) [49].
(a) The mean nearest neighbour distance
where is the number of points, is the nearest neighbor distance for point i.
(b) The expected value of the nearest neighbour distance in a random pattern
where A is the area and B is the length of the perimeter of the study area.
(c) The variance
Equations (2) and (3) contain a correction factor to account for the boundary effect based on Donnelly [32].
(d) The z- score is a test for statistical significance:
where DO is the observed mean distance between each feature and their neighbour, DE is the expected mean distance for the features given a random pattern [48] and SE is the standard deviation. It has to be conducted in order to test if the result of the average nearest neighbour analysis is significant (significant if, z is <−2.58 or >+2.58). In order to determine the z-score of a sample value, the variance, standard deviation and mean of the sample need to be calculated. Afterwards, the difference between the sample and the mean value is calculated and this is divided by the standard deviation.
2.5. Parks Facilities Under and Over Coverage
Relatively under-coverage areas can be classified as neighbourhoods within the lowest quantile of resource distribution across neighbourhoods, while areas of relative over-supply are defined as neighbourhoods with a public green spaces density within the highest quantile of all public green spaces densities across all neighbourhoods. Most significantly, the under- and over-coverage analysis is a comparative determination of areas characterized by spatial equity or inequity among all neighbourhoods and should not be considered as resource availability analysis [50,51].
2.6. Network Analysis
Provision of Green spaces coverage is often related to the socioeconomic status of the neighbourhoods concerned. Different levels of urban green spaces are defined by many planning authorities as the hierarchy of urban green spaces for social use [29]. Service area is the service distance of a public facility, which is equivalent to the accessibility to a green space that supplies service via traffic networks [28]. Accessibility is not easy to quantify, and there is no single best approach for measuring it. Accessibility refers to an individual′s ability to participate in a particular activity or set of activities [47]. Thresholds for different levels of urban parks and standards for accessibility to urban green spaces have been adopted by different city councils in different countries using different categories.
Over the past decade however, the network analysis method has been increasingly used to study the establishment of green space accessibility zones on the basis of different impedance values [36]. Those were given according to route types for instance pedestrian roads, crosswalks, overpasses, and underpasses [24,28,29,52].
The method of measuring accessibility using “network analysis” was applied to each set of urban parks. The network analysis method also involved specification of the travel distance allowed for each type of park [53]. Accessibility analyses were performed using the ArcGIS 10.2.2 network analyst extension “Service Area Analysis”. It is a powerful extension that provides network-based spatial analyses including routing, travel directions, closest facility, and service area calculation. Many numbers of studies choose the network analysis method because it has an advantage over the covering approach as it reflects the actual travel and includes all the barriers that make routes inaccessible by social users [52,54,55]. The intersections of the main road and pavement inside the park are counted as park access points as they are entrances to the public green spaces. These intersection points will be the facilities to be used in the park service area analysis done with the network analyst tool.
We analysed the parks’ accessibility along with social group factor using the network analysis method.
The distribution of different social sections in the city was documented according to socio- demographic criteria, in order to identify green spaces with the highest social heterogeneity, and thus the highest social integrative potential [25]. Public green-space data is linked with social demographic data for particular social sections of the society, which are to be integrated in public urban life.
2.7. One-Way ANOVA Test and Post-Hoc Tukey HSD Test
The one-way ANOVA (analysis of variance) test is an interval/ratio test used for situations with more than two groups in the independent variable. It reveals if there is a significant difference between the means of (at least) three different groups in relation to the dependent variable [56]. To use the one-way ANOVA test, there must be only one independent variable (here: socioeconomic status) with more than two levels (here: high, middle, low) and only one dependent variable (here: percentage of public park facilities in a neighbourhood). Normality and homogeneity of variance are assumed. The one-way ANOVA test is an omnibus test statistic, i.e., it only shows if there is a significant difference between at least two of the groups [56]. The post-hoc test is a pairwise comparison test method used to receive multiple comparisons between the groups; it points out between which groups the difference occurred (here: high versus middle, high versus low, middle versus low). The Tukey HSD (honestly significant difference) test is used if the data met the assumption of homogeneity of variances.
3. Results and Discussion
3.1. Public Parks Distribution and Spatial Equity
Most cities aim to supply their citizens with public green spaces. Some have successfully accomplished this objective, others have not achieved it yet, especially in developed countries. Few cities have been able to devise a system of parks that provide their citizens with the spatial and social benefits of public green space [41]. The analysis shows that the number and distribution of parks do not explain accessibility. The public green space per capita in Aleppo is 2.7 m2 while the standard target, based on urban planning ministry proposals, is 6 to 11 m2 and has not been met. To assess the accessibility and spatial pattern of distances of public green spaces within the city of Aleppo, we used ArcGIS 10.5. This analysis yields three values: Nearest Neighbour Ratio, z-value and p-value. We found that the public green spaces within the city are spatially clustered.
Results from the average nearest neighbour analysis showed that the average nearest neighbour ratio is less than 1 with 0.72 (p < 0.0001). From this result, we can expect that the public green spaces in Aleppo city exhibits a cluster pattern. The z-score is −16.40 (p < 0.0001). Consequently, the null hypothesis of no spatial pattern among public green spaces facilities in Aleppo neighbourhoods was rejected. Due to the large z-score in this study, there was less than 1% likelihood that this clustered pattern could be the result of random chance (null hypothesis). By using average nearest neighbour analysis also, it could be determined that the significant spatial autocorrelation of public green spaces is at an average distance of 133.85 m.
3.2. Facilities Under- and Over- Coverage
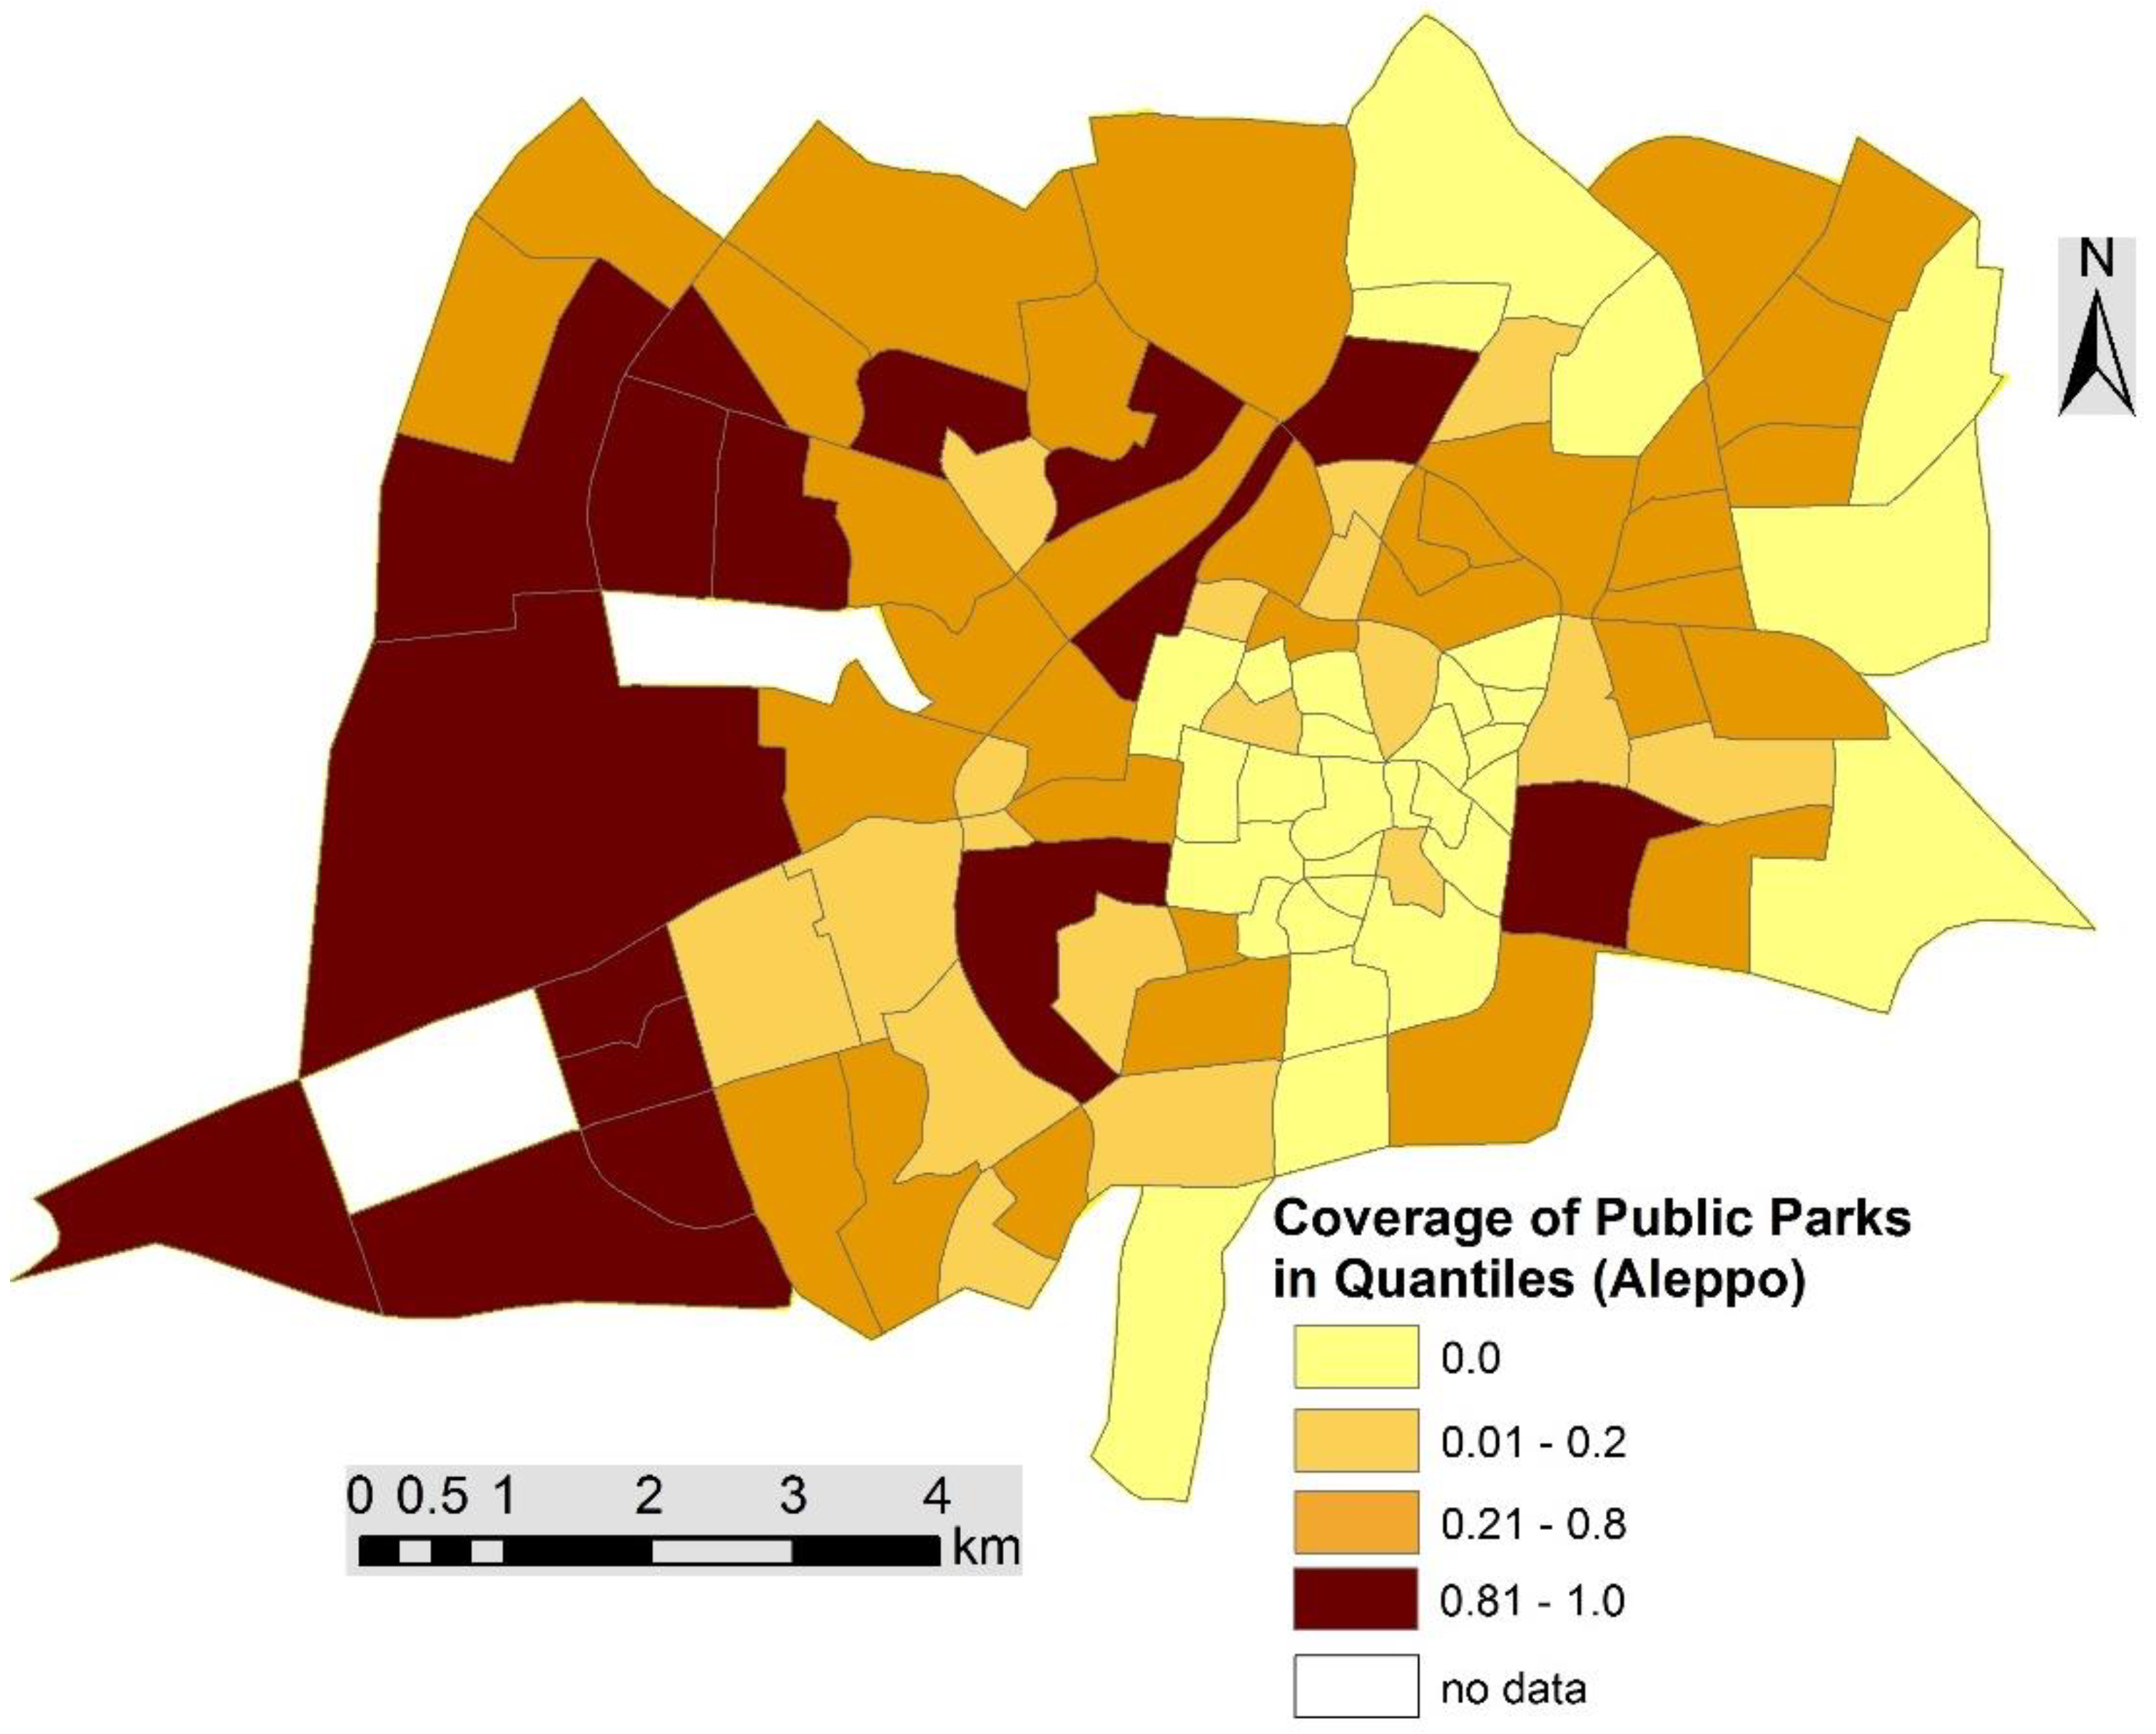
The output of the facilities under- and over- coverage analysis (Figure 4) revealed that one-third of neighbourhoods (32 out of 99) can be classified as areas with no public parks provision and they account for 33% of all neighbourhoods.
In total, the city of Aleppo counts 101 neighbourhoods, two of which have no socio-economic data as they are military used land and the University of Aleppo (no data). A total of 32 neighbourhoods (32.3%) were classified as areas of no supply of urban green spaces. 17 neighbourhoods (17.2%) were classified as areas of significant under-supply, compared with 16 neighbourhoods (16.2%) meeting criteria for significant over-supply. A number of 34 public green spaces met the definitions for areas of multiple under- and over-supply (spatial equity), respectively (34.3%). The geographic location of neighbourhoods with no coverage and under-coverage of public parks facilities (spatial inequity) can be recognized in the centre of Aleppo (old city) and east and south-east of Aleppo. The north-central city and western city is mostly characterized by over-supply (spatial inequity).
3.3. Network Analysis
Accessibility is not only used to measure the service area or the potential of public parks to adequately provide for the public; it is also used to evaluate whether it is equitable for different populations sharing the same degree of closeness to parks in cities [2]. Access to public parks in urban environments promotes social equity and improves quality of life for surrounding neighbourhoods. In this context, social equity is related to accessibility to public parks.
We assessed the accessibility of public parks in the study area by employing a network analysis in GIS. Urban parks have different purposes for their users as well as different land use. Therefore, the different park categories in various classes were analysed in GIS to assess the accessibility using network analysis. The distance network analysis was applied as defined in Table 2.
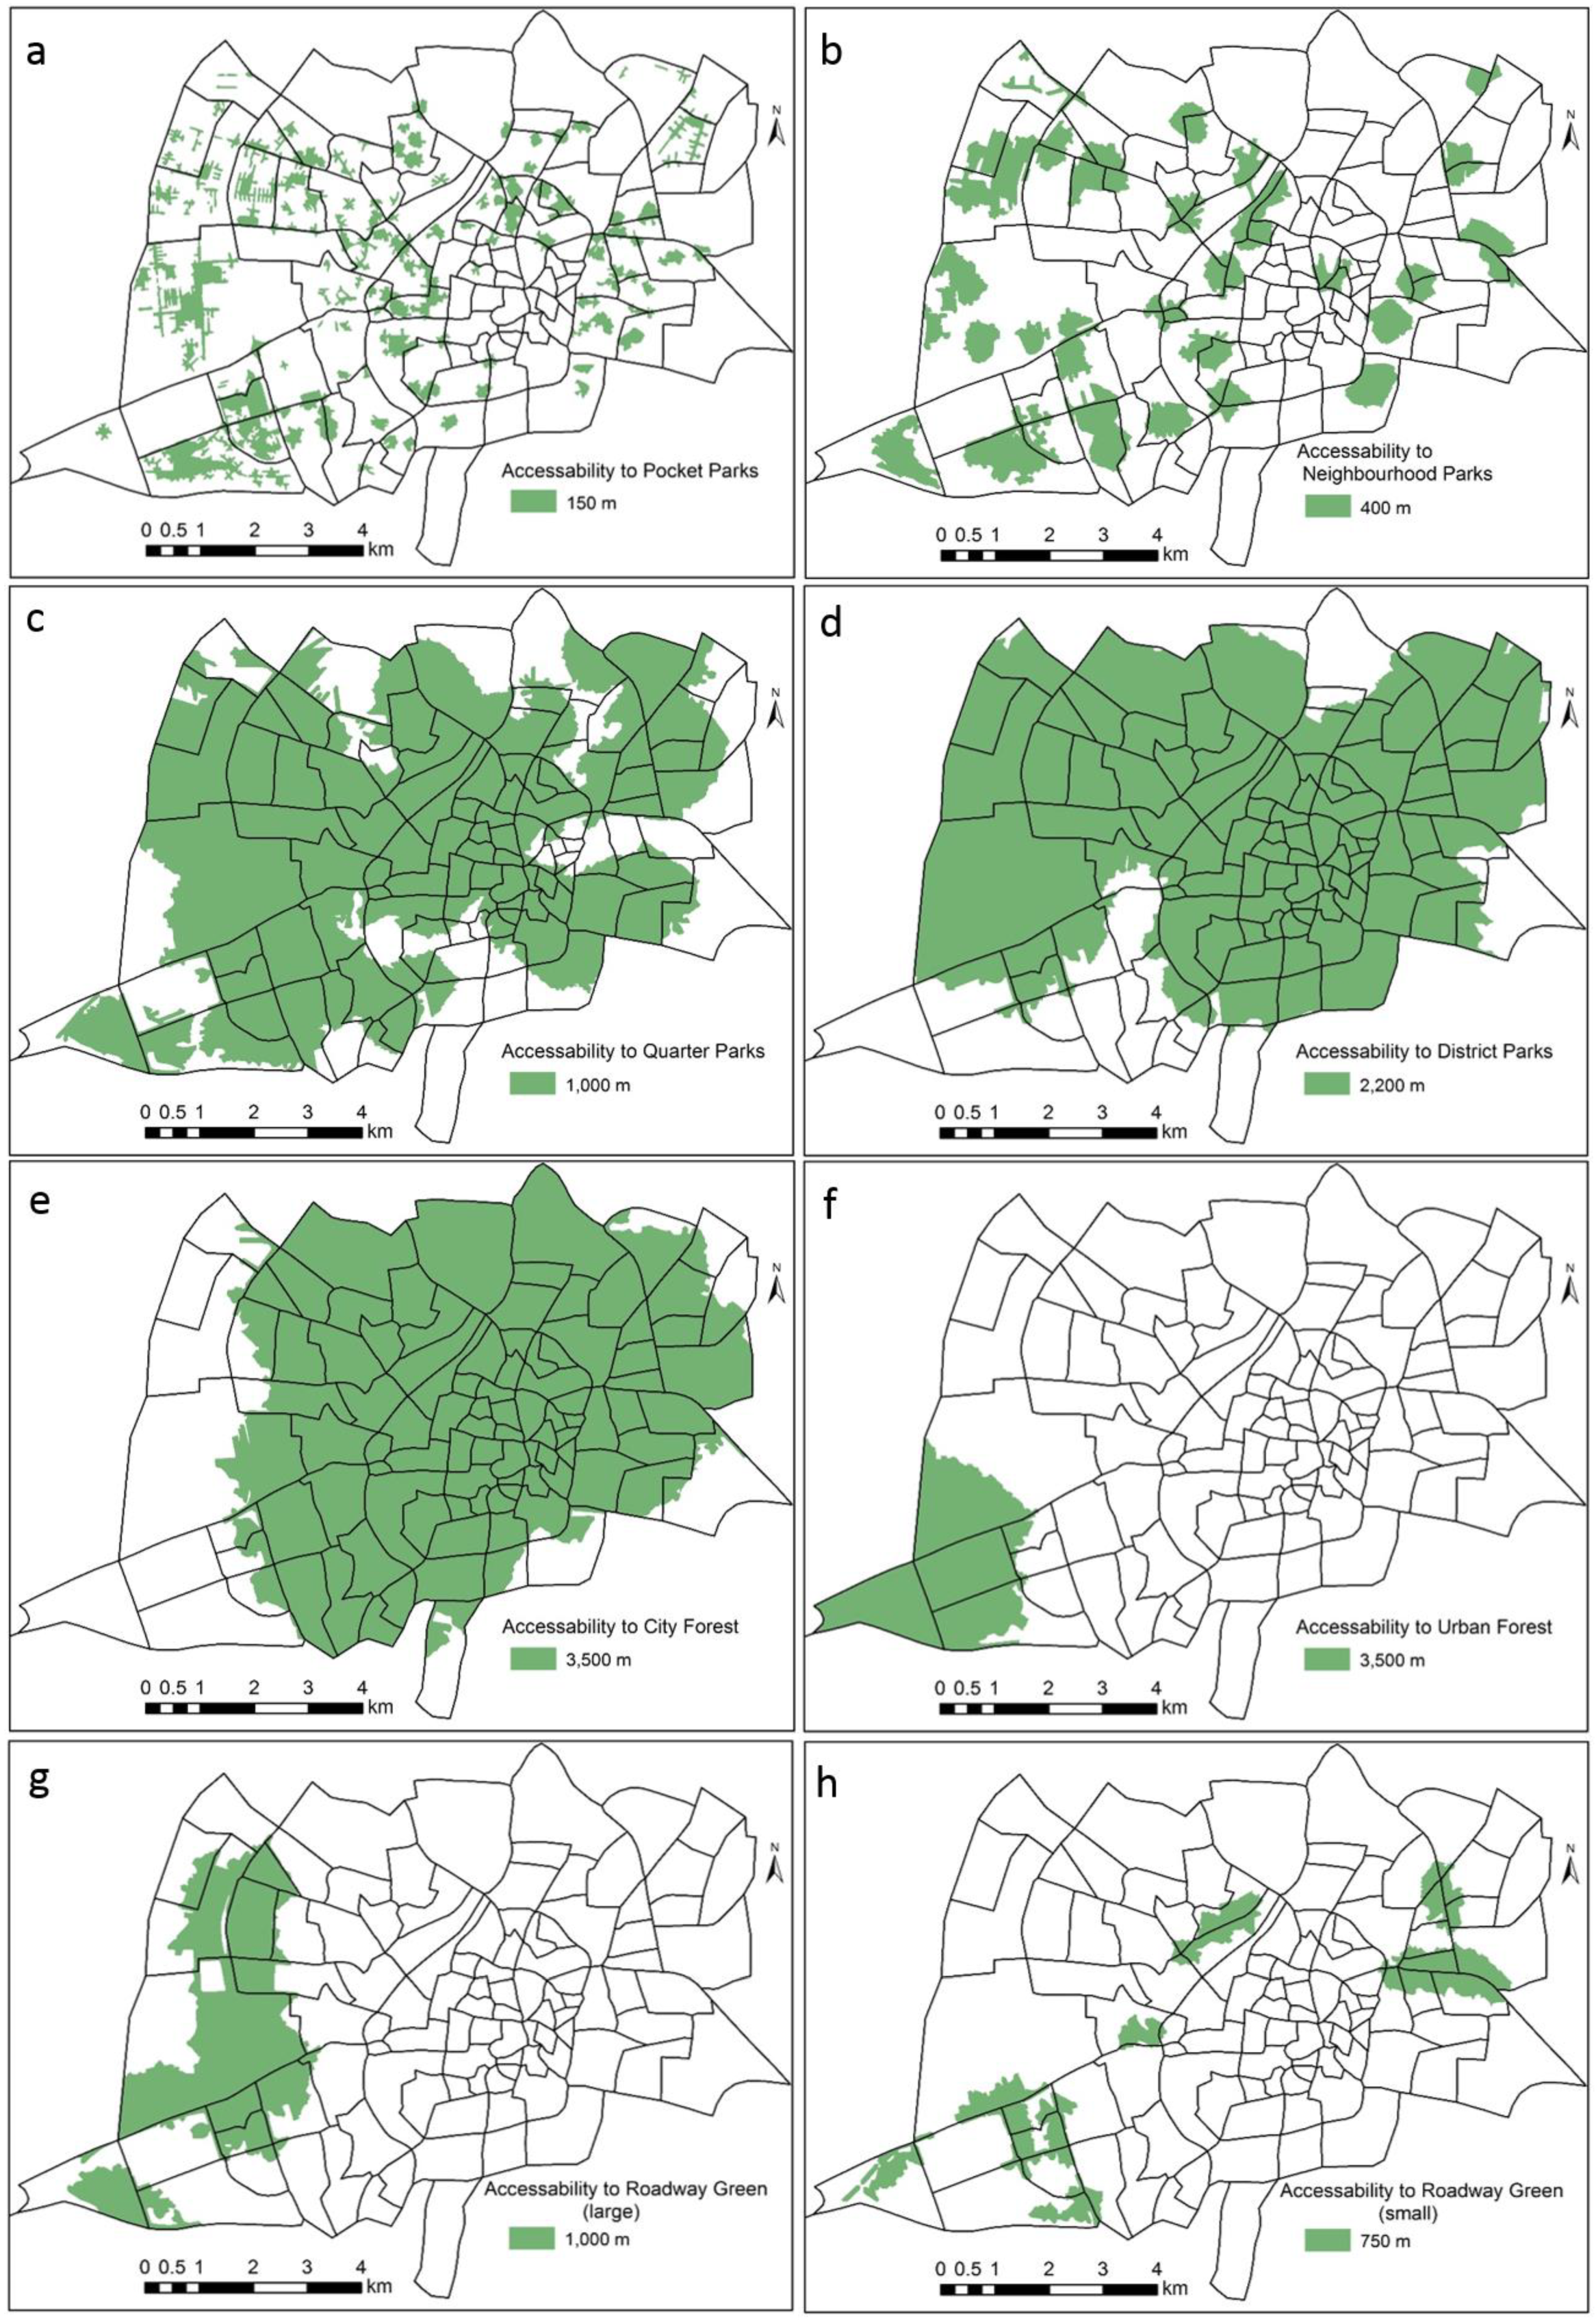
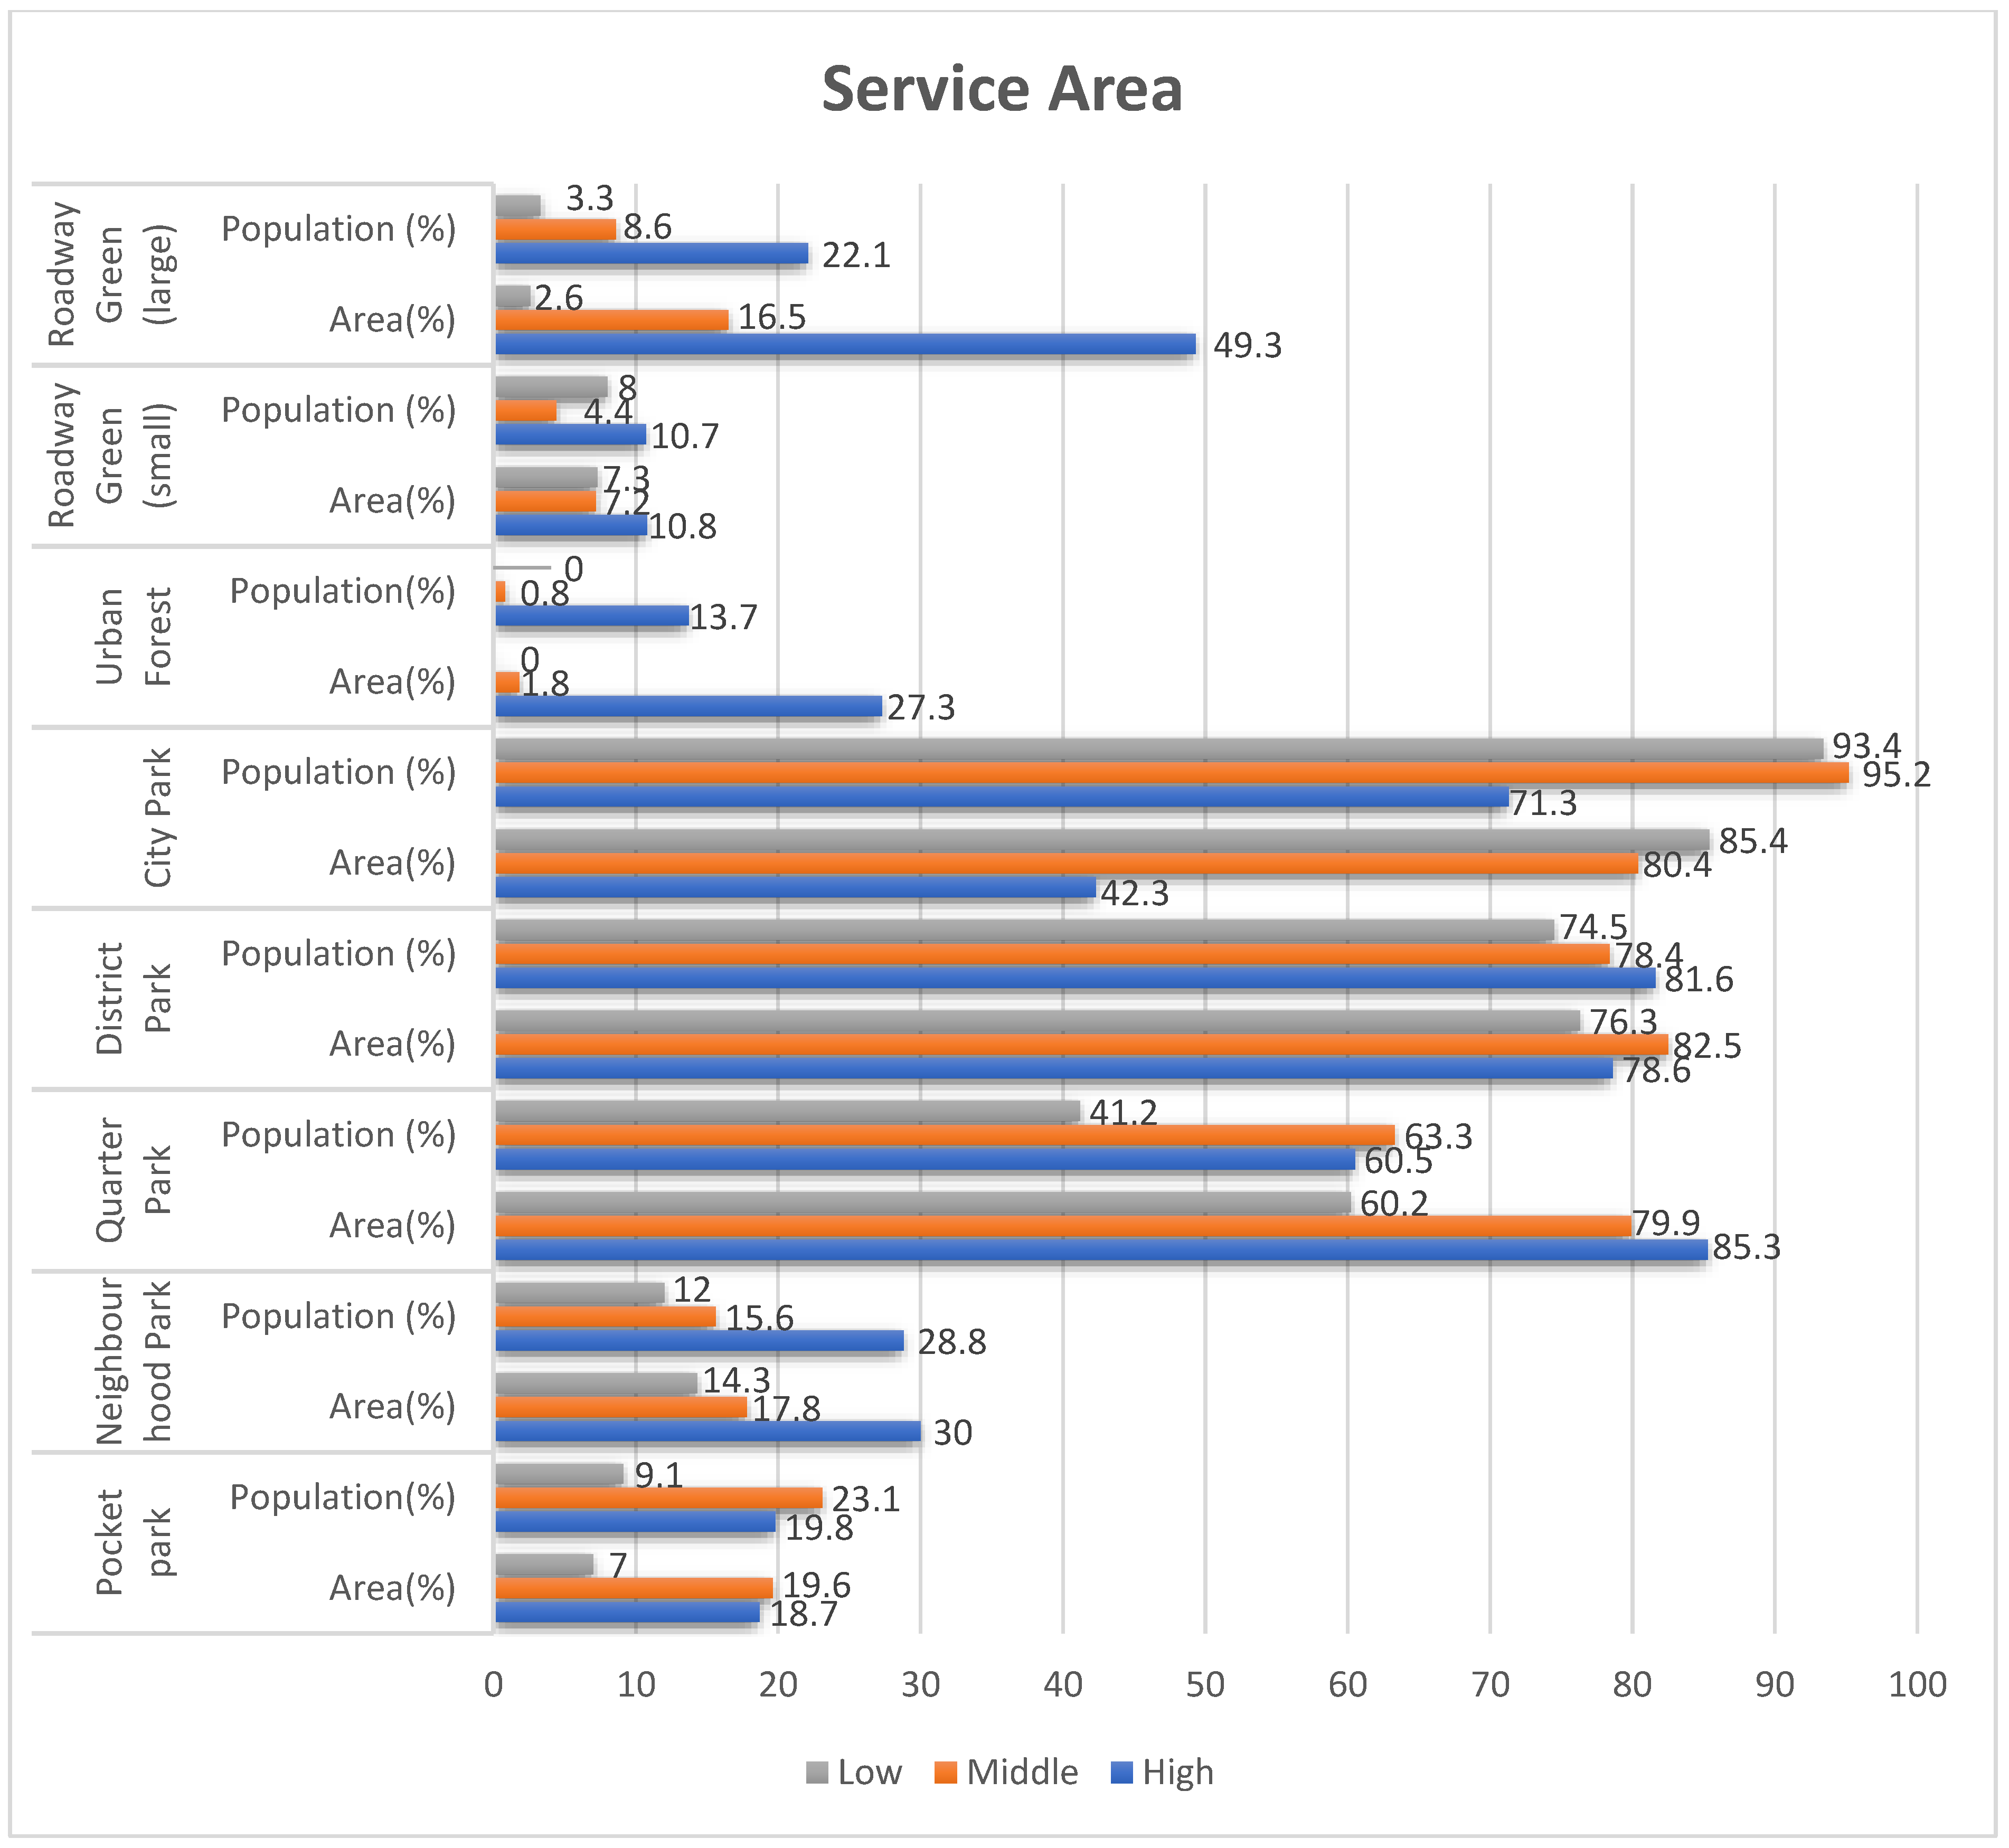
The hierarchy-wise service areas by network analysis (Figure 5a–h and Figure 6) reveal that the pocket parks are not well distributed in the study area and they have a poor serviceable population. The minimum coverage is found in areas with neighbourhoods of high population numbers and low income; in informal settlements in the southeast and east of Aleppo (Figure 5a). Figure 6 illustrates that 20% of the middle social status population have pocket parks within 150 m, but the accessibility of low and high social status groups is only 9% and 19%, respectively. It is noted that the neighbourhoods in the rich areas contain less pocket parks than middle-income neighbourhoods, except in the old city, due to the planning of buildings in the rich areas such that they are often villas with their own private gardens. Figure 5a demonstrates that 30% of neighbourhoods with low income are not covered with pocket parks service. It shows a large deficit of parks where early age children can play in a safe environment.
Access to pocket parks facilities in Aleppo varied by neighbourhoods boundaries. In general, the least accessible facilities were found in the marginal neighbourhoods, in particular, the far south, eastern parts of Aleppo city, and in the centre of old city, especially in neighbourhoods within Hanano, Al-Haydariyeh, Sheikh Maqsoud, Bani Zayed and Ain al-Tel municipalities (Figure 6). By contrast, the most accessible neighbourhoods were located in the west of Aleppo with variation in density of these facilities especially in neighbourhoods within Masharqa, Al-Hamadaniyeh 1, 2, 3 and 4, Feid and Mohafaza municipalities (Figure 5a).
Low and middle social status groups do not have good accessibility for most of the neighbourhood parks, which are mostly located in high social status group areas. We observed that in all service areas only 17% of the population was of low social status groups. 30% of neighbourhood area zones are not covered with public park service (Figure 5b and Figure 6). In contrast, high social status groups have good accessibility and approx. 30% of their population is served.
In quarter park and district parks assessment, all social status groups have good accessibility. Therefore, regional parks are most accessible for most social status levels compared to other park categories (Figure 5c,d and Figure 6).
City parks again illustrate a difference in accessibility by social status groups. Only 51% of high social status groups have accessibility, meanwhile, 80% of low- and middle social status groups profit from city parks (Figure 5e and Figure 6). The rapid growth has affected the urban form of the city over the past decades. This has encouraged the government to start improving the environment in informal neighbourhoods through the distribution of electricity and water and the establishment of parks, but due to very high building density there is lack of open space within most informal neighbourhoods in eastern Aleppo. They have established only district parks and city parks on the outskirts of the neighbourhoods, which later became part of the neighbourhoods due to urban expansion (e.g., Alsahour, Tarkbin Zaid and Alsharfia). Thus, all potential environmental assets can be transformed to serve the key objective of increasing the beneficial use of environmental resources, including green services and open spaces.
3.4. One-Way ANOVA Test and Post-Hoc Tukey HSD Test
There is a statistically significant difference between the three socioeconomic groups (high, middle and low income) as the one-way ANOVA (F (3.97) = 4.340, p = 0.006) pointed out. The post-hoc HSD Tukey test showed that there is a significant difference between high- and low-income neighbourhoods in their percentage of public park facilities. The test revealed that the percentage is significantly higher in high-income neighbourhoods (10.4 ± 10.5%, p = 0.010) compared to low-income neighbourhoods (3.1 ± 5.1%). According to the post-hoc test, there was no significant difference between high- and middle-income neighbourhoods (p = 0.534) as well as between middle- and low-income neighbourhoods (p = 0.075).
The government has also worked to establish roadway parks, which are located along the main roads in the city, especially in western Aleppo and in some areas in the east (Figure 5g,h) and Figure 6. The residents spend their leisure time in the afternoon and weekend there, but these gardens are not suitable for children to play because they are narrow and adjacent to the vast and fast roads in the city, posing a danger to children’s lives.
In summary, despite much accessible green space in Aleppo it is not evenly distributed. A number of statements about the provision of green space in Aleppo can be made:
- Most of the population (85%) lack access to pocket parks within 150 m.
- 60%–80% of residents lack access to neighbourhoods parks within 1000 m.
- Most people have access to the quarter parks, district parks and city parks within 3500 m.
- Low-income groups have significantly less access to most public city parks than high-income groups, except in the category of city parks.
Due to historical patterns of urban development, urban growth has been speeded up in high population density cities [9]. Unplanned and informal settlements have resulted in enlarged social and spatial inequality, resource consumption and environmental degradation [25]. This paper aimed to look at a certain part of urban infrastructure: recreational areas, such as parks, gardens, and playgrounds. These are especially important for human psychological wellbeing, as outlined previously. In a functioning city, they work as recreational space and places for physical activity. In destroyed Aleppo, green spaces can be especially useful to re-establish brick by brick a normality of living of the inhabitants. Green spaces can play an important role in the building up of a new social infrastructure within the neighbourhoods, can help the inhabitants to psychologically recover from the horror and pain of the civil war, and enhance their hope for a better future by supporting positive feelings. Especially for children it is important to provide spaces to play and to develop, which are not destroyed. Thinking in larger time frames, green spaces can also help to develop a sustainable city structure in the future and to remove the wartime-image from the face of the city within the coming decades.
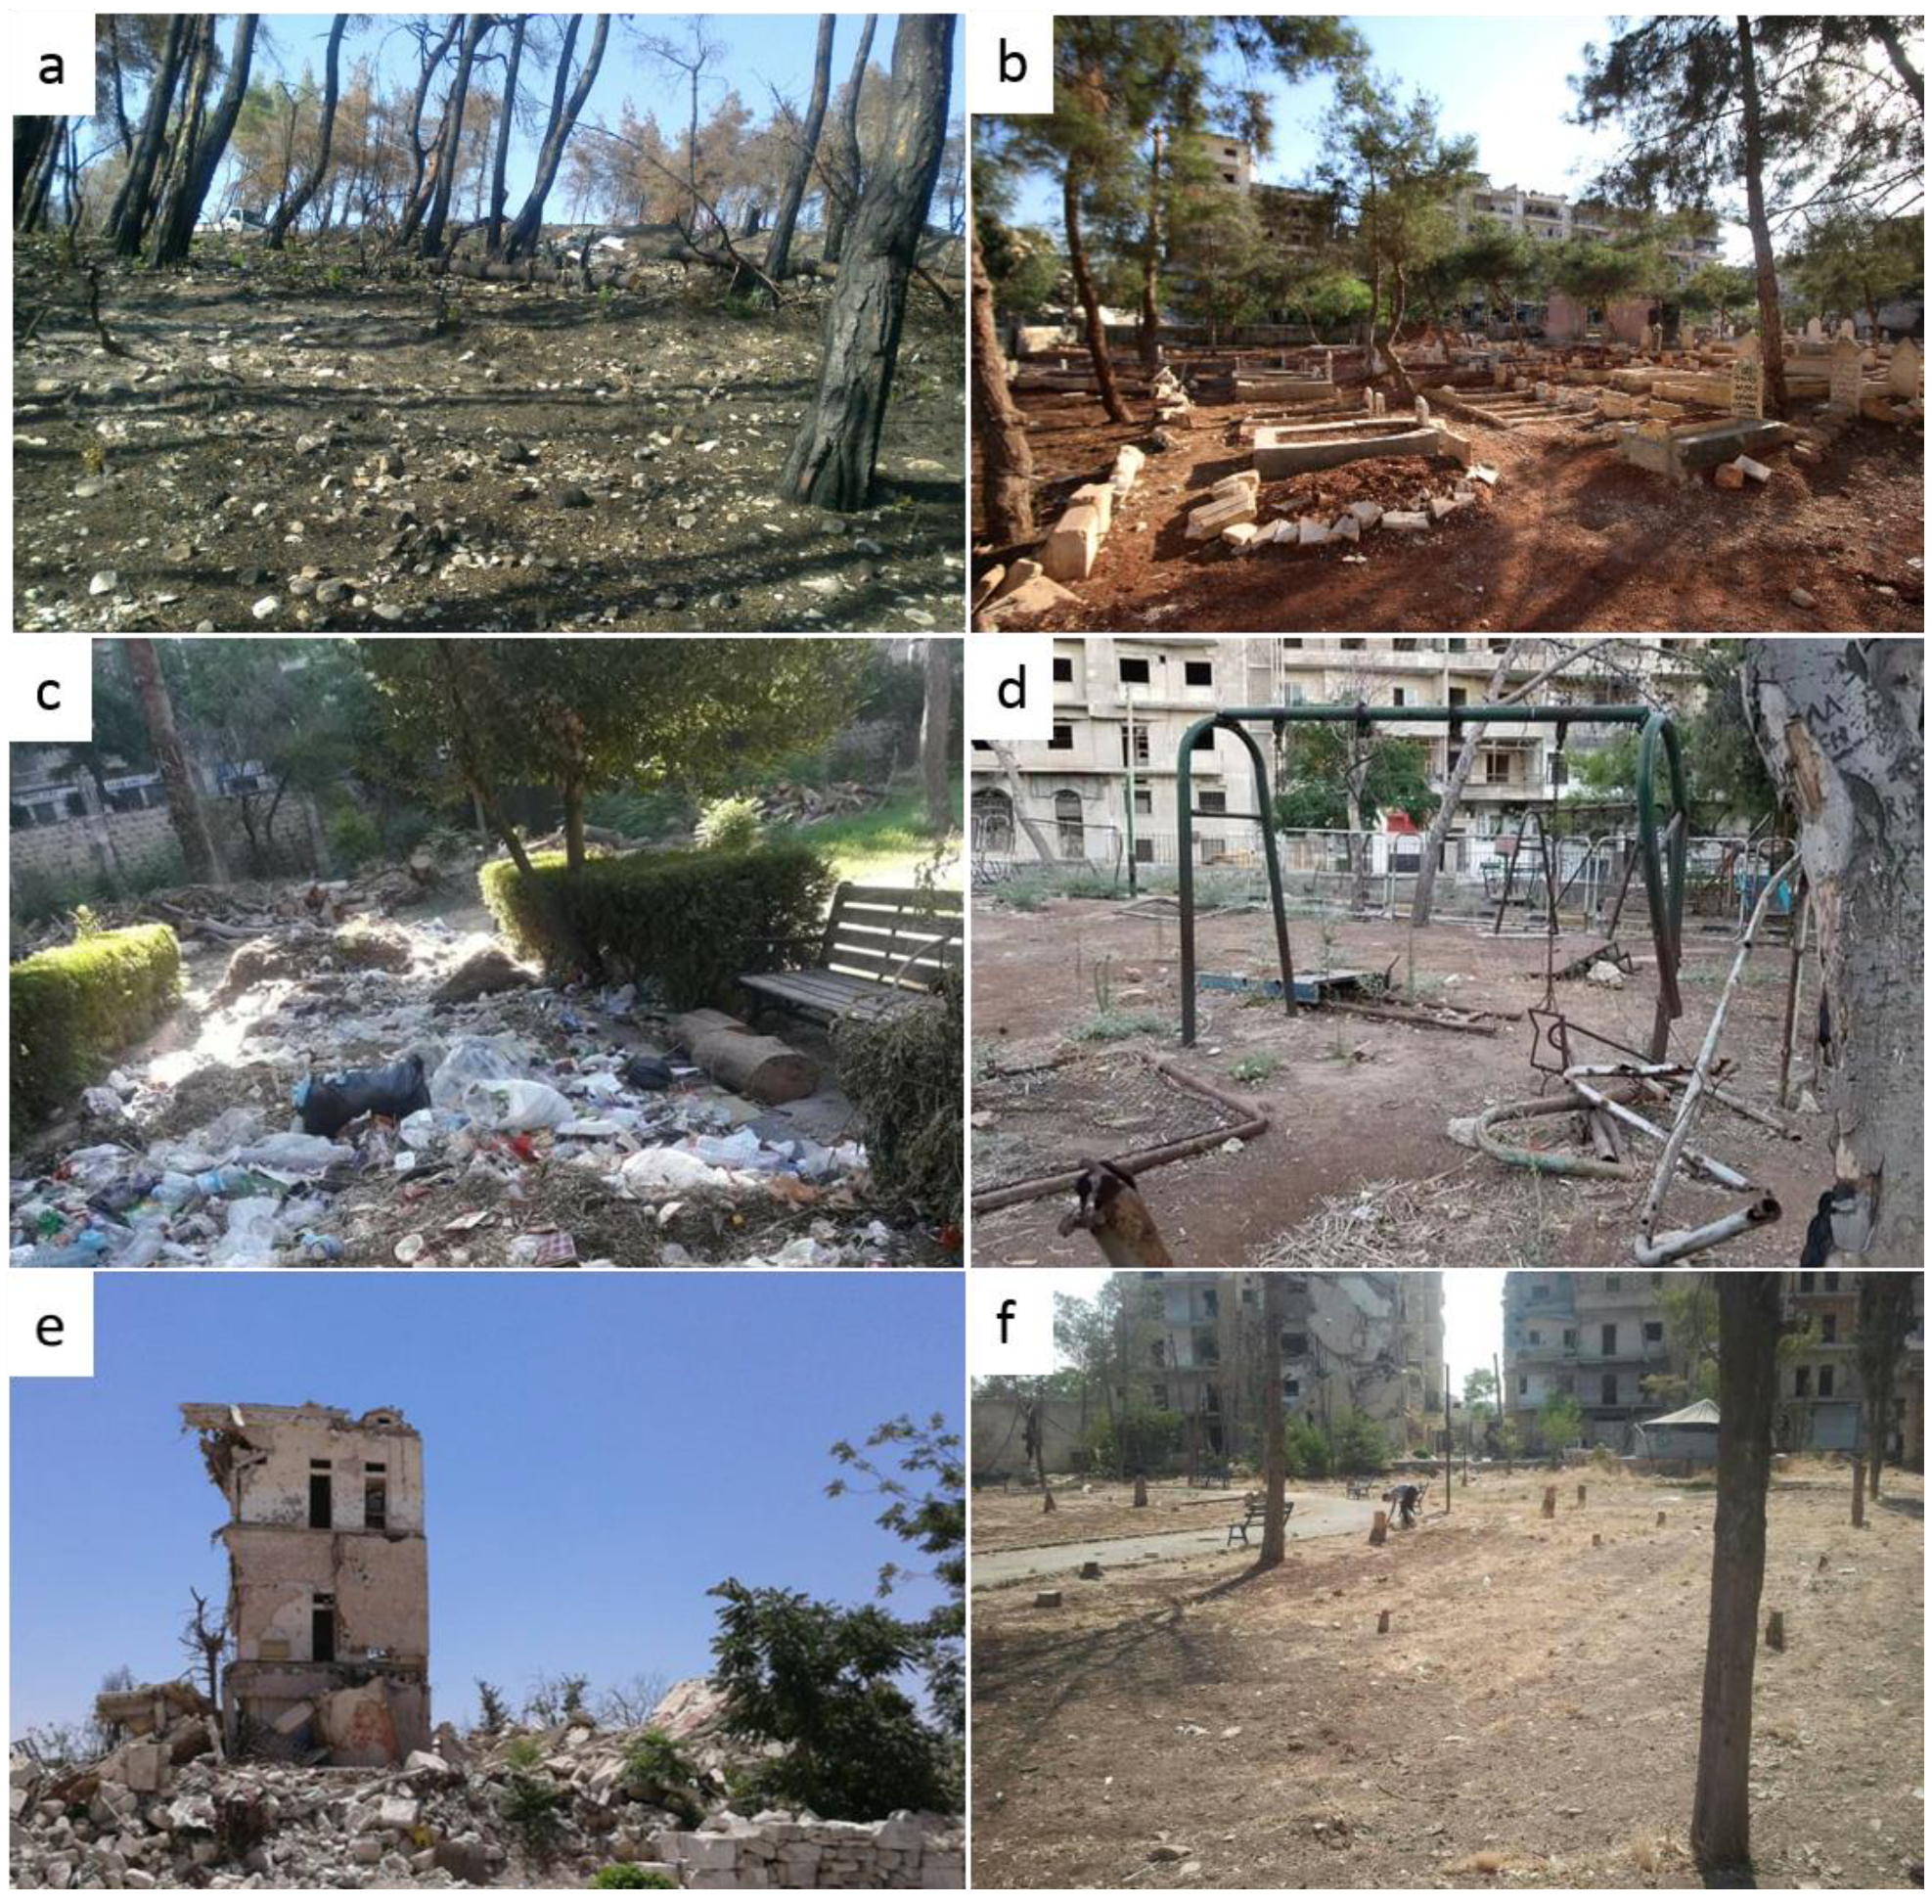
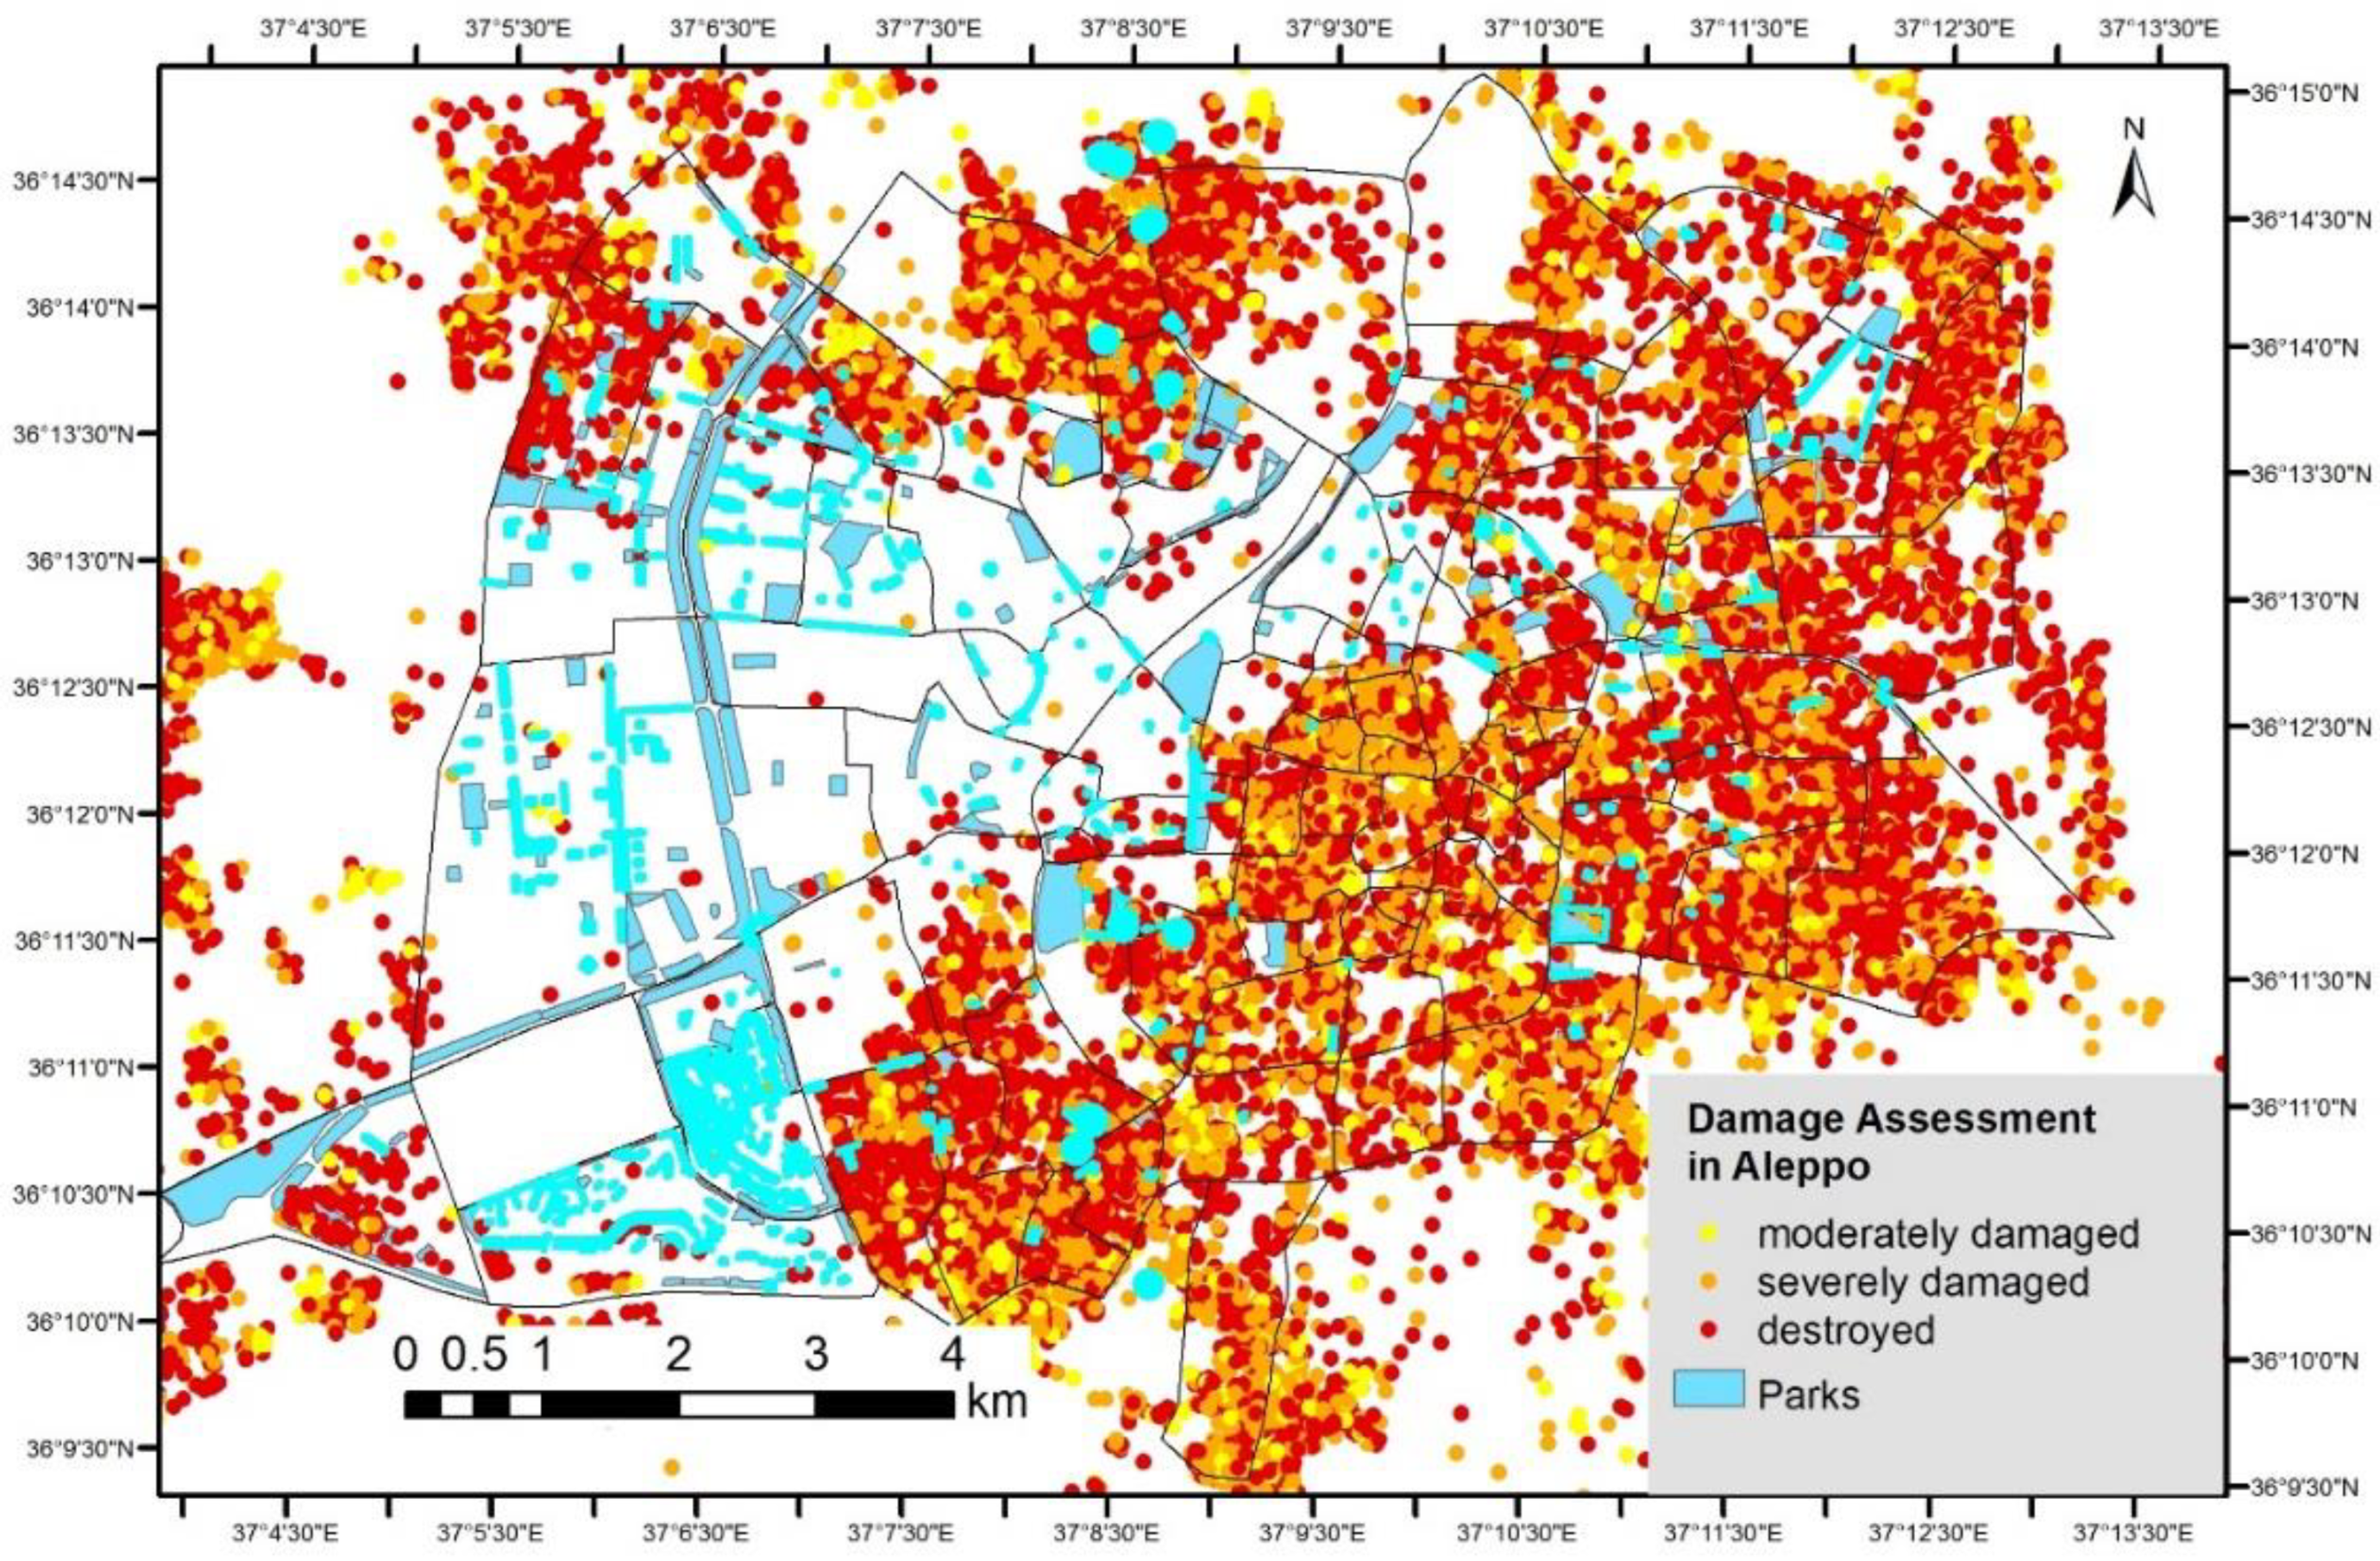
Although the government has established gardens in the informal settlements and on the outskirts of the old city, these gardens are not enough and lack a number of services. In particular, informal settlements and old Aleppo need small gardens (pocket parks and neighbourhood parks) for children. However, Aleppo’s green spaces were increasingly affected by the bombing, uncontrolled clear cutting and rampant stealing for heating fuel and other forest products (Figure 7). From 2012 until now, many of Aleppo’s public parks and forests have been decimated and several of the city’s parks, playgrounds, and sports fields had been unceremoniously converted into cemeteries, rubble fields, camps or military base installations [57]. Comparing our research results to damage assessment maps of the city core of Aleppo, it is striking to see that especially urban green spaces in eastern, southeastern and northern parts of Aleppo were heavily affected by destruction caused by the civil war (Figure 7 and Figure 8). In contrast, parks in the western parts of the city were left relatively untouched by the destruction. Moreover, the hierarchical levels of roadway green (small) and roadway green (large) were left relatively untouched, as they mainly lie in the western parts of the city. Like Aleppo’s built environment, it will take years for the city’s green space to recover from the ravages of war. As some areas already lacked urban green spaces especially of lower hierarchical levels before the war, it is therefore important that the reconstruction plans in the city of Aleppo include the construction of small gardens in eastern Aleppo and old Aleppo, which will contribute to improving life and promoting reconciliation. However, already today a number of civil and governmental initiatives (Husat Halab, Aleppo more beautiful) have been launched in order to help the public utilities to clean up the streets and rebuild areas and parks of the city damaged by war [58,59] (Figure 9).
It seems thus inevitable necessary to set up a plan to structure the whole city anew. While reconstructing the city, a lot of actors will be participating in the formation of new city concepts and attention will be given too many different emphases.
Optimum service areas should include area size, amenities of the public green spaces, transportation, focal points and population density, along with the appropriate data and destinations, in addition to the use of network analysis. This will lead to the increased accessibility of parks, not only for existing public green spaces but also for suggested urban green areas [3].
4. Conclusions
This study fills part of the significant gap in the urban planning literature in Syria, especially in relation to local and urban planning: we have presented a method for quantifying the size and accessibility of green space access using a GIS network analysis and census data to quantify access for different socioeconomic groups in order to point out the environmental justice issue of inequity to urban green spaces. The analysis explored in greater depth the results for public green parks. For example, in this study, the hierarchy-wise analysis reveals a strong deficit of urban green spaces at lower hierarchies. Pocket parks and neighborhood parks, which only served a very small fraction of population (9%–19% at pocket parks level and 14%–30% at neighbourhood level), showed the most variation and inequitable access amongst different socioeconomic groups. This correlates with results of environmental justice research in cities of the Global South. As income-differences between socioeconomic groups generally differ more widely in cities of the Global South than in cities of the Global North, access to urban green spaces becomes a crucial part of creating social equity, and therefore, sustainability within the city.
Although this research is based on pre-war datasets due to lack of recent data, it can serve as a basis for policy makers and decision makers in the reconstruction process in Aleppo. We analysed the spatial distribution of urban green spaces and also showed how some of those have been affected by the war. In-depth studies of each public park in post-war Aleppo are necessary to develop specific strategies for their reconstruction, however, our study may function as a foundational analysis of areas of under-supply. It can moreover emphasize the need to develop a strategy on urban green spaces for the whole city by pointing out the inequity in access to public parks before the war.
This work should stimulate the urban planning research community to consider GIS-based network analyses. For example, one consequence of this analysis on local decision-making or the evaluation of new development proposals is that planners must focus on optimizing the distribution of public green spaces and move towards a liveable and healthy city environment. Our opinion is that an equitable distribution of parks among different income cohorts of a city’s population is a good measure of spatial equity and that cities can improve quality of life for their citizens by prioritizing access to open space regardless of neighbourhood income. Environmental justice for the inhabitants of Aleppo city can only be obtained, if measures are taken to create equity among their access to urban green spaces.
The results of our spatial equity analysis, the network analysis and our recommendations for implementation of pocket parks and neighbourhood parks in the context of Aleppo can serve as a template for cities in Syria with a widening gap between high- and low-income levels. Developing a green space strategy is a necessary opportunity for improving the quality of life in Syrian cities. Spatial equity is an indicator of the sustainable provision of good public recreational space to all citizens, and it would give families living in low-income neighbourhoods a greater sense of security. Therefore, in post-war Aleppo, green spaces can play an important role in constructing new social infrastructure within neighbourhoods while also helping inhabitants to psychologically recover from the horror and pain of the civil war.
Author Contributions
Conceptualization, H.A. and A.L.K.; Methodology, H.A. and A.L.K.; Validation, H.A., B.M.H. and A.L.K.; Formal Analysis, H.A. and A.L.K.; Investigation, B.M.H.; Data Curation, H.A. and A.L.K.; Writing-Original Draft Preparation, H.A. and A.L.K.; Writing-Review & Editing, H.A., A.L.K. and B.M.H.; Visualization, H.A. and A.L.K.
Funding
This research received no external funding.
Acknowledgments
The authors would like to extend their sincere appreciation to the Justus Liebig University Giessen and Imam Abdulrahman Bin Faisal University. Pictures were taken in association with students and colleagues from Aleppo.
Conflicts of Interest
The authors declare no conflict of interest.
References and Notes
- Macedo, J.; Haddad, M.A. Equitable distribution of open space: Using spatial analysis to evaluate urban parks in Curitiba, Brazil. Environ. Plan. B Plan. Des. 2016, 43, 1096–1117. [Google Scholar] [CrossRef]
- Yuan, Y.; Xu, J.; Wang, Z. Spatial equity measure on urban ecological space layout based on accessibility of socially vulnerable groups-A case study of Changting, China. Sustainability 2017, 9, 1–20. [Google Scholar] [CrossRef]
- Unal, M.; Uslu, C. Evaluating and Optimizing Urban Green Spaces for Compact Urban Areas: Cukurova District in Adana, Turkey. Int. J. Geo-Inf. 2018, 7, 70. [Google Scholar] [CrossRef]
- German Technical Cooperation (GTZ) Syrian—German Development Cooperation Program for Sustainable Urban Development in Syria Aleppo Urban Development Project “Notes on a proposed Policy & Implementation Strategies for Informal Settlements” By: Patrick Wakely on behalf of Aleppo Urban D; Damascus and Columbus, 2010.
- La Rosa, D. Accessibility to greenspaces: GIS based indicators for sustainable planning in a dense urban context. Ecol. Indic. 2014, 42, 122–134. [Google Scholar] [CrossRef]
- Tu, X.; Huang, G.; Wu, J. Contrary to common observations in the west, urban park access is only weakly related to neighborhood socioeconomic conditions in Beijing, China. Sustainability 2018, 10, 1115. [Google Scholar] [CrossRef]
- Bertram, C.; Rehdanz, K. The role of urban green space for human well-being. Ecol. Econ. 2015, 120, 139–152. [Google Scholar] [CrossRef] [Green Version]
- De La Barrera, F.; Reyes-Paecke, S.; Banzhaf, E. Indicators for green spaces in contrasting urban settings. Ecol. Indic. 2016, 62, 212–219. [Google Scholar] [CrossRef]
- Cetin, M. Using GIS analysis to assess urban green space in terms of accessibility: Case study in Kutahya. Int. J. Sustain. Dev. World Ecol. 2015, 22, 420–424. [Google Scholar] [CrossRef]
- Talen, E. Neighborhoods as service providers: A methodology for evaluating pedestrian access. Environ. Plan. B Plan. Des. 2003, 30, 181–200. [Google Scholar] [CrossRef]
- Rigolon, A.; Browning, M.; Lee, K.; Shin, S. Access to urban green space in cities of the global south: A systematic literature review. Urban Sci. 2018, 2, 67. [Google Scholar] [CrossRef]
- Rigolon, A. A complex landscape of inequity in access to urban parks: A literature review. Landsc. Urban Plan. 2016, 153, 160–169. [Google Scholar] [CrossRef]
- Konijnendijk, C.C.; Annerstedt, M.; Nielsen, A.B.; Maruthaveeran, S. Benefits of Urban Parks—A systematic review. Int. Fed. Park. Recreat. Adm. 2013, 1–68. [Google Scholar]
- Van Herzele, A.; Wiedemann, T. A monitoring tool for the provision of accessible and attractive urban green spaces. Landsc. Urban Plan. 2003, 63, 109–126. [Google Scholar] [CrossRef]
- Haaland, C.; van den Bosch, C.K. Challenges and strategies for urban green-space planning in cities undergoing densification: A review. Urban For. Urban Green. 2015, 14, 760–771. [Google Scholar] [CrossRef]
- Jennings, V.; Johnson Gaither, C.; Gragg, R.S. Promoting Environmental Justice Through Urban Green Space Access: A Synopsis. Environ. Justice 2012, 5, 1–7. [Google Scholar] [CrossRef]
- Akpinar, A. How is quality of urban green spaces associated with physical activity and health? Urban For. Urban Green. 2016, 16, 76–83. [Google Scholar] [CrossRef]
- Wolch, J.R.; Byrne, J.; Newell, J.P. Urban green space, public health, and environmental justice: The challenge of making cities “just green enough”. Landsc. Urban Plan. 2014, 125, 234–244. [Google Scholar] [CrossRef]
- Margaritis, E.; Kang, J. Relationship between urban green spaces and other features of urban morphology with traffic noise distribution. Urban For. Urban Green. 2016, 15, 174–185. [Google Scholar] [CrossRef] [Green Version]
- Boone, C.G.; Buckley, G.L.; Grove, J.M.; Sister, C. Parks and People: An environmental justice inquiry in baltimore, Maryland. Ann. Assoc. Am. Geogr. 2009, 99, 767–787. [Google Scholar] [CrossRef]
- Campbell, S. Green Cities, Growing Cities, Just Cities? Urban Planning and the Contradictions of Sustainable Development. J. Am. Plan. Assoc. 1996, 62, 296–312. [Google Scholar] [CrossRef]
- Wolch, J.; Wilson, J.P.; Fehrenbach, J. Parks and park funding in Los Angeles: An equity-mapping analysis. Urban Geogr. 2005, 26, 4–35. [Google Scholar] [CrossRef]
- Schlosberg, D. Reconceiving environmental justice: Global movements and political theories. Environ. Polit. 2004, 13, 517–540. [Google Scholar] [CrossRef]
- Unal, M.; Uslu, C.; Cilek, A. GIS-based accessibility analysis for neighbourhood Parks: The case of cukurova district modelling accessibility to urban greenspaces. J. Digit. Landsc. Archit. 2016, 1, 46–56. [Google Scholar] [CrossRef]
- Germann-Chiari, C.; Seeland, K. Are urban green spaces optimally distributed to act as places for social integration? Results of a geographical information system (GIS) approach for urban forestry research. For. Policy Econ. 2004, 6, 3–13. [Google Scholar] [CrossRef]
- Rojas, C.; Páez, A.; Barbosa, O.; Carrasco, J. Accessibility to urban green spaces in Chilean cities using adaptive thresholds. J. Transp. Geogr. 2016, 57, 227–240. [Google Scholar] [CrossRef]
- Taylor, B.T.; Fernando, P.; Bauman, A.E.; Williamson, A.; Craig, J.C.; Redman, S. Measuring the quality of public open space using google earth. Am. J. Prev. Med. 2011, 40, 105–112. [Google Scholar] [CrossRef] [PubMed]
- Oh, K.; Jeong, S. Assessing the spatial distribution of urban parks using GIS. Landsc. Urban Plan. 2007, 82, 25–32. [Google Scholar] [CrossRef]
- Gupta, K.; Roy, A.; Luthra, K.; Maithani, S.; Mahavir. GIS based analysis for assessing the accessibility at hierarchical levels of urban green spaces. Urban For. Urban Green. 2016, 18, 198–211. [Google Scholar] [CrossRef]
- Programme for sustainable Urban Development UDP Informal settlements in aleppo: RAPID PROFILES OF ALL INFORMAL SETTLEMENTS IN ALEPPO; Aleppo, 2008.
- Central Bureau of Statistics Number of Population and Families by Urban and Rural 2004. Available online: http://cbssyr.sy/General census/census 2004/pop-man.pdf (accessed on 30 May 2017).
- UN-HABITAT City Profile Aleppo. Multi Sector Assessment; Damascus, 2014.
- Aleppo Governorate Council service for spatial data of Aleppo Governorate Council; Aleppo, 2016.
- Kounadi, O. Assessing the Quality of OpenStreetMap Data. Master’s Thesis, University College of London, London, UK, 2009. [Google Scholar]
- Ather, A. A Quality Analysis of Open Street Map Data. Master’s Thesis, University College London, London, UK, May 2009. [Google Scholar]
- Wang, M.; Li, Q.; Hu, Q.; Zhou, M. Quality analysis of open street map data. ISPRS Int. Arch. Photogramm. Remote Sens. Spat. Inf. Sci. 2013, 40, 155–158. [Google Scholar] [CrossRef]
- Open Street Map Data Quality. Available online: http://osmlab.github.io/osm-data-quality/ (accessed on 20 October 2018).
- Balooni, K.; Gangopadhyay, K.; Kumar, B.M. Governance for private green spaces in a growing Indian city. Landsc. Urban Plan. 2014, 123, 21–29. [Google Scholar] [CrossRef]
- Wright Wendel, H.E.; Zarger, R.K.; Mihelcic, J.R. Accessibility and usability: Green space preferences, perceptions, and barriers in a rapidly urbanizing city in Latin America. Landsc. Urban Plan. 2012, 107, 272–282. [Google Scholar] [CrossRef]
- Central Bureau of Statistics CBS-SY. Available online: http://www.cbssyr.sy/index-EN.htm (accessed on 7 August 2017).
- Municipality of Aleppo; Aleppo, 2009.
- Municipality of Aleppo; Aleppo, 2012.
- Winkleby, M.A.; Jatulis, D.E.; Frank, E.; Fortmann, S.P. Socioeconomic status and health: How education, income, and occupation contribute to risk factors for cardiovascular disease. Am. J. Public Health 1992, 82, 816. [Google Scholar] [CrossRef] [PubMed]
- Singh, T.; Sharma, S.; Nagesh, S. Socio-economic status scales updated for 2017. Int. J. Res. Med. Sci. 2017, 5, 3264. [Google Scholar] [CrossRef] [Green Version]
- Hashem, N. Assessing spatial equality of urban green spaces provision: A case study of Greater Doha in Qatar. Local Environ. 2015, 20, 386–399. [Google Scholar] [CrossRef]
- Handley, J.; Pauleit, S.; Slinn, P.; Lindley, S.; Baker, M.; Barber, A.; Jones, C. Providing accessible natural greenspace in towns and cities: A practical guide to assessing the resource and implementing local standards for provision. Rep. Nat. Engl. 2003, 1–36. [Google Scholar] [CrossRef]
- Breuste, J.; Rahimi, A. Many public urban parks, but who profits from them? The example of Tabriz, Iran. Ecol. Process. 2015, 4, 6. [Google Scholar] [CrossRef]
- ESRI (Environmental Systems Research Institute) How Average Nearest Neighbor Distance (Spatial Statistics) Works. Available online: http://resources.esri.com/help/9.3/ArcGISDesktop/com/Gp_ToolRef/spatial_statistics_tools/how_average_nearest_neighbor_distance_spatial_statistics_works.htm (accessed on 31 May 2017).
- IB Geography Nearest Neighbor Index. Available online: http://www.geoib.com/nearest-neighbor-index.html (accessed on 31 May 2017).
- Mansour, S. Spatial analysis of public health facilities in Riyadh governorate, Saudi Arabia: A GIS-based study to assess geographic variations of service provision and accessibility. Geo-spatial Inf. Sci. 2016, 19, 26–38. [Google Scholar] [CrossRef]
- Schwanke Khilji, S.U.; Rudge, J.W.; Drake, T.; Chavez, I.; Borin, K.; Touch, S.; Coker, R. Distribution of selected healthcare resources for influenza pandemic response in Cambodia. Int. J. Equity Health 2013, 12, 82. [Google Scholar] [CrossRef] [PubMed] [Green Version]
- Li, H.; Chen, W.; He, W. Planning of green space ecological network in urban areas: An example of Nanchang, China. Int. J. Environ. Res. Public Health 2015, 12, 12889–12904. [Google Scholar] [CrossRef] [PubMed]
- Siragusa, A.; Pafi, M.; Ferri, S.; Halkia, S. Measuring the Accessibility of Urban Green Areas: A Comparison of the Green ESM with other Datasets in Four European Cities Measuring the Accessibility of Urban Green Areas a Comparison of the Green; JRC Technical Reports; Joint Research Centre: Ispra, Italy, 2016; ISBN 9789279612862. [Google Scholar]
- So, S.W. Urban Green Space Accessibility and Environmental Justice: A GIS-based Analysis in the City of Phoenix, Arizona. Ph.D. Thesis, University of Southern California, Los Angeles, CA, USA, August 2016. [Google Scholar]
- Moseley, D.; Marzano, M.; Chetcuti, J.; Watts, K. Green networks for people: Application of a functional approach to support the planning and management of greenspace. Landsc. Urban Plan. 2013, 116, 1–12. [Google Scholar] [CrossRef]
- Ho, R. Handbook of Univariate and Multivariate Data Analysis and Interpretation with SPSS; Chapman and Hall/CRC.: New York, NY, USA, 2006. [Google Scholar]
- World Bank Group Syria Damage Assessment of Selected Cities Aleppo, Hama, Idlib; Washington, 2017.
- Asianews Aleppo more Beautiful Christians and Muslims Clean the City. Available online: http://www.asianews.it/news-en/Aleppo-more-beautiful:-Christians-and-Muslims-clean-the-city-41129.html (accessed on 17 October 2018).
- UNHCR Aleppo Slowly Progresses along Road to Recovery. Available online: http://www.unhcr.org/news/latest/2017/5/591480404/aleppo-slowly-progresses-along-road-recovery.html (accessed on 15 October 2018).
- UNITAR-UNOSAT Damage Density in the City of Aleppo 2016.
Figure 1.
The study area map.

Figure 2.
Neighbourhoods and Socioeconomic characteristics in Aleppo 2008.

Figure 3.
Photos of Classification of hierarchical levels of public green spaces, pocket park (a), neighbourhood park (b), quarter park (c), district park (d), city park (e), urban forest (f), roadway green (large) (g), and roadway green (small) (h) in Aleppo.
Figure 3.
Photos of Classification of hierarchical levels of public green spaces, pocket park (a), neighbourhood park (b), quarter park (c), district park (d), city park (e), urban forest (f), roadway green (large) (g), and roadway green (small) (h) in Aleppo.

Figure 4.
Percentage of public park facilities in each neighbourhood.

Figure 5.
Service areas of park area (pocket park (a), neighbourhood park (b), quarter park (c), district park (d), city park (e), urban forest (f), roadway green (large) (g), and roadway green (small) (h)) in Aleppo, 2009.
Figure 5.
Service areas of park area (pocket park (a), neighbourhood park (b), quarter park (c), district park (d), city park (e), urban forest (f), roadway green (large) (g), and roadway green (small) (h)) in Aleppo, 2009.

Figure 6.
Categories of public urban green spaces (Roadway green (large), Roadway Green (small), Urban Forest, City Park, District Park, Quarter Park, Neighbourhood Park, Pocket) and percent of social status profits by different categories of public urban green spaces.
Figure 6.
Categories of public urban green spaces (Roadway green (large), Roadway Green (small), Urban Forest, City Park, District Park, Quarter Park, Neighbourhood Park, Pocket) and percent of social status profits by different categories of public urban green spaces.

Figure 7.
Photos of public parks (2016–2018) converted into cemeteries (a), Landfill (b) or affected by the bombing (c–e), uncontrolled clear cutting and rampant stealing for heating fuel (f).
Figure 7.
Photos of public parks (2016–2018) converted into cemeteries (a), Landfill (b) or affected by the bombing (c–e), uncontrolled clear cutting and rampant stealing for heating fuel (f).

Figure 8.
Comparison of damaged sites in Aleppo (ranging from moderately damaged to destroyed) with urban green spaces (data provided by [60]).
Figure 8.
Comparison of damaged sites in Aleppo (ranging from moderately damaged to destroyed) with urban green spaces (data provided by [60]).

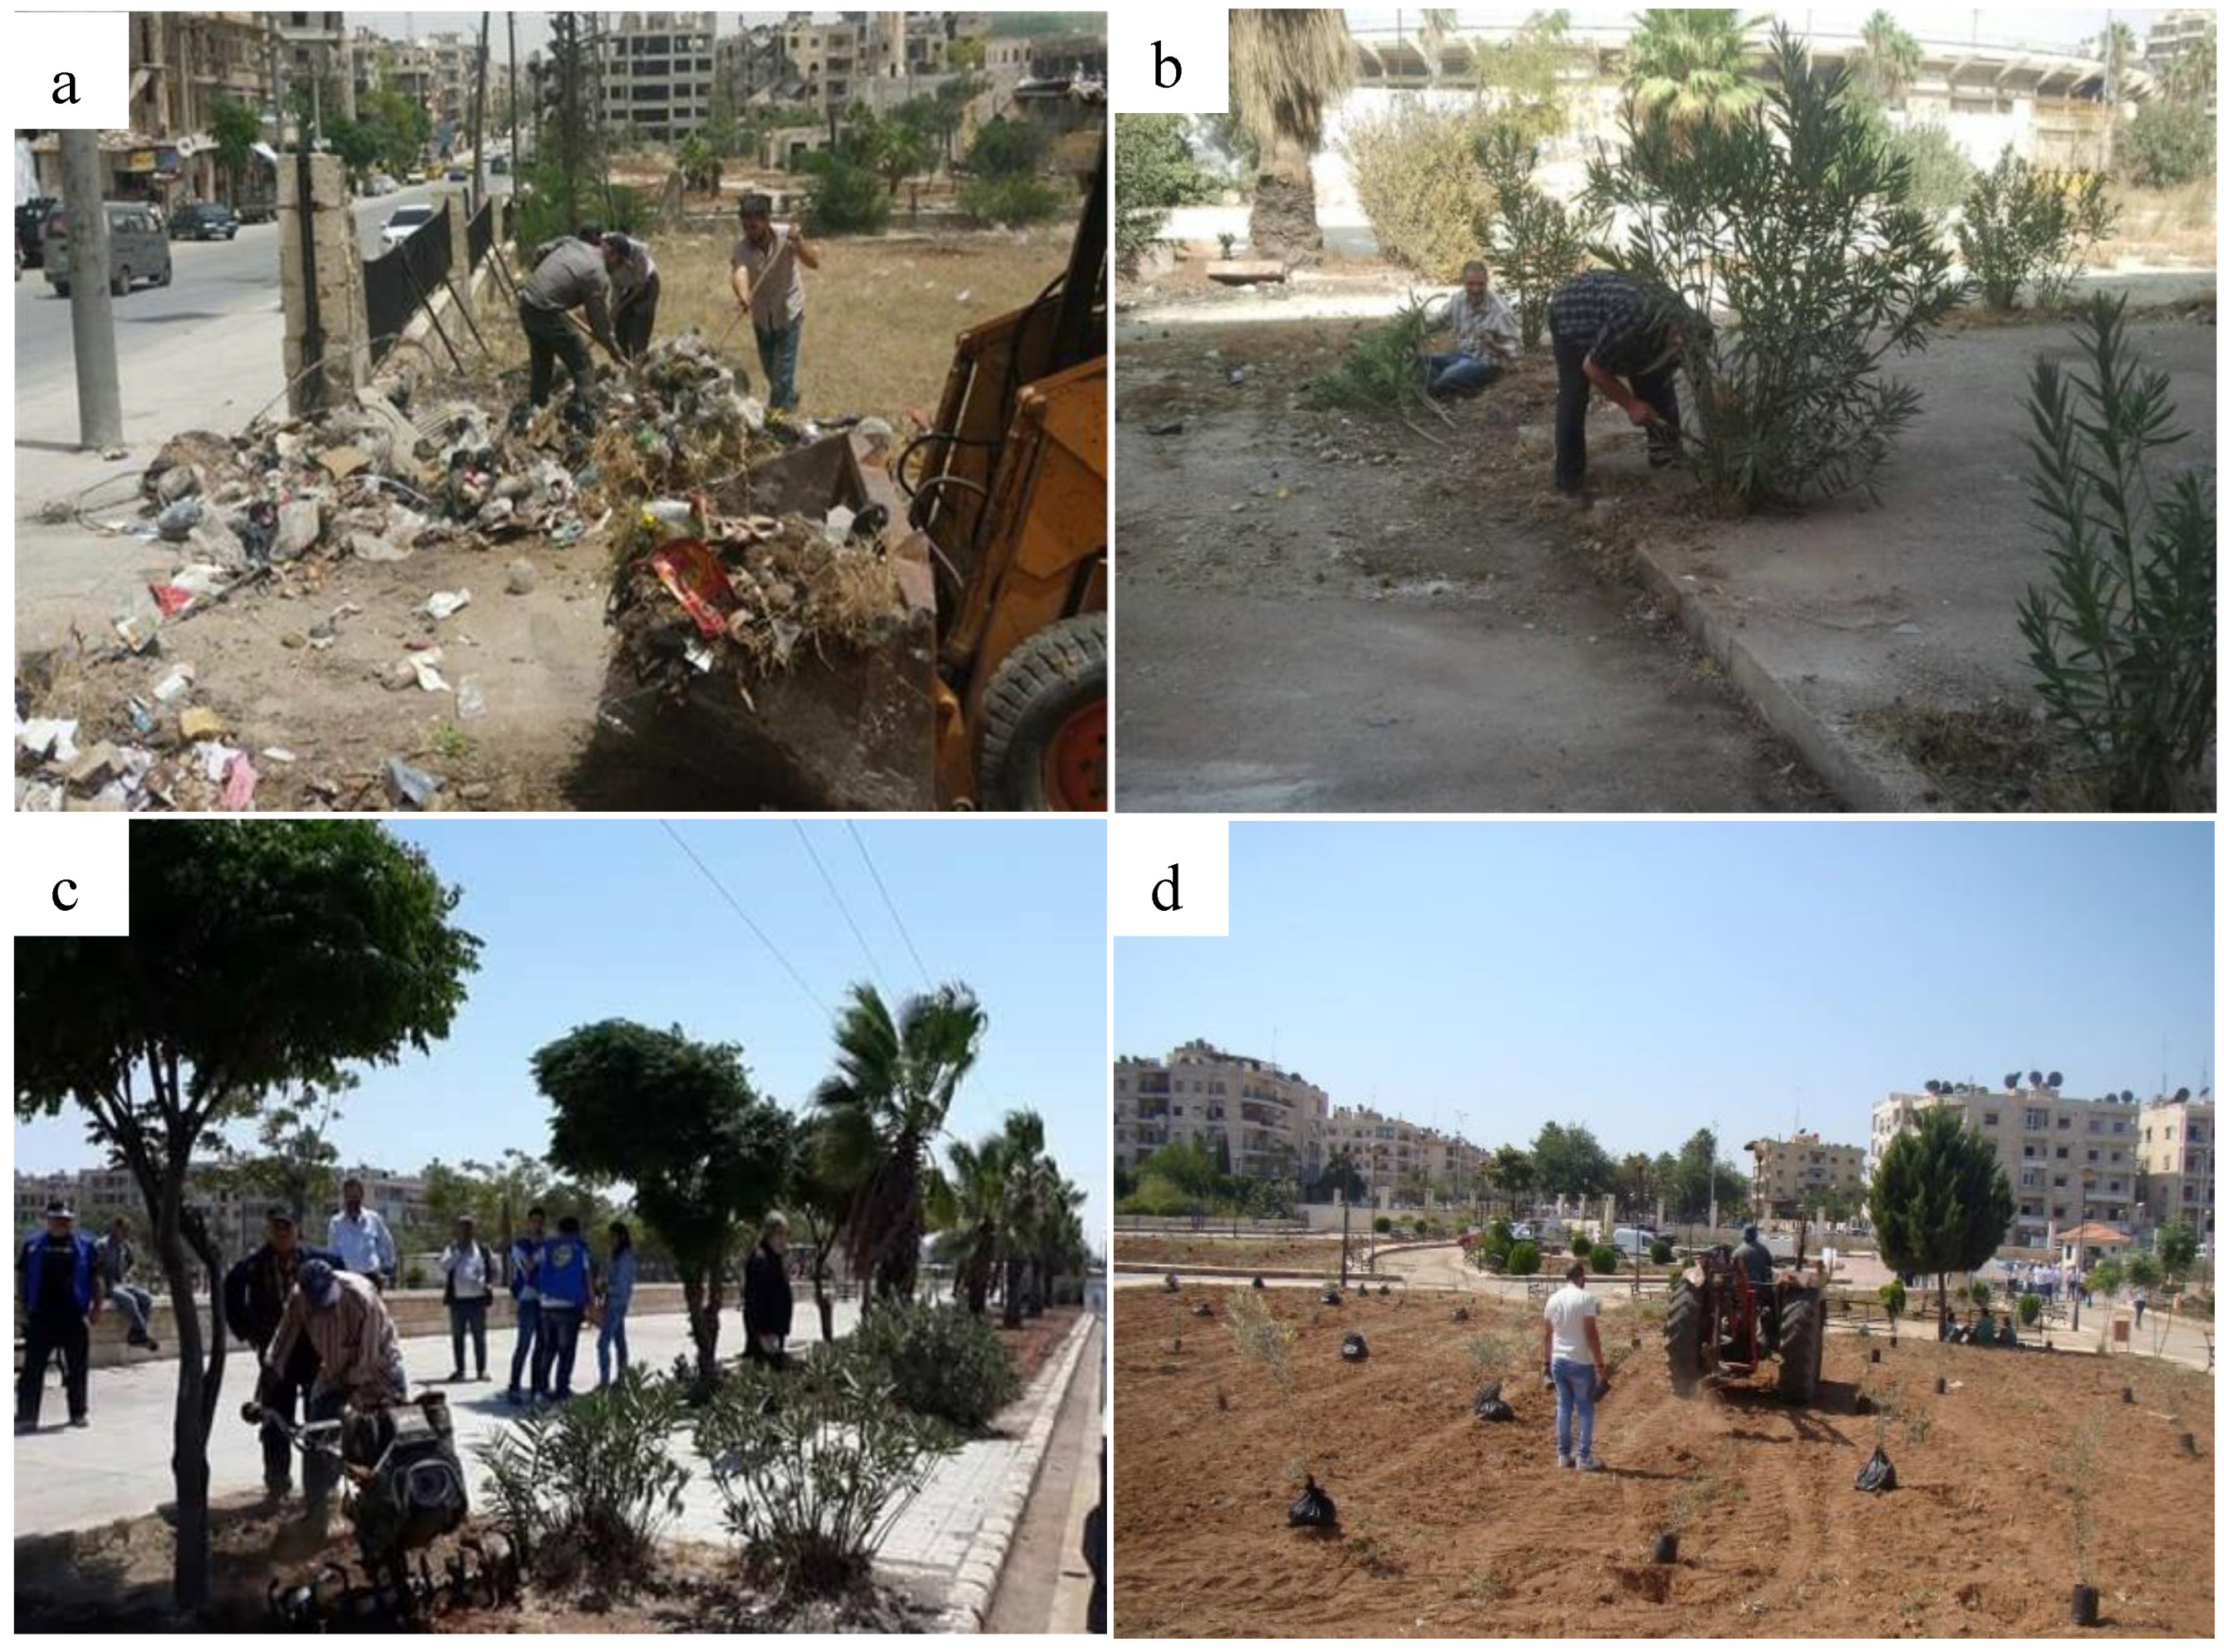
Figure 9.
(a–d) Aleppo residents started action to clean public parks after the war.


Table 1.
Classification of hierarchical levels of public green spaces.
| Parks | Description | Area (ha) | Max. Dist. From Home |
|---|---|---|---|
| Pocket/Residential park | A very small park which serves the immediately local population. Mostly scattered throughout the city. | <0.5 | <150 m |
| Neighbourhood park | A small park which serves the neighbourhood population. Mostly with playground facilities. | 0.5–1 | 200–500 m |
| Quarter park | A smaller park that serves more than one neighbourhood, but not the city as a whole. Equipped with more recreational facilities. | 1–4 | 500–1200 m |
| District park | A mid-sized park which serves the district as a whole. It provides a range of facilities, such as sport and recreation for various groups of people. | 4–10 | 1200–2500 m |
| City park | A large park which serves as the major recreation- and sport-facility-provider within a city and for its suburbs. | >10 | >3500 m |
| Urban forest | A large area within the boundaries of the city covered by forest serving as recreational space. | >10 | >3500 m |
| Roadway green (small) | Small green space alongside roadways serving as recreational space. | 0.2–5 | <750 m |
| Roadway green (large) | Large green space alongside roadways serving as recreational space. | >5 | 1000–1500 m |
Table 2.
Population and Socioeconomic characteristics in Aleppo 2008.
| Socio-Economic | Number of Neighbourhoods | Area | Population | ||||
|---|---|---|---|---|---|---|---|
| Classes | Number | % | km2 | % | Population | % | Population Density (persons/km2) |
| High | 15 | 15.2 | 22.8 | 28.5 | 192,899 | 8.1 | 8448 |
| Middle | 30 | 30.3 | 15.2 | 18.9 | 425,910 | 18 | 28,079 |
| Low | 54 | 54.5 | 42.1 | 52.6 | 1,751,613 | 73.9 | 41,605 |
| Sum | 99 | 100 | 80.1 | 100 | 2,370,422 | 100 | 29,592 |
© 2018 by the authors. Licensee MDPI, Basel, Switzerland. This article is an open access article distributed under the terms and conditions of the Creative Commons Attribution (CC BY) license (http://creativecommons.org/licenses/by/4.0/).
Share and Cite
MDPI and ACS Style
Almohamad, H.; Knaack, A.L.; Habib, B.M. Assessing Spatial Equity and Accessibility of Public Green Spaces in Aleppo City, Syria. Forests 2018, 9, 706. https://0-doi-org.brum.beds.ac.uk/10.3390/f9110706
AMA Style
Almohamad H, Knaack AL, Habib BM. Assessing Spatial Equity and Accessibility of Public Green Spaces in Aleppo City, Syria. Forests. 2018; 9(11):706. https://0-doi-org.brum.beds.ac.uk/10.3390/f9110706
Chicago/Turabian StyleAlmohamad, Hussein, Anna Lisa Knaack, and Badriah Mohammed Habib. 2018. "Assessing Spatial Equity and Accessibility of Public Green Spaces in Aleppo City, Syria" Forests 9, no. 11: 706. https://0-doi-org.brum.beds.ac.uk/10.3390/f9110706
Note that from the first issue of 2016, this journal uses article numbers instead of page numbers. See further details here.