Article

High Morphological Differentiation in Crown Architecture Contrasts with Low Population Genetic Structure of German Norway Spruce Stands

1
Department of Forest Genetics and Forest Tree Breeding, Büsgen-Institute, Faculty of Forest Sciences and Forest Ecology, University of Göttingen, 37077 Göttingen, Germany
2
Department of Forest Genetic Resources, Northwest German Forest Research Institute (NW-FVA), 34346 Hann. Münden, Germany
3
Service and Competence Centre of Thüringen Forst, 99867 Gotha, Germany
4
Department of Ecosystem Science and Management, Texas A&M University, College Station, TX 77840, USA
5
Laboratory of population genetics, Vavilov Institute of General Genetics, Russian Academy of Sciences, 119991 Moscow, Russia
6
Genome Research and Education Centre, Siberian Federal University, 660036 Krasnoyarsk, Russia
*
Author to whom correspondence should be addressed.
Submission received: 21 November 2018 / Revised: 28 November 2018 / Accepted: 30 November 2018 / Published: 4 December 2018
(This article belongs to the Section Forest Ecology and Management)

Abstract

:
High elevation sites in the low mountain ranges in Germany are naturally covered by Norway spruce (Picea abies (Karst.) L.) stands. Historically, large scale anthropogenic range expansion starting in the mid to late 18th century had a huge impact on the forest composition throughout Germany. Utilisation and exploitation often led to artificial regeneration, mostly carried out using seeds from allochthonous provenances. Usually, autochthonous (natural) high elevation Norway spruce trees have narrow crown phenotypes, whereas lowland trees have broader crowns. Narrow crown phenotypes are likely the result of adaptation to heavy snow loads combined with high wind speeds. In the present study, neighbouring stand pairs of putative autochthonous and allochthonous origin with contrasting phenotypes in high elevation sites were investigated with 200 samples each. These stands are located in the Ore Mountains, the Thuringian Forest, and the Harz Mountains. Additionally, a relict population with the typical narrow high elevation phenotypes was sampled in Thuringia, known as “Schlossbergfichte”. The objective of the study was to quantify supposedly adaptive phenotypic differences in crown architecture and the genetic differentiation of 11 putatively neutral nuclear microsatellite markers (i.e., simple sequence repeats (nSSRs)). The high differentiation of morphological traits (PST = 0.952–0.989) between the neighbouring autochthonous and allochthonous stands of similar age contrasts with the very low neutral genetic differentiation (FST = 0.002–0.007; G″ST = 0.002–0.030), suggesting that directional selection at adaptive gene loci was involved in phenotypic differentiation. Comparing the regions, a small isolation by distance effect for the Harz Mountains was detected, suggesting landscape resistance restricting gene flow. Finally, the differentiation of the very old autochthonous (up to 250 years) stand “Schlossbergfichte” with typical high elevation phenotypes could cohere with the sampling of a relict genepool.

1. Introduction

Genetic variation of neutral genetic markers across the distribution range of Norway spruce (Picea abies (Karst.) L.) is very high, but genetic differentiation is usually relatively low [1,2] and contrasts with the high phenotypic differentiation of crown architecture between low and high elevation varieties [3,4,5]. Autochthonous (natural) high elevation stands are characterised by narrow crowned individuals as a result of potential adaptation to heavy snow loads, while in allochthonous stands relatively recently planted in the same region, broad crown shapes are prevailing. High differentiation of phenotypic traits between neighbouring stands in the same environment, but low differentiation at randomly selected selectively neutral markers, would suggest directional selection on genes related to these phenotypic traits [6], which are crown architecture traits in our study.
Norway spruce is one of the economically most important tree species in Germany and has been widely planted since the late 18th century [7]. However, some autochthonous stands are still present in the low mountain ranges at higher elevations. One of these rare stands is located in Thuringia known as “Schlossbergfichte”. This stand is characterised by very old native trees (up to 250 years) with typical narrow crown phenotypes, whereas trees of neighbouring allochthonous stands mostly show the broad low elevation phenotypes.
Before extensive translocation of seeding material occurred [8], variation in crown phenotypes and typical narrow crown phenotypes were described in natural spruce stands from northern latitudes [9,10]. Crown characteristics are crucial for the resistance to snow breakage and high wind speeds [11]. Hence, trees with a narrow crown shape are considered to be more adapted to climatic conditions in high elevations or regions with high snow loads [7,12,13,14]. This assumption is also supported by the finding of higher frequencies of narrow crowned trees in areas with a high snow break hazard [15]. In addition, association of crown architecture with temperature, altitude, and precipitation had previously been reported [4,7,13]. Moreover, trees with high elevation phenotypes showed a higher frost hardiness than low elevation phenotypes, while both “morphotypes” had sufficient frost tolerance to prevent late frost damage [16].
Sylvén [17] was one of the first who suggested that variation in crown shapes is heritable. The occurrence of neighbouring autochthonous and allochthonous stands with different crown shapes is a further indication of the heritability of crown shapes. Kiellander [18] suggested heritability of crown architecture based on a crossing experiment made in 1942 in Sweden. Common garden studies have also revealed that damages caused by snow loads were less frequent in trees representing provenances from higher altitudes than in those from lower altitudes [19]. In addition, decreasing susceptibility to late and early frost events, a lower height to diameter ratio (slenderness), probable resulting in the reported increased resistance to mechanical damages by snow, a reduced growth rate, and shorter and thicker needles are reported for higher altitude provenances [20]. However, direct measurements on crown architecture in common garden experiments and heritability estimates are missing. In a formal way, inheritance of crown architecture was only assessed for the pendulous variety of Norway spruce (Picea abies f. pendula). Segregation ratios in open pollinated progenies suggested that it is controlled by a single or by a few dominant genes [21] and linked to an RAPD (random amplified polymorphic DNA) marker [22].
Even though genetic differentiation across the species range is low, historical migration patterns can be reconstructed using neutral genetic markers and other evidence, such as pollen data. Pollen data suggest that the first larger populations in the Holocene occurred within present day Germany in the Alps around 8000–9000 years ago [23]. Macrofossils and pollen data give evidence for several potential refugia during the last glacial maximum, some of which had no contribution to the recolonization history, such as the Massif Central (France) or the Moldavian lowlands refugia [24]. Concurrently, different refugia are proposed as a source of re-immigration, as P. abies can be divided in two main (Baltico Nordic and Alpine Central Europe) and one minor (Carpathian) domains [2,25,26,27,28,29]. Combined analysis from mtDNA (mitochondrial DNA) and pollen data reveal a more detailed view that suggest at least seven refugia from which recolonization occurred [30]. Despite this distinction, the level of inter-population differentiation at nuclear markers remains relatively low, even on larger geographical scales of several hundred kilometres, which is likely caused by high rates of pollen mediated gene flow [31,32,33,34].
Genetic and morphological analyses of neighbouring Norway spruce populations, which are morphologically differentiated in their crown architecture at the same altitudinal level, are rare. The study by Greger [35] is the only example for an investigation of a possible link between crown morphology and genetic variation. More common are studies comparing stands or individuals along altitudinal transects without any specific information on crown architecture. Results from different sources showed no consistent pattern of genetic variation between low and high elevation stands. For example, Maghuly et al. [36] found a higher genetic diversity in high elevation type populations than in allochthonous middle and low elevation populations, at nuclear simple sequence repeats (nSSRs) and mitochondrial markers. The authors further found higher expected heterozygosity in older stands than in younger stands, at nSSRs. However, other studies found either no relationship between altitude and diversity [32] or the highest diversity in populations from intermediate elevations [37].
For the first time, neighbouring high elevation type and low elevation type stands in the same high elevation environment are analysed for crown phenotypes and genetic markers to estimate both neutral and potentially adaptive genetic variation. These stands are located in the low mountain range in Germany, in the regions of the Thuringian Forest, the Ore Mountains, and the Harz Mountains.
Our objectives were to quantify phenotypic differences in crown architecture and genetic differentiation of nSSR markers between these neighbouring populations.
We tested the following hypotheses:
(1) There is large phenotypic differentiation (PST) among the investigated stands.
(2) All stands show a high genetic variation, but only low genetic differentiation based on neutral SSR markers.
(3) Signatures of selection for crown types can be detected by contrasting phenotypic and genetic differentiation (PST >> FST).
Our results are discussed regarding the human influence on genetic structures and the phenotypic variation of P. abies.

2. Materials and Methods

2.1. Study Sites and Sampling

A total of 1325 adult trees were sampled in seven stands growing in altitudes from 770 m to 1060 m above sea level (a.s.l.). Selected stands are located in the low mountain ranges of the Thuringian Forest, the Ore Mountains (Saxony), and the Harz Mountains (Lower-Saxony/Saxony-Anhalt), all being part of the Central German Uplands (Figure S1a–d). In each region, two neighbouring Norway spruce stands were sampled—one consisting of trees with narrow crowned mountain spruce phenotypes of autochthonous origin (high elevation type, HE) and another consisting of trees with lowland phenotypes with typical broad crowns of allochthonous origin (low elevation type, LE). In each stand, terminal branches from 200 individual adult trees were collected between June and August 2016. We sampled all upper layer trees, starting from one edge of the stand, until 200 samples were collected. In addition, as a typical high elevation narrow crowned spruce stand, the relict population, “Schlossbergfichte”, near Oberhof, Thuringia, was included with 75 individuals representing nearly the complete stock of old adult trees in this stand. All stands are growing under similar climatic conditions, such as mean temperature, length of the vegetation period, snow cover days, and wind speed (Table 1.) The names for low and high elevation type stands are abbreviated as LE and HE, respectively, with Thy, Sa, and H in the name indicating Thuringian Forest, Ore mountains (Saxony), and Harz, respectively.

2.2. Phenotypic Assessment

During the collection of needle material, visual assessment of each tree for crown architectural characteristics was carried out. The spectrum of possible trait expressions was subdivided in three categories, representing the high elevation (mountainous), intermediate, and low elevation (lowland) phenotypes (Table 2). A schematic visualisation of the traits based on a previous study [5] can be found in Figure S2. Additional crown breakage and the occurrence of forking was noted. Breakage of the main stem was noted irrespective of the number of breakage points. Forking was diagnosed when more than one secondary stem replaced the lost apical shoot.

2.3. Marker Analysis

All individuals were genotyped at 7 random genomic SSRs (gSSRs) and 4 expressed sequenced tag SSRs (EST-SSRs) (Table 3). Additional information on potential gene functions of the EST-SSRs is provided in Table 4. A total of 46 unlabelled primer pairs were tested for amplification, including SSRs developed specifically for Picea abies and SSRs adapted from other Picea species [47,48,49,50,51,52,53,54]. Further requirements for marker selection were the absence of null alleles in earlier studies [55,56] and the known location in different linkage groups of P. abies [25,57,58]. Eleven primer pairs that generated single-locus and polymorphic products were finally selected for the population analysis.

2.4. DNA Extraction

From each sample tree approximately 50 mg fresh needle tissue was cut into small pieces, frozen in liquid nitrogen, and ground in a MM300 ball mill (Retsch, Haan, Germany) for 2 min at 30 Hz. For the extraction of total DNA, we used the DNeasyTM 96 Plant Kit (Qiagen, Hilden, Germany) according to the manufacturer’s protocol with the minor modification of adding 5 mL of 26% polyphenylpyrovat solution to the 90.5 mL lysis buffer. Initial DNA concentration was measured using a NanoDropTM 2000 spectrophotometer (Thermo Fisher Scientific, Madison, SD, USA).
All PCR reactions were performed in a 14 μL total volume, containing 1 μL of 1:10 diluted DNA (ca. 20 ng). The PCR mix contained 1× reaction buffer B (Solis BioDyne, Tartu, Estonia), 2.68 mM MgCl2, 178.57 μM for each dNTP, and one unit of HOT FIREPol® (Solis BioDyne, Tartu, Estonia) Taq polymerase. Each forward and reverse primer was added in a concentration given in Table S1.
The reaction started with an initial incubation for 15 min at 95 °C, 10 touch-down cycles of denaturation at 94 °C, followed by annealing at 60 °C (Δ−1°C) and extension at 72 °C each for 1 min, 25 cycles at 94 °C, 50 °C, and 72 °C with each temperature level kept for 1 min, and final extension at 72 °C for 20 min. All reactions were run in a Biometra TProfessional Basic thermocycler (Analytic Jena AG, Jena, Germany). SSR fragments were separated on an ABITM 3130xl Genetic Analyzer (Applied Biosystems, Foster City, CA, USA) with the size standard GeneScanTM 500 ROXTM as a reference (Applied Biosystems, Foster City, CA, USA). Peak calling was done in the GeneMapperTM v 4.1 software (Applied Biosystems, Foster City, CA, USA).

2.5. Phenotypic Variation

To assess differentiation and structuring of phenotypic traits and to compare the results with the genetic data, we used the QST parameter and multivariate analyses, as follows.
The commonly used genetic differentiation measure, GST, has its analogy in QST to characterize the among population genetic variance exhibited by quantitative traits [60]. In case the among population additive genetic component of variance is unknown, QST can be estimated based on the phenotypic data. This estimate of phenotypic differentiation among populations (PST) is reliant on the scaling parameters, c (the proportion of total variance explained by the additive effect) and h2 (narrow sense heritability) [61,62]. Usually, no prior knowledge of c/h2 exists, and since this ratio can also vary across population pairs, robustness of the estimated PST on this ratio should be evaluated [62]. We calculated PST on the phenotypic data and evaluated its robustness with the Pstat-package (version 1.2) [63] in R (version 3.5.1) [64].
In addition, we used discriminant analysis (DA) of principal components (PCs) to analyse the phenotypic dataset. In contrast to principal component analysis (PCA), where the PCs are optimised for the maximal represented total variance, DAPC (discriminate analysis of principal components) maximises the between group variance while minimizing within group variance [65]. To choose the number of retained PCs, we ran a stratified cross-validation step with 5000 replications, and the number of used discriminant functions (DFs) was fixed to 2, as these always had much higher eigenvalues (EVs) than the remaining DFs. Two PCs were chosen as these had the lowest mean squared error, the highest number of correctly assigned individuals of the subsample, and explained 58.1% of the variance. To test for significance of group separation, a multivariate analysis of variance (MANOVA) on the retained PCs was performed, where the independent variables, contrary to DA, are the population groups. Finally, a classical PCA and a spatial principal component analysis (sPCA) [66] that optimizes the product of the variance and the spatial autocorrelation were calculated.

2.6. Genetic Variation—SSR Analyses

Allele binning was done using a custom R [64] script. Histograms of raw peak size data per locus were plotted with fine scale breakpoints and the binning limits of each allele per locus were manually defined. Then, we double checked the allele sizing further, and, if necessary, corrected allele sizes to make them consistent and reliable.
The Hardy-Weinberg equilibrium (HWE) was tested using the exact test proposed by Engels [67] and implemented in the R package “HWxtest” (version 1.1.7) [68].
Linkage disequilibrium (LD) was assessed as the standardized index of association, r ¯ d [69], in a pairwise loci comparison for each stand. Occurrence of significance of the LD values in each stand was evaluated by 10,000 permutations using the R package “poppr” (version 2.8.1) [70].
Null allele frequencies were estimated by the expectation maximisation (EM) algorithm [71] in the joint maximum likelihood (ML) estimation implementation in genepop [72]. Additionally, the ML method in ML-Nullfreq [73] was used. Averaging these results should improve the estimate and applying a frequency threshold of ≥5% for reporting can further reduce false positives [74]. Nevertheless, the occurrence of null alleles does not hinder the usage of affected markers, as conclusions drawn from assignment analyses or FST based estimates are unlikely to be influenced by the presence of null alleles [75].
Expected (He) and observed (Ho) heterozygosity, fixation index (FIS), and its p-values were calculated using Arlequin 3.5.2.2 [76]. Pairwise FST and standardized G″ST, and corresponding p-values based on 10,000 permutations, were calculated using GenAlEx 6.5 [77]. The mean number of alleles per locus (A), the mean allelic richness based on rarefaction (Ar), and the number of private allelic states within populations were calculated using the “hierfstat” (version 0.04-22) [78] and “poppr” [70] R-packages. To test for differences in diversity between stands, regions, and between high and low elevation type stands, linear mixed models accounting for differences in diversity between loci based on the rarefied allelic richness were calculated with the R-package “lme4” (version 1.1-18-1) [79]. The model included the rarefied allelic richness as a response variable, stand or region as a fixed effect, and locus as a random effect.
Being located in expressed genes, some EST-SSRs may reflect imprints of selection [80,81], which could be inferred from population genetic analysis when their variation and differentiation significantly deviate from those that are expected under neutrality (a so called FST outlier test). Hence, we checked potential deviation from neutrality for all SSRs using the FST outlier tests implemented in the Lositan (version 1.6) [82], Arlequin 3.5.2.2 [76] and BayeScan 2.1 [83] software. We used the recommended workflow in Lositan by first estimating the neutral FST value (~0.004) using the random gSSRs, and then rerunning the analysis, including the EST-SSRs, with the stepwise mutation model and 50,000 replications. In Arlequin, 50,000 simulations of 100 demes per group were run with the finite island model also based on FST. The default parameters were used to run the Markov chain Monte Carlo simulations implemented in BayeScan 2.1.
Hierarchical analysis of molecular variance (AMOVA) [84] was performed in Arlequin 3.5.2.2 [76] to partition variance between regions, stands, and stand types. The hierarchical structure of the dataset was described as the region in which the stands grow, the population/stand itself, and the single individuals. Alternatively, the stand classification as an HE or LE stand was used as the highest hierarchical level to compare if this grouping explains more variation than the grouping by regions. The within and between group variance was tested for significance using 5000 permutations.
To study the relatedness of the populations, in the light of hypothetical gene flow, we applied the approach of Sundqvist et al. [85] that projects the populations on a relative migration network. This method estimates the direction and rate of migration based on either GST [86], D [87,88] or NmAlcala [89]. We used GST, as it was shown to perform best in most scenarios [78], and further tested for significant directional migration by 10,000 permutations in the “diveRsity”—R-package (version 1.9.90) [90].
To study the structuring of individuals at the SSR markers accounting for spatial autocorrelation, we used sPCA [66] that optimizes the product of the variance and the spatial autocorrelation measured by Moran’s I [91,92]. Global or local structures with positive or negative autocorrelation are indicated by positive or negative EVs. To test whether global or local structures are significantly different from the null hypothesis of alleles being randomly distributed across space, the estimated distribution of the EVs via Monte Carlo (MC) sampling was used. This test has higher statistical power than the previously suggested method based on R2 [66,93]. We calculated the sPCA and the test procedure as implemented in the R-package “adegenet” (version 2.1.1) [94,95]. Spatial distribution was described by spatial weights that are directly proportional to the inverse of the geographic distance matrix. The EV-MC test for local and global structure was run 103 times. As with the phenotypic traits we calculated the alternatives, PCA and DAPC.
Finally, to determine if the sampled individuals can be grouped into different genetic clusters (K), the program, STRUCTURE (Version 2.3.4) [96], was used. Admixture proportions were estimated for K = 1 to 12 clusters with 15 replicated iterations for each cluster run with 10,000 burn-in and 50,000 following iterations. The ancestry model considering admixed individuals was chosen. Sample location information was considered as prior knowledge for the model [97], and both the degree of admixture alpha and the parameter lambda for the distribution of allele frequencies were set to be estimated from the data. Further, the model considered allele frequencies between populations to be correlated, as the result may give more accurate estimates of admixture, produces more detailed clustering results, and gives the same results as independent models in the absence of correlation [98,99]. Averaging different runs for the same K was done in CLUMPAK [100] with the default settings. The runs for each K were summarised according to a similarity score. If different runs passed a certain threshold value in the comparison, they were included in the major mode, which is a summary of the majority of the runs, or in one or more minor modes depending on their similarity. Methods based on DeltaK [101], the log-likelihood probability of K (L(K)), and the corresponding first and second order change of L(K) [96] were calculated with STRUCTURE HARVESTER (Version 0.6.94) [102] to help choose the most likely number of clusters (K).

3. Results

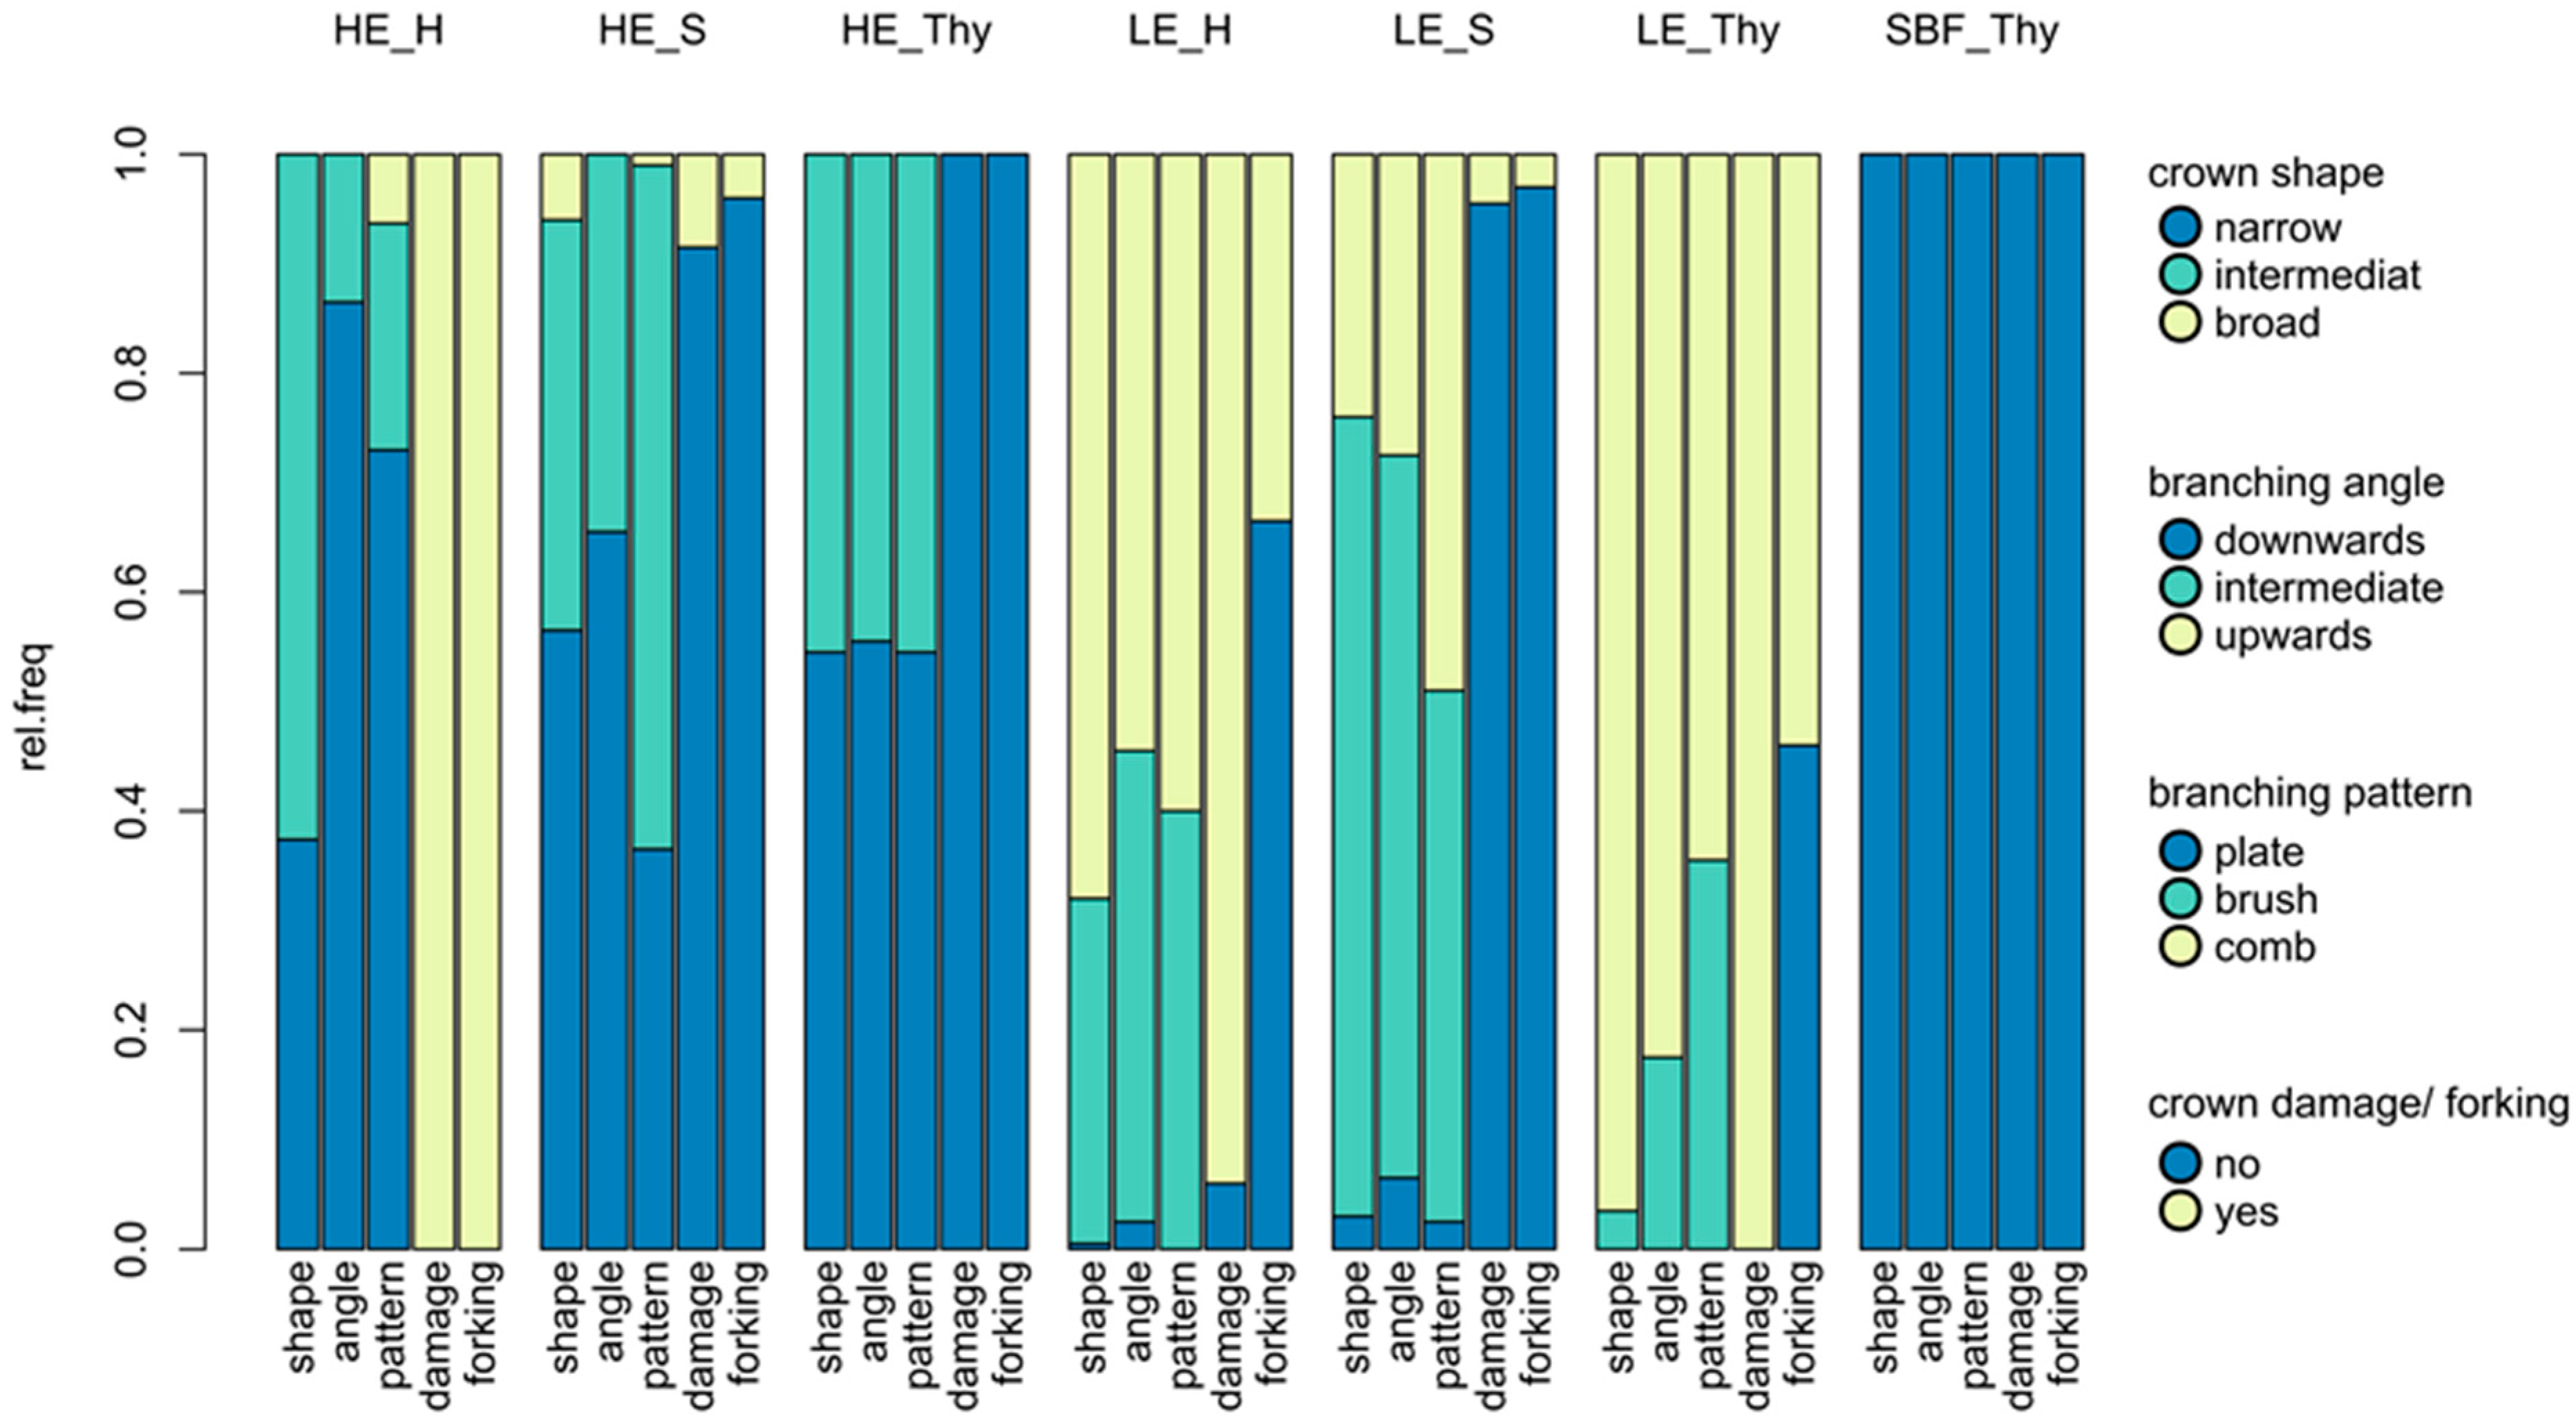
3.1. Phenotypic Differentiation between Low and High Elevation Types

A clear difference in the phenotypic traits was found between the selected high and low elevation type stands. The overall crown shape, angle, and the branching pattern were strongly correlated (Pearson correlation 0.64–0.76), due to the dependence of the crown appearance on the angle and pattern of the branches. The relative frequencies of the traits in each stand are presented in Figure 1 (values are also provided in Table S2). In the relict stand, “Schlossbergfichte” from Thuringia, all trees expressed the high elevation type according to the assessed traits, and no crown damage and forking were detected. High elevation characteristics were also found in more than half of the observed trees (~55%) in the potential autochthonous HE-Thy stand, and no damage and forking occurred. The neighbouring low elevation type stand was predominantly comprised of lowland crown shapes (96.5%), with all trees being damaged. In the Harz Mountains, the high elevation type stand was comprised of 37% narrow crowned individuals, but most trees showed the intermediate (62.6%) crown shape. Varying branching patterns were also observed there, and all trees were damaged. In the neighbouring low elevation type stand, most trees had broad (68%) or intermediate (31.5%) crowns, and most of them showed crown breakage (94%). In Saxony, the trees in the high elevation type stand were of narrow crowned (56.5%) or intermediate (37.5%) character, with few trees showing signs of breakage (8.5%). Intermediate crown type (73%) and branching pattern (66%) were typical for the low elevation type stand in Saxony, where also only a few trees were damaged (4.5%). Accordingly, the divergence for phenotypic traits (PST) showed high between group variance compared to within group variance, as the crown shape traits as well as the damage traits had PST values of 0.952 to 0.989 for c/h2 = 1. Only a weak effect of varying ratios of c/h2 could be noted. Even for low c/h2 ≥ 0.1 ratios, the PST value was above or near 0.95 (forking occurrence and branching pattern with PST values of 0.945 and 0.936 for c/h2 = 0.1, Figure S3).
The DAPC results demonstrated that the between group structure of the phenotypic data was mainly explained by the first two DFs as reflected in the corresponding high EVs. The low elevation type stands were separated from the high elevation type stands with the LE_S stand as a transition, as its 95% distribution density on the first DF overlaps with all, but the SBF_Thy and HE_H distributions. The second DF mostly separated the HE_H and LE_S stands from the other stands (Figure 2). Further testing the prior group membership of the individuals by MANOVA yielded a high significance (p ≈ 0). Post hoc Tukey’s HSD (honestly significant difference) tests of ANOVAs on each DF with Bonferroni correction showed a significant regional separation and significant differentiation between stand types. Similar phenotypic stand pairs (non-significant differences) for the first DF were SBF/HE_Thy and HE_Thy/HE_S, and SBF/HE_H, HE_Thy/HE_S and LE Thy/LE_S for the second DF.
PCA gave a similar data distribution on the first two axes; nevertheless, separation of the single stands was weaker compared to DAPC, as the DA step is not performed. Centres for each stand distribution were more separated in DAPC as well as the 95% inertia ellipses. In the sPCA, strong and highly significant global structure (positive autocorrelation), attributed to inter- and intra-regional separation of the stands with contrasting phenotypes, was observed. No local structure (negative autocorrelation) could be detected, which reflects the absence of clustering of similar types within the stands.
Summarizing these results, it is evident that a high phenotypic differentiation between high and low elevation type stands was observed at the assessed traits.

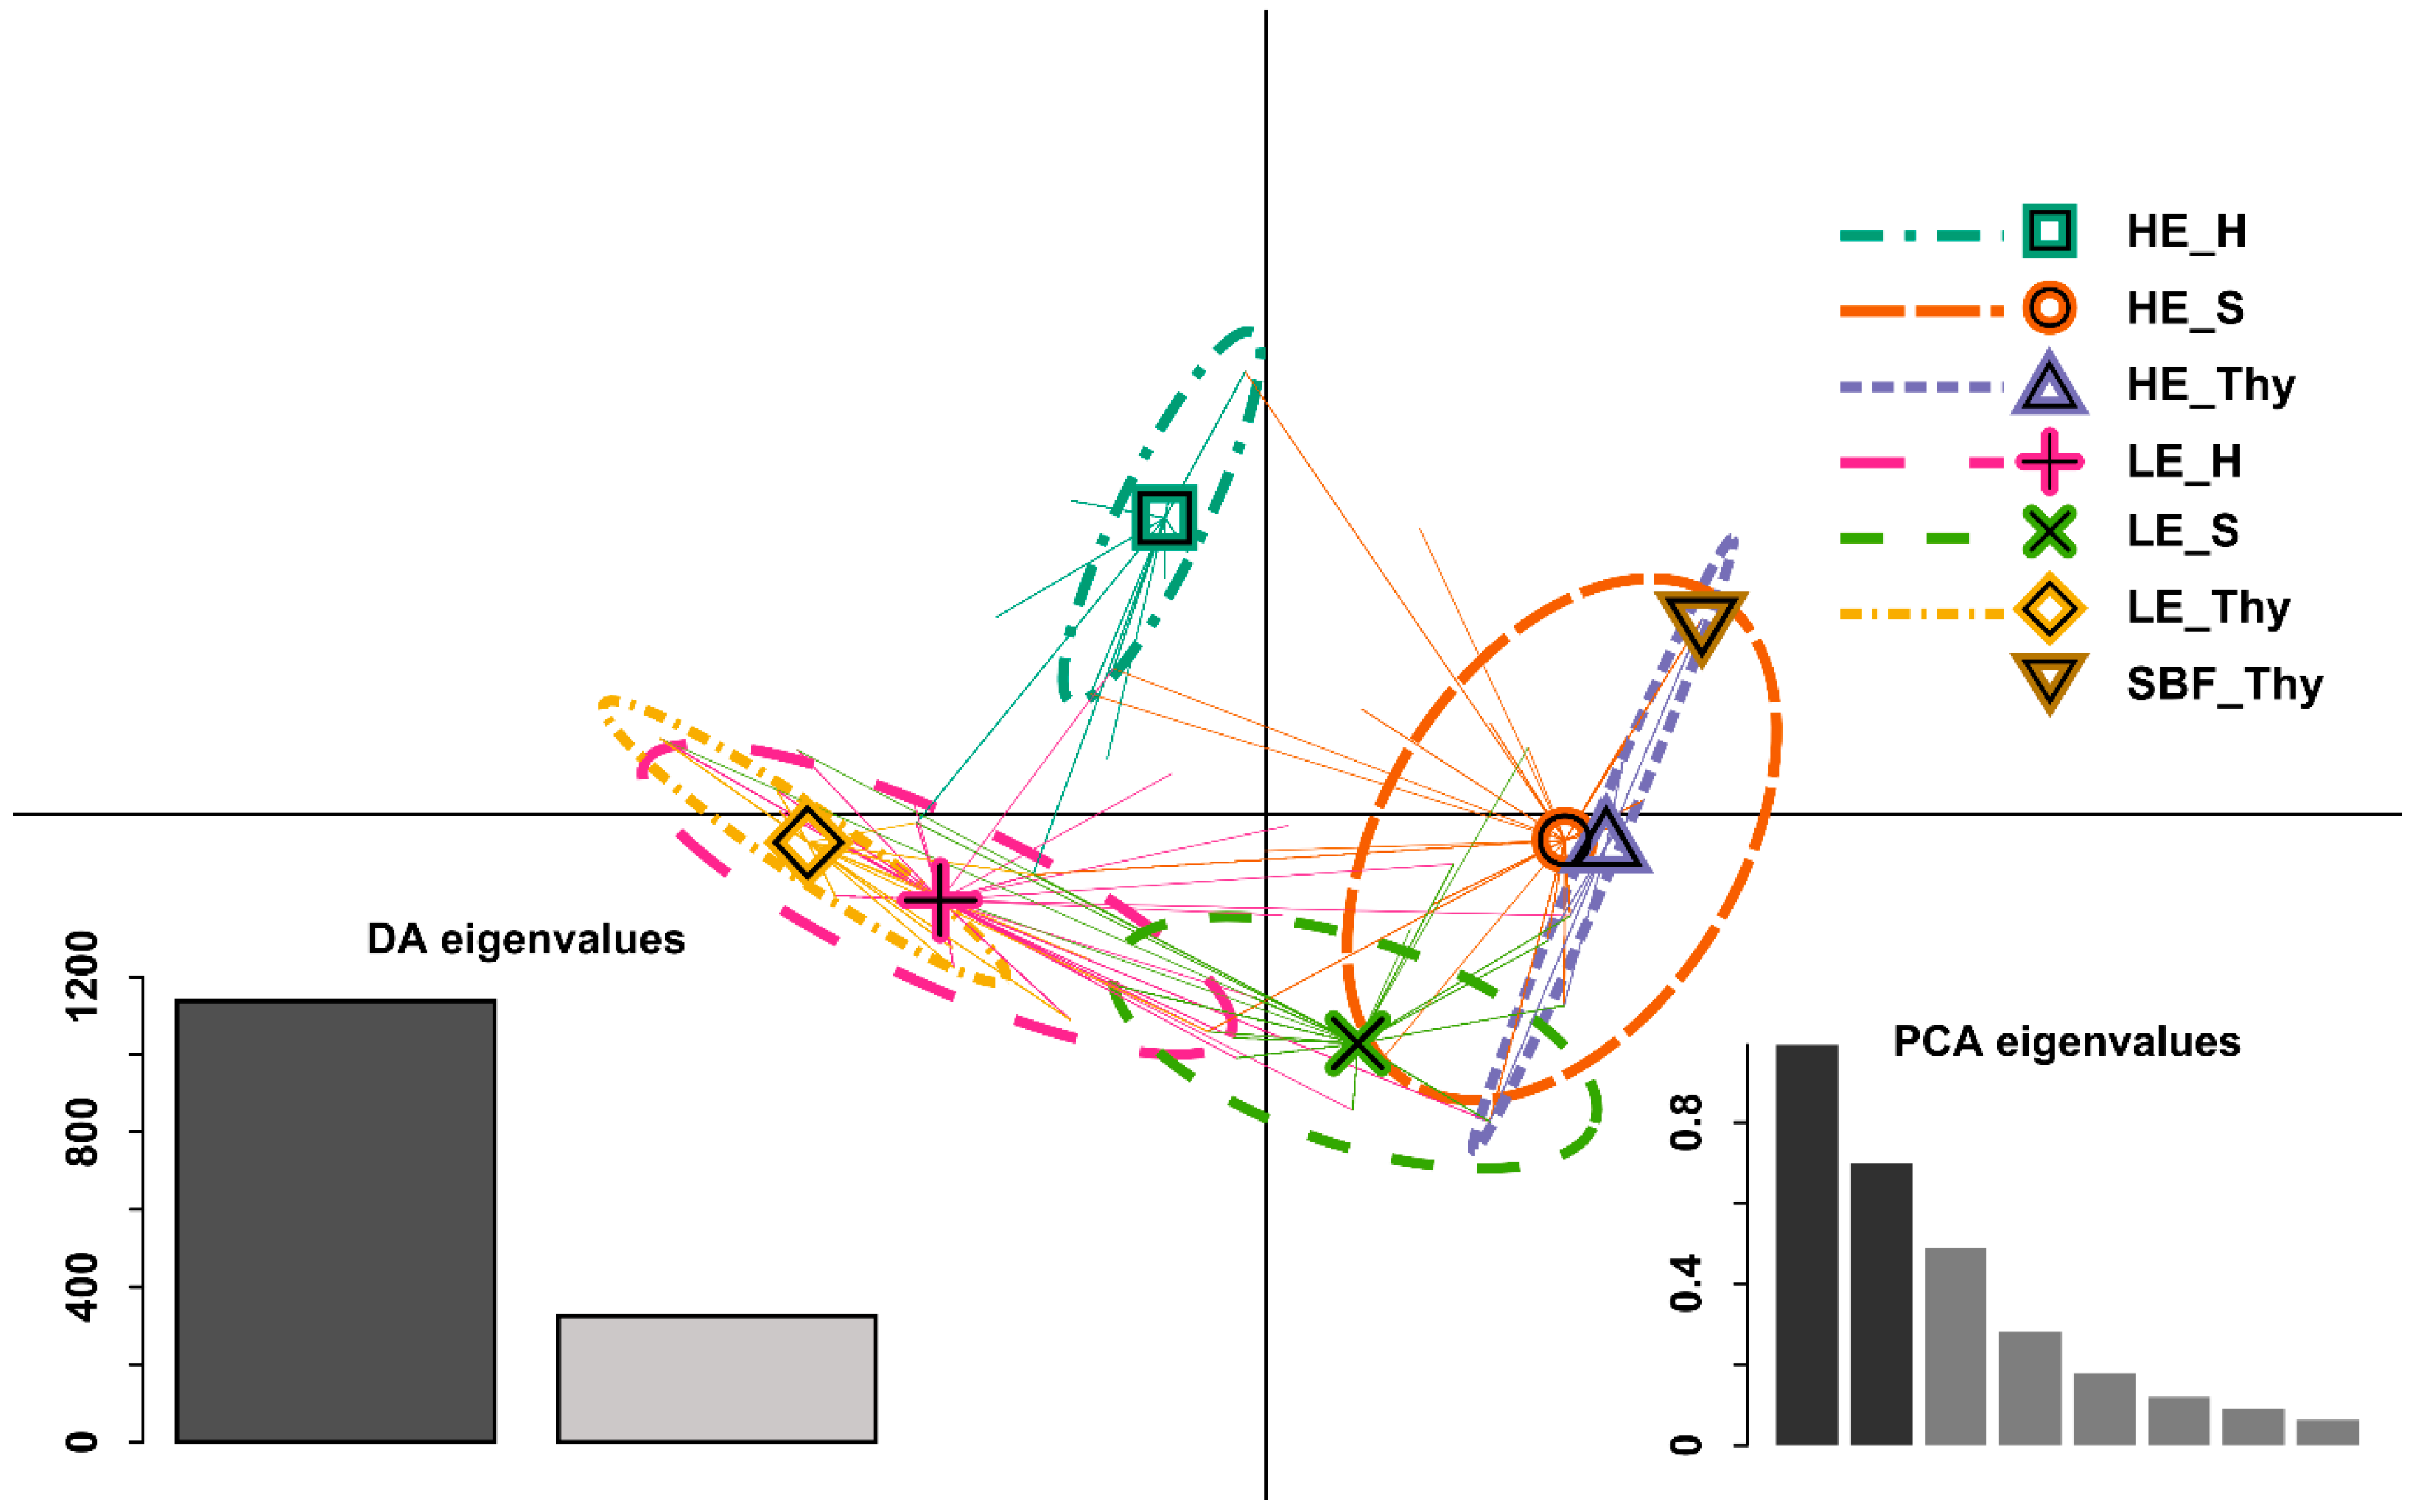
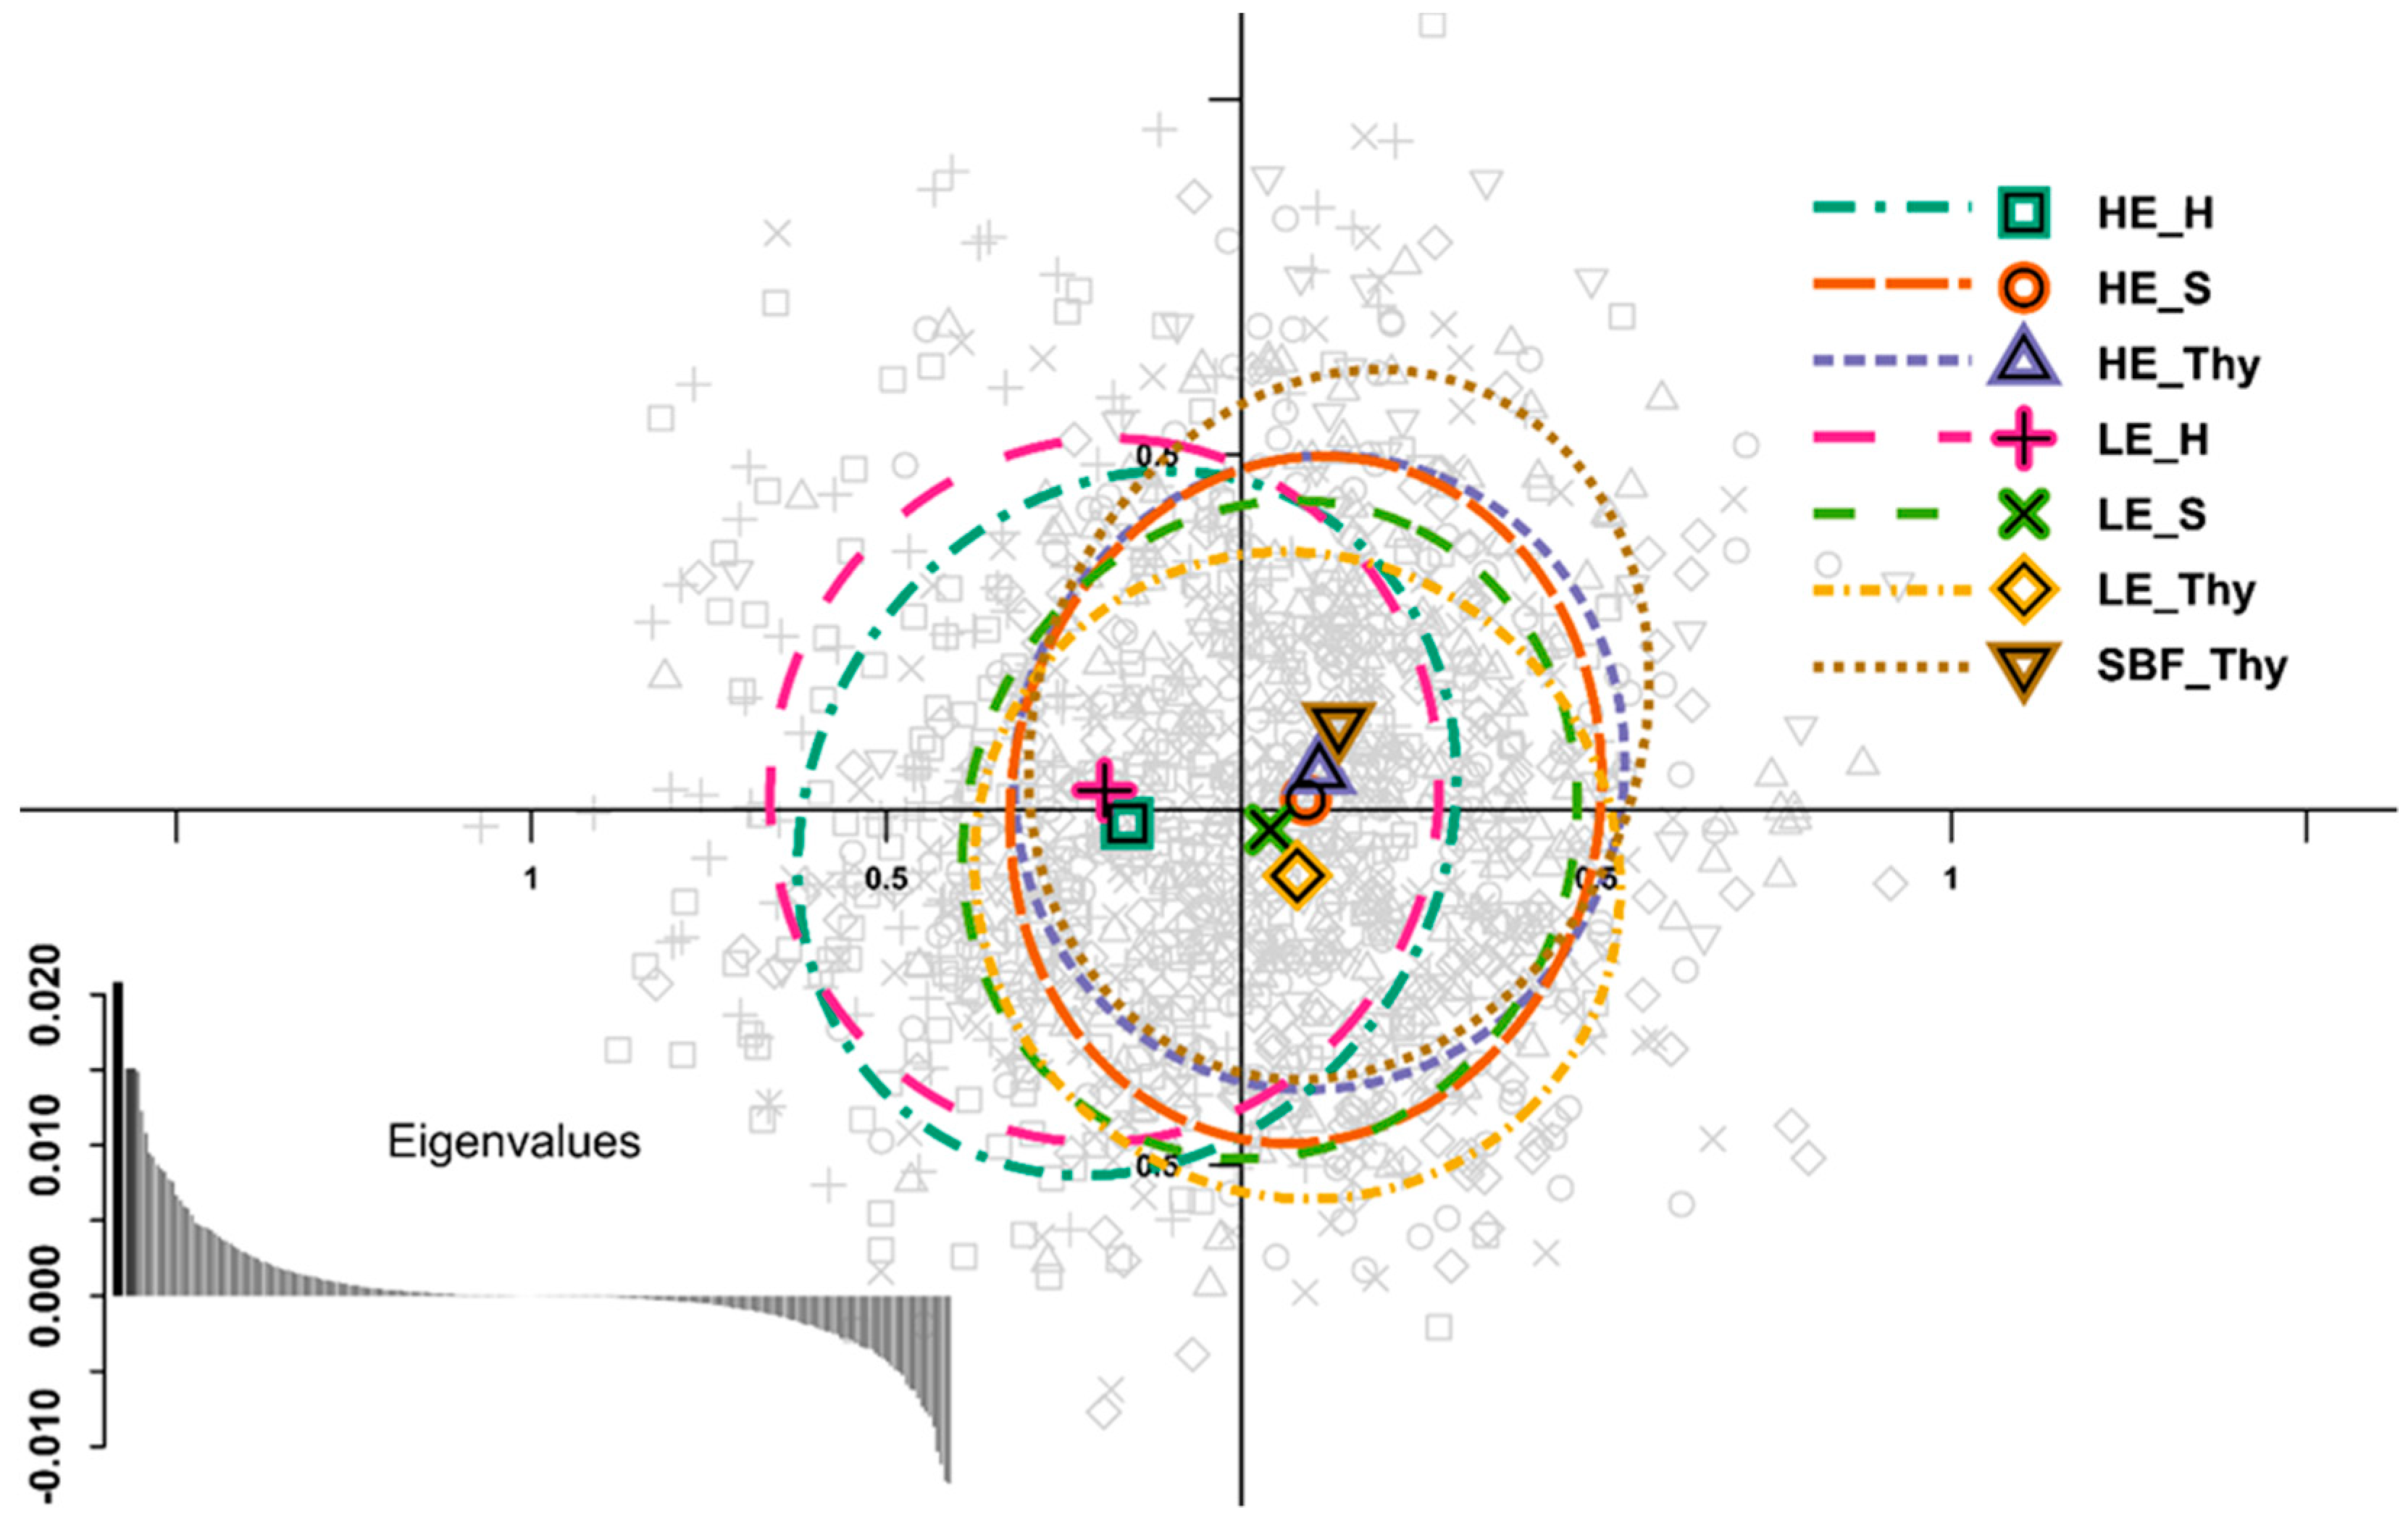
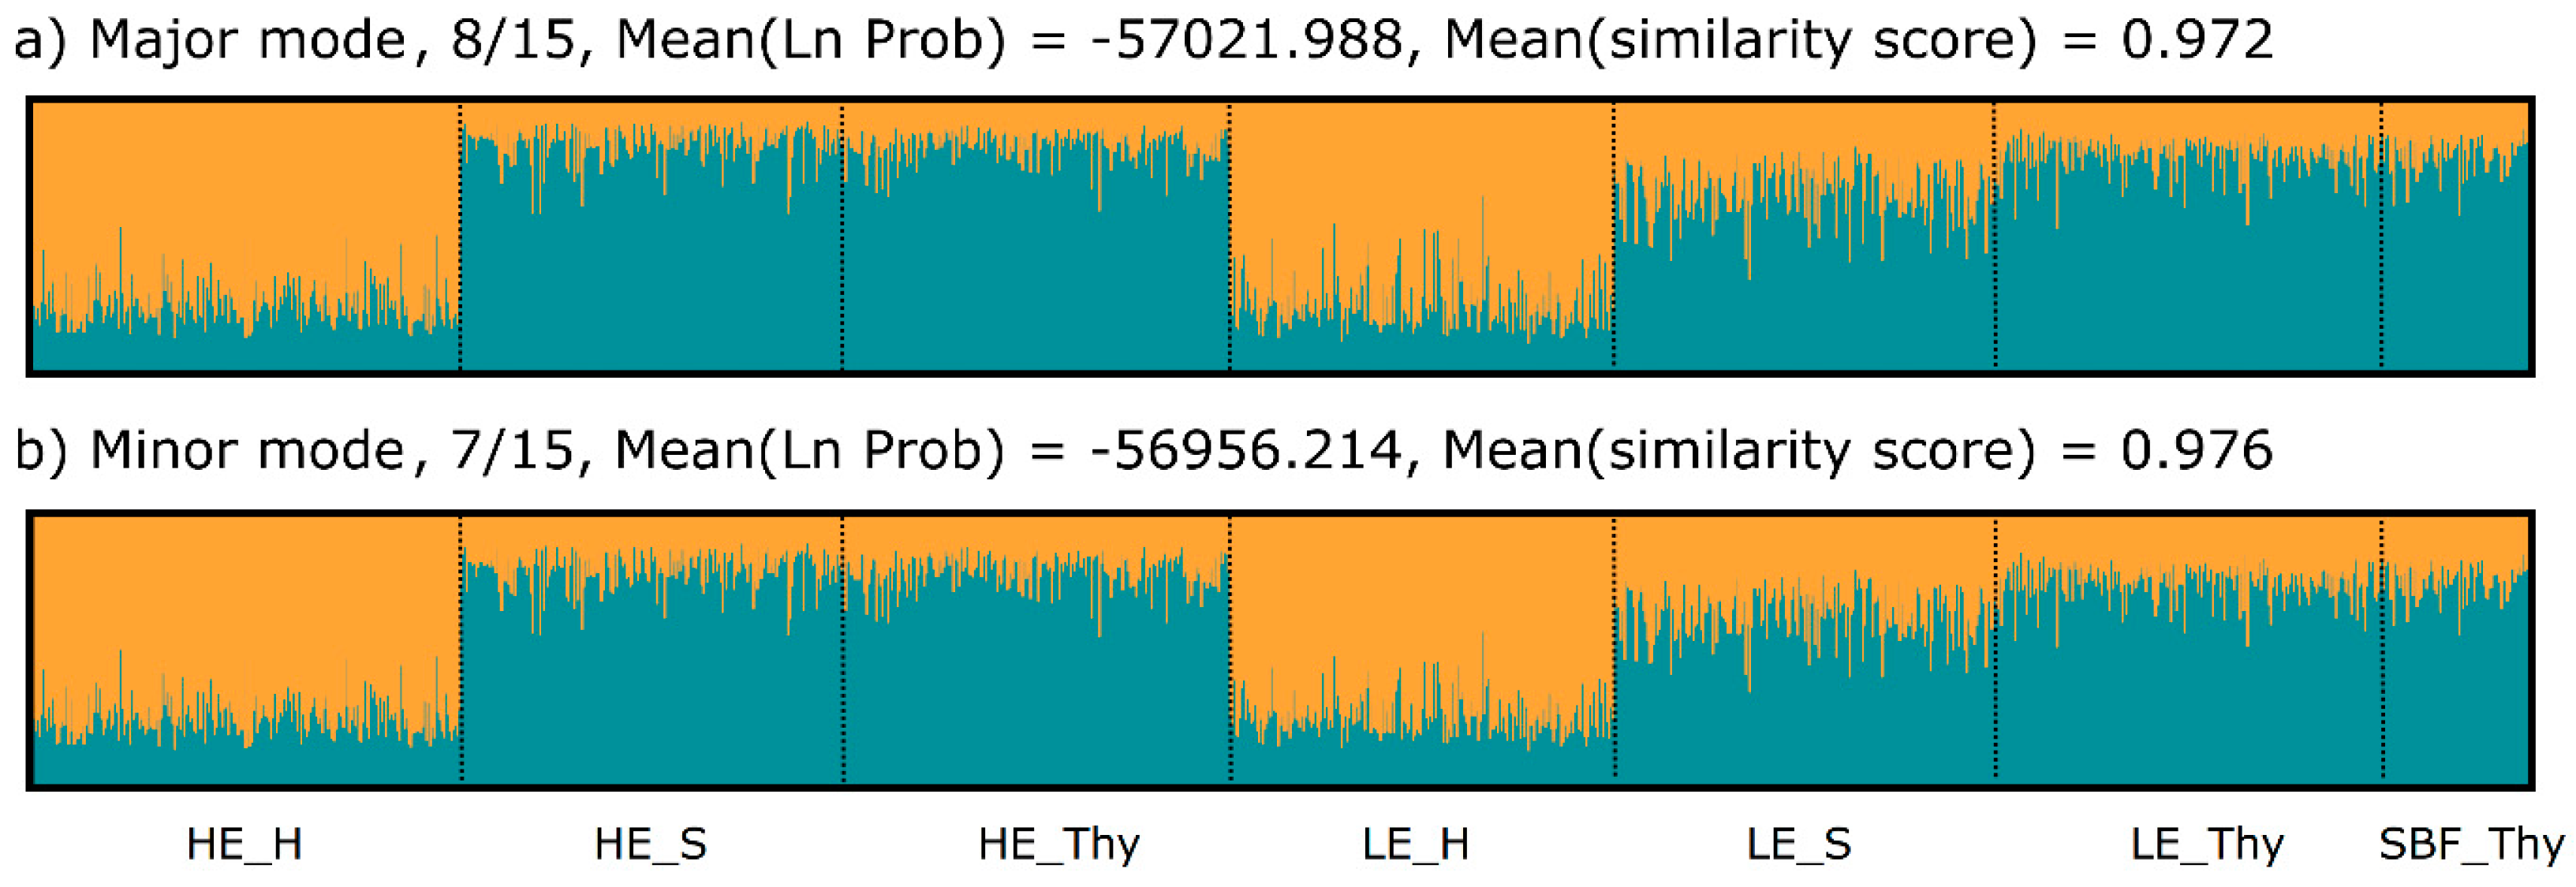
3.2. Genetic Variation and Differentiation

No significant differences in diversity between populations, regions, and stand-types could be detected based on linear mixed effect models accounting for between loci diversity divergences. In total, nine (EATC1E03 & WS00016-O09) to 41 (PaGB8(a)) alleles per locus were observed and only small differences in Ho, He, and Ar values between the stands were found. The Ho values ranged from 0.630 to 0.702, with the highest values found in the HE_Thy (0.702) and SBF_Thy (0.692) stands and lowest in the LE_H (0.640) and HE_S (0.630) stands. Values for He were similar among stands (0.730–0.757). The rarefied allelic richness of the relict stand, SBF_Thy, had a value (16.79) comparable to the other stands (16.13–16.83). HE_H (16.51) had a slightly reduced Ar compared to other HE stands (16.51–16.83). All, but one, FIS values (0.041 in LE_H) were significant, ranging from 0.079 in SBF_Thy to 0.142 in HE_H (Table 5).
Deviation from HWE was found for five loci in several stands. Locus WS0016-O09 deviated in all stands from HWE; PaGB3 in all stands, but SBF_Thy; and EATCG05 in all stands, but LE_Thy and SBF_Thy. Furthermore, in four stands, significant deviation from HWE was found for the loci, SpAGC1 and SpAGG3, and in one or two stands for EATC1B2, EATC1E03 and SpAG2, WS0011-K13, respectively (Figure S4). The estimated null allele frequencies per locus were mostly similar in the stands, thus underestimation of genetic diversities as result of null alleles would have affected all stands equally. Loci surpassing null allele frequencies of 5% were mostly in the more complex trinucleotide repeats, namely the EATC-loci. The dinucleotide repeats expressed much lower values, which narrowly exceeded 5% (Figure S5). Insignificant LD values ( r ¯ d ) were found for all locus pairs based on a population-wise permutation test (Figure S6). In the applied FST outlier tests, none of the loci exceeded the lower or upper 95% confidence intervals of the simulation run in Lositan (Figure S7). In accordance, no directional selection was found by the Bayesian method used as well.
The high phenotypic differences between high and low elevation type populations were not reflected in genetic variation patterns at the screened supposedly selectively neutral SSRs. Overall, very low genetic differentiation was observed among populations and regions based on the 11 supposedly neutral polymorphic SSR markers. Partitioning the molecular variance indicated that variation was mostly attributed to variability of the individuals within the population (99.60% with 90.21% within the individuals and 9.39% among individuals within the populations). Only 0.16% of the variance was attributed to among population variation within regions, and 0.24% was distributed between geographical regions. Except for the variance among regions, all levels were highly significant (p < 0.0002) (Table S3). When the phenotypic stand characteristics (high or low elevation type stand) were used as the highest hierarchical level no variance was partitioned between these two groups (the actual value of the percentage of variation among groups was −0.09%; negative values may arise due to the geometric distance calculation and can be considered zero).
In the pairwise comparison, low and non-significant FST values of 0.002 were observed between low elevation type stands in Saxony and Thuringia and in both stands in the Harz Mountains. Slightly higher values of 0.004–0.007 were detected between the relict stand, “Schlossbergfichte”, and all, but the HE_Thy stand (Table S4). Comparison based on G″ST gave a similar picture. Further, most of the highest G″ST values (0.016–0.030) were found between the Harz Mountains and both the Thuringia and Saxony regions (Table S5). Compared to the estimated PST values, even for low c/h2 ratios, all FST and G″ST values were much lower. Estimated rates of gene flow between stands of the same region were relatively high (0.58–1), but lower between the SBF_Thy stand and the other Thuringian stands. For this stand, a high gene flow rate (0.5) was only estimated towards the HE_Thy stand. Between Saxon and Thuringian stands (also excluding SBF), high bidirectional gene flow rates were estimated. As a general pattern across all regions, a stronger gene flow from the low to the high elevation type stand was detected. Nevertheless, no significant asymmetric migration was found at α = 0.05 (Figure S8).
We applied sPCA, which also incorporated spatial relationships among stands, to detect potential genetic structuring correlated with the geographic distances. The results revealed weak isolation by distance between the Harz Mountains and the two other regions. In Figure 3, the distribution of data along the first two sPCA-axes shows separation of the Harz population along the first axis, whereas the second axis slightly separates the HE_Thy and SBF_Thy populations from the LE_Thy population. The MC-EV test showed the absence of local structuring, but revealed highly significant global structuring (p < 0.001), which is attributed to the first four PCs. When only the between group variation is used, a DAPC analysis yields similar separation along the first DF as the sPCA, but a slightly stronger difference for SBF_Thy and HE_S stands. The regional differentiation was supported by MANOVA (p < 0.001), where the post hoc tests confirmed the regional separation of the Harz populations along the first axis. Weak geographical differentiation between Harz populations and the others was also confirmed by STRUCTURE. Evaluation of the cluster number, K, suggested two distinct clusters supported by delta K (Figure S9a). Summarizing all runs for K = 2 presented in Figure 4, individuals of the Harz populations formed one cluster, while individuals of all other populations were assigned to the second cluster, with a considerable amount of estimated admixture in all individuals. The analysis of the 15 runs in CLUMPAK [100] gave one major and one minor mode, which are very similar and consistent in their interpretation. Modes with a higher cluster number (especially K ≥ 6) showed higher admixture proportions of one cluster each in the HE_S, HE_Thy, and SBF population (Figure S10).

4. Discussion

Norway spruce is still one of the economically most important tree species for forestry in Europe, but the species’ range is assumed to decline due to the predicted climate change [103]. Forestry in Germany also heavily relies on Norway spruce [7], but the projected future area will be more limited to the low mountain ranges [104]. Thus, the sampled locations represent important regions of today’s and future spruce stands, also in terms of genetic variation of this species.

4.1. Autochthonous and Allochthonous Stands

Human impact strongly altered the composition of forests in Central Europe, especially in Germany [105,106], and may have had a strong impact on the neutral and adaptive genetic variation [107,108]. In Norway spruce, translocation and planting of non-local material started in the 18th century throughout Europe, also with the organised expansion of its natural range. In general, anthropogenic gene flow through extensive translocation of reproductive material had major effects on the genetic diversity of forest trees [8]. Hence, it is always difficult to identify autochthonous stands. In our study, we identified stands as autochthonous if there was no indication of stand establishment by artificial regeneration.
For example, in the population, “Schlossbergfichte”, the autochthonous character is concluded from its stand age, where the oldest trees are now up to 285 years old [44] and can therefore be considered relatively uninfluenced by the increasing forest practice and seed trading in the 18th century [8]. In case of the high elevation type stand in the Harz Mountains (estimated age of the oldest trees between 180 and 300 years [46,109]), reports indicate no utilisation and plantation near the tree line at Mount Brocken [35]. For the other high elevation type stands in Thuringia and Saxony, their age structure and management plans indicate their autochthonous character. Indications of the allochthonous origin of low elevation types are the even aged stand structure and the visibility of planting rows. With a complete inventory of stands, we also tried to minimise random sampling effects.

4.2. Phenotypic Differentiation

Our comparison of stand pairs of potentially autochthonous and allochthonous spruce stands, respectively, showed a high phenotypic differentiation between stands of autochthonous and allochthonous origin. The phenotypic differentiation can be interpreted as an adaptational mechanism that is genetically controlled, but not reflected by the supposedly neutral markers used in this study. The differentiation was revealed by both the high PST values (>0.9) and the stand separation in the DAPC analysis, with further confirmation by the significant MANOVA results. Comparison between the estimated PST and FST values at neutral loci can point to the natural selection of the phenotypical differences. As in the present case, with PST >> FST, directional selection is likely involved in the divergence at the trait level between different populations [6]. Also, comparing standardized G″ST to PST, this observation holds true. While the discussion on which measure to use is extensive (e.g., [87,110,111]), it is, in the reported case, likely irrelevant which particular measure of genetic differentiation is used, because either of them was much less than PST. In addition, as our estimated PST values remained high (>0.85) within the complete range of the c/h2 ratios examined, and PST >> FST or G″ST holds, the draw conclusions can be considered as very robust [62].
Morphological differences could also be due to phenotypic plasticity and epigenetic modifications. For instance, Gruber [5] assumed that the low elevation phenotype has a relative high plasticity and could resemble the high elevation phenotype under certain conditions. For example, tree allometry and subsequent change in tree morphology can arise from environmental factors, such as competition, density, and light availability. In Norway spruce, the length of the living crown, the length of the branches, and the crown width decreases, for example, with increasing stand density [112,113]. In this study, both the allochthonous stands and the autochthonous stands are dense, grow under uniform environmental conditions, and similar silvicultural treatments were applied. In addition, allochthonous Norway spruce stands were planted with about 10,000 plants/ha, and after decades, the allochthonous stands putatively adapted to low altitude conditions, especially in Thuringia and the Harz Mountains, still show a strong phenotypic differentiation from the natural high elevation type stands.
The expected lower frequencies or absence of crown damage in narrow crowned trees were confirmed in the Thuringian and Saxony stands, but not in the high elevation type stand of the Harz Mountains. This stand is located just below the natural tree-line at Mount Brocken with around 1100 m a.s.l. [114] and subjected to the highest average wind speeds and the most average snow cover days in this study, which may explain that even the narrow-crowned trees may not completely withstand these harsh conditions. Concordantly, under extreme high elevation site conditions in a Swiss provenance trial, a bushy growth was observed both in high and low elevation provenances. However, high elevation provenances still showed a better growth and less damage than low elevation provenances [20], indicating different local adaptations.
Hence, our results support the assumption that Norway spruce trees of natural origin in high elevation type stands have morphologically adapted to extreme weather conditions by alteration of crown architecture [12,13,115]. Moreover, these results are in agreement with the hypothesis that crown morphology is at least partially genetically controlled [12], as all stands or stand pairs were subjected to similar events of snow and wind (Table 1), but still showed considerable phenotypical differences. They cannot be explained only by epigenetics because provenances adapted to low altitudinal conditions maintained their lowland crown characteristics after plantation in the high elevation environment. In stands with both high and low elevation types, trees with different crown types were randomly distributed, suggesting that micro-environmental differences within the stand have a minor effect on crown architecture. In addition, provenance trials indicated genetic differences in frost resistance and different local adaptations of low and high elevation provenances. For example, several provenance trials showed genetic differences in growth and frost tolerance between high and low elevation provenances [19,20].
Environmental association studies revealed correlations of growth and frost tolerance traits and of environmental variables with genetic variation. For example, isoenzyme variation was correlated with latitudinal and elevation transects and with potentially adaptive traits (seed traits, growth, and bud burst) [116,117]. Also, SNPs in candidate genes were associated with bud set and growth cessation [118] and with environmental variables along altitudinal transects [31]. Furthermore, drought resistance [119] and susceptibility to fungal infection [120] are associated with certain SNPs.

4.3. Genetic Variation and Differentiation

Regarding levels of genetic variation in neighbouring low and high elevation type stands, we could not detect any differences in allelic richness or diversity. Such differences in diversity between natural and allochthonous stands were suggested by Gömöry [37] and Finkeldey and Ziehe [107]. Whereas, no consistent relationship of altitude and diversity between studies are reported. Comparing stands of Norway spruce growing in low elevations with high altitude stands, higher diversity was reported for the high-altitude [36,121] or intermediated populations [37], but also no correlation has been described [32], which is, correspondingly, our observation for neighboring stands of different origin.
The relatively weak genetic structure and differentiation contrasted with the morphological differentiation. However, both Harz populations, as well as the “Schlossbergfichte” population, were slightly differentiated from all other populations.
In general, as the genotyped SSR loci showed no sign of directional selection, these markers likely reflect neutral genetic variation patterns. It should, however, be noted that the relatively low number of loci used in our study could be insufficient to detect outliers. Our estimates of FST between the populations ranged from 0.002 to 0.007 (G″ST = 0.002–0.030) and are comparable to the overall very low differentiation found for nSSRs on similar or even greater geographical scales, such as for Austrian (FST = 0.0004–0.0035 [122]), Swedish (FST = 0.000–0.0206 [33]), Italian Alpine (FST = 0.00–0.04 [123]), and Scandinavian, Baltic, and Russian populations (FST = 0.087 [1]). These results of low differentiation among stands were mostly attributed to the high gene flow through pollen. Even between populations from putative different refugial lineages, and thus different gene pools, estimates remain low (FST = 0.12 based on isozymes [124]; FST = 0.0585 based on EST-SSRs [125]).
However, detailed assessment based on the pairwise FST, G″ST, and sPCA showed a differentiation of the Harz region and the “Schlossbergfichte” population from the other populations, even though differences were small and accounted for a very small fraction of the overall variation based on the AMOVA results. From the perspective of recolonization history, the regions in focus should belong to the same lineage from the Carpathian refugium, covering both the Harz and the Bohemian Massif [30]. Nevertheless, a more recent recolonization of the Harz Mountains than for the Bohemian Massif is presumed from pollen records [24]. This could suggest a still noticeable founder effect in the Harz typical for the found pattern. Historically, the Harz Mountains were a centre of forest reproductive material export [8]. Plantations within the region are more likely to be of local origin, and thus may have retained the broad spatial structure and the genetic similarity at neutral markers between LE and HE stands. In the mode (K = 2) of the Bayesian clustering analysis supported by delta K, we found one cluster to be comprised of the Harz stands and the second cluster comprising all stands from Saxony and Thuringia. These results are in agreement with a local origin of reproductive material in the low elevation stand in the Harz Mountains. The differentiation between the Harz and the other regions may also be attributable to their geographic isolation. A similar geographic pattern was also observed for Austrian high elevation populations [122,126] and is expected for more geographically scattered populations [125].
Genetic seperation of alpine/mountainous and lowland ecotypes growing in low and highland environments were recently reported in Czech populations [127]. Similarly, autochthonous mountainous spruce stands and allochthonous stands in the Vosges Mountains were distinguishable based on RAPD markers [128]. Such differentiation was not detected in our study. For the STRUCTURE output, choosing K based on delta K frequently leads to the result of K = 2 and further methods have to be considered [129] as presented in Figure S9. Based on these, a high number of K could not be ruled out, especially K = 5, 8 or even 11. Considering these modes with higher cluster numbers, a slight indication of separate ancient gene pools may be given by the admixture proportion of autochthonous populations.
Clear differentiation was, nonetheless, found between the relict population, “Schlossbergfichte”, and all other populations. This population is comprised of more than 280-year-old and younger adult trees (approximately 180), which originated from natural regeneration. As seed dispersal in spruce is limited compared to pollen dispersal [130], at least the maternal part is retained within the stand. Thus, the initial genetic composition of the typical Thuringian Forest high elevation provenance may have been retained in this remnant population through the oldest trees, and a temporal isolation effect could be the reason for the identified small genetic divergence to the other stands. The genetic divergence of the relict population was also reflected in the migration network, as the rates towards the “Schlossbergfichte” population were, overall, lower than between other stands, and only higher migration from this stand towards the HE_Thy population was found.
While we found a genetic separation of the “Schlossbergfichte” population with clear high elevation phenotypes from all other stands, other high elevation type stands were not differentiated from low elevation types stands, suggesting high rates of gene flow between HE and LE stands. Further, high and low elevation type stands in the Saxony and Thuringia regions were not distinguishable, and at least an origin of the allochthonous stand from within these regions can be assumed. Even though no significant directional migration was found, a strong influence of pollen mediated gene flow from the majority of allochthonous stands to the natural stands can be assumed. Over generations, this process can lead to lower genetic differentiation in general and specifically to a dilution of adaptive genetic variation.
Hence, we suggest that the partially unsuited morphological characteristics in the younger autochthonous stands reflect the influence of gene flow from introduced plant material. In our study, the oldest stand, SBF_Thy, showed pure high elevation ecotypes, whereas the younger autochthonous HE stands showed higher morphological variability with a mixture of intermediate, sometimes even low, and high elevation ecotypes. Thus, our results are related to the stand age and history. The older the stands, the smaller the anthropogenic influence should be [8,33], especially in terms of translocation of material and subsequent gene flow altering the frequency of genes coding for the high elevation morphological characteristics between allochthonous and autochthonous stands. Accordingly, the trees older than 250 years in the “Schlossbergfichte” stand should represent the original genepool of the local ecotype.

5. Conclusions

(1) High phenotypic variation contrasting with low genetic variation measured by the nSSR markers likely reflects different local adaptations. The autochthonous high elevation type stands are locally adapted in their crown architecture to the mountainous environment, whereas the allochthonous stands are adapted to their lowland origin prior to plantation of the material. The occurrence of high elevation and low elevation crown types in neighbouring stands, and the random distribution of trees with different crown types in mixed stands suggested that crown architecture is under strong genetic control. Common garden experiments are needed to derive heritability estimates for this trait.
(2) High and low elevation type stands were not differentiated at neutral markers. Candidate gene approaches or genome scans are needed to reveal adaptive genes associated with crown architecture.
(3) A weak geographic structure was detected based on the nSSR markers. However, the Harz region and the relict population showed a weak, but significant, differentiation from the remaining stands. Gene flow by pollen and seeds likely resulted in decreased phenotypic differentiation in younger autochthonous stands, while all trees in the relict population, “Schlossbergfichte”, were characterized by typical high elevation crown types.

Supplementary Materials

The following are available online at https://0-www-mdpi-com.brum.beds.ac.uk/1999-4907/9/12/752/s1, Table S1: Concentration (ci) of each forward and reverse primer in the multiplex reactions and single-plex, Table S2: Relative frequencies of assessed morphological traits in each stand corresponding, Table S3: Hierarchical AMOVA based on the regional and population membership of the individuals, Table S4: Paiwise FST values between population pairs with corresponding p-values, Table S5: Pairwise G″ST values between population pairs; Figure S1. Overview map (a) and map sections of the stand locations. Harz region (b) with the northern high elevation (HE) and southern low elevation (LE) stand. Thuringian forest (c) with the northern relict stand “Schlossbergfichte”, the southern LE stand and the more eastern HE stands. Ore mountains in Saxony (d) with the western HE stand and eastern LE stand. Longitudinal and latitudinal coordinates are given on the corresponding sides of each map. Maps generated with QGIS 2.18.15 [131] using geodata from www.openstreetmaps.org [132], Figure S2: Schematic presentation of the three main crown architectural types. From left to right, lowland combe type, intermediate brush type and narrow high elevation plate type. Top secondary branching pattern as cross-sectional view and bottom in side view (Figures modified and reproduced with permission from J.D. Sauerländer’s Verlag; Gruber, Allg. Forst-u. J.-Ztg, 160, published by J.D. Sauerländer’s Verlag, 1989 [5]), Figure S3: Relationship of phenotypic divergence in a trait across populations (PST) [60,61,62] over the ratio of the total variance explained by additive genetic effects across populations and the narrow sense heritability (c/h2), Figure S4: Corresponding p-value of the log likelihood ratio test on the deviation from HWE of each locus genotyped in each population sampled. Test statistic is based on either full enumeration or Monte Carlo sampling on the count tables depended on the number of tables to be observe (for details see [67,68]), Figure S5: Estimation of the null allele frequency at each locus in each population separately. Average of maximum likelihood estimation expectation maximisation [71] in genepop [72] and ML estimation in ML-Nullfreq [73]. Dashed line indicating the estimated 5% frequency, as it can be seen as a threshold value for reporting null alleles [74], Figure S6: Heatmaps displaying the standardizes index of association r ¯ d [69] for pairwise loci comparison for each stand separately. Low values are indicated in white, whereas higher values are indicated with increasing grey shades, Figure S7: Detection of outlier loci in LOSITAN [82] exploring the relationship between FST and He among populations by permutations. Black dashed lines indicate the upper 95% confidence limit, also highlighted by fine red hatching. Black dotted lines indicate the lower 95% confidence limit, highlighted by rougher yellow hatching, Figure S8: Directional relative migration network [85] based on GST [86] of potential allochthones and autochthones populations. The relative positions of the populations indicate relatedness from the perspective of hypothetical gene flow. Numbers and arrows indicate the direction and extent of gene flow (also underlined by arrow shading/thickness), Figure S9: Detection of the number of clusters K according to (a) DeltaK [101], the (b) log-likelihood probability of K (L(K)) and the corresponding (c) first and (d) second order change of L(K) [96] calculated in STRUCTURE HARVESTER [102], Figure S10: Major modes of cluster results from K 2 to 12 of STRUCTURE [96] analysis summarised in CLUMPAK [90]. For each K the major mode is given indication the number of runs and der mean similarity of the summarisation output as well as the mean ln probability of the mode. Individuals ordered by population membership as indicated at the bottom.

Author Contributions

Conceptualization: O.C., M.M, B.V., K.K., K.V.K., O.G. and L.L.; Methodology: O.C., M.M., B.V., O.G. and L.L.; Software: O.C.; Validation: O.C., M.M, B.V., K.V.K., O.G. and L.L.; Formal Analysis: O.C.; Investigation: O.C.; Resources, K.K. and A.M.H.; Data Curation: O.C.; Writing-Original Draft Preparation: O.C.; Writing-Review & Editing: O.C., M.M, B.V., A.M.H., K.K., K.V.K., O.G. and L.L.; Visualization: O.C.; Supervision: O.G. and L.L.; Project Administration: O.G. and L.L.; Funding Acquisition: M.M., B.V., O.G. and L.L. (listed based on position in author list).

Funding

This research was funded by the German Federal Ministry of Food and Agriculture (BMEL) represented by the Fachagentur Nachwachsende Rohstoffe e. V. (FNR) grant number FKZ 22023814. The APC was funded by the Open Access Grant Program of the German Research Foundation (DFG) and the Open Access Publication Fund of the University of Göttingen.

Acknowledgments

The authors thank the Northwest German Forest Research Institute (NW-FVA) for providing the samples of the Brocken (Harz) population with special thanks to Serge Havel for preparation of the samples, Alexandra Dolynska, Christine Radler for assistance with lab work, Staatsbetrieb Sachsenforst, ThüringenForst, Niedersächsische Landesforsten and Forstliches Forschungs- und Kompetenzzentrum (FFK Gotha) for their assistance in stand selection. We also acknowledge four anonymous reviewers for their comments that considerably improved the manuscript.

Conflicts of Interest

The authors declare no conflict of interest. The funding sponsors had no role in the design of the study; in the collection, analyses, or interpretation of data; in the writing of the manuscript, and in the decision to publish the results.

References

  1. Tollefsrud, M.M.; Sønstebø, J.H.; Brochmann, C.; Johnsen, Ø.; Skrøppa, T.; Vendramin, G.G. Combined analysis of nuclear and mitochondrial markers provide new insight into the genetic structure of North European Picea abies. Heredity 2009, 102, 549–562. [Google Scholar] [CrossRef] [PubMed]
  2. Heuertz, M.; De Paoli, E.; Källman, T.; Larsson, H.; Jurman, I.; Morgante, M.; Lascoux, M.; Gyllenstrand, N. Multilocus patterns of nucleotide diversity, linkage disequilibrium and demographic history of Norway spruce (Picea abies (L.) Karst.). Genetics 2006, 174, 2095–2105. [Google Scholar] [CrossRef] [PubMed]
  3. Schmidt-Vogt, H. Studien zu morphologischen Variabilität der Fichte (Picea abies (L.) Karst.). Allg. Forst- u. J.-Ztg 1972, 142, 133–144. [Google Scholar]
  4. Priehäusser, G. Die Fichten-Variationen und -Kombinationen des Bayr. Waldes nach phänotypischen Merkmalen mit Bestimmungsschlüssel. Forstwiss. Cent. 1958, 77, 151–171. [Google Scholar] [CrossRef] [Green Version]
  5. Gruber, F. Phänotypen der Fichte (Picea abies (L.) Karst.) I. Verzweigungsphänotypen: Genotyp und Modifikation. Allg. Forst-u. J.-Ztg 1989, 160, 157–165. [Google Scholar]
  6. Merilä, J.; Crnokrak, P. Comparison of genetic differentaition at marker loci and quantitative traits. J. Evol. Biol. 2001, 14, 892–903. [Google Scholar] [CrossRef]
  7. Schmidt-Vogt, H. Taxonomie, verbreitung, morphologie, ökologie, waldgesellschaften. In Die Fichte—Ein Handbuch in Zwei Bänden; Parey: Hamburg, Berlin, Germany, 1977; p. 647. [Google Scholar]
  8. Jansen, S.; Konrad, H.; Geburek, T. The extent of historic translocation of Norway spruce forest reproductive material in Europe. Ann. For. Sci. 2017, 74, 56. [Google Scholar] [CrossRef]
  9. Beckstein, J.M. Forstbotanik oder vollständige Naturgeschichte der deutschen Holzgewächse und einiger Fremden: Zur Selbstbelehrung für Oberförster, Förster und Forstgehülfen; Henning: Gotha, Germany, 1810. [Google Scholar]
  10. Wahlenberg, G. Flora Lapponica. Available online: https://www.biodiversitylibrary.org/item/91422 (accessed on 23 May 2018).
  11. Nykänen, M.L.; Peltola, H.; Quine, C.; Kellomäki, S.; Broadgate, M. Factors affecting snow damage of trees with particular reference to European conditions. Silv. Fenn. 1997, 31, 193–213. [Google Scholar] [CrossRef]
  12. Gruber, F. Verzweigungssystem, Benadelung und Nadelfall der Fichte (Picea abies); Ecomed-Verlag: Landsberg am Lech, Germany, 1993. [Google Scholar]
  13. Geburek, T.; Robitschek, K.; Milasowszky, N. A tree of many faces: Why are there different crown types in Norway spruce (Picea abies (L.) Karst.)? Flora Morphol. Distrib. Funct. Ecol. Plants 2008, 203, 126–133. [Google Scholar] [CrossRef]
  14. König, A. Growth and snowbreak damage of Norway spruce provenances from Poland under harsh site conditions. In Forest Tree Breeding in an Ecologically Oriented Forest Management System; Meier-Dinkel, A., Steiner, W., Eds.; Schriften Forstlichen Fakultät Universität Göttingen und der Niedersächsischen Forstlichen Versuchsanstalt: Frankfurt am Main, Germany, 2002; pp. 139–150. [Google Scholar]
  15. Mátyás, C. Population, conservation and ecological genetics. In Encyclopedia of Forest Sciences; Burley, J., Evans, J., Youngquist, J.A., Eds.; Elsevier: Amsterdam, The Netherlands, 2004; pp. 188–197. [Google Scholar]
  16. Kathke, S.; Bruelheide, H. Differences in frost hardiness of two Norway spruce morphotypes growing at Mt. Brocken, Germany. Flora Morphol. Distrib. Funct. Ecol. Plants 2011, 206, 120–126. [Google Scholar] [CrossRef]
  17. Sylvén, N. Studier Öfver Granens Formrikedom, Särskildt Dess Förgreningstyper Och Deras Skogliga Värde; Statens Skogsförsöksanstalt: Stockholm, Sweden, 1909. [Google Scholar]
  18. Kiellander, C.L. Picea, Abies, Pseudozuga. In Manual of Plant Breeding VI-Breeding of Legumes and Fruits, Viniculture and Silviculture; Kappert, H., Rudorf, W., Eds.; Parey: Berlin, Hamburg, Germany, 1962; pp. 854–873. [Google Scholar]
  19. Liesebach, M.; Rau, H.; König, A.O. Fichtenherkunftsversuch von 1962 und IUFRO-Fichtenherkunftsversuch von 1972—Ergebnisse von mehr als 30-Jähriger Beobachtung in Deutschland; Nordwestdeutsche Forstliche Versuchsanstalt (NW-FVA): Göttingen, Germany, 2010. [Google Scholar]
  20. Kalela, A. Zur Synthese er Experimentellen Untersuchungen über Klimarassen der Holzarten; Communications Instituti Forestalis Fenniae: Helsinki, Finland, 1937. [Google Scholar]
  21. Pulkkinen, P.; Pöykkö, T. Inherited narrow crown form, harvest index and stem biomass production in Norway spruce, Picea abies. Tree Physiol. 1990, 6, 381–391. [Google Scholar] [CrossRef] [PubMed]
  22. Lehner, A.; Campbell, M.A.; Wheeler, N.C.; Piöykkiö, T.; Gliissl, J.; Kreike, J.; Neale, D.B. Identification of a RAPD marker linked to the pendula gene in Norway spruce (Picea abies (L.) Karst. f. pendula). Theor. Appl. Genet. 1995, 91, 1092–1094. [Google Scholar] [CrossRef] [PubMed]
  23. Latałowa, M.; van der Knaap, W.O. Late quaternary expansion of Norway spruce (Picea abies (L.) Karst.) in Europe according to pollen data. Quat. Sci. Rev. 2006, 25, 2780–2805. [Google Scholar] [CrossRef]
  24. Terhürne-Berson, R. Changing Distribution Patterns of Selected Conifers in the Quaternary of Europe Caused by Climatic Variations. Ph.D. Thesis, Friedrich-Wilhelms-Universität, Bonn, Germany, 16 June 2005. [Google Scholar]
  25. Acheré, V.; Favre, J.M.; Besnard, G.; Jeandroz, S. Genomic organization of molecular differentiation in Norway spruce (Picea abies). Mol. Ecol. 2005, 14, 3191–3201. [Google Scholar] [CrossRef] [PubMed]
  26. Vendramin, G.G.; Anzidei, M.; Madaghiele, A.; Sperisen, C.; Bucci, G. Chloroplast microsatellite analysis reveals the presence of population subdivision in Norway spruce (Picea abies K.). Genome 2000, 43, 68–78. [Google Scholar] [CrossRef] [PubMed]
  27. Sperisen, C.; Büchler, U.; Gugerli, F.; Mátyás, G.; Geburek, T.; Vendramin, G.G. Tandem repeats in plant mitochondrial genomes: Application to the analysis of population differentiation in the conifer Norway spruce. Mol. Ecol. 2001, 10, 257–263. [Google Scholar] [CrossRef]
  28. Gugerli, F.; Sperisen, C.; Magni, F. Haplotype variation in a mitochondrial tandem repeat of Norway spruce (Picea abies) populations suggests a serious founder effect during postglacial re-colonization of the western Alps. Mol. Ecol. 2001, 1255–1263. [Google Scholar] [CrossRef]
  29. Scalfi, M.; Mosca, E.; Di Pierro, E.A.; Troggio, M.; Vendramin, G.G.; Sperisen, C.; La Porta, N.; Neale, D.B. Micro-and macro-geographic scale effect on the molecular imprint of selection and adaptation in Norway spruce. PLoS ONE 2014, 9, e115499. [Google Scholar] [CrossRef]
  30. Tollefsrud, M.M.; Kissling, R.; Gugerli, F.; Johnsen, Ø.; Skrøppa, T.; Cheddadi, R.; Van Der Knaap, W.O.; Latałowa, M.; Terhürne-Berson, R.; Litt, T.; et al. Genetic consequences of glacial survival and postglacial colonization in Norway spruce: Combined analysis of mitochondrial DNA and fossil pollen. Mol. Ecol. 2008, 17, 4134–4150. [Google Scholar] [CrossRef]
  31. Di Pierro, E.A.; Mosca, E.; González-Martínez, S.C.; Binelli, G.; Neale, D.B.; La Porta, N. Adaptive variation in natural Alpine populations of Norway spruce (Picea abies (L.) Karst.) at regional scale: Landscape features and altitudinal gradient effects. For. Ecol. Manag. 2017, 405, 350–359. [Google Scholar] [CrossRef]
  32. Müller-Starck, G. Genetic variation in high elevated populations of Norway spruce (Picea abies (L.) Karst.) in Switzerland. Silv. Genet. 1995, 44, 356–362. [Google Scholar]
  33. Ndrosiuk, B.P.A.; Shimono, A.; Westin, J.; Lindgren, D.; Fries, A.; Wang, X. Genetic status of Norway spruce (Picea abies) breeding populations for northern Sweden. Silvae Genet. 2013, 63, 288–295. [Google Scholar] [CrossRef]
  34. Quack, M. Molekulargenetische Untersuchungen zur Variabilität der Fichte (Picea abies (L.) Karst.) in Deutschland. Ph.D. Thesis, Universität Trier, Trier, Germany, 28 April 2004. [Google Scholar]
  35. Greger, O. Erfassung von Relikten des Autochtonen Fichtenvorkommens im Hochharz. Ph.D. Thesis, Georg-August-Universität, Göttingen, Germany, 1992. [Google Scholar]
  36. Maghuly, F.; Pinsker, W.; Praznik, W.; Fluch, S. Genetic diversity in managed subpopulations of Norway spruce (Picea abies (L.) Karst.). For. Ecol. Manag. 2006, 222, 266–271. [Google Scholar] [CrossRef]
  37. Gömöry, D. Effect of stand origin on the genetic diversity of Norway spruce (Picea abies Karst.) populations. For. Ecol. Manag. 1992, 54, 215–223. [Google Scholar] [CrossRef]
  38. Deutscher Wetterdienst DWD Climate Data Center (CDC): Multi-Annual Means of Grids of Monthly Averaged Daily Mean Air Temperature (2m) over Germany, Version v1.0, Offenbach. 2017. Available online: ftp://ftp-cdc.dwd.de/pub/CDC/grids_germany/multi_annual/air_temperature_mean/8110/ (accessed on 2 November 2017).
  39. Deutscher Wetterdienst DWD Climate Data Center (CDC): Multi-Annual Grids of the Begin of the Vegetation Period in Germany, Version 0.x, Offenbach. 2017. Available online: ftp://ftp-cdc.dwd.de/pub/CDC/grids_germany/multi_annual/vegetation_begin/ (accessed on 2 November 2017).
  40. Deutscher Wetterdienst DWD Climate Data Center (CDC): Multi-Annual Grids of the End of the Vegetation Period in Germany, Version 0.x, Offenbach. 2017. Available online: ftp://ftp-cdc.dwd.de/pub/CDC/grids_germany/multi_annual/vegetation_end/ (accessed on 2 November 2017).
  41. Deutscher Wetterdienst DWD Climate Data Center (CDC): Multi-Annual Grids of Numbers of Snowcover Days over Germany, Version v1.0, Offenbach. 2017. Available online: ftp://ftp-cdc.dwd.de/pub/CDC/grids_germany/multi_annual/snowcover_days/ (accessed on 2 November 2017).
  42. Deutscher Wetterdienst DWD Climate Data Center (CDC): Multi-Annual Grids of Precipitation Height over Germany 1981–2010, Version v1.0, Offenbach. 2017. Available online: ftp://ftp-cdc.dwd.de/pub/CDC/grids_germany/multi_annual/precipitation/8110/ (accessed on 2 November 2017).
  43. Deutscher Wetterdienst DWD Climate Data Center (CDC): 1 km × 1 km Gridded Mean of Annual Wind Speeds from 10 m to 100 m (in 10 m Steps) above Ground and Weibull Parameters, for Germany, Version V0.1, Offenbach. 2014. Available online: ftp://ftp-cdc.dwd.de/pub/CDC/grids_germany/wind_parameters/resol_1000x1000/ (accessed on 2 November 2017).
  44. Wilhelm, B. Die autochtonen Höhenfichten des Thüringer Waldes am Beispiel der Oberhofer Schlosßberg-Fichte. AFZ 1990, 33, 845–846. [Google Scholar]
  45. Jetschke, G. Oberhofer Schlossberg-Fichten und Methusalem-Kiefern von Paulinzella: Zwei Bemerkenswerte Altbestände von Nadelbäumen; ThüringenForst—Anstalt öffentlichen Rechts: Erfurt, Germany, 2019; (accepted); Mitteilungen 37/2019. [Google Scholar]
  46. Meyer, P.; Janda, P.; Mikoláš, M.; Trotsiuk, V.; Krumm, F.; Mrhalová, H.; Synek, M.; Lábusová, J.; Kraus, D.; Brandes, J.; et al. A matter of time: Self-regulated tree regeneration in a natural Norway spruce (Picea abies) forest at Mt. Brocken, Germany. Eur. J. For. Res. 2017, 136, 907–921. [Google Scholar] [CrossRef]
  47. Scotti, I.; Paglia, G.P.; Magni, F.; Morgante, M. Efficient development of dinucleotide microsatellite markers in Norway spruce (Picea abies Karst.) through dot-blot selection. Theor. Appl. Genet. 2002, 104, 1035–1041. [Google Scholar] [CrossRef]
  48. Scotti, I.; Magni, F.; Paglia, G.P.; Morgante, M. Trinucleotide microsatellites in Norway spruce (Picea abies): Their features and the development of molecular markers. Theor. Appl. Genet. 2002, 106, 40–50. [Google Scholar] [CrossRef]
  49. Rungis, D.; Bérubé, Y.; Zhang, J.; Ralph, S.; Ritland, C.E.; Ellis, B.E.; Douglas, C.; Bohlmann, J.; Ritland, K. Robust simple sequence repeat markers for spruce (Picea spp.) from expressed sequence tags. Theor. Appl. Genet. 2004, 109, 1283–1294. [Google Scholar] [CrossRef]
  50. Shi, Y.-Z.; Forneris, N.; Rajora, O.P. Highly informative single-copy nuclear microsatellite DNA markers developed using an AFLP-SSR approach in black spruce (Picea mariana) and red spruce (P. rubens). PLoS ONE 2014, 9. [Google Scholar] [CrossRef]
  51. Pfeiffer, A.; Olivieri, A.M.; Morgante, M. Identification and characterization of microsatellites in Norway spruce (Picea abies K.). Genome 1997, 40, 411–419. [Google Scholar] [CrossRef] [PubMed]
  52. Fluch, S.; Burg, A.; Kopecky, D.; Homolka, A.; Spiess, N.; Vendramin, G.G. Characterization of variable EST SSR markers for Norway spruce (Picea abies L.). BMC Res. Notes 2011, 4, 401. [Google Scholar] [CrossRef] [PubMed]
  53. Hodgetts, R.B.; Aleksiuk, M.A.; Brown, A.; Clarke, C.; Macdonald, E.; Nadeem, S.; Khasa, D.; Macdonald, E. Development of microsatellite markers for white spruce (Picea glauca) and related species. Theor. Appl. Genet. 2001, 102, 1252–1258. [Google Scholar] [CrossRef]
  54. Besnard, G.; Acheré, V.; Rampant, P.F.; Favre, J.M.; Jeandroz, S. A set of cross-species amplifying microsatellite markers developed from DNA sequence databanks in Picea (Pinaceae). Mol. Ecol. Resour. 2003, 3, 380–383. [Google Scholar] [CrossRef]
  55. De Sousa, S.N.; Finkeldey, R.; Gailing, O. Commentary: Experimental verification of microsatellite null alleles in norway spruce (Picea abies (L.) Karst.): Implications for population genetic studies. Plant Mol. Biol. Rep. 2005, 23, 113–119. [Google Scholar] [CrossRef]
  56. Yazdani, R.; Scotti, I.; Jansson, G.; Plomion, C.; Mathur, G. Inheritance and diversity of simple sequence repeat (SSR) microsatellite markers in various families of Picea abies. Hereditas 2003, 138, 219–227. [Google Scholar] [CrossRef] [PubMed]
  57. Paglia, G.P.; Olivieri, A.M.; Morgante, M. Towards second-generation STS (sequence-tagged sites) linkage maps in conifers: A genetic map of Norway spruce (Picea abies K.). Mol. Gen. Genet. 1998, 258, 466–478. [Google Scholar] [CrossRef]
  58. Scotti, I.; Burelli, A.; Cattonaro, F.; Chagné, D.; Fuller, J.; Hedley, P.E.; Jansson, G.; Lalanne, C.; Madur, D.; Neale, D. Analysis of the distribution of marker classes in a genetic linkage map: A case study in Norway spruce (Picea abies Karst). Tree Genet. Genomes 2005, 1, 93–102. [Google Scholar] [CrossRef]
  59. Altschul, S.F.; Madden, T.L.; Schäffer, A.A.; Zhang, J.; Zhang, Z.; Miller, W.; Lipman, D.J. Gapped BLAST and PSI-BLAST: A new generation of protein database search programs. Nucleic Acid. Res. 1997, 25, 3389–3402. [Google Scholar] [CrossRef]
  60. Spitze, K. Population structure in Daphnia obtusa: Quantitative genetic and allozymic variation. Genetics 1993, 135, 367–374. [Google Scholar] [CrossRef]
  61. Leinonen, T.; McCairns, R.J.S.; O’Hara, R.B.; Merilä, J. QST–FST comparisons: Evolutionary and ecological insights from genomic heterogeneity. Nat. Rev. Genet. 2013, 14, 179–190. [Google Scholar] [CrossRef] [PubMed]
  62. Brommer, J.E. Whither PST? The approximation of QST by PST in evolutionary and conservation biology. J. Evol. Biol. 2011, 24, 1160–1168. [Google Scholar] [CrossRef] [PubMed]
  63. Da Silva, S.B.; Da Silva, A. Pstat: An R Package to Assess Population Differentiation in Phenotypic Traits. R J. 2018, 10, 447–454. [Google Scholar]
  64. R Core Team. R: A Language and Environment for Statistical Computing 2018. Available online: https://www.R-project.org (accessed on 2 November 2018).
  65. Jombart, T.; Devillard, S.; Balloux, F. Discriminant analysis of principal components: A new method for the analysis of genetically structured populations. BMC Genet. 2010. [Google Scholar] [CrossRef] [PubMed]
  66. Jombart, T.; Devillard, S.; Dufour, A.; Pontier, D. Revealing cryptic spatial patterns in genetic variability by a new multivariate method. Heredity 2008, 101, 92–103. [Google Scholar] [CrossRef] [PubMed]
  67. Engels, W.R. Exact tests for Hardy-Weinberg proportions. Genetics 2009, 183, 1431–1441. [Google Scholar] [CrossRef]
  68. Engels, W.R. HWxtest: Exact Tests for Hardy-Weinberg Proportions. R package version 1.1.7 2016. Available online: https://CRAN.R-project.org/package=HWxtest (accessed on 2 November 2018).
  69. Agapow, P.-M.; Burt, A. Indices of multilocus linkage disequilibrium. Mol. Ecol. Notes 2001, 1, 101–102. [Google Scholar] [CrossRef]
  70. Kamvar, Z.N.; Tabima, J.F.; Grünwald, N.J. Poppr: An R package for genetic analysis of populations with clonal, partially clonal, and/or sexual reproduction. PeerJ 2014. [Google Scholar] [CrossRef] [Green Version]
  71. Dempster, A.P.; Laird, N.M.; Rubin, D.B. Maximum likelihood from incomplete data via the EM algorithm. J. R. Stat. Soc. 1977, 39, 1–38. [Google Scholar]
  72. Rousset, F. GENEPOP’007: A complete re-implementation of the GENEPOP software for Windows and Linux. Mol. Ecol. Resour. 2008, 8, 103–106. [Google Scholar] [CrossRef]
  73. Kalinowski, S.T.; Taper, M.L. Maximum likelihood estimation of the frequency of null alleles at microsatellite loci. Conserv. Genet. 2006, 7, 991–995. [Google Scholar] [CrossRef]
  74. Dabrowski, M.J.; Bornelöv, S.; Kruczyk, M.; Baltzer, N.; Komorowski, J. “True” null allele detection in microsatellite loci: A comparison of methods, assessment of difficulties and survey of possible improvements. Mol. Ecol. Resour. 2015, 15, 477–488. [Google Scholar] [CrossRef] [PubMed]
  75. Carlsson, J. Effects of microsatellite null alleles on assignment testing. J. Hered. 2008, 99, 616–623. [Google Scholar] [CrossRef] [PubMed]
  76. Excoffier, L.; Lischer, H.E.L. Arlequin suite ver 3.5: A new series of programs to perform population genetics analyses under Linux and Windows. Mol. Ecol. Resour. 2010, 10, 564–567. [Google Scholar] [CrossRef] [PubMed]
  77. Peakall, R.; Smouse, P.E. GenALEx 6.5: Genetic analysis in Excel—Population genetic software for teaching and research-an update. Bioinformatics 2012, 28, 2537–2539. [Google Scholar] [CrossRef] [PubMed]
  78. Goudet, J.; Jombart, T. Hierfstat: Estimation and Tests of Hierarchical F-Statistics. R package version 0.04–22. 2015. Available online: https://CRAN.R-project.org/package=hierfstat (accessed on 2 November 2018).
  79. Bates, D.; Mächler, M.; Bolker, B.; Walker, S. Fitting linear mixed-effects models using lme4. J. Stat. Softw. 2015, 67, 1–48. [Google Scholar] [CrossRef]
  80. Ellis, J.R.; Burke, J.M. EST-SSRs as a resource for population genetic analyses. Heredity 2007, 99, 125–132. [Google Scholar] [CrossRef] [PubMed] [Green Version]
  81. Kalia, R.K.; Rai, M.K.; Kalia, S.; Singh, R.; Dhawan, A.K. Microsatellite markers: An overview of the recent progress in plants. Euphytica 2011, 177, 309–334. [Google Scholar] [CrossRef]
  82. Antao, T.; Lopes, A.; Lopes, R.J.; Beja-Pereira, A.; Luikart, G. LOSITAN: A workbench to detect molecular adaptation based on a Fst-outlier method. BMC Bioinform. 2008, 9, 323. [Google Scholar] [CrossRef]
  83. Foll, M.; Gaggiotti, O. A genome-scan method to identify selected loci appropriate for both dominant and codominant markers: A Bayesian perspective. Genetics 2008, 180, 977–993. [Google Scholar] [CrossRef]
  84. Excoffier, L.; Smouse, P.E.; Quattro, J.M. Analysis of molecular variance inferred from metric distances among DNA haplotypes: Application to human mitochondrial DNA restriction data. Genetics 1992, 131, 479–491. [Google Scholar] [CrossRef]
  85. Sundqvist, L.; Keenan, K.; Zackrisson, M.; Prodöhl, P.; Kleinhans, D. Directional genetic differentiation and relative migration. Ecol. Evol. 2016, 6, 3461–3475. [Google Scholar] [CrossRef] [PubMed] [Green Version]
  86. Nei, M. Analysis of gene diversity in subdivided populations. Proc. Natl. Acad. Sci. USA 1973, 70, 3321–3323. [Google Scholar] [CrossRef]
  87. Jost, L. GST and its relatives do not measure differentiation. Mol. Ecol. 2008, 17, 4015–4026. [Google Scholar] [CrossRef]
  88. Crawford, N.G. Smogd: Software for the measurement of genetic diversity. Mol. Ecol. Resour. 2010, 10, 556–557. [Google Scholar] [CrossRef] [PubMed]
  89. Alcala, N.; Goudet, J.; Vuilleumier, S. On the transition of genetic differentiation from isolation to panmixia: What we can learn from GST and D. Theor. Popul. Biol. 2014, 93, 75–84. [Google Scholar] [CrossRef]
  90. Keenan, K.; McGinnity, P.; Cross, T.F.; Crozier, W.W.; Prodöhl, P.A. diveRsity: An R package for the estimation of population genetics parameters and their associated errors. Method. Ecol. Evol. 2013, 4, 782–788. [Google Scholar] [CrossRef]
  91. Moran, P.A. The interpretation of statistical maps. J. R. Stat. Soc. 1948, 10, 243–251. [Google Scholar] [CrossRef]
  92. Moran, P.A. Notes on continuous stochastic phenomena. Biometrika 1950, 37, 17–23. [Google Scholar] [CrossRef] [PubMed]
  93. Montano, V.; Jombart, T. An Eigenvalue test for spatial principal component analysis. BMC Bioinform. 2017. [Google Scholar] [CrossRef] [PubMed]
  94. Jombart, T. Adegenet: A R package for the multivariate analysis of genetic markers. BMC Bioinform. 2008, 24, 1403–1405. [Google Scholar] [CrossRef] [PubMed]
  95. Jombart, T.; Ahmed, I. Adegenet 1.3-1: New tools for the analysis of genome-wide SNP data. BMC Bioinform. 2011, 27, 3070–3071. [Google Scholar] [CrossRef] [PubMed]
  96. Pritchard, J.K.; Stephens, M.; Donnelly, P. Inference of population structure using multilocus genotype data. Genetics 2000, 155, 945–959. [Google Scholar] [CrossRef] [PubMed]
  97. Hubisz, M.J.; Falush, D.; Stephens, M.; Pritchard, J.K. Inferring weak population structure with the assistance of sample group information. Mol. Ecol. Resour. 2009, 9, 1322–1332. [Google Scholar] [CrossRef] [Green Version]
  98. Falush, D.; Stephens, M.; Pritchard, J.K. Inference of population structure using multilocus genotype data: Linked loci and correlated allele frequencies. Genetics 2003, 164, 1567–1587. [Google Scholar] [CrossRef] [PubMed]
  99. Porras-Hurtado, L.; Ruiz, Y.; Santos, C.; Phillips, C.; Carracedo, Á.; Lareu, M.V. An overview of STRUCTURE: Applications, parameter settings, and supporting software. Front. Genet. 2013, 4, 1–13. [Google Scholar] [CrossRef] [PubMed]
  100. Kopelman, N.M.; Mayzel, J.; Jakobsson, M.; Rosenberg, N.A.; Mayrose, I. Clumpak: A program for identifying clustering modes and packaging population structure inferences across K. Mol. Ecol. Resour. 2015, 15, 1179–1191. [Google Scholar] [CrossRef] [PubMed]
  101. Evanno, G.; Regnaut, S.; Goudet, J. Detecting the number of clusters of individuals using the software STRUCTURE: A simulation study. Mol. Ecol. 2005, 14, 2611–2620. [Google Scholar] [CrossRef] [PubMed]
  102. Earl, D.A.; von Holdt, B.M. STRUCTURE HARVESTER: A website and program for visualizing STRUCTURE output and implementing the Evanno method. Conserv. Genet. Resour. 2012, 4, 359–361. [Google Scholar] [CrossRef]
  103. Hanewinkel, M.; Cullmann, D.A.; Schelhaas, M.; Nabuurs, G.; Zimmermann, N.E. Climate change may cause severe loss in the economic value of European forest land. Nat. Clim. Chang. 2012, 3, 203–207. [Google Scholar] [CrossRef]
  104. Reif, A.; Brucke, U.; Kratzer, R.; Schmiedinger, A.; Bauhus, J. Waldbau und Baumartenwahl in Zeiten des Klimawandels aus Sicht des Naturschutzes; Bundesamt für Naturschutz (BfN): Bonn, Germany, 2010. [Google Scholar]
  105. Kaplan, J.O.; Krumhardt, K.M.; Zimmermann, N. The prehistoric and preindustrial deforestation of Europe. Quat. Sci. Rev. 2009, 28, 3016–3034. [Google Scholar] [CrossRef]
  106. Farrell, E.P.; Führer, E.; Ryan, D.; Andersson, F.; Hüttl, R.; Piussi, P. European forest ecosystems: Buildind the future on the legacy of the past. For. Ecol. Manag. 2000, 132, 5–20. [Google Scholar] [CrossRef]
  107. Finkeldey, R.; Ziehe, M. Genetic implications of silvicultural regimes. For. Ecol. Manag. 2004, 197, 231–244. [Google Scholar] [CrossRef]
  108. Hosius, B.; Leinemann, L.; Konnert, M.; Bergmann, F. Genetic aspects of forestry in the central Europe. Eur. J. For. Res. 2006, 125, 407–417. [Google Scholar] [CrossRef]
  109. Wegener, U.; Kison, H. Die Vegetation des Brockens im Nationalpark Hochharz (Exkursion G). Tuexenia 2002, 22, 243–267. [Google Scholar]
  110. Meirmans, P.G.; Hedrick, P.W. Assessing population structure: FST and related measures. Mol. Ecol. Resour. 2011, 11, 5–18. [Google Scholar] [CrossRef] [PubMed]
  111. Whitlock, M.C. G′ST and D do not replace FST. Mol. Ecol. 2011, 20, 1083–1091. [Google Scholar] [CrossRef]
  112. Deleuze, C.; Hervé, J.C.; Colin, F.; Ribeyrolles, L. Modelling crown shape of Picea abies: Spacing effects. Can. J. For. Res. 1996, 26, 1957–1966. [Google Scholar] [CrossRef]
  113. Grassi, G.; Giannini, R. Influence of light and competition on crown and shoot morphological parameters of Norway spruce and silver fir saplings. Ann. For. Sci. 2005, 62, 269–274. [Google Scholar] [CrossRef] [Green Version]
  114. Hertel, D.; Schöling, D. Below-ground response of Norway spruce to climate conditions at Mt. Brocken (Germany)—A re-assessment of Central Europe’s northernmost treeline. Flora Morphol. Distrib. Funct. Ecol. Plants 2011, 206, 127–135. [Google Scholar] [CrossRef]
  115. Schmidt-Vogt, H. Monographie der Picea abies (L.) Karst. unter Berücksichtigung genetischer und züchterischer Aspekte. Forstwiss. Cent. 1978, 97, 281–302. [Google Scholar] [CrossRef]
  116. Bergmann, F. The allelic distribution at an acid phosphatase locus in Norway spruce (Picea abies) along similar climatic gradients. Theor. Appl. Genet. 1978, 52, 57–64. [Google Scholar] [CrossRef] [PubMed]
  117. Lagercrantz, U.; Ryman, N. Genetic structure of Norway spruce (Picea abies): Concordance of Morphological and Allozymic Variation. Evolution 1990, 44, 38–53. [Google Scholar] [CrossRef] [PubMed]
  118. Chen, J.; Källman, T.; Ma, X.; Gyllenstrand, N.; Zaina, G.; Morgante, M.; Bousquet, J.; Eckert, A.; Wegrzyn, J.; Neale, D.; et al. Disentangling the roles of history and local selection in shaping clinal variation of allele frequencies and gene expression in Norway spruce (Picea abies). Genetics 2012, 191, 865–881. [Google Scholar] [CrossRef] [PubMed]
  119. Trujillo-Moya, C.; George, J.-P.; Fluch, S.; Geburek, T.; Grabner, M.; Karanitsch-Ackerl, S.; Konrad, H.; Mayer, K.; Sehr, E.M.; Wischnitzki, E.; et al. Drought sensitivity of Norway Spruce at the species’ warmest fringe: Quantitative and molecular analysis reveals high genetic variation among and within provenances. G3 Genes Genomes Genet. 2018. [Google Scholar] [CrossRef] [PubMed]
  120. Ganthaler, A.; Stöggl, W.; Mayr, S.; Kranner, I.; Schüler, S.; Wischnitzki, E.; Sehr, E.M.; Fluch, S.; Trujillo-Moya, C. Association genetics of phenolic needle compounds in Norway spruce with variable susceptibility to needle bladder rust. Plant Mol. Biol. 2017, 94, 229–251. [Google Scholar] [CrossRef] [PubMed]
  121. Radu, R.G.; Curtu, L.A.; Spârchez, G.; Şofletea, N. Genetic diversity of Norway spruce (Picea abies (L.) Karst.) in Romanian Carpathians. Ann. For. Res. 2014, 57, 19–29. [Google Scholar] [CrossRef]
  122. Unger, G.M.; Konrad, H.; Geburek, T. Does spatial genetic structure increase with altitude? An answer from Picea abies in Tyrol, Austria. Plant Syst. Evol. 2011, 292, 133–141. [Google Scholar] [CrossRef]
  123. Scotti, I.; Paglia, G.; Magni, F.; Morgante, M. Population genetics of Norway spruce (Picea abies Karst.) at regional scale: Sensitivity of different microsatellite motif classes in detecting differentiation. Ann. For. Sci. 2006, 63, 485–491. [Google Scholar] [CrossRef]
  124. Muona, O.; Paule, L.; Szmidt, A.E.; Kärkkäinen, K. Mating system analysis in a central and northern European population of Picea abies. Scand. J. For. Res. 1990, 5, 97–102. [Google Scholar] [CrossRef]
  125. Chevarria, M.V. Genetic Characterisation of Populations from the European Natural Range of Norway Spruce (Picea abies (L.) Karst.) by Means of EST Markers. Ph.D. Thesis, Technische Universität München, Munich, Germany, 9 March 2005. [Google Scholar]
  126. Geburek, T. Genetic variation of Norway spruce (Picea abies (L.) Karst.) populations in Austria. III. Macrospatial allozyme patterns of high elevation populations. Int. J. For. Genet. 1999, 6, 201–211. [Google Scholar]
  127. Máchová, P.; Trčková, O.; Cvrčková, H. Use of nuclear microsatellite loci for evaluating genetic diversity of selected populations of Picea abies (L.) Karsten in the Czech Republic. Forests 2018, 9, 92. [Google Scholar] [CrossRef]
  128. Jeandroz, S.; Collignon, A.M.; Favre, J.M. RAPD and mtDNA variation among autochthonous and planted populations of Picea abies from the Vosges mountains (France) in reference to other French populations. For. Ecol. Manag. 2004, 197, 225–229. [Google Scholar] [CrossRef]
  129. Janes, J.K.; Miller, J.M.; Dupuis, J.R.; Malenfant, R.M.; Gorrell, J.C.; Cullingham, C.I.; Andrew, R.L. The K = 2 conundrum. Mol. Ecol. 2017, 3594–3602. [Google Scholar] [CrossRef] [PubMed]
  130. Ennos, R.A. Estimating the relative rates of pollen and seed migratin among plant populations. Heredity 1994, 72, 250–259. [Google Scholar] [CrossRef]
  131. QGIS Development Team. QGIS Geographic Information System. Open Source Geospatial Found. Project. Available online: http://www.qgis.org/ (accessed on 18 December 2017).
  132. OpenStreetMap Contributors. OpenStreetMap. Available online: http://tile.openstreetmap.org (accessed on 18 October 2018).
Figure 1. Relative frequencies of the assessed phenotypic traits (overall crown shape, angle of the first order branches, second order branching pattern, occurrence of crown damage, and occurrence of forking) in the studied stands. LE: Low elevation type; HE: High elevation type; SBF: relict stand “Schlossbergfichte”; S: Ore Mountains (Saxony); Thy: Thuringia; H: Harz Mountains. Categories for the traits are described in the right-hand legend.
Forests 09 00752 g001
Figure 2. Discriminant analysis of principal component (DAPC) [65] on multivariate phenotypic data. Data points are displayed along the first and second discriminate axes (x- and y-axes, respectively) of the DAPC indicated by the stars originating from the corresponding distribution centre. Groups are depicted by 95% inertia ellipses with corresponding barycentre as a symbol. LE: Low elevation type; HE: High elevation type; SBF: relict stand “Schlossbergfichte”; S: Ore Mountains (Saxony); Thy: Thuringia; H: Harz Mountains. Note that for the stand SBF_Thy, no ellipse is displayed as all data points are identical. In the bottom left corner, the DA (discriminate analysis) eigenvalues are displayed, where the first and second DA are highlighted in dark grey and grey, respectively. The PCA (principal component analysis) eigenvalues are displayed in the lower right corner, where the retained PC’s (principal component) eigenvalues are highlighted in dark grey.
Forests 09 00752 g002
Figure 3. Spatial principal component analysis [66] based on the allele data, reflecting low spatial genetic differentiation for the SSR loci. Data points (grey) are displayed on the first and second principal components (x- and y-axes, respectively), where the symbols represent the different stands in the upper right legend. LE: Low elevation type; HE: High elevation type; SBF: relict stand “Schlossbergfichte”; S: Ore Mountains (Saxony); Thy: Thuringia; H: Harz Mountains. Groups are depicted by 95% inertia ellipses with a corresponding barycentre as a symbol. In the bottom left corner, the eigenvalues are displayed, were the first and second eigenvalues are displayed with wider bars and highlights in the darker grey.
Forests 09 00752 g003
Figure 4. Clustering result based on the STRUCTURE analysis [96] and displayed as the average over the 15 runs obtained from CLUMPAK [100]. In the major mode, (a) eight of the 15 runs were summarized and an additional minor mode (b) of seven runs was obtained. The average logarithmic probability of the data for the given mode and the average similarity of the runs summarized is also given.
Forests 09 00752 g004
Table 1. Climatological and stand specific data.
StandNAge of Upper Story Trees, yearsMean Multi Annual Air Temperature 1981–2010, °CMean Vegetation Period in 1992–2015, daysMean Snow Cover Days in 1981–2010, daysAnnual Mean Precipitation in 1981–2010, mmMean Wind in 20 m a.g.l. m/s in 1981–2000Elevation Range Of Sampled Individuals, m a.s.l.
LE_H2001804.7181.0141.51668.556889–915
HE_H250300 *3.9177.0158.01793.0791036–1065
LE_S2001625.2184.0127.01210.055.5972–1009
HE_S2001424.9182.0136.01255.058988–1014
LE_Thy200905.7190.0122.01331.057899–912
HE_Thy2001516.3195.5100.51211.039761–776
Schloss-bergfichte75280 *5.8191.0116.01331.050818–840
Mean 5.2185.8128.71399.956.4921
Number of sampled individuals (N), mean air temperature, mean length of the vegetation period, mean number of days with a snow cover >1 cm in the morning, mean annual precipitation, mean wind speed at 20 m above ground level, and the elevation range in the sampled stands. LE: Low elevation type; HE: High elevation type; S: Ore Mountains (Saxony); Thy: Thuringia; H: Harz Mountains. Values for climatological parameters were taken from extrapolated 1 × 1 km grid maps of the long-term average measurements [38,39,40,41,42,43]. For individuals falling in different grids, the mean of these grid values is given and used for calculation of the total mean. The mean vegetation period is calculated from the grid values of the mean end-date minus the mean starting-date of the vegetation period (both are presented in days from New Year). Elevation data were taken from the GPS data and stand age according to information given by the forestry officials. * The age of the “Schlossbergfichte” population is based on the oldest trees [44,45], and the age of the HE_Harz population is based on the oldest trees of equivalent stands at Mt. Brocken [46].
Table 2. The assessed phenotypic traits and phenotypes associated with elevation.
TraitPhenotype
MountainousIntermediateLowland
overall crown architecture; structural appearancenarrow shaped crownequivocal/intermediate shapebroad shape
angle of the first order branchesclearly downwards facing branches, stem and branchesno clear branch orientation up- or downwardsstraight and upwards facing branches, all angles between stem and branches right or obtuse
branching pattern of the second order branchesplate or plate brush likebrush likecomb or comb brush like
The traits were scored in three categories, which were summarizations of the categories used by various authors [4,7,12,13].
Table 3. Details on the SSR (simple sequence repeat) markers used for genotyping.
SSRAllele SizeDye Label and the PCR Primer Sequences (5′–3′)Repeat MotifReference
Min, bpMax, bp
EATC1B2a197219F: FAM-TGGCATGAGATTTATGTGGTT
R: GTGTGCCACTCAACCTCAC
(ATC)7(AT)3[48]
EATC1D2a180236F: FAM-TTGTCATCGTCGTCATTGTC
R: TTTAGCCTCTGTTTTCTAGCG
(ATC)3AT(ATC)6[48]
EATC1E03a130175F: FAM-CCCCTTATTCCTAACGTCAAA
R: TACCAGTGGTGACAACGATG
(CAT)4CGT(CAT)8CGT-(CAT)4CGT(CT)4CGT(CAT)4[48]
EATC2G05a193254F: HEX-TGGAGCATGGGTAAATCG
R: TACCTCACACCCGTGAGAAT
(AAT)5(CAT)16CAA(CAT)4[48]
PaGB3b109150F: FAM-AGTGATTAAACTCCTGACCAC
R: CACTGAATACACCCATTATCC
(AT)11[54]
PaGB8b95203F: FAM-AGCATGTACAAAATGAAGATTCTC
R: CCCTTTAGTGTTTTCTCTTTCTAC
(AC)12[54]
SpAG2a88122F: FAM-GCTCTTCACGTGTACTTGATC
R: TTCGAAGATCCTCCAAGATAC
(TC)16[41]
SpAGC1a71121F: HEX-TTCACCTTAGCCGAGAACC
R: CACTGGAGATCTTCGTTCTGA
(TC)5TT(TC)10[41]
SpAGG3a109149F: HEX-AGCATGTTGTCCCATATAGACC
R: CTCCAACATTCCCATGTAGC
(GA)24[41]
WS00016.O09b386402F: HEX-CTTTGGGGGCTAGCAAGTTT
R: ATTCGGGCTTCATAGCACAA
(AT)9[49]
WS00111.K13b212272F: HEX-GACTGAAGATGCCGATATGC
R: GGCCATATCATCTCAAAATAAAGAA
(AT)9[49]
a gSSRs, b EST-SSRs; F: Forward primer; R: Reverse primer.
Table 4. Annotation of the four EST (expressed sequenced tag)-sequences with SSRs (EST-SSRs) used in this study [49,54].
EST-SSRGenBank Accession NumberAnnotationLocation of SSR in the EST
PaGB3AJ133748P. abies mRNA for major intrinsic protein (aquaporin)3′UTR
PaGB8AF100429P. abies clone PA12H2 repetitive DNA sequence
WS00016.O09 *CN480894NP 197764—expressed protein (A. thaliana)3′UTR
WS00111.K13 *CN480897BAB86071—putative beta-glucosidase (O. sativa (japonica cultivar-group))3′UTR
* Based on a BLAST [59] search.
Table 5. Summary of basic population genetic parameters.
StandHoHeAArPrivate AllelesFISp-Value
HE_H0.6550.73317.0916.5100.1420.000
HE_S0.6400.75116.9016.8320.1240.000
HE_Thy0.7020.75717.0016.6740.1290.006
LE_H0.6300.73016.4616.1340.0410.099
LE_S0.6730.74616.6416.6400.1080.000
LE_Thy0.6680.73416.7316.4650.1370.000
SBF_Thy0.6920.74914.5516.7900.0790.007
LE: Low elevation type; HE: High elevation type; S: Ore Mountains (Saxony); Thy: Thuringia; H: Harz Mountains; SBF: relict stand “Schlossbergfichte”. Ho and He—expected and observed heterozygosity, respectively; A—mean number of alleles per locus; Ar—allelic richness adjusted for different sample size by rarefaction; FIS—index of fixation with corresponding p-values based on permutation.

