Article

Genomic Prediction of Growth and Stem Quality Traits in Eucalyptus globulus Labill. at Its Southernmost Distribution Limit in Chile

1
Instituto de Ciencias Biológicas, Universidad de Talca, 2 Norte 685, Talca 3460000, Chile
2
Semillas Imperial SpA, Av. Las Industrias 13320, Los Ángeles 4440000, Chile
3
Departamento de Silvicultura, Facultad de Ciencias Forestales, Universidad de Concepción, Concepción 4070386, Chile
*
Author to whom correspondence should be addressed.
Submission received: 4 October 2018 / Revised: 5 November 2018 / Accepted: 14 December 2018 / Published: 18 December 2018
(This article belongs to the Section Forest Ecophysiology and Biology)

Abstract

:
The present study was undertaken to examine the ability of different genomic selection (GS) models to predict growth traits (diameter at breast height, tree height and wood volume), stem straightness and branching quality of Eucalyptus globulus Labill. trees using a genome-wide Single Nucleotide Polymorphism (SNP) chip (60 K), in one of the southernmost progeny trials of the species, close to its southern distribution limit in Chile. The GS methods examined were Ridge Regression-BLUP (RRBLUP), Bayes-A, Bayes-B, Bayesian least absolute shrinkage and selection operator (BLASSO), principal component regression (PCR), supervised PCR and a variant of the RRBLUP method that involves the previous selection of predictor variables (RRBLUP-B). RRBLUP-B and supervised PCR models presented the greatest predictive ability (PA), followed by the PCR method, for most of the traits studied. The highest PA was obtained for the branching quality (~0.7). For the growth traits, the maximum values of PA varied from 0.43 to 0.54, while for stem straightness, the maximum value of PA reached 0.62 (supervised PCR). The study population presented a more extended linkage disequilibrium (LD) than other populations of E. globulus previously studied. The genome-wide LD decayed rapidly within 0.76 Mbp (threshold value of r2 = 0.1). The average LD on all chromosomes was r2 = 0.09. In addition, the 0.15% of total pairs of linked SNPs were in a complete LD (r2 = 1), and the 3% had an r2 value >0.5. Genomic prediction, which is based on the reduction in dimensionality and variable selection may be a promising method, considering the early growth of the trees and the low-to-moderate values of heritability found in the traits evaluated. These findings provide new understanding of how develop novel breeding strategies for tree improvement of E. globulus at its southernmost range limit in Chile, which could represent new opportunities for forest planting that can benefit the local economy.

1. Introduction

The genus Eucalyptus L’Her. comprises more than 700 species that are distributed mainly in Australia, and these species are planted in a wide variety of environments, such as the Mediterranean, tropical, subtropical and temperate climates [1,2]. Both the species and hybrids of the genus are among the main sources of biomass worldwide and among the main hardwoods used for the production of pulp and wood [3]. For example, Eucalyptus globulus Labill. is one of the most planted hardwood species for industrial uses in various countries with temperate zones (e.g., Portugal, Spain, Uruguay and Chile), which has been the target of breeding in several programs around the world to improve economically important traits such as tree growth and wood quality. E. globulus is naturally distributed in coastal south-eastern Australia [4], between 38° and 43° S latitude, where oceanic and subpolar oceanic climates are predominant. However, the species has been extensively planted under temperate conditions [1,2]. Notably, E. globulus exhibits physiological plasticity and has been successfully grown in a broad range of environmental conditions that are characterized by moderate abiotic stresses [5,6,7]. In Chile, for instance, several studies have been conducted to provide an understanding of the mechanisms through which E. globulus trees respond to cold conditions [8,9,10]. In fact, severe cold winter periods restrict the majority of the E. globulus plantations to coastal and central Chile [7]. In fact, the southern limit of E. globulus in Chile occurs in central Los Lagos (administrative region) at approximately latitude 41° S, accounting for only 4% of the total E. globulus plantations in Chile.
Individual selection based on phenotypic data of the traits of interest, which includes pedigree records, has been the most commonly used strategy to genetically improve forest tree species. In this sense, the estimation of quantitative genetic parameters in tree breeding programs is important to ensure efficient selection [11]. On the other hand, the growth rate is relatively long, and low juvenile-mature correlations in forest trees have stimulated interest in marker-assisted selection (MAS) to accelerate breeding through early selection [12]. In MAS, individual tree breeding values are predicted based on the effects of selected markers, and is most effective for traits controlled by few quantitative trait loci (QTLs), each of which controls a relatively large proportion of the total phenotypic variation. In this context, efforts to increase genetic gains using MAS in different breeding programs of Eucalyptus have been performed [11,12,13,14,15,16,17]. However, the benefits of MAS may be diminished by the low genetic variance that can be explained by a given QTL [18,19,20]. This principle is particularly important when the selection processes focus mainly on complex traits (controlled by multiple genes), such as stem straightness, wood volume, wood quality and growth traits [21,22,23]. Moreover, many QTLs underlying a complex trait are useful within the same or related families and environments (e.g., Ukrainetz et al. [24], Mamani et al. [25]), and the use of small population sizes and conventional statistical methods have been inadequate to accurately detect small effects of QTLs [26].
To overcome the limitations of MAS in polygenic traits, Meuwissen et al. [27] proposed the genomic prediction/selection (GS) method; in which environmental factors are important, and it focuses on traits that are affected by a large number of genes. In their study, these researchers compared several frequentist analyses (e.g., best linear unbiased prediction (BLUP) and least squares) and their Bayesian counterpart models based on the predictive ability of breeding values. The GS principles agree with the infinitesimal model, which is based on the fact that breeding values result from the small and additive effects of alleles in a large number of loci [28]. GS is based on the simultaneous prediction of the effects of thousands of DNA markers (e.g., SNPs) scattered throughout the genome of an organism, which disregards the use of significance tests for individual markers. Daetwyler et al. [29] highlighted that GS can increase genetic gain through greater precision in the estimation of breeding values, the reduction in generational intervals and an optimal use of available genetic resources. In the context of the genetic improvement of forest tree species, GS was originally proposed as a promising way to capture a greater proportion of the genetic variation for growth traits [30]. Moreover, according to Suontama et al. [31], Grattapaglia [32], Iwata et al. [33] and Zhong et al. [34], genomic selection is expected to enhance the genetic improvement of plants, including forest tree species by providing more accurate estimates of breeding values compared with pedigree-based methodologies.
Several models and methodological variants have been proposed for a better use of the benefits of GS because this method requires the development of statistical models that usually contain a massive number of markers (predictor variables) and a limited number of phenotypic data. The statistical methods commonly used in GS correspond to Bayes-A, Bayes-B, Bayes Cπ, Bayesian Least Absolute Shrinkage and Selection Operator (LASSO; BLASSO) [27,35,36], Genomic-BLUP (GBLUP) [36] and Ridge Regression BLUP (RRBLUP) [27]. In each GS model, genetic merits are predicted under different analytical assumptions. Therefore, there is no universally optimal statistical method for all the traits in every population. For instance, Suontama et al. [31] and Durán et al. [37] showed a significant improvement in breeding value accuracy for wood properties in Eucalyptus by implementing GBLUP method compared to pedigree based prediction. On the other hand, Resende-Junior et al. [38] determined the SNP effects based on five predictive models in a training population of Pinus taeda L., in which the Bayes Cπ, Bayes-A and RRBLUB-B methods (using a subset of selected markers) showed greater predictive ability than RRBLUP and BLASSO methods. In turn, some studies have shown that the predictive accuracy of GS models can be enhanced by previously selecting a subset of predictor variables based on the individual effects of each marker on the study traits [38,39,40]. Likewise, Long et al. [41], Solberg et al. [42], Du et al. [43] and Azevedo et al. [44] demonstrated the potential to combine the dimension reduction and variable selection for accurate and cost-effective prediction of genomic breeding values. Among the methods proposed for these objectives, the principal component regression (PCR), partial least squares (PLS) and their extensions supervised PCR and sparse PLS stand out. The reduction in dimensionality becomes more relevant when considering the new genomic data platforms, which have allowed for high-density genomic data to be obtained, thereby increasing the possibility of finding genomic regions controlling the variation of a trait. Considering the large size of the SNP platforms currently available in Eucalyptus (e.g., EUchip60K), a preselection of SNP and/or the use of dimensionality reduction methods may improve the prediction ability of the traits of interest for the forestry industry.
The present study was undertaken to examine the ability of different GS models to predict growth traits (diameter at breast height, tree height and wood volume), stem straightness and branching quality of E. globulus trees using 60,000 SNP markers, in one of the southernmost progeny trials of the species, close to its southern distribution limit in Chile. A better understanding of how develop novel breeding strategies for tree improvement of E. globulus could represent new opportunities for forest planting at its southernmost range limit in Chile.

2. Materials and Methods

2.1. Genetic Material and Phenotypic Measurements

The breeding population consisted of a mixture of E. globulus Labill. families composed of 62 full-sib and 3 half-sib families (1968 individuals), established in 2012 in La Poza, municipality of Purranque, in the administrative region of Los Lagos; the southernmost distribution of E. globulus in Chile [7]. The local conditions of La Poza are shown in Table 1. A randomized complete block design was used in this experiment, with 30 blocks, single-tree plots, and a spacing of 2.5 m between the trees within a block. A total of 1968 trees were measured at four years of age for the following five phenotypic traits: total tree height (H), diameter at breast height (DBH), total wood volume (VOL), stem straightness (ST) and branching quality (BQ). The ST was evaluated in the first two-thirds of the total height of the tree using a categorical scale of 6 levels (1 represents trees with curvature in the first stretch of the total height of the tree; and 6 represents trees without problems that may show a slight curvature in the upper third of the tree without loss of productivity). BQ was evaluated according to different criteria that define the quality of branches (diameter, angle and distribution in the tree) using a categorical scale of 6 levels (1 represents trees with extreme deficiency in branch diameter and any other variable; and 6 represents trees that present an optimal combination of all the variables that qualify the quality of branches without loss of productivity).

2.2. Genotyping and Estimation of Linkage Disequilibrium (LD)

Nuclear DNA was isolated from leaf tissue of 647 individuals randomly selected (approximately 10 individuals per family) from the breeding population according to Doyle and Doyle [45] and Porebsky et al. [46]. The sample was genotyped using the EUChip60K SNP system (GeneSeek, Lincoln, NE, USA) developed by Silva-Junior et al. [47]. The genotyping quality was evaluated using Genome Studio software (Illumina, San Diego, CA, USA). Subsequently, the genotyping matrix was filtered considering a minor allele frequency (MAF) ≥0.05 and a maximum proportion of 10% of lost data. The genotyped sample was used to estimate the LD pattern in the breeding population studied. The LD between marker pairs (expressed in terms of r2) was corrected by relatedness and estimated using LDcorSV package version 1.3.2 [48]. The LD decay curve was plotted using R software version 3.4 according to the method of Hill and Weir [49], and it was based on the physical distance of the genome of Eucalyptus grandis [50].

2.3. Estimation of Pedigree-Based Breeding Values

Estimated breeding values (EBV) were obtained using the Best Linear Unbiased Prediction (BLUP) with estimates of variance components based on the Restricted Maximum Likelihood (REML) method by the ASREML program version 4 [51]. This pedigree-based model was as follows:
y = X β + Za + ε
where y represents the vector of phenotypic data, β is the vector of fixed effects (general mean and block effect), a is the vector of additive effects, which N ( 0 , A σ a 2 ) where A is the average numerator relationship matrix from pedigree information and σ a 2 is the additive genetic variance, X and Z correspond to the incidence matrices associated with the fixed and random effects, respectively, and ε represents the vector of residual effects, which N ( 0 , I σ e 2 ) where I is an identity matrix and σ e 2 is the residual variance. Due to the ordinal nature of the traits BQ and ST, their estimated breeding values (EBVs) were obtained using a Generalized Linear Mixed Model, evaluated with a logistic regression model in the ASREML program v4 [51]. Additionally, coefficients of additive genetic variation (CVa) were calculated using variance component estimates and the means of each trait ( X ¯ ) as:
C V a = σ ^ a 2 X ¯

2.4. Genomic Prediction Models

We compared the following statistical methods with regard to their predictive performance: Ridge Regression BLUP (RRBLUP), Bayes-A, Bayes-B, Bayesian Least Absolute Shrinkage and Selection Operator (BLASSO), PCR, supervised PCR and a variant of RRBLUP, which involves the previous selection of predictive variables (RRBLUP-B) [27,35,38,43]. The genotypic information is usually fitted using a basic linear model that includes a vector β (the overall mean) and a vector m with the marker effects [38].
In RRBLUP and RRBLUP-B, a mixed model was fitted in which the vector of fixed effect (β), i.e., the overall mean, and the vector of random marker effects (m) were estimated simultaneously using the following mixed model equations:
[ X X X Z Z X Z Z + σ e 2 / σ m 2 I ] [ β ^ m ^ ] = [ X y Z y ]
where σ m 2 and σ e 2 correspond to the variance components (estimated by REML) of marker and residual effects, respectively, and the variance ratio σ e 2 / σ m 2 corresponds to the shrinkage parameter for the random SNP marker effects. RRBLUP-B corresponds to a variant of the RRBLUP method [38], which utilizes a selected subset of markers. The number of markers in the subset was defined according to the criteria of Resende-Junior et al. [38]. In a first step, the marker effects from the RRBLUP were ranked in decreasing order by their absolute values and grouped in multiples of 50 markers (50, 100, 150…, n). The group that maximized the predictive ability was selected as the optimum number of marker effects to be used in predictive model. Finally, markers effects were re-estimated in a new RRBLUP analysis, using selected markers (more details in Resende-Junior et al. [38]).
The methods Bayes A, Bayes B and BLASSO relax the assumption of common prior variance to all marker effects [30]. In the Bayes-A method [27], it is assumed that each ith marker effect (mi) follows a normal prior distribution N ( 0 , I σ m i 2 ) . The prior distribution of marker variances is assumed to be scaled inverted chi-square, σ m i 2 χ 2 ( v , S 2 ) , where S 2 and v are a scale parameter and the number of degrees of freedom, respectively. The Bayes-B method [27] uses a prior distribution that has a high density, π, at σ m i 2 = 0 , and an inverted chi-square distribution for σ m i 2 > 0 with probability 1–π. The BLASSO method, a double exponential prior distribution (DE) is assumed for marker effects, p ( m i | λ , σ e 2 ) = DE ( m i | 0 , λ / σ e 2 ) , where λ corresponds to a regularization parameter. The DE distribution generates a strong contraction (closer to zero) to estimate the effect of the markers [52].
PCR is a statistical method that addresses the problem of multicollinearity when there are a large number of explanatory variables in a prediction model [53]. Importantly, dimension reduction techniques have recently gained much attention in the analysis of high dimensional genomic data [54,55,56]. This method consists of finding combinations of the predictor variables that best represent the variability of the data (main components). In the first step, the components that mainly explain the variation of the response variable (e.g., deregressed EBV) are identified. Subsequently, the model is validated by reducing the matrix dimension of the predictor variables in such a way that only relevant components are incorporated in the prediction model. Considering that matrix X (matrix of markers or predictor variables) is centered and scaled (X*) with n × m dimensions (n is the sample size and m is the number of markers), its singular decomposition value is as follows [54]:
X * = UD V T
where U, D and VT are matrices of n × m, m × m and m × p, respectively, n is the number of observations (n = 647), p is the total number of predictors (SNPs); m is the number of X “ranked” elements; D is a diagonal matrix of singular values dj; and U contains the main components (u1, u2… um) in the order of d1d2 ≥ … ≥ 0. The PCR model corresponds to a regression expressed as follows:
y = β 0 1 + X * β * + ε
where β * corresponds to the regression coefficients that allow selecting the main components that explain the variation of y. The matrix Vm × m is also known as the load matrix of X. When the number of components (p) is defined, the load matrix is truncated to a matrix of m × p. Therefore, the matrix containing the selected components is represented by T nxp = X nxm V mxp . The regression model using these new terms is y = Tb + e . Therefore, the estimated score coefficients can be expressed as follows:
b ^ = ( T T T ) 1 T T y
(further details in Du et al. [49]). The supervised PCR method consists of two steps [44]. In the first step, the individual coefficients of each predictor variable (effects of the SNPs) are obtained to “rank” each SNP according to the magnitude of its effects. Subsequently, a set of variables ranked in the first positions are selected to perform a PCR analysis. The variable selection in supervised PCR model was based upon association with the phenotype of each SNP, using a single-marker regression (Long et al. [41]). A value of significance p < 0.01 for the regression between SNP and phenotypic response was considered as threshold for SNP selection in the supervised PCR method.
The optimal number of components for the PCR and supervised PCR methods was determined by selecting the minimum prediction error value (predicted residual error sum of squares—PRESS) for each component. These methods were implemented using the PLS package in R [57]. The RRBLUP, Bayes-A, Bayes-B and BLASSO methods were implemented in R software using the RRBLUP version 4.6 [58] and BLR version 1.5 [59] packages.

2.5. Cross-Validation and Prediction Ability

The sample of 647 trees was divided in two subsets of individuals. A total of 582 individuals (~90%) were used to train the models and estimate the effects of the markers, while the rest of the individuals (~10%) were used to evaluate and validate the prediction values. In the case of the RRBLUP, BAYES-A, BAYES-B, BLASSO and RRBLUP-B methods, 100 cycles were used to obtain the average prediction ability of each method. The PCR and supervised PCR methods were validated according to Du et al. [43] using 10 folds in the cross-validation analysis. The prediction ability of all the methods was calculated as the correlation coefficient between genomic estimated breeding values (GEBVs) and EBVs of the validation subsample.

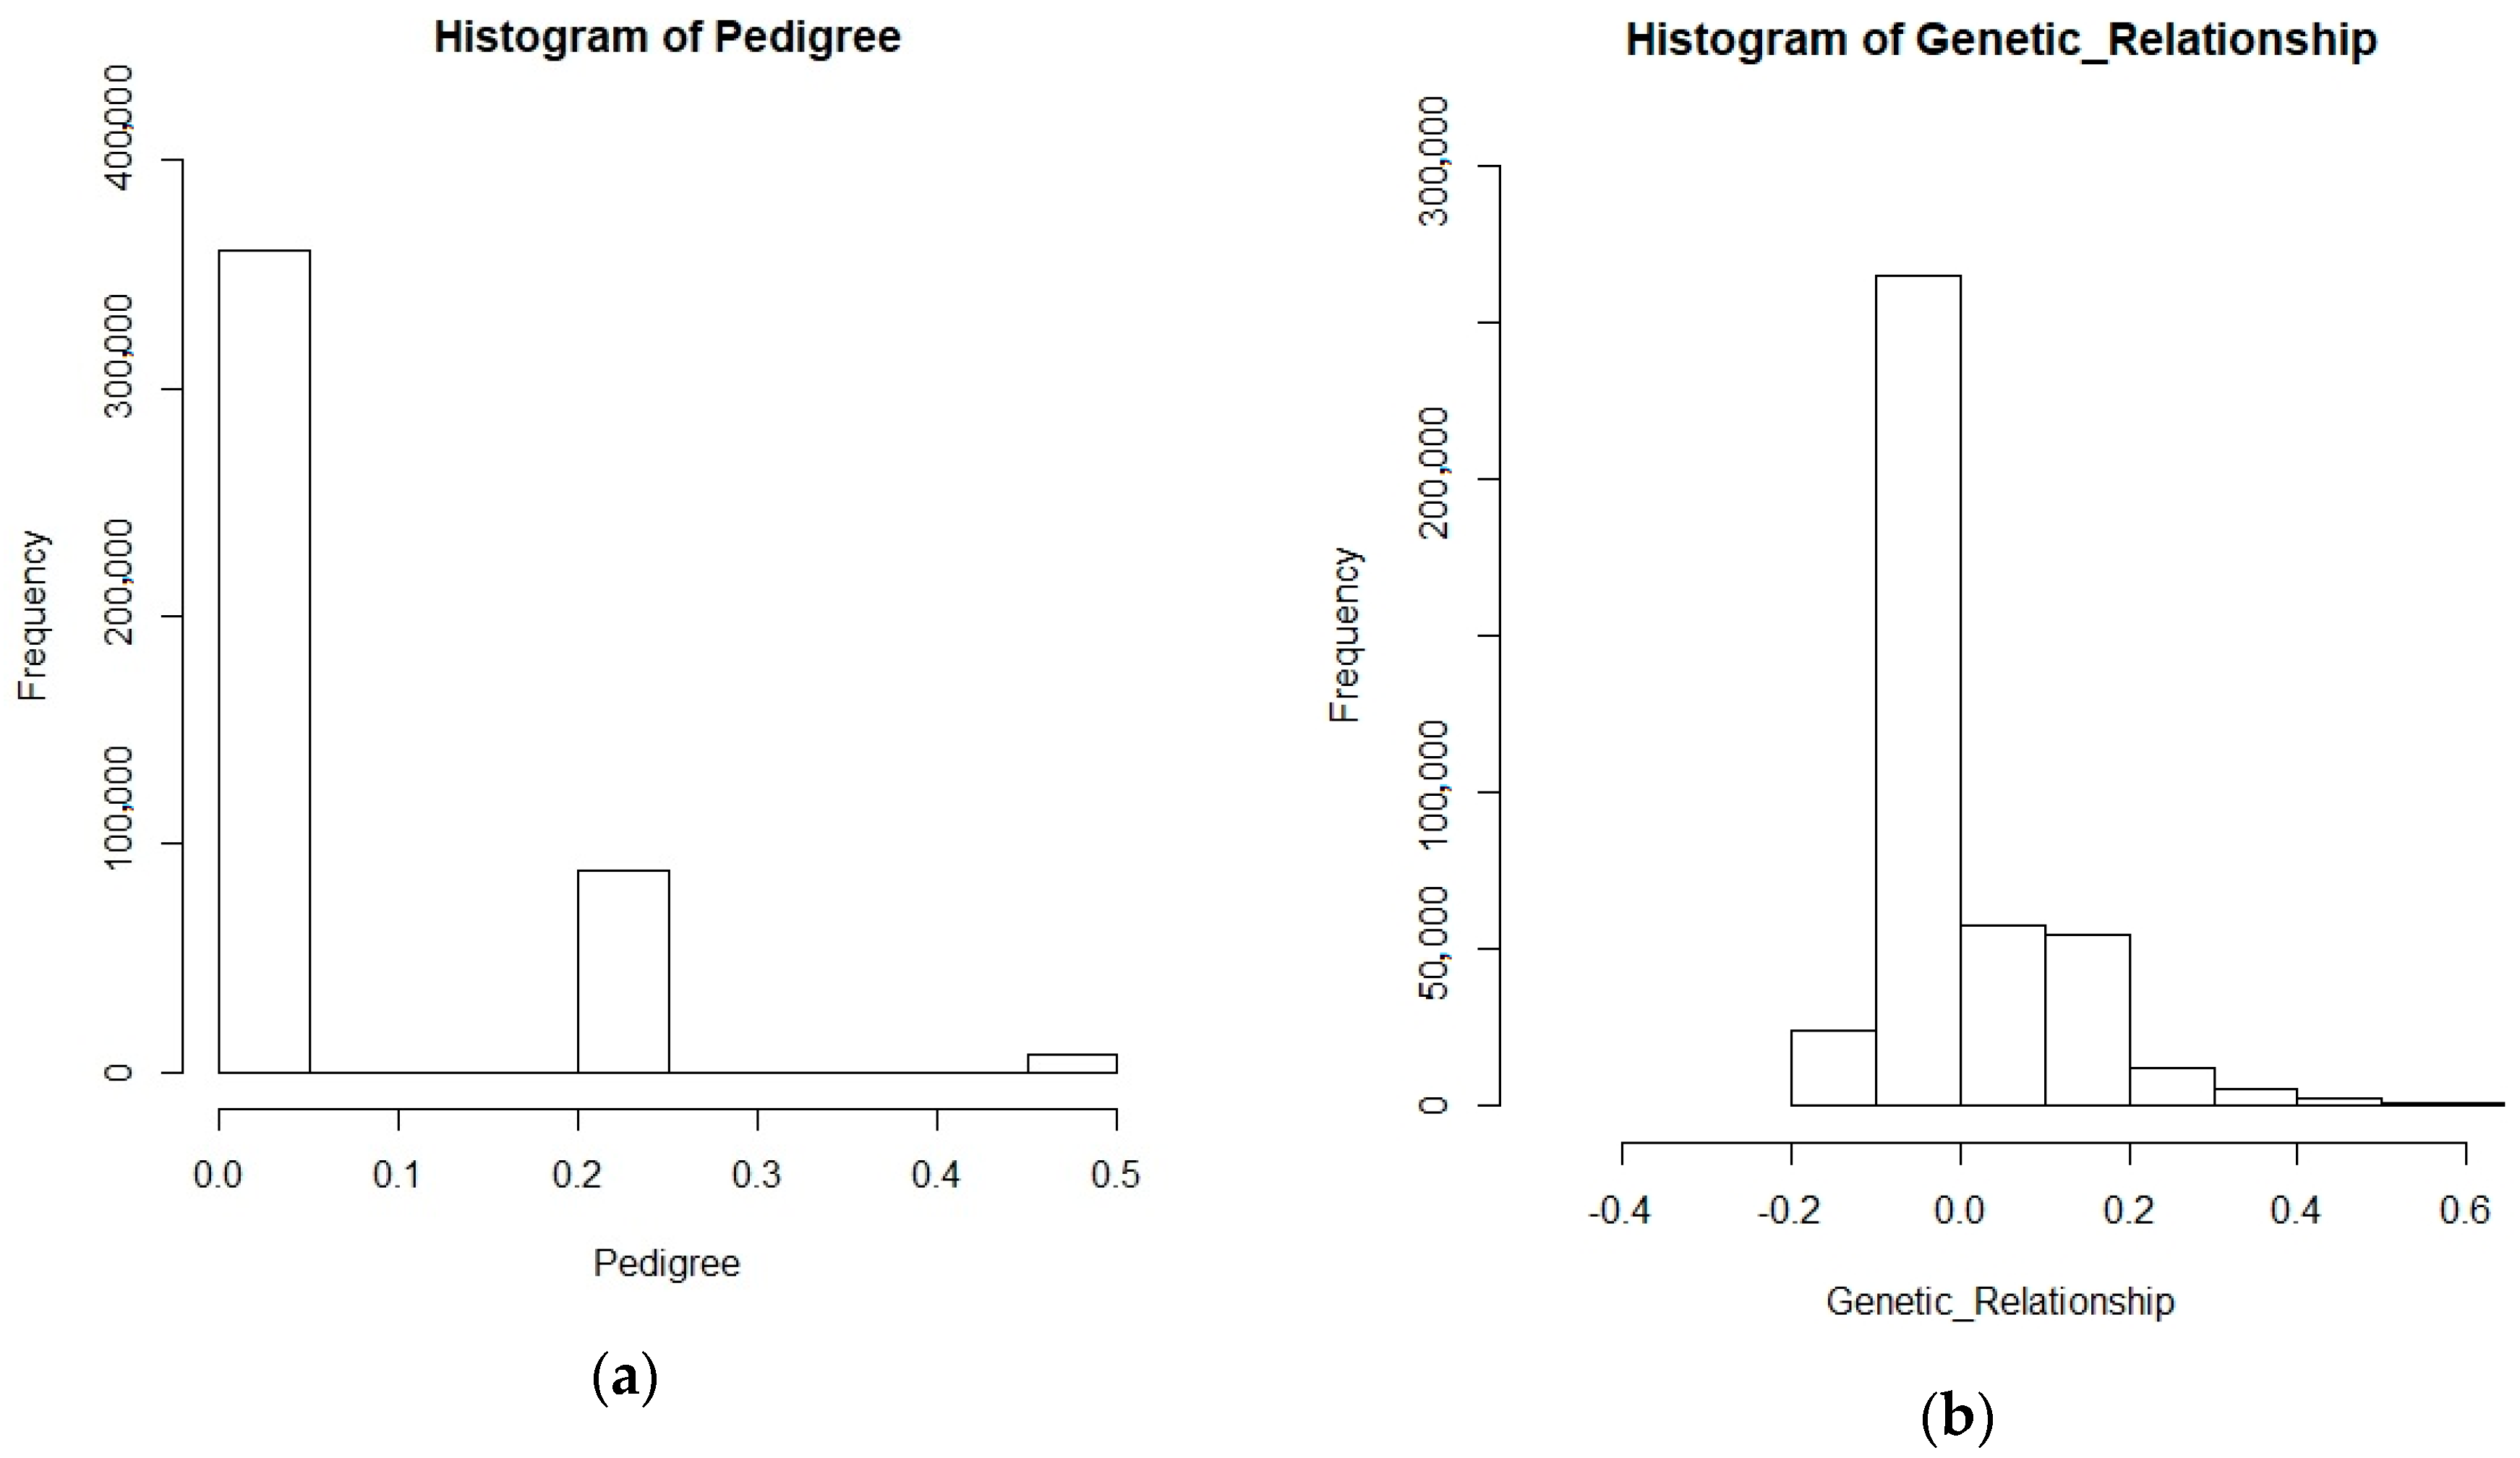
2.6. Validation of Pedigree Data

In an additional analysis, a genomic relationship matrix was calculated to evaluate the consistency between the relatedness coefficient based on pedigree information and genomic information based on SNPs data. The genomic relationship matrix was obtained in R software using the RRBLUP version 4.6 [58] package.

3. Results

3.1. Estimates of Variance Components and Heritability of Growth Traits, Branching Quality and Stem Straightness

The estimates of the variance components (REML) and heritability for branching quality (BQ), stem straightness (ST), total tree height (H), diameter at breast height (DBH) and wood volume (VOL) are presented in Table 2 (BLUP analysis). According to these results, the study traits showed low-to-moderate heritability, with estimates varying from 0.07 to 0.19 for BQ and DBH. The heritability values of all traits were consistent with other breeding populations of E. globulus [60,61,62,63]. Furthermore, these findings were supported by the coefficients of additive genetic variation, which were similar to those found in other studies with E. globulus and Eucalyptus spp. [63,64,65]. The results evidenced that growth traits such (H, DBH, VOL) and stem form traits (ST and BQ) had a low additive genetic control in early stages of E. globulus, which can be usual for populations younger than 5 years [61,62]. In this context, the low heritability found is supporting the use of genomic prediction methods that have the potential to capture a greater proportion of the phenotypic variation during selection cycles.
In this study, the consistence between the frequency distribution of coefficients of genomic and pedigree-based relationship data was additionally evaluated. As expected, the analysis of genomic data revealed that the most of individuals are not related. This result is in agreement with the analysis of pedigree data (Figure 1). However, both relationship matrix (based on genomic and pedigree), showed that several individuals are related with others, and the coefficients were between 0.2–0.3, which reflects the mating design implemented in this breeding population of E. globulus.

3.2. Final Set of Qualified SNPs and Linkage Disequilibrium Decay

After applying the corresponding filters, the final set of markers consisted of 14,442 high-quality SNPs, which were distributed on the 11 chromosomes of E. globulus with an average of 1356 SNPs per chromosome and an average distance of approximately 4000 bp. The genome-wide linkage disequilibrium (LD) decay pattern for the study population is shown in Figure 2. Decay of LD showed a clear nonlinear trend with physical distance. According to these results, the genome-wide LD decayed rapidly within 0.76 Mbp, regarding a threshold value of r2 = 0.1 (p < 0.05). The average LD on all chromosomes was r2 = 0.09. In addition, the 0.15% of total pairs of linked SNPs were in a complete LD (r2 = 1), and the 3% had an r2 value >0.5. Particularly, the LD of chromosome 2 decayed faster than the other linkage groups, and chromosome 11 had the greatest extension of LD, decaying at 1 Mbp (r2 = 0.11) (Table 3). Approximately 3.8% of the marker pairs of each chromosome registered a value of LD (r2) > 0.5. Particularly, 5.6% of the marker pairs of chromosome 11 were found in strong LD (r2 > 0.5).

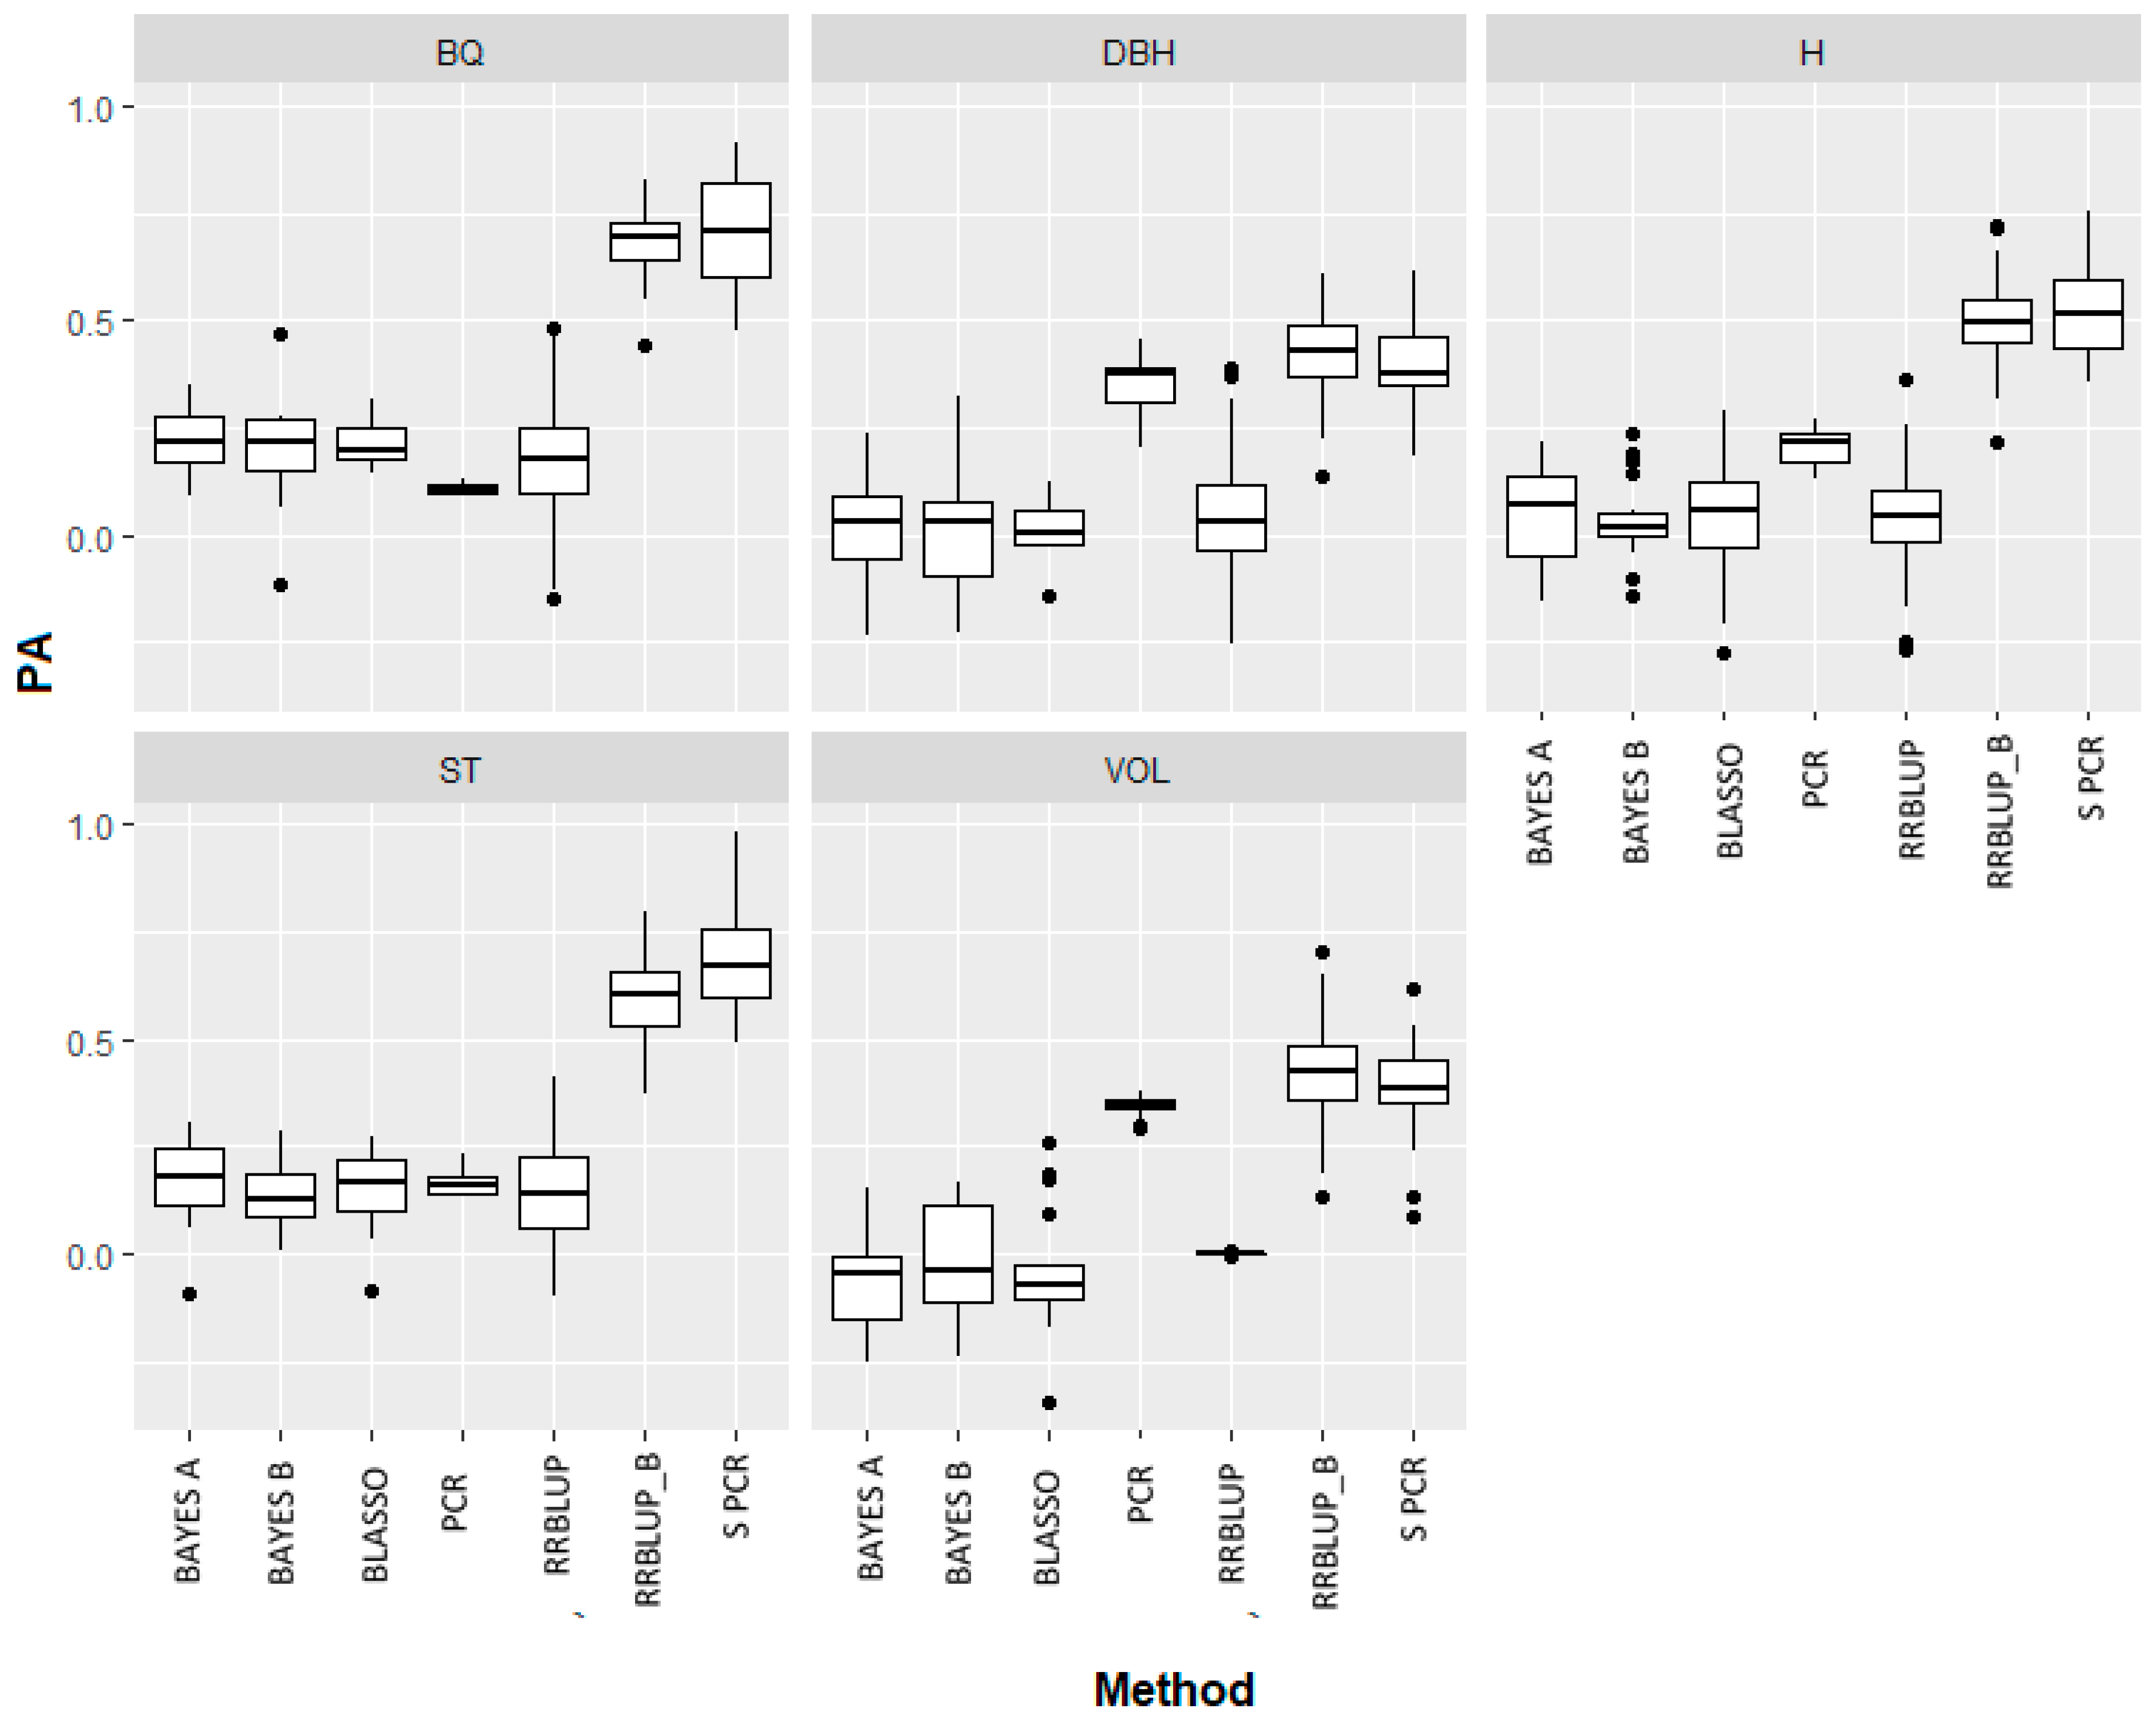
3.3. Predictive Ability of Frequentist, Bayesian and Dimension Reduction Methods

In Table 4 and Figure 3, the predictive ability (PA) values of all the methods under study and each evaluated trait are shown. As expected, PA varied between the seven prediction methods explored here, as well as between the traits under study [43]. The highest PA values were obtained by means of methods of dimension reduction and variable selection (RRBLUP-B and supervised PCR). In the case of RRBLUP-B, PA was increased in all traits by reducing between 94 and 97% the total number of SNP markers (Figure 4). The highest predictive ability values for DBH, VOL, H, ST and BQ were obtained using models based on 450, 900, 850, 800 and 950 SNPs, respectively. In particular, the maximum PA values reached by the RRBLUP, Bayes-A, Bayes-B and BLASSO methods were significantly lower than the rest of the methods, with maximum values corresponding to 0.14 (ST), 0.17 (BQ and ST), 0.24 (BQ) and 0.21 (BQ), respectively. According to the results, more parsimonious models provided a higher prediction of growth and stem form than other predictive models in this population of E. globulus. On the other hand, the RRBLUP and BAYES-A methods performed a greater predictive ability than the BAYES-B and BLASSO methods for growth traits (VOL, DHB and H), and vice versa for stem form traits (BQ and ST).
The importance of each SNP on the studied traits was evaluated according to their effects and individual regression coefficients (Figure 5). The 950, 800, 900, 450 and 850 SNPs that were used to predict the traits under study through the RRBLUP-B model were located mainly in chromosomes 2 (BQ), 2 (ST), 6 (VOL), 11 (DBH), and 8 (H), respectively. The variability of SNPs effects was higher for BQ and ST, and lower for H and DBH. The SNP effects for H and DBH yielded a more homogeneous distribution than the other studied traits, while some SNPs generated an effect at least 75% above the mean of SNP effects for BQ and ST.

4. Discussion

The study population presented a more extended LD than other populations of E. globulus previously studied. For example, Durán et al. [37] found that LD decays within 3000 bp in a clonal population of the species. In contrast, Thavamanikumar et al. [67] found that the LD decays rapidly within 1000 bp in natural populations of E. globulus. The high LD found in the present study may be explained by the fact that most of the families included in the studied population (62/65) were derived from controlled crosses (from an incomplete factorial mating design). The genomic relationship matrix showed that several individuals were tightly related with others; as revealed by the values of relatedness coefficients (estimated between 0.2–0.3), which reflect the mating design implemented in this population of E. globulus. The LD pattern is one of the main factors that contribute to the success of breeding programs that involve GS [27,68,69]. The greater extent of LD in a population results in fewer markers that are needed to find QTLs associated with phenotypic traits, and a more accurate genomic prediction can be obtained. According to Liu et al. [70], populations that present extensive LD in long genomic distances allow for predictions with higher stability. In this context, genomic prediction models may benefit from the genetic structure of the studied population in such a way that the high LD values in their chromosomes could contribute in obtaining models with a relatively high predictive ability.
The results of the present study revealed that the reduction in dimensionality and selection of variables could contribute to obtain predictive models with greater predictive accuracy. Several studies have shown that a subset of selected variables can reasonably increase PA and the reliability of BV estimates predicted by GS [40,71,72]. For example, Long et al. [71], Usai et al. [72] and Weigel et al. [73] found that the maximum accuracy value of a predictive model was obtained by using only 1% to 3% of the total variables. In agreement with present results, Liu et al. [70] reported that closer genetic relationships between the training and validation populations as well as relatively high LD result in the need for fewer markers to achieve greater predictive accuracy. Moreover, the genetic architecture that underlies the study trait also determines the most appropriate method for predicting BV [74,75]. Growth-related traits, such as H, DBH and VOL, have been described as less heritable (h2 < 0.3; in narrow-sense) than other complex traits in E. globulus (e.g., wood quality and chemical properties; h2 > 0.5 [76,77]), which explain the small number of genomic regions or QTLs detected for these traits, in contrast to other traits.
The predictive ability for growth-related traits was maximized by dimension reduction and variable selection methods, while all tested Bayesian methods performed similarly, with the lowest PA values for these traits. Bayes-B and BLASSO are also considered to be methods of variable selection, in which the predictor variables with an effect value closer to zero are removed from the prediction model [59]. Unexpectedly, the Bayes-A method was slightly superior to the previous methods, suggesting that a large number of markers have an effect on the study trait (similar to RRBLUP). In general, the BLASSO and Bayes-B methods have been suggested for the prediction of traits that are controlled by a small number of QTLs and relatively large effects [78,79], while Bayes-A method exploits the prior knowledge that many SNPs have small individual effects on the trait [80]. For the present study, the BLASSO and Bayes-B methods would not be adequate to predict breeding values of DBH, H and VOL because these traits are better represented by an infinitesimal model where the effects are relatively small and homogeneous. On the other hand, the predictive ability of DBH, VOL and H obtained by the PCR method was superior to the Bayesian methods. The PCR method develops the components and/or latent variables identifying linear combinations that present a correlation degree [41], which would explain the response variable considerably. Therefore, these methods can deal with the multicollinearity effects of the predictor variables. Based on the LD pattern results of the study population, approximately 3% of the predictor variables were highly correlated, which may indicate that the main components consisted of SNPs found in LD because their frequencies in the population would be correlated. Notably, the SNPs that play a relatively important role for growth-related traits (RRBLUP-B) were located on all 11 chromosomes, which was consistent with the fact that QTLs detected for growth traits, such as DBH and H of Eucalyptus, have previously been identified in different linkage groups [81,82]. For instance, Bundock et al. [83], Thumma et al. [82] and Gion et al. [84] identified QTLs for DBH and H on chromosomes 2, 5, 6, 8 and 11 in Eucalyptus trees of 4 and 5 years of age, which is consistent with the findings of the present study. In addition, when we ranked the top ten SNPs explaining the phenotypic variation of each trait, three SNPs performed a high effect on DBH and VOL, which is consistent with previous studies of QTL for growth traits in Eucalyptus (e.g., Arriagada et al. [13]). These background and results confirm that the methods involving dimensionality reduction and variable selection (RRBLUP-B, supervised PCR) perform a better predictive ability than the PCR method.
The PA for BQ and ST traits was significantly increased with the use of predictive methods based on dimension reduction and variable selection (RRBLUP-B, supervised PCR) as well as Bayes-B and BLASSO. Bayes-B and BLASSO methods assume that the effects of some SNPs on phenotypic variation tend to be zero; therefore, these SNPs could be removed from regression model [27]. The effects of the markers (expressed in absolute value) of BQ and ST were highly variable, indicating that the variation of these traits may be explained by a combination of QTLs of greater effects and others of lesser effects. Further, the BLASSO and Bayes-B methods were slightly superior to RRBLUP and Bayes-A, supporting the previous hypothesis of that some SNPs with an effect value closer to zero are not important to explain the phenotypic variation of these traits, and they can be removed from the prediction model. To date, no study on Eucalyptus species has reported QTLs associated with BQ. However, in rice [85] and, more recently, in peach [86], the angle of branches and spikes has been found to be controlled by a QTL of greater effect known as TAC1, which provides an estimate of the possible oligogenic inheritance of BQ. Regarding ST, a limited number of QTL studies associated with this trait have been reported for Eucalyptus [13,14]. In agreement with the present findings, Arriagada et al. [13] in a breeding population of Eucalyptus cladocalyx, reported microsatellite markers associated with ST, which were located on chromosome 11.
The results of the genomic prediction of the present study were comparable to previous reports in Eucalyptus species. For instance, in hybrids of E. gradis Hill ex Maiden, E. urophylla S.T. Blake and E. globulus of 3–4 years of age, Resende et al. [30] obtained PA values higher than 0.5 in growth traits using the RRBLUP method. However, the present results involved a smaller number of predictor variables to obtain maximum accuracy. In other Eucalyptus species, Müller et al. [87] obtained a PA for growth-related traits (DBH and VOL) lower than 0.5 in open pollinated families of E. benthamii Maiden & Cambage and E. pellita F. Muell. Regarding other traits relevant to wood production, such as BQ and ST, Isik et al. [88] in another species of interest for the forestry industry (Pinus pinaster Aiton), reported a PA for stem sweep over 0.55, and they obtained the maximum predictive accuracy by non-Bayesian methods.
According to the present results, the methods based on dimensionality reduction in the matrix of predictor variables (i.e., PCR) performed better than traditional prediction methods, such as RRBLUP and Bayesian methods. An advantage of PCR is that no assumptions of prior distribution of marker affects are made [42]. This quality allows PCR to have broad applications in the prediction of phenotypic traits with different genetic architectures. Furthermore, supervised methods tend to be computationally more efficient than unsupervised methods [44] and allow the removal of variables correlated with other predictor variables, but they are irrelevant to explain the variation of the variable response. Prediction models based on variable reduction have been widely used in animal genomic prediction, but their use in plants is scarce [38,89]. Therefore, taking advantage of prediction models that involve dimensionality reduction and variable selection is beneficial.
The results of this study provide new knowledge to assist breeding programs of E. globulus based on growth and wood form traits. We evaluated a progeny trial established under unusual conditions for E. globulus to generate accurate genomic prediction models. In fact, the southern limit of E. globulus in Chile occurs close to the study location, at the central part of the Chilean administrative region of Los Lagos; a region that account for only 4% of the total E. globulus plantations in Chile. In the global context, several regions worldwide will be affected by the climate change, and therefore, it is expected a significant reduction of temperate forests [90,91]. The diversification of plantation areas could represent new opportunities for forest planting that can benefit the local economy.

5. Conclusions

The present GS analysis performed on 4-year-old trees of Eucalyptus globulus found that the dimensionality reduction and variable selection showed a strong impact on the predictive ability. In this sense, the RRBLUP-B and supervised PCR methods provided the highest PA values for all the traits studied. On the other hand, we confirmed that the prediction method depends on the genetic architecture of the trait under study, in which the BLASSO and Bayes-B methods performed better for BQ and ST, while RRBLUP and Bayes-A were more suitable for growth traits. RRBLUP-B as well as supervised PCR allowed increases in PA regardless of the genetic nature of the traits.
The present results are promising in terms of early genetic improvement of E. globulus in unusual regions for the development of the species because the present study was conducted in one of the southernmost sites for the species. Finally, the genomic prediction approach based on dimensionality reduction and variable selection has been scarcely explored in woody species, such as Eucalyptus, and it was shown to be a promising method, considering the early growth and the low heritability values.

Author Contributions

Conceptualization, F.P.G., R.H. and F.M.; Data curation, P.B. and N.S.; Formal analysis, P.B. and F.M.; Funding acquisition, N.S. and F.M.; Methodology, P.B., F.P.G., R.H. and F.M.; Project administration, F.M.; Resources, N.S. and F.M.; Supervision, F.P.G., R.H. and F.M.; Writing—original draft, P.B.; Writing—review and editing, P.B. and F.M.

Funding

The study was supported by FONDECYT (grant number 1170695) and Semillas Imperial SpA.

Acknowledgments

We would like to thank FONDECYT (grant number 1170695) and Semillas Imperial SpA. Paulina Ballesta thanks CONICYT-PCHA/Doctorado Nacional/año 2016-folio 21160624.

Conflicts of Interest

The authors declare no conflict of interest.

References

  1. Drake, J.E.; Aspinwall, M.J.; Pfautsch, S.; Rymer, P.D.; Reich, P.B.; Smith, R.A.; Crous, K.Y.; Tissue, D.T.; Ghannoum, O.; Tjoelker, M.G. The capacity to cope with climate warming declines from temperate to tropical latitudes in two widely distributed Eucalyptus species. Glob. Chang. Biol. 2015, 21, 459–472. [Google Scholar] [CrossRef] [PubMed]
  2. Mora, F.; Arriagada, O.; Ballesta, P.; Ruiz, E. Genetic diversity and population structure of a drought-tolerant species of Eucalyptus, using microsatellite markers. J. Plant Biochem. Biotechnol. 2017, 26, 274–281. [Google Scholar] [CrossRef]
  3. Paiva, J.A.; Prat, E.; Vautrin, S.; Santos, M.D.; San Clemente, H.; Brommonschenkel, S.; Fonseca, P.G.S.; Grattapaglia, D.; Song, X.; Ammiraju, J.S.S.; et al. Advancing Eucalyptus genomics: Identification and sequencing of lignin biosynthesis genes from deep-coverage BAC libraries. BMC Genom. 2011, 12, 137. [Google Scholar] [CrossRef] [PubMed]
  4. Foster, S.A.; McKinnon, G.E.; Steane, D.A.; Potts, B.M. Parallel evolution of dwarf ecotypes in the forest tree Eucalyptus globulus. New Phytol. 2007, 175, 370–380. [Google Scholar] [CrossRef] [PubMed]
  5. Dutkowski, G.W.; Potts, B.M. Geographic patterns of genetic variation in Eucalyptus globulus ssp. globulus and a revised racial classification. Aust. J. Bot. 1999, 47, 237–263. [Google Scholar] [CrossRef]
  6. Tibbits, W.N.; White, T.L.; Hodge, G.R.; Borralho, N.M. Genetic variation in frost resistance of Eucalyptus globulus ssp. globulus assessed by artificial freezing in winter. Aust. J. Bot. 2006, 54, 521–529. [Google Scholar] [CrossRef]
  7. Lanfranco, D.; Dungey, H.S. Insect damage in Eucalyptus: A review of plantations in Chile. Aust. Ecol. 2001, 26, 477–481. [Google Scholar] [CrossRef]
  8. Navarrete-Campos, D.; Bravo, L.A.; Rubilar, R.A.; Emhart, V.; Sanhueza, R. Drought effects on water use efficiency, freezing tolerance and survival of Eucalyptus globulus and Eucalyptus globulus × nitens cuttings. New For. 2013, 44, 119–134. [Google Scholar] [CrossRef]
  9. Fernández, M.; Valenzuela, S.A.; Arora, R.; Chen, K. Isolation and characterization of three cold acclimation-responsive dehydrin genes from Eucalyptus globulus. Tree Genet. Genom. 2012, 8, 149–162. [Google Scholar] [CrossRef]
  10. Castillo, R.; Otto, M.; Freer, J.; Valenzuela, S. Multivariate strategies for classification of Eucalyptus globulus genotypes using carbohydrates content and NIR spectra for evaluation of their cold resistance. J. Chem. Soc. 2008, 22, 268–280. [Google Scholar]
  11. Tambarussi, E.V.; Pereira, F.B.; Da Silva, P.H.M.; Lee, D.; Bush, D. Are tree breeders properly predicting genetic gain? A case study involving Corymbia species. Euphytica 2018, 214, 150. [Google Scholar] [CrossRef]
  12. Grattapaglia, D.; Resende, M.D. Genomic selection in forest tree breeding. Tree Genet. Genom. 2011, 7, 241–255. [Google Scholar] [CrossRef]
  13. Arriagada, O.; Mora, F.; Amaral Junior, A.T. Thirteen years under arid conditions: Exploring marker-trait associations in Eucalyptus cladocalyx for complex traits related to flowering, stem form and growth. Breed. Sci. 2018, 68, 367–374. [Google Scholar] [CrossRef] [PubMed]
  14. Ballesta, P.; Mora, F.; Ruiz, E.; Contreras-Soto, R. Marker-trait associations for survival, growth, and flowering components in Eucalyptus cladocalyx under arid conditions. Biol. Plant. 2015, 59, 389–392. [Google Scholar] [CrossRef]
  15. Bartholomé, J.; Salmon, F.; Vigneron, P.; Bouvet, J.M.; Plomion, C.; Gion, J.M. Plasticity of primary and secondary growth dynamics in Eucalyptus hybrids: A quantitative genetics and QTL mapping perspective. BMC Plant Biol. 2013, 13, 120–133. [Google Scholar] [CrossRef] [PubMed]
  16. Cappa, E.P.; El-Kassaby, Y.A.; Garcia, M.N.; Acuña, C.; Borralho, N.M.G.; Grattapaglia, D.; Marcucci-Poltri, S.N. Impacts of population structure and analytical models in genome-wide association studies of complex traits in forest trees: A case study in Eucalyptus globulus. PLoS ONE 2013, 8, e81267. [Google Scholar] [CrossRef] [PubMed]
  17. Carocha, V.; Soler, M.; Hefer, C.; Cassan-Wang, H.; Fevereiro, P.; Myburg, A.A.; Paiva, J.A.; Grima-Pettenati, J. Genome-wide analysis of the lignin toolbox of Eucalyptus grandis. New Phytol. 2015, 206, 1297–1313. [Google Scholar] [CrossRef] [PubMed]
  18. Isik, F. Genomic selection in forest tree breeding: The concept and an outlook to the future. New For. 2014, 45, 379–401. [Google Scholar] [CrossRef]
  19. Beaulieu, J.; Doerksen, T.; Clément, S.; MacKay, J.; Bousquet, J. Accuracy of genomic selection models in a large population of open-pollinated families in white spruce. Heredity 2014, 113, 343. [Google Scholar] [CrossRef] [PubMed]
  20. Heffner, E.L.; Lorenz, A.J.; Jannink, J.L.; Sorrells, M.E. Plant breeding with genomic selection: Gain per unit time and cost. Crop Sci. 2010, 50, 1681–1690. [Google Scholar] [CrossRef]
  21. Neale, D.B.; Kremer, A. Forest tree genomics: Growing resources and applications. Nat. Rev. Genet. 2011, 12, 111. [Google Scholar] [CrossRef] [PubMed]
  22. Beaulieu, J.; Doerksen, T.K.; MacKay, J.; Rainville, A.; Bousquet, J. Genomic selection accuracies within and between environments and small breeding groups in white spruce. BMC Genom. 2014, 15, 1048. [Google Scholar] [CrossRef] [PubMed]
  23. Ratcliffe, B.; El-Dien, O.G.; Klápště, J.; Porth, I.; Chen, C.; Jaquish, B.; El-Kassaby, Y.A. A comparison of genomic selection models across time in interior spruce (Picea engelmannii× glauca) using unordered SNP imputation methods. Heredity 2015, 115, 547. [Google Scholar] [CrossRef] [PubMed]
  24. Ukrainetz, N.K.; Ritland, K.; Mansfield, S.D. Identification of quantitative trait loci for wood quality and growth across eight full-sib coastal Douglas-fir families. Tree Genet. Genom. 2008, 4, 159–170. [Google Scholar] [CrossRef]
  25. Mamani, E.M.; Bueno, N.W.; Faria, D.A.; Guimarães, L.M.; Lau, D.; Alfenas, A.C. Positioning of the major locus for Puccinia psidii rust resistance (Ppr1) on the Eucalyptus reference map and its validation across unrelated pedigrees. Tree Genet. Genom. 2010, 6, 953–962. [Google Scholar] [CrossRef]
  26. Heffner, E.L.; Jannink, J.L.; Sorrells, M.E. Genomic selection accuracy using multifamily prediction models in a wheat breeding program. Plant Genom. 2011, 4, 65–75. [Google Scholar] [CrossRef]
  27. Meuwissen, T.H.; Hayes, B.J.; Goddard, M.E. Prediction of total genetic value using genome-wide dense marker maps. Genetics 2001, 157, 1819–1829. [Google Scholar] [PubMed]
  28. De Los Campos, G.; Sorensen, D.; Gianola, D. Genomic Heritability: What Is It? PLoS Genet. 2015, 11, e1005048. [Google Scholar] [CrossRef] [PubMed]
  29. Daetwyler, H.D.; Calus, M.P.L.; Pong-Wong, R.; De Los Campos, G.; Hickey, J.M. Genomic prediction in animals and plants: Simulation of data, validation, reporting, and benchmarking. Genetics 2013, 193, 347–365. [Google Scholar] [CrossRef] [PubMed]
  30. Resende, M.D.; Resende, M.F.; Sansaloni, C.P.; Petroli, C.D.; Missiaggia, A.A.; Aguiar, A.M.; Abad, J.M.; Takahashi, E.K.; Rosado, A.M.; Faria, D.A.; et al. Genomic selection for growth and wood quality in Eucalyptus: Capturing the missing heritability and accelerating breeding for complex traits in forest trees. New Phytol. 2012, 194, 116–128. [Google Scholar] [CrossRef] [PubMed]
  31. Suontama, M.; Klápště, J.; Telfer, E.; Graham, N.; Stovold, T.; Low, C.; McKinley, R.; Dungey, H. Efficiency of genomic prediction across two Eucalyptus nitens seed orchards with different selection histories. Heredity 2018. [Google Scholar] [CrossRef]
  32. Grattapaglia, D. Breeding forest trees by genomic selection: Current progress and the way forward. Genom. Plant Genet. Resour. 2014, 1, 651–682. [Google Scholar]
  33. Iwata, H.; Hayashi, T.; Tsumura, Y. Prospects for genomic selection in conifer breeding: A simulation study of Cryptomeria japonica. Tree Genet. Genom. 2011, 7, 747–758. [Google Scholar] [CrossRef]
  34. Zhong, S.; Dekkers, J.C.; Fernando, R.L.; Jannink, J.L. Factors affecting accuracy from genomic selection in populations derived from multiple inbred lines: A barley case study. Genetics 2009, 182, 355–364. [Google Scholar] [CrossRef] [PubMed]
  35. Tibshirani, R. Regression shrinkage and selection via the lasso. J. R. Stat. Soc. 1996, 58, 267–288. [Google Scholar] [CrossRef]
  36. VanRaden, P.M. Efficient methods to compute genomic predictions. J. Dairy Sci. 2008, 91, 4414–4423. [Google Scholar] [CrossRef] [PubMed]
  37. Durán, R.; Isik, F.; Zapata-Valenzuela, J.; Balocchi, C.; Valenzuela, S. Genomic predictions of breeding values in a cloned Eucalyptus globulus population in Chile. Tree Genet. Genom. 2007, 13, 74. [Google Scholar] [CrossRef]
  38. Resende-Junior, M.F.R.; Muñoz, P.; Resende, M.D.V.; Garrick, D.J.; Fernando, R.L.; Davis, J.M.; Jokela, E.J.; Martin, T.A.; Peter, G.F.; Kirst, M. Accuracy of genomic selection methods in a standard data set of loblolly pine (Pinus taeda L.). Genetics 2012, 190, 1503–1510. [Google Scholar] [CrossRef] [PubMed]
  39. Macciotta, N.P.; Gaspa, G.; Steri, R.; Pieramati, C.; Carnier, P.; Dimauro, C. Pre-selection of most significant SNPS for the estimation of genomic breeding values. BMC Proc. 2009, 3, 14. [Google Scholar] [CrossRef]
  40. Arojju, S.K.; Conaghan, P.; Barth, S.; Milbourne, D.; Casler, M.D.; Hodkinson, T.R.; Michel, T.; Byrne, S.L. Genomic prediction of crown rust resistance in Lolium perenne. BMC Genet. 2018, 19, 35. [Google Scholar] [CrossRef] [PubMed]
  41. Long, N.; Gianola, D.; Rosa, G.J.M.; Weigel, K.A. Dimension reduction and variable selection for genomic selection: Application to predicting milk yield in Holsteins. J. Anim. Breed. Genet. 2011, 128, 247–257. [Google Scholar] [CrossRef] [PubMed]
  42. Solberg, T.R.; Sonesson, A.K.; Woolliams, J.A.; Meuwissen, T.H. Reducing dimensionality for prediction of genome-wide breeding values. Genet. Sel. Evol. 2009, 41, 29. [Google Scholar] [CrossRef] [PubMed] [Green Version]
  43. Du, C.; Wei, J.; Wang, S.; Jia, Z. Genomic selection using principal component regression. Heredity 2018, 121, 12–23. [Google Scholar] [CrossRef] [PubMed]
  44. Azevedo, C.F.; Silva, F.; Resende, M.D.; Lopes, M.S.; Duijvesteijn, S.E.; Lopes, P.S.; Kelly, M.J.; Viana, J.M.; Knol, E.F. Supervised independent component analysis as an alternative method for genomic selection in pigs. J. Anim. Breed. Genet. 2014, 131, 452–461. [Google Scholar] [CrossRef] [PubMed]
  45. Doyle, J.J.; Doyle, J.L. Isolation of plant DNA from fresh tissue. Focus 1990, 12, 13–15. [Google Scholar]
  46. Porebski, S.; Bailey, L.G.; Baum, B.R. Modification of a CTAB DNA extraction protocol for plants containing high polysaccharide and polyphenol components. Plant Mol. Biol. Rep. 1997, 15, 8–15. [Google Scholar] [CrossRef]
  47. Silva-Junior, O.B.; Faria, D.A.; Grattapaglia, D.A. Flexible multi-species genome-wide 60K SNP chip developed from pooled resequencing of 240 Eucalyptus tree genomes across 12 species. New Phytol. 2015, 206, 1527–1540. [Google Scholar] [CrossRef] [PubMed]
  48. Mangin, B.; Siberchicot, A.; Nicolas, S.; Doligez, A.; This, P.; Cierco-Ayrolles, C. Novel measures of linkage disequilibrium that correct the bias due to population structure and relatedness. Heredity 2012, 108, 285. [Google Scholar] [CrossRef] [PubMed]
  49. Hill, W.G.; Weir, B.S. Variances and covariances of squared linkage disequilibria in finite populations. Theor. Popul. Biol. 1988, 33, 54–78. [Google Scholar] [CrossRef]
  50. Myburg, A.A.; Grattapaglia, D.; Tuskan, G.A.; Hellsten, U.; Hayes, R.D.; Grimwood, J.; Jenkins, J.; Lindquist, E.; Tice, H.; Bauer, D.; et al. The genome of Eucalyptus grandis. Nature 2014, 510, 356. [Google Scholar] [CrossRef] [PubMed]
  51. Gilmour, A.R.; Gogel, B.J.; Cullis, B.R.; Welham, S. ASReml User Guide Release 4.1 Structural Specification. 2015. Available online: https://www.vsni.co.uk/downloads/asreml/release4/UserGuideStructural.pdf (accessed on 13 April 2018).
  52. Wang, X.; Yang, Z.; Xu, C. A comparison of genomic selection methods for breeding value prediction. Sci. Bull. 2015, 60, 925–935. [Google Scholar] [CrossRef]
  53. Pant, S.; Schenkel, F.S.; Verschoor, C.P.; You, Q. A principal component regression based genome wide analysis approach reveals the presence of a novel QTL on BTA7 for MAP resistance in holstein cattle. Genomics 2010, 95, 176–182. [Google Scholar] [CrossRef] [PubMed] [Green Version]
  54. Bair, E.; Hastie, T.; Paul, D.; Tibshirani, R. Prediction by supervised principal components. J. Am. Stat. Assoc. 2006, 101, 119–137. [Google Scholar] [CrossRef]
  55. Chun, H.; Keleş, S. Sparse partial least squares regression for simultaneous dimension reduction and variable selection. J. R. Stat. Soc. B 2010, 72, 3–25. [Google Scholar] [CrossRef] [PubMed] [Green Version]
  56. Lê Cao, K.A.; Rossouw, D.; Robert-Granié, C.; Besse, P. A sparse PLS for variable selection when integrating omics data. Stat. Appl. Genet. Mol. B 2008, 7, 37. [Google Scholar] [CrossRef] [PubMed]
  57. Mevik, B.H.; Wehrens, R. The pls package: Principal component and partial least squares regression in R. J. Stat. Softw. 2007, 18, 1–24. [Google Scholar] [CrossRef]
  58. Endelman, J.B. Ridge regression and other kernels for genomic selection with R. package rrBLUP. Plant Genome 2011, 4, 250–255. [Google Scholar] [CrossRef]
  59. Pérez, P.; de los Campos, G.; Crossa, J.; Gianola, D. Genomic-enabled prediction based on molecular markers and pedigree using the Bayesian linear regression package in R. Plant Genome 2010, 3, 106–116. [Google Scholar] [CrossRef] [PubMed]
  60. Li, Y.; Dutkowski, G.W.; Apiolaza, L.A.; Pilbeam, D. The genetic architecture of a Eucalyptus globulus full-sib breeding population in Australia. For. Genet. 2007, 12, 167–179. [Google Scholar]
  61. Costa e Silva, J.C.; Hardner, C.; Potts, B.M. Genetic variation and parental performance under inbreeding for growth in Eucalyptus globulus. Ann. For. Sci. 2010, 67, 606. [Google Scholar] [CrossRef]
  62. Callister, A.N.; England, N.; Collins, S. Genetic analysis of Eucalyptus globulus diameter, straightness, branch size, and forking in Western Australia. Can. J. For. Res. 2011, 41, 1333–1343. [Google Scholar] [CrossRef]
  63. Mora, F.; Serra, N. Bayesian estimation of genetic parameters for growth, stem straightness, and survival in Eucalyptus globulus on an Andean Foothill site. Tree Genet. Genom. 2014, 10, 711–719. [Google Scholar] [CrossRef]
  64. Blackburn, D.; Farrell, R.; Hamilton, M.; Volker, P. Genetic improvement for pulpwood and peeled veneer in Eucalyptus nitens. Can. J. For. Res. 2012, 42, 1724–1732. [Google Scholar] [CrossRef]
  65. Blackburn, D.P.; Hamilton, M.G.; Harwood, C.E.; Baker, T.G. Assessing genetic variation to improve stem straightness in Eucalyptus globulus. Ann. For. Sci. 2013, 70, 461–470. [Google Scholar] [CrossRef]
  66. Burdon, R.D. Short note: Coefficients of variation in variables with bounded scales. Silvae Genet. 2008, 57, 179–180. [Google Scholar] [CrossRef]
  67. Thavamanikumar, S.; McManus, L.J.; Tibbits, J.F.; Bossinger, G. The significance of single nucleotide polymorphisms (SNPs) in Eucalyptus globulus breeding programs. Aust. For. 2013, 74, 23–29. [Google Scholar] [CrossRef]
  68. Brito, F.V.; Neto, J.B.; Sargolzaei, M.; Cobuci, J.A. Accuracy of genomic selection in simulated populations mimicking the extent of linkage disequilibrium in beef cattle. BMC Genet. 2011, 12, 80. [Google Scholar] [CrossRef] [PubMed]
  69. Habier, D.; Fernando, R.; Garrick, D. Genomic BLUP decoded: A look into the black box of genomic prediction. Genetics 2013, 194, 597–607. [Google Scholar] [CrossRef] [PubMed]
  70. Liu, H.; Zhou, H.; Wu, Y.; Li, X.; Zhao, J.; Zuo, T.; Zhang, X.; Zhang, Y.; Liu, S.; Shen, Y.; et al. The impact of genetic relationship and linkage disequilibrium on genomic selection. PLoS ONE 2015, 10, e0132379. [Google Scholar] [CrossRef] [PubMed]
  71. Long, N.; Gianola, D.; Rosa, G.J.M.; Weigel, K.A. Machine learning classification procedure for selecting SNPs in genomic selection: Application to early mortality in broilers. J. Anim. Breed. Genet. 2007, 124, 377–389. [Google Scholar] [CrossRef] [PubMed]
  72. Usai, M.G.; Goddard, M.E.; Hayes, B.J. LASSO with cross-validation for genomic selection. Genet. Res. 2009, 91, 427–436. [Google Scholar] [CrossRef] [PubMed]
  73. Weigel, K.A.; de los Campos, G.; González-Recio, O.; Naya, H.; Wu, X.L.; Long, N.; Rosa, G.J.; Gianola, D. Predictive ability of direct genomic values for lifetime net merit of Holstein sires using selected subsets of single nucleotide polymorphism markers. J. Dairy Sci. 2009, 92, 5248–5257. [Google Scholar] [CrossRef] [PubMed]
  74. Spindel, J.; Begum, H.; Akdemir, D.; Virk, P.; Collard, B.; Redoña, E.; Atlin, G.; Jannink, J.L.; McCouch, S.R. Genomic selection and association mapping in rice (Oryza sativa): Effect of trait genetic architecture, training population composition, marker number and statistical model on accuracy of rice genomic selection in elite, tropical rice breeding lines. PLoS Genet. 2015, 11, e1004982. [Google Scholar]
  75. Wimmer, V.; Lehermeier, C.; Albrecht, T.; Auinger, H.J.; Wang, Y.; Schon, C.C. Genome-wide prediction of traits with different genetic architecture through efficient variable selection. Genetics 2013, 113, 573–587. [Google Scholar] [CrossRef] [PubMed]
  76. Stackpole, D.J.; Vaillancourt, R.E.; de Aguigar, M.; Potts, B.M. Age trends in genetic parameters for growth and wood density in Eucalyptus globulus. Tree Genet. Genom. 2010, 6, 179–193. [Google Scholar] [CrossRef]
  77. Stackpole, D.J.; Vaillancourt, R.E.; Alves, A.; Rodrigues, J.; Potts, B.M. Genetic variation in the chemical components of Eucalyptus globulus wood. G3: Genes Genom. Genet. 2011, 1, 151–159. [Google Scholar] [CrossRef] [PubMed]
  78. Daetwyler, H.D.; Pong-Wong, R.; Villanueva, B.; Woolliams, J.A. The impact of 539 genetic architecture on genome-wide evaluation methods. Genetics 2010, 185, 1021–1031. [Google Scholar] [CrossRef] [PubMed]
  79. Jannink, J.L.; Lorenz, A.J.; Iwata, H. Genomic selection in plant breeding: From 566 theory to practice. Brief. Funct. Genom. 2010, 9, 166–177. [Google Scholar] [CrossRef] [PubMed]
  80. Colombani, C.; Croiseau, P.; Fritz, S.; Guillaume, F.; Legarra, A.; Ducrocq, V.; Robert-Granié, C. Comparison of partial least squares (PLS) and sparse PLS regressions in genomic selection in French dairy cattle. J. Dairy Sci. 2012, 95, 2120–2131. [Google Scholar] [CrossRef] [PubMed]
  81. Freeman, J.S.; Potts, B.M.; Downes, G.M.; Pilbeam, D. Stability of quantitative trait loci for growth and wood properties across multiple pedigrees and environments in Eucalyptus globulus. New Phytol. 2013, 198, 1121–1134. [Google Scholar] [CrossRef] [PubMed]
  82. Thumma, B.R.; Baltunis, B.S.; Bell, J.C.; Emebiri, L.C. Quantitative trait locus (QTL) analysis of growth and vegetative propagation traits in Eucalyptus nitens full-sib families. Tree Genet. Genom. 2010, 6, 877–889. [Google Scholar] [CrossRef]
  83. Bundock, P.C.; Potts, B.M.; Vaillancourt, R.E. Detection and stability of quantitative trait loci (QTL) in Eucalyptus globulus. Tree Genet. Genom. 2008, 24, 85–95. [Google Scholar] [CrossRef]
  84. Gion, J.M.; Carouché, A.; Deweer, S.; Bedon, F.; Pichavant, F.; Charpentier, J.P.; Bailleres, H.; Rozenberg, P.; Carocha, V.; Ognouabi, N.; et al. Comprehensive genetic dissection of wood properties in a widely-grown tropical tree: Eucalyptus. BMC Genom. 2011, 12, 301. [Google Scholar] [CrossRef] [PubMed]
  85. Yu, B.; Lin, Z.; Li, H.; Li, X.; Li, J.; Wang, Y.; Zhang, X.; Zhu, Z.; Zhai, W.; Wang, X.; et al. TAC1, a major quantitative trait locus controlling tiller angle in rice. Plant J. 2007, 52, 891–898. [Google Scholar] [CrossRef] [PubMed]
  86. Dardick, C.; Callahan, A.; Horn, R.; Ruiz, K.B.; Zhebentyayeva, T.; Hollender, C.; Whitaker, M.; Abbott, A.; Scorza, R. PpeTAC1 promotes the horizontal growth of branches in peach trees and is a member of a functionally conserved gene family found in diverse plants species. Plant J. 2013, 75, 618–630. [Google Scholar] [CrossRef] [PubMed] [Green Version]
  87. Müller, B.S.; Neves, L.G.; de Almeida Filho, J.E.; Resende, M.F.; Muñoz, P.R.; Dos Santos, P.E.T.; Filho, E.P.; Kirst, M.; Grattapaglia, D. Genomic prediction in contrast to a genome-wide association study in explaining heritable variation of complex growth traits in breeding populations of Eucalyptus. BMC Genom. 2017, 18, 524. [Google Scholar] [CrossRef] [PubMed]
  88. Isik, F.; Bartholomé, J.; Farjat, A.; Chancerel, E.; Raffin, A.; Sanchez, L.; Plomion, C.; Bouffier, L. Genomic selection in maritime pine. Plant Sci. 2016, 242, 108–119. [Google Scholar] [CrossRef] [PubMed]
  89. Iwata, H.; Ebana, K.; Uga, Y.; Hayashi, T. Genomic prediction of biological shape: Elliptic fourier analysis and kernel partial least squares (PLS) regression applied to grain shape prediction in rice (Oryza sativa L.). PLoS ONE 2015, 10, e0120610. [Google Scholar] [CrossRef] [PubMed]
  90. Estrada-Contreras, I.; Equihua, M.; Castillo-Campos, G.; Rojas-Soto, O. Climate change and effects on vegetation in Veracruz, Mexico: An approach using ecological niche modelling. Acta Bot. Mex. 2015, 112, 73–93. [Google Scholar] [CrossRef]
  91. Woillez, M.N.; Kageyama, M.; Combourieu-Nebout, N.; Krinner, G. Simulating the vegetation response in western Europe to abrupt climate changes under glacial background conditions. Biogeosciences 2013, 10, 1561–1582. [Google Scholar] [CrossRef] [Green Version]
Figure 1. Distribution of pedigree (a) and genetic relationship values (b) for the breeding population studied.
Forests 09 00779 g001
Figure 2. Genome-wide linkage disequilibrium (LD) decay pattern for the study population of Eucalyptus globulus. Labill. Pairwise LD values expressed by r2; LD (R2), as adjusted according to Hill and Weir [53] (curve colored by black). Distance (bp) is the distance between SNP pairs. The LD threshold of r2 = 0.1 is indicated with a dotted line.
Forests 09 00779 g002
Figure 3. Box plot of adjusted means for the predictive ability (PA) of seven GS methods for branching quality (BQ), stem straightness (ST), wood volume (VOL), diameter at breast height (DBH) and tree height (H).
Forests 09 00779 g003
Figure 4. Predictive ability (PA) of the RRBLUP-B method (without cross-validation), where n SNPs corresponds to a subset of markers for (a) tree height (H), (b) diameter at breast height (DBH), (c) branching quality (BQ), (d) stem straightness (ST) and (e) stem volume (VOL).
Forests 09 00779 g004
Figure 5. Absolute values of the SNP effects (n = 14,442) estimated by RRBLUP (without cross-validation) for (a) wood volume, (b) stem straightness, (c) branching quality, (d) diameter at breast height, and (e) tree height.
Forests 09 00779 g005
Table 1. Site conditions of La Poza, municipality of Purranque, Chilean administrative region of Los Lagos.
Site ConditionsMetrics
Coordinates40°57′ S, 73°30′ W
Climate TypeOceanic or marine
Annual Temperature13 °C
Average temperature in coldest months6 °C
Average temperature in warmest months16 °C
Annual accumulated rainfall1282 mm
Altitude326 masl
Table 2. Restricted Maximum Likelihood (REML) estimates of variance components and narrow-sense heritability (standard error in parenthesis) for stem straightness (ST), branching quality (BQ), total tree height (H), diameter at breast height (DBH) and stem volume (VOL), evaluated in full- and half-sib families of Eucalyptus globulus Labill. REML: Restricted Maximum Likelihood, CVa: coefficients of additive genetic variation.
REML EstimatesSTBQHDBHVOL
Additive variance0.1940.0730.1070.6930.00001
Residual variance1.0001.0000.7773.010.00006
Heritability0.162 (0.03)0.068 (0.02)0.121 (0.04)0.187 (0.06)0.156 (0.05)
CVa17.6 *11.0 *5.038.518.7
* Corrected according to Burdon [66].
Table 3. LD estimates (corrected by the relatedness) for each chromosome. Distance (Mbp) and r2 express the average values of genomic distance and LD between pairs of markers. Max. r2 and Min. r2 correspond to the maximum and minimum LD values, respectively, found between each pair of markers. Dist. Max and Dist. Min represent the maximum and minimum distance between markers found in LD, respectively. CH is the number of chromosome of Eucalyptus.
CHr2Max. r2Min. r2Distance (Mbp)Dist. Max (Mbp)Dist. Min (Mbp)
10.030.370.00570.963.650.00003
20.030.370.00570.783.190.00003
30.090.360.00571.115.850.00003
40.090.370.00570.995.310.000031
50.090.360.00571.045.50.00003
60.090.360.01370.813.190.000039
70.090.370.01370.974.590.000033
80.090.360.01370.93.850.000036
90.090.370.01370.933.920.00003
100.090.370.01370.813.40.000049
110.110.370.02170.833.430.000038
Table 4. Predictive ability of seven prediction methods (with cross-validation) for branching quality (BQ), stem straightness (ST), wood volume (VOL), diameter at breast height (DBH) and tree height (H) in Eucalyptus globulus families, evaluated under oceanic climate conditions. NPV corresponds to number of predictor variables, SNPs or Components (PCR and Supervised PCR (S PCR)) used.
Trait/NPVRRBLUPRRBLUP-BBAYES-ABAYES-BBLASSOPCRS PCR
BQ0.170.680.210.280.230.10.69
NPV14,42295014,42214,42214,42257371
ST0.140.590.170.140.10.160.62
NPV14,42280014,42214,42214,42257995
VOL0.130.420.070.040.040.350.35
NPV14,42290014,42214,42214,422575148
DBH0.040.430.020.010.010.350.43
NPV14,42245014,42214,42214,42257962
H0.040.50.050.030.040.210.54
NPV14,42285014,42214,42214,422570338

