Wineinformatics: A Quantitative Analysis of Wine Reviewers

1
Department of Computer Science, University of Central Arkansas, Conway, AR 72035, USA
2
Department of Computer Science, University of Alabama, Tuscaloosa, AL 35487, USA
*
Author to whom correspondence should be addressed.
Fermentation 2018, 4(4), 82; https://0-doi-org.brum.beds.ac.uk/10.3390/fermentation4040082
Submission received: 31 July 2018
/
Revised: 14 September 2018
/
Accepted: 17 September 2018
/
Published: 25 September 2018
(This article belongs to the Special Issue Bioprocess and Fermentation Monitoring)
Abstract
:Data Science is a successful study that incorporates varying techniques and theories from distinct fields including Mathematics, Computer Science, Economics, Business and domain knowledge. Among all components in data science, domain knowledge is the key to create high quality data products by data scientists. Wineinformatics is a new data science application that uses wine as the domain knowledge and incorporates data science and wine related datasets, including physicochemical laboratory data and wine reviews. This paper produces a brand-new dataset that contains more than 100,000 wine reviews made available by the Computational Wine Wheel. This dataset is then used to quantitatively evaluate the consistency of the Wine Spectator and all of its major reviewers through both white-box and black-box classification algorithms. Wine Spectator reviewers receive more than 87% accuracy when evaluated with the SVM method. This result supports Wine Spectator’s prestigious standing in the wine industry.
1. Introduction
One of the most important research questions in the wine related area is the ranking, rating and judging of wine. Questions such as, “Who is a reliable wine judge? Are wine judges consistent? Do wine judges agree with each other?” are required for formal statistical answers according to the Journal of Wine Economics [1]. In the past decade, many researchers focused on these problems with small to medium sized wine datasets [2,3,4,5]. However, to the best of our knowledge, no research is being performed on analyzing the consistency of wine judges with a large-scale dataset. As a prestigious magazine in the wine field, WineSpectator.com contains more than 370,000 wine reviews. The research presented in this paper investigates the consistency of the wine being considered as “outstanding” or “extraordinary” for the past 10 years in Wine Spectator. It will not only analyze Wine Spectator as a whole but also examine all 10 reviewers in Wine Spectator and rank their consistency.
In order to process the large amount of data, techniques in data science will be utilized to discover useful information from domain-related data. Data science is a field of study that incorporates varying techniques and theories from distinct fields, such as Data Mining, Scientific Methods, Math and Statistics, Visualization, natural language processing and Domain Knowledge. Among all components in data science, domain knowledge is the key to create high quality data products by data scientists [6,7]. Based on different domain knowledge, new information is revealed in daily life through data science research; for instance, mining useful information from the reviews of restaurants [8], movies [9] and music [10]. In this paper, the domain knowledge is about wine.
The quality of the wine is usually assured by the wine certification, which is generally assessed by physicochemical and sensory tests [11]. Physicochemical laboratory tests routinely used to characterize wine include determination of density, alcohol or pH values, while sensory tests rely mainly on human experts [12]. Figure 1 provides an example for a wine review in both perspectives.
Currently, almost all existing data mining research is focused on physicochemical laboratory tests [11,12,13,14,15]. This focus is because of the dataset availability. The most popular dataset used in wine related research is stored in the UCI Machine Learning Repository [16]. Chemical values can be measured and stored by a number, while sensory tests produce results that are difficult to enumerate with precision. However, based on Figure 1, sensory analysis is much more interesting to wine consumers and distributors because they describe aesthetics, pleasure, complexity, color, appearance, odor, aroma, bouquet, tartness and the interactions with the senses of these characteristics of the wine [14].
To the best of our knowledge, little related research has been conducted on the contents of wine sensory reviews, which is stored in a human language format. Ramirez [17] did a research in finding the correlation between the length of the tasting notes and wine’s price; however, no contents of the review are analyzed. Researchers have mentioned that “it should be stressed that taste is the least understood of the human senses, thus wine classification is a difficult task” [11]. Therefore, the key to the success of the wine sensory related research relies on consistent reviews from prestigious experts, in other words, judges that can be trusted. Several popular wine magazines provide widely accepted sensory reviews of wines produced every year, such as Wine Spectator, Wine Advocate, Decanter, Wine enthusiast and so forth. Although the sensory reviews are stored in human-language format, which requires special methods to extract attributes to represent the wine, the large amount of existing sensory reviews makes finding interesting wine patterns/information possible.
Wine sensory reviews consist of the score summaries of a wine’s overall quality and the testing note describes the wine’s style and character. The score is a rating within a 100-point scale to reflect how highly its reviewers regard the wine’s potential quality relative to other wines in the same category. Below is an example wine sensory review with bolded key attributes of the number one wine of 2014 as named in Wine Spectator.
Dow’s Vintage Port 2011 99 pts.
Powerful, refined and luscious, with a surplus of dark plum, kirsch and cassis flavors that are unctuous and long. Shows plenty of grip, presenting a long, full finish, filled with Asian spice and raspberry tart accents. Rich and chocolaty. One for the ages. Best from 2030 through 2060.
16,000 wine sensory reviews are produced by Wine Spectator each year. Wine Spectator’s publicly available database currently has more than 370,000 reviews. Similar size data is available on other prestigious wine review magazines such as Wine Advocate and Decanter. Therefore, more than a million wine sensory reviews are currently considered as “raw data”. It is impossible to manually pick out attributes for all wine reviews. However, extracting important key words from the wine sensory review automatically is challenging. This process needs to include not only the flavors, such as DARK PLUM, KIRSCH, CASSIS, ASIAN SPICE, RASPBERRY TART but also non-flavor notes like LONG FINISH and FULL FINISH. Furthermore, different descriptions in human language are considered to have the same attributes from an expert’s point of view, while other descriptions are considered distinct. An example would be that FRESHLY CUT APPLE, RIPE APPLE and APPLE represent the same attribute “Apple”, but GREEN APPLE is categorized as “GREEN APPLE” since it is a unique flavor.
In our previous work [18,19,20,21], a new data science application domain named “Wineinformatics” was proposed that incorporated data science and wine related datasets, including physicochemical laboratory data and wine reviews. A mechanism was developed to extract wine attributes automatically from wine sensory reviews. This produced small to medium sized (250–1000 wines) brand new datasets of wine attributes, such as wine region or grape-type specific. Then, various data science techniques were applied to discover the information that could benefit society including wine producers, distributors and consumers. This information may be used to answer the following questions: “Why do wines achieve a 90+ rating? What are the shared similarities among groups of wine and what wines are suggested to the consumer? What are the differences in character between wines from Bordeaux, France and Napa, United States?”
In this paper, a new dataset will be constructed which contains more than 100,000 wines. It will consist of ALL wines from 2006–2015 with 80+ scores. This new dataset will be used to investigate the consistency of the wine being considered as “outstanding” or “extraordinary” in Wine Spectator. Furthermore, individual reviewers will be examined to rate and rank their consistency and discover the preferred wine characteristics for each reviewer. We believe this is the first paper that performs Quantitative Analysis of Wine Reviewers in a large-scale dataset.
2. Materials and Methods
2.1. Data Preparation
Wine sensory analysis involves tasting a wine and being able to accurately describe every component that makes it up. Not only does this include flavors and aromas but characteristics such as acidity, tannin, weight, finish and structure. Within each of those categories, there are multitudes of possible attributes or forms that each can take. What makes the wine tasting process so special is the ability for two people to simultaneously view the same wine differently while being able to share and detect all the same attributes. Each year, tens of thousands of wine reviews are published. It is impossible for the researchers to read and process all reviews manually. Therefore, using a Natural Language Processing (NLP) method to extract key terms from each review automatically is the first step of our research.
2.1.1. Computational Wine Wheel
In our previous research [17,19], a new technique named the Computational Wine Wheel was developed to accurately capture keywords, including not only flavors but also non-flavor notes, which always appear in the wine reviews. Non-flavor notes include tannins, acidity, body, structure, or finish. The Computational Wine Wheel was developed based on Wine Spectator’s top 100 wines from 2003 through 2013. It currently holds 1881 specific terms that appeared in wine reviews and normalized those specific terms into 985 normalized terms. For instance, “HIGH TANNINS”, “FULL TANNINS”, “LUSH TANNINS” and “RICH TANNINS” all represent specific terms which are normalized into “TANNINS_HIGH”. Normalized names are necessary because of the fact that a variety of adjectives can be used to describe one quality.
In this paper, a program is created that would easily preprocess wine data into a binary matrix in an Excel format for easier analysis of wine attributes. In this format, each wine would occupy a row and each flavor attribute would occupy a column. This program would analyze a set of reviews by extracting specific keywords in accordance to the chosen wine wheel. Then, it would create a matrix to show if each of the normalized versions of those keywords are present in the review.
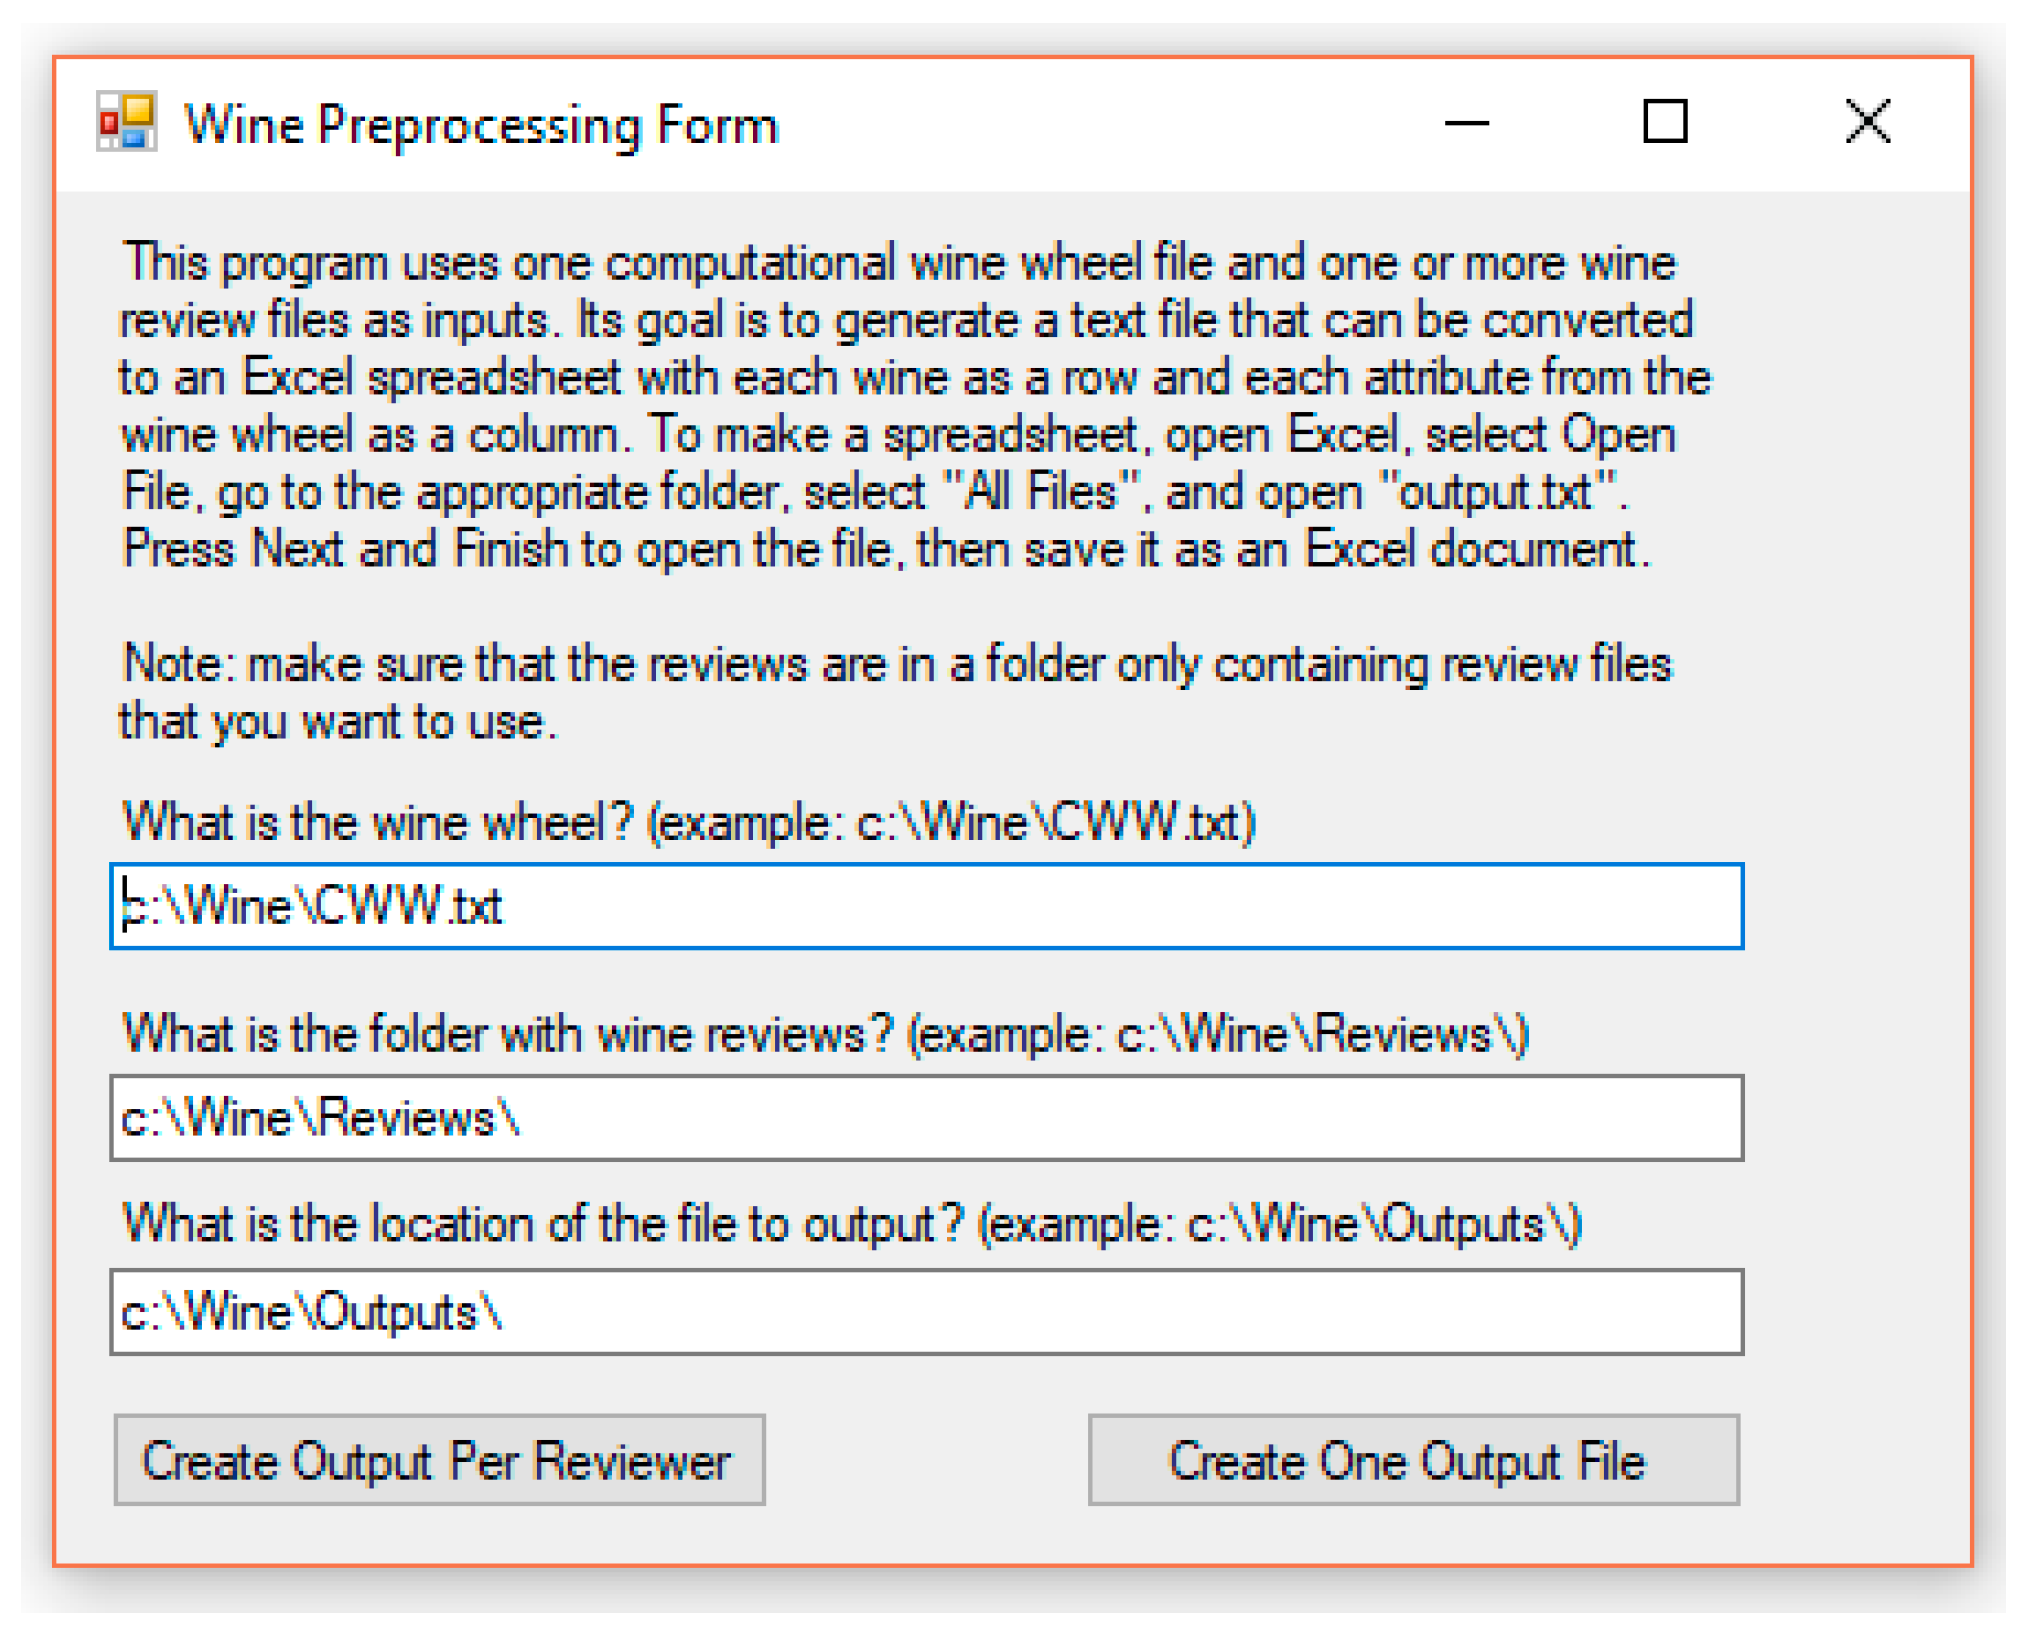
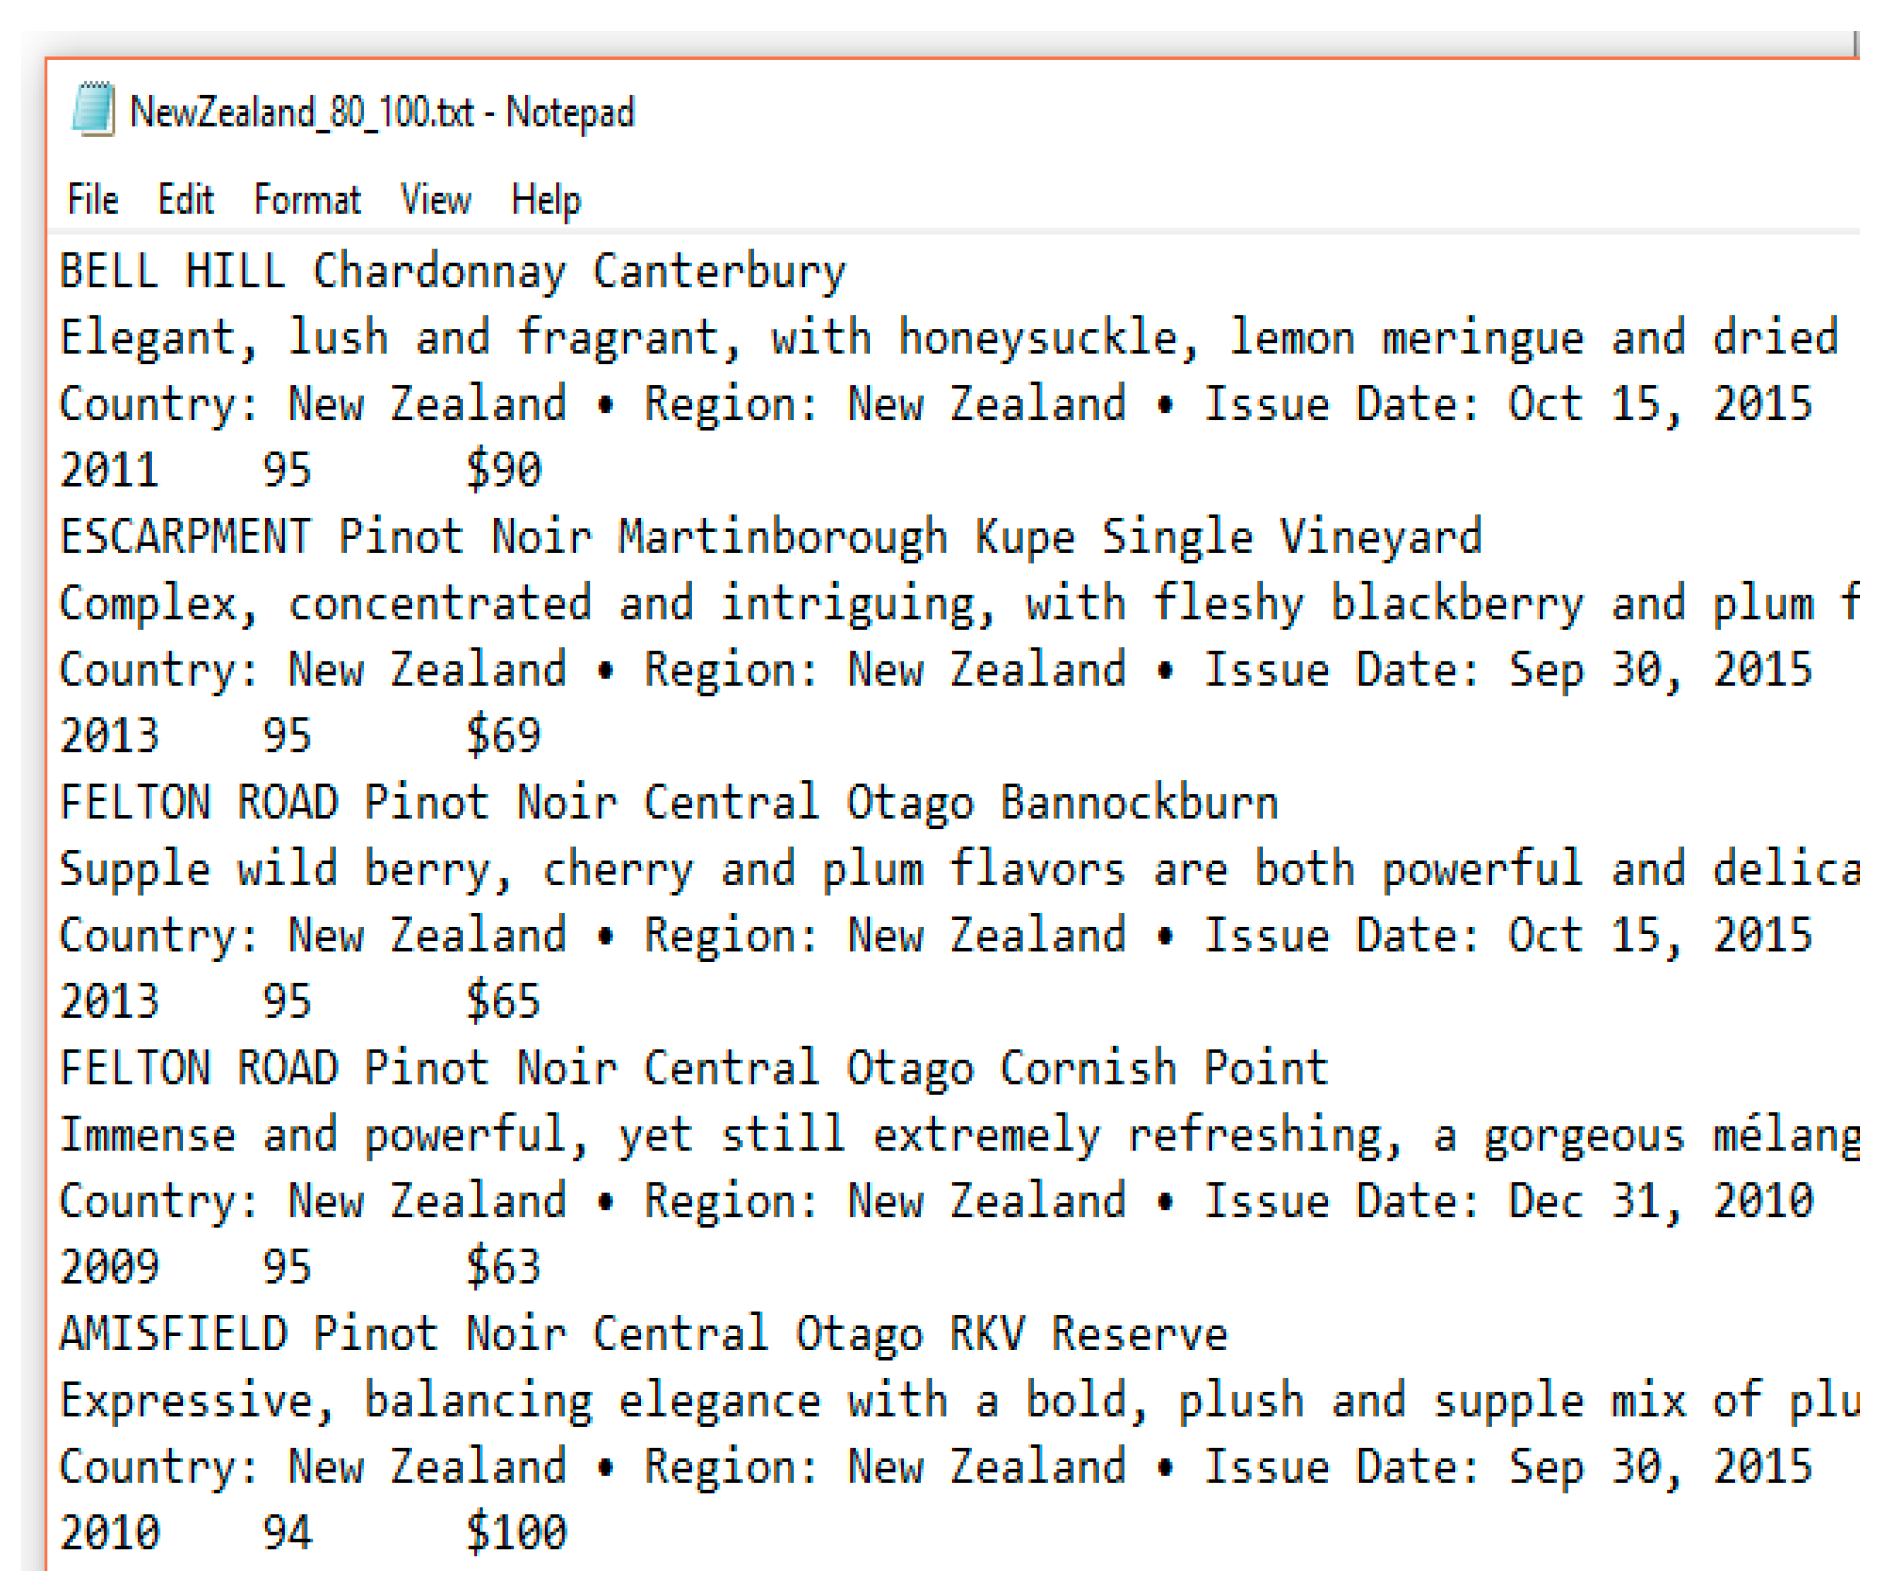
Figure 2 shows the Wine Preprocessing Form created for this research. The format this form accepts is a text file of wine reviews. For a review, the first line must have the name of the wine, the second line must have the wine’s description (the review itself), the third line must have the country and region information and the final line must have the year, rating and price of the wine, in order and tab delimited. This format is used by Wine Spectator for users to view wine reviews. The text file may have any number of subsequent reviews, as shown in Figure 3.
The wine preprocessing form has a straightforward input and output. It uses the file path of the Computational Wine Wheel text file, the folder that contains the wine review files and the location to output the matrix, which will be another text file. Depending on which option is selected, the program can separate the output into a matrix for each reviewer it finds, or simply one large matrix. In the matrix, each row represents a wine with reviews and each column denotes whether the wine has the normalized attribute in the review. Table 1 provides an example of a wine review stored in digital format:
DOMAINE DE L’A Castillon Côtes de Bordeaux 90 pts
Well built, with solid density for the vintage, this lets a core of dark plum sauce, steeped currant and blackberry coulis play out, while hints of charcoal, anise and smoldering tobacco line the fleshy finish. A solid effort. Drink now through 2018. 1900 cases made. –JM.
The goal of this program is to allow for easier preprocessing of the wine data. This in turn allows us to more efficiently run data mining algorithms, such as association rules and Naïve Bayes, which would determine which types of wines more commonly contain which attributes. The program’s ability to separate by individual reviewer helps us analyze and compare each reviewer more easily as well. The program will be publically available once the paper is published.
2.1.2. Wine Reviews from Wine Spectator
Wine Spectator was chosen as the primary data source for this research because of their strong on-line wine review search database. These reviews are mostly comprised of specific tasting notes and observations while avoiding superfluous anecdotes and non-related information. They review more than 15,000 wines per year and all tastings are conducted in private, under controlled conditions. Wines are always tasted blind, which means bottles are bagged and coded. Reviewers are told only the general type of wine and vintage. Price is also not taken into account. Their reviews are straight and to the point. Wine Spectator provides an effective tool for users to easily search their consistent and precise reviews.
For each reviewed wine, a rating within a 100-points scale is given to reflect how highly their reviewers regard each wine relative to other wines in its category and potential quality. The score summarizes a wine’s overall quality, while the testing note describes the wine’s style and character. The overall rating reflects the following information recommended by Wine Spectator about the wine:
95–100, Classic: a great wine; 90–94, Outstanding: a wine of superior character and style; 85–89, Very good: a wine with special qualities; 80–84, Good: a solid, well-made wine; 75–79, Mediocre: a drinkable wine that may have minor flaws; 50–74, Not Recommended.
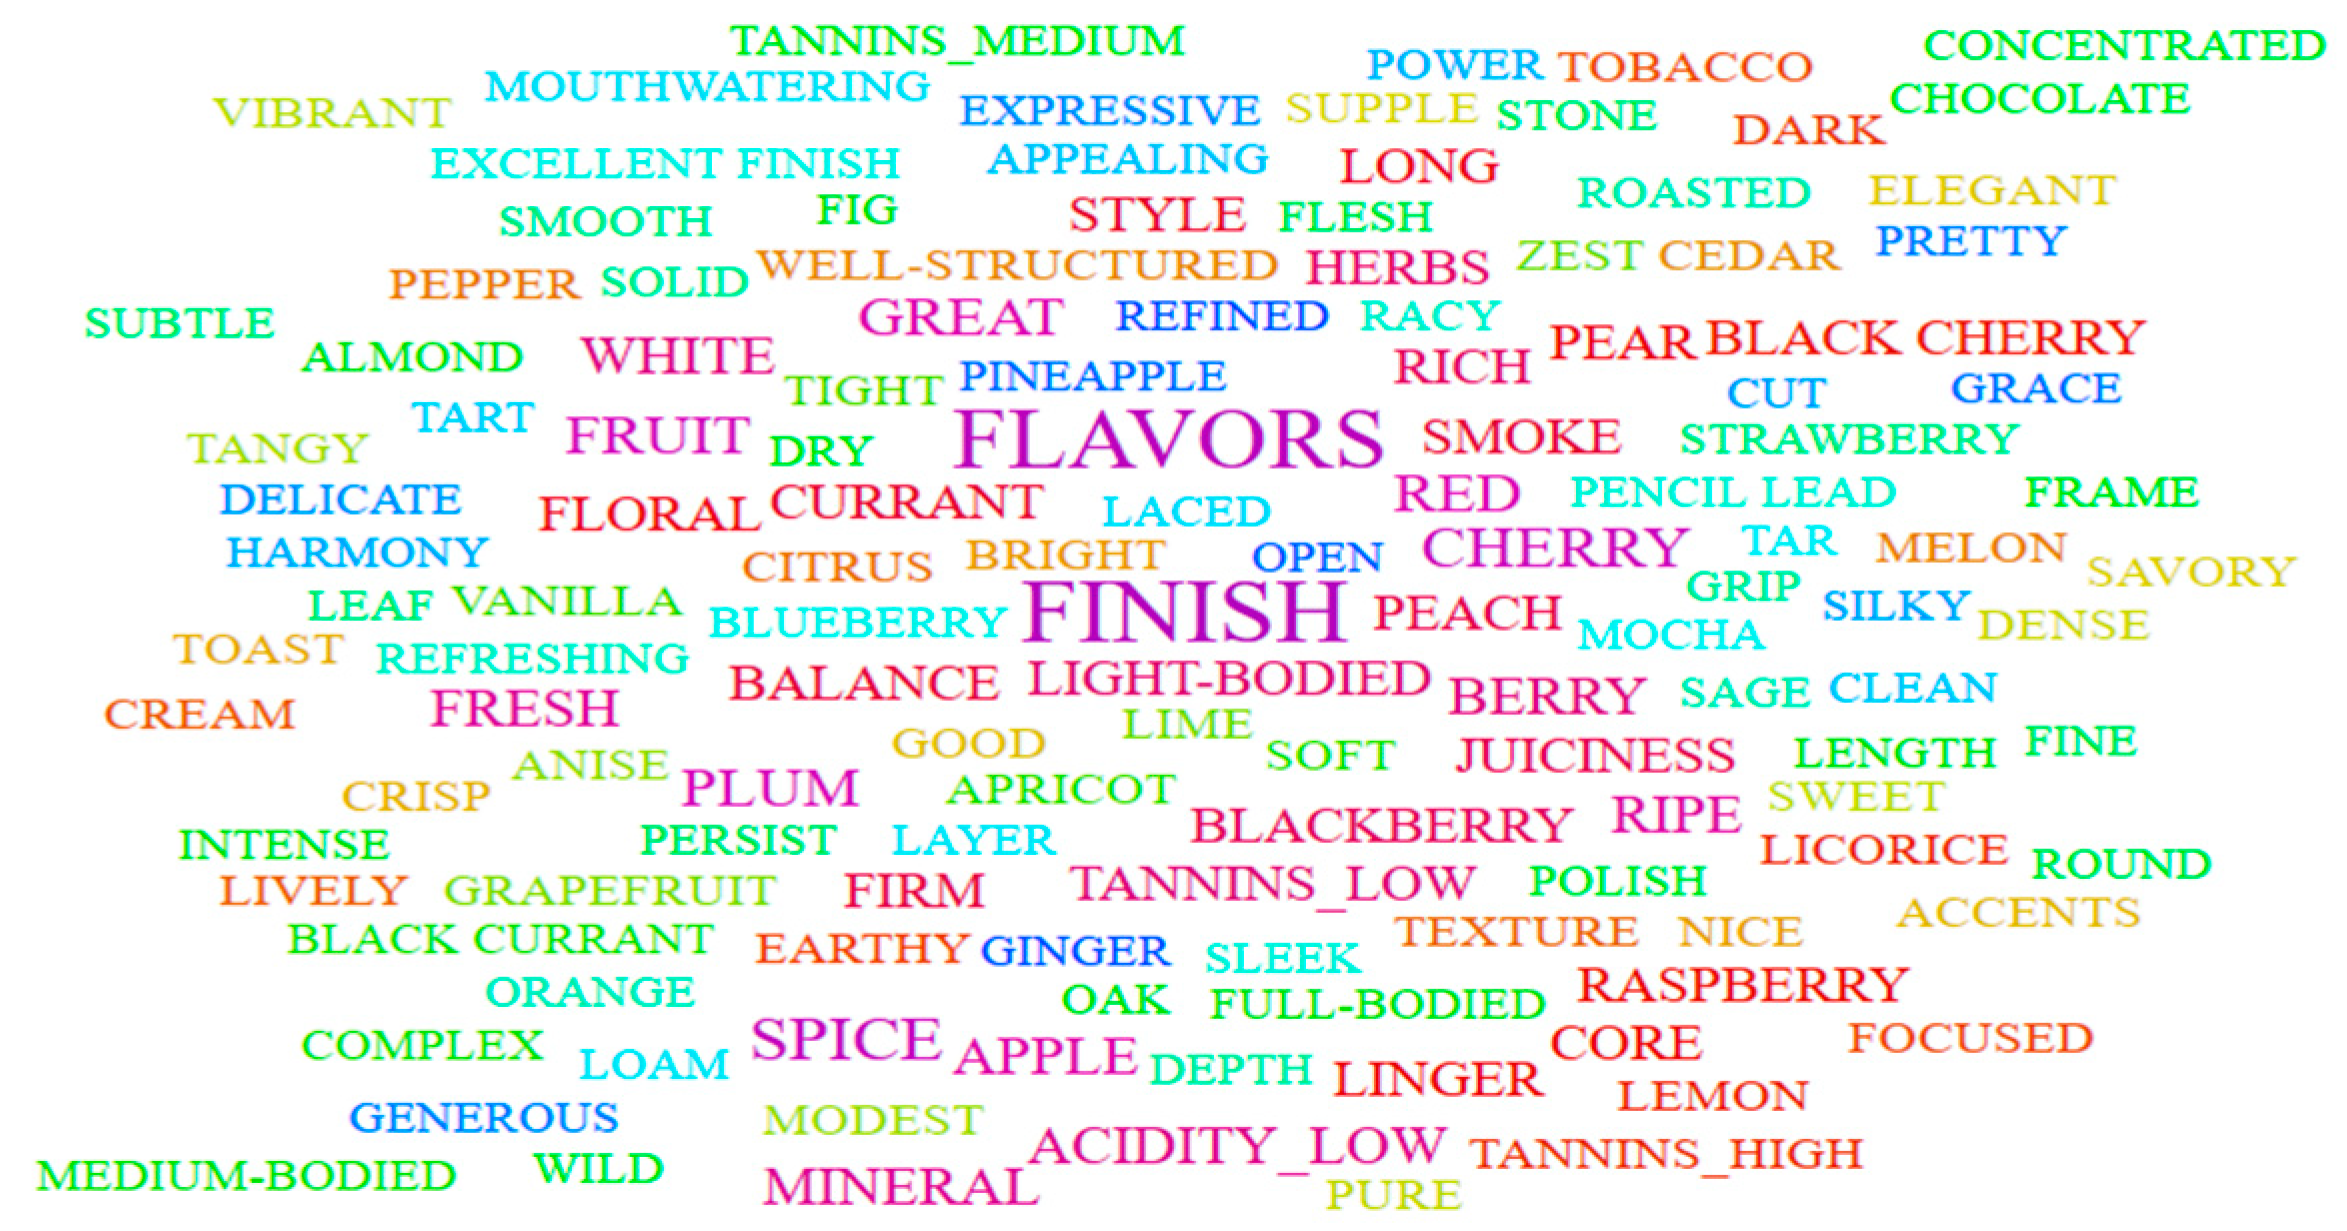
For this research, all wines from 2006 to 2015 with 80+ scores are collected for the new dataset. It would be interesting to note what some of the most popular wine attributes are in the dataset. Figure 4 visualizes the most common keywords found in the data set. As we can see, there is a huge variety of very common wine. Even though only a small subset of the words is pictured, the reader should note that the words primarily reflect the flavor of the wine and not its price, quality, or region of origin.
Since Wine Spectator has 10 reviewers in total, we also annotate the reviewer who reviews the wine. Table 2 shows the score distribution for the reviewers using the selected dataset. Table 3 shows the position of each reviewer and the “tasting beat” or wine regions from which they taste. We explored how many reviews the wine judges made in each of the four categories, with over 107,000 wines in total. The middle categories contained far more reviews than the lowest and highest. Two of the reviewers, MaryAnn Worobiec and Tim Fish, had only 15 and 16 reviews in the 95–100 score range respectively. Due to the lacking sample size of Gillian Sciaretta, specifically in the top two categories, she was excluded from the comparison of Wine Spectator reviewers. The program mentioned in the previous subsection is applied to construct the dataset used in this paper.
2.2. Methods
Wine reviews provided by the wine judges are crucial information for understanding the attributes that the wines exhibit. Wine judges taste a wine to determine which attributes the wine exhibits and give a verdict (usually a score) to the wine. The question this paper seeks to focus on is the consistency of the wine judges’ evaluation. More specifically, when a wine judge gives a wine a 90+ score with the wine review as the evaluation; does the wine judge give a 90+ score to other wines with similar reviews? Based on this question, the wine dataset is divided into two categories: the wines that score 90+ and the wines that score 89−. Per Wine Spectator, wines that score 90+ are considered as either “outstanding” or “classic”, which are great recognitions to the wine.
The goal of classification algorithms is to use a collection of previously categorized data as a basis for categorizing new data. Therefore, the data will include a training set from which to base its classification on as well as a testing set that will predict unknown quantities into the previously established categories. The more consistent the wine reviews provided by the wine judges are, the higher the model accuracy will be when built to predict the level of the grade for the unknown wines. There are two kinds of classification algorithms: Black-box classification algorithms usually provide a classification result without explaining; White-box classification algorithms typically give a classification result with justifiable reason. Generally speaking, Black-box classification algorithms produce higher accuracy results while White-box classification algorithm provides an understanding to the model. In this paper, both Black-box and White-box classification algorithms are used.
2.2.1. White-Box Classification Algorithm: Naïve Bayes
Naïve Bayes is a classification method based on Bayes’ Theorem with a supposition of independence among predictors. In simple terms, a Naïve Bayes classifier assumes that the presence of a feature in a class is unrelated to the presence of any other feature. For example, a fruit may be considered to be an apple if it is red, round and about 3 inches in diameter. Even if these features depend on each other or upon the existence of the other features, all of these properties independently contribute to the probability that this fruit is an apple and that is why it is known as “Naïve”. The Naïve Bayes model is easy to build and particularly useful for very large data sets. Along with simplicity, Naïve Bayes is known to outperform even highly sophisticated classification methods. In the research area of Wineinformatics, Naïve Bayes is considered as one of the most suitable white-box classification algorithm when compared with other white-box classification algorithms, such as Decision Tree, Association Classification and K Nearest Neighbor [20].
Naïve Bayes’ algorithm is based on Bayes’ Theorem, which has four fundamental components, Theorem 1. First, the posterior probability, P(c|x) is how probable the hypothesis is given the observed evidence. P(c) is the prior probability of class. P(x|c) is the likelihood which is the probability of predictor given class. P(x) is the prior probability of predictor. The likelihood asks what the probability of the evidence is given that the hypothesis is true. The class prior probability asks how probable the hypothesis was before observing the evidence and the predictor prior probability asks how probable the new evidence is given any of the possible hypotheses.
Theorem 1.
Bayes’ Theorem.
A version of the Naïve Bayes algorithm that we must note is Laplacian smoothing. With the Naïve Bayes formula, one may have zero probabilities. For example, if we have the attribute “apple” in our testing set but have never had that word in our training set, the probability P(x|c) will always be zero. This would cause us to ignore other testing attributes for this one word. Laplace smoothing alleviates this issue by adding a parameter such as one to both the numerator and the denominator so that these zero probabilities do not interfere with the probabilities of other attributes [22]. This is important to note because we have made tests on our dataset with both the original Naïve Bayes algorithm as well as the Laplacian version.
2.2.2. Black-Box Classification Algorithm: Support Vector Machine
Support Vector Machines [23] is probably the most famous and successful Black-box classification algorithm in various application areas. Support Vector Machines (SVM) generate a deterministic binary linear classifier as a margin is created by space between hyperplanes based on the training dataset. The testing dataset is mapped into the same space produced by the training dataset and predicted the belonging category based on which side of the gap they fall. The line that forms the gap is a hypothetical separation; therefore, no meaningful explanations can be produced. While most of the applications do not fall into a two-dimensional space, research with high dimensional space use the kernel map data points into higher dimensional space.
2.2.3. Evaluation Metrics
In classification, the terms true positive (tp), true negative (tn), false positive (fp) and false negative (fn) compare the predicted results with the known label. The term positive and negative indicates the classifier’s prediction, while the terms true and false indicates whether the prediction corresponds to the known label. In this paper, a wine which scores greater or equal to 90 points (score 90–100 or 90+) is considered as a positive class and a wine which scores less than 90 points (score 89–80 or 89−) as a negative class. Therefore, if the prediction made by the classification algorithm is positive and the wine is truly a positive class (score 90–100), then it is a true positive (tp); if the prediction made by the classification algorithm is positive and the wine is actually a negative class (score 89–80), then it is a false positive (fp); if the prediction made by the classification algorithm is negative and the wine is truly a positive class (score 90–100), then it is a false negative (fn); if the prediction made by the classification algorithm is negative and the wine is truly a negative class (score 89–80), then it is a true negative (tn). Several important statistical evaluations are used in this paper:
Accuracy indicates how many predictions made by the classification algorithm are correct; Precision shows how many wines predicted as positive are truly 90+ wines; Recall demonstrates how many 90+ wines can be distinguished by the classification algorithm among all positive wines; Specificity demonstrates how many 89− wines can be distinguished by the classification algorithm among all negative wines. Five-fold cross validation was applied for all results reported in this paper.
3. Results
3.1. Naïve Bayes
Naïve Bayes has been identified as the most suitable white-box classification algorithm in Wineinformatics from the previous research (Chen et al., 2016B) [21] since the algorithm usually constructs the most reliable model and equips the ability to explain the importance of each attribute.
The Naïve Bayes algorithm is applied to determine the consistency for each of Wine Spectator’s wine reviewers. All reviews are collected for each reviewer (summarized in Table 2) and five-fold cross validation is run, which will select 20% of the data as the testing dataset and use the other 80% of the data to train the Naïve Bayes algorithm for prediction of the testing dataset. The process will be executed 5 times in total. Each time it will select a testing dataset that has never been included in the previous cross-validation. Therefore, all data will be tested exactly once. The final evaluation metrics are calculated based on the average of each cross-validation results. Having more consistent wine reviews from each wine reviewer will lead to a more accurate classification model which will yield better evaluation results for the testing dataset.
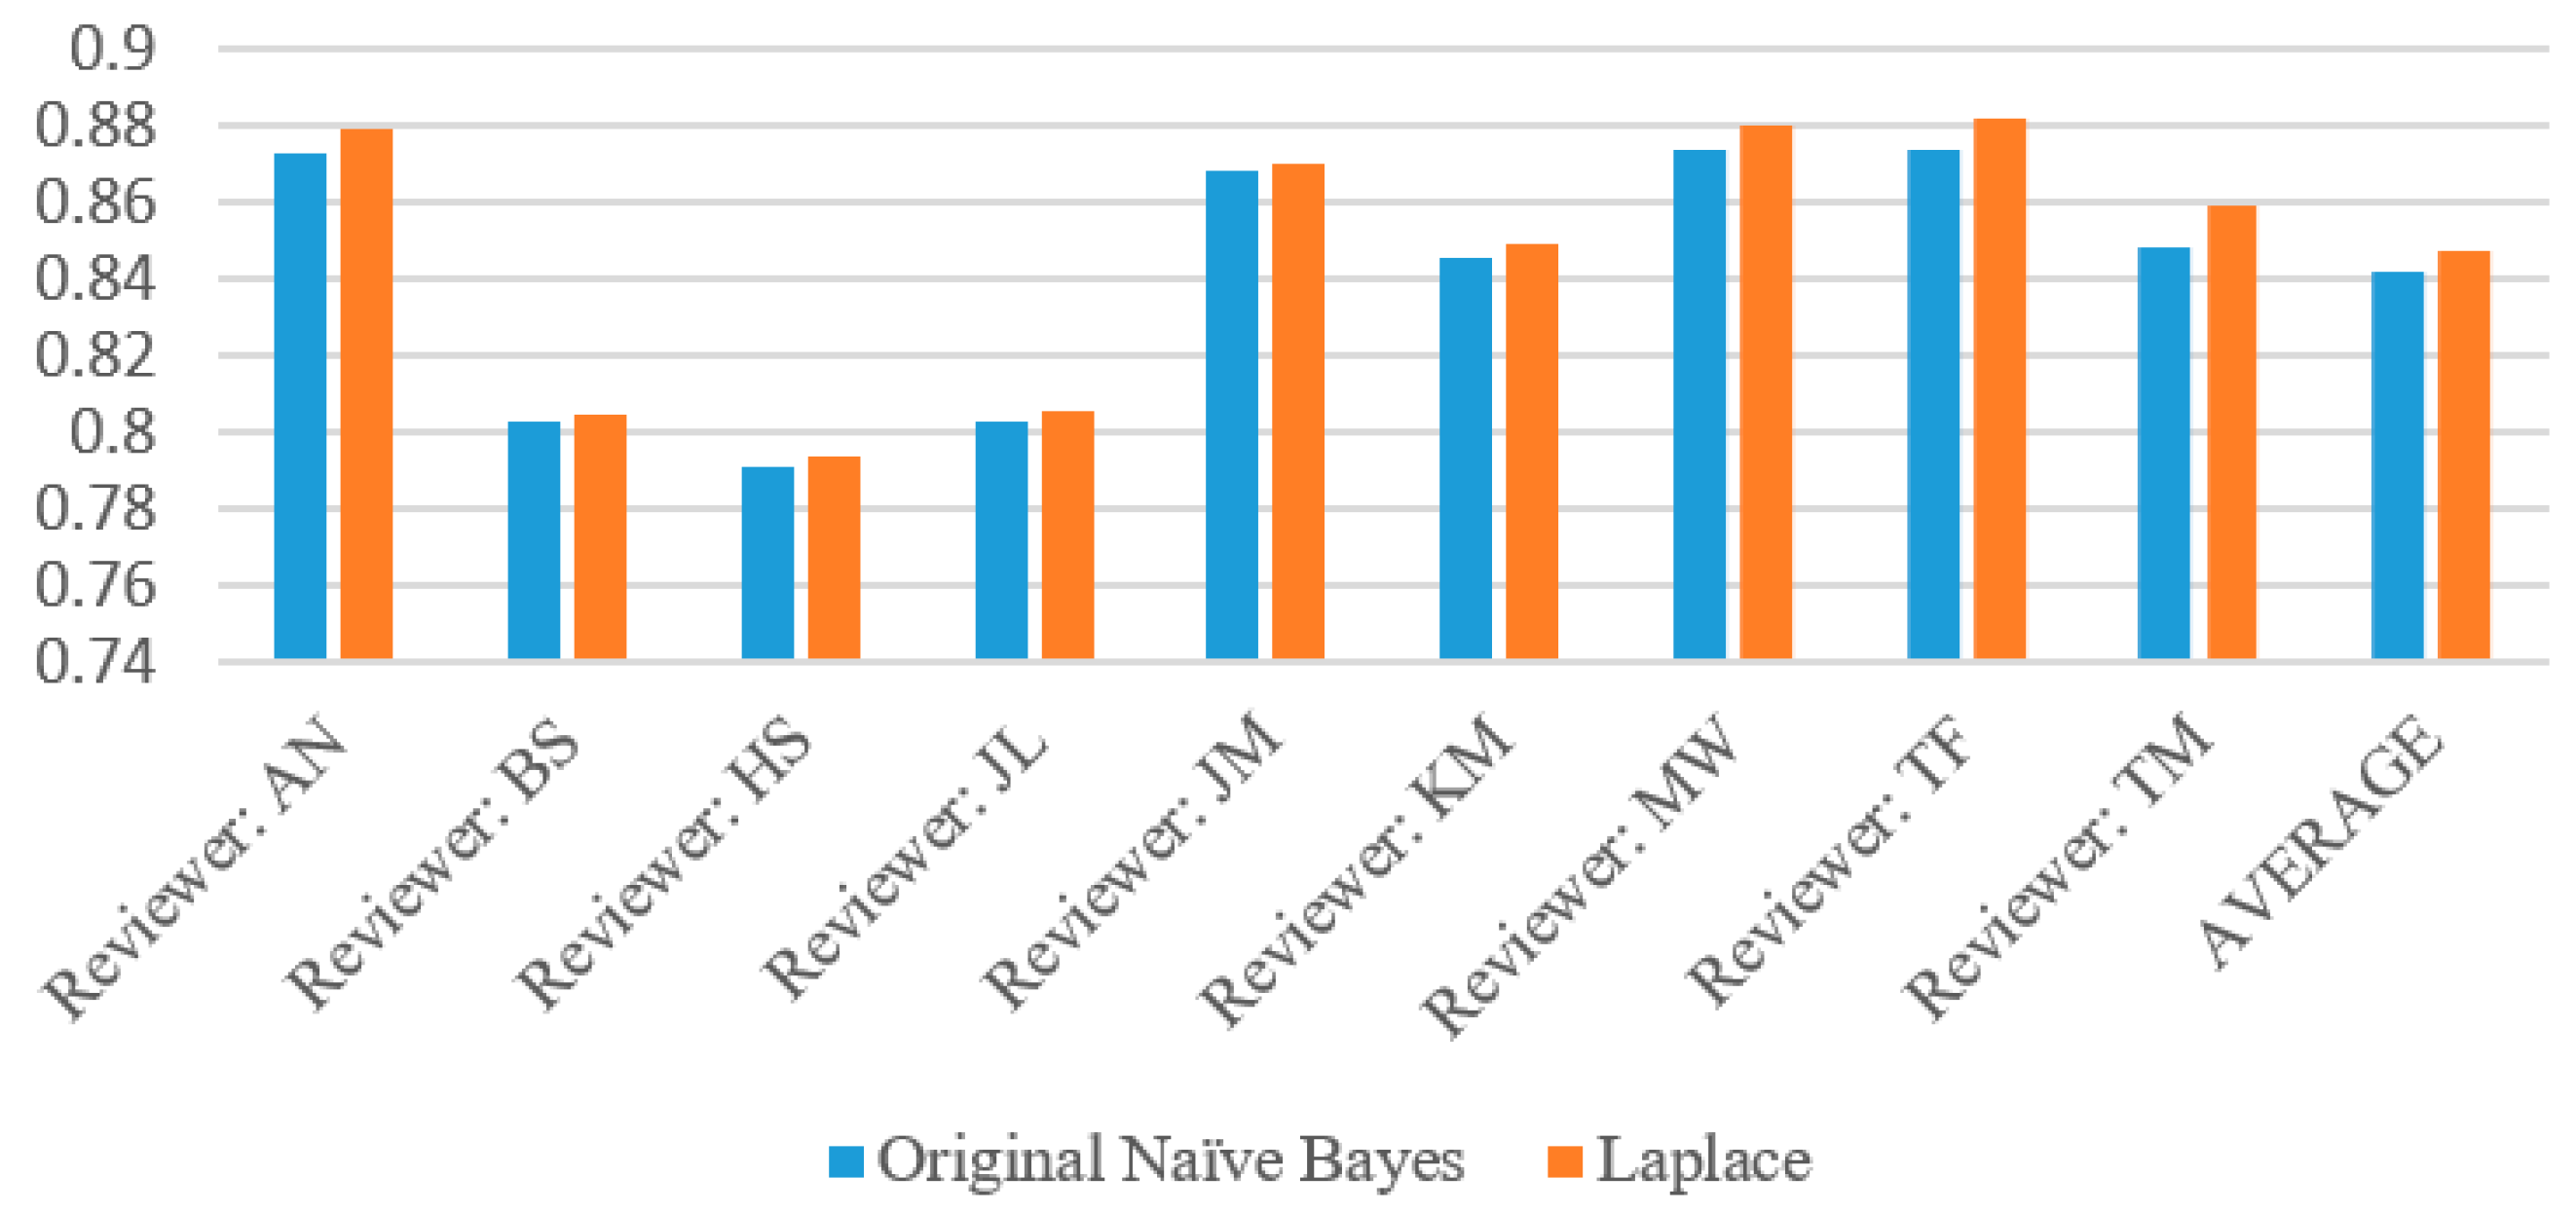
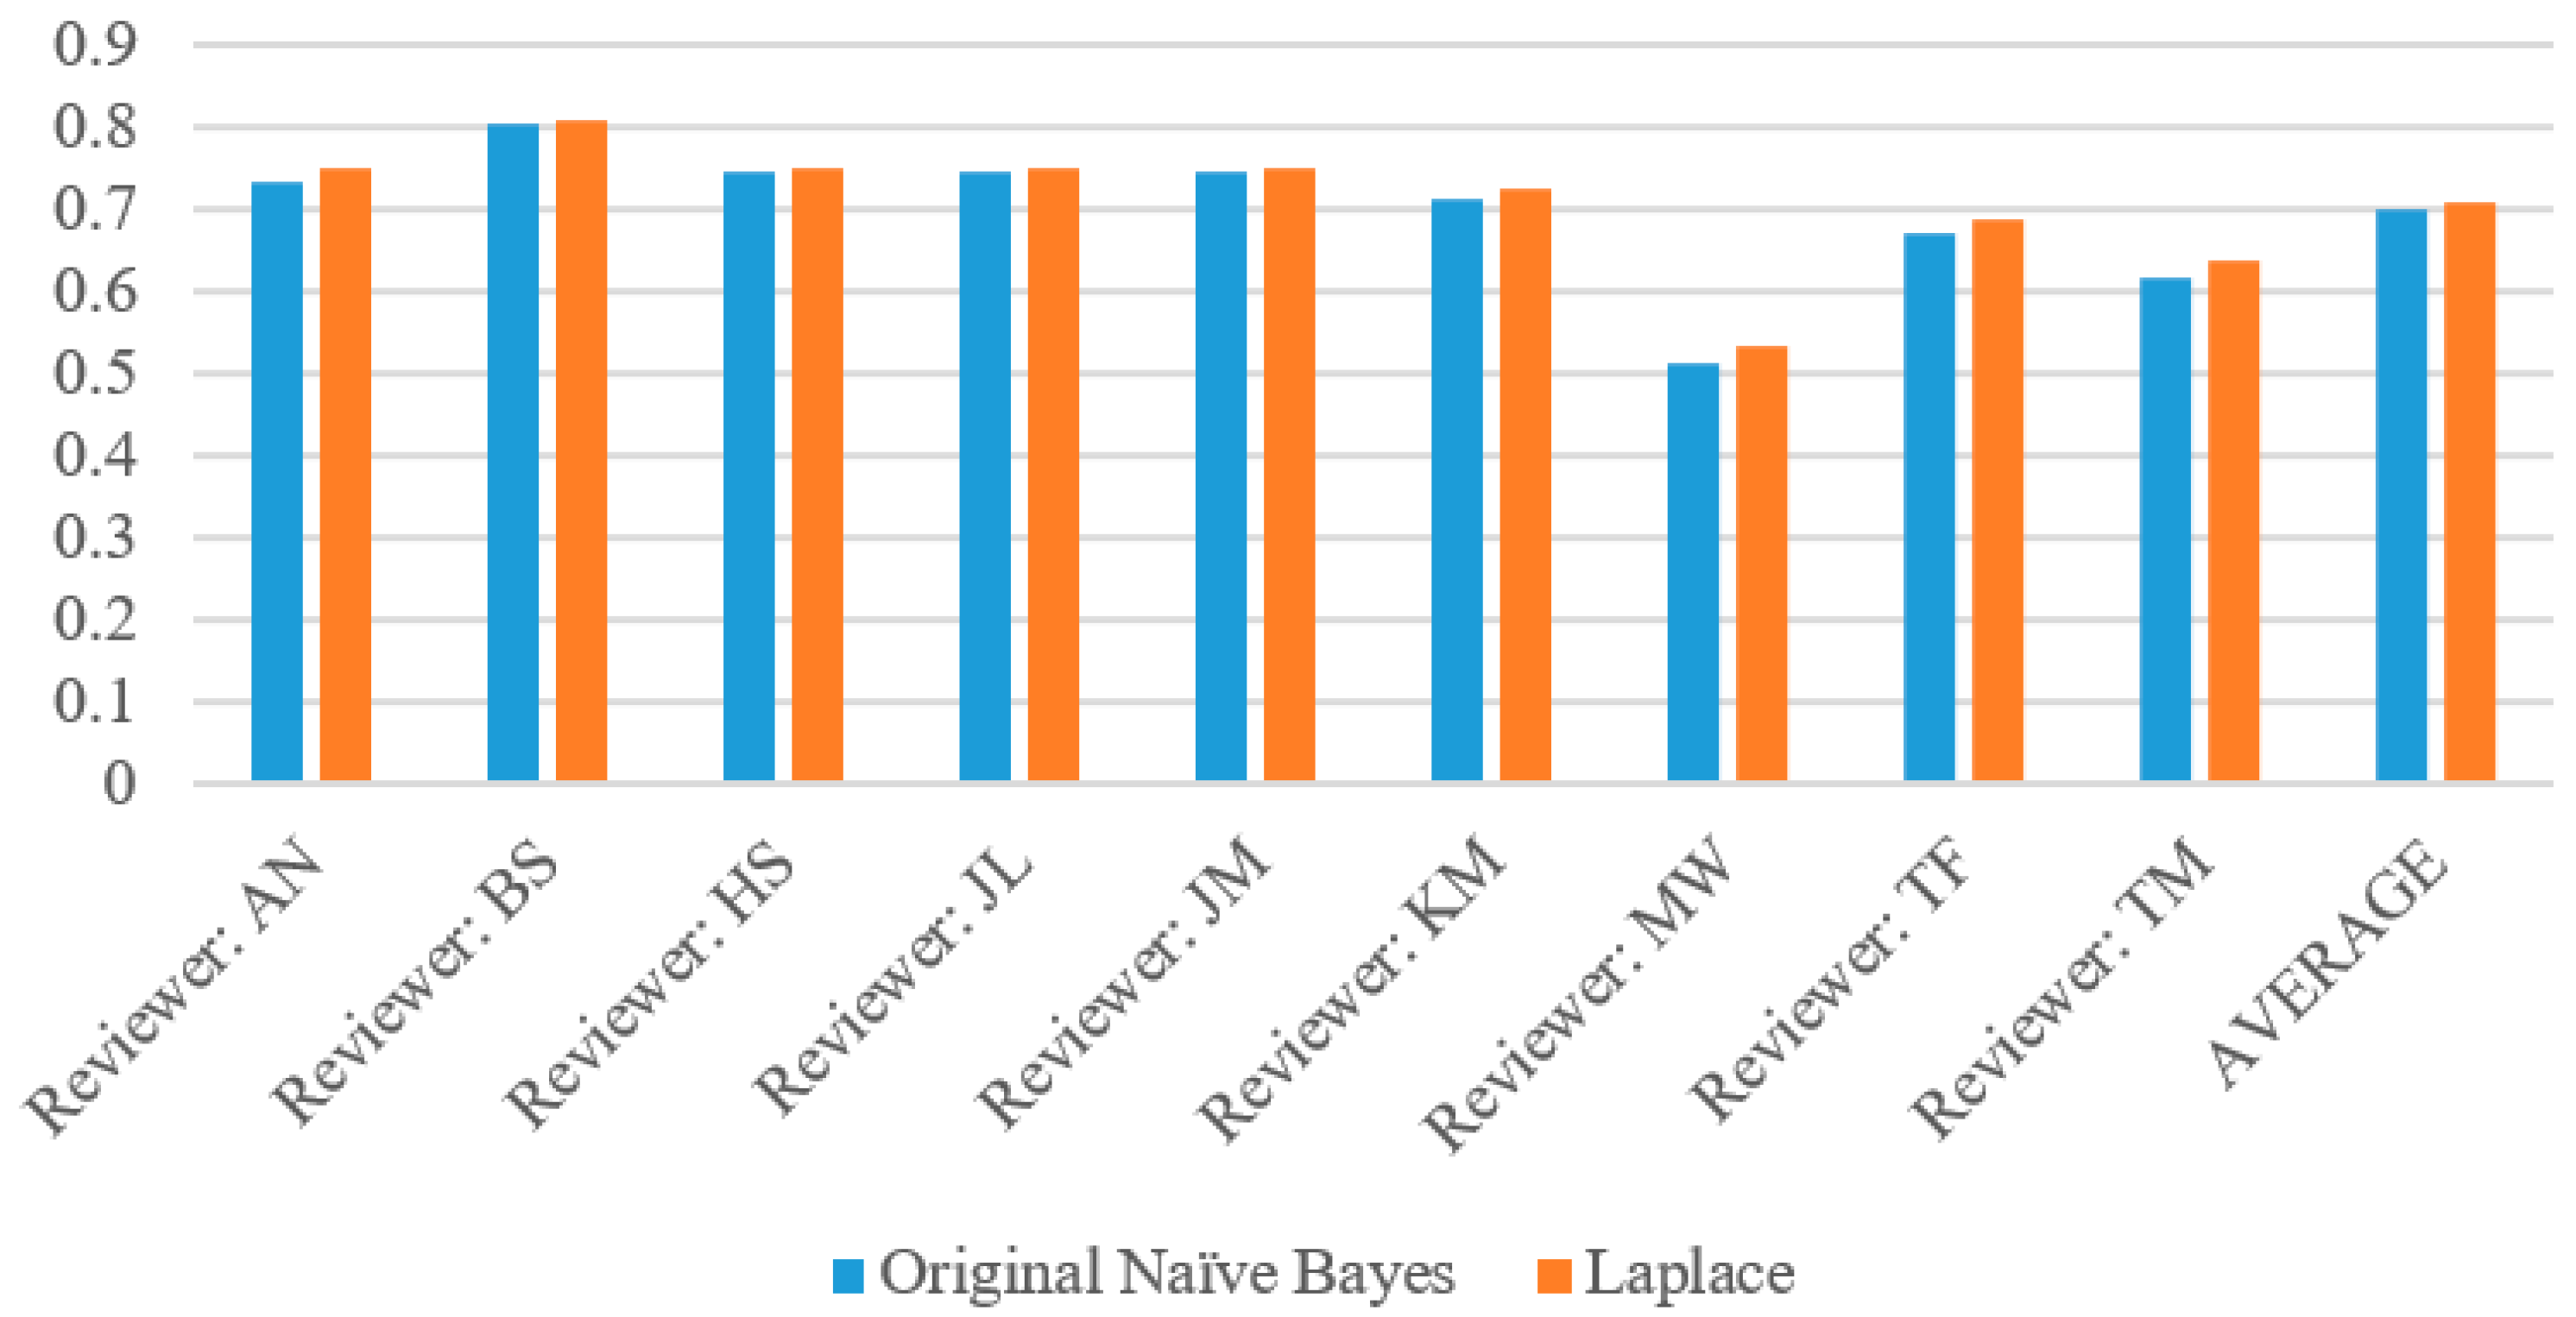
The complete evaluation results for each wine reviewer based on Naïve Bayes algorithm with and without Laplace are given in Table 4. Across all reviewers, the Naïve Bayes Original algorithm performed slightly worse than the Laplace. This is due to the parameter (k = 1) adding slightly extra weight to zero attribute probabilities so that the above or below probability does not go to zero. Among all of these reviewers, there were only 49 instances of the probabilities of the original Naïve Bayes tied (specifically, with both at zero) and zero instances of Laplace’s probabilities tied. These are the instances where both the above and below probabilities had zero attributes (which Laplace corrected for), so the program was forced to perform a virtual coin flip whereas the Laplace implementation did not have this problem.
The most reliable reviewer in this instance was Tim Fish, who had an accuracy of 87.37% with the original version of the algorithm and 88.16% with the Laplace version, as Table 4 demonstrates. However, MaryAnn Worobiec was a very close second with 87.36% and 88.04% respectively. Mining this type of information can give insight into which reviewers give precise descriptions in their reviews and with enough data collected on the reviewers, one could rank them by their reliability. In this case, by order of accuracy as shown in Table 5, these would be TF, MW, AN, JM, TM, KM, JL, BS, HS. To the best of our knowledge, this is the very first paper to rank different judges based on their large amount of reviews through data science methods.
Due to the skew of these datasets, with the vast majority of wines being below 90, or in the “false” prediction category, our results generally reflected high specificity, mediocre precision and low recall. However, reviewer Bruce Sanderson remained the most consistent for our predictions despite the skew, with precision, recall and specificity all within one percentage point for both the original Naïve Bayes and the Laplace correction.
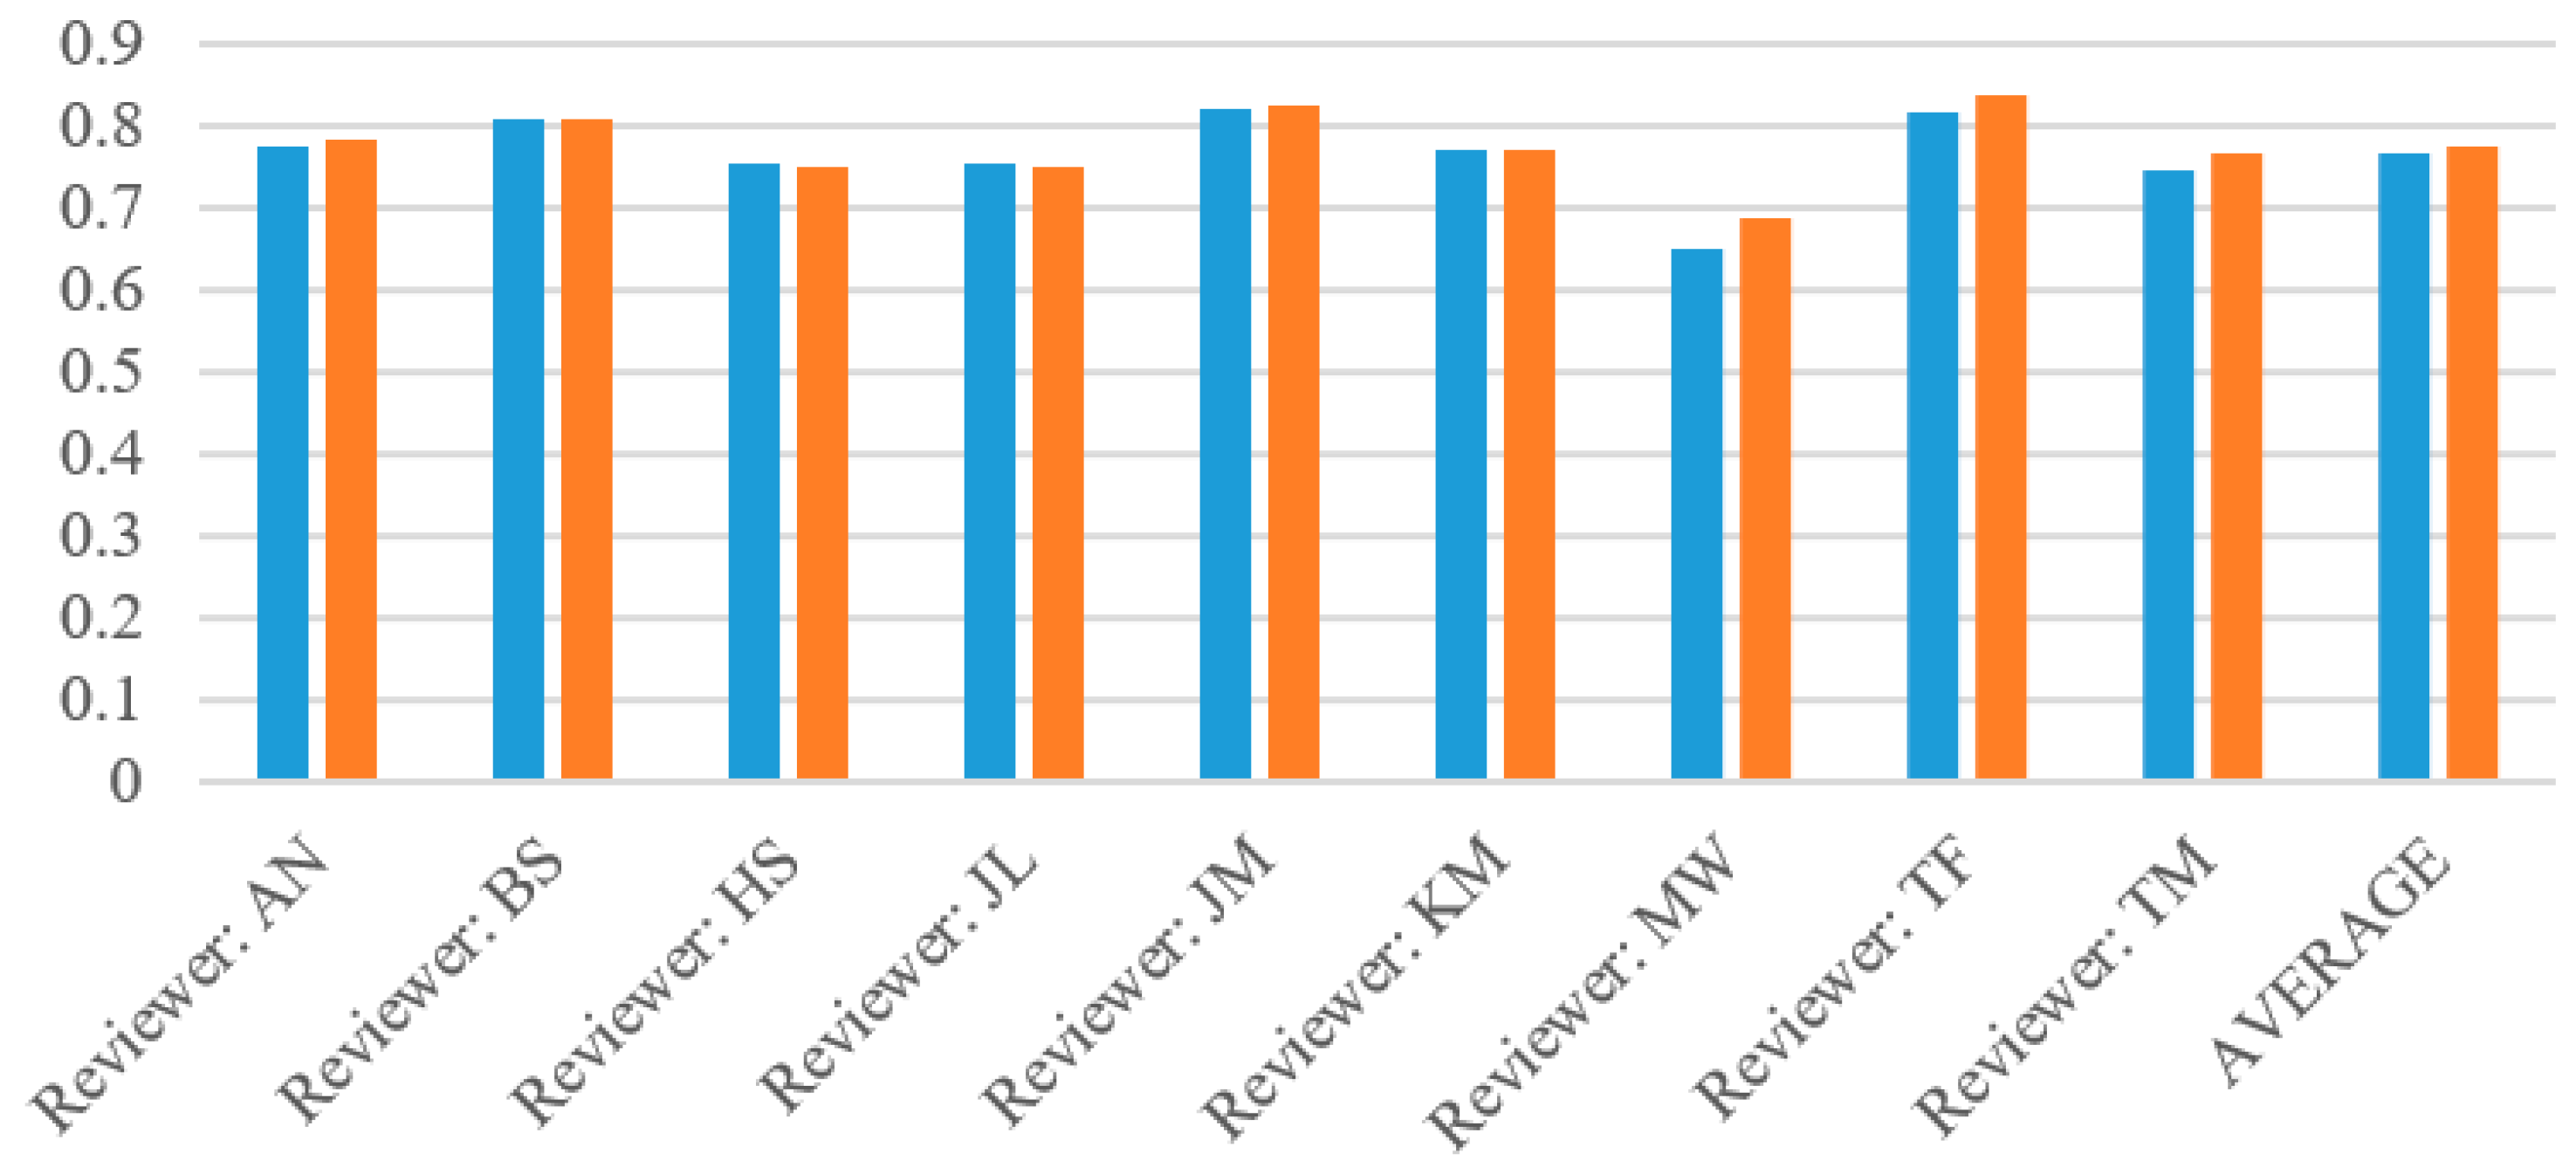
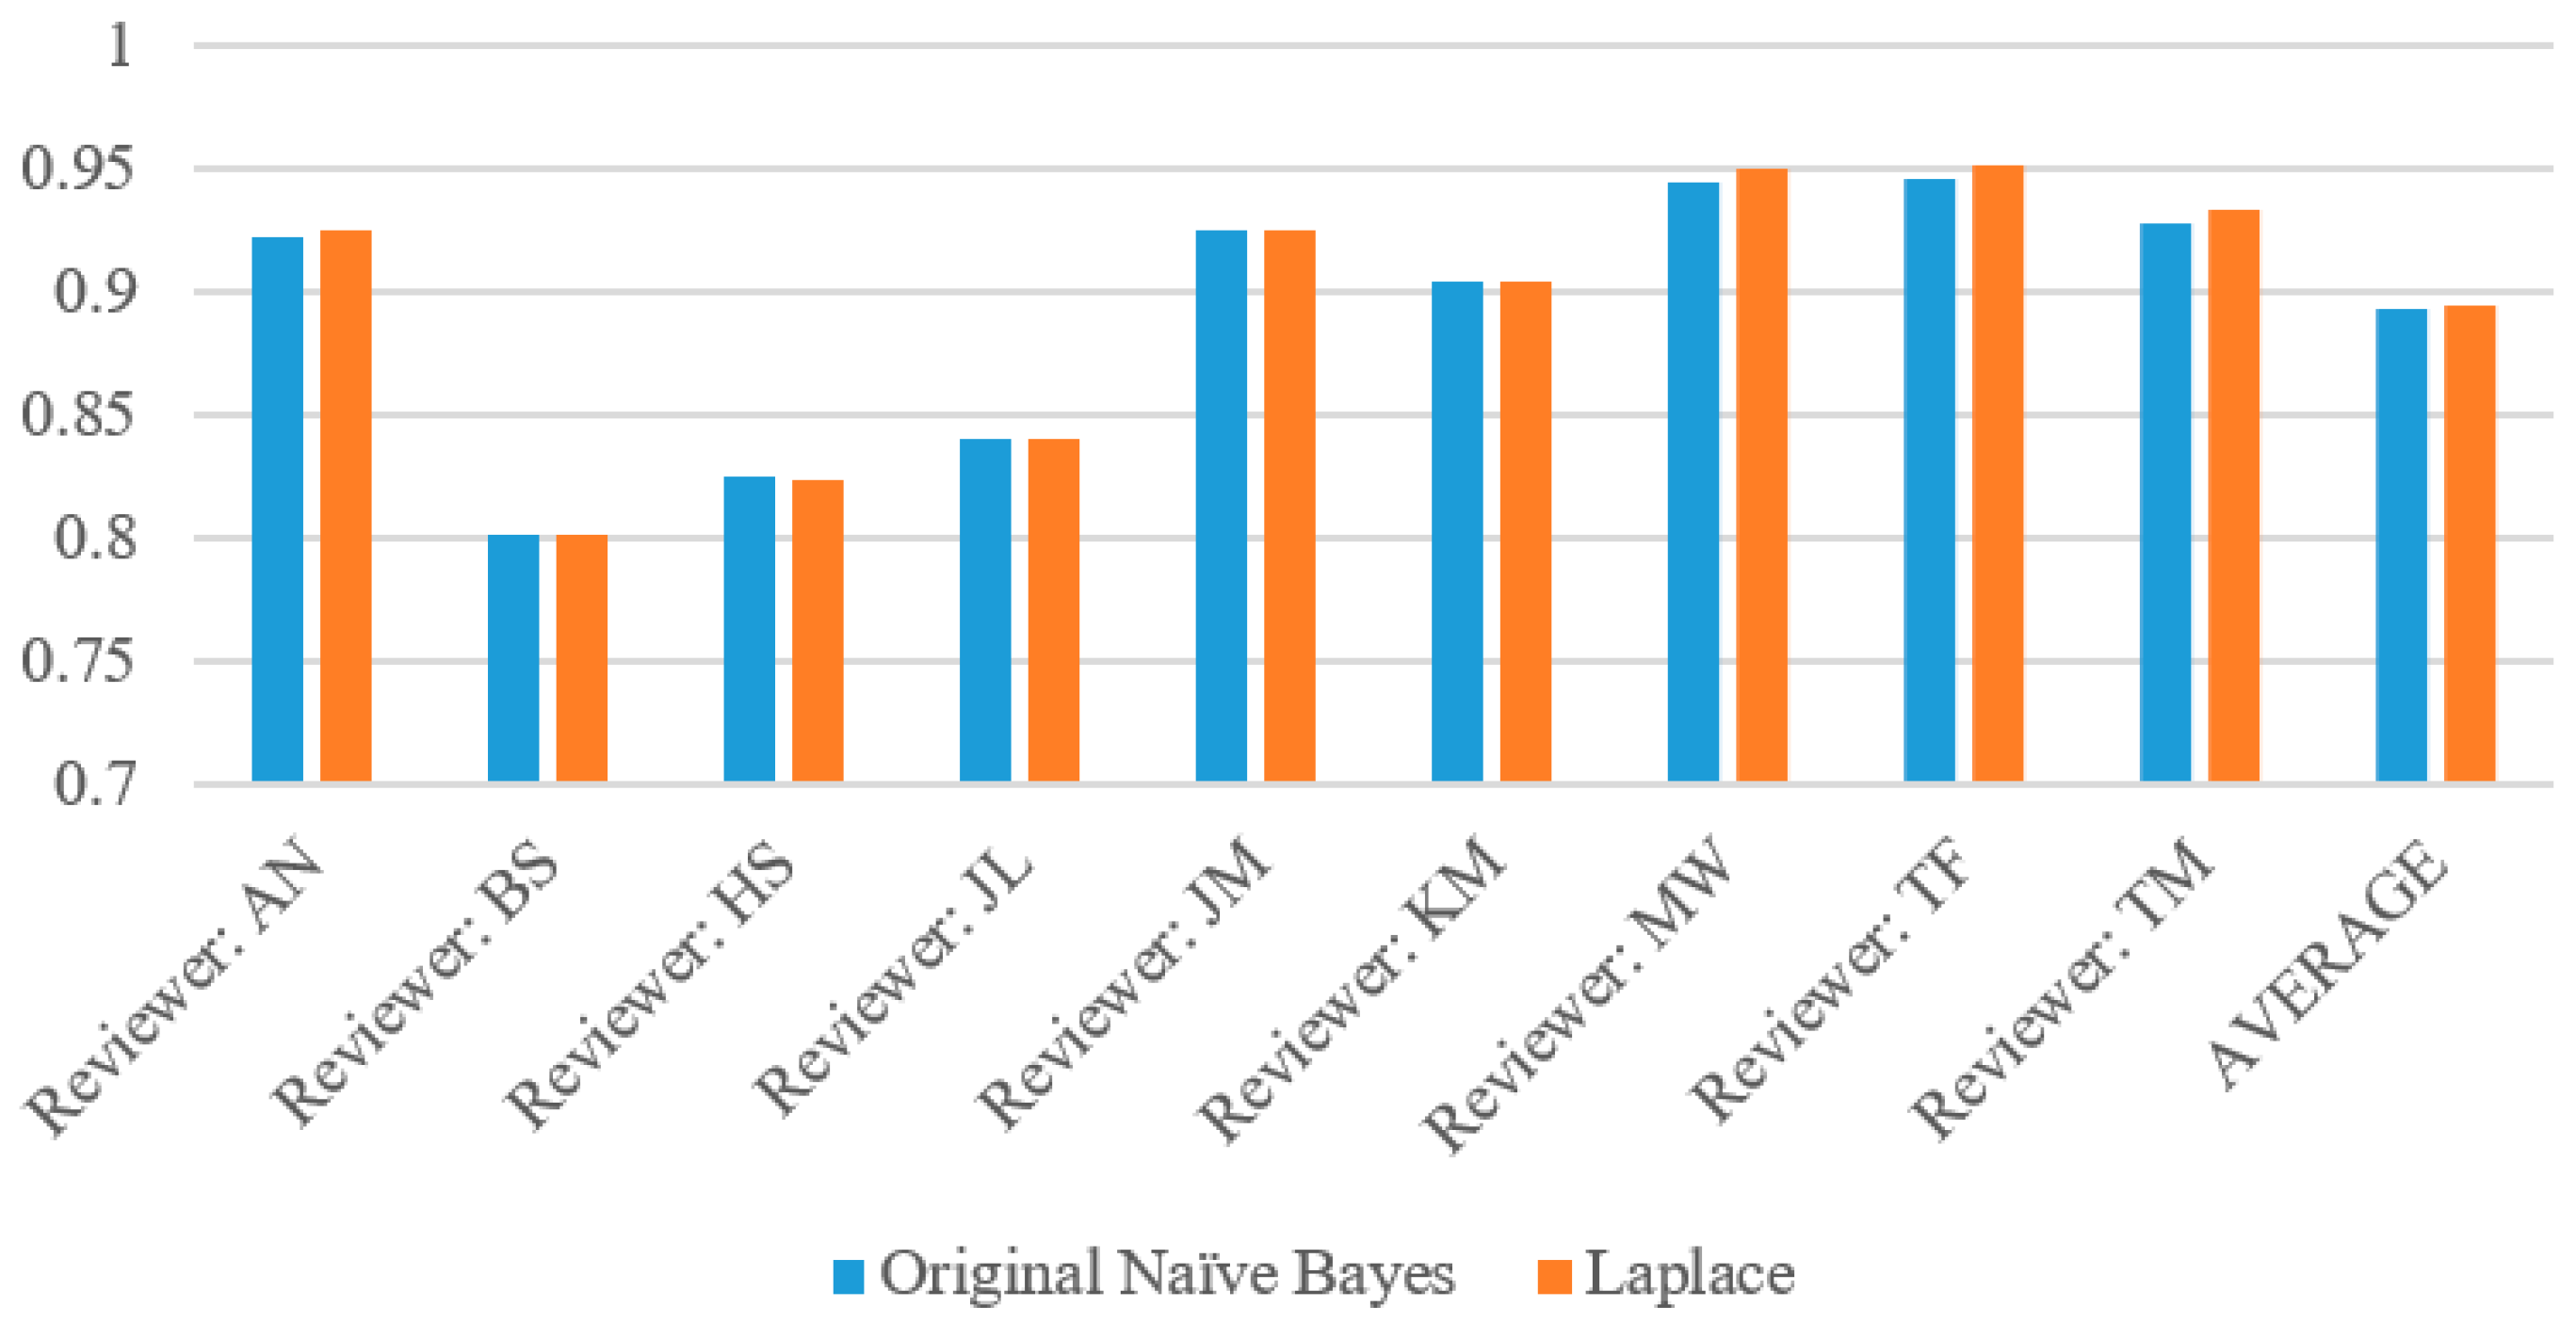
Figure 5, Figure 6, Figure 7 and Figure 8 show the accuracy, precision, recall and specificity respectively of each reviewer as summarized from Table 4. The graphs of accuracy and specificity highly correlate due to the greater sample size of below 90 wines. All of the reviewers had a very high precision, generally around 80%, with the exception of MaryAnn Worobiec, one of the two higher scoring reviewers. The recall graph appears very similar to the precision graph for each reviewer.
We also ran through the program in order to test which attributes for each reviewer correlated at positively (were likely to have a 90 or higher rating) at least 90% of the time with at least 30 instances of the attribute. For example, Table 6 shows that the attribute Intense correlates to an above 90 rating 90.9% of the time with 33 instances and each of the other attributes meet the same requirement. The purpose of this is to determine which words certain reviewers are likely to use when they describe a highly rated wine.
Based on these results, there are several reviewers that do not have positively correlated attributes. From this, we can conclude that certain reviewers have words that they are likely to fall back on when describing quality wines and we can use this information to make more accurate predictions about those particular reviewers and perhaps their biases. Unsurprisingly, nearly all of the attributes are generic praise such as “beauty,” and we can use this in our prediction models. However, an attribute such as “Turkish Coffee” may have a high rating in general or only for the particular reviewer and this requires further research.
3.2. Support Vector Machines (SVM)
The SVM algorithm had the most successful results but we cannot trace how it arrives at these results, due to the black-box nature of the algorithm. The average accuracy for the SVM is 87.2% for this dataset while the average accuracy for the Naïve Bayes is 84.2%, three percent higher. Again, reviewers MW and TF had the most successful results with the SVM as they did with the Naïve Bayes algorithm, both with more than 91% accuracy.
This is similar to previous tests where the SVM performs the most successfully. We can use this information as a guideline for programming our white-box classification algorithms. For example, the closer our algorithm is to the SVM ideal, the more reliable it is for us to use and because it would be a white-box algorithm, we could trace how it arrives at its conclusions.
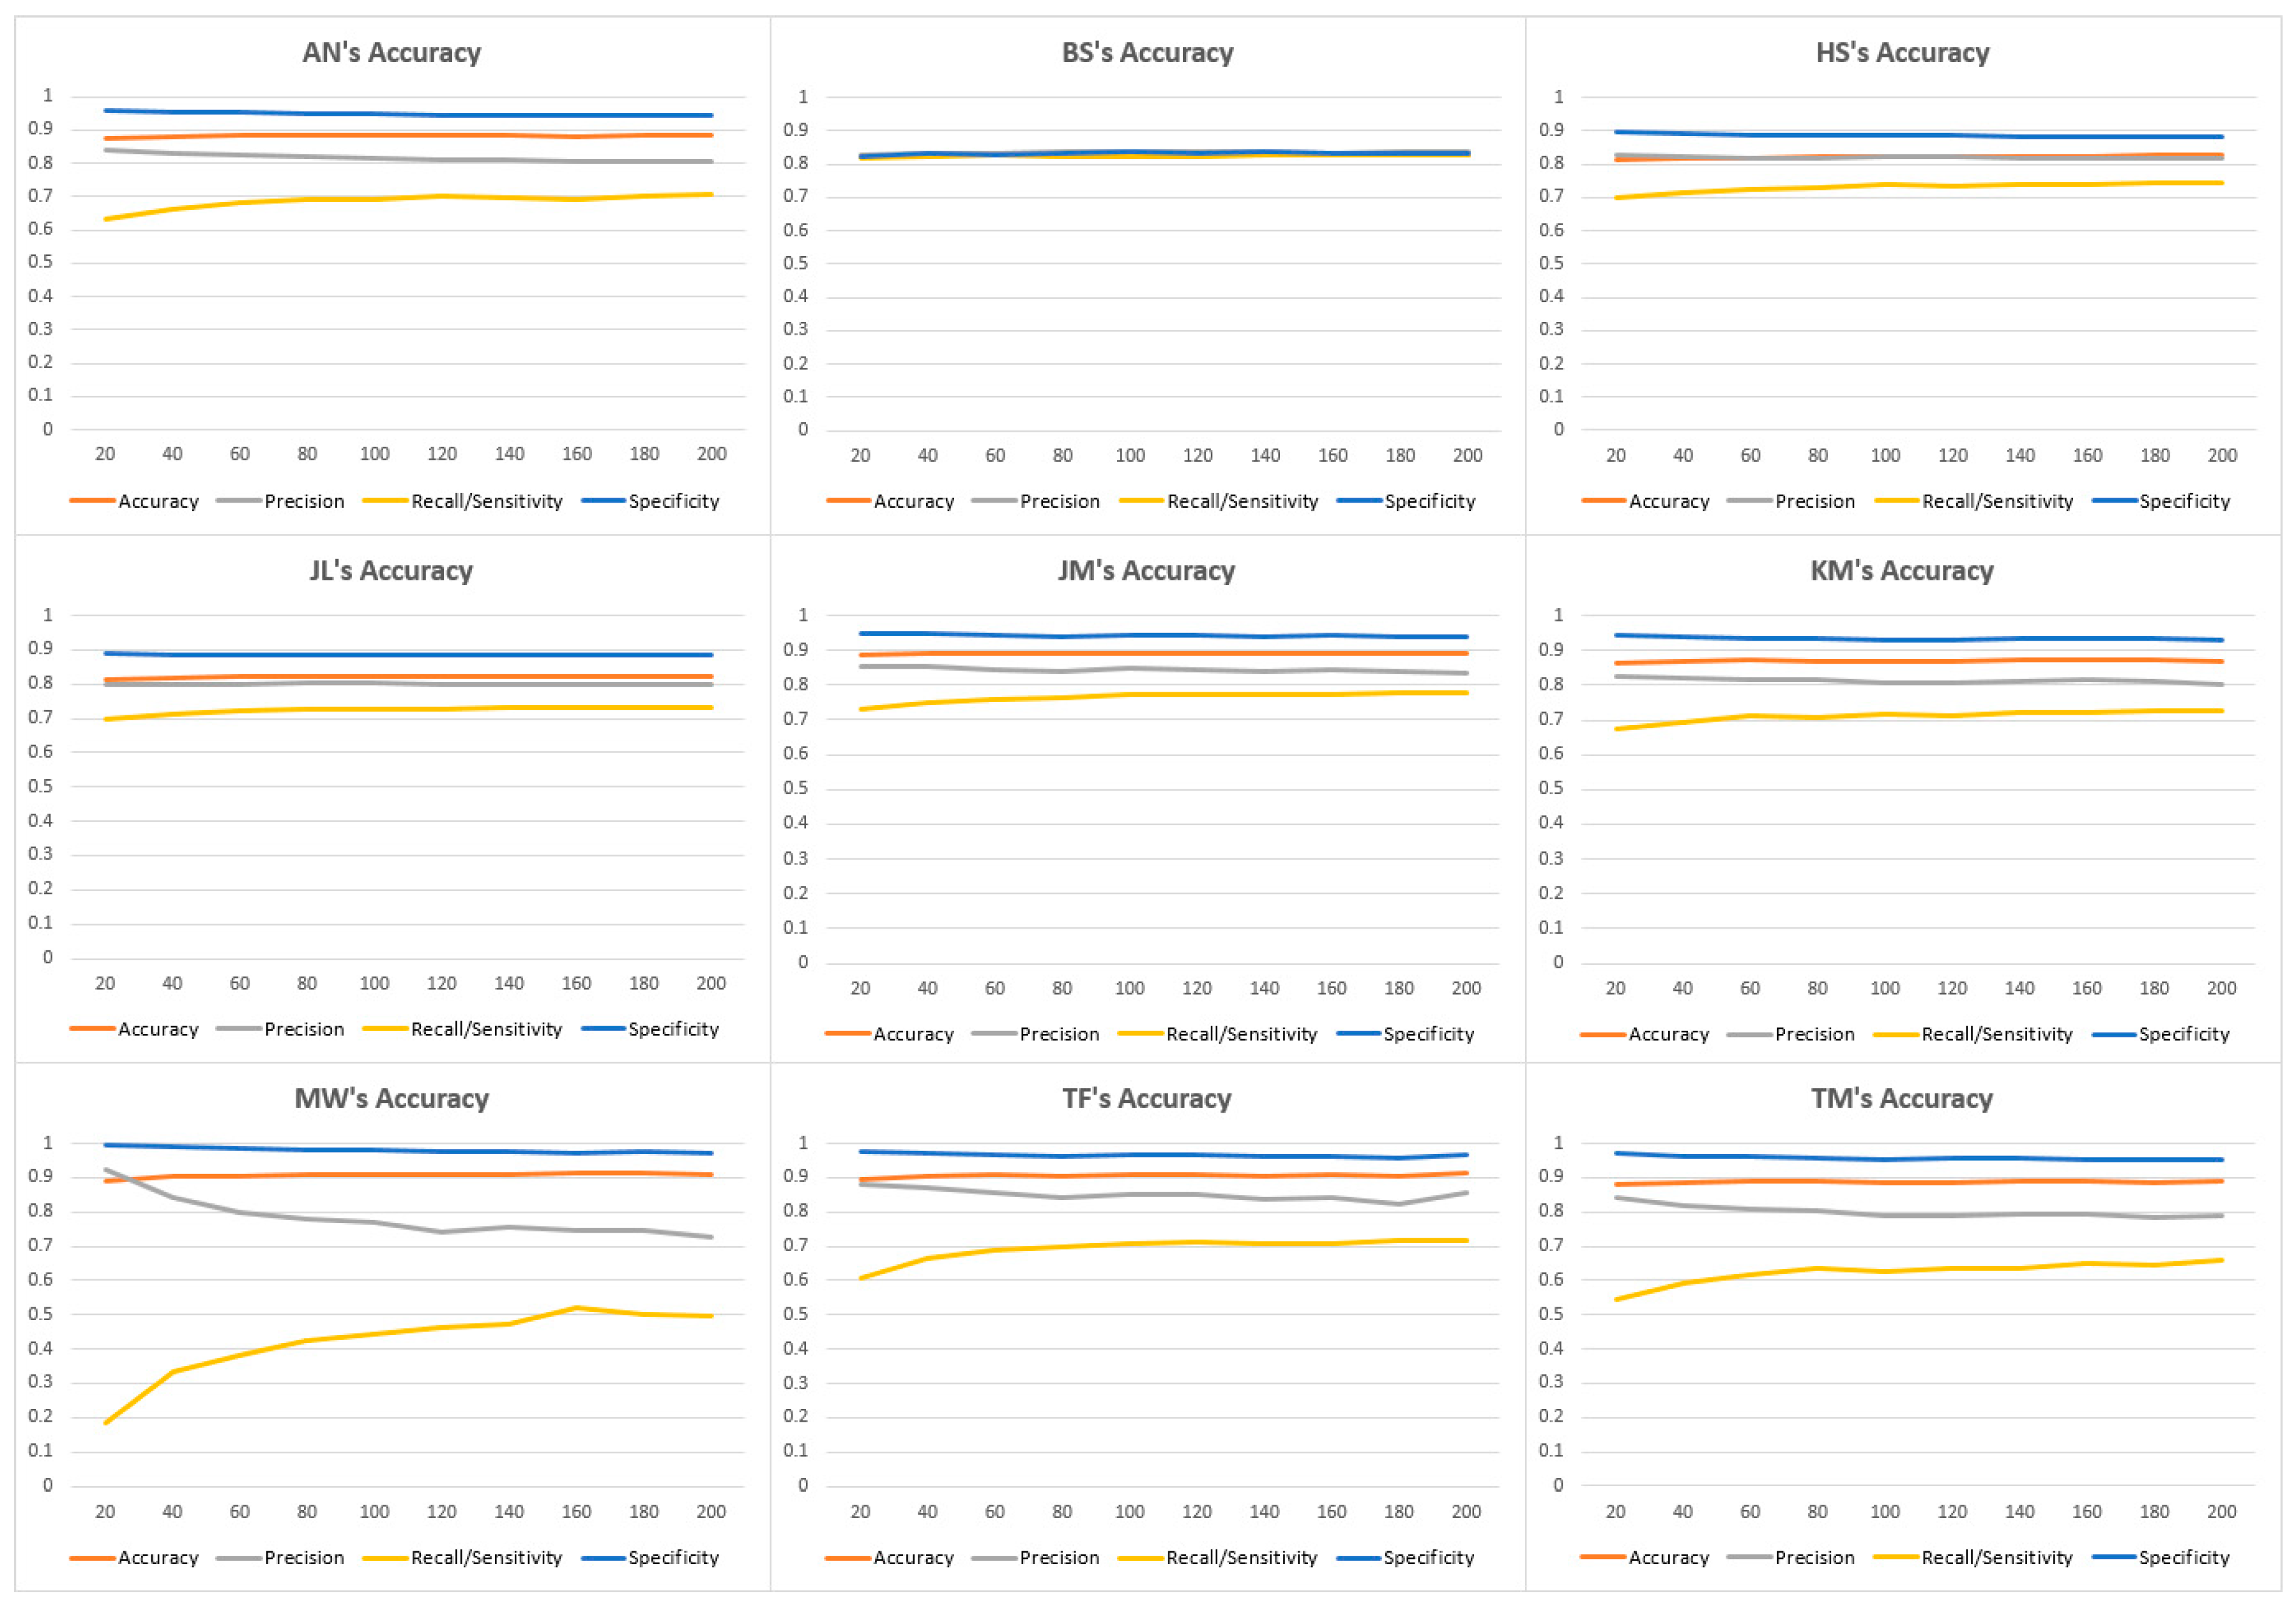
In our test of the accuracy of each reviewer using the SVM, we also tested only the aforementioned nine reviewers because the tenth, Gillian Sciaretta, lacking an adequate sample size of reviews (she had only seven reviews in the 90–94 category and zero for the 95–100 category). We used LibSVM and tested with the C parameter in order to measure the rate of true positives, false positives, true negatives and false negatives. We realized that when the parameter is a low amount (approaching zero), the SVM’s dimension fails to label any of the reviews as positive. We found that the SVM gave the most accurate results when we set the C parameter between 100 and 200. Table 7 describes the summary of the peak performance of the results. Figure 8 is derived from Table 7 and shows all four evaluation metrics for each reviewer. Most of the rest of the reviews have very high specificity, high accuracy, low precision and very low recall. We believe this is the case because Sanderson’s reviews were evenly balanced between above-90 and below-90 cases, with 49.3% of his reviews falling below 90, which demonstrates that this reviewer is more likely to rate the wines that he reviews higher.
Most of the reviewers resemble Alison Napjus’s curve, as illustrated by Figure 9. Some of the more exaggerated versions of this curve, such as MaryAnn Worobiec in Figure 9, happen when the reviewer is extremely likely to rate reviews below 90 (in her instance, 86.9% of her ratings are below 90). Table 8 demonstrates the reviewers’ rankings by SVM accuracy. From our results, we found that the most consistent reviewer is MaryAnn Worobiec because her reviews consistently have 91% accuracy.
Overall, the Naïve Bayes algorithm has provided very good results, with reviewers MaryAnn Worobiec and Tim Fish providing 88% accuracy; these reviewers reached 91% in the SVM as well. We can conclude that these two reviewers have the most reliability among the ones we have tested in determining whether the wine they have sampled would have a rating higher or lower than 90. They fit the model of our computational wine wheel’s choice of attributes more accurately than any of the other reviewers based on this information and a point of expansion may be to investigate these reviewers further or examine what attributes can improve the accuracy of the rest of the reviewers.
3.3. Comparison of Naïve Bayes and SVM
In order to compare the results obtained from two different classification methods, Table 9 is summarized from Table 4, Table 5, Table 7 and Table 8. SVM, the black box classification algorithm, produced higher accuracy results as expected. The average accuracy found in SVM reaches 87.21%; compare with the average accuracy found in Naïve Bayes (84.72%), SVM performed around 2.5% more accurate in average. All reviewers have better accuracy results; MW showed the biggest difference (improve 3.34%) while AN showed the least changes (improve 0.47%).
In terms of ranking of the reviewers, both methods give similar results. MW and TF are ranked 1st and 2nd in both SVM and Naïve Bayes. BS, HS and JL are ranked 7th, 8th and 9th in both classification methods. The middle rank 3rd, 4th and 5th show some minor differences. SVM ranked JM, TM and AN 3rd, 4th and 5th; while Naïve Bayes ranked AN, JM and TM 3rd, 4th and 5th. However, the accuracy between the three reviewers is very little. The results demonstrate in Table 9 suggest both methods have the capability to rank reviewers and be able to capture information between the reviews and the wines’ score.
4. Discussion
Wineinformatics has developed as a study that uses data science to further the understanding of wine as the domain knowledge. The main goal of this paper is to answer the question of “Who is a reliable wine judge?” in a quantitative way. More than 100,000 wine reviews are collected as the dataset and processed by the Computational Wine Wheel to produce the largest dataset in Wineinformatics. We have successfully ranked all wine reviewers in Wine Spectator through a white-box and a black-box classification algorithm. The Naïve Bayes classification algorithm also provides the “preferable” attributes/words for each wine reviewer. Reviewers MaryAnn Worobiec and Tim Fish appear to give the most accurate results in our tests, both with higher than 91% in our SVM calculations and 88% in Naïve Bayes, so these two reviewers may have the most consistency in the attributes described by their reviews. Wine Spectator as a whole also received the accuracy evaluation as high as 87.21% from SVM and 84.71% from Naïve Bayes, which supports its prestigious standing in the wine industry. Many similar Wineinformatics research topics could be developed based on this paper. We believe the potential of this work is substantial.
Author Contributions
Conceptualization, B.C.; Data curation, V.V.; Funding acquisition, T.A.; Investigation, V.V. and J.P.; Resources, T.A.; Software, V.V.; Supervision, B.C.; Validation, J.P.; Writing—original draft, B.C.
Funding
This research received no external funding.
Acknowledgments
We would like to thank the Department of Computer Science at UCA for the support of the new research application domain development.
Conflicts of Interest
The authors declare no conflict of interest.
References
- Storchmann, K. Introduction to the Issue. J. Wine Econ. 2015, 10, 1–3. [Google Scholar] [CrossRef] [Green Version]
- Quandt, R.E. A note on a test for the sum of ranksums. J. Wine Econ. 2007, 2, 98–102. [Google Scholar] [CrossRef]
- Ashton, R.H. Improving experts’ wine quality judgments: Two heads are better than one. J. Wine Econ. 2011, 6, 135–159. [Google Scholar] [CrossRef]
- Ashton, R.H. Reliability and consensus of experienced wine judges: Expertise within and between? J. Wine Econ. 2012, 7, 70–87. [Google Scholar] [CrossRef]
- Bodington, J.C. Evaluating wine-tasting results and randomness with a mixture of rank preference models. J. Wine Econ. 2015, 10, 31–46. [Google Scholar] [CrossRef]
- Fayyad, U.; Piatetsky-Shapiro, G.; Smyth, P. From data mining to knowledge discovery in databases. AI Mag. 1996, 17, 37–54. [Google Scholar] [CrossRef]
- Wu, X.D.; Zhu, X.Q.; Wu, G.-Q.; Ding, W. Data mining with big data. IEEE Trans. Knowl. Data Eng. 2014, 26, 97–107. [Google Scholar]
- Brody, S.; Elhadad, N. An unsupervised aspect-sentiment model for online reviews. In Proceedings of the Human Language Technologies: The 2010 Annual Conference of the North American Chapter of the Association for Computational Linguistics, Los Angeles, CA, USA, 2–4 June 2010; pp. 804–812. [Google Scholar]
- Zhuang, L.; Feng, J.; Zhu, X.-Y. Movie review mining and summarization. In Proceedings of the 15th ACM International Conference on Information and Knowledge Management, Arlington, WV, USA, 6–11 Novermber 2006; pp. 43–50. [Google Scholar]
- Hu, X.; Downie, J.S.; West, K.; Ehmann, A. Mining Music Reviews: Promising Preliminary Results. In Proceedings of the ISMIR 2005—6th International Conference on Music Information Retrieval, London, UK, 11–15 September 2005; pp. 536–539. [Google Scholar]
- Cortez, P.; Cerdeira, A.; Almeida, F.; Matos, T.; Reis, J. Modeling wine preferences by data mining from physicochemical properties. Decis. Support Syst. 2009, 47, 547–553. [Google Scholar] [CrossRef] [Green Version]
- Urtubia, A.; Pérez-Correa, J.R.; Soto, A.; Pszczolkowski, P. Using data mining techniques to predict industrial wine problem fermentations. Food Control 2007, 18, 1512–1517. [Google Scholar] [CrossRef]
- Capece, A.; Romaniello, R.; Siesto, G.; Pietrafesa, R.; Massari, C.; Poeta, C.; Romano, P. Selection of indigenous Saccharomyces cerevisiae strains for Nero d’Avola wine and evaluation of selected starter implantation in pilot fermentation. Int. J. Food Microbiol. 2010, 144, 187–192. [Google Scholar] [CrossRef] [PubMed]
- Edelmann, A.; Diewok, J.; Schuster, K.C.; Lendl, B. Rapid method for the discrimination of red wine cultivars based on mid-infrared spectroscopy of phenolic wine extracts. J. Agric. Food Chem. 2001, 49, 1139–1145. [Google Scholar] [CrossRef] [PubMed]
- Yeo, M.; Fletcher, T.; Shawe-Taylor, J. Machine Learning in Fine Wine Price Prediction. J. Wine Econ. 2015, 10, 151–172. [Google Scholar] [CrossRef]
- Olkin, I.; Lou, Y.; Stokes, L.; Cao, J. Analyses of wine-tasting data: A tutorial. J. Wine Econ. 2015, 10, 4–30. [Google Scholar] [CrossRef]
- Ramirez, C.D. Do tasting notes add value? Evidence from Napa wines. J. Wine Econ. 2010, 5, 143–163. [Google Scholar] [CrossRef]
- Chen, B.; Rhodes, C.; Crawford, A.; Hambuchen, L. Wineinformatics: Applying data mining on wine sensory reviews processed by the computational wine wheel. In Proceedings of the 2014 IEEE International Conference on Data Mining Workshop, Shenzhen, China, 14 December 2014; pp. 142–149. [Google Scholar]
- Chen, B.; Velchev, V.; Nicholson, B.; Garrison, J.; Iwamura, M.; Battisto, R. Wineinformatics: Uncork Napa’s Cabernet Sauvignon by Association Rule Based Classification. In Proceedings of the 2015 IEEE 14th International Conference on Machine Learning and Applications (ICMLA), Miami, FL, USA, 9–11 December 2015; pp. 565–569. [Google Scholar]
- Chen, B.; Rhodes, C.; Yu, A.; Velchev, V. Advances in Data Mining. Applications and Theoretical Aspects; The Computational Wine Wheel 2.0 and the TriMax Triclustering in Wineinformatics; Springer: New York, NY, USA, 2016; pp. 223–238. [Google Scholar]
- Chen, B.; Le, H.; Rhodes, C.; Che, D. Understanding the Wine Judges and Evaluating the Consistency Through White-Box Classification Algorithms. In Proceedings of the Industrial Conference on Data Mining, New York, NY, USA, 18–20 July 2016; Springer: New York, NY, USA, 2016; pp. 239–252. [Google Scholar]
- Ng, A.Y.; Jordan, M.I. On discriminative vs. generative classifiers: A comparison of logistic regression and naïve bayes. In Proceedings of the 14th International Conference on Neural Information Processing Systems: Natural and Synthetic, Vancouver, BC, Canada, 3–8 December 2002; pp. 841–848. [Google Scholar]
- Cortes, C.; Vapnik, V. Support-vector networks. Mach. Learn. 1995, 20, 273–297. [Google Scholar] [CrossRef] [Green Version]
Figure 1.
The review of the Kosta Browne Pinot Noir Sonoma Coast 2009 (scores 95 pts) on both chemical and sensory analysis
Figure 1.
The review of the Kosta Browne Pinot Noir Sonoma Coast 2009 (scores 95 pts) on both chemical and sensory analysis

Figure 2.
Wine Preprocessing Forms.

Figure 3.
Wine Review Format.

Figure 4.
A word cloud of all of the keywords that occur on at least 2000 different wines.

Figure 5.
Accuracy for each reviewer with both original Naïve Bayes and Laplace.

Figure 6.
Precision for each reviewer with both original Naïve Bayes and Laplace.

Figure 7.
Recall for each reviewer with both original Naïve Bayes and Laplace.

Figure 8.
Specificity for each reviewer with both original Naïve Bayes and Laplace.

Figure 9.
Evaluation results for each wine reviewer based on SVM.


Table 1.
Data Pre-processing for DOMAINE DE L’A Castillon Côtes de Bordeaux’s review.
| Wine | Berry | Excellent Finish | Blackberry | Score |
|---|---|---|---|---|
| Castillon Côtes de Bordeaux | 0 | 1 | 1 | 95 |
Table 2.
Wine Spectator review metadata from 2006–2015.
| Reviewer Judge | 80–84 | 85–89 | 90–94 | 95–100 |
|---|---|---|---|---|
| James Laube (JL) | 1250 | 7384 | 5168 | 357 |
| Kim Marcus (KM) | 1618 | 6690 | 3217 | 161 |
| Thomas Matthews (TM) | 1367 | 2981 | 1144 | 26 |
| James Molesworth (JM) | 3857 | 13,628 | 6682 | 433 |
| Bruce Sanderson (BS) | 1148 | 7677 | 8618 | 451 |
| Harvey Steiman (HS) | 708 | 7657 | 5755 | 178 |
| Tim Fish (TF) | 1236 | 2531 | 1032 | 16 |
| Alison Napjus (AN) | 1510 | 4802 | 2095 | 33 |
| MaryAnn Worobiec (MW) | 833 | 3745 | 676 | 15 |
| Gillian Sciaretta (GS) | 66 | 355 | 7 | 0 |
| Total | 13,593 | 57,450 | 34,394 | 1670 |
Table 3.
Wine Spectator reviewer profiles.
| Reviewer | Position | Tasting Beat |
|---|---|---|
| James Laube (JL) | Senior editor, Napa | California |
| Kim Marcus (KM) | Managing editor, New York | Argentina, Austria, Chile, Germany, Portugal |
| Thomas Matthews (TM) | Executive editor, New York | New York, Spain |
| James Molesworth (JM) | Senior editor, New York | Bordeaux, Finger Lakes, Loire Valley, Rhône Valley, South Africa |
| Bruce Sanderson (BS) | Senior editor, New York | Burgundy, Italy |
| Harvey Steiman (HS) | Editor at large, San Francisco | Australia, Oregon, Washington |
| Tim Fish (TF) | Senior editor, Napa | California Merlot, Zinfandel and Rhône-style wines, U.S. sparkling wines |
| Alison Napjus (AN) | Senior editor and tasting director, New York | Alsace, Beaujolais, Champagne, Italy |
| MaryAnn Worobiec (MW) | Senior editor and senior tasting coordinator, Napa | Australia, California (Petite Sirah, Sauvignon Blanc, other whites) and New Zealand |
| Gillian Sciaretta (GS) | Tasting coordinator, New York | France |
Table 4.
Evaluation results for each wine reviewer based on Naïve Bayes algorithm with and without Laplace.
Table 4.
Evaluation results for each wine reviewer based on Naïve Bayes algorithm with and without Laplace.
| Reviewer: AN | Naïve Bayes Original | Laplace Correction |
| Accuracy | 0.8728 | 0.8789 |
| Precision | 0.7763 | 0.7824 |
| Recall/Sensitivity | 0.7345 | 0.7486 |
| Specificity | 0.9231 | 0.9255 |
| Reviewer: BS | Naïve Bayes Original | Laplace Correction |
| Accuracy | 0.8026 | 0.8047 |
| Precision | 0.8082 | 0.8070 |
| Recall/Sensitivity | 0.8034 | 0.8076 |
| Specificity | 0.8017 | 0.8018 |
| Reviewer: HS | Naïve Bayes Original | Laplace Correction |
| Accuracy | 0.7910 | 0.7938 |
| Precision | 0.7552 | 0.7515 |
| Recall/Sensitivity | 0.7447 | 0.7515 |
| Specificity | 0.8246 | 0.8237 |
| Reviewer: JL | Naïve Bayes Original | Laplace Correction |
| Accuracy | 0.8028 | 0.8059 |
| Precision | 0.7533 | 0.7516 |
| Recall/Sensitivity | 0.7444 | 0.7511 |
| Specificity | 0.8409 | 0.8410 |
| Reviewer: JM | Naïve Bayes Original | Laplace Correction |
| Accuracy | 0.8682 | 0.8704 |
| Precision | 0.8234 | 0.8238 |
| Recall/Sensitivity | 0.7468 | 0.7518 |
| Specificity | 0.9250 | 0.9254 |
| Reviewer: KM | Naïve Bayes Original | Laplace Correction |
| Accuracy | 0.8452 | 0.84947 |
| Precision | 0.7726 | 0.77235 |
| Recall/Sensitivity | 0.7150 | 0.72492 |
| Specificity | 0.9044 | 0.9049 |
| Reviewer: MW | Naïve Bayes Original | Laplace Correction |
| Accuracy | 0.8736 | 0.8804 |
| Precision | 0.6526 | 0.6874 |
| Recall/Sensitivity | 0.5142 | 0.5343 |
| Specificity | 0.9453 | 0.9506 |
| Reviewer: TF | Naïve Bayes Original | Laplace Correction |
| Accuracy | 0.8737 | 0.8816 |
| Precision | 0.8187 | 0.8368 |
| Recall/Sensitivity | 0.6724 | 0.6873 |
| Specificity | 0.9463 | 0.9516 |
| Reviewer: TM | Naïve Bayes Original | Laplace Correction |
| Accuracy | 0.8483 | 0.8591 |
| Precision | 0.7478 | 0.7675 |
| Recall/Sensitivity | 0.6175 | 0.6400 |
| Specificity | 0.9280 | 0.9339 |
| Average | Naïve Bayes Original | Laplace Correction |
| Accuracy | 0.8420 | 0.8471 |
| Precision | 0.7676 | 0.7756 |
| Recall/Sensitivity | 0.6992 | 0.7108 |
| Specificity | 0.8932 | 0.8954 |
Table 5.
Reviewers by order of Naïve Bayes accuracy.
| Reviewer | Original Naïve Bayes | Laplace |
|---|---|---|
| TF | 0.8737 | 0.8816 |
| MW | 0.8736 | 0.8804 |
| AN | 0.8728 | 0.8789 |
| JM | 0.8682 | 0.8704 |
| TM | 0.8483 | 0.8591 |
| KM | 0.8452 | 0.8494 |
| Average | 0.8420 | 0.8471 |
| JL | 0.8028 | 0.8059 |
| BS | 0.8026 | 0.8047 |
| HS | 0.7910 | 0.7938 |
Table 6.
Naïve Bayes Positively Correlated Attributes.
| Reviewer | Attributes Correlated Positively (>90 Rating) with at Least 30 Instances |
|---|---|
| AN | Intense 30/33, Beauty 55/58, Power 57/59, Seamless 43/44, Finesse 41/45 |
| BS | Alluring 103/112, Excellent 182/184, Terrific 170/175, Refined 171/182, Seamless 77/80, Potential 141/149, Detailed 104/114, Beauty 285/290, Seductive 35/37, Gorgeous 33/34, Ethereal 50/53 |
| HS | Deep 58/61, Elegant 276/305, Power 156/172, Long 765/849, Impresses 214/232, Complex 238/264, Seductive 83/92, Beauty 215/228, Tension 33/36, Remarkable 29/32, Gorgeous 71/73, Tremendous 53/53 |
| JL | Plush 93/101, Seductive 82/88, Delicious 97/104, Wonderful 125/130, Opulent 41/44, Beauty 114/115, Remarkable 33/33, Gorgeous 65/65, Amazing 57/57 |
| JM | Rock Solid 155/171, Seamless 146/162, Impresses 186/192, Turkish Coffee 69/75, Packed 150/159, Serious 94/98, Remarkable 51/52, Gorgeous 360/361, Terrific 104/104, Beauty 148/148, Wonderful 49/49, Backward 36/36, Stunning 57/57 |
| KM | Complex 173/188 |
| TM | Long 72/78 |
Table 7.
Evaluation results for each wine reviewer based on SVM.
| Reviewer: AN | Evaluation Scores |
| Accuracy | 0.8836 |
| Precision | 0.8408 |
| Recall/Sensitivity | 0.7053 |
| Specificity | 0.9597 |
| Reviewer: BS | Evaluation Scores |
| Accuracy | 0.8312 |
| Precision | 0.8380 |
| Recall/Sensitivity | 0.8274 |
| Specificity | 0.8358 |
| Reviewer: HS | Evaluation Scores |
| Accuracy | 0.8264 |
| Precision | 0.8255 |
| Recall/Sensitivity | 0.7456 |
| Specificity | 0.8955 |
| Reviewer: JL | Evaluation Scores |
| Accuracy | 0.8247 |
| Precision | 0.8026 |
| Recall/Sensitivity | 0.7337 |
| Specificity | 0.8876 |
| Reviewer: JM | Evaluation Scores |
| Accuracy | 0.8935 |
| Precision | 0.8547 |
| Recall/Sensitivity | 0.7780 |
| Specificity | 0.9496 |
| Reviewer: KM | Evaluation Scores |
| Accuracy | 0.8729 |
| Precision | 0.8242 |
| Recall/Sensitivity | 0.7279 |
| Specificity | 0.9417 |
| Reviewer: MW | Evaluation Scores |
| Accuracy | 0.9138 |
| Precision | 0.9214 |
| Recall/Sensitivity | 0.5209 |
| Specificity | 0.9975 |
| Reviewer: TF | Evaluation Scores |
| Accuracy | 0.9121 |
| Precision | 0.8807 |
| Recall/Sensitivity | 0.7185 |
| Specificity | 0.9771 |
| Reviewer: TM | Evaluation Scores |
| Accuracy | 0.8905 |
| Precision | 0.8405 |
| Recall/Sensitivity | 0.6589 |
| Specificity | 0.9721 |
| Average | Evaluation Scores |
| Accuracy | 0.8721 |
| Precision | 0.8476 |
| Recall/Sensitivity | 0.7129 |
| Specificity | 0.9352 |
Table 8.
Reviewers by order of SVM accuracy.
| Reviewer | SVM Peak |
|---|---|
| MW | 0.9138 |
| TF | 0.9121 |
| JM | 0.8935 |
| TM | 0.8905 |
| AN | 0.8836 |
| KM | 0.8729 |
| Average | 0.8721 |
| BS | 0.8312 |
| HS | 0.8264 |
| JL | 0.8247 |
Table 9.
Comparison results obtained from SVM and Naïve Bayes.
| Reviewer: AN | SVM | SVM Rank | Naïve Bayes with Laplace | Naïve Bayes Rank |
|---|---|---|---|---|
| AN | 0.8836 | 5 | 0.8789 | 3 |
| BS | 0.8312 | 7 | 0.8047 | 8 |
| HS | 0.8264 | 8 | 0.7938 | 9 |
| JL | 0.8247 | 9 | 0.8059 | 7 |
| JM | 0.8935 | 3 | 0.8704 | 4 |
| KM | 0.8729 | 6 | 0.8494 | 6 |
| MW | 0.9138 | 1 | 0.8804 | 2 |
| TF | 0.9121 | 2 | 0.8816 | 1 |
| TM | 0.8905 | 4 | 0.8591 | 5 |
| Average | 0.8721 | – | 0.8471 | – |
© 2018 by the authors. Licensee MDPI, Basel, Switzerland. This article is an open access article distributed under the terms and conditions of the Creative Commons Attribution (CC BY) license (http://creativecommons.org/licenses/by/4.0/).
Share and Cite
MDPI and ACS Style
Chen, B.; Velchev, V.; Palmer, J.; Atkison, T. Wineinformatics: A Quantitative Analysis of Wine Reviewers. Fermentation 2018, 4, 82. https://0-doi-org.brum.beds.ac.uk/10.3390/fermentation4040082
AMA Style
Chen B, Velchev V, Palmer J, Atkison T. Wineinformatics: A Quantitative Analysis of Wine Reviewers. Fermentation. 2018; 4(4):82. https://0-doi-org.brum.beds.ac.uk/10.3390/fermentation4040082
Chicago/Turabian StyleChen, Bernard, Valentin Velchev, James Palmer, and Travis Atkison. 2018. "Wineinformatics: A Quantitative Analysis of Wine Reviewers" Fermentation 4, no. 4: 82. https://0-doi-org.brum.beds.ac.uk/10.3390/fermentation4040082
Note that from the first issue of 2016, this journal uses article numbers instead of page numbers. See further details here.