Article

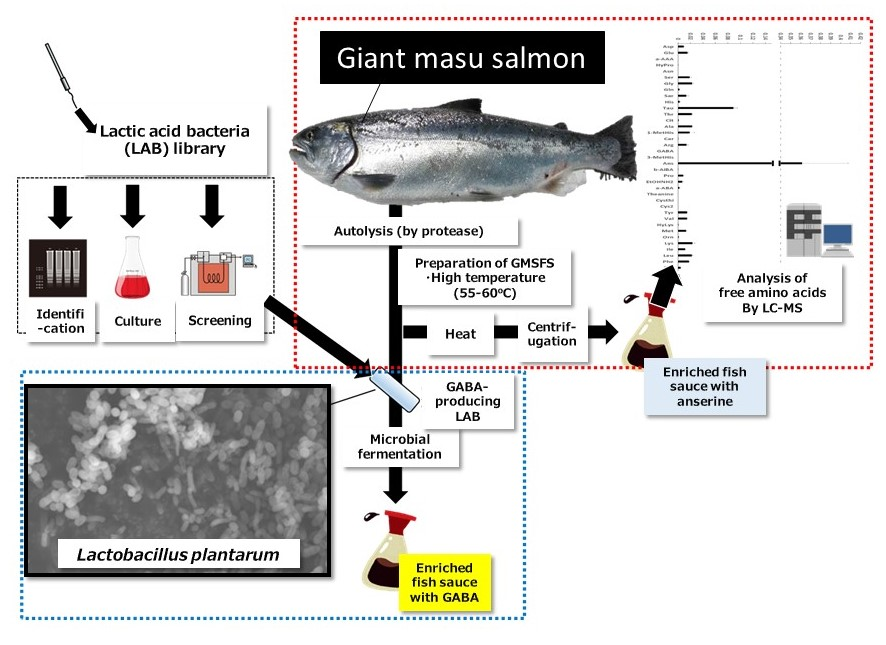
Production of Anserine-Rich Fish Sauce from Giant Masu Salmon, Oncorhynchus masou masou and γ-Aminobutyric Acid (GABA)-Enrichment by Lactobacillus plantarum Strain N10

Department of Marine Biology and Environmental Sciences, Faculty of Miyazaki, Gakuen-kibanadai-nisi 1-1, Miyazaki 889-2192, Japan
*
Author to whom correspondence should be addressed.
Submission received: 8 March 2019 / Revised: 23 May 2019 / Accepted: 24 May 2019 / Published: 30 May 2019
(This article belongs to the Special Issue Lactic Acid Fermentation and the Colours of Biotechnology)

Abstract

:
Previously, we developed a novel production technique for giant masu salmon (GMS). This study aimed to develop a fish sauce from GMS to explore ways to efficiently utilize the salmon and to enrich the fish sauce with γ-aminobutyric acid (GABA) by microbial fermentation. The minced bodies of GMS were autolyzed by endogenous protease at 55 °C and 60 °C. During autolysis, the changes in total free amino acids and protein size was monitored by LC-MS and SDS-PAGE analysis, respectively. After 96 h, fish sauce was prepared by heating, and the amino acid composition was analyzed by LC-MS. To enrich the fish sauce with GABA, Lactobacillus plantarum strain N10 was added and incubated at 28 °C for 48 h. The total free amino acids content significantly increased for 96 h. SDS-PAGE analysis showed that major bands at 200 kDa and 48 kDa detected at 0 h gradually disappeared over time. The ratio of anserine to total amino acids in the fish sauce was approximately 36%. The concentration of GABA in the fish sauce significantly increased through the addition of strain N10. Thus, anserine-rich fish sauce could be quickly produced from GMS, and the fish sauce was enriched with GABA by microbial fermentation.

Graphical Abstract

1. Introduction

In 2013, Miyazaki prefecture, Japan, presented a food business-promotion plan. One of the plan’s primary objectives was the efficient utilization of farm and fisheries products with added value. These trials under the government initiative were expected to encourage the creation of novel local industries in the field of fisheries, based on industry-academia-government collaboration. Gokase City, in northern Miyazaki, has been culturing the masu salmon, Oncorhynchus masou masou, and the muscle and eggs produced are important food products in the local area. There are two types of O. masou masou, based on the species’ life cycle. For the first part of the cycle, O. masou masou live only in freshwater environments, such as rivers and lakes, and are classified with landlocked varieties of salmon (residual type) known as “Yamame” in Japanese. In the second part of the life cycle, O. masou masou run to sea from the river, and are classified as sea-run varieties (seaward type), referred to as “masu salmon” in English and “Sakuramasu” in Japanese. In salmon production, the transformation from larvae to smolt occurs in the spring. A silver sheen replaces the parr marks, and the color of the edges of the pectoral and caudal fins darkens. In the process of smolting, fish increase their osmoregulation ability and start to adapt to life in a marine environment. However, some populations remain in inland areas without running to the sea [1,2].
In masu salmon production in Gokase City during the winter season, the growth of fish reared in inland rivers is strongly inhibited due to lower water temperatures. This late growth in the winter season is one of the bottlenecks hindering the enhancement of profitability in the masu salmon culture industry. In this study, we focused on the characteristic of masu salmon that allows its high adaptation to a marine environment by smolting. Nobeoka City is located to the east of Gokase, and the water temperature at the seaside is above 20 °C during the winter, due to warm ocean currents, such as the Kuroshio Current. We succeeded in establishing a production technique for giant masu salmon by transferring landlocked yamame to the sea for rearing during the winter season. The production rate and yield of the fish-mass were significantly increased by culturing in seawater.
A significant increase of fish biomass, however, means a corresponding increase in the residues of production, such as eyes, internal organs, bones, and skin. Therefore, novel applications for masu salmon products, including production residues, are needed from the viewpoint of full utilization of resources. In this study, we planned to produce a fish sauce from the residues of giant masu salmon production. In Asian countries including Japan, fish sauce is made from various aquatic species, such as anchovies, mackerel, herring, squid, and sea urchin [3]. Fish sauce has a prominent umami component, and it contains glutamic acids from some ingredients and fish meat; the balance of the taste is comparable to that of soy sauce [4,5]. Recently, the production of traditional fish sauce has decreased, but the production of microbial fermented fishery seasoning has been increasing [6].
Fish sauce is a common fermented fishery product in Southeast Asia, and extra value can be added based on the fermentation process [7]. The sauce is produced by mixing large portions of salts and fermented fish products together at ambient temperature for a period lasting from a few months to a few years. In the process of fermentation, the protein is hydrolyzed by endogenous proteases, which are proteolytic enzymes contained in the aquatic animals. By means of this auto-digestion, the fish protein is degraded to lower molecules, such as peptides and amino acids [8]. In addition to autolysis, the protease produced by halophilic bacteria accelerates protein hydrolysis, and produces various volatile compounds and organic acids such as acetic acids [9]. The production of volatile compounds is related to the flavor of the end product.
Sometimes, fish sauces accumulate histamines from various fish species and from the fermentation process that are known to cause allergic reactions. Histamines are a biogenic amine and are synthesized by pyridoxal phosphate (vitamin B-6)–containing L-histidine decarboxylase (HDC) from histidine as a precursor [10,11]. HDC is formed from histamine-producing bacteria in fisheries products, and the histidine level in fish muscle affects the amount of histamine produced [12]. Maintaining low levels of histamine in fish sanitation is very important from the perspective of food sanitation.
Furthermore, to develop a functional fish sauce, we focused on lactic acid bacteria (LAB) and γ-aminobutyuric acid (GABA). LAB are gram positive bacteria and known through ages for various their applications in foods industries such as fermented foods and food processing, and chemical industries and pharmaceutical field. Lactic acid fermentation is one of the ways to preserve food contamination and add nutritional and sensory properties [13]. LAB can produce not only lactic acid but also various substances such as extracellular polysaccharides, glucans, diacetyl, bactriocins, enzymes, and vitamins using carbohydrates as energy sources [14,15]. Therefore, LAB is widely applied as starter cultures in fermented foods, probiotics, and/or biopreservative agents [16,17,18]. Additionally, it is known that some LAB can produce GABA [19,20,21]. It is well known that GABA is a functional non-protein amino acid that is synthesized from glutamate via decarboxylation due to an enzymatic reaction or through the degradation of polyamine [22]. GABA acts physiologically in our body, such as in the regulation of cardiovascular and pituitary functions, the inhibition of the metastasis of cancer cells, the modulation of renal function, and the stabilization of mood disorders [23,24,25,26]. Moreover, stress relief effects and antihypertensive and sedative effects have been well documented in humans [27,28]. Therefore, GABA-containing products—such as drinks, snacks, and supplements—are sold widely on the market.
This study aimed to design a tailored LAB starter culture to develop a novel functional fish sauce using giant masu salmon. Our approach allows avoiding the traditional/spontaneous fermentation process of fish sauce that takes a long time and is inadequate for the safe/steady production of commercial products [29]. Additionally, in the traditional process, large amounts of added salt are needed to prevent bacterial contamination, but the high salt concentration in the product is unfavorable from the perspective of recent health-focused food trends [30].
Therefore, we performed this study as following experimental scheme; (1) isolation of GABA-producing LAB and identification, (2) growth test of GABA-producing LAB under the different NaCl concentrations, pH, and temperatures, (3) effect of high temperatures on indigenous protease activity from masu salmon, (4) change of protein content and protein molecular size during autolysis of masu salmon, (5) evaluation of food sanitation in fish sauce from the viewpoints of bacterial growth and histamine accumulation, (6) change of free amino acid content and amino acid profile in fish sauce, and (7) enrichment of fish sauce with GABA by GABA-producing LAB.

2. Materials and Methods

2.1. Isolation of LAB

LAB was isolated from various handmade fermented foods such as kimchi (leaves of Japanese white radish, Japanese white radish, leaf mustard, Chinese cabbage, cucumber, seaweed, octopus, and sea squirts) and Japanese pickled vegetables which are referred to as tsukemono in Japanese (Chinese white radish and Chinese cabbage). Each source of LAB was homogenized and serially diluted with a sterile 0.85% NaCl solution. Ten-fold serial dilutions were inoculated on a GYP agar plate medium (glucose 1.0 g, yeast extract 1.0 g, bacto peptone 0.5 g, meat extract 0.2 g, 0.5 mL of a salt solution consisting of MgSO4·7H2O 40 mg, MnSO4·4H2O 2 mg, FeSO4·7H2O 2 mg, NaCl 2 mg, and 1 mL of distilled water, 5% (w/v) tween 80 solution 1.0 mL, CaCO3 0.5 g, agar 1.2 g, 0.1% (w/v) cycloheximide solution 1.0 mL, 0.1% (w/v) sodium azide solution 1.0 mL and distilled water 100 mL (pH 6.8)). They were then incubated at 28 °C for 96 h. Colonies on the plates were aseptically picked up and repeatedly inoculated on the same medium to purify them. Isolates were tentatively identified as LAB using the catalase test and acid production on a GYP agar medium.

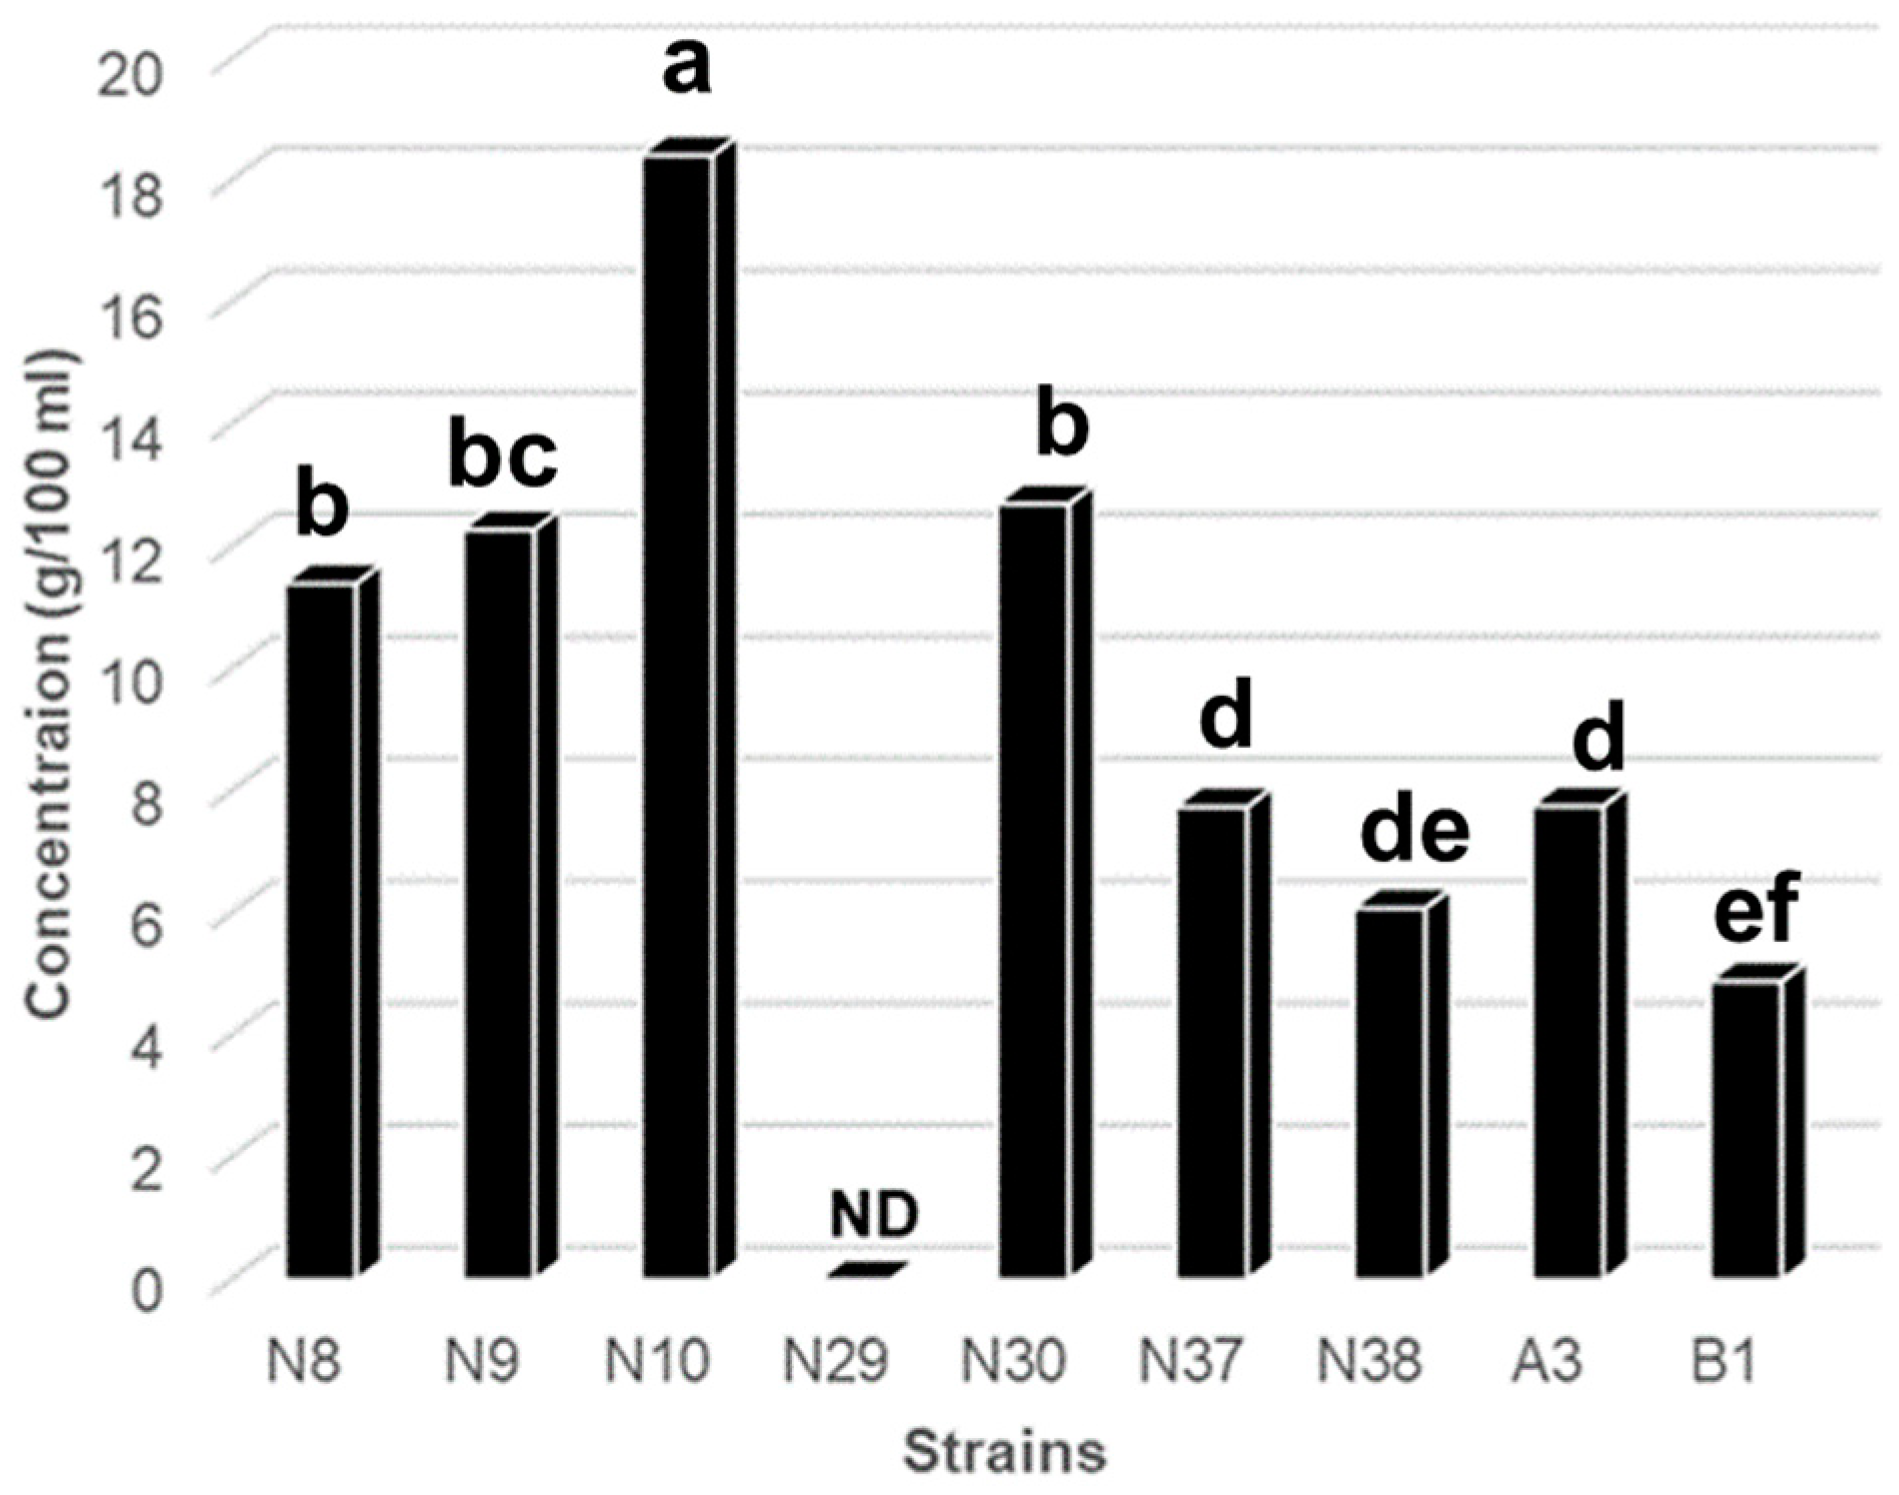
2.2. Screening of GABA-Producing LAB by Thin Layer Chromatography (TLC) and Determination of GABA by Liquid Chromatography-Mass Spectrometry (LC-MS)

Isolated strains were cultivated in a de Man, Rogosa, Sharpe (MRS) liquid medium (Difco, Sparks, MD, USA) containing 1.0% (w/v) monosodium glutamate at 28 °C for 96 h. After incubation, the cultures were centrifuged at 5000× g for 10 min, and the supernatant was collected for TLC analysis. The TLC Silica gel 60F254 (Merk, Darmstadt, Germany) was activated by heating in an oven at 100 °C for 2 h. The culture supernatant (2 µL) was spotted on the silica gel plate using a micropipette, and the plates were developed using solvent mixtures (1-butanol/acetic acid/distilled water: 5/1/1 (v/v/v)). The spots on the plates were visualized by spraying 2% (w/v) ninhydrin solution and heated at 105 °C for 10 min. As standard solutions, GABA solution (2 mg/mL) and sodium glutamate solution (20 mg/mL) were used. The concentration of GABA in the culture supernatant was determined by LC-MS as described below.

2.3. Extraction of DNA and Amplification of 16S rRNA Genes by Polymerase Chain Reaction (PCR)

To the extract genomic DNA of the isolates, the cultured cells in an MRS liquid medium were collected by centrifugation at 5000× g for 10 min. The cell pellets were washed with TE buffer (10 mM Tris-HCl buffer (pH 8.0) and 1 mM ethylenediaminetetraacetic acid (EDTA)) twice and re-suspended in 400 µL of TE buffer. The cell suspensions were mixed with 20 µL of protenase K solution (6 mg/mL) and 80 µL of 5% (w/v) sodium dodecyl sulfate solution at 60 °C in a water bath for 2 h. The genomic DNA was extracted and purified according to the standard phenol chloroform method [31].
Amplification of the 16S rRNA gene was performed with pairs of two universal primers, 27f (5′-AGAGTTTGATCCTGGCTCAG-3′) and 1525r (5′AAAGGAGGTGATCCAGCC-3′). The composition of the PCR mixture was 2 µL of 10 × Ex Taq buffer, 0.4 µL of deoxynucleoside triphosphate (10 mM each), 0.2 µL of two universal primers (final concentration in a mixture, 1 µM), 1 µL of template DNA (1 ng/µL), 0.1 µL of Takara Ex Taq DNA polymerase (5 U/µL) and 16.1 µL of pure water. PCR was performed in a thermal cycler (Bio-Rad, Tokyo, Japan) using the following protocol: initial denaturation for 2 min at 95 °C, 30 cycles of denaturation for 1 min at 95 °C, annealing for 1 min at 55 °C and extension for 1 min at 72 °C, and final incubation for 10 min at 72 °C. The quality of the PCR products was checked by electrophoresis on a 1.5% (w/v) agarose gel stained with SYBR® Safe DNA gel stain (Thermo Fisher Scientific, Waltham, MA, USA) in a TAE buffer (40 mM Tris-HCl buffer, 20 mM acetic acid and 1 mM EDTA) at 100 V for 30 min. The PCR products were visualized by irradiation with a light emitting-diode, and the sizes of the PCR products were estimated using a standard 100 bp DNA ladder maker (Shinkouseiki Co. Ltd., Fukuoka, Japan). The PCR products were purified by the polyethylene glycol precipitation method [32]. The sequencing of the purified PCR products was carried out with an Applied Biosystems 3730 × l DNA analyzer (Thermo Fisher Scientific Inc., Yokohama, Japan) using pairs of universal primers.

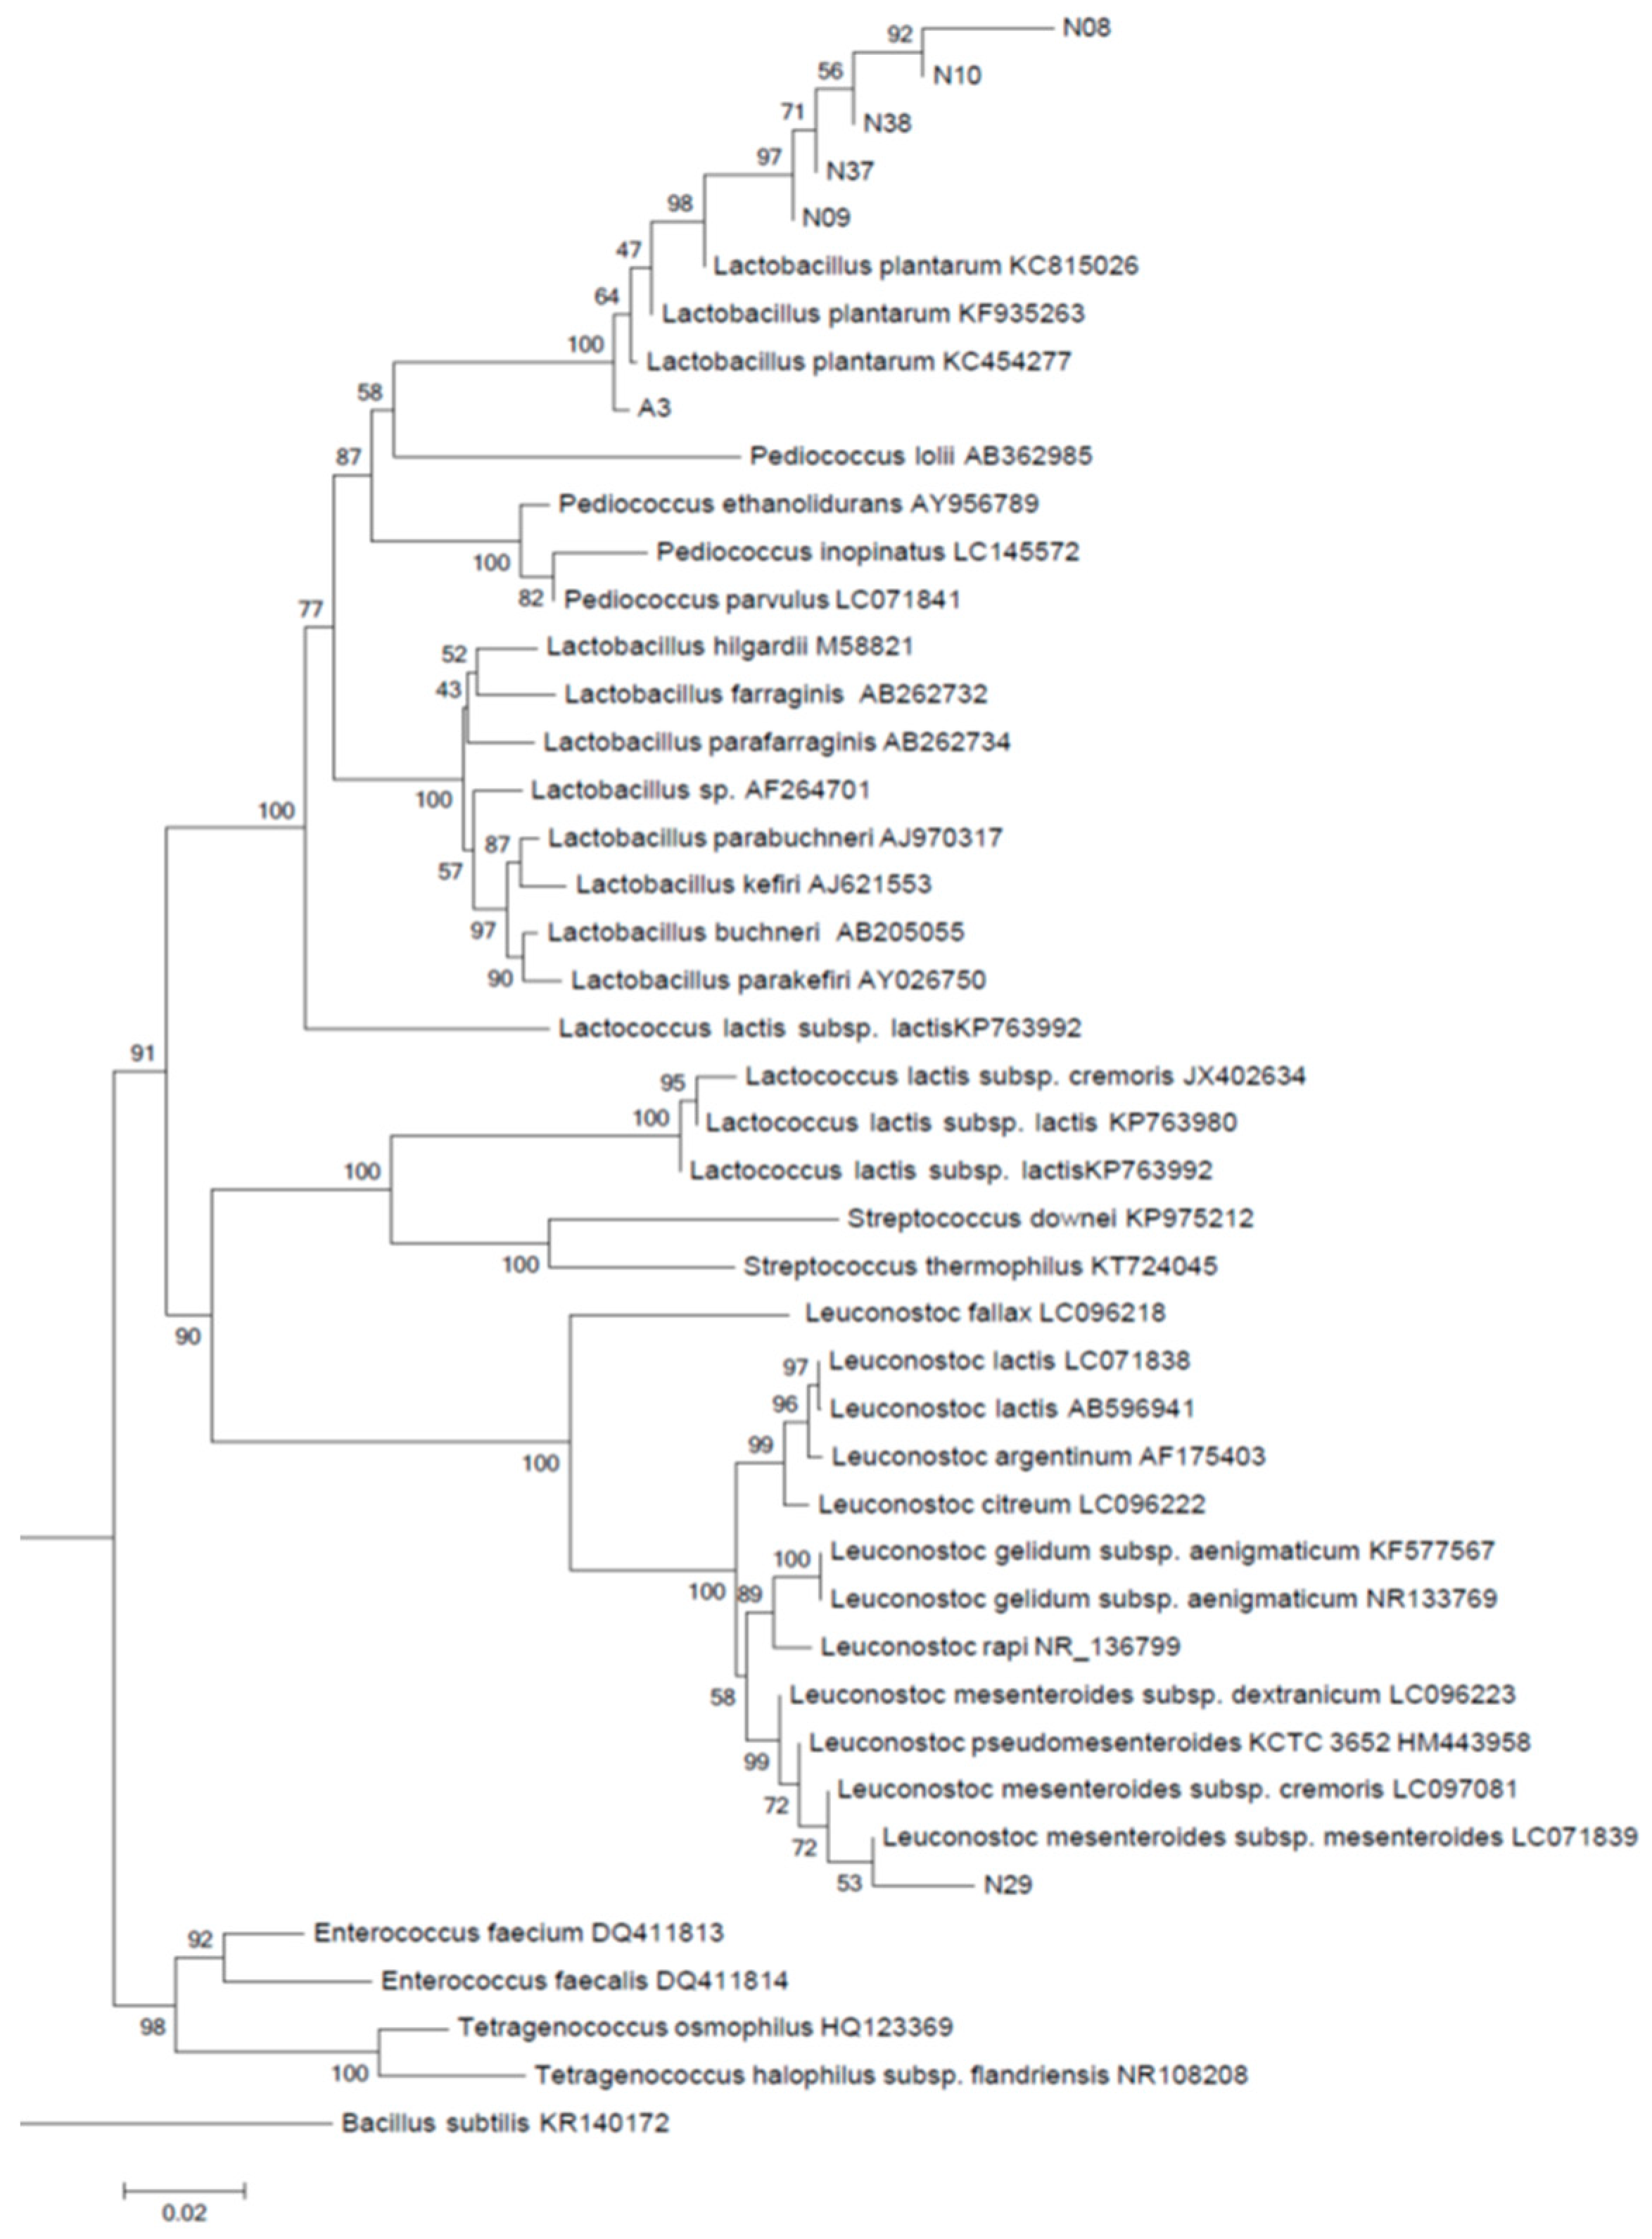
2.4. Basic Local Alightment Search Tool (BLAST) ANALYSIS and Phylogenetic Analysis

The partial sequence data of the 16 S rRNA genes (683–748 bp) were deposited in the database of the National Center for Biotechnology Information (NCBI). These sequence data were compared with the public database in GenBank using BLAST, and the closest known relatives were obtained.
The sequence data of the 16S rRNA genes from the isolates were aligned using CLUSTALX version [33]. The evolutionary distance among isolates and other kinds of LAB obtained from the GenBank database in the NCBI was calculated according to the method of the Kimura two-parameters model [34]. The phylogenetic tree was constructed based on the neighbor-joining method [35] using MEGA version 7.0 [36].

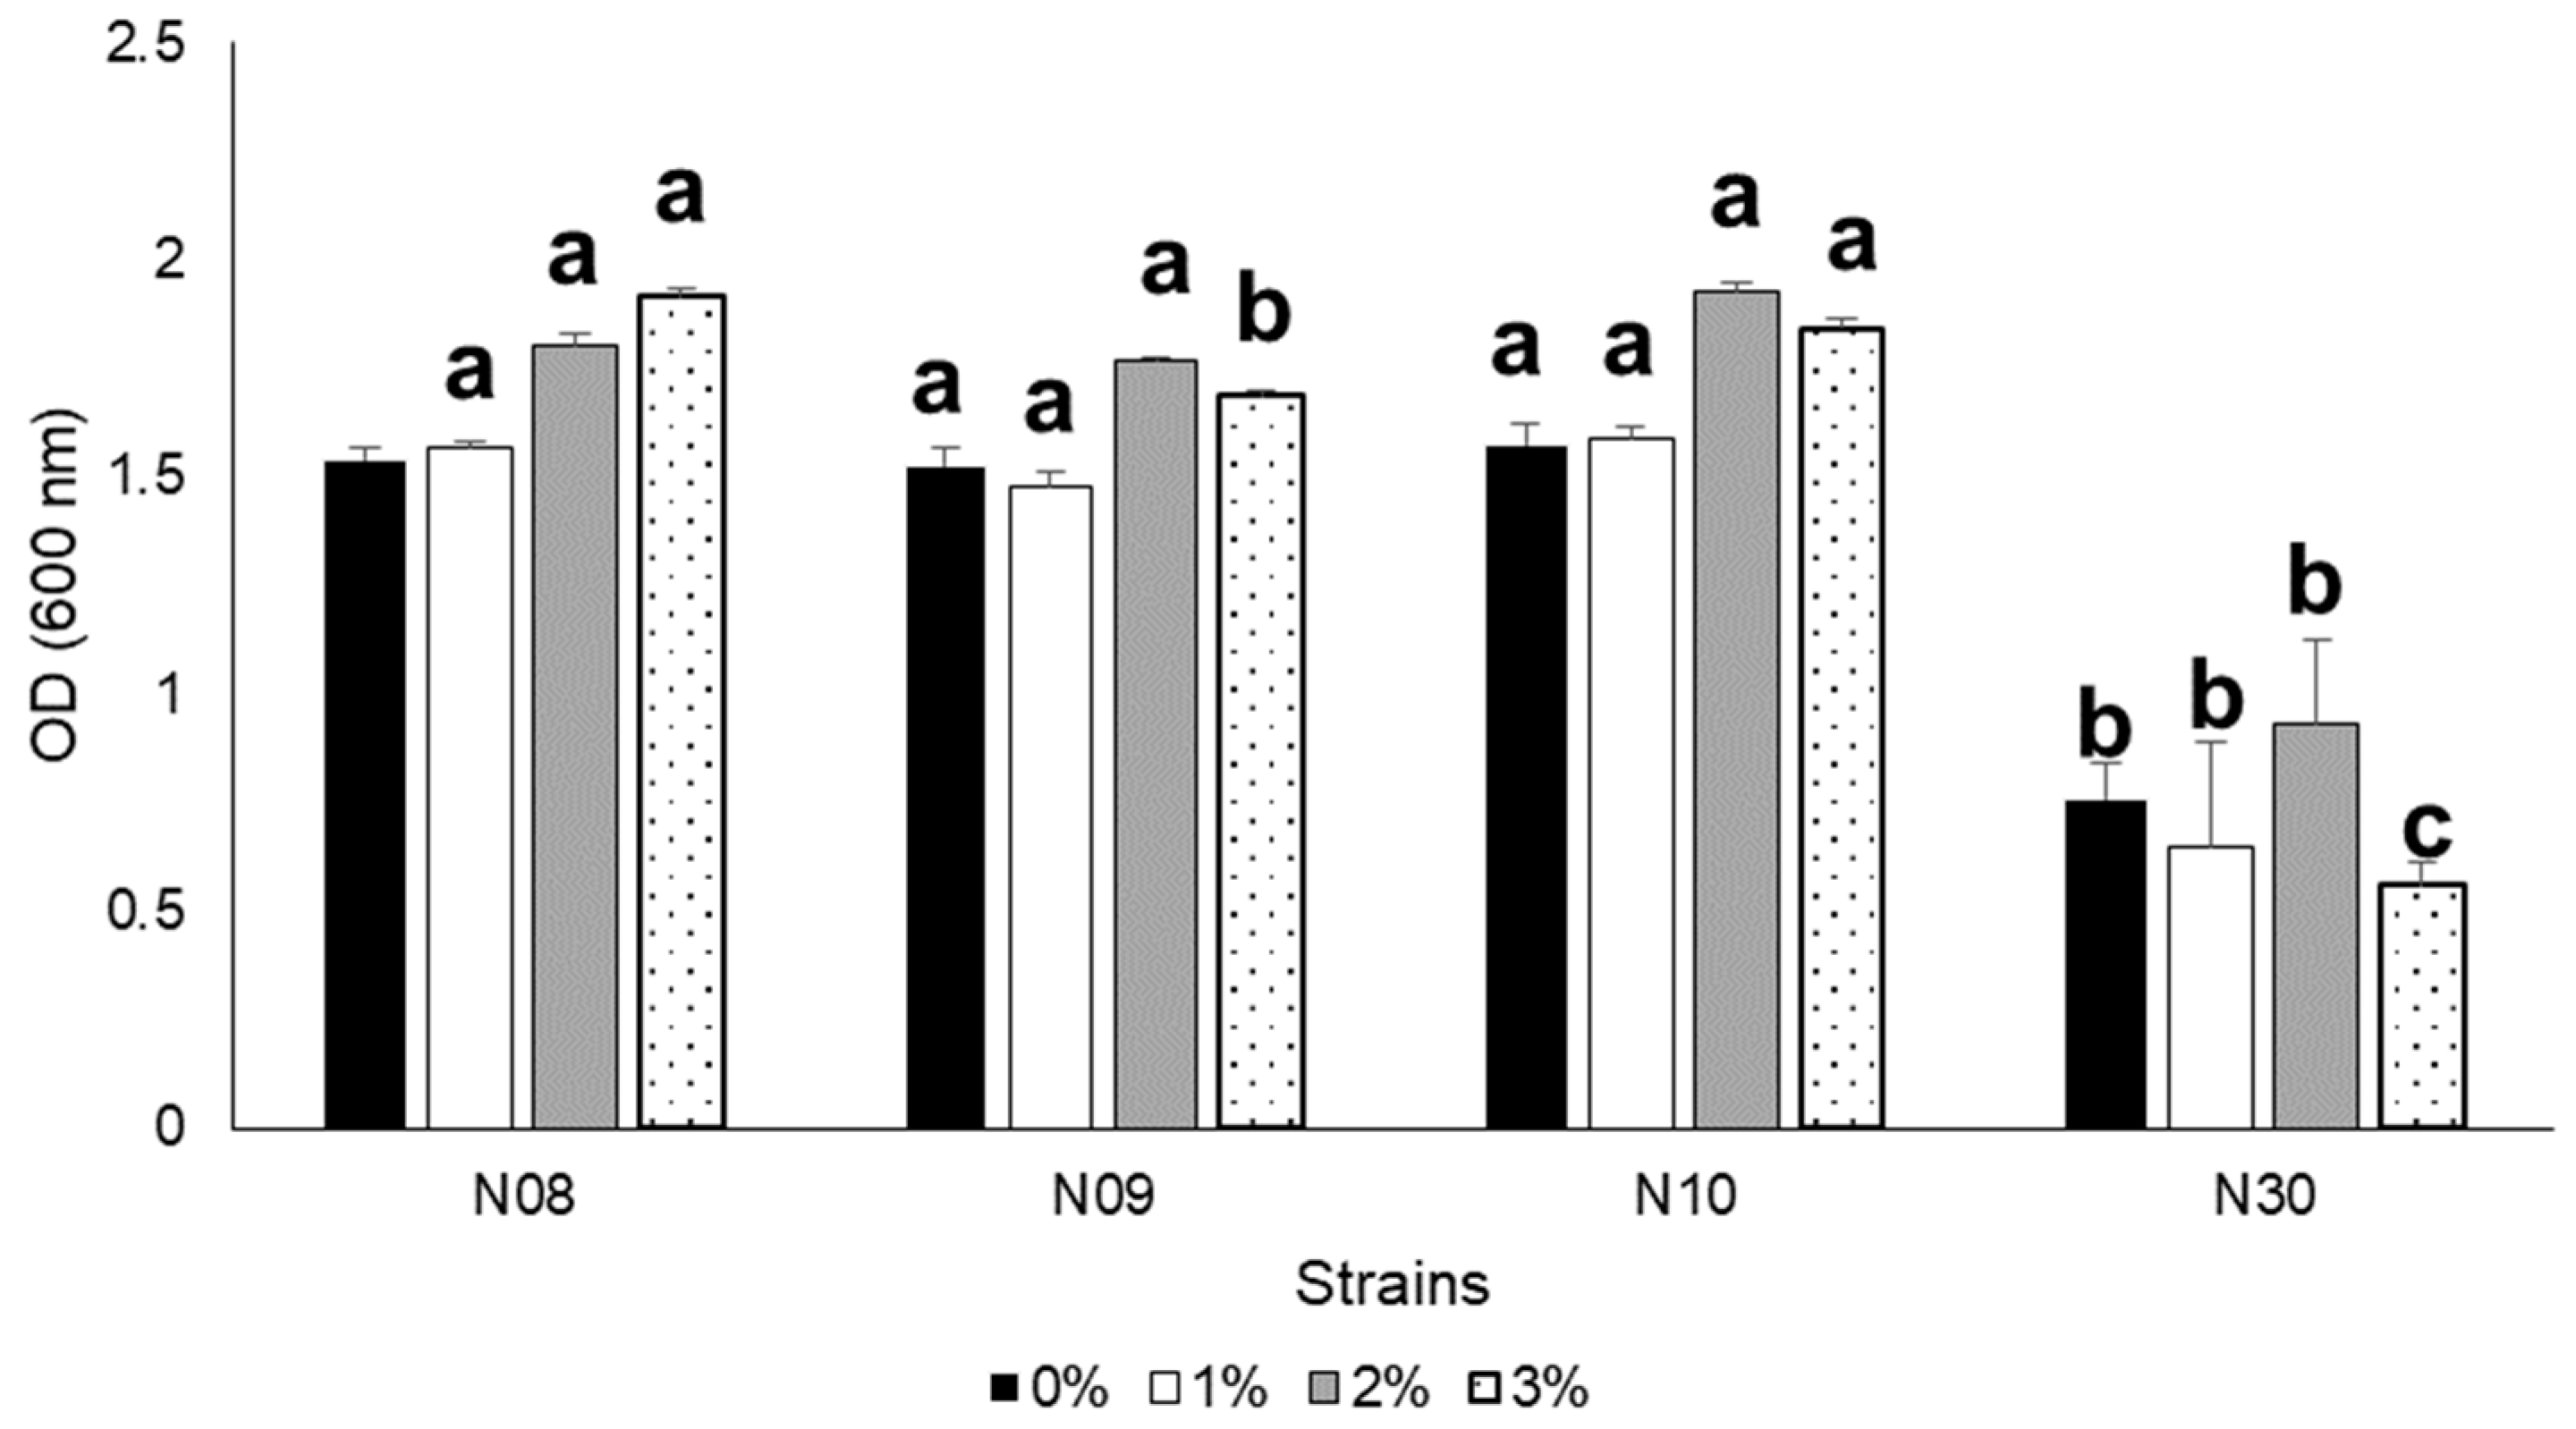
2.5. Effect of NaCl, pH and Temperatures on the Growth of GABA-Producing LAB

Four strains of LAB—namely N8, N9, N10, and N30—were cultured in an MRS liquid medium in a 96-well microplate at different NaCl concentrations (0, 1, 2, and 3% (w/v)), pH levels (2–9) and incubation temperatures (10, 15, 20, 25, 30, and 35 °C). After incubation at 28 °C for 72 h, the optical density (OD) at 600 nm was measured in a spectrophotometer (V-530, JASCO, Tokyo, Japan) to evaluate the growth.

2.6. Experimental Fish and Proximate Analysis

Masu salmon, O. masou masou without eggs were obtained from commercial fisheries in Miyazaki. Smolt yamame (fertilized in October 2014) were transferred into fish cages located in the seashore area in Nobeoka, Miyazaki. The fish were reared from mid-December to mid-April, and some fish survived as giant masu salmon. The eggs of seawater-cultured giant masu salmon were removed, and the fish bodies except for the eggs were randomly collected and stored at −20 °C until analysis.
The average fish collected weighed 321 g. The fish were cut into small pieces with a kitchen knife and crushed well with a mixer. The minced fish was used for the proximate analysis. The protein content was analyzed by the Kjeldahl method. The lipid content was analyzed according to the method described by Folch et al. [37]. The ash content and moisture were analyzed according to the guidelines published by the Association of Official Analytical Chemists [38].

2.7. Preparation of Crude Enzyme Solution from Giant Masu Salmon

A portion of the minced fish was added to an equal volume of distilled water, and mixed well with a vortex mixer. The mixed solution was centrifuged at 5000× g for 15 min, and the supernatant was used as a crude enzyme solution for the protease assay.

2.8. Protease Assay

Protease activity was determined by measuring the amount of tyrosine liberated from casein as a substrate [39]. The crude enzyme solution of 100 µL was mixed with 500 µL of a 3.0% casein solution. The mixture was incubated at 55 °C or 60 °C for 10 min, and then 500 µL of 5.0% trichloroacetic acid (w/v) was added to stop the enzyme activity. The mixture was centrifuged at 5000× g for 10 min, and the supernatant was used to determine the amount of tyrosine liberated from casein.
For the measurement, 250 µL of the supernatant was mixed with 0.55 mol/L sodium carbonate solution and incubated at room temperature for 10 min. Then, 125 µL of 660 mM Folin’s phenol reagent was added, and the mixtures was incubated at 55 °C or 60 °C for 30 min to generate a measurable color, based on the reaction with tyrosine. The absorbance of the supernatant at 660 nm was measured with a UV–vis spectrophotometer (V-530, JASCO Co., Tokyo, Japan), and the amount of liberated tyrosine was calculated using a calibration curve previously made for a standard tyrosine solution. One unit of enzyme activity was defined as the amount of enzyme that could liberate the equivalent of 1 µg of tyrosine from casein per 1 min. The protein concentration of the crude enzyme solution was determined according to the method described in Lowry et al. [40].

2.9. Preparation of Fish Sauce From Giant Masu Salmon

To prepare the fish sauce, the giant masu salmon was treated according to the procedure for making the crude enzyme solution described above. We selected 55 °C and 60 °C as adequate temperatures to induce autolysis based on a previous study. Ten g of the mixture was placed in a vial vessel and incubated at 55 °C or 60 °C for 96 h with or without the addition of 10 mL of distilled water. An aliquot of each sample was collected for chemical analysis every 24 h. The mixture was then heated in boiling water for 20 min and centrifuged at 15,000 rpm for 10 min. The supernatant, except for a lipid layer, was collected as a giant masu salmon fish sauce (GMSFS), and the bacterial counts, histamine concentration, and free amino acid composition were analyzed. The protein concentration was determined by Kjeldahl method [38].

2.10. Sodium Dodecyl Sulfate-Polyacrylamide Gel Electrophoresis (SDS-PAGE) Analysis

The protein content of autolyzed fish bodies was adjusted to 2 µg/µL, and it was mixed with equal amount of 2 × SDS-PAGE buffer solution consisting of 0.125 M (w/v) Tris-HCl buffer (pH 6.8), 4% SDS (w/v) and 8% (w/v) 2-mercaptoethanol, 40% (v/v) glycerol and 0.004% (w/v) bromo phenolblue. The mixture was heated at 100 °C for 3 min. The profiles of protein size in the samples were monitored using SDS-PAGE according to the method of Laemmli [41]. Samples were loaded onto the 12.5% (w/v) polyacrylamide gel and run at 250 V. The gels were stained using 0.1% (w/v) Coomassie Brilliant Blue R250 (CBB) staining solution in 30% (v/v) methanol, 10% (v/v) acetic acid, and 60% (v/v) distilled water and destained using CBB destaining solution consisting of 10% (v/v) methanol, 10% (v/v) acetic acid, and 80% (v/v) distilled water to visualize protein bands for 60 min. The destaining procedure was repeated three times.

2.11. Bacteria Plate Count and Histamine Analysis

The bacterial count of each fish sauce was conducted using Nissui Standard Method Agar (Nissui Pharmaceutical Co. Ltd., Tokyo, Japan), according to the standard plate-count method. The histamine concentration was measured with a commercial kit, Check-Color Histamine (Kikkoman Co., Tokyo, Japan), according to the manufacturer’s instructions.

2.12. Amino Acid Analysis

Fish sauces including shellfish were purchased from commercial supermarkets. The GMSFS were each mixed with the same volume of 20% (w/v) trichloroacetic acid solution, mixed well, and kept at room temperature for 30 min. The mixture was centrifuged at 10,000× g for 15 min and the supernatant was used for amino acid analysis. The amino acid composition of GMSFS was analyzed with a liquid chromatography-mass spectrometry (LC-MS; UF-aminostation, Shimazdu Co., Kyoto, Japan) system consisting of a vacuum pump (oil mist filter EMF20, Edwards Co. Ltd., Crawley, UK) and a gas generator (N2 model supplier 24F, System Instruments Co. Ltd., Tokyo, Japan). The fish sauce was mixed with an equal volume of 20% (w/v) trichloroacetic acid and centrifuged at 10,000 g for 10 min. The supernatant was mixed with an acetonitrile and subjected to LC-MS analysis. As amino acids standard solutions, amino acids mixture standard solution type B and type AN-II (Wako Pure Chemical Co. Ltd., Osaka, Japan) were used. l-glutamine, l-asparagine, and l-tryptophan solutions were separately prepared with reagents purchased from Nacalai Tesque Inc., Kyoto, Japan. The derivatization of amino acids was conducted with an APDSTag® Wako (Wako Pure Chemical Co. Ltd., Osaka, Japan) at 60 °C for 5 min.
Samples were injected into a shim-pack column (UF-AMINO, Shimazdu Co., Kyoto, Japan) (100 mm × 2.1 mm i.d., pore size 2 µm). The solvent system was APDSTAG Wako Eluent, acetonitrile for LC/MS and APDSTAG Wako Borate Buffer (Wako Pure Chemical Co. Ltd., Osaka, Japan), and the elution was carried out in gradient mode (total run 12 min), with a flow rate of 0.3 mL/min at ambient temperature.

2.13. Microbial Fermentation of GMSFS by GABA-Producing Strain N10

The GMSFS was mixed with cell suspensions of strain N10 at 107 colony-forming units (CFU)/mL and incubated at 28 °C for 48 h. After incubation, the mixtures were centrifuged at 10,000× g for 15 min, and the GABA concentration was analyzed using LC-MS as described above.

2.14. Statistical Analysis

The data were subjected to Student’s t-test and analyzed to determine statistical differences (Microsoft Excel, 2013). To compare more than three experimental groups, one-way analysis of variance followed by the Turkey test was carried out using Bell Curve Excel Statistics (SSRI Co. Ltd., Tokyo, Japan).

3. Results

3.1. Isolation of LAB and Screening of GABA-Producing LAB by TLC

Thirty-eight strains were isolated from kimchi and tsukemono samples. The production of GABA were detected in 9 strains out of 38 strains based on the screening with TLC. Figure 1 shows the concentration of GABA in the culture supernatant from the nine strains selected by TLC analysis. The concentration was highest in strain N10, in which it was significantly higher than in other strains.

3.2. Identification of Isolates Based on Phylogenetic Analysis

Partial sequence data of the 16S rRNA genes of 8 GABA-producing strains was deposited in the data bank with accession numbers. The results of a BLAST search and phylogenetic trees showed that all strains except for strain N29 were clearly located in the cluster of Lactobacillus plantarum, and the identity was 99% according to the BLAST analysis (Figure 2). Strain N29 was located in the cluster Leuconostoc mesenteroides, and the identity was 99% according to the BLAST analysis. A partial length of the 16S rRNA gene sequence of strains N8, N9, N10, N29, N30, N37, N38, and A3 was deposited in the data bank with accession numbers LC474157, LC474158, LC474159, LC474160, LC474161, LC474162, and LC474157, respectively.

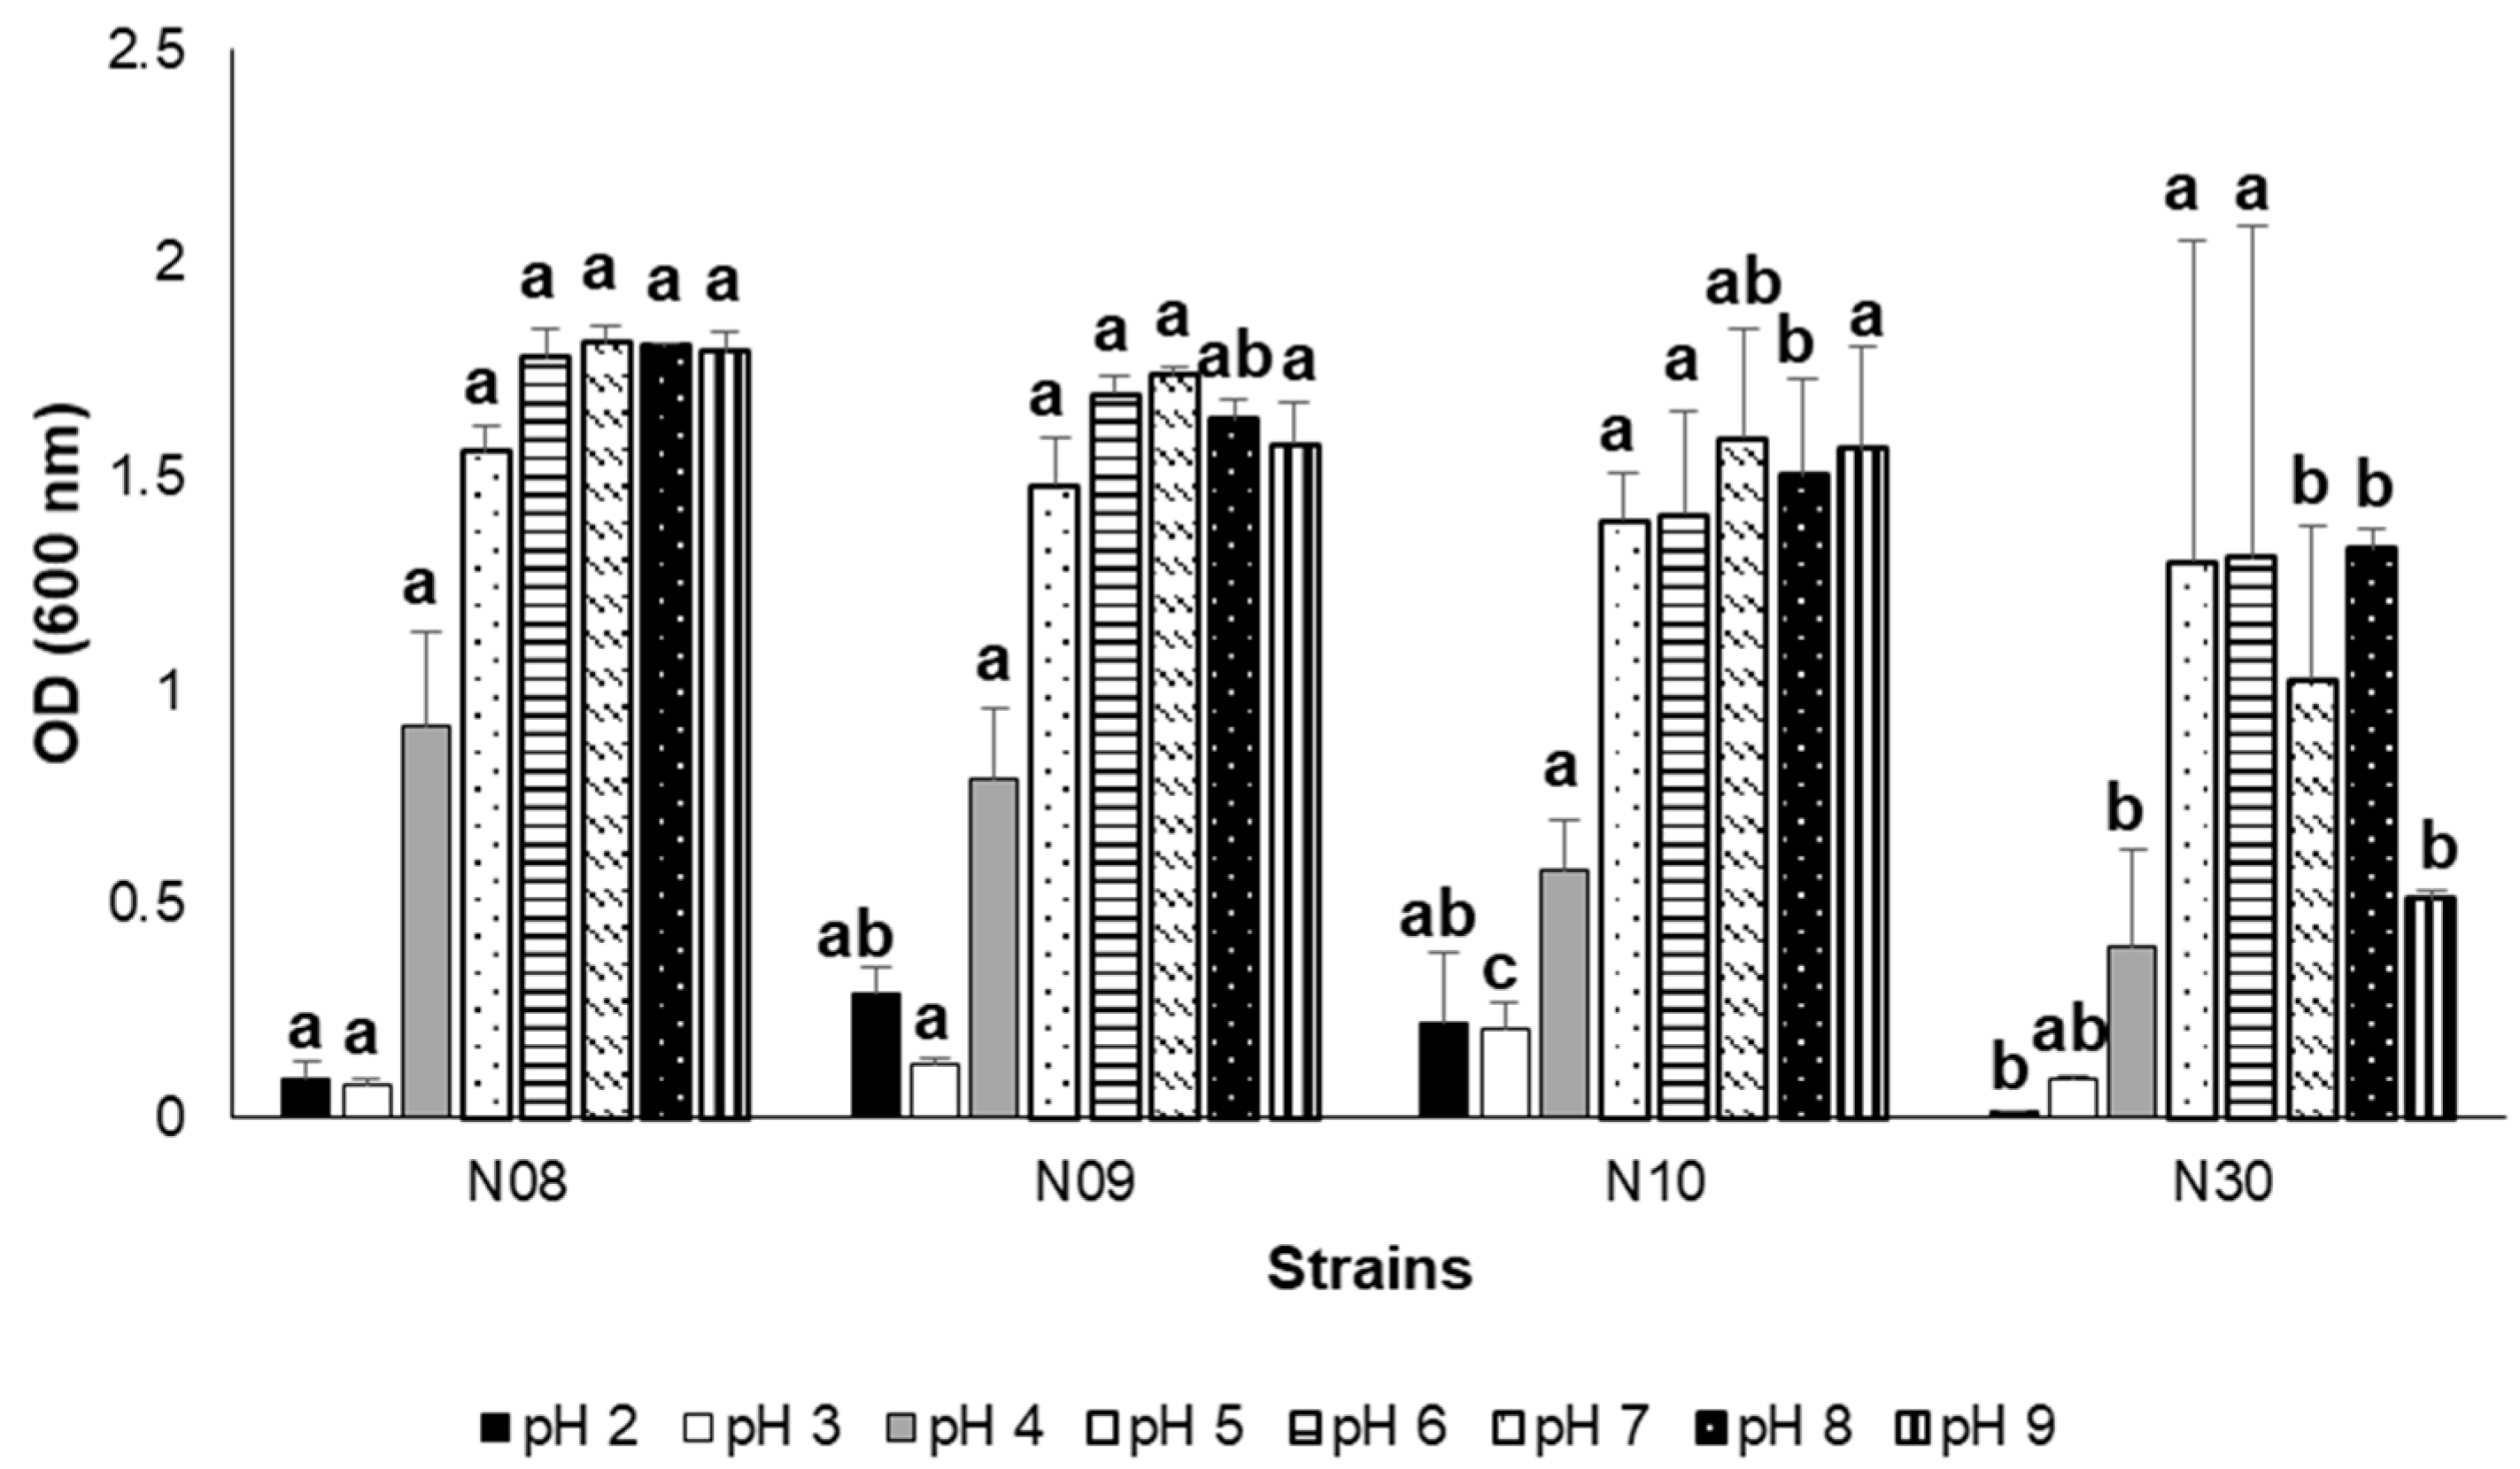
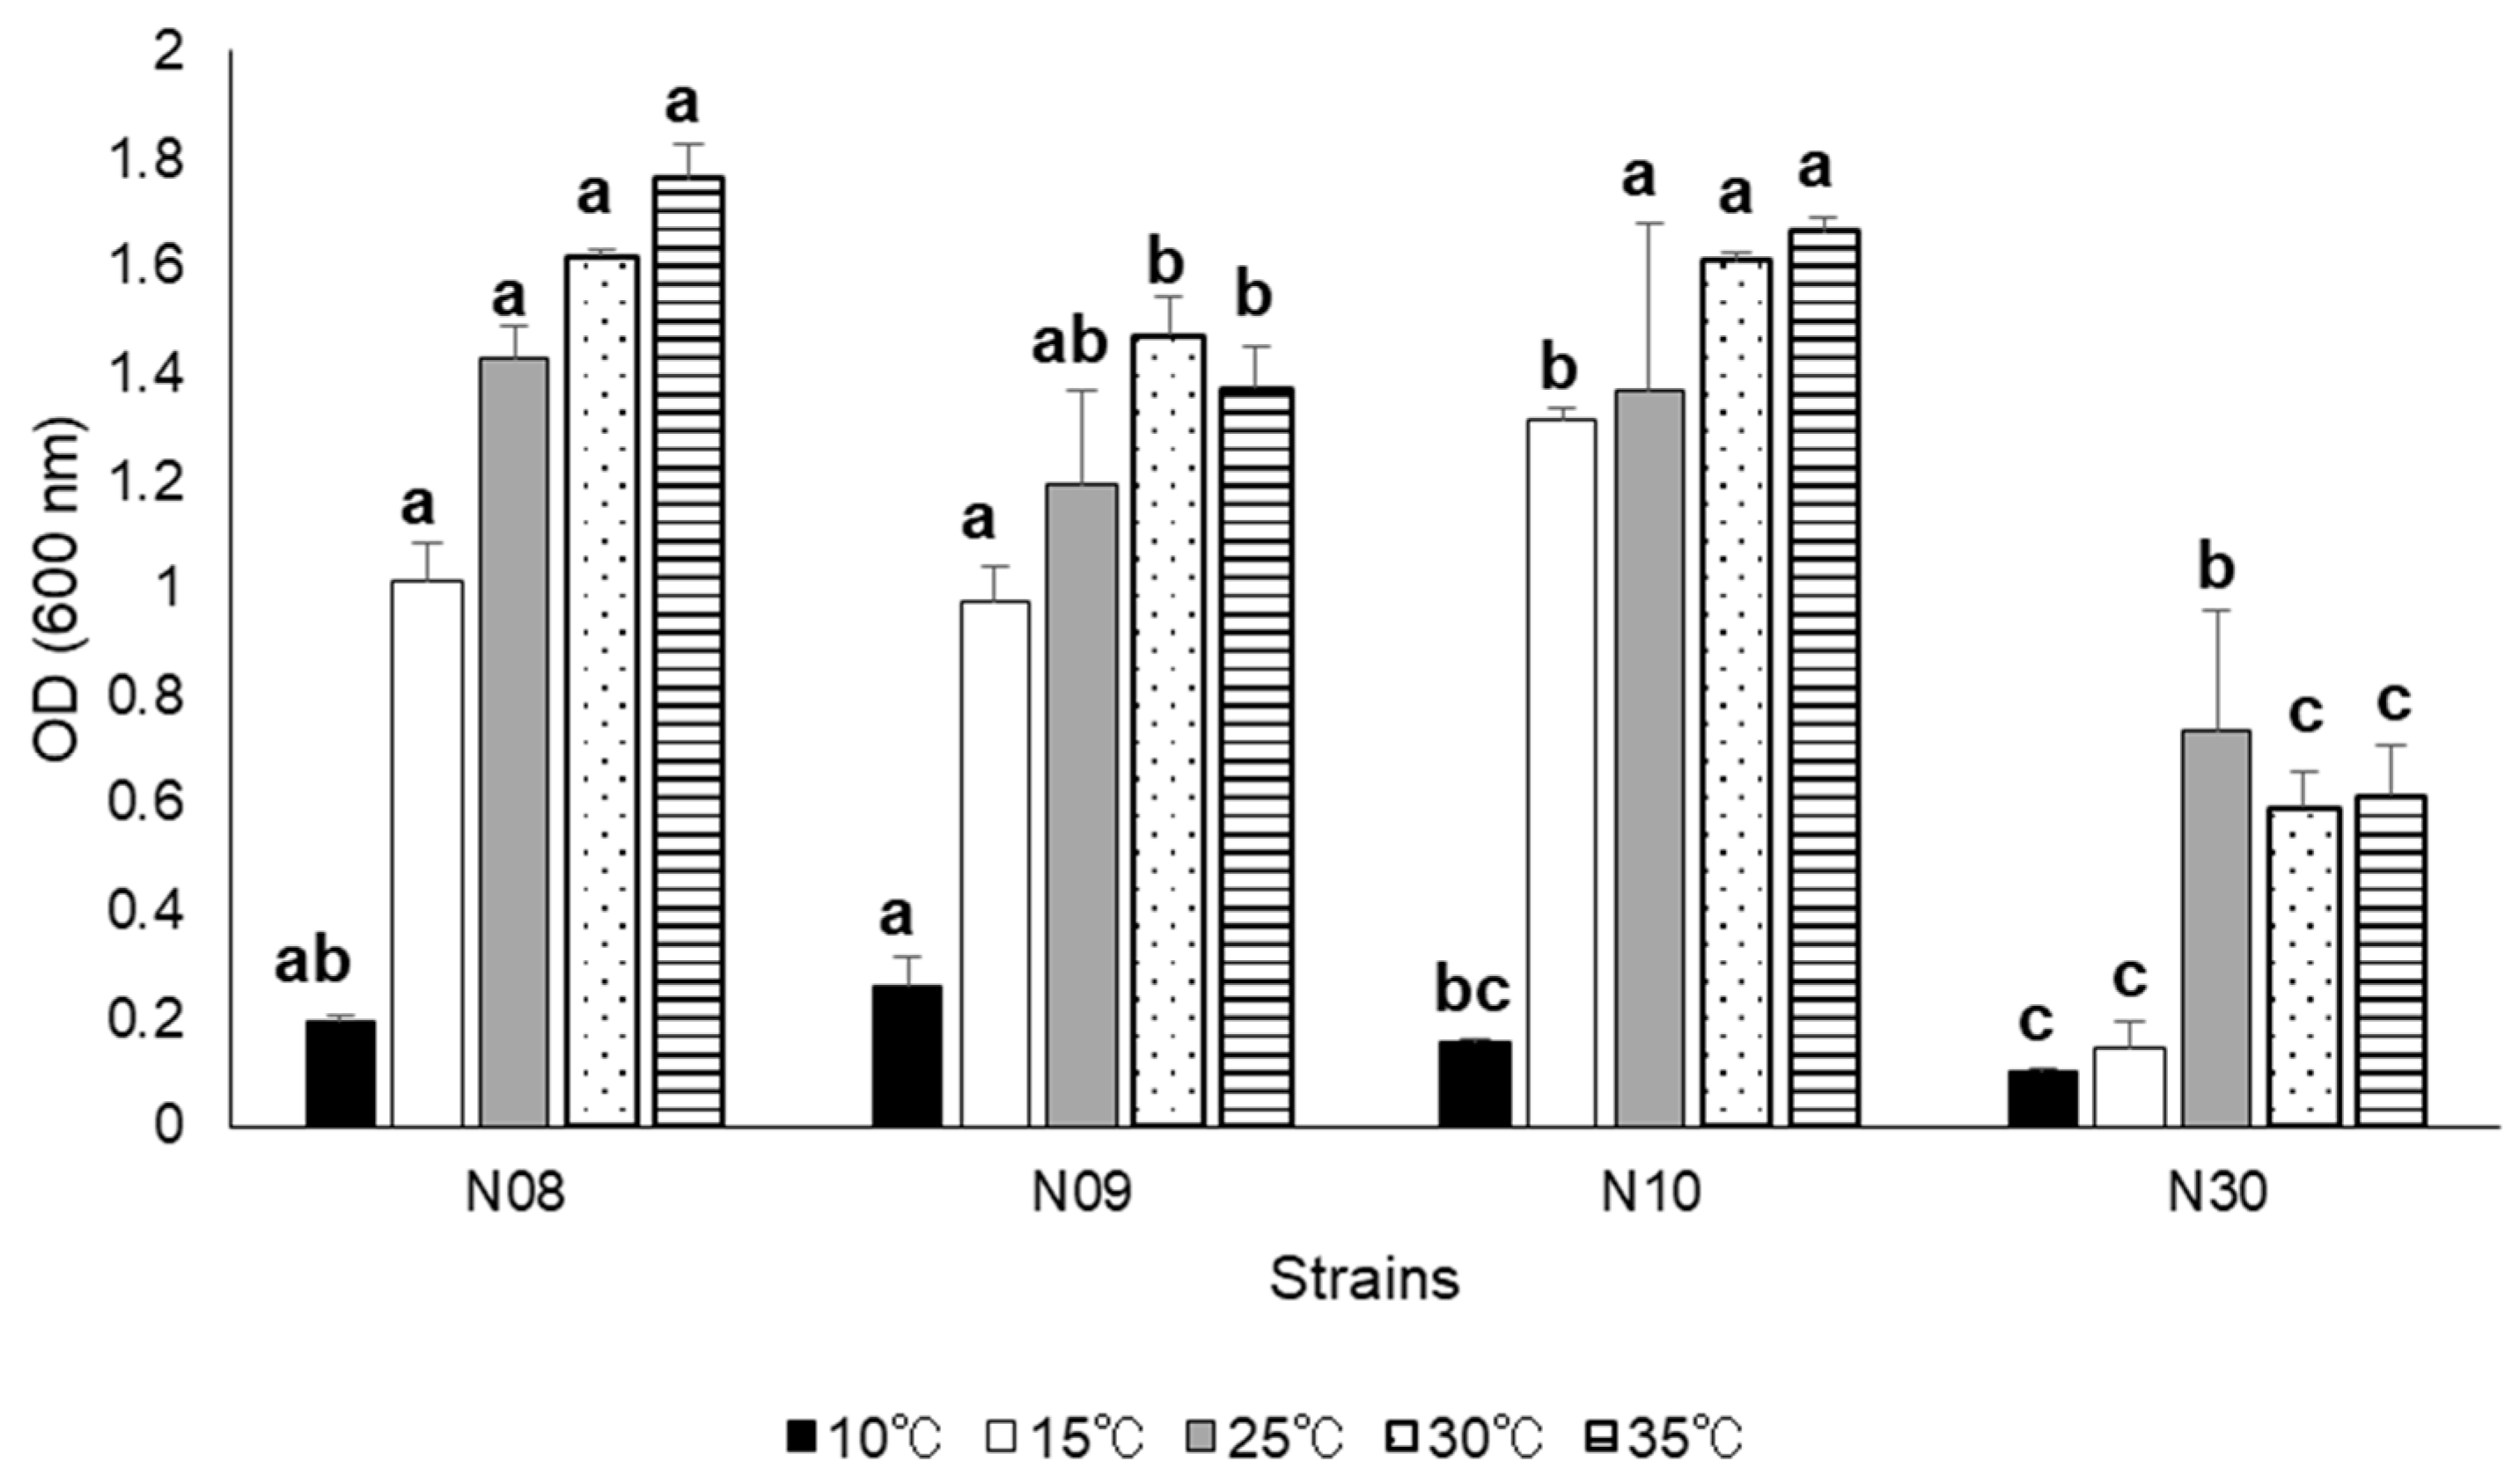
3.3. Growth at Different Salinity, pH, and NaCl

Figure 3 shows the OD values of cultures at different NaCl concentrations. As compared with strains N8, N9, and N10, the OD of strain N30 was significantly lower at each NaCl concentration. In the case of a 3% NaCl concentration, the OD values of strains N8 and N10 were significantly higher than that of strain N9.
Figure 4 show the OD values of cultures at different pH levels. All strains grew well in the range of pH 5.0 to 8.0. In all strains, OD was lower at pH 4.0 than at pH 5.0. The OD at pH 2 and 3 was strongly suppressed than pH 4.0. In the pH range of 6–9, the growth of strain N30 was significantly lower than those of strains N8, N9, and N10.
Figure 5 shows the OD values of cultures at different temperatures. All strains grew well at the range of 25 °C to 35 °C. In all strains, the growth at 10 °C was drastically inhibited as compared with higher temperatures. At temperatures higher 15 °C, the OD of strain N30 was significantly lower as compared with strains N8, N9, and N10. In all strains except for strain N30, the OD increased due to increases in the cultivation temperature.

3.4. Proximate Analysis of the Minced Fish Body

The contents of moisture, protein, lipid, and ash in the minced whole bodies of masu salmon were 81.5%, 13.4%, 2.71%, and 1.16%, respectively.

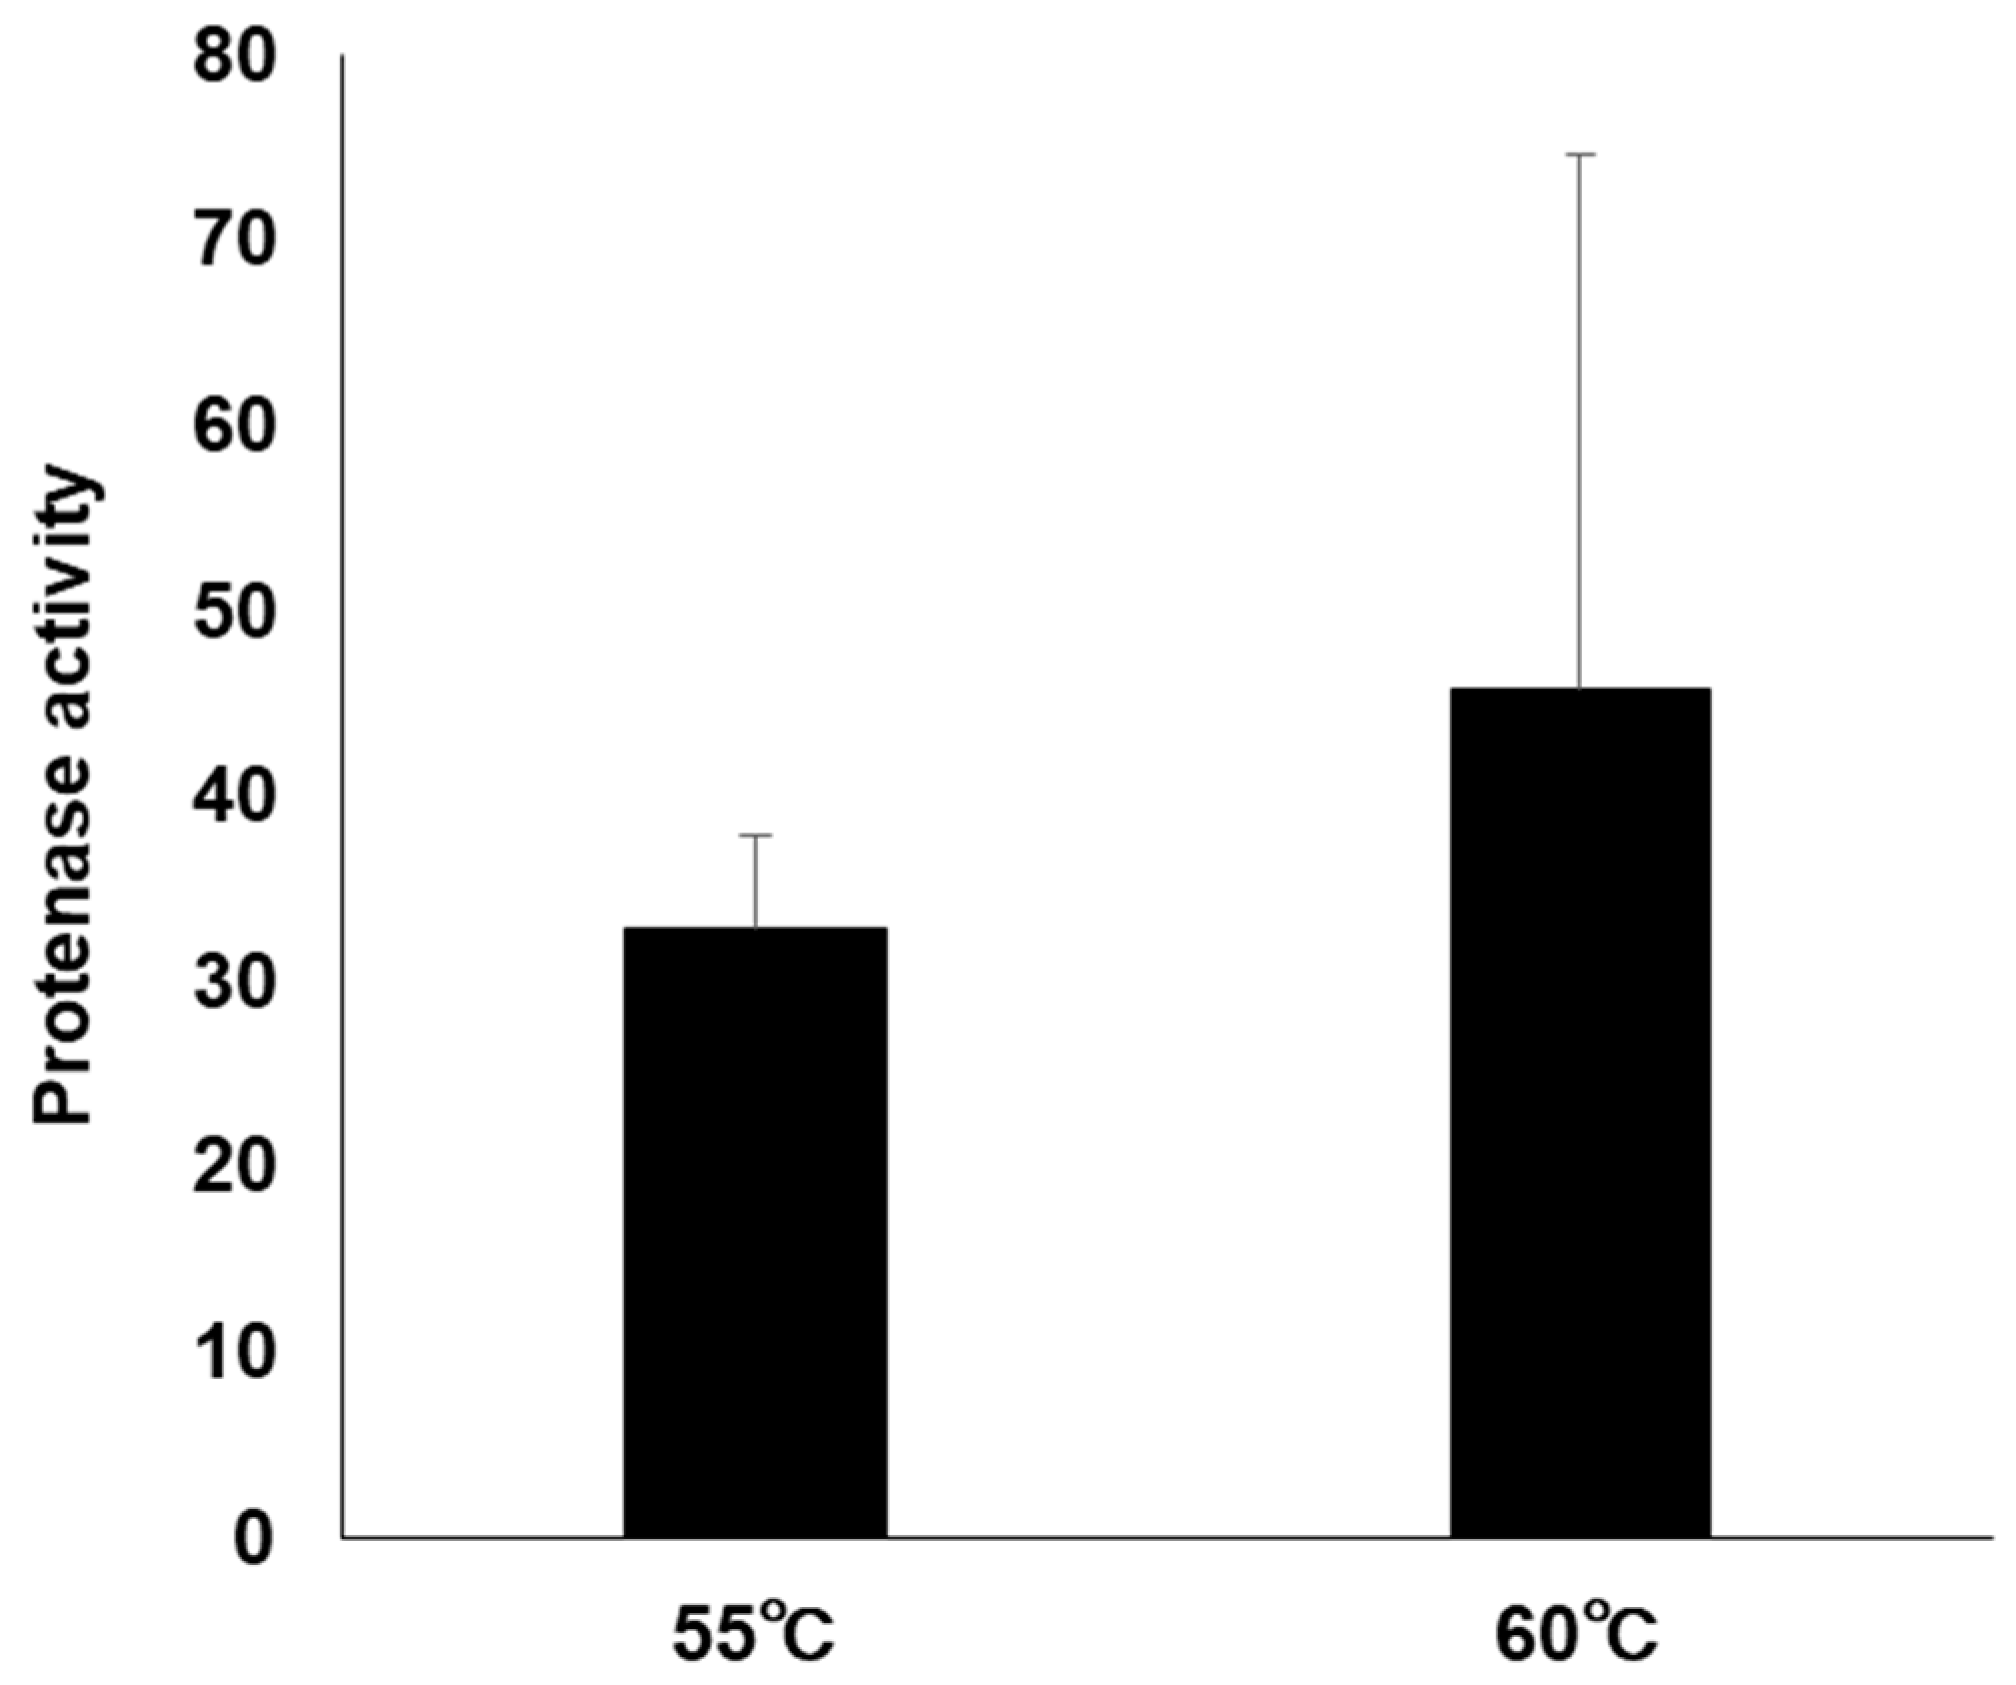
3.5. Protease Activity

Figure 6 shows the protease activity contained in the minced fish body. The activity at 60 °C was higher than that at 55 °C without statistical significance.

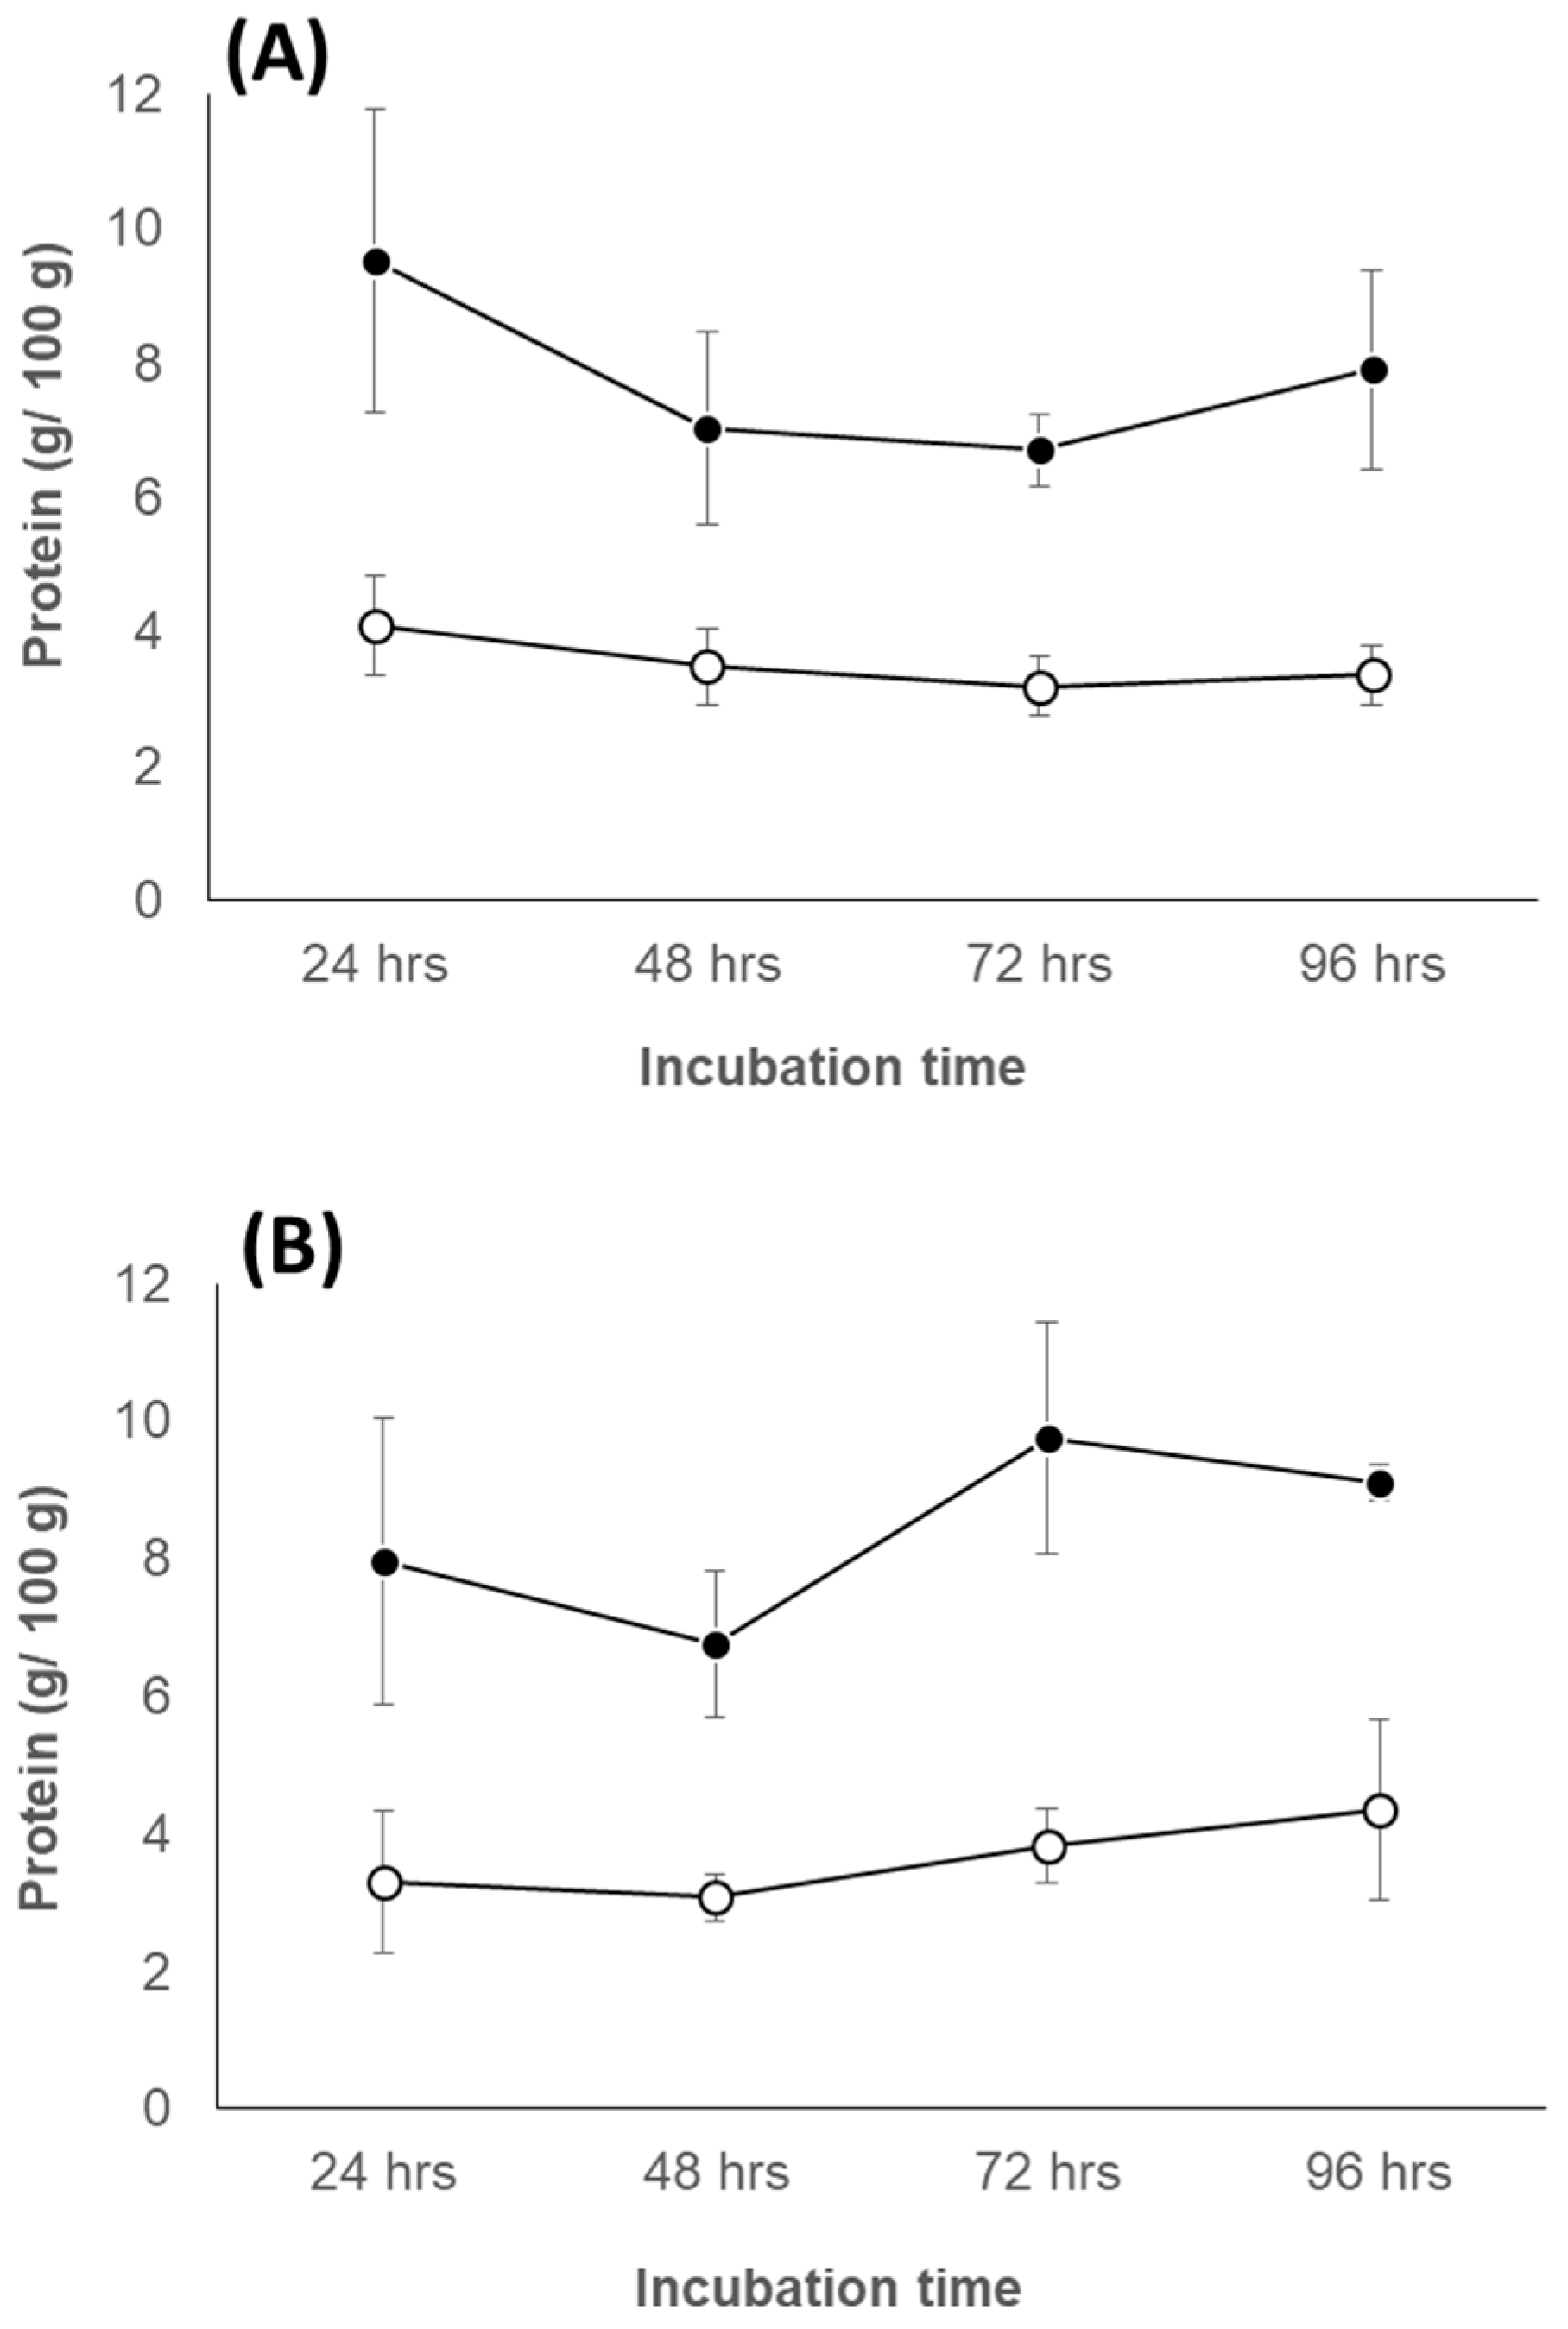
3.6. Time Course Experiment of Autolysis

3.6.1. Change of Protein Concentration

Figure 7 shows the change of protein over the time course of 96 h. At 55 °C, the protein concentrations in the group with and without water ranged 3.9 to 4.1 and 7.2 to 9.4, respectively. At 60 °C, the protein concentrations in the group with and without water ranged 3.7 to 4.1 and 8.1 to 9.7, respectively. In all groups, the protein concentration did not significantly change over the course of 96 h. The protein concentration was lower in the group with water than that without water at both 55 °C and 60 °C.

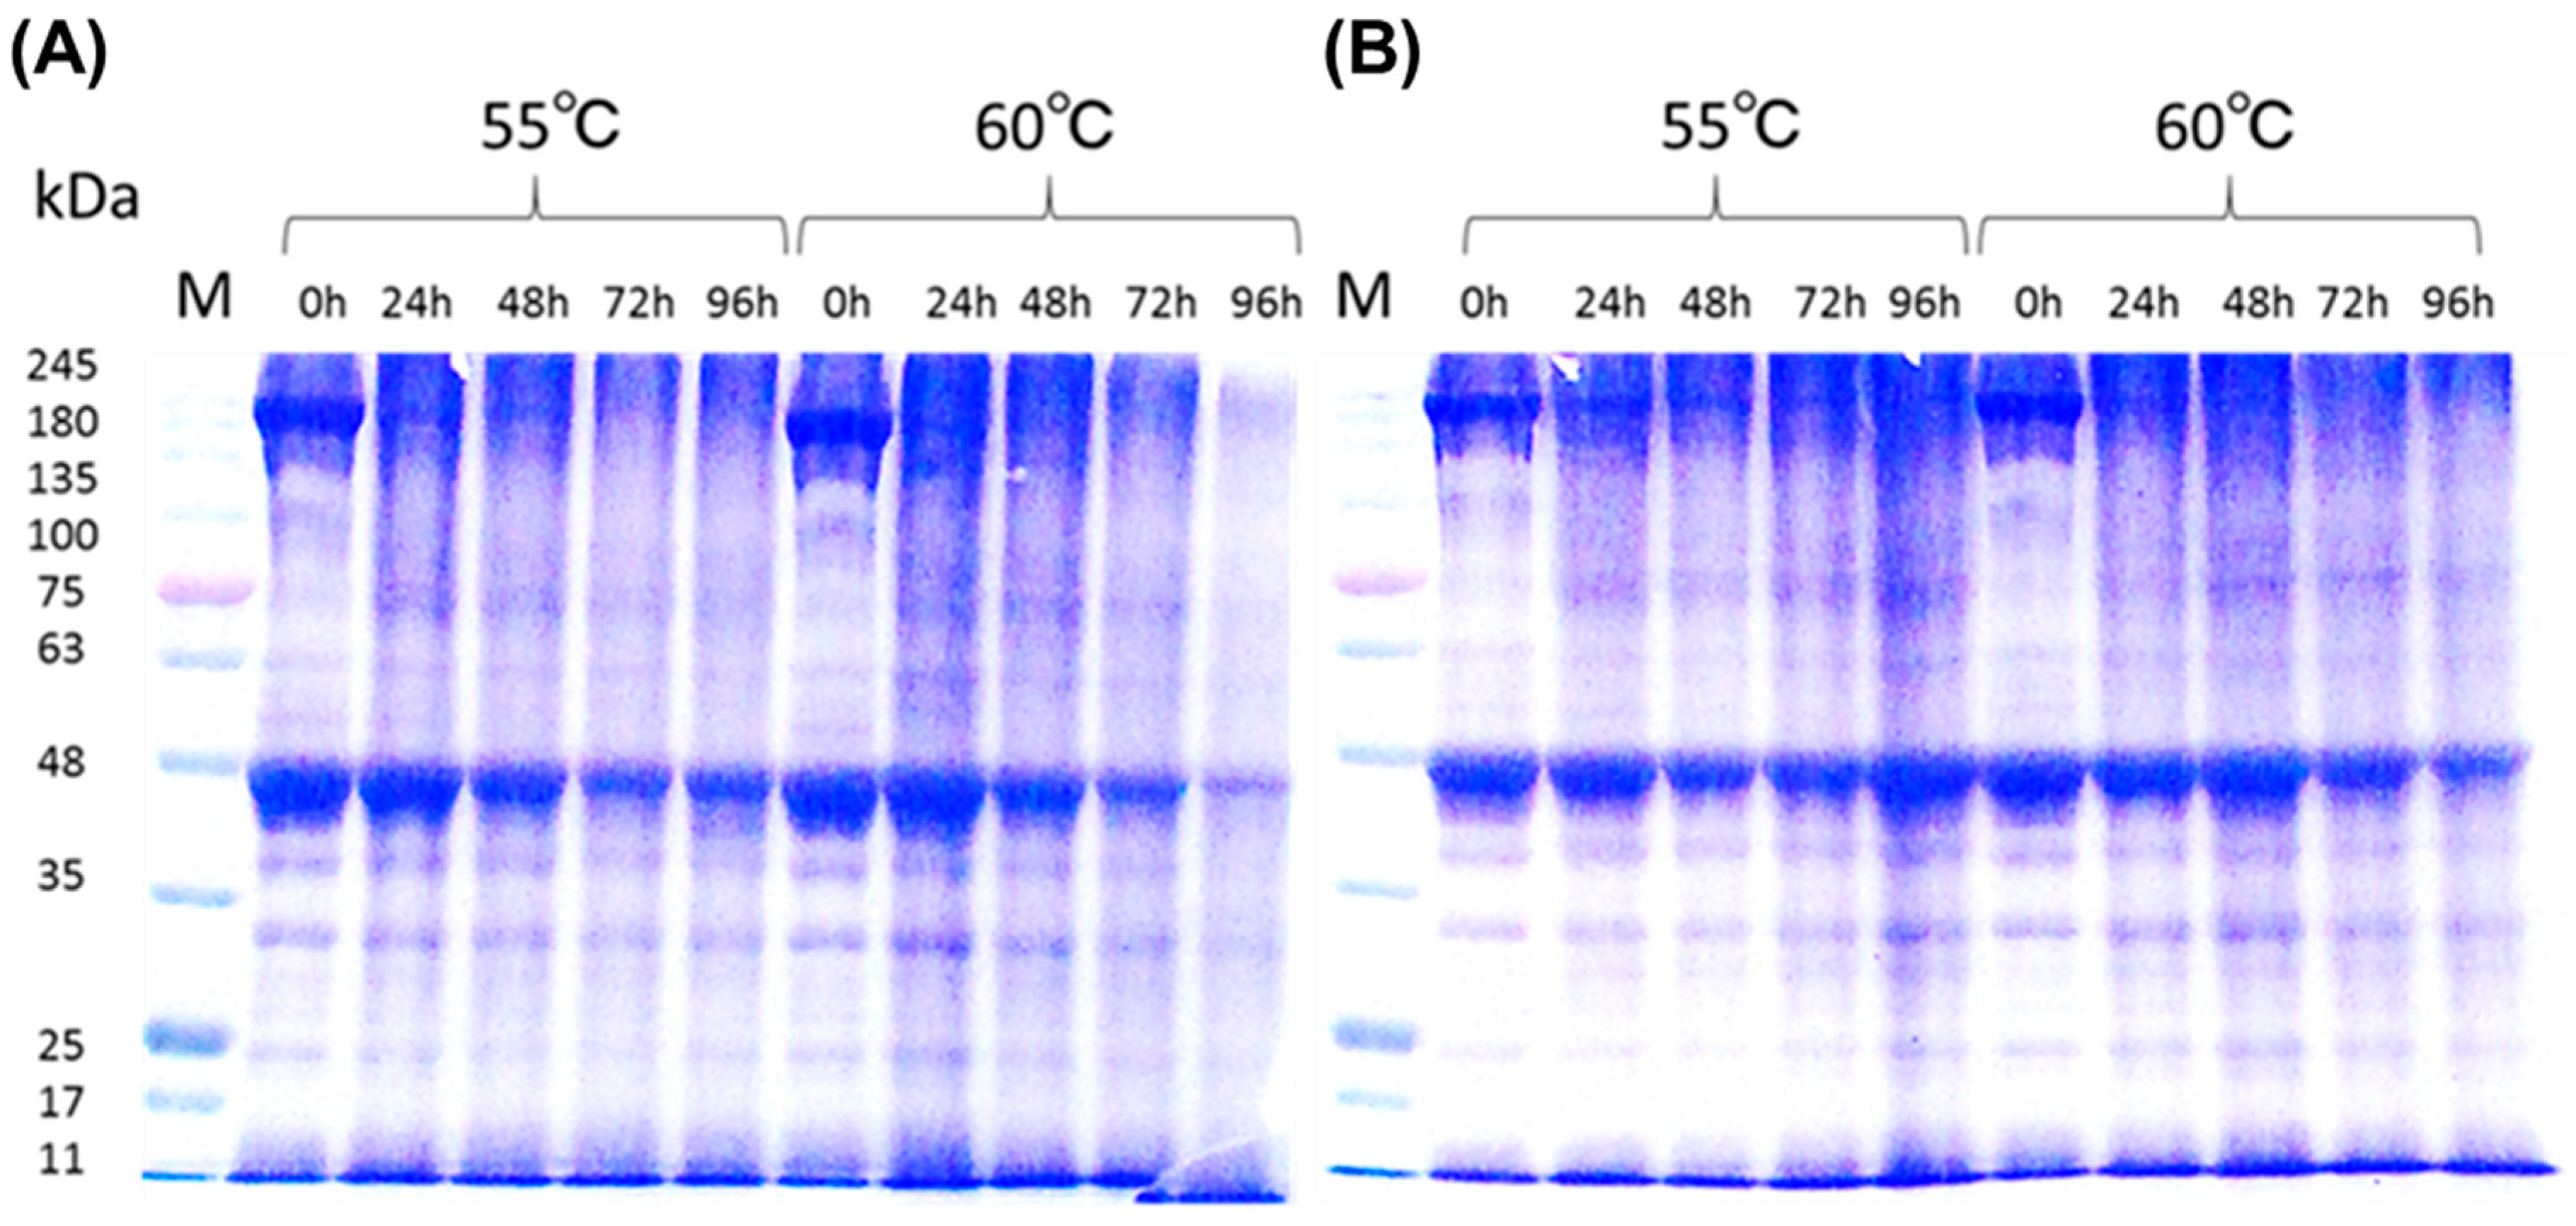
3.6.2. Distribution of Protein Molecular Size

Figure 8 shows the results of SDS-PAGE analysis. In all conditions of combination between incubation temperatures (55 °C or 60 °C) and the presence or absence of water, the major band at 200 kDa detected at 0 h gradually disappeared due to the incubation time. In all conditions except for the group at 55 °C with water, the major band at 48 kDa that was also detected at 0 h gradually disappeared as the incubation time increased.

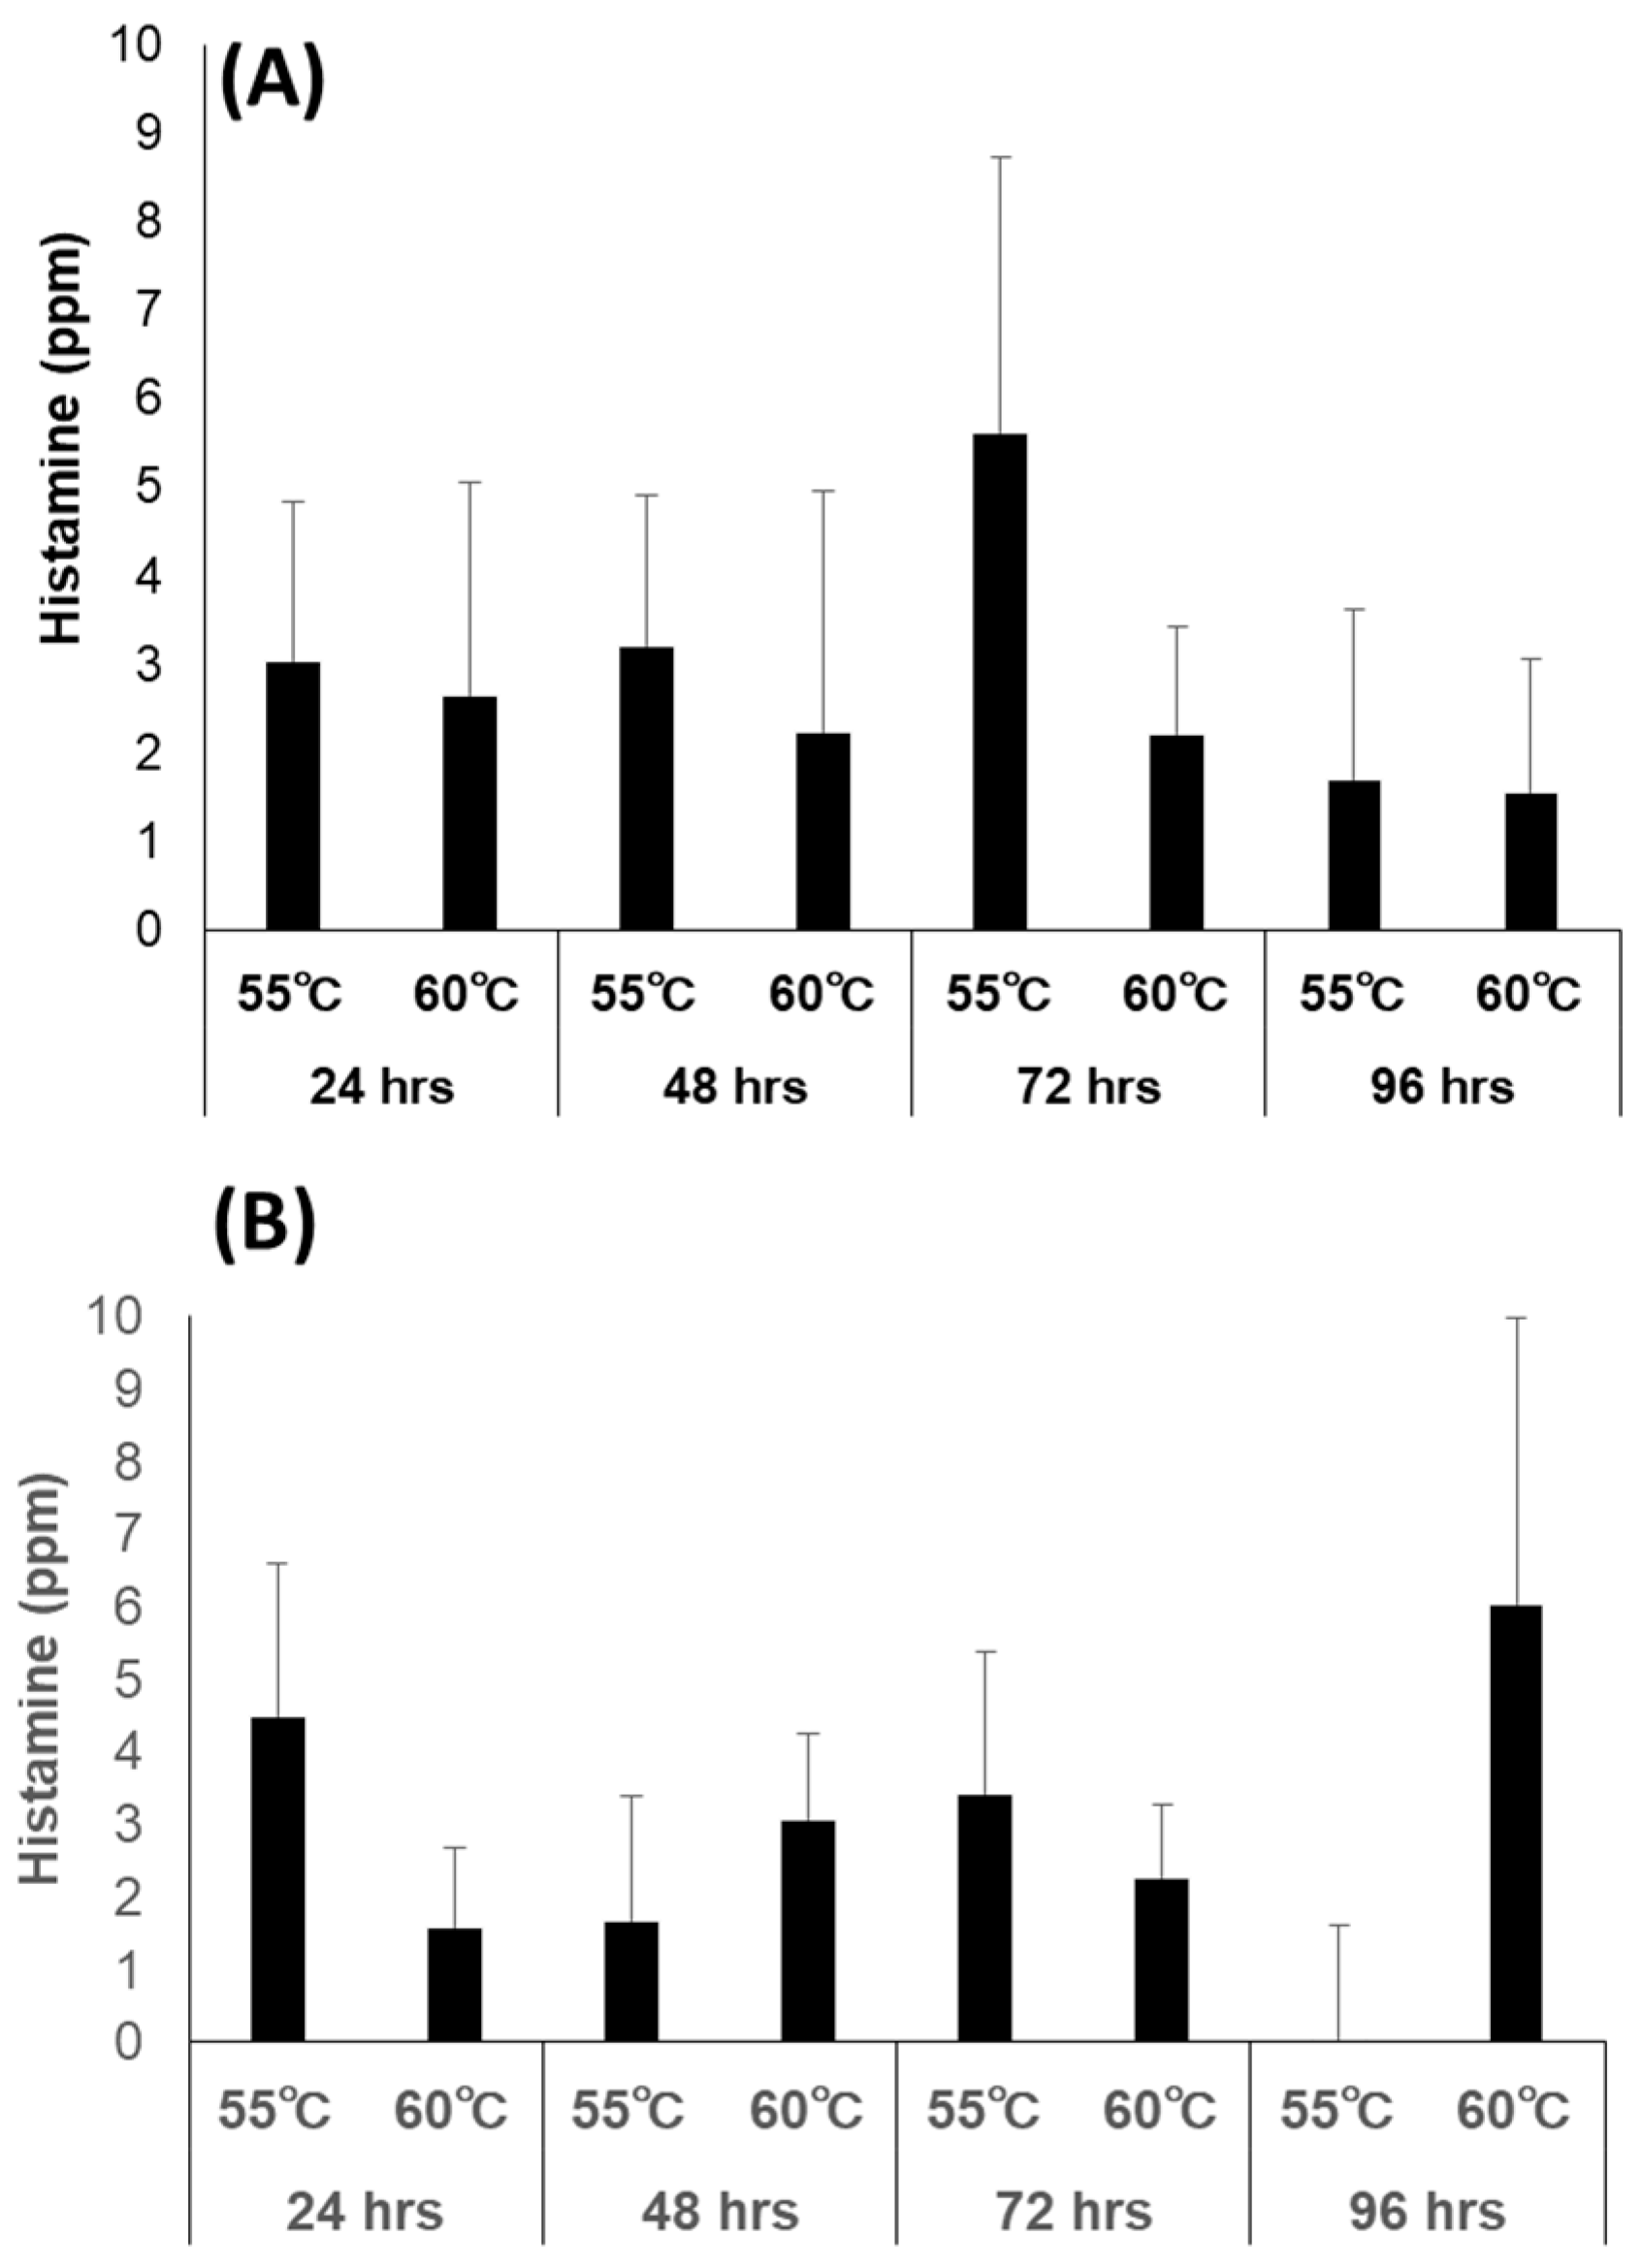
3.6.3. Bacterial Counts and Histamine Concentration

In all groups, the total viable count of the GMSFS was less than 90 CFU/mL with an incubation time of 96 h (data not shown). In all groups, the concentration of histamine was less than 6 ppm during an incubation time of 96 h, and no significant differences were observed during the incubation time (Figure 9).

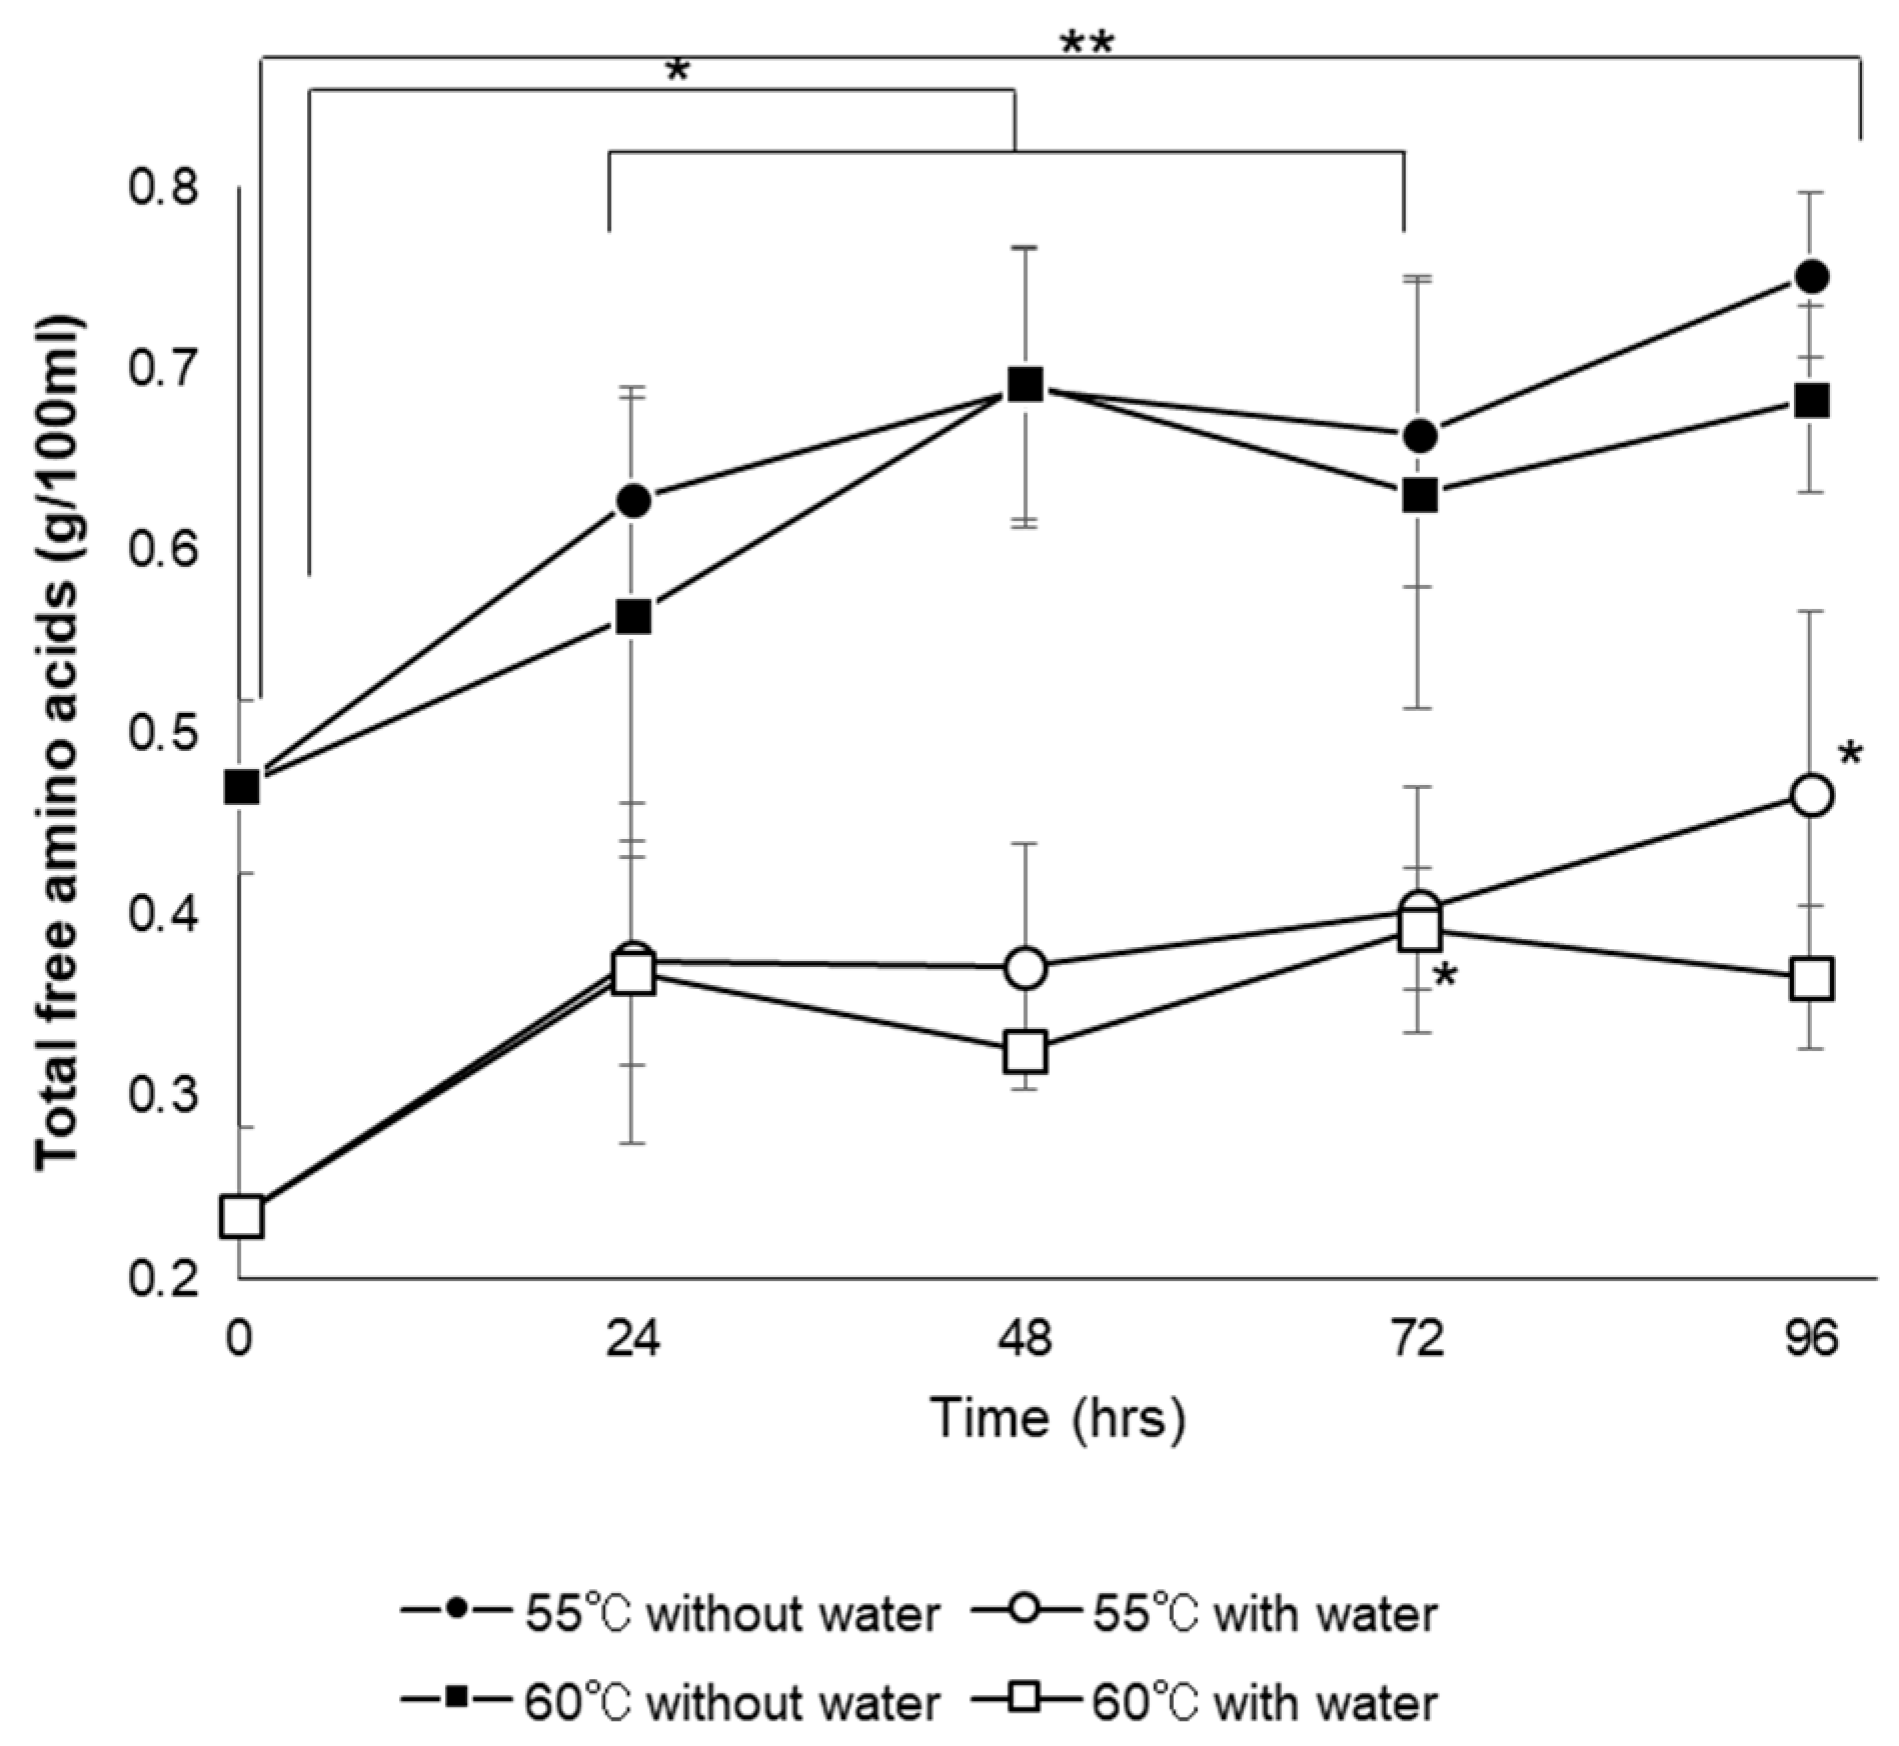
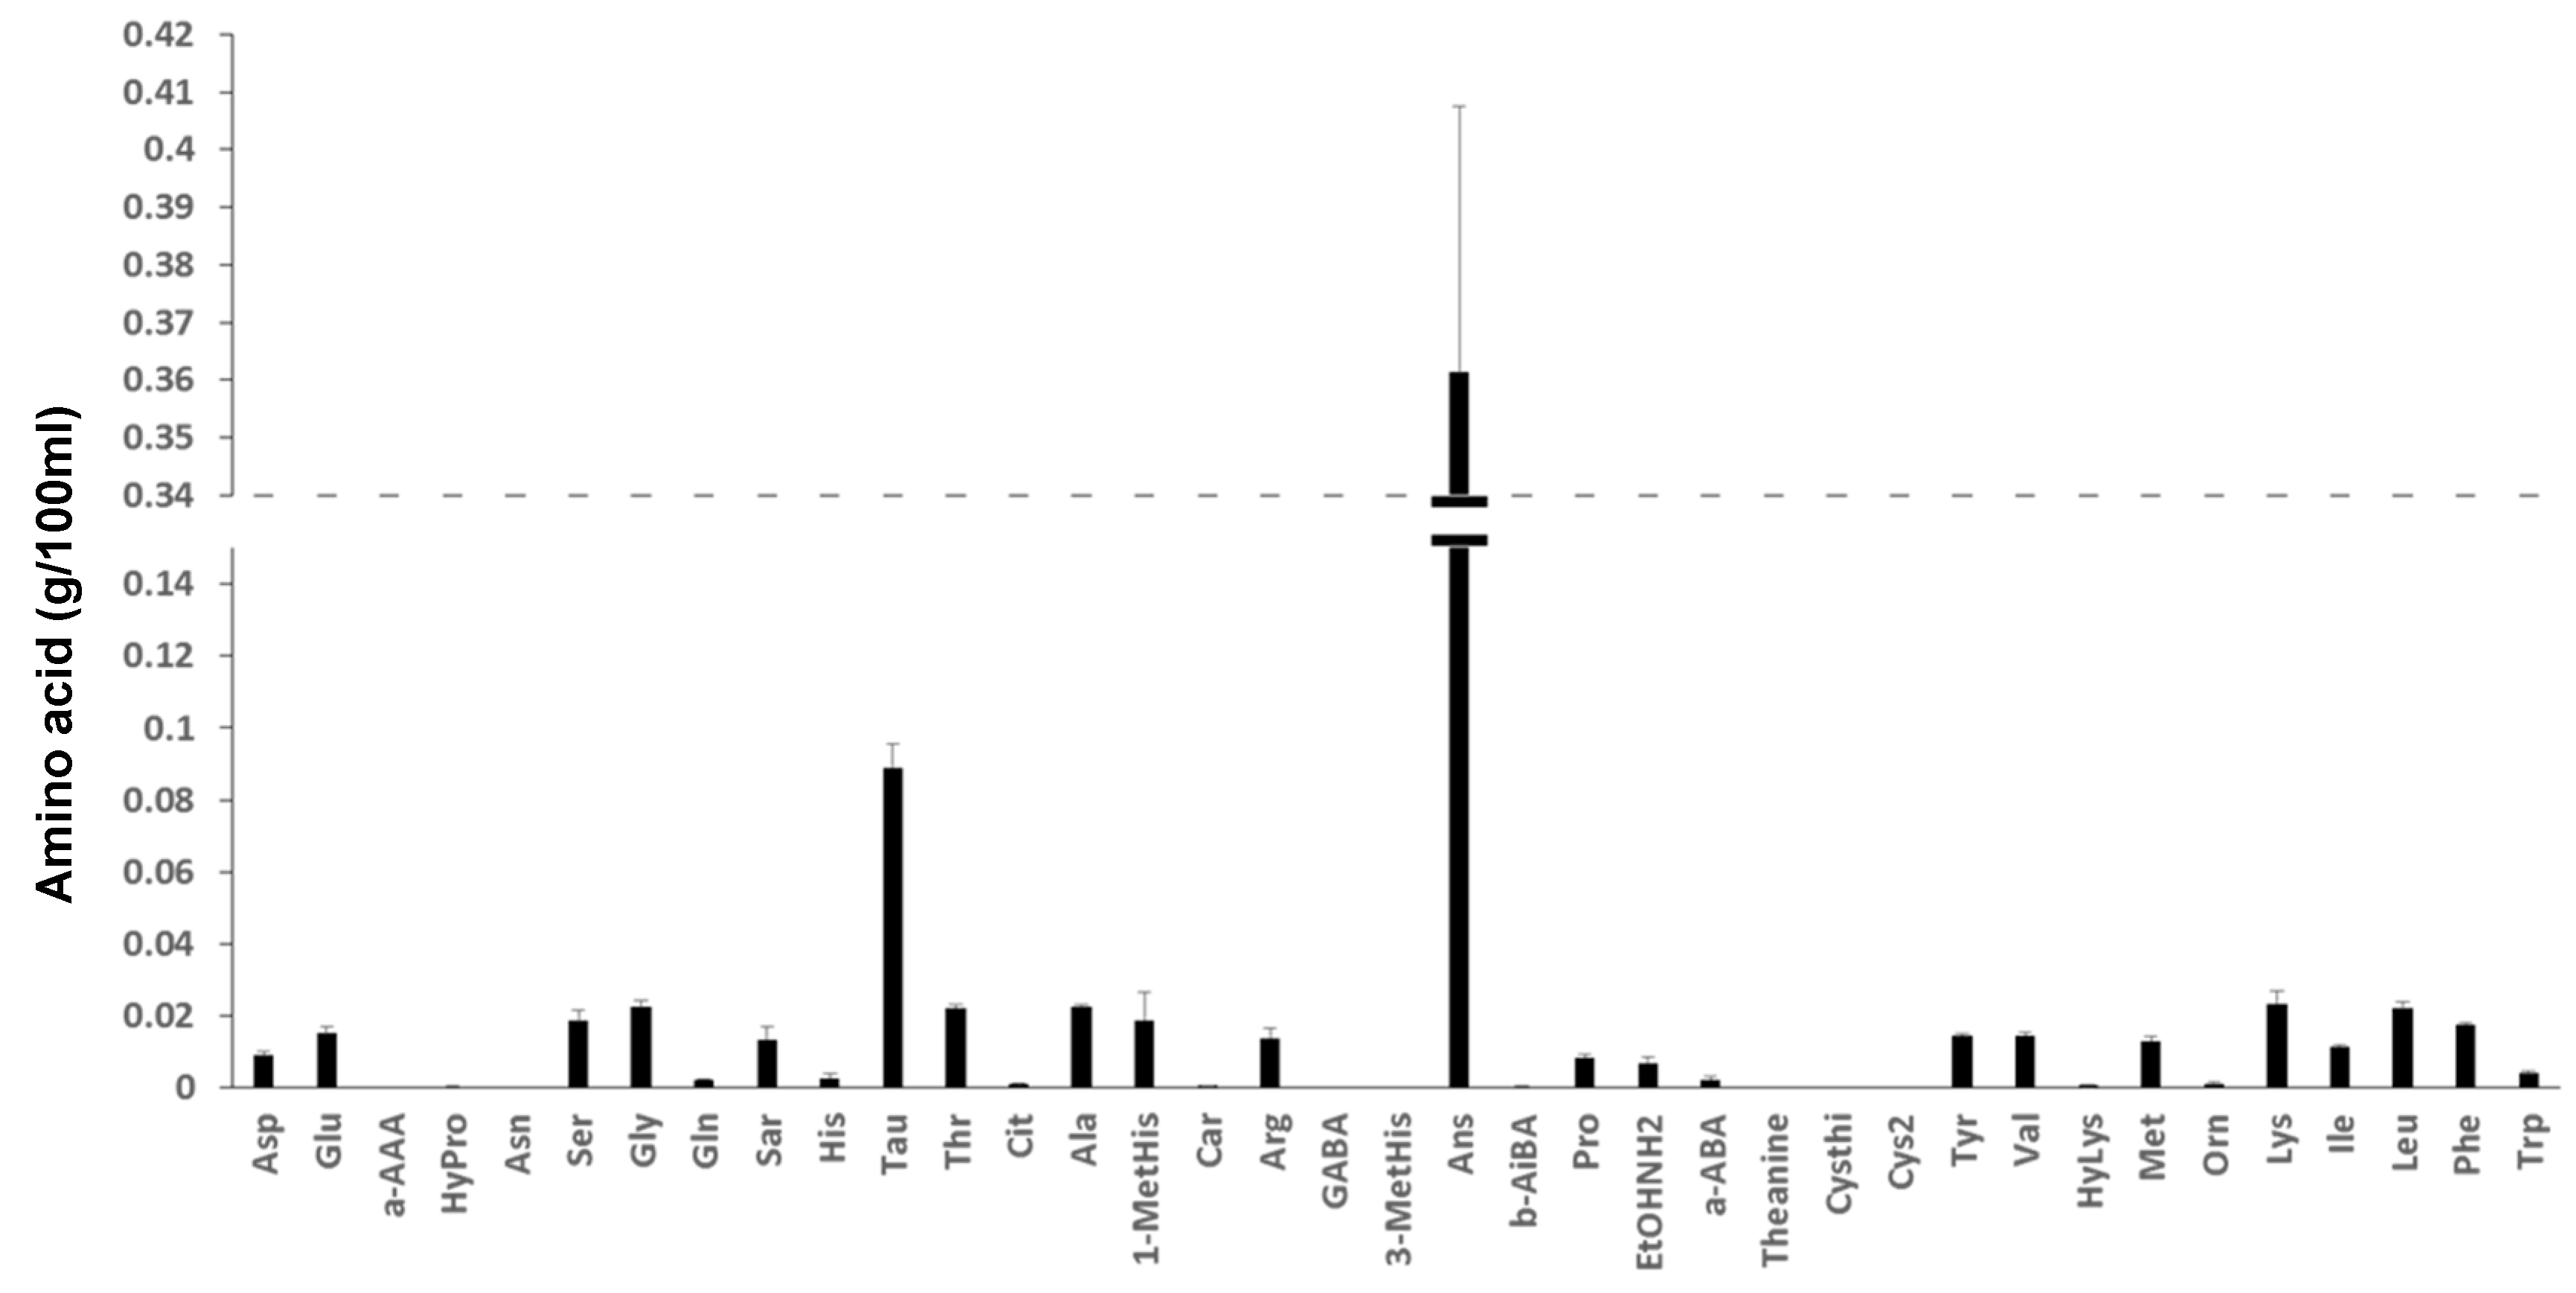
3.6.4. Total Free Amino Acid Content and Amino Acid Composition

Figure 10 shows the change in the total free amino acids content. The content prepared at both 55 °C and 60 °C without the addition of water was approximately 0.47 g/100 mL; no significance was observed between temperatures. The content prepared at both 55 °C and 60 °C with the addition of water was approximately 0.23 g/100 mL; no significant difference was observed between temperatures. In the case the without addition of water, the content significantly increased as time passed, and reached more than 0.65 g/100 mL. In the case with addition of water, the content was stable until 72 h, and that at 60 °C was significantly increased at 72 h as compared to 0 h. The content significantly increased to 0.47 g/100 mL at 96 h as compared to 0 h at the temperature of 55 °C.
Figure 11 shows the amino acid composition of GMSFS. Interestingly, the ratio of anserine to total amino acids was significantly higher than that of other amino acids (approximately 36% of total amino acids). Taurine also was significantly higher than that of other amino acids except for anserine. Essential amino acids (isoleucine, leucine, methionine, lysine, valine, phenylalanine, tryptophan, histidine, threonine) for human and others (asparagine, glutamic acid, serine, glycine, sarcosine, citrulline, alanine, 1-metyl histidine, arginine, proline, ethanolamine, α-aminobutyric acid, and tyrosine) were detected at less than 0.03 g/100 mL. GABA was not detected in the GMSFS.

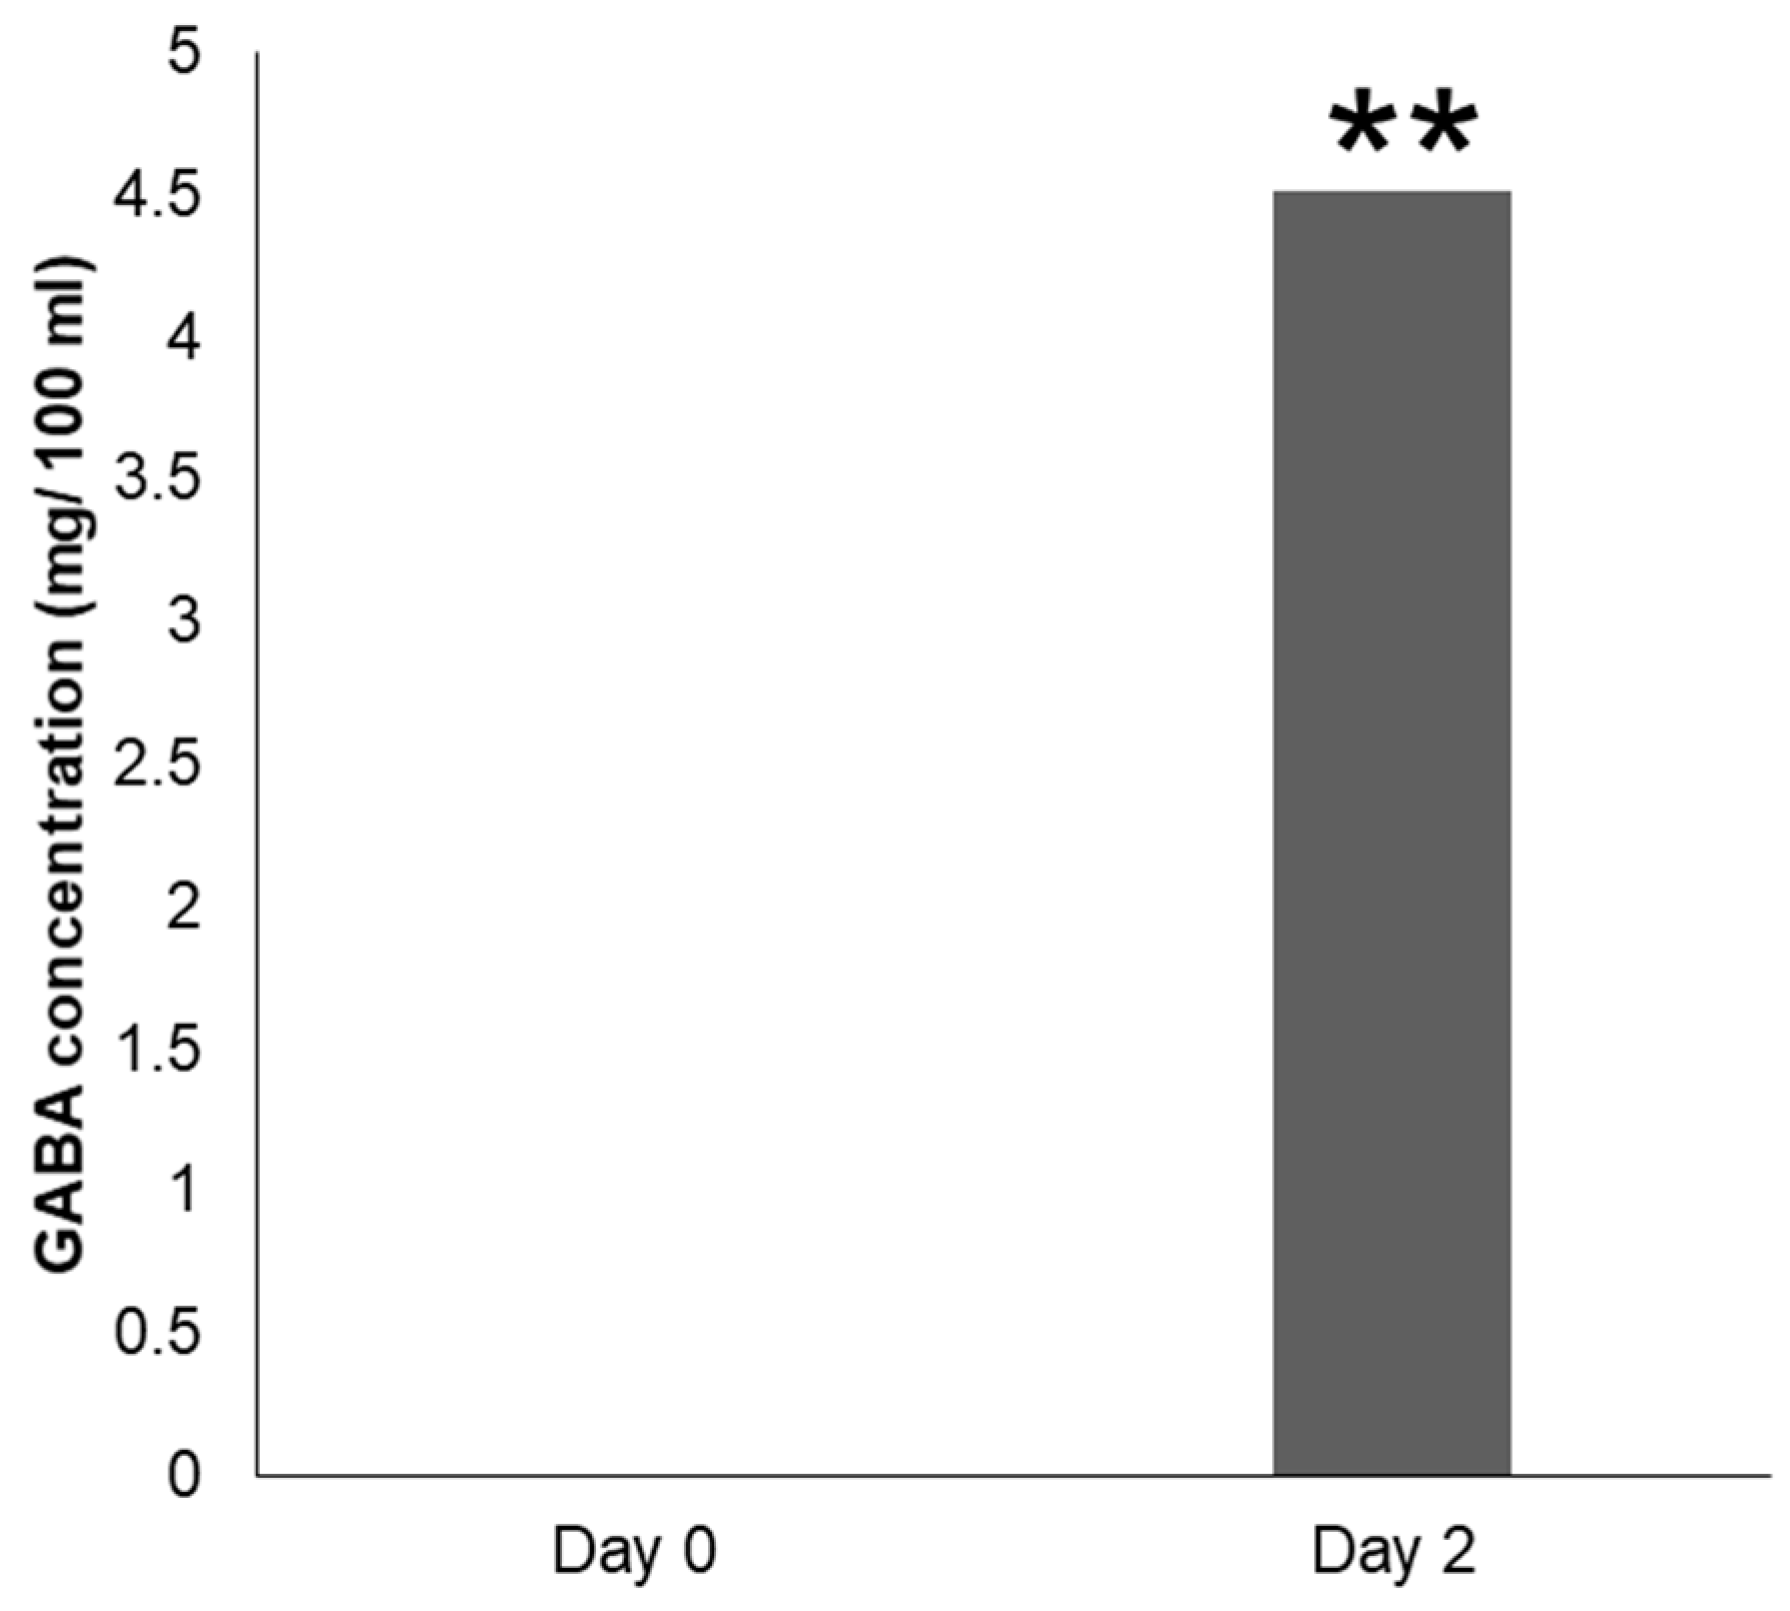
3.7. Microbial Fermentation of GMSFS by Strain N10

Figure 12 shows the GABA concentration in the GMSFS before and after incubation with strain N10. Before incubation, GABA was not detected in the GMSFS, but it was detected after incubation for 48 h with strain N10 (4.5 mg/100 mL).

4. Discussion

In this study, we successfully isolated 38 strains of LAB from fermented foods, and 8 strains of GABA-producing LAB were detected based on TLC and LC-MS analyses. All strains of GABA producing LAB were identified as L. plantarum based on the 16S rRNA gene sequence analysis. This species has been well reported as a GABA-producing LAB in various studies [42,43]. We selected strain N10 as a candidate LAB for producing GABA-enriched fish sauce based on the results of growth trials at different temperatures, pH, and NaCl concentrations.
In our previous study, we already confirmed that the protease activities in a crude enzyme solution from masu salmon were significantly improved and suppressed by increasing the temperature from 50 °C to 60 °C and by the addition of NaCl, respectively. In the case of traditional fish sauces, NaCl was added at more than 10% to the minced fish. In our previous study, the protease activity at 10% NaCl was inhibited by 57% compared to that at 0% NaCl. In the case of sardines, protease activities were significantly suppressed under high-salt conditions [44]. From the viewpoints of efficient autolysis and human health, the development of low or no-salt fish sources is desirable. The protease activity was showed significantly stronger at 60 °C than at 55 °C. This result indicated that it is possible to avoid the risk of microbial contamination by reducing the amount of NaCl in fish sauce.
During the process of autolysis at 55 °C and 60 °C, the protein concentration did not significantly change (Figure 7). On the other hand, the results of SDS-PAGE showed the degradation of protein to low-molecular-weight substances, which indicated that the indigenous protease of masu salmon worked at higher temperatures (Figure 8). Furutani and Satomi (2013) monitored the protein degradation in the process of fish sauce preparation with Glossanodon semifasciatus by SDS-PAGE and found the disappearance of the band at 45–66 kDa due to the autolysis of proteins [45]. Those results agreed with the result of this study.
Histamine poisoning frequently occurs in fishery products such as red meat fish, especially Scombridae, which contains a high content of free histidine, the precursor of histamine, at around 700–1800 mg/100 g [46]. It is known that histamine poisoning can be caused by the ingestion of foods containing 22–370 mg of histamine [47]. In the GMSFS without NaCl, the total viable count was low (less than 90 CFU/mL), and the histamine concentrations at 55 °C and 60 °C were less than 6 ppm (6 mg/100 g) (Figure 9). This result indicates that the autolysis of giant masu salmon without NaCl did not cause microbial and histamine contamination due to the high-temperature treatment.
During autolysis, the total free amino acid content increased as time advanced, and it reached 740 mg/100 mL (Figure 10). Katayama et al. surveyed the total amino acid concentration in various commercial fish sauces (CFS) made in Vietnam, Thailand, and Japan, and found concentrations ranging from 1.749 mg/100 mL (CFS from Japan) to 22,507 mg/100 mL (CFS from Vietnam) [48]. Park et al. also reported variation in the total amino acids in fish sauce among Asian countries [5].
The amino acid composition of GMSFS was unique because the ratio of anserine to total amino acid was very high (Figure 11). Anserine is an imidazole peptide and consists of β-alanine and L-histidine. Ogata and Murai found that the amount of anserine in the white muscle of smolts was significantly larger than that in parr [49]. We also previously found high concentrations of anserine in the free amino acids of the white muscle of giant masu salmon [50]. It is known that anserine has a strong buffering capacity, which is important for the anaerobic-burst swimming ability [51,52]. The white muscle of various fish, particularly migratory species, is known to contain large amounts of free histidine and its related dipeptides, such as anserine, carnosine, and balenine [53]. In the case of salmonid species, anserine seems to be selectively accumulated in the white muscle over other dipeptides including histidine [54]. Additionally, the anserine content in the muscle increased as the fish size increased [55]. Anserine shows physiological effects such as antioxidant effects, not only fish but also mammalians including humans, and these effects contribute to its anti-fatigue effects and improvement of athletic performance [56,57]. Taurine also was detected in GMSFS at a high rate after the anserine. Taurine is a sulfur-containing amino acid and is abundantly distributed in several organs of various animals. Taurine can be synthesized from other sulfur-containing amino acids such as methionine, cysteine, and cysteine through cysteine sulfinate decarboxylase, and freshwater fish have this pathway [58,59]. It is well known that taurine plays multiple important physiological roles such as osmolyte, bile acid conjugate, and antioxidant [60]. Therefore, taurine supplements are widely used to support the increasing body of literature.
Subsequently, we succeeded in enriching the anserine-rich GMSFS with GABA using microbial fermentation with GABA-producing LAB strain N10 (Figure 12). Few attempts have been made to make a GABA-rich fish sauce although there are many GABA-rich foods such as drinks and snacks.
Like this, we succeeded to develop anserine-rich fish sauce from masu salmon, and enrich it with GABA by LAB. In further studies, we need to investigate optimize the fermentation process to increase the amino acids content in the GMSFS, and to evaluate the taste.

5. Conclusions

This study indicated that the giant masu salmon could be quickly autolyzed under non-salt concentrations and high temperature and that microbiological contamination could be prevented. Additionally, the GMSFS obtained from this fermentation process was unique as compared to CFS that it was an anserine-rich fish sauce. Also, the GABA content in the GMSFS was enriched by microbial fermentation with the L. plantarum strain N10 isolated in this study.

Author Contributions

Conceptualization, Y.T.; Writing—original draft, Y.T., Writing—review and editing, Y.T.; Investigation, M.N., S.N., N.N., R.T., and K.U.; Methodology, Y.T. and N.M.; Visualization, Y.T. and M.N.

Funding

This research received no external funding.

Acknowledgments

Individuals of giant masu salmon was kindly supplied by Yamameno-sato Co. Ltd., Miyazaki, Japan.

Conflicts of Interest

The authors declare no conflict interests.

References

  1. Tamate, T.; Maekawa, K. Life cycle of masu salmon (Oncorhynchus masou) in Shumarinai Lake, northern Hokkaido, Japan. Eur. J. For. Res. 2000, 1, 39–42. [Google Scholar]
  2. Nakajima, T.; Shimura, H.; Yamazaki, M.; Fujioka, Y.; Ura, K.; Hara, A.; Shimizu, M. Lack of hormonal stimulation prevents the landlocked Biwa salmon (Oncorhynchus masou subspecies) from adapting to seawater. Am. J. Physiol. Regul. Integr. Comp. Physiol. 2004, 307, R414–R425. [Google Scholar] [CrossRef] [PubMed]
  3. Uchida, M.; Ou, J.; Chen, B.W.; Yuan, C.H.; Zhang, X.H.; Cheng, S.S.; Funatsu, Y.; Kawasaki, K.I.; Satomi, M.; Fukuda, Y. Effects of soy sauce koji and lactic acid bacteria on the fermentation of fish sauce from freshwater silver carp Hypophthalmichthys molitrix. Fish. Sci. 2005, 71, 422–430. [Google Scholar] [CrossRef]
  4. Park, J.; Fukumoto, Y.; Fujita, E.; Tanaka, T.; Washio, T.; Otsuka, S.; Shimizu, T.; Watanabe, K.; Abe, H. Chemical Composition of Fish Sauce Produced in Southeast and East Asian Countries. J. Food Comp. Anal. 2001, 14, 113–125. [Google Scholar] [CrossRef]
  5. Park, J.; Watanabe, T.; Endo, K.; Watanabe, K.; Abe, H. Tasteactive components in a Vietnamese fish sauce. Fish. Sci. 2002, 68, 913–920. [Google Scholar] [CrossRef]
  6. Kimura, M.; Furutani, A.; Fukui, Y.; Shibata, Y.; Nei, D.; Yano, Y.; Satomi, M. Isolation and identification of the causative bacterium of histamine accumulation during fish sauce fermentation and the suppression effect of inoculation with starter culture of lactic acid bacterium on the histamine accumulation in fish sauce processing. Nippon Suisan Gakkaishi 2015, 81, 97–106. [Google Scholar] [CrossRef] [Green Version]
  7. Klomklao, S.; Benjakul, S.; Visessanguan, W.; Kishimura, H.; Simpson, B.K. Effects of the addition of spleen of skipjack tuna (Katsuwonuspelamis) on the liquefaction and characteristics of fish sauce made from sardine (Sardinella gibbosa). Food Chem. 2006, 98, 440–452. [Google Scholar] [CrossRef]
  8. Utagawa, T. Rapid fermentation of fish sauce and its use. J. Brew. Soc. Jpn. 2012, 107, 477–484. [Google Scholar] [CrossRef]
  9. Kataoka, E.; Tokue, C.; Yamashita, T.; Tanimura, W. Amino Acids, Organic Acids, Fatty Acids, Trimethylamine and Methional in Improved Fish Sauce. Jpn. J. Nutr. Dietet. 1987, 45, 67–76. [Google Scholar] [CrossRef]
  10. Kimata, M.; Kawai, A. The freshness of fish and the amount of histamine presented in the meat. Mem. Res. Inst. Food Sci. Kyoto Univ. 1953, 5, 25–54. [Google Scholar]
  11. Steinhoff, M.; Griffiths, C.; Church, M.; Lugar, T.A. Histamine; Blackwell Science: Oxford, UK, 2004; pp. 50–52. [Google Scholar]
  12. Maintz, L.; Novak, N. Histamine and histamine intolerance. Am. J. Clin. Nutr. 2007, 85, 1185–1196. [Google Scholar] [CrossRef] [PubMed]
  13. Divya, J.; Kulangara Varsha, K.; Madhavan Nampoothiri, K.; Ismail, B.; Pandey, A. Probiotic fermented foods for health benefits. Eng. Life Sci. 2012, 12, 377–390. [Google Scholar] [CrossRef]
  14. Das, D.; Goyal, A. Lactic Acid Bacteria in Food Industry: Microorganisms in Sustainable Agriculture and Biotechnology; Satyanarayama, T., Johri, B.M., Prakash, A., Eds.; Springer: Berlin/Heidelberg, Germany, 2011; pp. 757–772. [Google Scholar]
  15. Fessard, A.; Kapoor, A.; Patche, J.; Assemat, S.; Hoarau, M.; Bourdon, E.; Bahorun, T.; Remize, F. Lactic Fermentation as an Efficient Tool to Enhance the Antioxidant Activity of Tropical Fruit Juices and Teas. Microorganisms 2017, 5, 23. [Google Scholar] [CrossRef]
  16. Arena, M.P.; Caggianiello, G.; Russo, P.; Albenzio, M.; Massa, S.; Fiocco, D.; Capozzi, V.; Spano, G. Functional Starters for Functional Yogurt. Foods 2015, 4, 15–33. [Google Scholar] [CrossRef] [Green Version]
  17. Pasini, F.; Soglia, F.; Petracci, M.; Caboni, M.F.; Marziali, S.; Montanari, C.; Gardini, F.; Grazia, L.; Tabanelli, G. Effect of Fermentation with Different Lactic Acid Bacteria Starter Cultures on Biogenic Amine Content and Ripening Patterns in Dry Fermented Sausages. Nutrients 2018, 10, 1497. [Google Scholar] [CrossRef]
  18. Sanders, M.E.; Merenstein, D.; Merrifield, C.A.; Hutkins, R. Probiotics for human use. Nutr. Bull. 2018, 43, 212–225. [Google Scholar] [CrossRef]
  19. Ribeiro, S.C.; Domingos-Lopes, M.F.P.; Stanton, C.; Paul Ross, R.; Silva, C.C.G. Production of γ-aminobutyric acid (GABA) by Lactobacillus otakiensis and other Lactobacillus sp. isolated from traditional Pico cheese. Int. J. Dairy Technol. 2018, 71, 1012–1017. [Google Scholar] [CrossRef]
  20. Yoshida, S.; Haramoto, M.; Fukuda, T.; Mizuno, H.; Tanaka, A.; Nishimura, M.; Nishihara, J. Optimization of a γ-aminobutyric acid (GABA) enrichment process for Hokkaido white rice and the effects of GABA-enriched white rice on stress relief in humans. Nippon Shokuhin Kagaku Kogaku Kaishi 2015, 62, 95–103. [Google Scholar] [CrossRef]
  21. Itoh, T.; Tomita, J.; Motegi, H.; Ebihara, S.; Takahashi, K.; Shimizu, R.; Numata, H.; Watanabe, Y. Antihypertensive and sedative effect of soymilk contained high natural GABA levels in human. Oyo Yakuri 2007, 72, 51–56. [Google Scholar]
  22. Wang, C.; Fan, L.; Gao, H.; Wu, X.; Li, J.; Lv, G.; Gong, B. Polyamine biosynthesis and degradation are modulated by exogenous gamma-aminobutyric acid in root-zone hypoxia-stressed melon roots. Plant Physiol. Biochem. 2014, 82, 17–26. [Google Scholar] [CrossRef]
  23. Gordon, F.J.; Sved, A.F. Neutrotransmitters in central cardiovascular regulations: Glutamate and GABA. Clin. Exp. Pharmacol. Physiol. 2002, 29, 522–524. [Google Scholar] [CrossRef]
  24. Gamel-Didelon, K.; Corsi, C.; Pepeu, G.; Jung, H.; Gratzl, M.; Mayerhofer, A. An autocrine role for pituitary GABA: Activation of GABA-B receptors and regulation of growth hormone levels. Neutroendocrinology 2002, 76, 170–177. [Google Scholar] [CrossRef] [PubMed]
  25. Krystal, J.; Sanacora, G.; Blumberg, H.; Anand, A.; Charney, D.S.; Marck, G.; Epperson, C.N.; Goddard, A.; Mason, G.F. Glutamate and GABA systems as targets for novel antidepressant and mood-stabilizing treatments. Mol. Psychiatr. 2002, 7, S71–S80. [Google Scholar] [CrossRef] [Green Version]
  26. Minuk, G.Y. GABA and hepatocellular carcinoma. Mol. Cell. Biochem. 2000, 207, 105–108. [Google Scholar] [CrossRef] [PubMed]
  27. Capozzi, V.; Fragasso, M.; Romaniello, R.; Berbegal, C.; Russo, P.; Spano, G. Spontaneous Food Fermentations and Potential Risks for Human Health. Fermentation 2017, 3, 49. [Google Scholar] [CrossRef]
  28. Hoppu, U.; Hopia, A.; Pohjanheimo, T.; Rotola-Pukkila, M.; Mäkinen, S.; Pihlanto, A.; Sandell, M. Effect of Salt Reduction on Consumer Acceptance and Sensory Quality of Food. Foods 2017, 6, 103. [Google Scholar] [CrossRef]
  29. Diana, M.; Rafecas, M.; Arco, C.; Quilez, J. Free amino acid profile of Spanish artisanal cheeses: Importance of gamma-aminobutyric acid (GABA) and ornithine content. J. Food Compos. Anal. 2014, 35, 94–100. [Google Scholar] [CrossRef]
  30. Aryanta, R.W.; Fleet, G.H.; Buckle, K.A. The occurrence and growth of microorganisms during the fermentation of fish sausage. Int. J. Food Microbiol. 1991, 13, 143–155. [Google Scholar] [CrossRef]
  31. Hill, W.E.; Keasler, S.P.; Trucksess, M.W.; Feng, P.; Kaysner, C.A.; Lampel, K.A. Polymerase Chain Reaction Identification of Vibrio vulnificus in Artificially Contaminated Oysters. Appl. Environ. Microbiol. 1991, 57, 707–711. [Google Scholar]
  32. Schmizs, A.; Riesner, D. Purification of nucleic acids by selective precipitation with polyethylene glycol 6000. Anal. Biochem. 2006, 354, 311–313. [Google Scholar]
  33. Tompson, J.D.; Gibon, T.J.; Plewniak, F.; Jeanmougin, F.; Higgins, D.G. The CLUSTAL X windows interface: Flexible strategies for multiple sequence alignment aided by quality analysis tools. Nucleic Acids Res. 1997, 25, 4876–4882. [Google Scholar] [CrossRef] [PubMed]
  34. Kimura, M. A simple method for estimating evolutionary rates of base substitutions through comparative studies of nucleotide sequences. J. Mol. Evol. 1980, 16, 111–120. [Google Scholar] [CrossRef] [PubMed]
  35. Saitou, N.; Nei, M. The neighbor-joining method: A new method for reconstructing phylogenetic trees. Mol. Biol. Evol. 1987, 4, 406–425. [Google Scholar]
  36. Kumar, S.; Stecher, G.; Tamura, K. MEGA7: Molecular evolutionary genetics analysis version 7.0 for bigger datasets. Mol. Biol. Evol. 2006, 33, 1870–1874. [Google Scholar] [CrossRef] [PubMed]
  37. Folch, J.; Ascoli, I.; Lees, M.; Meath, J.A.; Lebaron, N. Preparation of lipid extracts from brain tissue. J. Biol. Chem. 1951, 195, 833–841. [Google Scholar]
  38. AOAC International. AOAC International Official Methods of Analysis, 18th ed.; AOAC International: Washington, DC, USA, 2005. [Google Scholar]
  39. Hirata, K.; Hirokado, M.; Uematsu, Y.; Nakajima, K.; Kazama, M. Investigation on Assay for the Proteolytic Activity of Protease and Papain Preparations for Food Manufacturing. Food Hyg. Saf. Sci. 1987, 45, 67–76. [Google Scholar] [CrossRef]
  40. Lowly, O.H.; Rosebrough, N.J.; Fan, A.C.; Rondall, R.T. Protein measurement with the folin phenol solution. J. Biol. Chem. 1951, 193, 265–275. [Google Scholar]
  41. Laemmli, U.K. Cleavage of structural proteins during the assembly of the head of bacteriophage T4. Nature 1970, 227, 680–685. [Google Scholar] [CrossRef]
  42. Zareian, M.; Oskoueian, E.; Forghani, B.; Ebrahimi, M. Production of a wheat-based fermented rice enriched with γ-amino butyric acid using Lactobacillus plantarum MNZ and its antihypertensive effects in spontaneously hypertensive rats. J. Funct. Foods 2015, 16, 194–203. [Google Scholar] [CrossRef]
  43. Shan, Y.; Man, C.X.; Han, X.; Li, L.; Guo, Y.; Deng, Y.; Li, T.; Zhang, L.W.; Jiang, Y.J. Evaluation of improved γ-aminobutyric acid production in yogurt using Lactobacillus plantarum NDC75017. J. Dairy Sci. 2015, 98, 2138–2149. [Google Scholar] [CrossRef]
  44. Yoshinaka, R.; Sato, M.; Tsuchiya, N.; Ikeda, S. Production of Fish Sauce from Sardine by Utilization of its Visceral Enzymes. Bull. Jpn. Soc. Sci. Fish. 1983, 49, 463–469. [Google Scholar] [CrossRef]
  45. Furutani, A.; Satomi, M. Study on proteolytic process of two fish sauce mashes prepared from deepsea smelt and waste from Kamaboko processing using soy sauce Koji mold. J. Brew. Soc. Jpn. 2013, 108, 802–812. [Google Scholar] [CrossRef]
  46. Auerswald, L.; Morren, C.; Lopata, A.L. Histamine levels in seventeen species of fresh and processed South African seafood. Food Chem. 2006, 98, 231–239. [Google Scholar] [CrossRef]
  47. Fujii, T. Scombroid Fish Poisoning. Jpn. J. Food Microbiol. 2006, 23, 61–71. [Google Scholar] [CrossRef]
  48. Katayama, Y.; Uchino, M.; Saro, H.; Takano, K. Chemical Property on Fish Sauce Produced in Thailand, Vietnam, and Japan. Food Preser. Sci. 2008, 34, 307–321. [Google Scholar] [CrossRef]
  49. Ogata, H.; Murai, T. White muscle of masu salmon, Oncorhynchus masou masou, smolts possesses a strong buffering capacity due to a high level of anserine. Fish Phys. Biochem. 1999, 13, 285–293. [Google Scholar] [CrossRef] [PubMed]
  50. Tanaka, R.; Uchida, K.; Ishimaru, M.; Ito, M.; Matsumoto, N.; Taoka, Y.; Hatate, H. Effect of seawater reared on the nutritional composition and antioxidant activity of edible muscle in smoltified-landlocked masu salmon (Oncorhynchus masou masou). Food Meas. 2018, 12, 200–208. [Google Scholar] [CrossRef]
  51. Abe, H.; Ohmama, S. Effect of starvation and seawater acclimation on the concentration of free L-histidine and related dipeptides in the muscle of eel, rainbow trout and Japanese dace. Comp. Biochem. Physiol. 1987, 88B, 507–511. [Google Scholar]
  52. Ogata, H.Y.; Konno, S.; Silverstein, J. Muscular buffering capacity of the parr and smolts in Oncorhynchus masou. Aquaculture 1998, 168, 303–310. [Google Scholar] [CrossRef]
  53. Suzuki, T.; Hirano, T.; Suyama, M. Free imidazole compounds in white and dark muscles of migratory marine fish. Comp. Biochem. Physiol. 1987, 87B, 615–619. [Google Scholar] [CrossRef]
  54. Abe, H. Distribution of free L-histidine and related dipeptides in the muscle of fresh-water fishes. Comp. Biochem. Physiol. 1983, 76B, 35–39. [Google Scholar] [CrossRef]
  55. Abe, H. Effect of growth on the concentration of L-histidine and anserine in the white muscle of carp and rainbow trout. Nippon Suisan Gakkaishi 1987, 53, 1657–1661. [Google Scholar] [CrossRef]
  56. Peng, H.C.; Lin, S.H. Effects of chicken extract on antioxidative status and liver protection under oxidative stress. J. Nut. Sci. Vitaminol. 2004, 50, 325–329. [Google Scholar] [CrossRef]
  57. Tanaka, M.; Nakamura, F.; Mizokawa, S.; Matsumura, A.; Nozaki, S.; Watanabe, Y. Establishment and assessment of a rat model of fatigue. Neurosci. Lett. 2003, 352, 159–162. [Google Scholar] [CrossRef] [PubMed]
  58. Wesseling, S.; Koeners, M.P.; Joles, J.A. Taurine red bull or red herring? Hypertension 2009, 53, 909–911. [Google Scholar] [CrossRef] [PubMed]
  59. Salze, G.P.; Davis, D.A. Taurine: Critical nutrients for future fish feeds. Aquaculture 2015, 437, 215–229. [Google Scholar] [CrossRef]
  60. Schuller Levis, G.B.; Park, E. Taurine: New implications for an old amino acid. FEMS Microbiol. Lett. 2003, 226, 195–202. [Google Scholar] [CrossRef]
Figure 1. Concentration of GABA in the culture supernatant of the GABA-producing LAB isolated in this study. Values show average (n = 3). Different letters denoted in column show significant difference (p < 0.05). ND, not detected.
Fermentation 05 00045 g001
Figure 2. Phylogenetic tree by the neighbor-joining method based on the sequence of 16S rRNA gene of LAB isolated in this study and corresponding region of LAB obtained from NCBI database. The bootstrap value was 1000 replicates. The scale at the bottom indicates the evolutionary distance of nucleotide substitution per site.
Fermentation 05 00045 g002
Figure 3. Effect of NaCl concentrations on growth of GABA producing-four strains. Values indicate the average ± standard deviation (n = 3). Different letters denoted in column show significant difference (p < 0.05).
Fermentation 05 00045 g003
Figure 4. Effect of pH on growth of GABA producing-four strains. Values indicate the average ± standard deviation (n = 3). Different letters denoted in column show significant difference (p < 0.05).
Fermentation 05 00045 g004
Figure 5. Effect of culture temperatures on growth of GABA producing-four strains. Values indicate the average ± standard deviation (n = 3). Different letters denoted in column show significant difference (p < 0.05).
Fermentation 05 00045 g005
Figure 6. Specific activity of protease extracted from giant masu salmon in different temperatures. Values represent mean (n = 3).
Fermentation 05 00045 g006
Figure 7. Change of protein concentrations in the mixtures of masu salmon reacted at 55 °C (A) and 60 °C (B) for 96 h. Closed circle (●), without water; open circle (o) with water. Values show average ± standard deviation (n = 3).
Fermentation 05 00045 g007
Figure 8. SDS-PAGE analysis of the mixtures of masu salmon reacted at 55 °C (A) and 60 °C (B) for 96 h. M, protein molecular weight standards.
Fermentation 05 00045 g008
Figure 9. Histamine concentration of the mixtures of masu salmon reacted at 55 °C (A) and 60 °C (B) for 96 h. Values represent mean (n = 3). An asterisk shows significant different (p < 0.05).
Fermentation 05 00045 g009
Figure 10. Total free amino acid content of the mixtures of masu salmon reacted at 55 °C and 60 °C or 96 h. Values represent mean (n = 3). Asterisks mean significant different (*, p <0.05; **, p < 0.01).
Fermentation 05 00045 g010
Figure 11. Amino acid compositions of the GMSFS. Values represent mean±standard deviation (n = 3). Asp, aspartic acid; Glu, glutamic acid; α-AAA, α-Aminoadipic acid; Hypro, hydroxyproline; Asn, asparagine; Ser, serine; Gly, glycine; Gln, glutamine; Sar, sarcosine; His, histidine; Tau, taurine; Thr, threonine; Cit, citrulline; Ala, alanine; 1-MeHis, 1-Methylhistidine; Car, carnosine; Arg, arginine; GABA γ-amino butyric acid; 3-Methylhistidine; Ans, anserine; β-AiBA, β-Amino-iso-butyric acid; Pro, proline; EtOHNH2, ethanolamine; α-ABA, α-aminobutyric acid; Cysthi, cystathionine; Cys2, cystine; Tyr, tyrosine; Val, valine; HyLys, hydroxylysine; Met, methionine; Orn, ornithine; Lys, lysine; Ile, isoleucine; Leu, leucine; Phe, phenylalanine; Try, tryptophan.
Fermentation 05 00045 g011
Figure 12. Concentration of GABA of the GMSFS treated by strain N10 for 2 days (n = 3). Asterisks mean significant difference (p < 0.01).
Fermentation 05 00045 g012

