Article

Simulation and Performance Analysis of Integrated Gasification–Syngas Fermentation Plant for Lignocellulosic Ethanol Production

Faculty of Industrial Engineering, Mechanical Engineering and Computer Science, University of Iceland, Hjardarhagi 6, 107 Reykjavik, Iceland
*
Author to whom correspondence should be addressed.
Submission received: 30 June 2020 / Revised: 9 July 2020 / Accepted: 13 July 2020 / Published: 14 July 2020
(This article belongs to the Special Issue Biorefineries)

Abstract

:
This study presents a new simulation model developed with ASPEN Plus of waste biomass gasification integrated with syngas fermentation and product recovery units for bioethanol production from garden waste as a lignocellulosic biomass. The simulation model includes three modules: gasification, fermentation, and ethanol recovery. A parametric analysis is carried out to investigate the effect of gasification temperature (500–1500 °C) and equivalence ratio (0.2–0.6) on the gasification performance and bioethanol production yield. The results reveal that, for efficient gasification and high ethanol production, the operating temperature range should be 700–1000 °C, as well as an equivalence ratio between 0.2 and 0.4. At optimal operating conditions, the bioethanol production yield is 0.114 kg/h per 1 kg/h input garden waste with 50% moisture content. It is worth mentioning that this parameter increases to 0.217 kgbioethanol/kggarden waste under dry-based conditions.

1. Introduction

In order to prevent dangerous climate change, the world needs to reduce greenhouse gas (GHG) emissions to net zero or even negative. Many experts suggest that we need to completely phase out fossil fuels and replace them with local and renewable energy sources like solar, biofuel, and wind energy [1,2,3,4]. Among the different renewable energy sources, biomass is one of the most promising alternative energy sources considered to be used instead of conventional ones [5,6,7].
Currently, around 10% of all energy generated worldwide comes from biomass. Most of this 10% is biofuel energy from the fermentation of corn and sugarcane. However, fermentation of corn competes with the global food supply, and fermentation of sugarcane drives deforestation. Therefore, the renewable and sustainable growth of these two bio-based energy sources may not be desirable even if it is economically feasible [8]. The key to overcome these challenges is using lignocellulosic biomasses as the most viable option for bioethanol production. Lignocellulosic ethanol (bioethanol) is one of the most important sources of advanced biofuels due to its promising feedstock availability and low production costs [9,10].
Lignocellulosic biomass can be converted into ethanol through either biochemical or thermochemical conversion processes. Biochemical conversion involves hydrolysis and fermentation while thermochemical conversion involves gasification and syngas fermentation [11]. Syngas fermentation operates at mild temperatures and pressures, and it avoids using expensive pretreatment processes and enzymes [12]. Moreover, in the thermochemical conversion, the environmental impacts rated to inlets can be neglected. However, it cannot be practical for biochemical conversion where the consumed sulfuric acid, lime, and nutrients contribute significantly in life-cycle fossil fuel consumption, GHG emission, and water use [11].
The objective of the present study was the development of a new computer model using the simulation software ASPEN Plus for the integrated gasification, syngas fermentation, and product purification units for ethanol production from garden waste as a model lignocellulosic biomass. Then, the model was used to investigate the effect of operating parameters like temperature and equivalence ratio (ER) on the syngas composition, low heating value (LHV) of produced syngas, cold gas efficiency (CGE), and amount of bioethanol production. Thus, this study could provide a framework for defining the gasification, fermentation, and product recovery plants to support equipment specification, and it will be the basis for future comprehensive environmental and techno-economic assessments.

2. Material and Methods

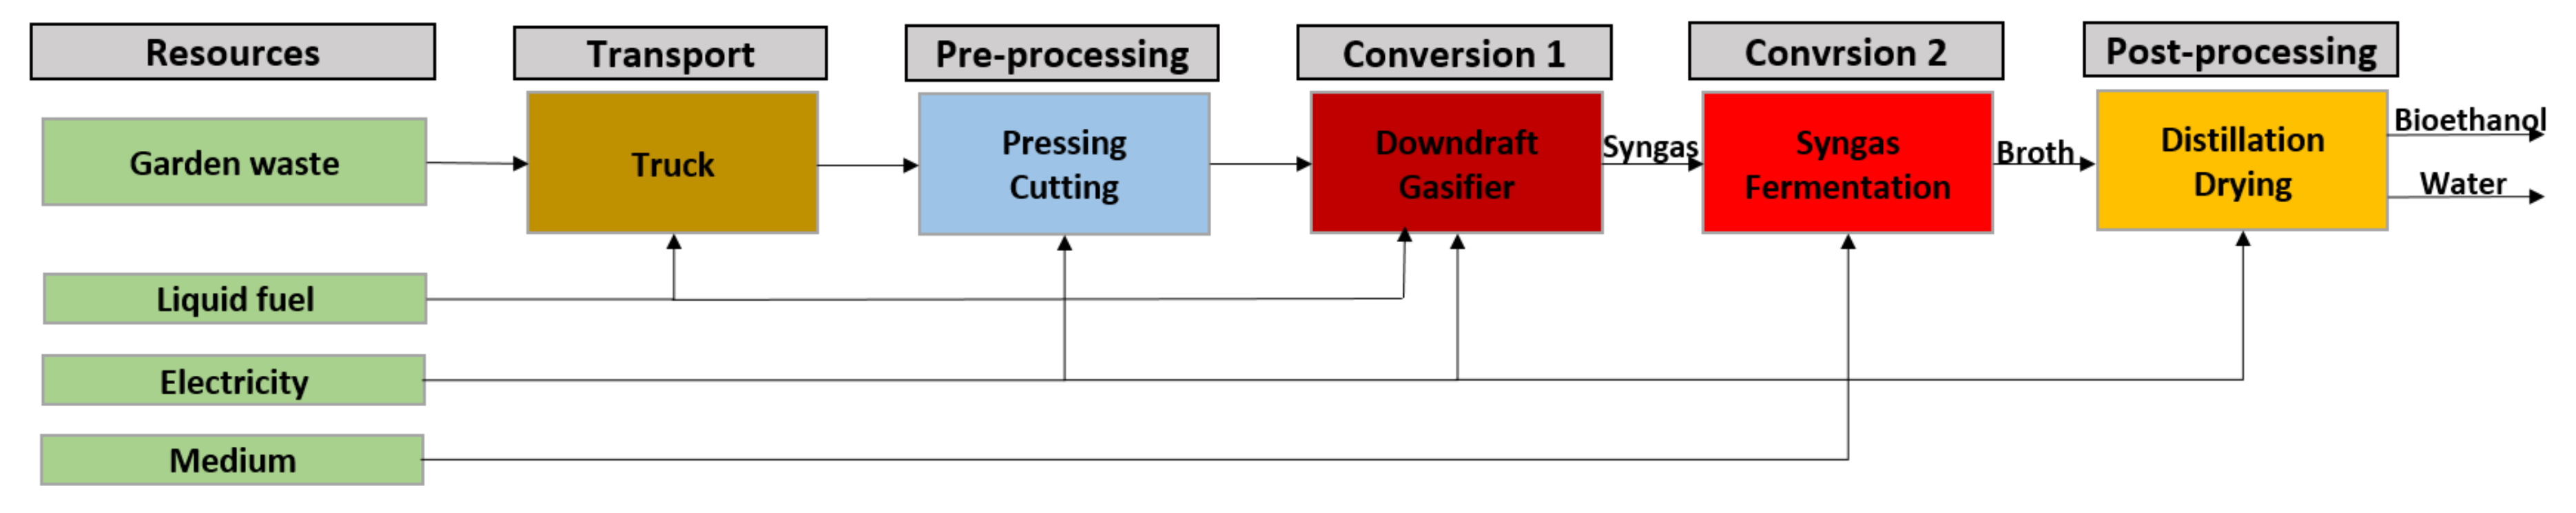
2.1. System Description

The system considered in this work includes all the process steps from resources to the end products (Figure 1).
Garden waste is the significant resource entering to the system, while liquid fuel and electricity are also the accessory inputs. Diesel fuel is used in trucks for transportation, and electricity is consumed for driving force and heat generation through the process. Garden waste is transferred from the waste fields to the preparation/pre-processing part, which is next to the gasification and ethanol production unit. The gasification process consists of drying, pyrolysis, combustion, and reduction [13,14]. Typically, the moisture in biomass ranges from 5–35%, which is reduced to lower than 5% through the drying process which occurs at a temperature of 100–150 °C. Then, in the pyrolysis step, biomass is heated (it is in the range of 200–700 °C) in the absence of oxygen; then, its volatile components are vaporized. The volatile vapor consists mainly of H2, CO, CO2, CH4, hydrocarbon gases, tar, and steam. Finally, combustion occurs at 700–1500 °C and gasification occurs between 800 and 1100 °C [15]. In this work, the down-draft reactors are considered to operate at atmospheric pressure to gasify garden waste biomass, while air is used as the gasification agent, resulting in CO2 and H2O, which subsequently undergo reduction upon contact with the char produced from pyrolysis. Reduction yields combustible gases such as H2, CO, and CH4 through a series of reactions; the main reactions in this category are outlined in Table 1 [8].
Then, the produced syngas enters the fermentation process where it is converted into ethanol and acetic acid in the fermenter by acetogenic microorganisms like Clostridium ljungdahlii. The stoichiometric equations for the production of ethanol and acetic acid are displayed below [12,16].
4 C O + 2 H 2 O C H 3 C O O H + 2 C O 2
2 C O 2 + 4 H 2 C H 3 C O O H + 2 H 2 O
6 C O + 3 H 2 O C 2 H 5 O H + 4 C O 2
2 C O 2 + 6 H 2 C 2 H 5 O H + 3 H 2 O
Finally, ethanol produced is removed from the fermentation broth or beer by distillation in the post-processing step and then dried in packed beds of molecular sieves with recovery of water and ethanol.

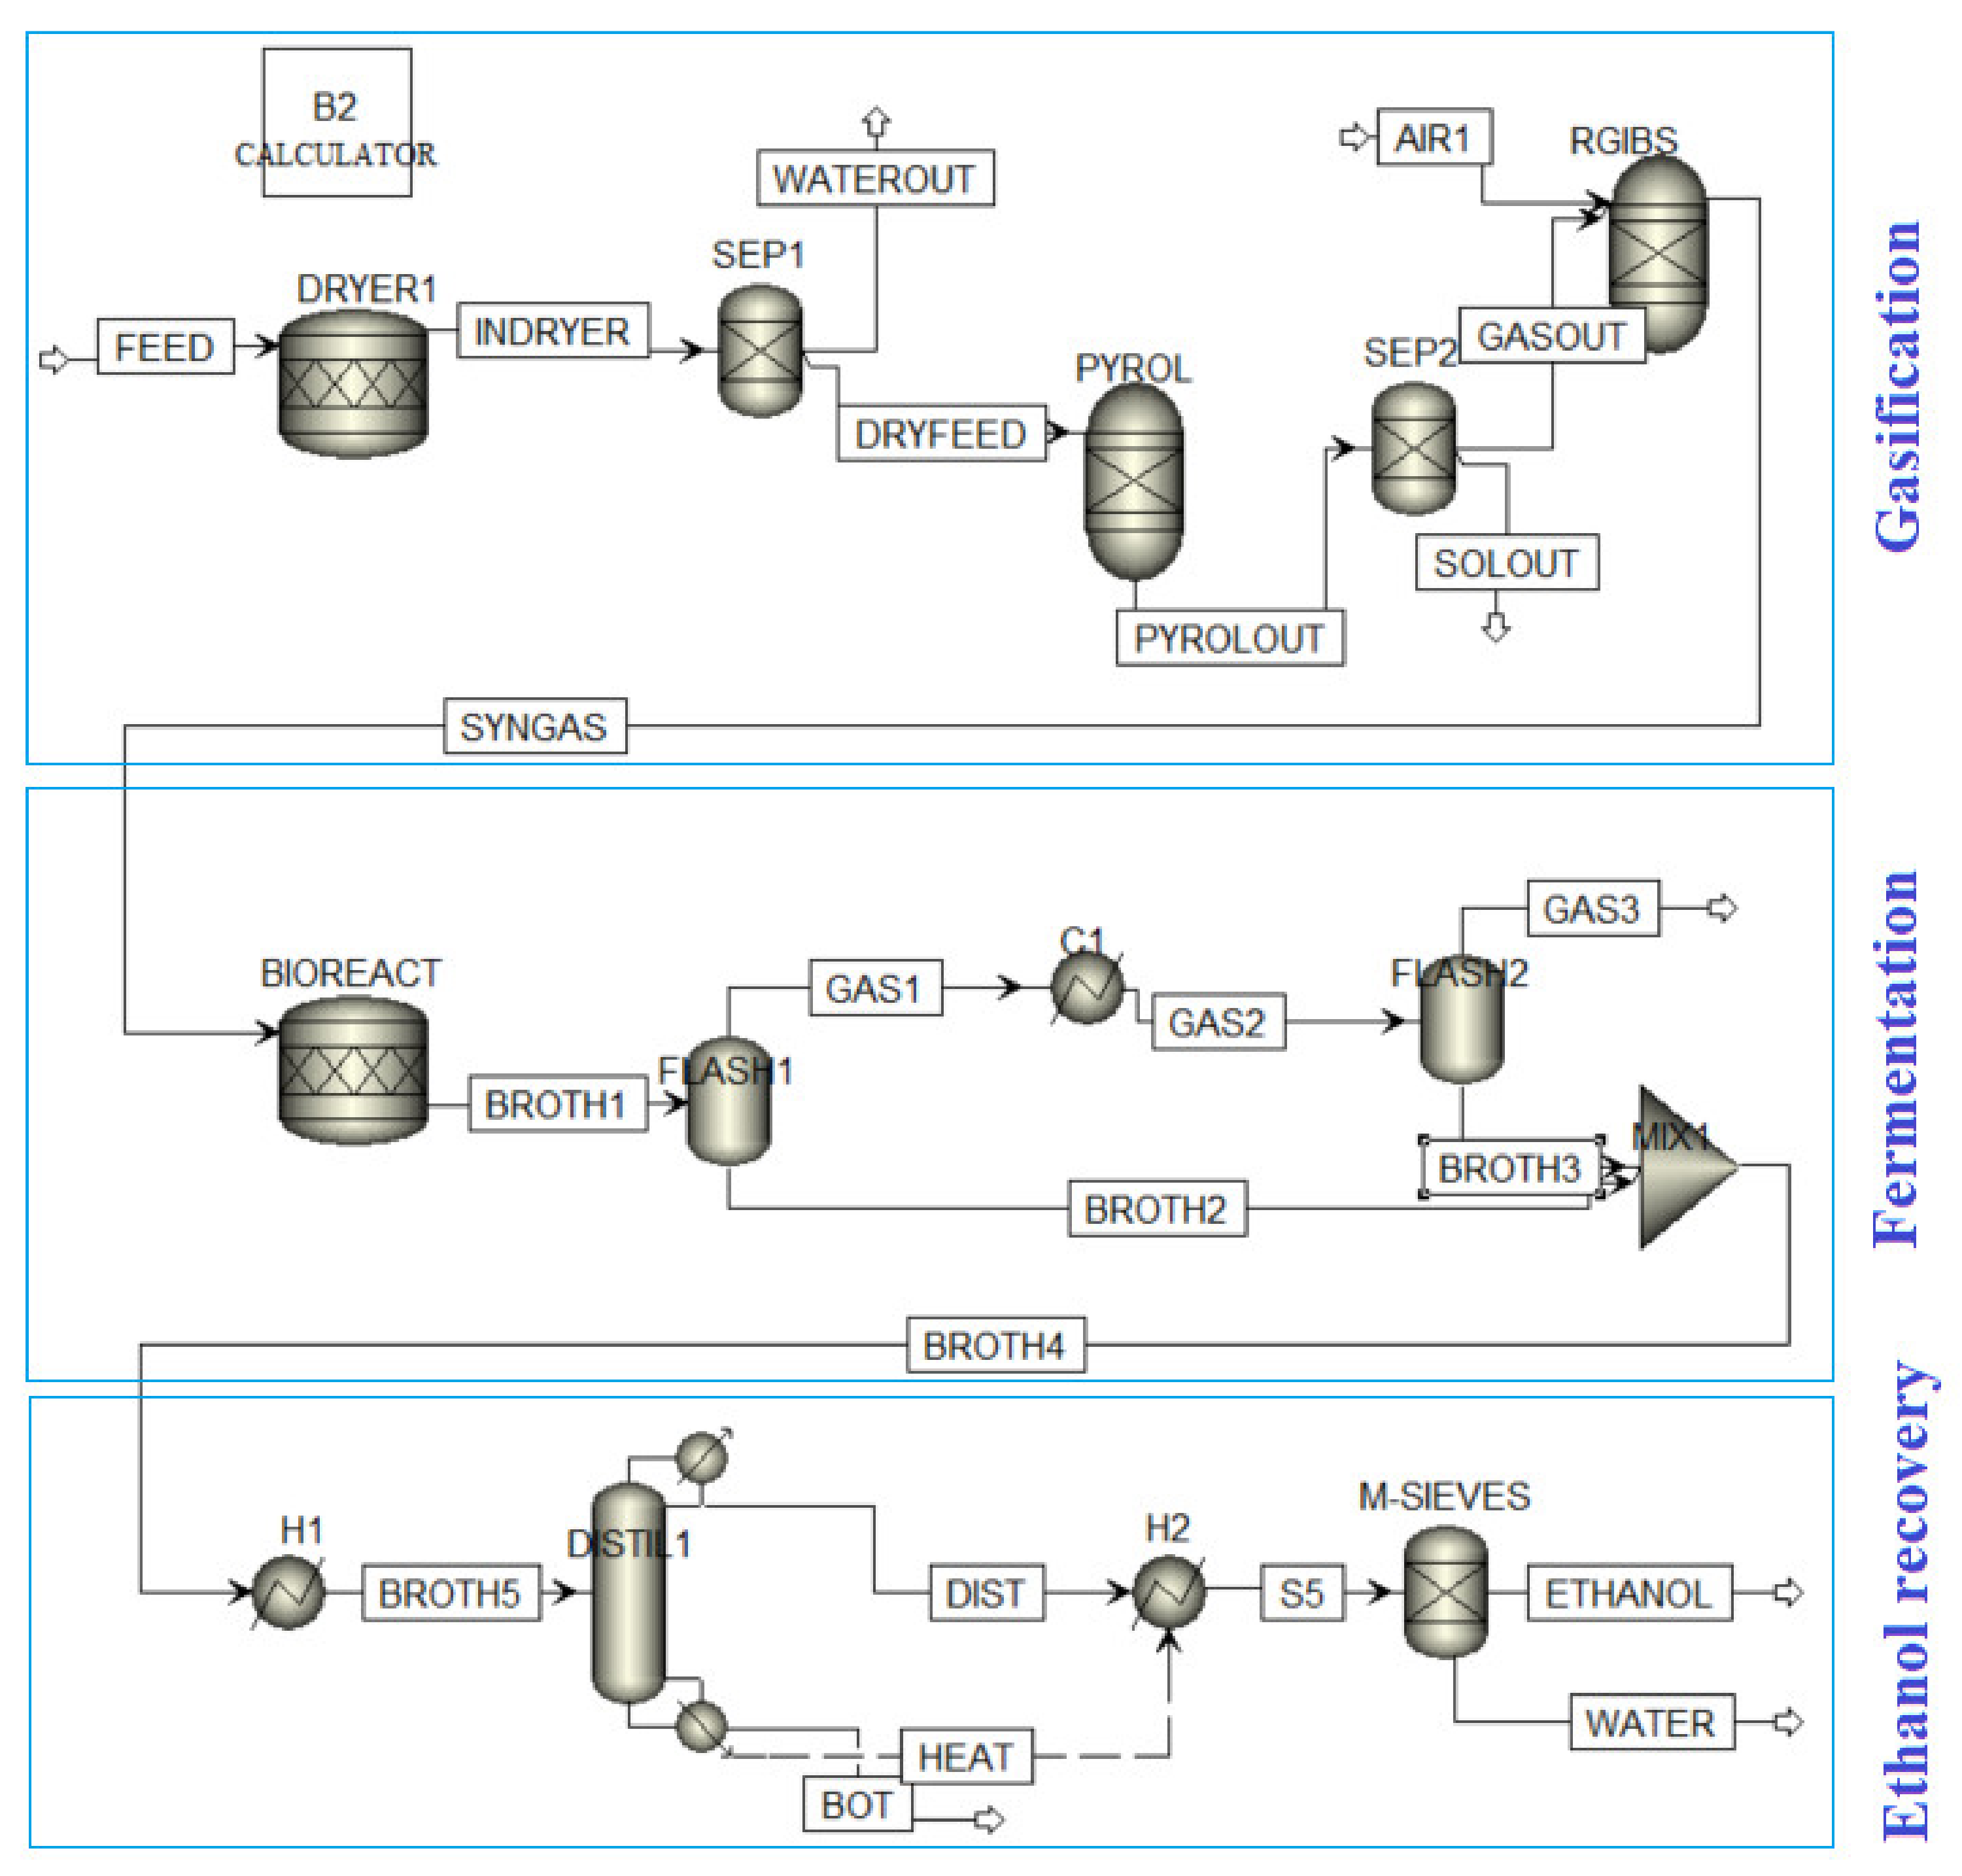
2.2. Simulation Model

An equilibrium simulation model was developed for lignocellulosic biomass gasification integrated with syngas fermentation and product recovery units for ethanol production using ASPEN Plus version 10. The Peng–Robinson equation of state with Boston–Mathias alpha function (PR-BM) was applied to calculate physical properties of the conventional components in the gasification process [17]. Moreover, the NRTL model was used as the thermodynamic package for description of the phase equilibrium between different components in the mixture, including a water–ethanol azeotrope existing in this system. HCOALGEN and DCOALIGT models were also employed for enthalpy and density of biomass and ash which are non-conventional components. MCINCPSD stream, comprising three substreams of the MIXED, CIPSD, and NCPSD classes, was also considered to define the biomass structure and ash streams which are not available in the ASPEN Plus component database [18,19]. The flow chart of the system simulated using ASPEN Plus is shown in Figure 2.

2.2.1. Gasification Module

The BIOMSS stream was defined as a nonconventional stream, and it was created by specifying the elemental and gross compositions of feedstock obtained from proximate and elemental analyses given in Table 2 [20]. Drying occurs at 150 °C to achieve the moisture reduction to 5 wt.% of the original sample. This step is directed by the stoichiometric reactor RSTOIC in Aspen Plus. This particular module is used to perform chemical reactions of known stoichiometry [21]. After drying, RYIELD, the yield reactor, is brought to simulate the feed pyrolysis. In this step, the feedstock is converted to volatile materials (VM) and char. VM contains carbon, hydrogen, oxygen, and nitrogen; char is also converted into ash and carbon, by specifying the product distribution based on the proximate and ultimate analysis of the feedstock. Then, RGibbs is used to simulate the biomass gasification. The decomposed feed and air enter the RGibbs reactor, where partial oxidation and gasification reactions occur. The reactor calculates the syngas composition by minimizing the Gibbs free energy and assumes complete chemical equilibrium [22,23].

2.2.2. Fermentation Module

The fermenter was modeled using a stoichiometric reactor (BIOREACT) in ASPEN Plus combined at atmospheric pressure and 38 °C. This temperature was chosen because it is the optimal temperature for growth of most ethanol-producing acetogenic microorganisms. The modeling of the bioreactor is based on the works proposed by Ray and Ramachandran [16]. In the bioreactor, 70% of CO is converted to ethanol and 5% to acetic acid, while 50% of H2 is converted to ethanol and 2% to acetic acid.
The bioreactor containing cells of the acetogenic bacteria (cell broth or beer) is a vessel designed to promote transfer of CO and H2 into the cells in the beer. CO and H2 are transformed to ethanol via reactions mediated by enzymes inside the cells. The product stream is a combination of liquid and gas that must be separated. A series of cooler and flash units were used to model this separation, minimizing the ethanol lost in the exhaust gas (GAS3).

2.2.3. Ethanol Recovery Module

Using ethanol as a biofuel needs to be a high-purity product. However, water and ethanol form an atmospheric azeotrope at 96.5 wt.%; thus, it is not possible to achieve the desired product by applying only a distillation unit. In this part, a combination of distillation and molecular sieves is used. Firstly, the broth from the fermentation part is distilled until an ethanol purity of 90 wt.%. Then, the rest of water is removed using molecular sieves. This is a vapor dehydration process that is based on the adsorption of the water molecules on the sieve micropores [24].
A rigorous distillation unit (Radfrac) was used to model the first step of the ethanol recovery. Based on preliminary shortcut calculations, a total condenser and a kettle reboiler were considered, and the stage number of the column was set to 25, with the feed entering at the stage of 11. The design specs feature in ASPEN Plus was used to design a column capable of obtaining a product purity of 90% and molar recovery of 99%, minimizing the loss of ethanol in the bottoms. Based on these design specifications, the mass distillate-to-feed ratio and the reflux ratio were calculated. Finally, the molecular sieve unit was modeled using a separator block that generates a pure ethanol stream (with a purity of 99%) as the final product of the simulated plant.

3. Results and Discussion

The developed model for waste biomass gasification integrated with syngas fermentation and bioethanol production was used to investigate the gasification performance of garden waste as a lignocellulosic biomass. The effect of gasifier temperature and equivalence ratio (ER) on the syngas composition, syngas yield, lower heating value (LHV) of produced gas, cold gas efficiency (CGE), and amount of bioethanol production are investigated. The lower heating value of product gas is calculated as follows [25,26]:
L H V s y n g a s ( k j N m 3 ) = 4.2 × ( 30 × y C O + 25.7 × y H 2 + 85.4 × y C H 4 )
where y is the molar fraction of gas species in the syngas (dry basis).
The cold gas efficiency (CGE) is an important index to account for the performance of biomass gasification, and it is calculated using Equation (6) [25,27].
C G E ( % ) = G P × L H V s y n g a s H H V f u e l × 100
where GP is the syngas yield, which is the volume of total product gas from the gasification per unit weight of fuel in normal conditions (N·m3·kg fuel−1). HHVfuel is the higher heating value of the fuel (MJ·kg fuel−1). It is calculated using the following equation [15,28]:
H H V f u e l ( M j k g ) = 0.312 × ( F C ) + 0.1534 × ( V M )
According to the Equation (7), heating value is a function of weight fractions of fixed carbon and volatile matter in the dry and ash-free conditions.
The specific mass flow rate of the produced bioethanol ( m b i o e t h a n o l ) is the ratio of the mass flow rate of the entering biomass into the system per mass flow rate of the product ethanol, calculated as shown below.
m b i o e t h a n o l = M b i o e t h a n o l ( k g / h r ) M b i o m a s s ( k g / h r )

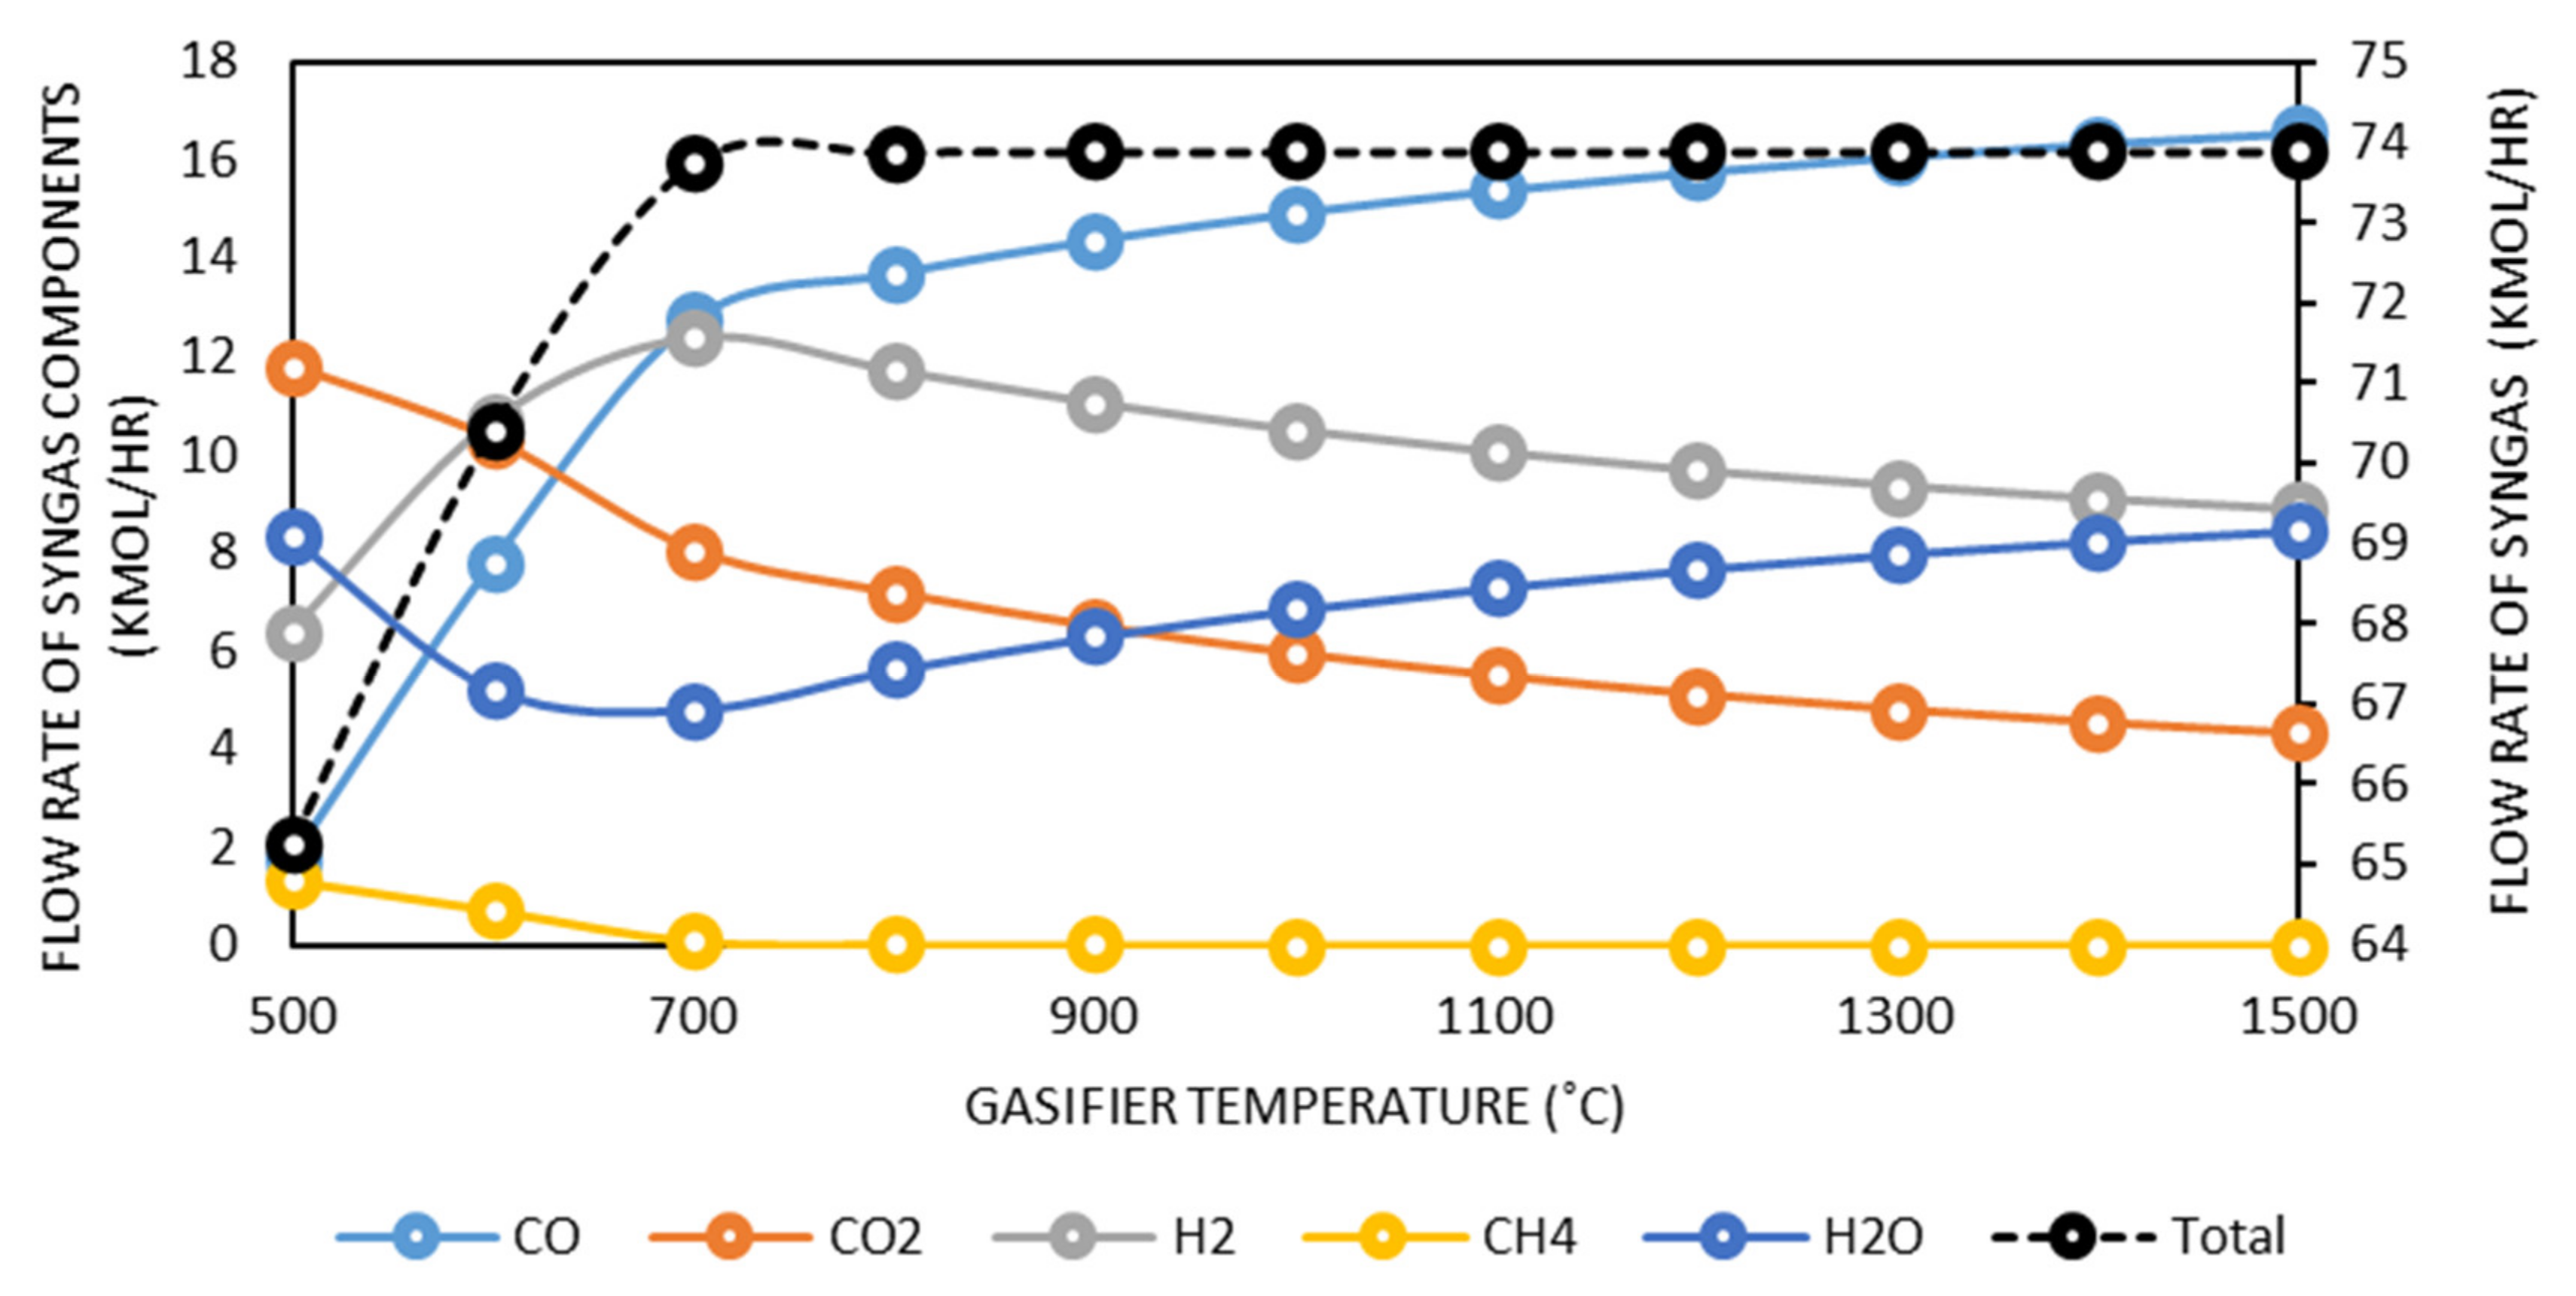
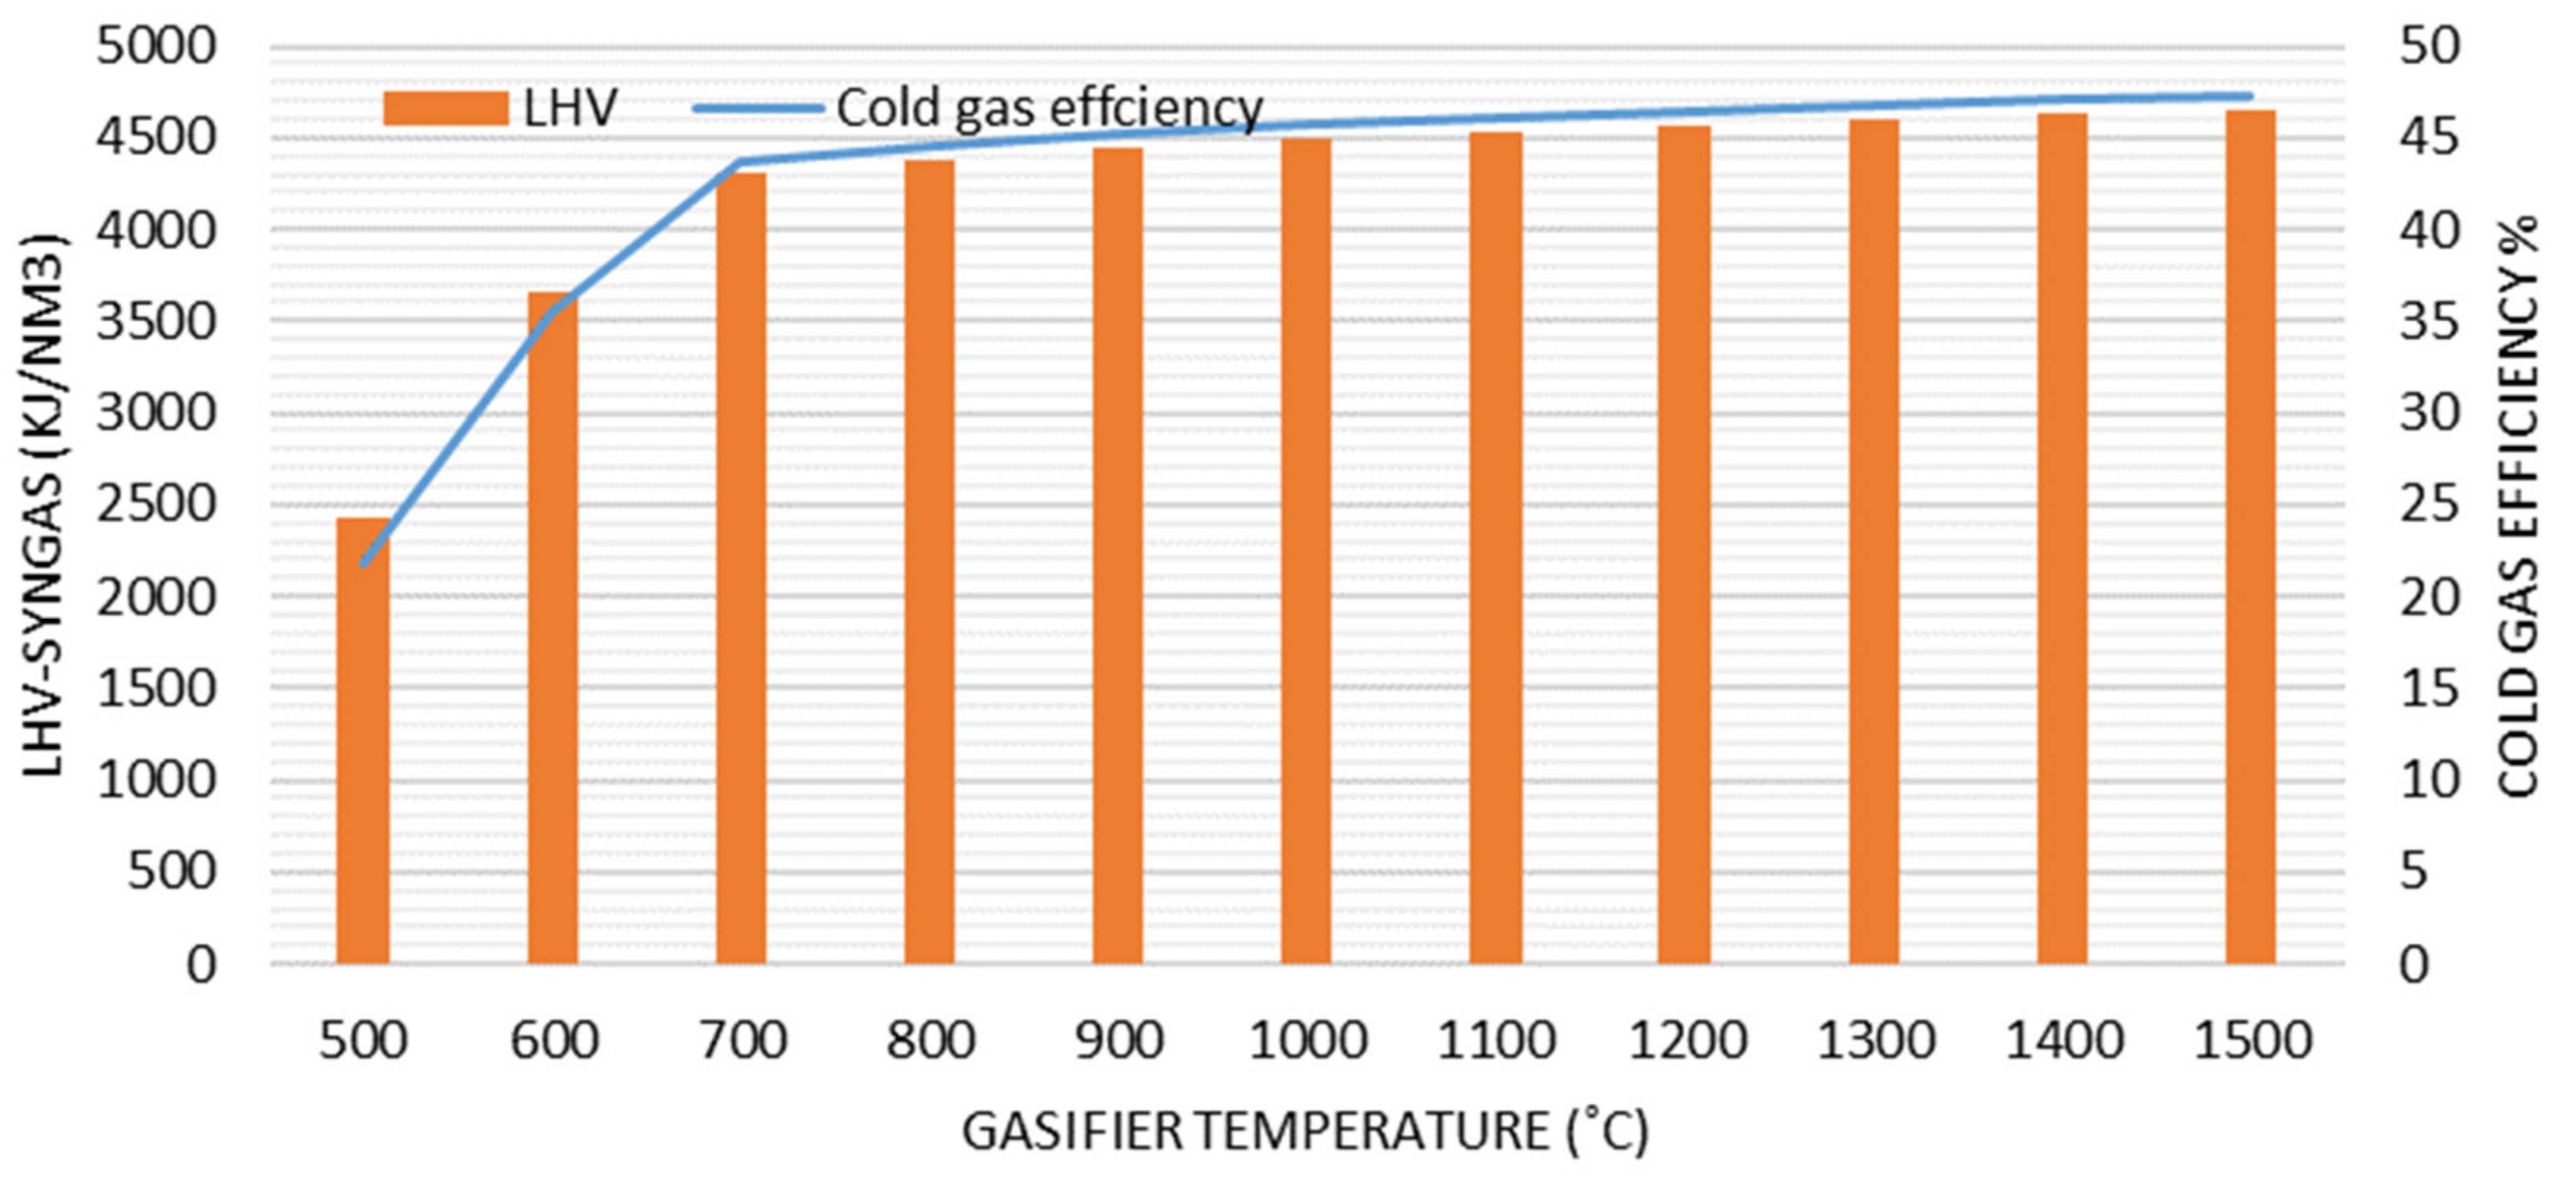
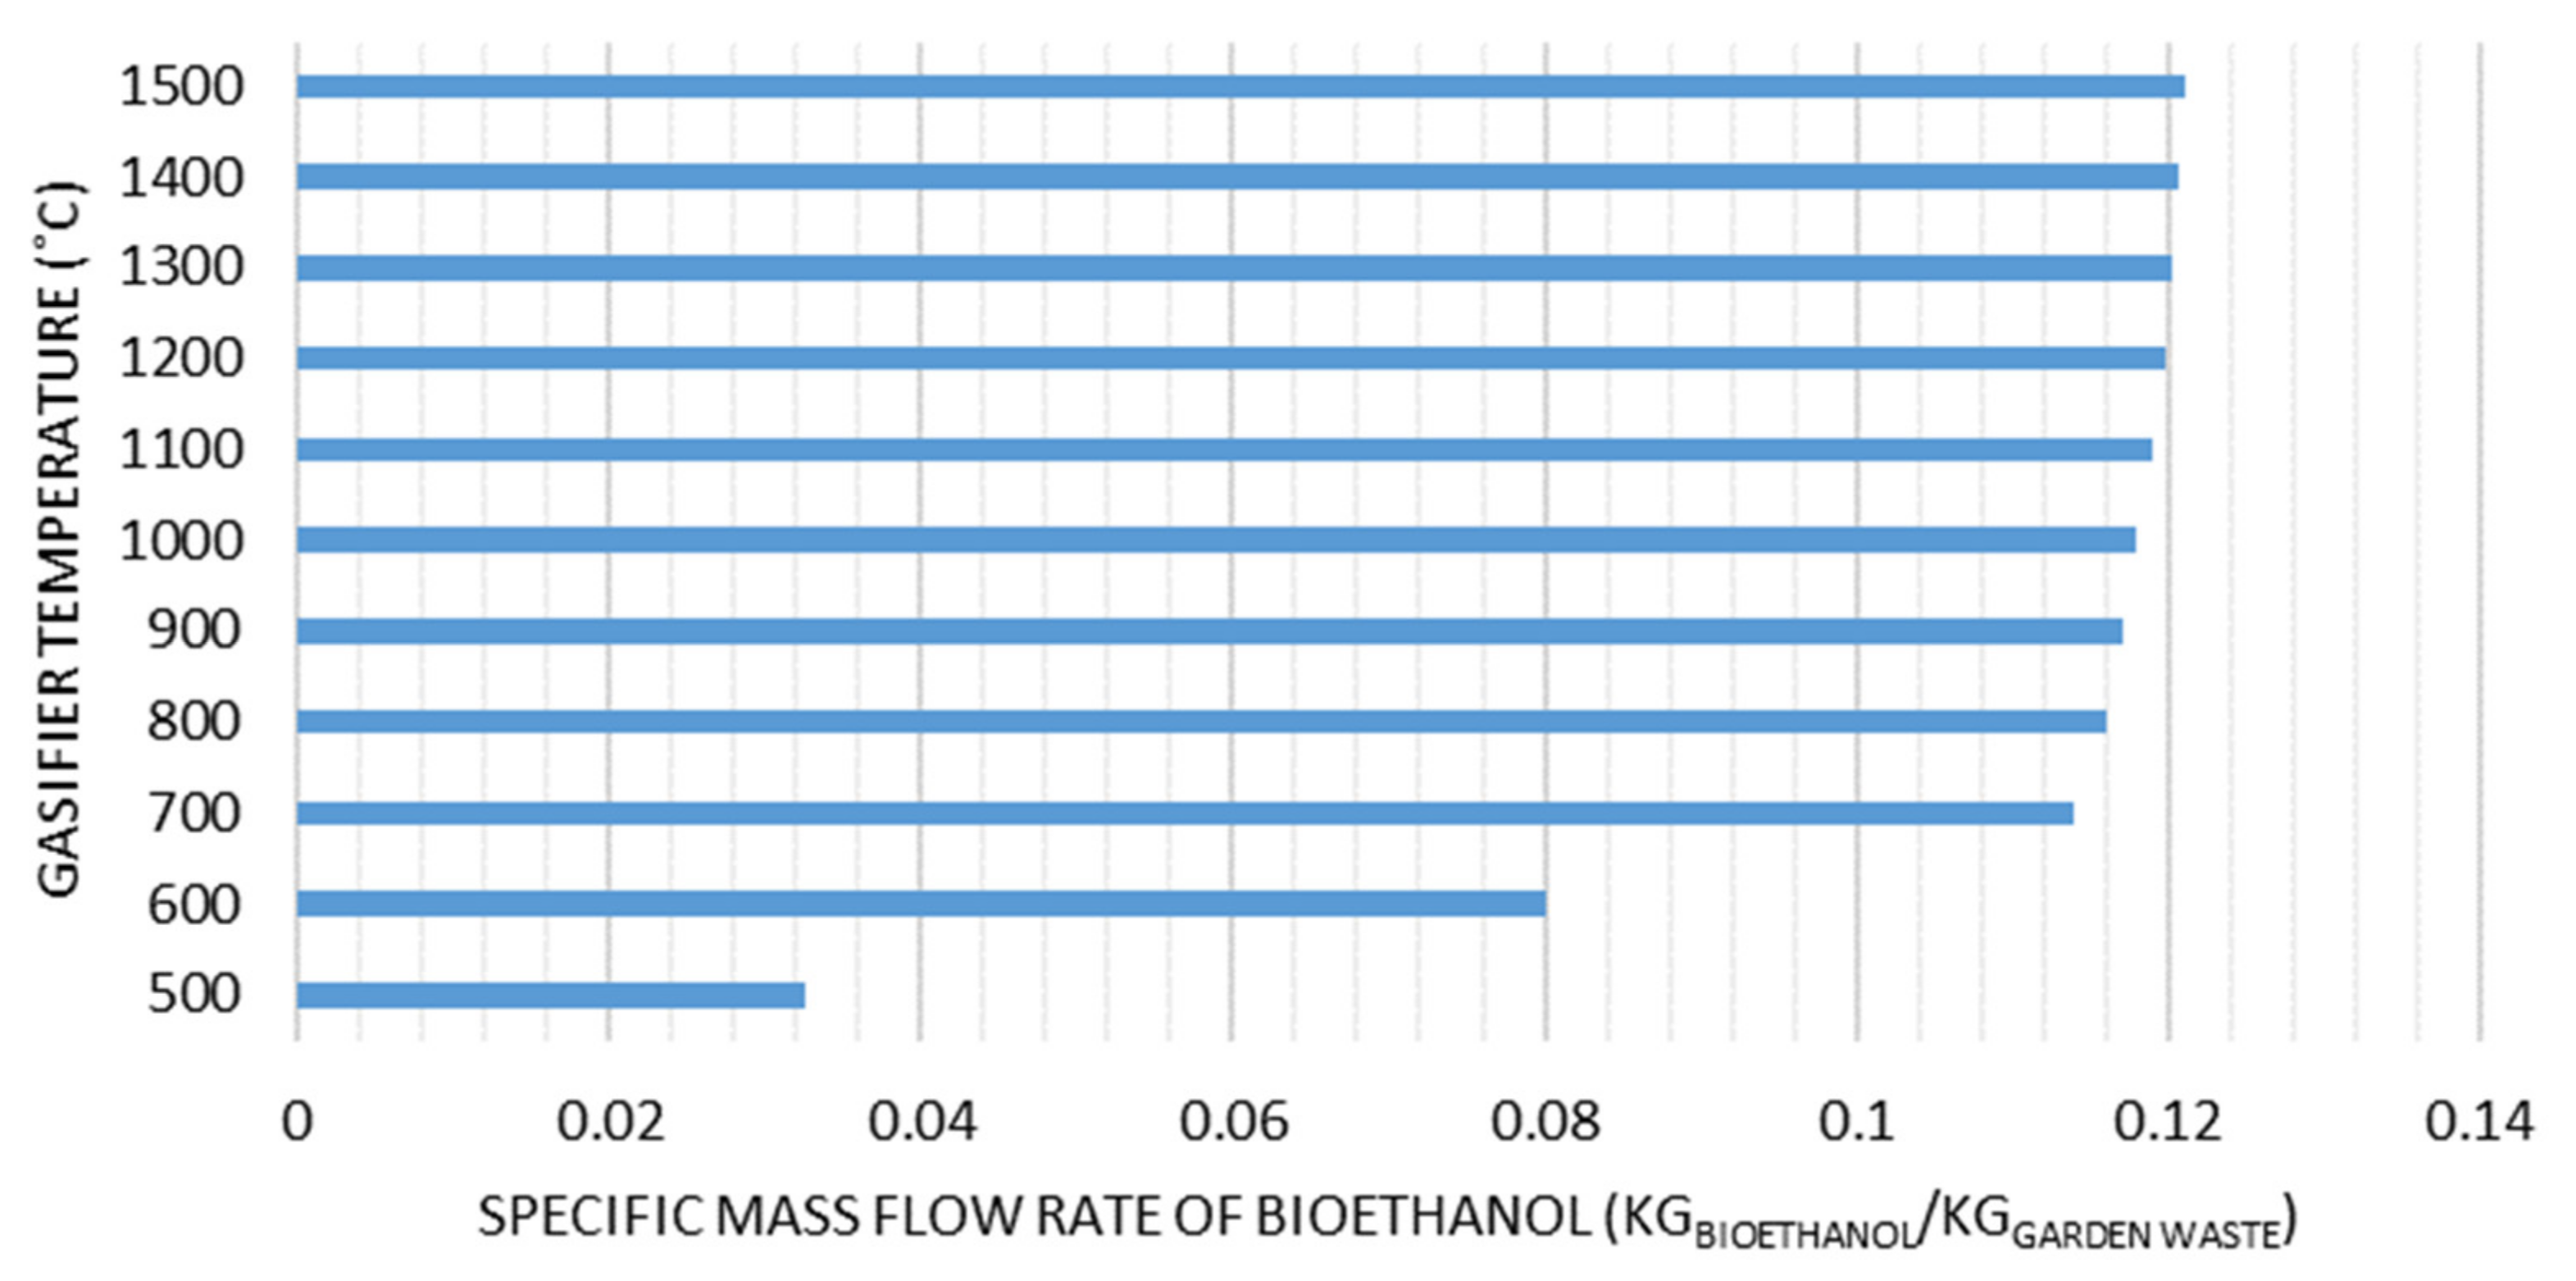
3.1. Effect of Temperature on Gasification Performance and Bioethanol Production

The effect of gasification temperature on the molar flow rates of syngas constituents was studied in the window of 500 to 1500 °C. While the equivalence ratio was set to 0.372, moisture content was reduced from 50% to 5%, and the biomass feeding rate was 1000 kg/h. Figure 3 shows the variation in molar flow rate of syngas and its composition with increasing temperature. As the gasifier temperature increased, H2 and CO flow rates also increased. However, CO2 and CH4 flow rates decreased with the increase in the temperature. The growth of CO and H2 flow rates in the range of 500 to 700 °C was because of the combined effect of Boudouard, steam methane reforming, and the water-gas reaction. These are endothermic reactions in nature; hence, they are favored with higher temperature. Moreover, reduction in CO2 and CH4 flow rates with increasing temperature was due to the exothermic nature of water-gas shift and methanation reactions, making them unfavorable at higher temperatures. Obviously, H2 flow rate lessened after 700 °C, which can be attributed to the combined effect of all reactions occurring in the reduction zone. At low temperatures, the water-gas shift reaction contributed to hydrogen production, but this reaction was hindered at high temperatures.
By increasing the gasification temperature, water-gas and steam methane reforming reactions contributed majorly to H2 production, but the steam methane reforming reaction was limited due to the absence of CH4 as the main reactant at a higher temperature. As a whole, it can be concluded that the water-gas shift reaction mainly controls H2 production. In addition, the reduction in CO2 flow rate by increasing the temperature can be associated with the Boudouard reaction which utilizes CO2 to produce CO; as it is endothermic in nature, it is favored at higher temperatures. Methane is also produced through the methanation reaction, which is an exothermic reaction that is favored at lower temperatures. Thus, a decrease in CH4 flow rate was observed when the temperature was increased.
Figure 4 shows the variation in LHV of syngas and cold gas efficiency (CGE) with increasing gasification temperature. Cold gas efficiency and LHV firstly increased abruptly from 21.7% and 2.42 MJ/N·m3 at 500 °C to 43.7% and 4.30 MJ/N·m3 at 700 °C, before becoming almost constant. According to Equation (5), the LHV of syngas is a function of H2, CO, and CH4 molar fractions; thus, it increased until 700 °C because of the increase in H2, CO, and CH4 concentrations. After 700 °C, LHV did not show so much variation due to the decrease in H2 concentration and slight increase in CO concentration. Cold gas efficiency also followed the LHV trend as it is the most influential parameter on the CGE of the gasifier (based on Equation (6)).
The effect of the gasifier temperature on the specific mass flow rate of bioethanol production is illustrated on Figure 5. The mass flow rate of garden waste entering the system was fixed at 1000 kg/h and it was reduced to 526 kg/h upon passing through the drying process (its moisture content was reduced to 5%). However, as the gasifier temperature was increased, the syngas production also increased until 700 °C, before becoming approximately constant. Bioethanol production also followed this trend since the fermentation part is affected mainly by the input of syngas to its process. Figure 5 shows that the process yielded 32 kg/h ethanol production from 1000 kg/h wet garden waste (with 50% moisture content) at 500 °C before increasing to 114 kg/h at 700 °C. However, the specific mass flow rate of the produced bioethanol from dry garden waste would be 0.062–0.217 kgbioethanol/kggarden waste in the window of 500–700 °C. This means that 217 kg/h ethanol can be produced from 1000 kg/h dry garden waste. Impressively, moisture content indirectly affects the process yield. Increasing moisture content strongly degrades the syngas production. Because of the much higher moisture content in the fuel, the percentage of carbon and hydrogen on a wet basis decreases, thereby leading to a lower production of syngas composition and, finally, a lower production of ethanol.

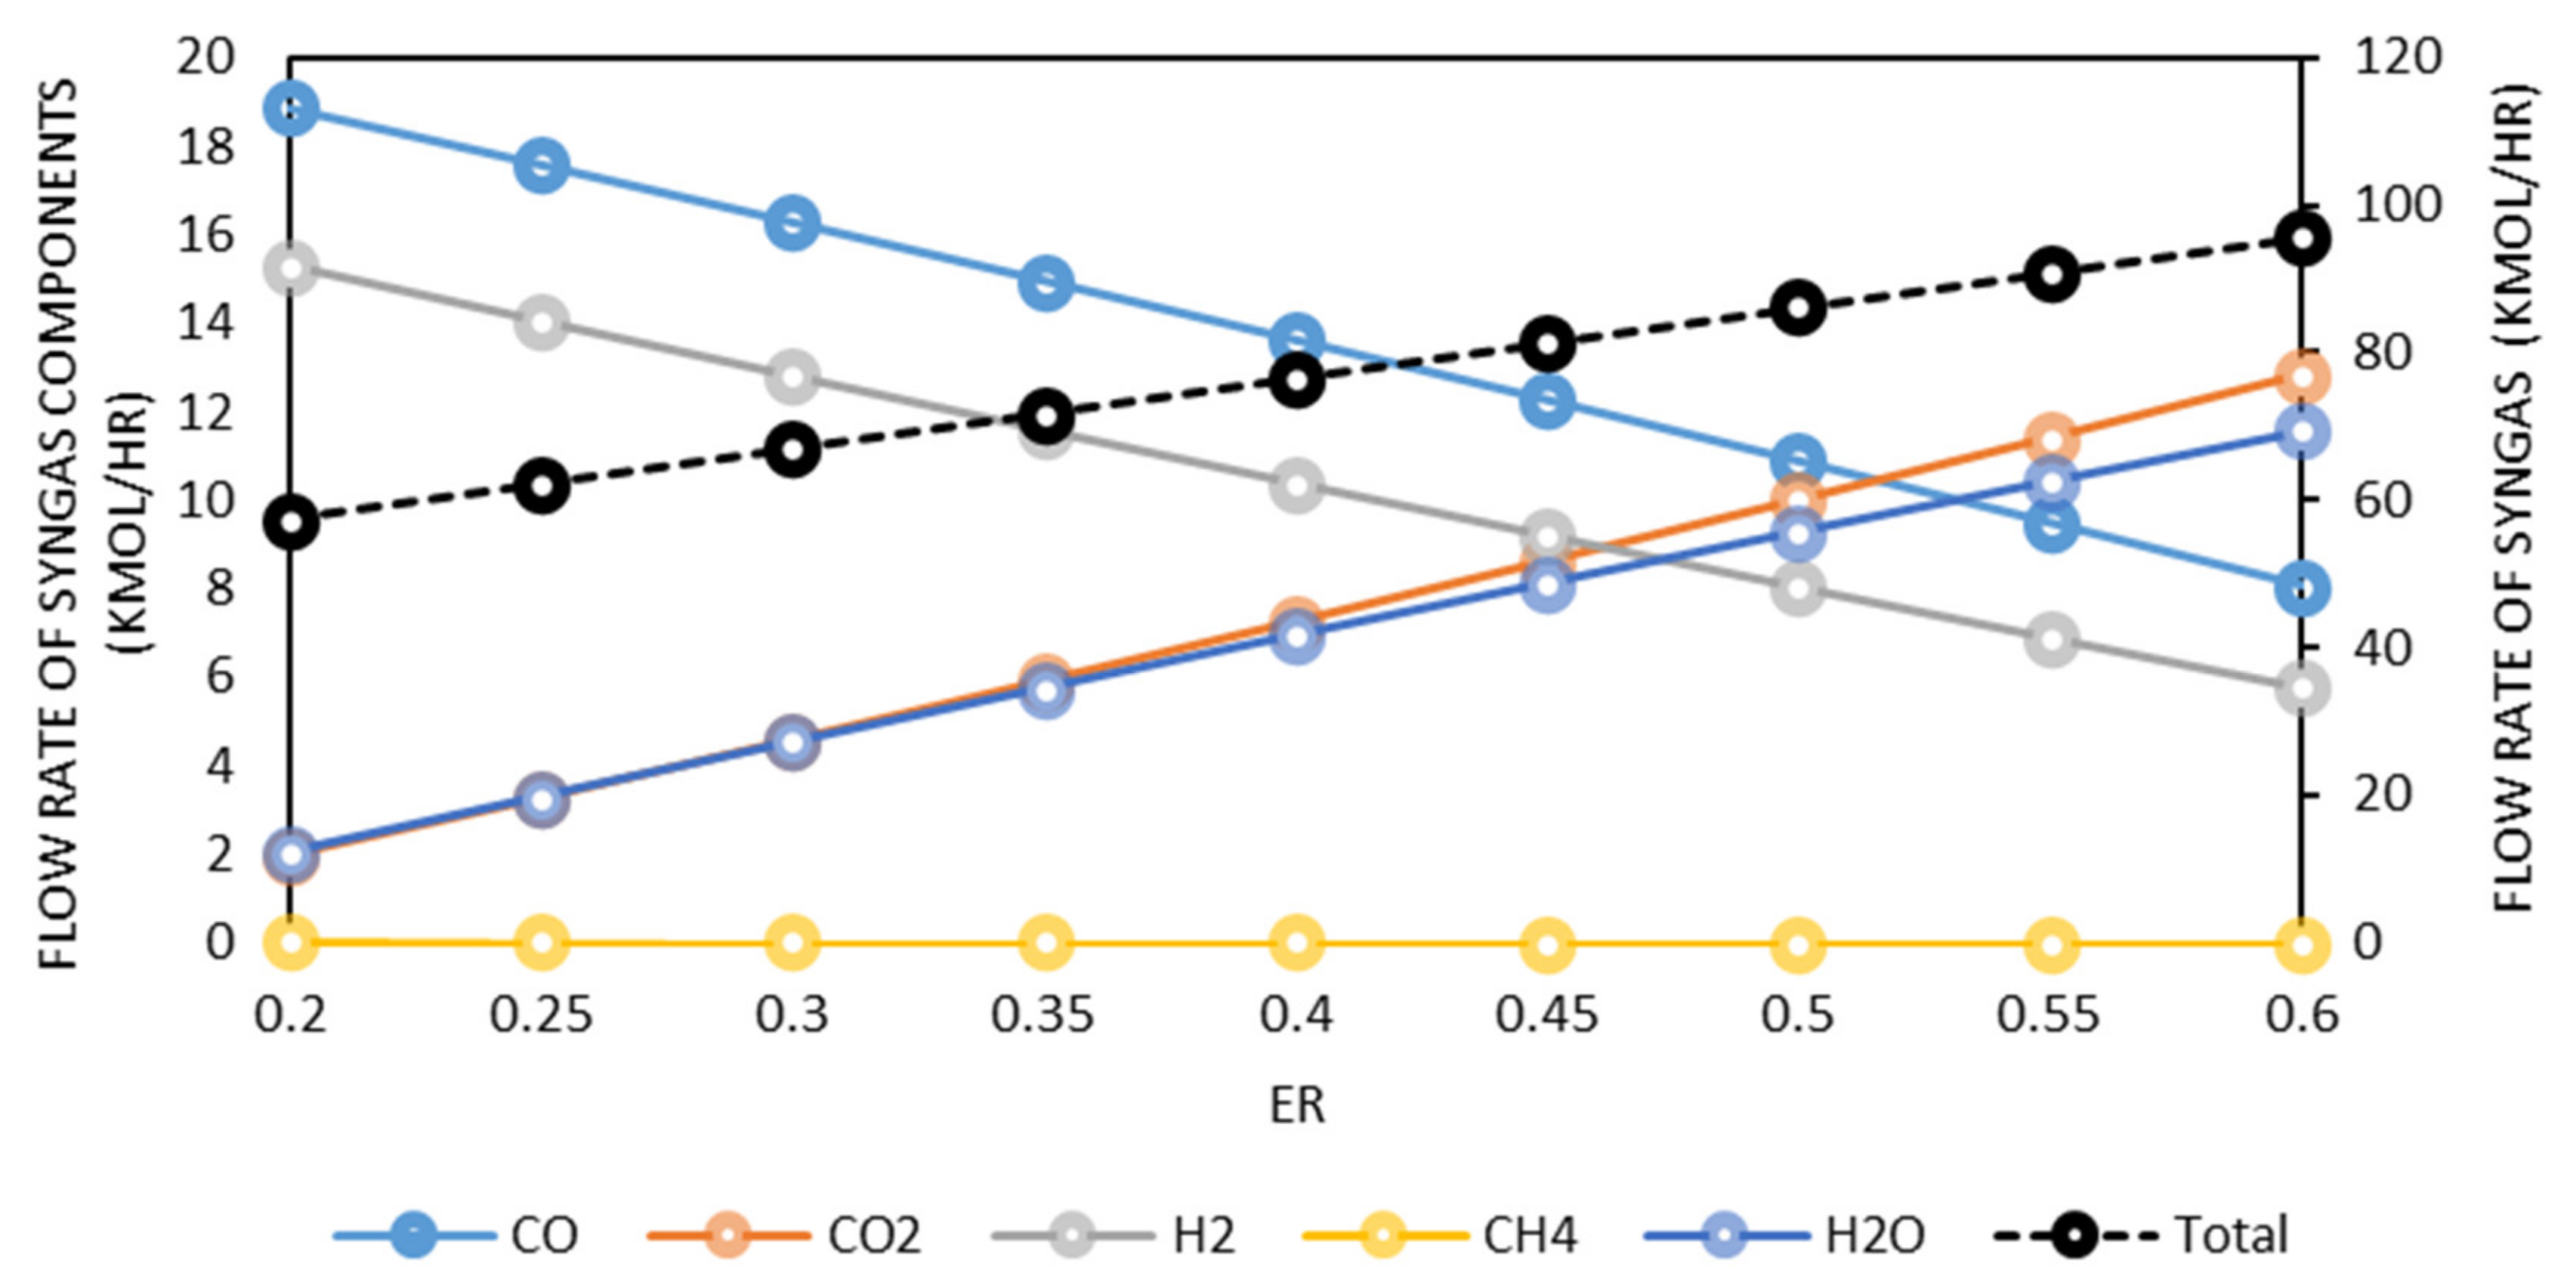
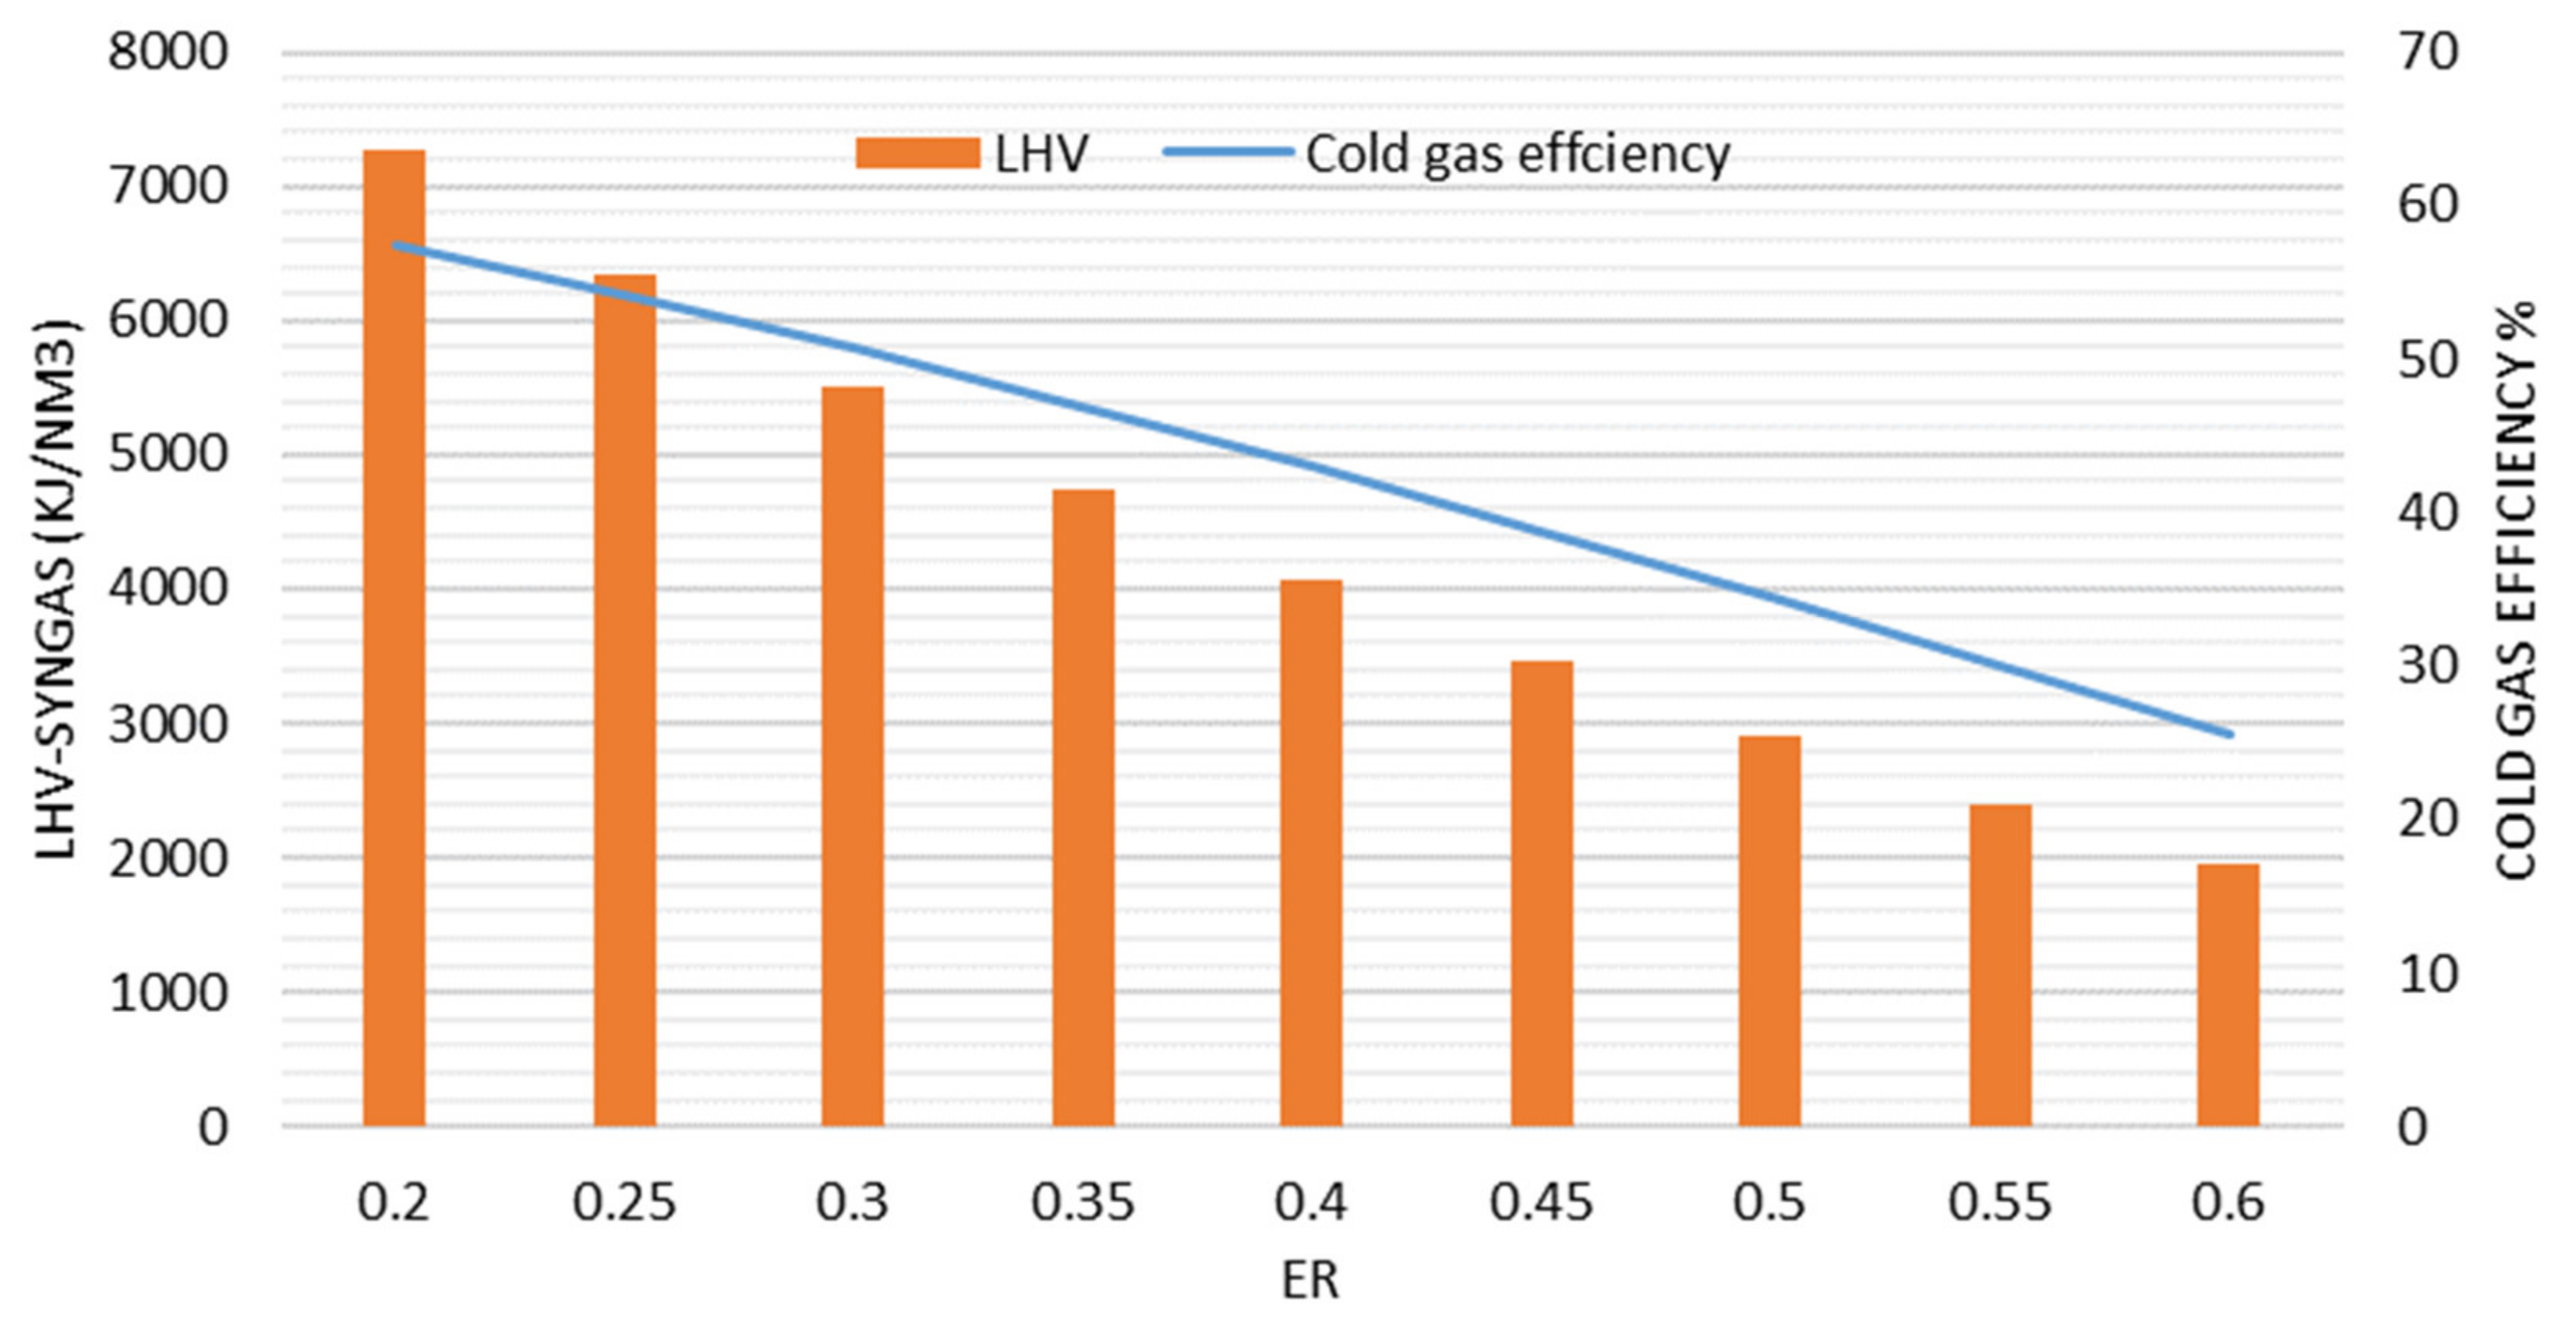
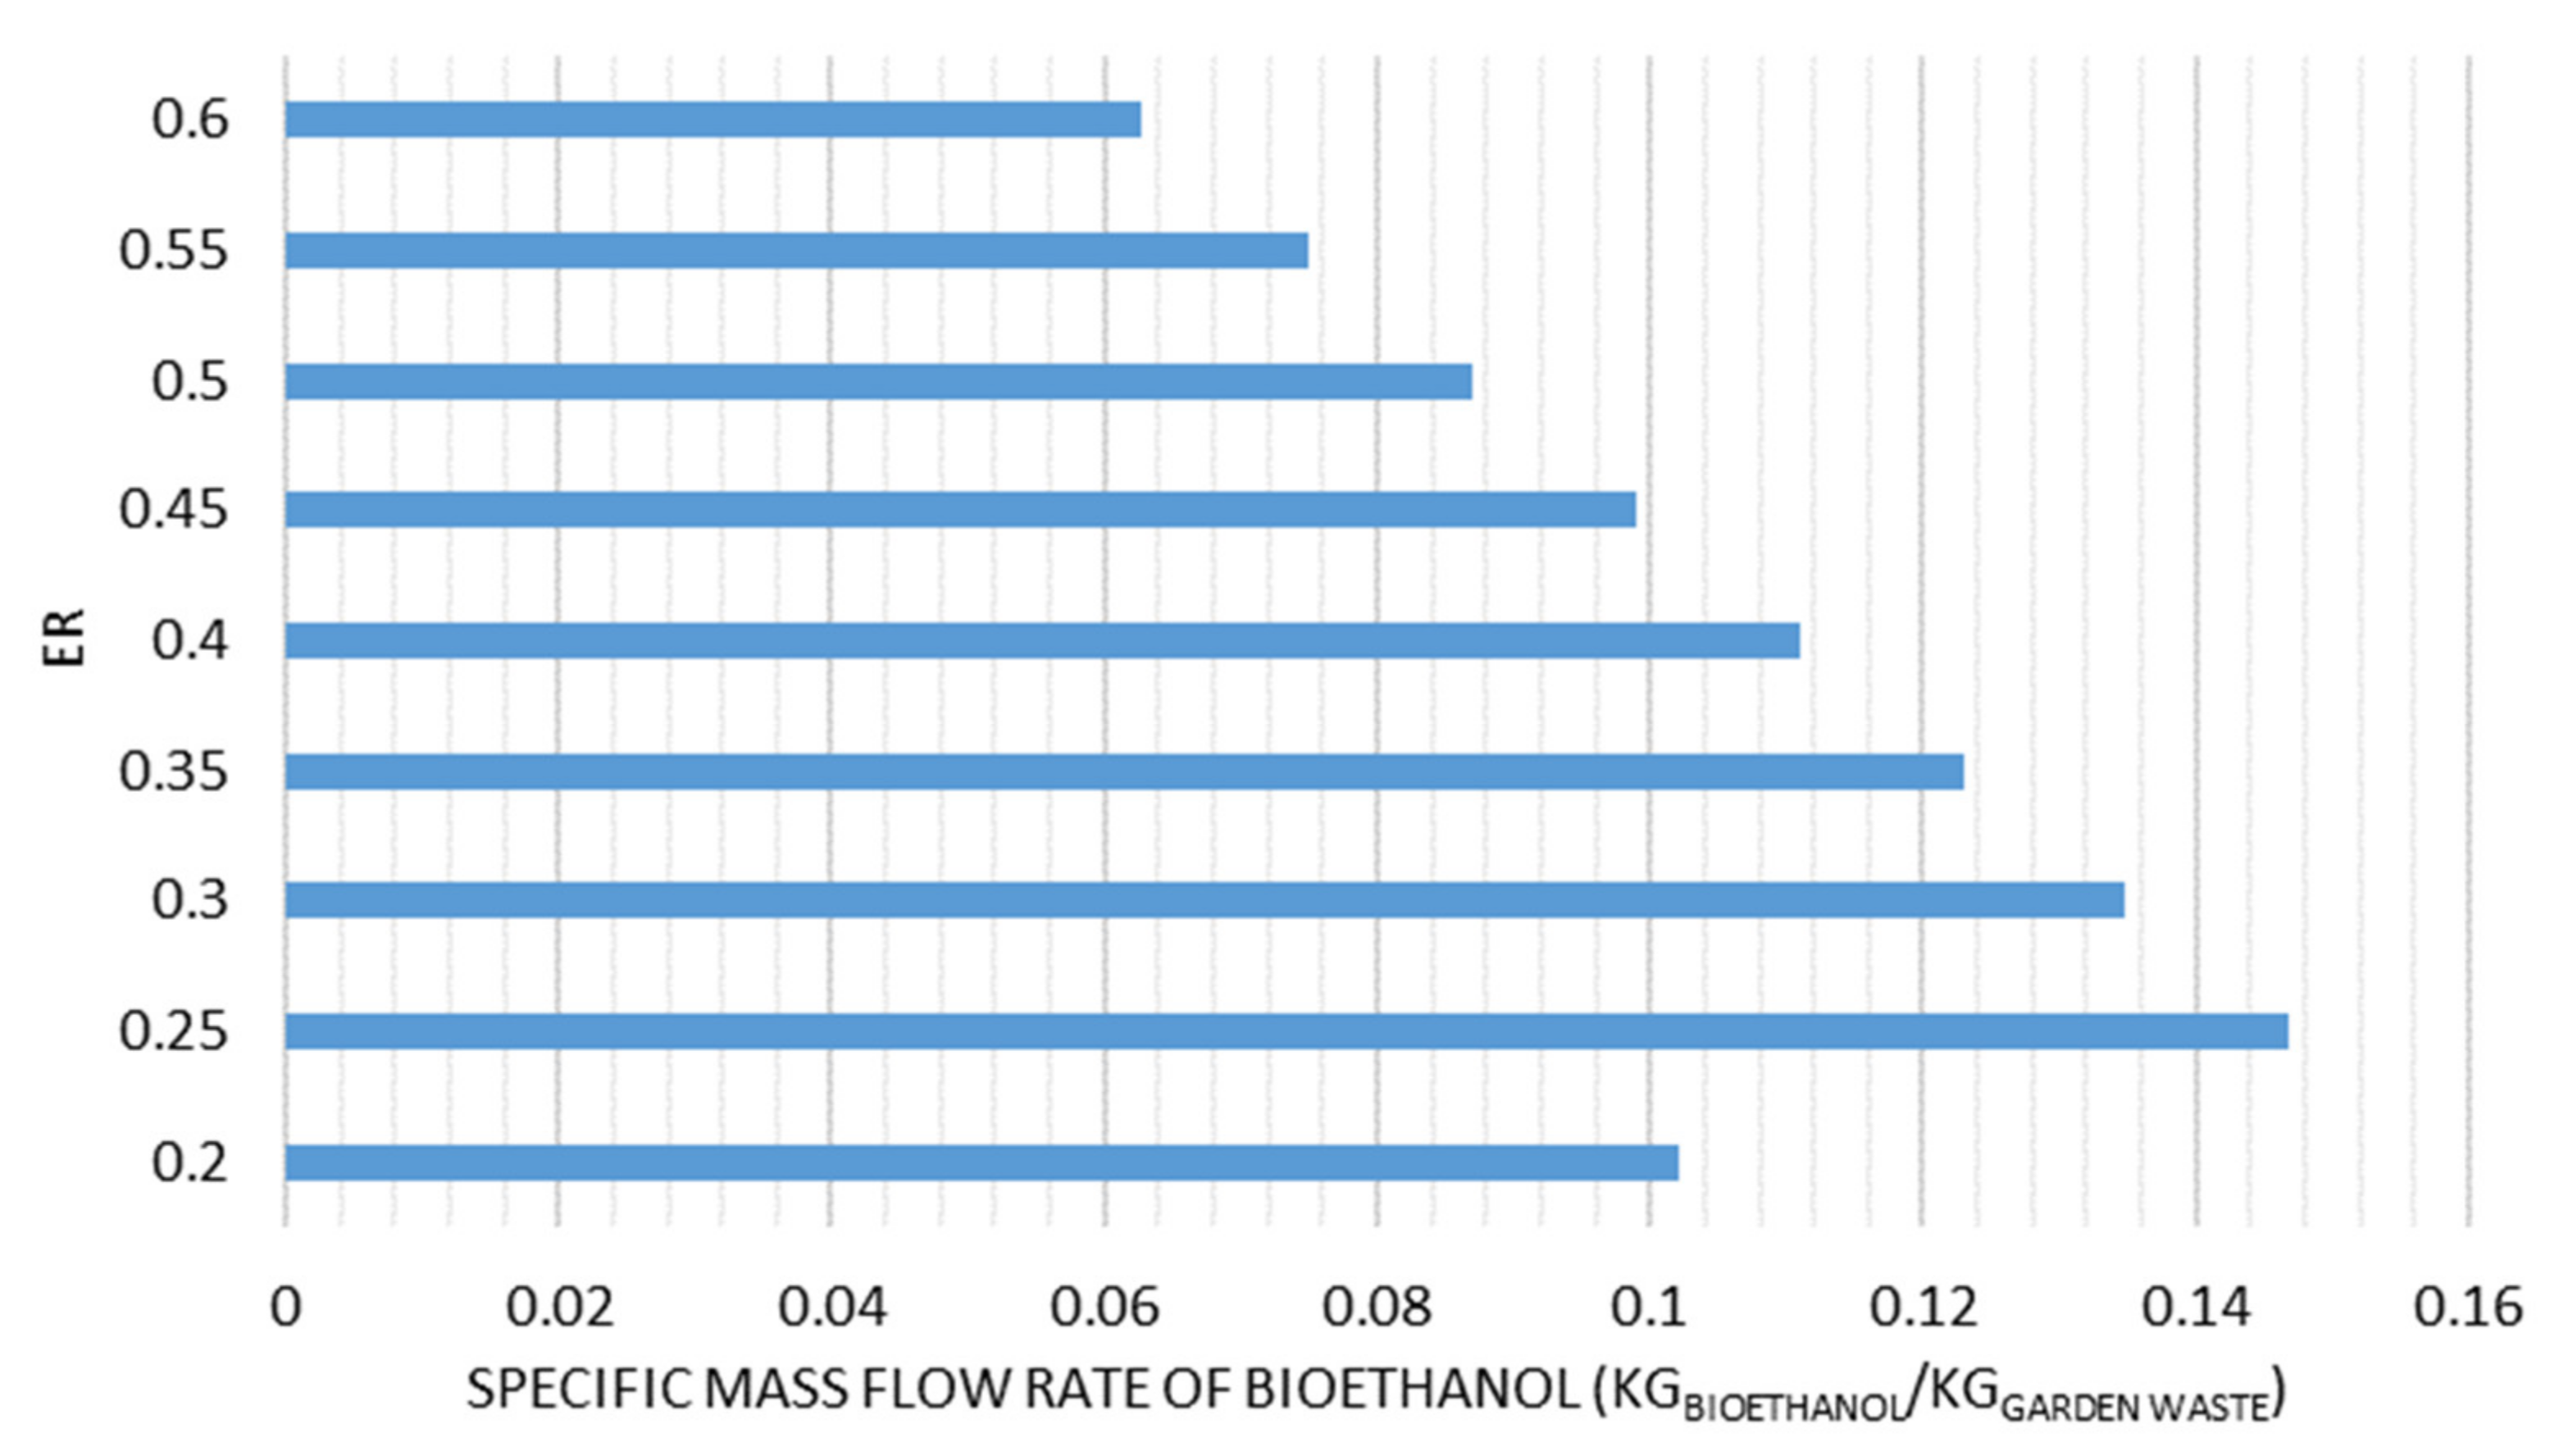
3.2. Effect of ER on Gasification Performance and Bioethanol Production

The equivalence ratio (ER) is a significant indicator showing the role of an oxidizing agent and it is defined as the ratio of the amount of actual air supplied to the gasifier to the stoichiometric air. In this section, the effect of ER on the molar flow rates of syngas constituents and gasification performance was investigated by varying it in the span of 0.2 to 0.6. Gasification temperature (900 °C), moisture content (50%), and biomass feeding rate (1000 kg/h) remained constant. It can be seen in Figure 6 that H2 and CO flow rates decreased with an increase in ER, while CO2 and CH4 flow rates increased with an increase in ER. ER increased upon increasing the air supply in the oxidation zone. Increased oxygen supply enhances the carbon and hydrogen oxidation reaction. These two reactions utilize carbon and hydrogen to produce CO2 and H2O. CH4 production was very low because reactants of the methanation reaction were consumed in the hydrogen and carbon oxidation reactions.
The effect of ER on the LHV of syngas and cold gas efficiency is shown in Figure 7. It can be observed that the LHV of syngas decreased from 7.28 MJ/N·m3 at ER = 0.2 to 1.94 MJ/N·m3 at ER = 0.6. This can be explained by the fact that, upon increasing ER, the production of CO and H2 in syngas decreased due to the complete combustion of fuel, thus leading to a decrease in the heating value of the syngas. Cold gas efficiency also reduced, stemming from the reduction of the LHV. Its value of 54.2% at ER = 0.2 decreased to 25.6% at ER = 0.6.
Figure 8 depicts the effect of the equivalence ratio on the specific mass flow rate of bioethanol production from garden waste. As can be seen, the flow rate of bioethanol firstly increased and then decreased with an increase in ER. This may be because, at low ER, biomass reactions approach pyrolysis, while, at high ER, the excess amount of oxygen gradually oxidizes the fuel completely and causes biomass combustion; then, the production of CO and H2 as the main syngas contents declines. Hence, it is important to find the appropriate range of ER for biomass gasification integrated with ethanol production, as studied in this work. As shown in Figure 8, the optimum ER lies between 0.2 and 0.4 (particularly 0.25), where the specific mass flow rate of bioethanol is higher than 0.1 kgbioethanol/kggarden waste.

4. Conclusions

In this work, the integration of gasification, syngas fermentation, and product purification units for ethanol production from garden waste as a model lignocellulosic biomass was modeled using the ASPEN Plus simulator. Parametric analysis was performed by varying gasification temperature from 500 to 1500 °C and equivalence ratio from 0.2 to 0.6, before determining the effect on gasification performance and bioethanol production.
The main results are as follows:
  • The maximum value of cold gas efficiency (44.5%) could be achieved around 800 °C, while the lower heating value at this temperature was 4.38 MJ/N·m3. The main reaction controlling the H2 yield is the water-gas reaction because of its endothermic nature.
  • CGE and LHV reached the maximum values of 54.2% and 7.28 MJ/N·m3, respectively, at ER = 0.2. These parameters continued to decrease with an increase in ER.
  • It is evident that, for efficient gasification and high ethanol yield, the operating temperature range of the reduction zone should be 700–1000 °C, along with an equivalence ratio between 0.2 and 0.4.
  • At 700 °C, the bioethanol production yield was 0.114 kg/h per 1 kg/h input garden waste with 50% moisture content. However, under dry-based conditions, this parameter increased to 0.217 kgbioethanol/kggarden waste. Consequently, increasing moisture content strongly degrades the system yield.

Author Contributions

S.S.: Conceptualization, Formal analysis, Investigation, Methodology, Validation, Writing—original draft. C.R.: Software, Supervision. R.U.: Supervision, Writing—review & editing. All authors have read and agreed to the published version of the manuscript.

Funding

This research was funded by the Icelandic Research Fund (IRF) (in Icelandic: Rannsoknasjodur) and the grant number is 196458-051.

Conflicts of Interest

The authors declare no conflicts of interest.

References

  1. Safarian, S.; Khodaparast, P.; Kateb, M. Modeling and technical-economic optimization of electricity supply network by three photovoltaic systems. J. Sol. Energy Eng. 2014, 136, 024501. [Google Scholar] [CrossRef]
  2. Rajaeifar, M.A.; Akram, A.; Ghobadian, B.; Rafiee, S.; Heijungs, R.; Tabatabaei, M. Environmental impact assessment of olive pomace oil biodiesel production and consumption: A comparative lifecycle assessment. Energy 2016, 106, 87–102. [Google Scholar] [CrossRef]
  3. Talebnia, F.; Karakashev, D.; Angelidaki, I. Production of bioethanol from wheat straw: An overview on pretreatment, hydrolysis and fermentation. Bioresour. Technol. 2010, 101, 4744–4753. [Google Scholar] [CrossRef] [PubMed]
  4. Safarian, S.; Unnthorsson, R.; Richter, C. Techno-economic analysis of power production by using waste biomass gasification. J. Power Energy Eng. 2020, 8, 1. [Google Scholar] [CrossRef]
  5. Safarian, S.; Sattari, S.; Hamidzadeh, Z. Sustainability assessment of biodiesel supply chain from various biomasses and conversion technologies. Biophys. Econ. Resour. Qual. 2018, 3, 6. [Google Scholar] [CrossRef]
  6. Safarian, S.; Sattari, S.; Unnthorsson, R.; Hamidzadeh, Z. Prioritization of bioethanol production systems from agricultural and waste agricultural biomass using multi-criteria decision making. Biophys. Econ. Resour. Qual. 2019, 4, 4. [Google Scholar] [CrossRef]
  7. Safarian, S.; Unnthorsson, R. An assessment of the sustainability of lignocellulosic bioethanol production from wastes in iceland. Energies 2018, 11, 1493. [Google Scholar] [CrossRef] [Green Version]
  8. Safarian, S.; Unnþórsson, R.; Richter, C. A review of biomass gasification modelling. Renew. Sustain. Energy Rev. 2019, 110, 378–391. [Google Scholar] [CrossRef]
  9. Datta, B. Socio-economic, environmental, and policy perspectives of advanced biodiesel production. In Advances in Biodiesel Production; Woodhead Publishing: Cambridge, UK, 2012; pp. 32–68. [Google Scholar]
  10. Liguori, R.; Soccol, C.R.; Porto de Souza Vandenberghe, L.; Woiciechowski, A.L.; Faraco, V. Second generation ethanol production from brewers’ spent grain. Energies 2015, 8, 2575–2586. [Google Scholar] [CrossRef] [Green Version]
  11. Mu, D.; Seager, T.; Rao, P.S.; Zhao, F. Comparative life cycle assessment of lignocellulosic ethanol production: Biochemical versus thermochemical conversion. Environ. Manag. 2010, 46, 565–578. [Google Scholar] [CrossRef]
  12. Pardo-Planas, O.; Atiyeh, H.K.; Phillips, J.R.; Aichele, C.P.; Mohammad, S. Process simulation of ethanol production from biomass gasification and syngas fermentation. Bioresour. Technol. 2017, 245, 925–932. [Google Scholar] [CrossRef] [PubMed]
  13. Safarianbana, S.; Unnthorsson, R.; Richter, C. Development of a new stoichiometric equilibrium-based model for wood chips and mixed paper wastes gasification by aspen plus. In ASME International Mechanical Engineering Congress and Exposition; American Society of Mechanical Engineers, Calvin L. Rampton Salt Palace Convention Center: Salt Lake City, UT, USA, 2019. [Google Scholar]
  14. Safarian, S.; Unnthorsson, R.; Richter, C. Techno-economic and environmental assessment of power supply chain by using waste biomass gasification in iceland. Biophys. Econ. Sustain. 2020, 5, 7. [Google Scholar]
  15. Safarian, S.; Richter, C.; Unnthorsson, R. Waste biomass gasification simulation using aspen plus: Performance evaluation of wood chips, sawdust and mixed paper wastes. J. Power Energy Eng. 2019, 7, 12–30. [Google Scholar] [CrossRef] [Green Version]
  16. Ray, R.C.; Ramachandran, S. Bioethanol Production from Food Crops: Sustainable Sources, Interventions, and Challenges; Academic Press: London, UK, 2018. [Google Scholar]
  17. Safarian, S.; Bararzadeh, M. Exergy analysis of high-performance cycles for gas turbine with air-bottoming. J. Mech. Eng. Res. 2012, 5, 38–49. [Google Scholar]
  18. Safarian, S.; Unnthorsson, R.; Richter, C. Performance analysis and environmental assessment of small-scale waste biomass gasification integrated chp in iceland. Energy 2020, 197, 117268. [Google Scholar] [CrossRef]
  19. Safarian, S.; Unnthorsson, R.; Richter, C. Simulation of small-scale waste biomass gasification integrated power production: A comparative performance analysis for timber and wood waste. Int. J. Appl. Power Eng. 2020, 9, 147–152. [Google Scholar]
  20. Williams, P.T. Waste Treatment and Disposal; John Wiley & Sons: Chichester, UK, 2005. [Google Scholar]
  21. Damartzis, T.; Michailos, S.; Zabaniotou, A. Energetic assessment of a combined heat and power integrated biomass gasification–internal combustion engine system by using aspen plus®. Fuel Process. Technol. 2012, 95, 37–44. [Google Scholar] [CrossRef]
  22. Tauqir, W.; Zubair, M.; Nazir, H. Parametric analysis of a steady state equilibrium-based biomass gasification model for syngas and biochar production and heat generation. Energy Convers. Manag. 2019, 199, 111954. [Google Scholar] [CrossRef]
  23. Safarian, S.; Unnthorsson, R.; Richter, C. The equivalence of stoichiometric and non-stoichiometric methods for modeling gasification and other reaction equilibria. Renew. Sustain. Energy Rev. 2020, 131, 109982. [Google Scholar] [CrossRef]
  24. Teo, W.K.; Ruthven, D.M. Adsorption of water from aqueous ethanol using 3-. Ang. molecular sieves. Ind. Eng. Chem. Process Des. Dev. 1986, 25, 17–21. [Google Scholar] [CrossRef]
  25. Kuo, P.-C.; Wu, W.; Chen, W.-H. Gasification performances of raw and torrefied biomass in a downdraft fixed bed gasifier using thermodynamic analysis. Fuel 2014, 117, 1231–1241. [Google Scholar] [CrossRef]
  26. Lv, P.; Xiong, Z.; Chang, J.; Wu, C.; Chen, Y.; Zhu, J. An experimental study on biomass air–steam gasification in a fluidized bed. Bioresour. Technol. 2004, 95, 95–101. [Google Scholar] [CrossRef] [PubMed]
  27. Gai, C.; Dong, Y. Experimental study on non-woody biomass gasification in a downdraft gasifier. Int. J. Hydrog. Energy 2012, 37, 4935–4944. [Google Scholar] [CrossRef]
  28. Demirbaş, A. Calculation of higher heating values of biomass fuels. Fuel 1997, 76, 431–434. [Google Scholar] [CrossRef]
Figure 1. System boundaries, considered technologies, and associated inputs.
Fermentation 06 00068 g001
Figure 2. ASPEN Plus flow chart of the system.
Fermentation 06 00068 g002
Figure 3. Effect of gasification temperature on molar flow rates of syngas constituents.
Fermentation 06 00068 g003
Figure 4. Effect of gasification temperature on syngas lower heating value (LHV) and cold gas efficiency (CGE).
Fermentation 06 00068 g004
Figure 5. Effect of gasification temperature on specific mass flow rate of bioethanol production.
Fermentation 06 00068 g005
Figure 6. Effect of equivalence ratio (ER) on molar flow rates of syngas constituents.
Fermentation 06 00068 g006
Figure 7. Effect of ER on syngas LHV and cold gas efficiency.
Fermentation 06 00068 g007
Figure 8. Effect of ER on the specific mass flow rate of bioethanol production.
Fermentation 06 00068 g008
Table 1. The main gasification reactions [8].
Heterogeneous reactions
C + O 2 C O 2 394 k J m o l Complete combustionR1
C + 0.5 O 2 C O 111 k J m o l Partial combustionR2
C + C O 2 2 C O + 172 k J m o l BoudouardR3
C + H 2 O C O + H 2 + 131 k J m o l Water-gasR4
C + 2 H 2 C H 4 75 k J m o l MethanationR5
Homogeneous reactions
C O + 0.5 O 2 C O 2 283 k J m o l CO partial combustionR6
H 2 + 0.5 O 2 H 2 O 242 k J m o l H2 combustionR7
C O + H 2 O C O 2 + H 2 41 k J m o l Water-gas shift (WGS)R8
C H 4 + H 2 O C O + 3 H 2 + 206 k J m o l ReformingR9
H2S and NH3 formation reactions
H 2 + S H 2 S H2S formationR10
3 H 2 + N 2 2 N H 3 NH3 formationR11
Table 2. Ultimate and proximate analysis of garden waste.
Garden Waste
Proximate analysis
Proximate analysis (wt.%)
Moisture50
Volatile matter (VM)84.5
Fixed carbon (FC)14.5
Ash1
Ultimate analysis
Elemental analysis (wt.% dry basis)
C50.12
H6.40
N0.14
Cl0
S0.08
O42.26

