1. Introduction
Disaster management has played a significant role in mitigating and minimising loss of life and damage to properties and infrastructure. Effective disaster management demands intelligent infrastructure for the collection, integration, management, and analysis of a variety of distributed data sources, including ground-based sensors, video streaming, and satellite imagery [
1]. The emergence of social networks and crowd-sourcing has enabled the application of human-centric approaches that allow the public to provide essential disaster-related information that can be used to enhance the effectiveness of disaster management in reducing the impact of natural disasters. Social media data contain rich information about human activities, environmental conditions, and public sentiment, which geographic information scientists, computer scientists, and domain scientists can use for data analysis [
2,
3,
4]. Social media not only generates massive volumes of data, but also a wide variety of data types, such as text, images, and videos. In 2020, there were 3.5 billion social media users worldwide, equivalent to about 45% of the world’s population [
5]. Facebook had over 2.6 billion monthly active users (MAUs) and 1.73 billion daily active users as of March 31 2020. Twitter had 330 million MAUs and 145 million daily active users [
6] in 2019. A total of 500 million tweets are sent by Twitter users every day, equivalent to 5787 tweets per second [
7]. Moreover, there were 1 billion MAUs on Instagram as of June 2018, and 500 million daily active users updated their stories. The large number of posts generated by these active users exemplifies the variety of dimensions of social media data. For instance, Twitter data are comprised of several types of information, including account IDs, timestamps, user tweets (e.g., texts, images, videos), coordinates, retweets, and so forth. The volume, velocity, and variety of data thus make it increasingly difficult for disaster managers to extract relevant and timely information from such data.
A comprehensive taxonomical framework is presented in this article to effectively explore, assess, contrast, and compare existing approaches that use social media data for disaster management. Previous surveys in this subject area have mostly focused on specific aspects; hence, they appear to be narrow and fragmented. Topics include: (i) digital volunteerism [
8]; (ii) disaster management lifecycle [
9], including Warning, Impact, Response, and Relief; and (iii) disaster response ([
10,
11]). They consider aspects such as space, time, content, and network reach. Although the above-mentioned papers classified the literature based on taxonomies that covered aspects related to the effects of emergency occurrences on social media, social media data gathering and processing, and social media’s effect on post-disaster management, they are limited in scope, with only a “broad” significance. In contrast, we present a holistic and comprehensive taxonomical framework. We propose a taxonomy that is much more exhaustive, with additional (sub-)dimensions that contribute to an “in-depth” understanding of end-to-end challenges (e.g., data source, application, methodology, information dimension, and language) related to managing social media data for detecting, predicting, and responding to natural disasters. To date, this level of investigation has received little attention, and this article aims to alleviate this gap. While the existing surveys mainly discuss the novel techniques used to analyse social media data, their proposed classifications cannot represent the overall perspectives for applying social media data in disaster management. Overall, this survey proposes a novel taxonomy designed for understanding all significant aspects of social media data management and analysis for disaster management challenges, ranging from data sources to social media applications. Our taxonomical framework’s main advantage is that it can provide the guidance of data management processes required in the context of using social media data for disaster management.
The focus of the work presented in this paper is on understanding how social media data contribute to disaster management. We do this by surveying the literature for methodologies for social media data management and analysis for disaster management. We classify social media data based on their sources, language, information dimension, methodologies for data management, analysis, evaluation, and applications. The aim of this work is to provide a useful classification that could potentially be used to improve decision-making by enabling disaster managers to identify the appropriate data sources and the corresponding methodologies for analysis and management.
The main contributions of this paper are as follows:
Identification of the research challenges involved in using social media data for disaster management and the methodologies for data analysis and management;
A research taxonomy for analysis and management of social media data;
Application of the proposed taxonomy to survey the existing literature on data analysis and management.
The rest of this paper is structured as follows: The background and motivation for this work are presented in
Section 2, followed by the details of the survey method in
Section 3. Classification details are presented in
Section 4, including a categorisation of the data sources, language analysis, and identification of types of users. The languages presented in social media data that are used for social media data analysis are discussed in
Section 5. In
Section 6, the approaches to social media’s inclusion of spatial and temporal information are discussed. The methodologies for social media data management and the application of these data in disaster management are discussed in
Section 7 and
Section 8, respectively, before concluding the paper in
Section 9.
2. Background
During natural disasters, social media can play an essential role in the emergency response and provide a complete picture of situational awareness during and after the disaster. There are several challenges in acquiring and extracting hazard-related information from social media, including volume, unstructured data sources, signal-to-noise ratio, ungrammatical and multilingual data, and fraudulent message identification and removal. The massive amounts and variety of data generated by social media lead to different levels of information being extracted from the social media data. For instance, geographical information (geo-tagging) attached to a tweet about a roadblock on a hilly road provides more useful contextual information than a similar tweet without geo-tagging. Similarly, a tweet with attached images could potentially provide more situational awareness. For example, a tweet with photos of a roadblock on a hilly road can help people who are driving on the road nearby to understand the current situation of the roadblock and change to a new route away from the blocked area.
Due to the volume and complexity in such large amounts of social media data, it is crucial to have tools and systems that can automatically classify and extract information, which could turn data into meaningful, actionable information for those attempting to manage the situation. This information has to be systematically managed and made available upon request and to be queried based on different query conditions. The main dimensions of a query include the geo-location/geo-fence, keywords and their disambiguations, user type (e.g., government, non-governmental organisations (NGOs), news agencies, public, etc.), and type of message (e.g., warning, news, SOS, request for supplies, or general posts/tweets about an ongoing or impending situation). It is also important for the system to remove common false-positive patterns. For instance, the word “Landslide” in a tweet talking about a landslide victory of a sports team could potentially be classified as a tweet about a landslide hazard. To support this, the use of a tool such as an ontology can be applied to yield meaningful information from complex data. For instance, an ontology of landslides would represent the domain of landslide hazards through relevant terms and relationships between them. These relationships provide formal definitions to the domain terms, thereby enabling machines to understand and analyse them. Thus, the knowledge represented in an ontology enables machines to perform intelligent tasks, such as interactively communicating with social media users to extract contextual information related to an event of interest, identifying the relation of this information with the hazard of interest, and providing this to the decision-maker as a complete picture to enable informed decision-making.
An ontology-based approach is thus more sophisticated than traditional data management approaches, since it combines the data model with the associated domain knowledge that can be processed by machines to obtain semantically rich and meaningful information [
12]. Systematic extraction of important information and semantic meaning from the free text in social media will help make the systems intelligent enough to organise and present data in an actionable form. Similarly, natural language processing (NLP) is an important technology for understanding and extracting information from user-generated text content. We reviewed several natural language processing methods and case studies [
13,
14,
15].
In this survey, the applications described above, including ontological support, NLP, and data mining, are reviewed in the context of social media and natural hazard response and recovery.
3. Materials and Methods
In this section, we present a taxonomy of the existing research on social media data management and the procedure for selecting the publications discussed in this paper.
3.1. Scope
Social media data provide a rich footprint of real-world events that can be used to facilitate the management of disasters. Several research works have proposed methods for exploiting social media data for the efficient management of disasters. The scope of our survey is determined by the common issues discussed in existing research works. Based on these issues, we have developed a taxonomy of social media data management and analysis for disaster management.
Figure 1 depicts the taxonomy that shows six different aspects discussed in existing research, including the data source, language, social media user, information dimension, methodology, and application.
The taxonomy elements are described below.
Data source —refers to the sources of social media data and ancillary data provided by other sources (e.g., physical sensors, wireless sensor networks (WSNs), and web services) that are used to facilitate social media data analysis in disaster management. We frame the dimension of data sources into four sub-classes, Sensor, Social Media User, Social Media Platform, and Third Party, based on the common attributes of data sources mentioned in the selected papers. The Sensor class is divided into Physical Sensor and Human Sensor, and the Social Media User is divided into four types of social media users, including Government Authorities, Research/Academic Institutions, Non-Governmental Organisations (NGOs), and Public.
Language—refers to the language used for making a post on social media. Language is classified into the Global Language, Local Language, Mixed Language, and Mixed Script types.
Information dimension—there are two major dimensions of information available in social media content: Spatial and Temporal. The methodologies for analysing social media content to extract spatial and temporal information are also included in this category. The spatial dimension refers to the representation of geographical information in social media and the methodologies for geo-location identification and analysis. The geographical information is presented in several ways, including Geo-tagging, User-defined, and Spatial Coverage. The Temporal dimension refers to the utilisation of temporal information describing disaster-related events in the existing system for event detection. The temporal dimension is further classified as Pre-event, Real-time, and Post-event based on the temporal categories of real events.
Methodology—refers to the methodologies and algorithms used to analyse social media data, especially the spatial and temporal information. We categorise the methodologies based on data analysis stages, which include the Methodology for Data Management and Methodology for Data Analysis. The evaluations for each methodology are also summarised.
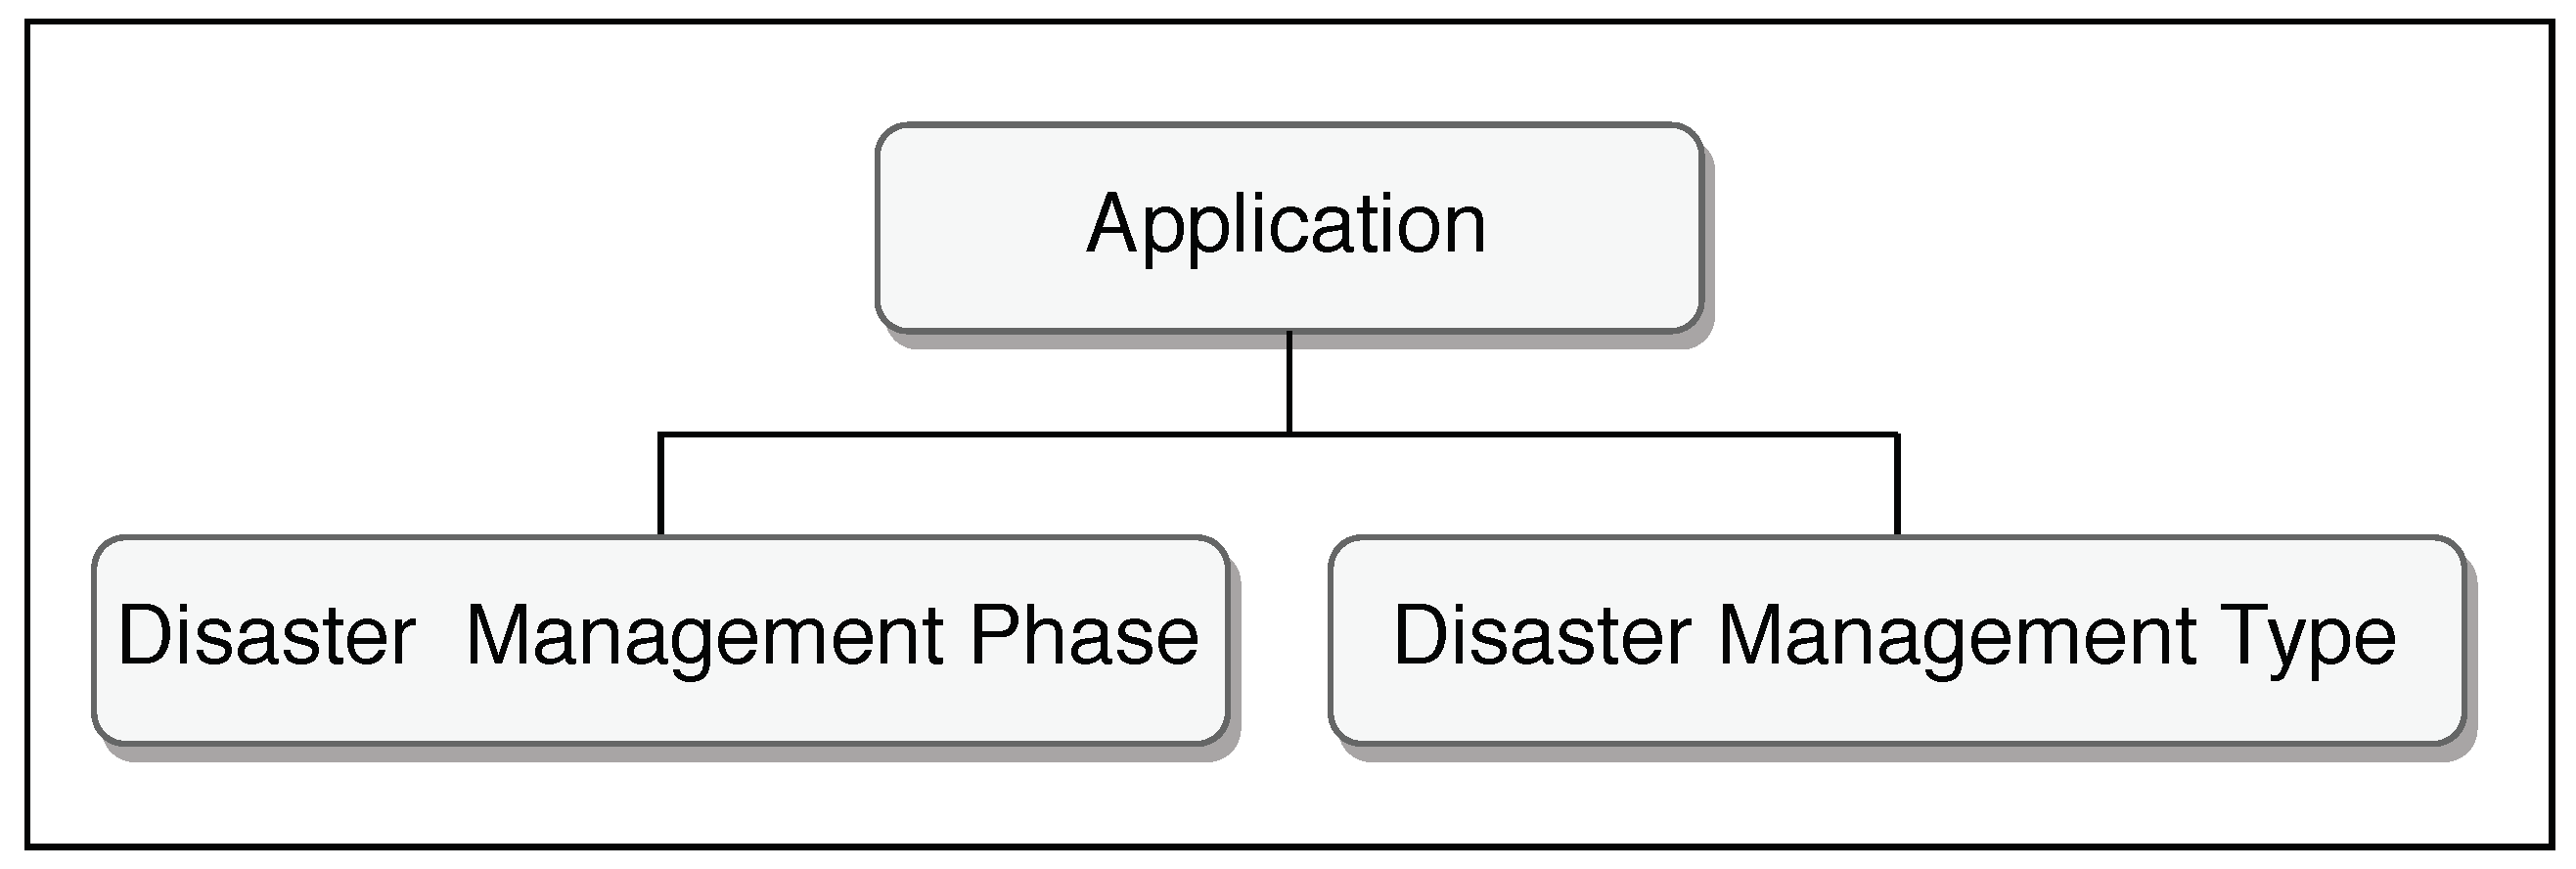
Application—refers to the current uses of social media data for disaster management, which are classified into the two aspects of Disaster Management Phases and Disaster Management Types.
3.2. Survey Procedure
The taxonomy presented in
Section 3.1 is defined based on the common research issues mentioned in the selected publications in this survey. Our process for choosing the publications is divided into four main steps: (i) taxonomy and keyword determination, (ii) publication search, (iii) publication review, and (iv) publication selection.
Step i. Taxonomy and keyword determination: We created a primary taxonomy and identified keywords based on the application of social media data in disaster management. The taxonomy and keywords were determined based on the requirements of our ongoing Landslip project (
http://www.landslip.org (accessed on 17 December 2020)). The keywords were further used in step ii to search for publication candidates. Further, the set of keywords and taxonomy were iteratively refined throughout the process. We also used the keywords provided in the selected papers (in step iv) to identify more keywords and to analyse the critical issues in the selected papers to refine the taxonomy.
Step ii. Publication search: We searched for publication candidates from several potential repositories based on the set of keywords identified in step i. The main publication repositories and search engine used in this step included IEEE Xplore (
https://ieeexplore.ieee.org (accessed on 2 September 2020)), ACM Digital Library (
https://dl.acm.org (accessed on 2 September 2020)), SpringerLink (
https://link.springer.com (accessed on 2 September 2020)), ScienceDirect
https://www.sciencedirect.com (accessed on 2 September 2020)), and Google Scholar (
https://scholar.google.com (accessed on 2 September 2020)). In addition, the search results from Google Scholar led to the sources of the publication candidates, which included ResearchGate, JMR, ScienceAdvances, PLOS, MDPI, and Tandfonline. The keywords could be classified into three main classes: Social Media (e.g., Social Media, Social Network, Crowd-sourcing, Twitter, Microblogs), Disaster (e.g., Disaster Management, Emergency Management, Landslide, Earthquake, Flood, Rainfall), and Data Management and Analysis (e.g., Data Analysis, Data Management, Data Mining). The search for publications was based on the combinations of keywords from these classes, which helped to narrow down the search, leading to more focused and relevant results.
Step iii. Publication review: The search results of publications returned from repositories and search engines were reviewed and selected as candidates based on information provided in the title, keywords, and abstract of the publications and if they were relevant to one of the scopes defined in the taxonomy (
Section 3.1). As a result, 200 publications from the repositories and search engines were selected as publication candidates.
Step iv. Publication selection: We scanned through the contents of the publication candidates and selected the publications for this survey based on their relevance to terms in the taxonomy. For example, Reference [
16] was one of the selected papers that provided information relevant to all terms defined in the taxonomy shown in
Section 3.1. Accordingly, 40 publications from several repositories and search engines were selected. These are presented in
Table 1. Next, we analysed the selected publications to extract more keywords and to update the list of the keywords identified in step i. Furthermore, critical issues mentioned in the selected papers were used to refine and update terms and sub-terms in the taxonomy.
4. Data Sources for Social Media Data Analysis
Effective disaster management demands high-quality and rich data from many data sources that are related to the disaster of interest. Data sources could be any sensors and data services that provide data to a data consumer. This section presents four main data sources for social media data analysis, classified in the taxonomy as Sensor, Social Media User, Social Media Platform, and Third Party. We analyse the characteristics of data sources for each aspect used for disaster management.
4.1. Sensors
The subclass Sensor includes data sources that produce original data for social media data analysis. Such data sources include physical sensors (e.g., remote sensing, in situ sensors, wireless sensor networks) and human sensors (e.g., social media, blogs, and crowdsourcing). A physical sensor is a set of physical sensing devices that observe and measure physical phenomena and transform observations and measurements into a human-readable form. On the other hand, a social or human sensor comprises human activities and interactions to observe real-world events and produce information in the social network [
17].
4.1.1. Physical Sensors
Earth Observation (EO) and ancillary data generated from physical sensors can enhance the effectiveness of social media data analysis for disaster management. There are several types of sensors that generate EO and ancillary data. An in situ sensor is a basic sensor that is deployed in the place of interest to observe and measure the physical phenomena directly. Examples of in situ sensors include temperature sensors, rain gauges, and soil moisture sensors. In situ sensing is suitable for analytics that require high-accuracy observation. Furthermore, a wireless sensor network (WSN) [
18] is an advanced in situ sensor system that consists of spatially distributed sensors called nodes. Each node is usually equipped with wireless connectivity, a microcontroller, a power source, and multi-type sensors. Based on this, data observed by each node can be exchanged among nodes within the system. With computing capabilities, a WSN can be applied in many applications, including industrial process monitoring and control, machine health monitoring, and natural hazard or fire detection. Even though the in situ sensing method can provide highly accurate data, the deployment of in situ sensors to cover a wide area is difficult and extremely expensive. Remote sensing technologies (e.g., radar, satellite, and airborne) have thus been used to remotely sense physical and environmental conditions and to generate observation data that cover a wide area.
4.1.2. Human Sensors
Human sensors utilise people to observe and measure real-world phenomena and generate different types of observation data, including social media data. The emergence of social networks and mobile applications has enabled people to report about observed events. These activities are considered as human sensing [
16] and can be a significant data source for effective urban risk analytics. The data sources include RSS feeds, social media, Instagram, Twitter, Facebook, SMS, and online news. Similarly, crowdsourcing is a process that encourages people to give their contributions with regard to certain tasks in a specific context. This process is widely used in disaster management applications, where people can report a disaster event that they observed. For example, in 2010, people used Ushahidi, a web-based and mobile crowdsourcing application, to report about the earthquakes in Haiti [
19].
4.2. Social Media Users
Messages originating from different accounts on social media have different qualities and trustworthiness [
20]. For instance, official accounts used by government agencies are likely to have more trustworthiness than public users with personal accounts. However, although government agencies that are responsible for the management of disasters use social media to disseminate disaster-related information, they still play a limited role in the communities. Instead, it is the public users that play a significant role in contributing to information networks during disaster events. The authors of [
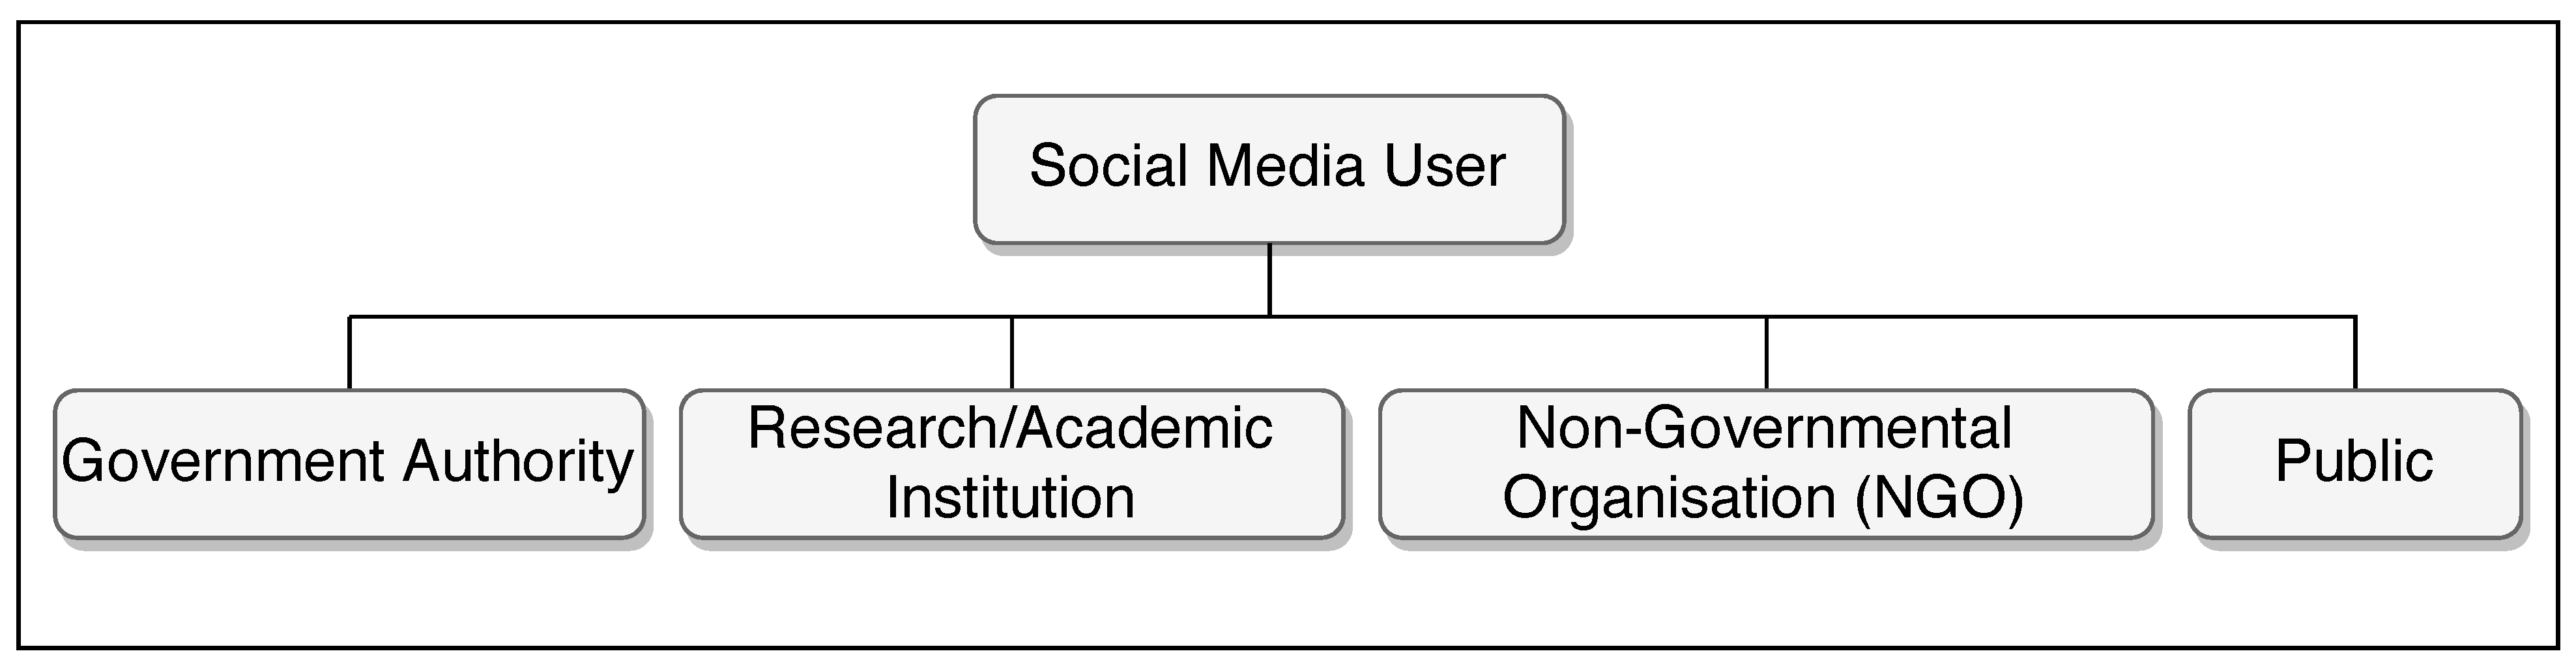
21] showed different distributions of Twitter users participating in various disaster events, with public users having a clearly greater percentage of participation. To summarise, different types of social media users play different roles in disaster management, each providing different context, quality, and trustworthiness of social media data. In this paper, we classify types of social media users as government authorities, research/academic institutions, non-governmental organisations (NGO), and the public, as shown in
Figure 2.
Government Authority—refers to government organisations involved in disaster response and support. These organisations are authorised to: (i) disseminate official announcement and actionable warning information to people in a disaster risk area, e.g., National Disaster Management Authority (NDMA), and (ii) provide supporting information for disaster management, e.g., Geological Survey of India (GSI), British Geological Survey (BGS), and national meteorological offices.
Research/Academic Institution—refers to institutions or research groups who are conducting research on disaster management.
Non-Governmental Organisation (NGO)—refers to private-sector organisations that are disseminating disaster-related information on social media. This user type contributes a greater percentage of information than the government authorities and provides a higher quality of information compared to the information provided by individual users. Examples of NGOs include Save the Hills, Cable News Network (CNN), and Asian News International (ANI).
Public—refers to individual users with personal social media accounts. This user type makes the greatest contribution to social media by sharing disaster-related information. With a huge number of users in this category, it constitutes the greatest percentage in information networks compared to other types of users. Most research [
22,
23,
24,
25,
26,
27] relies on information contributed by public users, even though the information may be of uncertain quality and trustworthiness. As a consequence, social media data preparation techniques (e.g., data filtering, data classification, and data extraction) to improve data quality and enhance the accuracy of social media data analysis prove challenging.
4.3. Social Media Platforms
Generally, social media data are directly accessible on social media platforms (e.g., Facebook, Twitter, and Instagram). These platforms are considered as major data sources for social media data analytics in disaster management. Most social media platforms provide HTTP-based Application Programming Interfaces (APIs) for data consumers to access their social media services (e.g., data service and analytics services). Data consumers can use their tools to communicate with the respective APIs to collect and store social media data for their purposes [
28]. For example, Twitter provides search APIs that enable consumers to find historical or real-time data by using keywords or hashtags. Much research on using social media data for disaster management utilises such APIs to access social media data directly from the social media platforms [
22,
23,
24,
25]. Due to the unstructured characteristics of social media data and the indeterminacy of the sources, the quality and trustworthiness of the collected social media data become significant issues [
20]. Based on this, additional processes (e.g., data filtering, data classification, and data extraction) for data preparation are required. Due to privacy concerns, some of the social media platforms (e.g., Facebook and Twitter) have put several restrictions on data access.
4.4. Third Parties
Social media data are also collected and organised by organisations and institutions for specific purposes. Due to the benefits of Open Data, some of them have been interested in opening their collected social media data for others [
20]. These organisations are considered as alternative data sources for social media data. This section discusses the different methods of accessing social media data. Third parties who provide their collected social media data are considered as alternative data sources for conducting research on social media data analytics for disaster management. This social media data are collected and organised in a specific way to be used for a specific purpose. For example, CrisisLexT26 [
26] provides crisis-related tweets during emergency events, which are collected from Twitter by using crisis-specific keywords. CrowdFlower [
29] provides the Figure Eight platform for free open datasets. These include tweets relevant to various kinds of disasters. Most social media data collected by third-party data sources are usually prepared using additional processes to provide higher-quality datasets. In addition to using datasets from third-party data sources for disaster management, such datasets can be used as training datasets and for evaluation in data analysis in many studies on disaster management. For example, the authors of [
27] utilised datasets from CrisisLexT26 and CrowdFlower as training datasets for identifying disaster-related tweets.
Table 2 depicts some existing works that use social media data sources for disaster management. Twitter is a major source of social media data, which can be accessed via the Twitter API.
5. Language
Language refers to the language used for making a post on social media. The languages of the social media data are investigated and classified into four categories: global language, local language, mixed language, and mixed script, as shown in
Figure 3.
Global Language—refers to social media posts that are in English.
Local Language—refers to social media posts in languages other than English.
Mixed Language—refers to social media posts that are a combination of two or more languages.
Mixed Script—refers to social media posts that are in a stylistic or linguistic variation of two or more languages. For example, a Twitter user may tweet in Hindi language using English script.
Table 3 illustrates the variety of languages present in social media data. Social media posts in English are used in most research, and English is also a common language for social media posts in mixed languages. Moreover, multiple local languages can be seen in the social media posts in some research. This variety has become challenging in the understanding of text-based information produced by social media. Here, natural language processing (NLP) has played an essential role in understanding and extracting useful information from the text information and facilitating disaster management. Research works on NLP are discussed in
Section 7.
6. Information Dimension
This section presents two major dimensions of information—spatial and temporal—that are essential parts of social media data for disaster management, as we explain below. We also investigate the variety of methodologies for analysing social media content to extract the spatial and temporal information.
6.1. Spatial
Although spatial representations of social media data, such as geo-location, play an essential part in social-media-based event detection or event analysis, there are few social media data that provide information about users’ locations [
34]. Furthermore, there is a variety of location information represented in social media, ranging from a very precise location using geographic coordinates (e.g., longitude and latitude) to a very fuzzy location using descriptive language (e.g., city name).
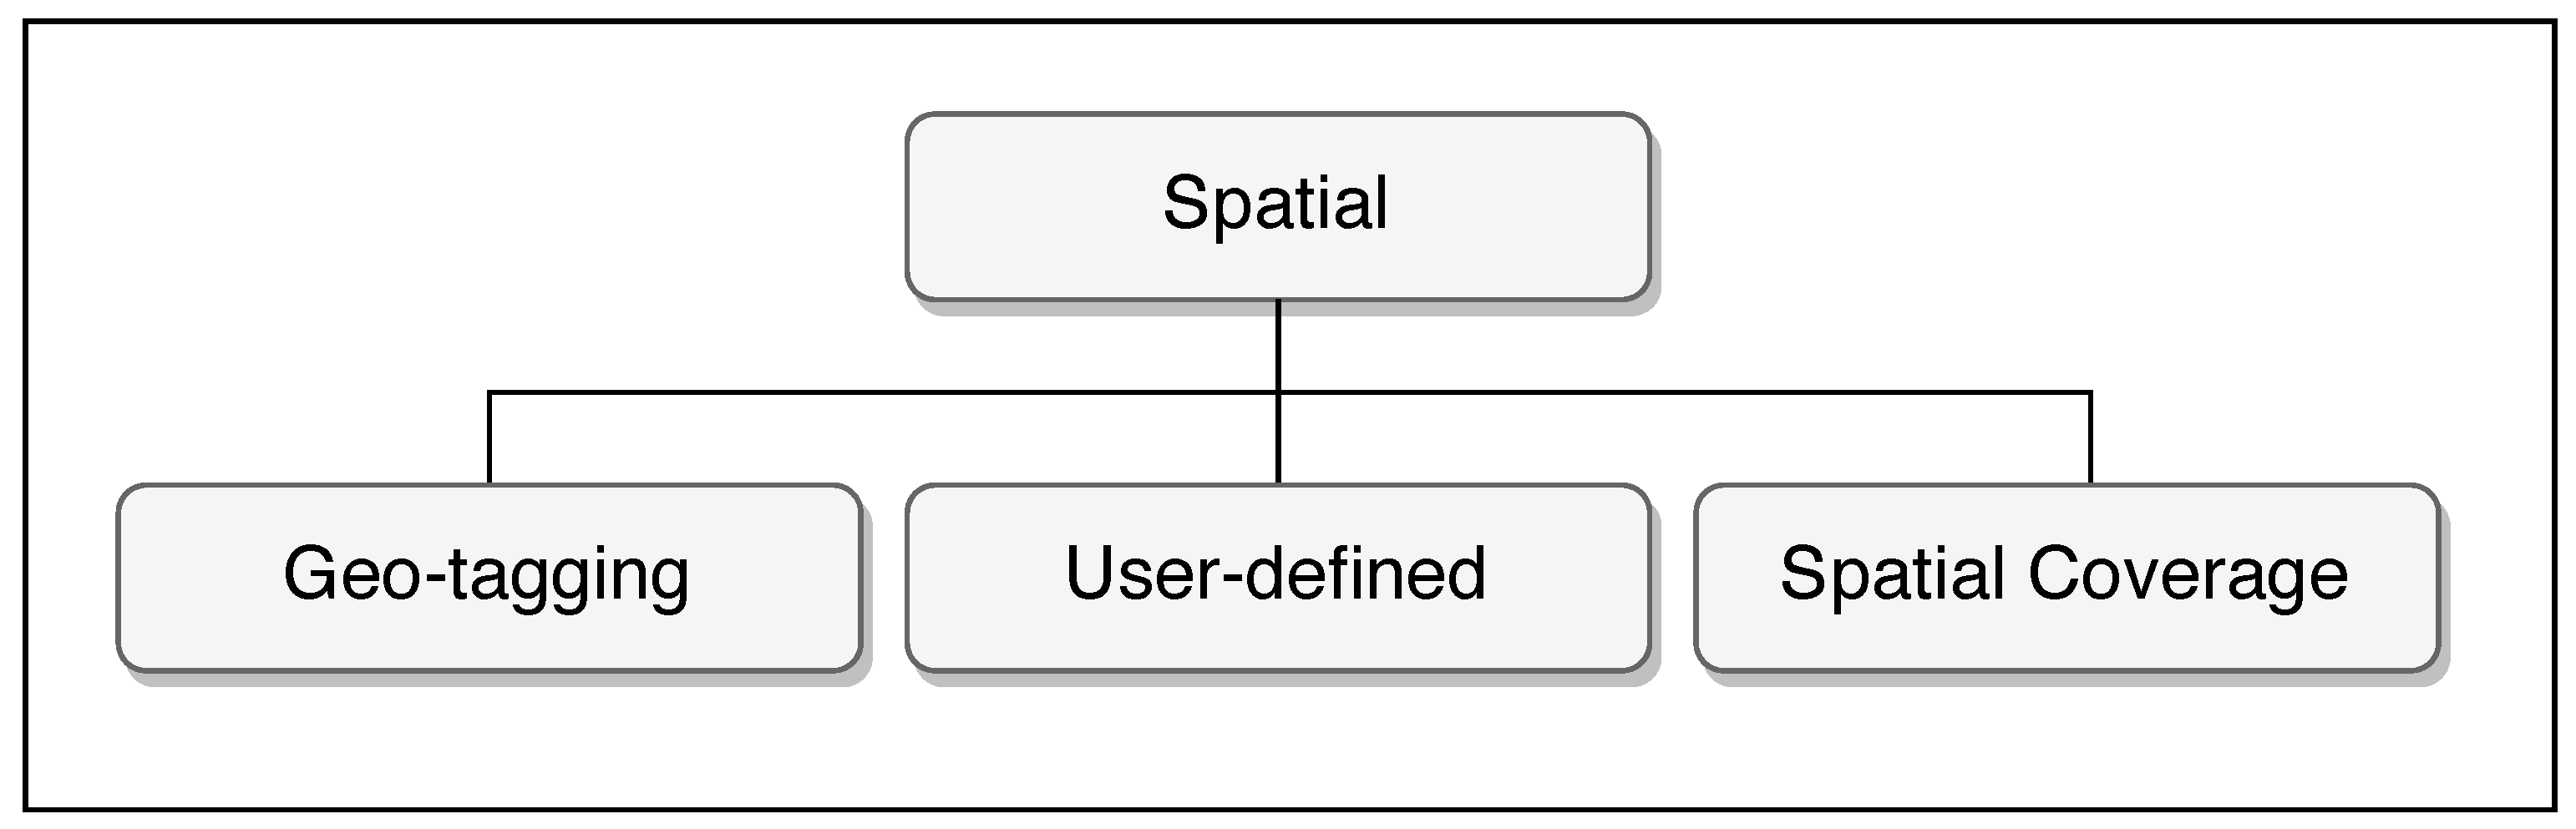
Geographical information is represented in several ways on social media, as shown in
Figure 4.
Geo-tagging: The social media systems attach geographical information automatically or manually (by users) when the users post a message.
User-defined: The user mentions the location in the post, either as the place name or as geographic coordinates.
Spatial coverage: Many posts only mention the geographical extent, such as the town/village/locality, a district, a country/province, the continent, or similar information.
Several approaches have been proposed in the literature to address the issues of spatial representation in social media. Here,
Table 4 presents the state-of-the-art methods for identifying and analysing the spatial information of social media data.
Geo-location identification: The research of [
34] shows that 0.42% of all tweets use the latitude and longitude function to tag their geo-location, and out of 1 million Twitter users, only 26% have listed a city name. In most cases, general expressions (such as California) or nonsensical expressions (such as wonderland) are used. This research aimed to detect the locations of tweets that do not clearly mention geographic information. To this end, the authors proposed a method of computing the probability that a word is linked to a city. In order to improve the accuracy, the authors introduced a model of spatial variation for analysing the geographic distribution of words in tweets. The authors of [
35] mentioned that geo-location information in tweet data may have noisy signals. For example, a user in the UK could tweet about a Houston Rockets game or their vacation in India. To overcome this, the authors integrate two types of signals (user’s friend and user’s tweet’s nearby location) from social networks to predict a user’s location.
Geo-location analytics: The authors of [
36] discussed the effect of an earthquake on the East Coast of the United States (US) on August 23, 2011 by analysing the collected tweet data. The main finding of the paper was the patterns between the distance from the epicentre and the time after the earthquake. The authors of [
37] used sensor data to identify flood-affected regions. The authors performed some statistical analyses of the collected data to find the general spatial patterns and to explore the differences between the spatial patterns among the relevant tweets. On the other hand, methods such as kernel density estimation (KDE) have been widely used for clustering of the activities during Hurricane Sandy [
38] and spatial hotspot detection during the 2012 Beijing rainstorm [
3].
6.2. Temporal
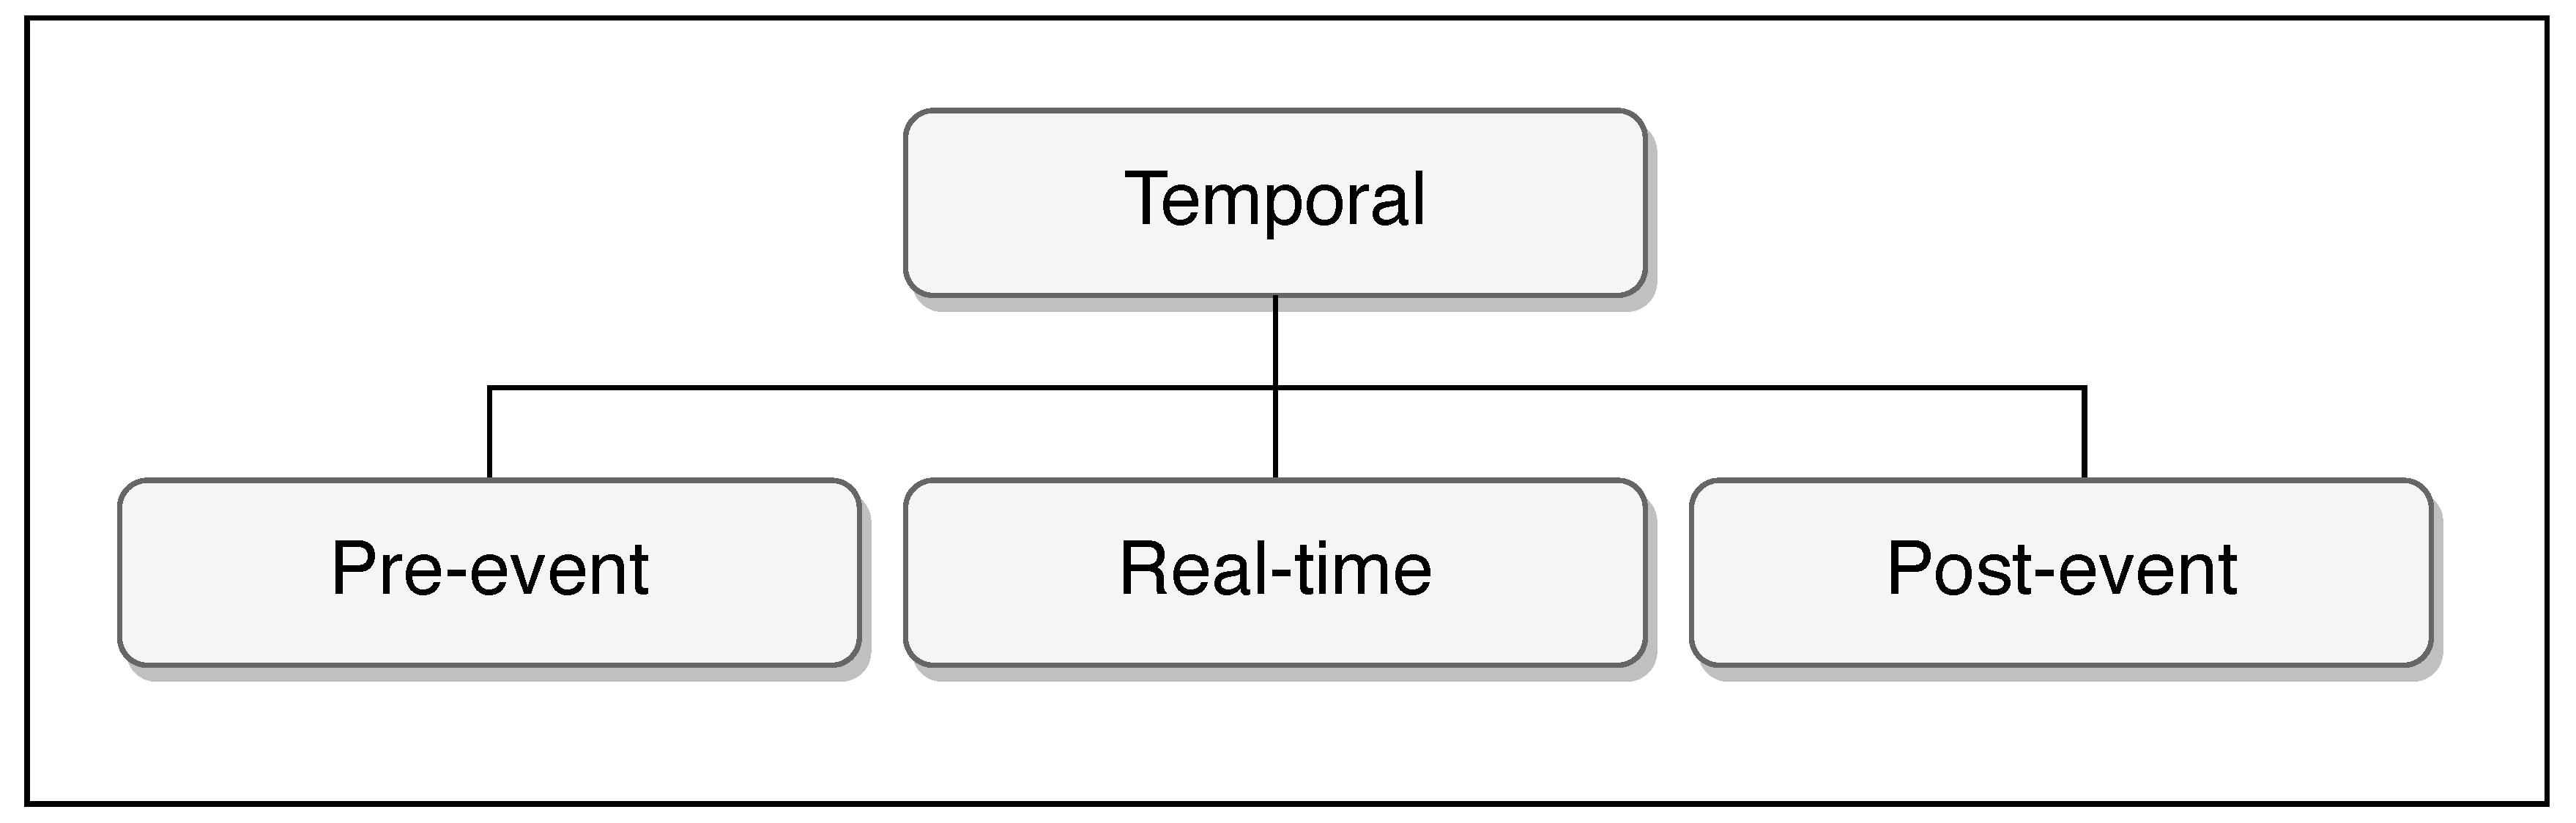
Most social media applications attach a time stamp to the posted data. The temporal relation between events can be derived from the time stamp of the event and the content. We studied how temporal information is used in the existing systems for event detection. In the context of event detection, we categorised the temporal information into three categories as shown in
Figure 5.
Pre-event: This represents the time period before the occurrence of the event of interest. In general, a social media message that is posted before the event occurrence can be analysed to derive the following information: (i) warnings—e.g., a post about bad weather from the Met-Office before heavy rainfall, a cyclone alert, etc. serves as a warning message for an impending natural disaster, (ii) precursor event detection—e.g., a social media post about a leaning electric pole in a location can serve as a precursor for landslide event detection, and (iii) temporal offset—pre-event posts from social media are analysed to determine the offset between the time of the post and the time of the actual event, such as, for instance, the time taken after the leaning pole post and the actual landslide in that locality. Pre-event posts from social media can thus be utilised for serving the mitigation and preparedness phases of emergency management.
Real-time: This represents the time span during which the event is happening. In the real time of the event occurrence, social media may be widely used for information sharing about the incidents related to the event. Generally, the real-time posts from social media during the occurrence of the event can be analysed for: (i) obtaining situational awareness—e.g., “trains cancelled, schools closed in Kerala due to heavy rains”, or a social media post about “roadblock due to landslides on NH-8”, (ii) deriving/issuing warnings about the after-effects/impacts of a disaster—e.g., “high tides are expected in coastal areas after the tremors”, and (iii) response, relief, and recovery—e.g., a tweet during the Kerala flood in 2018: “shortage of bubble wrap and ready-to-eat items in Sanskrit College Palayam”.
Post-event: This represents the time period after the occurrence of the event of interest. Often, after disasters, social media is widely used to communicate about required supplies, information about missing people, death tolls, property losses, relief operations planned by the government and NGOs, protective measures to be undertaken while returning home, funds donated by various authorities, etc. Thus, the post-event data can generally be analysed for: (i) warnings of further events, (ii) deriving information on the impact of the event, (iii) identifying the relief and recovery measures required, and (iv) determining the temporal offset between the time of the post and time of the actual event.
It is important to analyse the behaviour of the public/communities before, during, and after disasters in order to bring in effective disaster response, management, planning, and mitigation. Since social networks serve as the easiest and most common way to sample public opinion, we can make use of the time-stamped, geo-tagged data from social media for this purpose.
Table 5 summarises the temporal the state-of-the-art methods for temporal information analysis. Chae et al. [
39] explain the temporal analysis of Twitter data related to hurricane Sandy, wherein they analyse the Twitter user density distribution two weeks before and after the date of the event, as well as for a time period on the day of the event, right after the announcement of the evacuation order. A similar study on the spatiotemporal analysis of Twitter data for the same disaster event was performed by Kryvasheyeu et al. [
40], according to whom the persistence of the Twitter activity levels in the time frame immediate to the occurrence of the event (post-event) was a good indicator for determining which areas were likely to need the most assistance. Further, during a disaster, normalised activity levels, rates of original content creation, and rates of content rebroadcasting must be considered to identify the hardest-hit areas in real time. The number of tweets during the Christchurch, New Zealand earthquakes were analysed over time in a window of five minutes in [
41]. The analysis indicated that when an earthquake with a magnitude of 4.2 or stronger occurred at a particular time, it correlated with a spike in the number of tweets over that time frame.
Another crucial factor to be considered while choosing the time frame for social media data collection is the type of disaster. For disasters like landslides, floods, and storms, we may be able to capture some of the warning signs for these events from social media posts before the actual occurrence of these events, whereas for other events, such as wildfires and earthquakes, the posts relevant or related to them may surface only after the occurrence of these events. Wang et al. [
42] analysed wildfire-related tweets of some of the major wildfires that occurred in San Diego County, USA with respect to space, time, content, and network by collecting Twitter data from the day when the first wildfire occurred until the date when most of these wildfires were 100% contained. The temporal evolution of wildfire-related tweets obtained using different keywords, with and without the location, gave an insight into the time lag taken for the spreading of the information. Furthermore, as Granell and Ostermann mentioned in [
43], the durations of the impacts of these events also affect the temporal and contextual variation in the data related to these events. For instance, real-time and post-event data can be utilised for disaster response and recovery, whereas pre-event data can be utilised for preparedness and planning. A case study to analyse the social media text during and after the 2012 Beijing rainstorm was described in [
3], where the authors performed time-series decomposition of the data to identify the overall trend and variations with respect to different developmental stages of the event, as well as the cyclical trends of microblogging activity. They concluded that the trend analysis of text streams for different topics over time corresponded well with different development stages of the event. For example, texts related to the event increased in the week after the rainstorm, following which they began to slowly subside, and, finally, faded out.
The classification of these social media messages into different contextual categories and their analysis over time help to identify the transition between various phases of disaster management and support effective decision-making for disaster preparedness, response, and recovery. The authors of [
44] present a classifier based on logistic regression that automatically classifies the gathered social media data into various topic categories during various disaster phases and classifies the temporal trends of these topic categories in different phases. The experimentation using tweets related to Hurricane Sandy revealed that: (i) Tweets regarding preparedness reached their peak on the day before the event when the emergency declaration was issued, (ii) a large proportion of tweets related to impact were observed within a few days of the event’s occurrence, and (iii) the largest peak of tweets related to disaster recovery was observed five days after the event.
7. Methodology
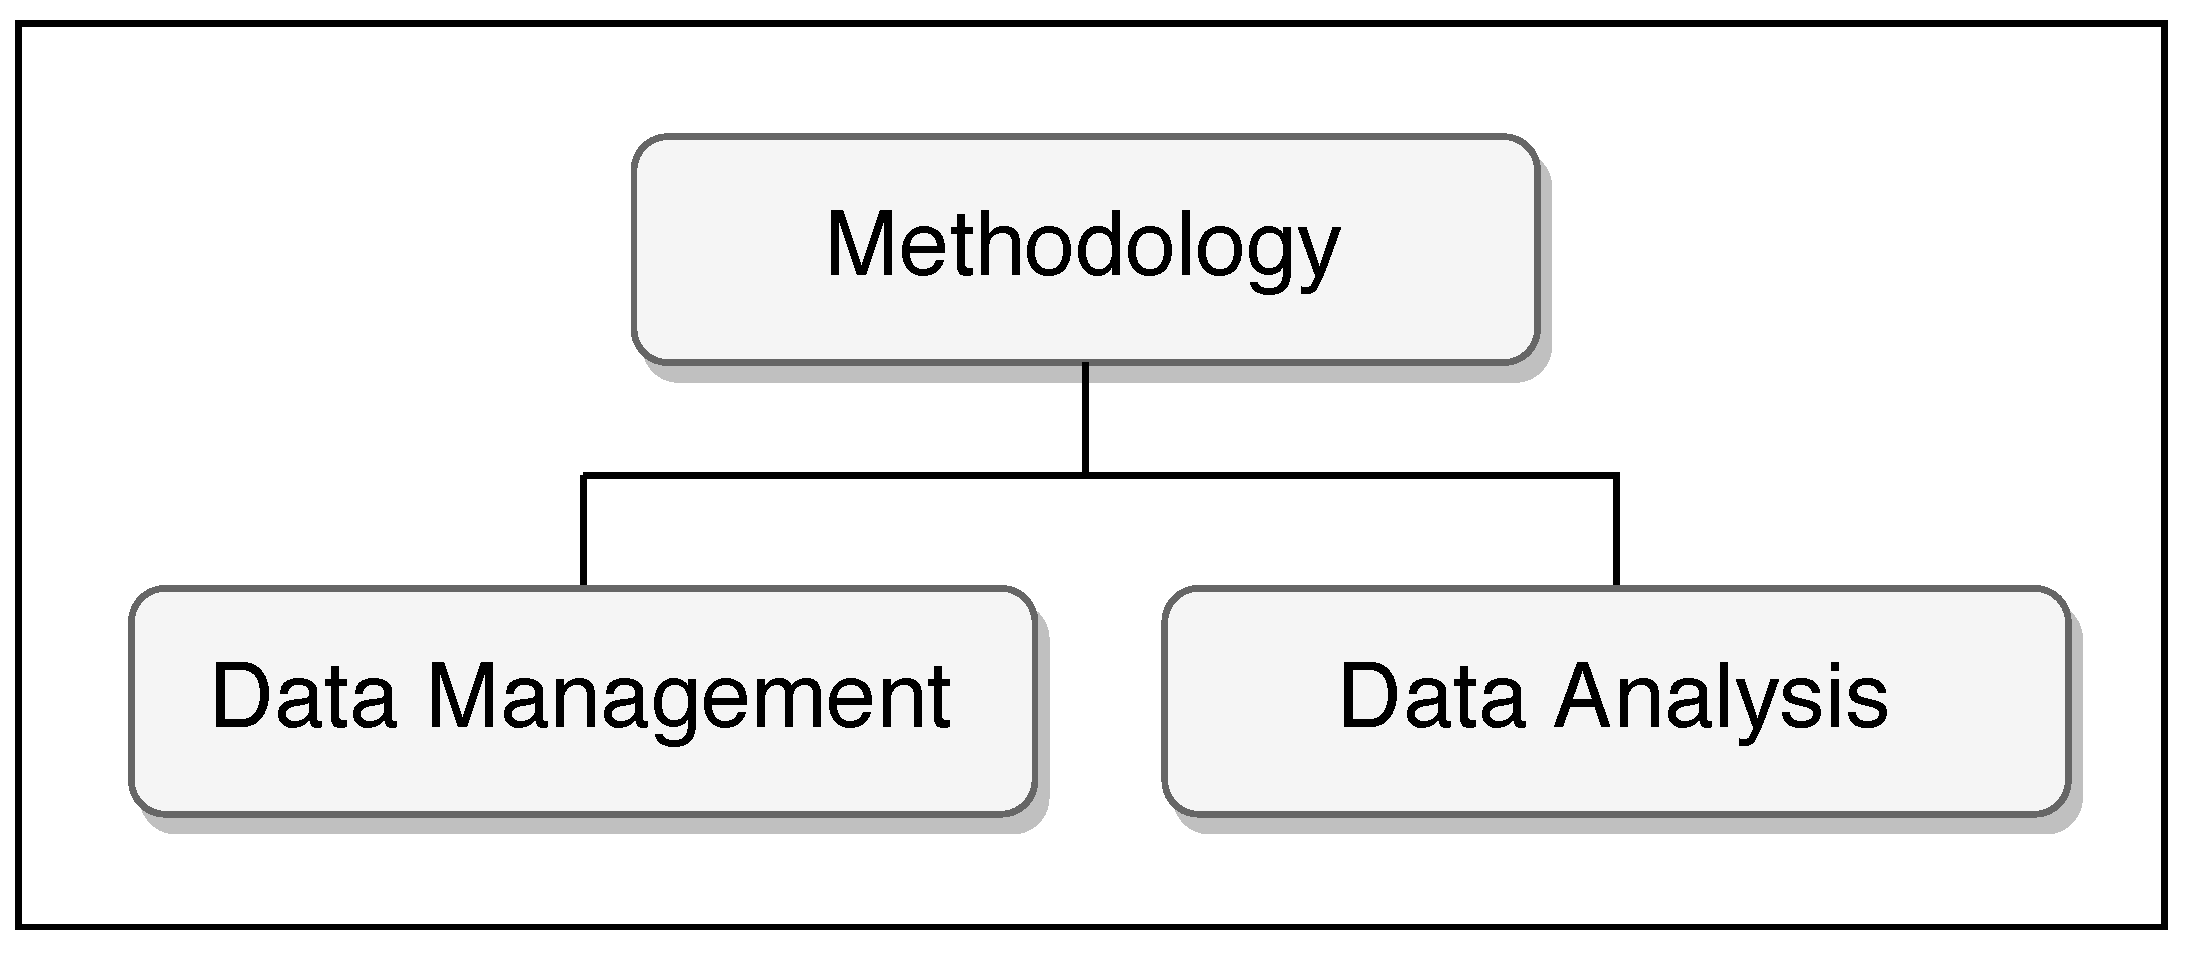
In the previous section, we discussed the state-of-the-art methodologies and algorithms used in research for extracting the spatial and temporal information from social media. However, methodologies and algorithms are used in all stages of social media data analytics. In this section, we categorise the most popular methodologies applied to social media data based on the data analysis stages, as shwon in
Figure 6. The state-of-the-art methodologies for the data analysis stages are summarised in
Table 6.
7.1. Methodologies Used for Data Management
Data management for social media includes collecting, indexing, storing, and querying social media data for the accessibility, reliability, and timeliness of the data. Social media generates a large volume of data every day. For instance, according to [
45], Facebook generates around four petabytes of data every day. The sheer amount of data itself poses a significant challenge in social media data management, making it a Big Data problem. Data management and analysis systems for social media data must, therefore, be able to handle the “four Vs” of Big Data analytics—namely, volume, variety, velocity, and veracity. In this section, we present the state of the art in various systems and in research involving social media analytics for disaster management. From the data management perspective, we reviewed how data are collected, filtered, pre-processed, localised, stored, indexed, and queried.
Maynard et al. [
15] presented a framework for real-time semantic social media analysis that is based on a popular open-source framework for natural language processing, GATE [
46]. For the evaluation of the framework, they used the Twitter streaming API for data collection. Both streaming and batch processing approaches were evaluated. The GATE Cloud Paralleliser (GCP) [
47] was used to perform batch processing of text, as it supports execution of NLP pipelines with millions of documents. It performs the pre-processing and transformations required to load into the main information management system in the GATE pipeline, Mímir (Multi-paradigm Information Management Index and Repository). It also supports indexing of text, annotations, and semantics. In real-time stream analysis, the Twitter client is used to capture data from the Twitter streaming API to feed into a message queue. Separate semantic analysis processors analyse and annotate the text and push it into Mímir, which, in turn, enables semantic search using the knowledge encoded in knowledge graphs or ontologies [
48]. This enables the indexed documents to form semantic relationships and, thus, makes it easy to perform complex semantic searches over the indexed dataset. GATE Prospector [
14] is used for exploring and searching datasets in the Mímir system. This system is reviewed in the next section.
Kim et al. proposed a conceptual framework [
49] for social media data collection and quality assessment. The framework’s strategy consists of three major steps to develop, apply, and validate search filters. Retrieval precision and retrieval recall are measured. Quality assessment in data collection is an important aspect of analysing a large amount of data, such as social media content. This is very relevant in the disaster management scenario. Search filter development is performed with keyword selection, which includes disambiguations and slang words, and this procedure was generally performed manually by domain experts. Search filters are developed using standard logical operators, such as AND, OR, and NOT, and by involving data preprocessing techniques, such as n-gram analysis and proximity operators. D-record [
50] utilises three data sources: Twitter, OpenStreetMap, and satellite images. A set of keywords for a needed concept was expanded using topic modelling learned using an support vector machine (SVM)-based classifier with Synthetic Minority Over-Sampling Technique (SMOTE). In “Twitter Analytics: A big data management perspective” [
13], Goonetilleke et al. reviewed several open-source and commercial tools for data collection, management, and querying for Twitter, many of which have been used in disaster management applications. Wang et al. (2013) and Wang et al. (2010) [
51,
52] developed a scalable Cyber Infrastructure-based Geographic Information Systems (CyberGIS) for analysing large amounts of social media content in a natural disaster context. The system employs data fusion techniques to fuse social media data with census data and remote-sensing imagery. Slamet et al. proposed a system design [
53] to find a secure place locator (SPL), which covers a system information engineering aspect. It involves combining multiple data sources, such as location databases, governmental information, and information from the community, as it uses a relational database model to store and process the data. Yates et al. performed a case study on emergency knowledge management and social media technologies [
54]. The study investigated social media and related tools for effective knowledge management. It discussed how US government agencies use social media data as an informal information dispersal mechanism, and also studied how visual information layering helped the disaster management scenario.
Apart from text information, the use of multimedia data, such as images, audio, and video, in extreme event management [
55] remains challenging due to the variety and complexity of social media content. Such events require sophisticated techniques to represent and analyse the multimedia contents to better understand extreme events. The authors of [
56] proposed a novel data model based on a hypergraph structure to manage the massive amount of multimedia data produced by social media. The proposed data model comprises three different entities—users, multimedia objects, and annotation objects—to represent the variety and complexity of relationships of the multimedia contents. This approach enables merging of social media contents from different social media platforms in a single data structure. Here, the influence diffusion algorithm [
57] was proposed to investigate social media users who have significant interactions on a particular social media object.
7.2. Methodologies Used for Data Analysis
In [
59], the researchers showed an example of an earthquake event and early warning using a social approach. This was accomplished by integrating semantic analysis and real-time data from Twitter. They made two primary assumptions: that each Twitter user is a sensor, and each tweet is associated with a time and location. Semantic analysis was used to classify tweets into positive and negative classes. Tweets related to earthquake events were classified as a positive class, while tweets unrelated to earthquake events were classified as a negative class. Furthermore, they used a machine learning algorithm, support vector machine (SVM), for tweet classification.
On the other hand, Latent Dirichlet Allocation (LDA), a topic modelling technique in the information retrieval domain, was used in [
60]. LDA was used to extract the inherent topic structure from a set of social media messages, and the extracted topic referred to an event (e.g., 2011 Virginia earthquake).
The authors gave an example of topics and the proportions of each topic to all messages and showed how the earthquake events captured from the topics constituted a small proportion of messages. Using the LDA topic model approach, meaningful topics with many iterations were discovered. Abnormal events captured from extracted topics did not happen frequently and covered only a small fraction of the social media data stream. In order to identify such abnormal events, the authors used seasonal trend decomposition based on locally weighted regression (Loess), which they called STL. In STL, the reminder component is used to implement control charts. The detected anomaly events are compared with other social media data to confirm the anomalies.
A candidate retrieval algorithm was used in [
61] for retrieving events from the database. The authors implemented feature extraction to extract spatial, temporal, and textual information, and then used scoring and ranking to determine which document belonged to which event. SVM-based classification was the methodology used in this paper for event detection.
An architecture for a public health surveillance process using SMART-C was presented in [
63]. The architecture explains the data sources with their modalities, users, and services provided by the underlying system to enable enhanced situational awareness and informed decision-making during all phases of disaster management. The authors discussed the requirements for implementing the following services: event classification/grouping, semantic reasoning, location determination, event extraction, speech analysis, text analysis, video analysis, sensor analysis, geospatial analysis, response planning and generation, and alert dissemination service. They also presented a discussion on security and privacy, event detection, and correlation.
Classification and information extraction from Twitter were carried out in [
30]. The authors used free part-of-speech-tagging software for Twitter and Weka data mining tools. For classification purposes, they first broadly classified the tweets into personal, informative, and other tweets. They further classified the informative tweets into: (i) caution and advice, (ii) damage, (iii) donations, (iv) people, and (v) other. They used a Naive Bayesian classifier for feature extraction and used unigram, bigram, and part-of-speech (POS) tagging to provide a rich set of features in the classifier. Once a tweet was classified, a sequence labelling task identified relevant information using conditional random fields.
A participatory sensing-based model for mining spatial information of urban emergency events was discussed in [
64]. The researchers conducted simulations on a typhoon event, Typhoon Chan-hom. They proposed a hierarchical data model with three different layers: a (i) social user layer, (ii) crowdsourcing layer, and (iii) spatial information layer. In the social user layer, the proposed method collected data related to emergency events. In the crowdsourcing layer, the positive samples were collected, and the address and Geographic Information Systems (GIS) data is mined. Information related to the same emergency events was clustered in this layer. In the spatial information layer, the spatial information of the emergency event was mined. Semantic analysis of the geo-tagged microblog data helped obtain a public opinion from the spatial perspective, and assistance could be offered where it was required. From the collected data, it was observed that the risk was high in Beijing, Zhejiang, Jiangsu, and Shanghai.
In [
34], the authors proposed a probabilistic framework for identifying the location of a Twitter user based on the content of their tweet. The authors used a simple cart classifier to classify the tweets with strong geo-scope, and then use a lattice-based neighbourhood smoothing model to refine the user location. They also showed that, with an increase in the number of tweets, the location estimation process converges.
The authors of [
35] proposed a unified discriminative influence model to solve the problem of profiling users’ home locations on Twitter. They adapted probabilistic methods for local prediction and global prediction to profile user location. Local-prediction-based profiling uses the user’s friends, followers, and their tweets to efficiently profile the user’s location, whereas global prediction, in addition, uses unlabelled users to accurately profile user location. In D-record [
50], text sentences are vectorised to capture their semantics. Before featuring, the text is pre-processed by stemming, case folding, and removing noisy lexical elements using an SVM classifier with a lexicon-based feature, Term Frequency-Inverse Document Frequency (TF-IDF) vectors, and gensim’s word2vec embedding.
8. Applications
In this section, we investigate the contribution of social media applications in the context of disaster management strategy, which is a discipline for dealing with disasters or avoid disasters where possible. In general, disaster management strategies consist of four phases: mitigation, preparedness, response, and recovery [
65]. These four phases demand supporting tools and technologies for effective disaster management. Several recent research works have utilised social media data to address problems in different types of disasters and phases of disaster management. According to The Emergency Events Database (EM-DAT) [
66], there are two general groups of disasters: natural disasters and technological disasters, with several types of disasters within each of these groups.
Figure 7 depicts two significant dimensions of social media applications in disaster management studied in this paper, disaster management phase and disaster management type. The disaster management phase represents the stage in the life cycle of disaster management contributed to by social media applications, whereas the disaster management type represents the group of disaster applications. Based on these dimensions, we investigate the current coverage of existing social media applications for disaster management and the overall picture of existing applications.
8.1. Disaster Management Phases
Disaster management phases describe the normal life cycle of a disaster and provide a useful framework for response [
65]. As we have already established, there has been an increased use of social media in different phases of disaster management. Several techniques for the application of social media for disaster management have been proposed in the literature. As presented in
Section 6.1 and
Section 6.2, social media data are usually generated with spatial and temporal information. Such information can be used to facilitate disaster management in different phases.
Mitigation—the actions for minimising the cause and impact of hazards and preventing them from developing into a disaster.
Preparedness—the action plans and educational activities for communities to confront unpreventable hazard events.
Response—the actions for protecting people’s lives and property during hazards or disaster events.
Recovery—the actions for restoring damaged property and community infrastructures and for curing people of their illnesses.
8.2. Disaster Management Types
Disaster management types refer to groups of disasters, which are classified based on the root cause of the disaster. According to the International Disaster Database (EM-DAT) [
66], there are two main groups of disasters: natural disasters and technological disasters.
Natural disasters are natural events that emerge from natural processes or phenomena and may cause loss of people’s lives and property. Natural disasters are further divided into six sub-groups: biological, geophysical, climatological, hydrological, meteorological, and extra-terrestrial disasters. Some examples of natural hazards are floods, landslides, earthquakes, and tsunamis.
Technological disasters are disasters that are a consequence of technological processes or human activities. Some examples of technological disasters are industrial and transport accidents.
Table 7 lists the applications of social media data in disaster management. We identify the sub-classes of both disaster management phase and disaster type for the application of social media proposed by each publication. Consequently, this reveals the current coverage of the existing applications of social media in disaster management.
The authors of [
16] proposed a novel approach to viewing social media data as a human sensor and using social media to observe technological disasters (sightings of oil) and natural disasters (earthquakes and air quality). Geo-locations were extracted and used as a boundary for the prediction of an oil spill. The authors of [
39,
40] analysed Twitter data to identify public behaviour patterns from both spatial and temporal perspectives during a natural disaster—Hurricane Sandy. An investigation of the emergency information distribution using social media during an emergency event was performed in [
3]. This work analysed the social media stream during the 2012 Beijing rainstorm by using classification and location models. The authors of [
44] analysed tweets about Hurricane Sandy to find temporal trends using a classifier based on logistic regression. The applications of social media mentioned in
Table 7 were proposed to address problems in a different phase of disaster management. The work in [
16,
39,
40,
44] addresses problems in the preparedness phase, while the outcomes in [
3,
16,
39,
40,
44] are utilised for the response phase. The applications outlined in [
39,
40] are used for the recovery phase.
It can be seen that most research has focused on the application of social media data for natural disasters rather than technological disasters. However, the approaches presented in most of these works can be applied to multiple phases of disaster management. Interestingly, the response phase is the most popular aspect in which to exploit social media data, while there are no available publications that are applicable to the mitigation phase.
9. Conclusions
In this paper, we reviewed research publications to investigate the contributions of social media data and the techniques for data management and analysis in disaster management. We studied the various dimensions of the contributions based on our proposed taxonomy, which includes data sources, languages, spatial and temporal information, methodologies, and applications. Human-centric approaches (e.g., social media, blogs, and crowdsourcing) have become significant data sources that provide observational data of real-world events and contribute to disaster management. Several publications have proposed the exploitation of social media data for disaster management, with Twitter being one of the most significant social media data sources used for disaster management. The temporal and spatial information extracted from Twitter is critical information for supporting decision-making in disaster management. Geo-location identification and analysis are key research challenges of the spatial perspective in disaster management. Even though several methodologies have been proposed in the literature, these challenges remain unresolved. However, social media content, along with temporal information, including posting time and event time, can be used to facilitate disaster management in several ways. Many research works used such information to detect precursor events or support decision-making during disasters. Furthermore, several approaches for managing, analysing, and evaluating social media data have been proposed in the literature. It is evident that Big Data technology is a key technology for social media data management due to the high volume of generated social media data. Moreover, machine learning and information retrieval algorithms are widely used to collect, classify, and extract essential information from social media. Such information includes temporal and spatial information and disaster events. F-Measure, precision, and recall are common techniques for evaluation of the proposed methods for data collection, classification, and extraction. Finally, the application perspective of this survey has shown evidence that social media plays a significant role in every phase of disaster management, and the generated data have been used extensively in such management.
Author Contributions
Conceptualisation, R.R., T.S., P.J., M.V.R., J.P., N.B.T., Z.W., R.S., D.P., H.T. and G.M.; methodology, R.R., T.S., P.J. and J.P.; data curation, J.P.; writing—original draft preparation, J.P., N.B.T., Z.W., R.S., D.P. and H.T.; writing—review and editing, J.P., T.S., R.R. and P.J.; visualisation, J.P. and T.S.; supervision, R.R., T.S., P.J., G.M. and M.V.R.; funding acquisition, R.R., P.J. and M.V.R. All authors have read and agreed to the published version of the manuscript.
Funding
This research was partially funded by two Natural Environment Research Council projects, including LandSlip (NE/P000681/1), FloodPrep (NE/P017134/1), EPSRC Project Super (RES/0550/7498/001), and the Engineering and Physical Sciences Research Council (EPSRC), Sustainable urban power supply through intelligent control and enhanced restoration of AC/DC networks, EPSRC-NSFC Call in Sustainable Power Supply, and EP/T021985/1.
Data Availability Statement
Not applicable, the study does not report any data.
Acknowledgments
This research was partially supported by Natural Environment Research Council projects, including LandSlip (NE/P000681/1), FloodPrep (NE/P017134/1), EPSRC Project Super (RES/0550/7498/001), the Engineering and Physical Sciences Research Council (EPSRC), Sustainable urban power supply through intelligent control and enhanced restoration of AC/DC networks, EPSRC-NSFC Call in Sustainable Power Supply, and EP/T021985/1.
Conflicts of Interest
The authors declare no conflict of interest.
Abbreviations
The following abbreviations are used in this manuscript:
| Landslip ontology |
| WSN | Wireless sensor network |
| EO | Earth observation |
References
- Adeel, A.; Gogate, M.; Farooq, S.; Ieracitano, C.; Dashtipour, K.; Larijani, H.; Hussain, A. A Survey on the Role of Wireless Sensor Networks and IoT in Disaster Management. In Geological Disaster Monitoring Based on Sensor Networks; Durrani, T.S., Wang, W., Forbes, S.M., Eds.; Springer: Singapore, 2019; pp. 57–66. [Google Scholar] [CrossRef] [Green Version]
- Li, L.; Goodchild, M.F.; Xu, B. Spatial, temporal, and socioeconomic patterns in the use of Twitter and Flickr. Cartogr. Geogr. Inf. Sci. 2013, 40, 61–77. [Google Scholar] [CrossRef]
- Wang, Y.; Wang, T.; Ye, X.; Zhu, J.; Lee, J. Using social media for emergency response and urban sustainability: A case study of the 2012 Beijing rainstorm. Sustainability 2015, 8, 25. [Google Scholar] [CrossRef]
- Zhao, P.; Qin, K.; Ye, X.; Wang, Y.; Chen, Y. A trajectory clustering approach based on decision graph and data field for detecting hotspots. Int. J. Geogr. Inf. Sci. 2017, 31, 1101–1127. [Google Scholar] [CrossRef]
- Maryam Mohsin, M.Y.S. 10 Social Media Statistics You Need to Know in 2020 [Infographic]. Available online: https://www.oberlo.com/blog/social-media-marketing-statistics (accessed on 10 June 2020).
- Zephoria. The Top 20 Valuable Facebook Statistics—Updated May 2020. Available online: https://zephoria.com/top-15-valuable-facebook-statistics/ (accessed on 10 June 2020).
- Twitter. Quarterly Results. Available online: https://investor.twitterinc.com/financial-information/quarterly-results/default.aspx (accessed on 10 June 2020).
- Abdulhamid, N.G.; Ayoung, D.A.; Kashefi, A.; Sigweni, B. A survey of social media use in emergency situations: A literature review. Inf. Dev. 2020, 0266666920913894. [Google Scholar] [CrossRef]
- Nazer, T.H.; Xue, G.; Ji, Y.; Liu, H. Intelligent Disaster Response via Social Media Analysis A Survey. SIGKDD Explor. Newsl. 2017, 19, 46–59. [Google Scholar] [CrossRef]
- Wang, Z.; Ye, X. Social media analytics for natural disaster management. Int. J. Geogr. Inf. Sci. 2018, 32, 49–72. [Google Scholar] [CrossRef]
- Saroj, A.; Pal, S. Use of social media in crisis management: A survey. Int. J. Disaster Risk Reduct. 2020, 48, 101584. [Google Scholar] [CrossRef]
- Munir, K.; Anjum, M.S. The use of ontologies for effective knowledge modelling and information retrieval. Appl. Comput. Informatics 2018, 14, 116–126. [Google Scholar] [CrossRef]
- Goonetilleke, O.; Sellis, T.; Zhang, X.; Sathe, S. Twitter analytics: A big data management perspective. ACM Sigkdd Explor. Newsl. 2014, 16, 11–20. [Google Scholar] [CrossRef]
- Tablan, V.; Bontcheva, K.; Roberts, I.; Cunningham, H. Mímir: An open-source semantic search framework for interactive information seeking and discovery. Web Semant. Sci. Serv. Agents World Wide Web 2015, 30, 52–68. [Google Scholar] [CrossRef]
- Maynard, D.; Roberts, I.; Greenwood, M.A.; Rout, D.; Bontcheva, K. A framework for real-time semantic social media analysis. Web Semant. Sci. Serv. Agents World Wide Web 2017, 44, 75–88. [Google Scholar] [CrossRef] [Green Version]
- Aulov, O.; Halem, M. Human Sensor Networks for Improved Modeling of Natural Disasters. Proc. IEEE 2012, 100, 2812–2823. [Google Scholar] [CrossRef]
- Wang, D.; Amin, M.T.; Li, S.; Abdelzaher, T.; Kaplan, L.; Gu, S.; Pan, C.; Liu, H.; Aggarwal, C.C.; Ganti, R.; et al. Using humans as sensors: An estimation-theoretic perspective. In Proceedings of the IPSN-14 Proceedings of the 13th International Symposium on Information Processing in Sensor Networks, Berlin, Germany, 15–17 April 2014; pp. 35–46. [Google Scholar] [CrossRef] [Green Version]
- Yick, J.; Mukherjee, B.; Ghosal, D. Wireless sensor network survey. Comput. Netw. 2008, 52, 2292–2330. [Google Scholar] [CrossRef]
- Shen, H. Discussion and Analysis of the Crowdsourcing Mode of Public Participation in Emergency Management. In Proceedings of the 2015 8th International Symposium on Computational Intelligence and Design (ISCID), Hangzhou, China, 12–13 December 2015; pp. 610–613. [Google Scholar] [CrossRef]
- Immonen, A.; Pääkkönen, P.; Ovaska, E. Evaluating the Quality of Social Media Data in Big Data Architecture. IEEE Access 2015, 3, 2028–2043. [Google Scholar] [CrossRef]
- Steinberg, A.; Wukich, C.; Wu, H. Central Social Media Actors in Disaster Information Networks. Int. J. Mass Emerg. Disasters 2016, 34, 47–74. [Google Scholar]
- Yin, J.; Lampert, A.; Cameron, M.; Robinson, B.; Power, R. Using Social Media to Enhance Emergency Situation Awareness. IEEE Intell. Syst. 2012, 27, 52–59. [Google Scholar] [CrossRef]
- Rogstadius, J.; Vukovic, M.; Teixeira, C.A.; Kostakos, V.; Karapanos, E.; Laredo, J.A. CrisisTracker: Crowdsourced social media curation for disaster awareness. IBM J. Res. Dev. 2013, 57, 4:1–4:13. [Google Scholar] [CrossRef]
- Middleton, S.E.; Middleton, L.; Modafferi, S. Real-Time Crisis Mapping of Natural Disasters Using Social Media. IEEE Intell. Syst. 2014, 29, 9–17. [Google Scholar] [CrossRef] [Green Version]
- Kuriakose, S.L.; Sankar, G.; Muraleedharan, C. History of landslide susceptibility and a chorology of landslide-prone areas in the Western Ghats of Kerala, India. Environ. Geol. 2009, 57, 1553–1568. [Google Scholar] [CrossRef]
- Olteanu, A.; Castillo, C.; Diaz, F.; Vieweg, S. CrisisLex: A Lexicon for Collecting and Filtering Microblogged Communications in Crises. In Proceedings of the Eighth International Conference on Weblogs and Social Media (ICWSM), Ann Arbor, MJ, USA, 1–4 June 2014. [Google Scholar]
- To, H.; Agrawal, S.; Kim, S.H.; Shahabi, C. On Identifying Disaster-Related Tweets: Matching-based or Learning-based? In Proceedings of the 2017 IEEE Third International Conference on Multimedia Big Data (BigMM), Laguna Hills, CA, USA, 19–21 April 2017; pp. 330–337. [Google Scholar]
- Lomborg, S.; Bechmann, A. Using APIs for Data Collection on Social Media. Inf. Soc. 2014, 30, 256–265. [Google Scholar] [CrossRef] [Green Version]
- Eight, F. Data For Everyone. Available online: https://www.figure-eight.com/data-for-everyone/ (accessed on 22 January 2019).
- Imran, M.; Elbassuoni, S.; Castillo, C.; Diaz, F.; Meier, P. Practical extraction of disaster-relevant information from social media. In Proceedings of the 22nd International Conference on World Wide Web, Rio de Janeiro, Brazil, 13–17 May 2013; pp. 1021–1024. [Google Scholar]
- Takahashi, B.; Tandoc, E.C.; Carmichael, C. Communicating on Twitter during a disaster: An analysis of tweets during Typhoon Haiyan in the Philippines. Comput. Hum. Behav. 2015, 50, 392–398. [Google Scholar] [CrossRef]
- Rudra, K.; Ganguly, N.; Goyal, P.; Ghosh, S. Extracting and Summarizing Situational Information from the Twitter Social Media during Disasters. ACM Trans. Web 2018, 12. [Google Scholar] [CrossRef]
- Zamarreño-Aramendia, G.; Cristòfol, F.J.; De-San-eugenio vela, J.; Ginesta, X. Social-media analysis for disaster prevention: Forest fire in artenara and valleseco, Canary Islands. J. Open Innov. Technol. Mark. Complex. 2020, 6, 169. [Google Scholar] [CrossRef]
- Cheng, Z.; Caverlee, J.; Lee, K. You are where you tweet: A content-based approach to geo-locating twitter users. In Proceedings of the 19th ACM International Conference on Information and Knowledge Management, Toronto, ON, Canada, 26–30 October 2010; pp. 759–768. [Google Scholar]
- Li, R.; Wang, S.; Deng, H.; Wang, R.; Chang, K.C.C. Towards social user profiling: Unified and discriminative influence model for inferring home locations. In Proceedings of the 18th ACM SIGKDD International conference on Knowledge Discovery and Data Mining, Beijing, China, 12–16 August 2012; pp. 1023–1031. [Google Scholar]
- Crooks, A.; Croitoru, A.; Stefanidis, A.; Radzikowski, J. # Earthquake: Twitter as a distributed sensor system. Trans. GIS 2013, 17, 124–147. [Google Scholar]
- De Albuquerque, J.P.; Herfort, B.; Brenning, A.; Zipf, A. A geographic approach for combining social media and authoritative data towards identifying useful information for disaster management. Int. J. Geogr. Inf. Sci. 2015, 29, 667–689. [Google Scholar] [CrossRef] [Green Version]
- Guan, X.; Chen, C. Using social media data to understand and assess disasters. Nat. Hazards 2014, 74, 837–850. [Google Scholar] [CrossRef]
- Chae, J.; Thom, D.; Jang, Y.; Kim, S.; Ertl, T.; Ebert, D.S. Public behavior response analysis in disaster events utilizing visual analytics of microblog data. Comput. Graph. 2014, 38, 51–60. [Google Scholar] [CrossRef]
- Kryvasheyeu, Y.; Chen, H.; Obradovich, N.; Moro, E.; Van Hentenryck, P.; Fowler, J.; Cebrian, M. Rapid assessment of disaster damage using social media activity. Sci. Adv. 2016, 2, e1500779. [Google Scholar] [CrossRef] [PubMed] [Green Version]
- Yin, J.; Karimi, S.; Lampert, A.; Cameron, M.; Robinson, B.; Power, R. Using social media to enhance emergency situation awareness. In Proceedings of the Twenty-Fourth International Joint Conference on Artificial Intelligence, Buenos Aires, Argentina, 25–31 July 2015. [Google Scholar]
- Wang, Z.; Ye, X.; Tsou, M.H. Spatial, temporal, and content analysis of Twitter for wildfire hazards. Nat. Hazards 2016, 83, 523–540. [Google Scholar] [CrossRef]
- Granell, C.; Ostermann, F.O. Beyond data collection: Objectives and methods of research using VGI and geo-social media for disaster management. Comput. Environ. Urban Syst. 2016, 59, 231–243. [Google Scholar] [CrossRef]
- Huang, Q.; Xiao, Y. Geographic situational awareness: Mining tweets for disaster preparedness, emergency response, impact, and recovery. ISPRS Int. J. Geo. Inf. 2015, 4, 1549–1568. [Google Scholar] [CrossRef] [Green Version]
- kinsta. Wild and Interesting Facebook Statistics and Facts. 2020. Available online: https://kinsta.com/blog/facebook-statistics/ (accessed on 10 June 2020).
- Cunningham, H.; Tablan, V.; Roberts, A.; Bontcheva, K. Getting more out of biomedical documents with GATE’s full lifecycle open source text analytics. PLoS Comput. Biol. 2013, 9, e1002854. [Google Scholar] [CrossRef] [PubMed] [Green Version]
- GATE. The GATE Cloud Paralleliser (GCP). Available online: https://gate.ac.uk/gcp/ (accessed on 10 September 2020).
- Cunningham, H.; Tablan, V.; Roberts, I.; Greenwood, M.A.; Aswani, N. Information Extraction and Semantic Annotation for Multi-Paradigm Information Management. In Current Challenges in Patent Information Retrieval; Lupu, M., Mayer, K., Tait, J., Trippe, A.J., Eds.; Springer: Berlin/Heidelberg, Germany, 2011; pp. 307–327. [Google Scholar] [CrossRef]
- Kim, Y.; Huang, J.; Emery, S. Garbage in, garbage out: Data collection, quality assessment and reporting standards for social media data use in health research, infodemiology and digital disease detection. J. Med Internet Res. 2016, 18, e41. [Google Scholar] [CrossRef] [PubMed]
- Kar, S.; Al-Olimat, H.S.; Thirunarayan, K.; Shalin, V.; Sheth, A.; Parthasarathy, S. D-record: Disaster Response and Relief Coordination Pipeline. In Proceedings of the ACM SIGSPATIAL International Workshop on Advances in Resilient and Intelligent Cities (ARIC) 2018, Seattle, WA, USA, 6–9 November 2018. [Google Scholar]
- Wang, S.; Anselin, L.; Bhaduri, B.; Crosby, C.; Goodchild, M.F.; Liu, Y.; Nyerges, T.L. CyberGIS software: A synthetic review and integration roadmap. Int. J. Geogr. Inf. Sci. 2013, 27, 2122–2145. [Google Scholar] [CrossRef]
- Wang, S. A CyberGIS framework for the synthesis of cyberinfrastructure, GIS, and spatial analysis. Ann. Assoc. Am. Geogr. 2010, 100, 535–557. [Google Scholar] [CrossRef]
- Slamet, C.; Rahman, A.; Sutedi, A.; Darmalaksana, W.; Ramdhani, M.A.; Maylawati, D.S. Social Media-Based Identifier for Natural Disaster. In Proceedings of the IOP Conference Series: Materials Science and Engineering 2018, Kuala Lumpur, Malaysia, 13–14 August 2018. [Google Scholar]
- Yates, D.; Paquette, S. Emergency knowledge management and social media technologies: A case study of the 2010 Haitian earthquake. Int. J. Inf. Manag. 2010, 31, 6–13. [Google Scholar] [CrossRef]
- Amato, F.; Moscato, V.; Picariello, A.; Sperli’ì, G. Extreme events management using multimedia social networks. Future Gener. Comput. Syst. 2019, 94, 444–452. [Google Scholar] [CrossRef]
- Amato, F.; Moscato, V.; Picariello, A.; Sperlí, G. Multimedia Social Network Modeling: A Proposal. In Proceedings of the 2016 IEEE Tenth International Conference on Semantic Computing (ICSC), Laguna Hills, CA, USA, 4–6 February 2016; pp. 448–453. [Google Scholar]
- Amato, F.; Moscato, V.; Picariello, A.; Sperlí, G. Diffusion Algorithms in Multimedia Social Networks: A Preliminary Model. In Proceedings of the 2017 IEEE/ACM International Conference on Advances in Social Networks Analysis and Mining, Sydney, Australia, 31 July–3 August 2017; pp. 844–851. [Google Scholar]
- Derczynski, L.; Maynard, D.; Rizzo, G.; van Erp, M.; Gorrell, G.; Troncy, R.; Petrak, J.; Bontcheva, K. Analysis of named entity recognition and linking for tweets. Inf. Process. Manag. 2015, 51, 32–49. [Google Scholar] [CrossRef]
- Sakaki, T.; Okazaki, M.; Matsuo, Y. Tweet analysis for real-time event detection and earthquake reporting system development. IEEE Trans. Knowl. Data Eng. 2013, 25, 919–931. [Google Scholar] [CrossRef]
- Chae, J.; Thom, D.; Bosch, H.; Jang, Y.; Maciejewski, R.; Ebert, D.S.; Ertl, T. Spatiotemporal social media analytics for abnormal event detection and examination using seasonal-trend decomposition. In Proceedings of the Visual Analytics Science and Technology (VAST), Seattle, WA, USA, 14–19 October 2012; pp. 143–152. [Google Scholar]
- Reuter, T.; Cimiano, P. Event-based classification of social media streams. In Proceedings of the 2nd ACM International Conference on Multimedia Retrieval, Hong Kong, China, 1 June 2012; p. 22. [Google Scholar]
- Becker, H.; Naaman, M.; Gravano, L. Learning similarity metrics for event identification in social media. In Proceedings of the Third ACM International Conference on Web Search and Data Mining, New York, NY, USA, 3–6 February 2010; pp. 291–300. [Google Scholar]
- Adam, N.R.; Shafiq, B.; Staffin, R. Spatial computing and social media in the context of disaster management. IEEE Intell. Syst. 2012, 27, 90–96. [Google Scholar] [CrossRef]
- Xu, Z.; Zhang, H.; Sugumaran, V.; Choo, K.K.R.; Mei, L.; Zhu, Y. Participatory sensing-based semantic and spatial analysis of urban emergency events using mobile social media. EURASIP J. Wirel. Commun. Netw. 2016, 2016, 44. [Google Scholar] [CrossRef]
- Albtoush, R.; Dobrescu, R.; Ionescou, F. A hierarchical model for emergency management systems. Univ. Politeh. Buchar. Sci. Bull. Ser. Electr. Eng. 2011, 73, 53–62. [Google Scholar]
- EM-DAT. EM-DAT the International Disaster Database. Available online: https://www.emdat.be/classification (accessed on 8 May 2020).
| Publisher’s Note: MDPI stays neutral with regard to jurisdictional claims in published maps and institutional affiliations. |
© 2021 by the authors. Licensee MDPI, Basel, Switzerland. This article is an open access article distributed under the terms and conditions of the Creative Commons Attribution (CC BY) license (http://creativecommons.org/licenses/by/4.0/).


 ,
, 


