
RecPOID: POI Recommendation with Friendship Aware and Deep CNN


1
Department of Computer Engineering, Mashhad Branch, Islamic Azad University, Mashhad 9187147578, Iran
2
Institute of Functional Interfaces, Karlsruhe Institute of Technology (KIT), 76344 Karlsruhe, Germany
*
Author to whom correspondence should be addressed.
Future Internet 2021, 13(3), 79; https://0-doi-org.brum.beds.ac.uk/10.3390/fi13030079
Submission received: 9 February 2021
/
Revised: 11 March 2021
/
Accepted: 17 March 2021
/
Published: 22 March 2021
(This article belongs to the Special Issue Social Networks Analysis and Mining)
Abstract
:In location-based social networks (LBSNs), exploit several key features of points-of-interest (POIs) and users on precise POI recommendation be significant. In this work, a novel POI recommendation pipeline based on the convolutional neural network named RecPOID is proposed, which can recommend an accurate sequence of top-k POIs and considers only the effect of the most similar pattern friendship rather than all user’s friendship. We use the fuzzy c-mean clustering method to find the similarity. Temporal and spatial features of similar friends are fed to our Deep CNN model. The 10-layer convolutional neural network can predict longitude and latitude and the Id of the next proper locations; after that, based on the shortest time distance from a similar pattern’s friendship, select the smallest distance locations. The proposed structure uses six features, including user’s ID, month, day, hour, minute, and second of visiting time by each user as inputs. RecPOID based on two accessible LBSNs datasets is evaluated. Experimental outcomes illustrate considering most similar friendship could improve the accuracy of recommendations and the proposed RecPOID for POI recommendation outperforms state-of-the-art approaches.
1. Introduction
As a result of the explosive growth of smartphones, location-based social networks (LBSNs) such as Yelp and location-based service providers like Foursquare are popular. By 2020, Foursquare has over 55 million users per month and over three billion monthly visits to various locations worldwide; the Swarm app has nine million check-ins per day. LBSN also allows users to share information and find friends. These Location-based social networks collected users’ check-in data such as users’ tips at the location and visited locations’ geographical information (longitude and latitude) [1,2]. To increase the user experience in LBSNs, from mining social relationships and users’ check-in history, point-of-interest (POI) recommendation is recommended, which advocates unknown places on users for visiting.
POI recommendation a critical task that will create the most significant results in LBSNs, which allows users to explore new favorite places in the LBSNs. POI recommendation usually explores venue information such as users’ social relationships and categories to recommend a list of POIs where users most probably visit locations that had been checked-in by their friends. POI recommendation improves a user’s interest in LBSN service and profits advertising agencies through planning, launching, and analyzing a successful marketing campaign. Specifically, users can discover nearby downtown shopping malls and restaurants in Foursquare. The quality of LBSN services and benefits both POI owners and users can be greatly improved by personalized POI recommendations. For instance, users can discover POIs that they potentially favor [3,4,5].
In former studies, has been shown that POI recommendation is meaningfully controlled by three significant items: friend importance [6], check-in correlation [7], and user preference [8]. Friend importance appraises on the user’ friend influence to go and visit a location. User preference outlines the similarity between potential willingness and users to the specific POIs in a region of interest. Common interests among users lead to a potential possibility to visit the same POI. The behavior of users is correlated based on the POIs and the check-in. For instance, users tend to travel several scenic spots or go to nearby locations with short distances. Previous research reports one of these factors or does not adequately describe them. In POI recommendation systems, the friend’s importance is a vital issue because human beings are commonly living together as social and groups. The user check-in activities of his friends are very influential [8]. However, most recent studies in location-based recommendation systems consider all social friends, although the survey of check-in pattern’s most similar friendship is important to accurate prediction and recommendation according to the user’s interests [9].
In recent years, there has been a constant rise in utilizing the deep learning pipeline to artificial intelligence tasks such as POI recommendation, natural language processing, and also computer vision, where key features can be extracted deeply and effectively [10,11,12,13]. Deep learning is a representation-learning approach that can learn from data representations with multiple simple modules. Each module explores higher-level representations of input (former module) from lower-level data [14,15]. Hence, different deep learning structures are very good at extracting intrinsic high-level features beneficial for recommendation tasks. However, few studies have been proposed on location-based recommender systems with the aid of artificial intelligence and deep learning that incorporate key factors such as exploring the patterns of check-in behaviors and the impact of most similar friendships and user preferences.
Yin et al. [16] have designed a Spatial-Aware Hierarchical Collaborative Deep Learning technique (SH-CDL) used to spatial-aware personal preferences of hierarchically additive representation learning and heterogeneous features. A new POI recommendation method is employed by [9], capable of mine information in real-time. Convolutional Neural Networks (CNN) are used for mining POI textual information and learn their inherent representation. To improve accuracy, they add real-time POI embedding in the matrix factorization approach. Doan et al. [6] have presented a new modeling user check-in behavior based on focusing on neighborhood competition and area attraction. The visitation through the attractiveness of the area and neighborhood competition (VAN) method has been implemented by incorporating neighborhood competition and area attraction factors. He et al. [17] have implemented a POI recommendation model to combine time items, geographical factors, also social factors. Their approach is based on the linear weighting and cascading combination. A deep neural network (DNN) was suggested by [5] to integrate numerous attributes in LBSNs and then learn how they affect user behavior. Moreover, to reduce data sparsity within POI recommendation systems, categorical, geographical, and co-visiting influences have been exploited. The purpose of the study by Zhou et al. [18] is to obtain a predictive score for each user of any POI. This overall score is the individual prediction score by factors such as user preference modeling, importance of friend modeling, and check-in correlation modeling. Wang et al. [19] By supporting information on location-based social networks, consider the three factors of visited venues, the user’s geographical location, and social influence. For prediction and recommendation to visit the new POI, they used characteristics such as the distance proximity of previously visited locations by users and the impact of social relationships. The main function of the research Zhang et al. [20] is to investigate the patterns of the check-in orders of all clients and to consider the consecutive POIs visited dynamically. This work predicts the probability of the sequence of visiting locations according to the geographical location and social scores.
Due to the importance of recommending POI to users in LBSNs and predicting the user’s next possible locations with higher accuracy, and suggesting places of interest to the user,
and completing the shortcomings of past methods, this research has proposed a new deep learning structure named RecPOID to recommend top-k POIs to each user. RecPOID
is a combination of convolutional neural network and c-mean fuzzy clustering method, which first identifies the most similar friendship relying on the check-in behavioral pattern of user friends and second, CNN’s proposed model based on six input features including user’s ID, month, day, hour, minute, and second predicts the next POI locations to visit, depending on the current position and time of the user. Finally, to increase the proposed POI accuracy, the shortest time distance is measured with a similar friendship check-in pattern, and the next location is recommended to the user.
The remaining document is arranged as follows: A POI clustering approach is explained in Section 2.1. Section 2.2 describes the convolutional neural network architecture and in Section 2.3, the proposed CNN model is represented. The results and final remarks are outlined in Section 3.
2. Materials and Methods
2.1. Clustering the POI’s
Clustering is an unsupervised algorithm used for dividing/splitting wherever each cluster has the most similar features [21,22]. Fuzzy c-means (FCM) iteratively groups the pixels together based on specific conditions such as variations in the magnitude, time, and place. In this method, the data is split into the pre-defined clusters (n clusters) based on a priori knowledge or computed other available information. Every particular point in the dataset (location in our dataset) is a member of at least two clusters with unlike weights. Moreover, the clustering approach can uncover concealed information or previously undetected relationships between input data [23,24].
In non-fuzzy clustering, each location in the data only belongs to a cluster. In contrast, in the FCM technique, locations near the center of a cluster are more dependent on or are in that cluster, while locations with a higher distance from the cluster center have a lower dependency on the cluster. In this fuzzy technique, every section’s cluster investigated the membership level of every location by repetitive updating. The following objective function in this procedure is accomplished by minimizing [21]:
where βki implies membership value of ith location regarding the C-th cluster, N indicates the total of visited locations by each user U, k shows the number of clusters, centerc demonstrates the center of C-th cluster, and the locationi indicates the i-th location of U.
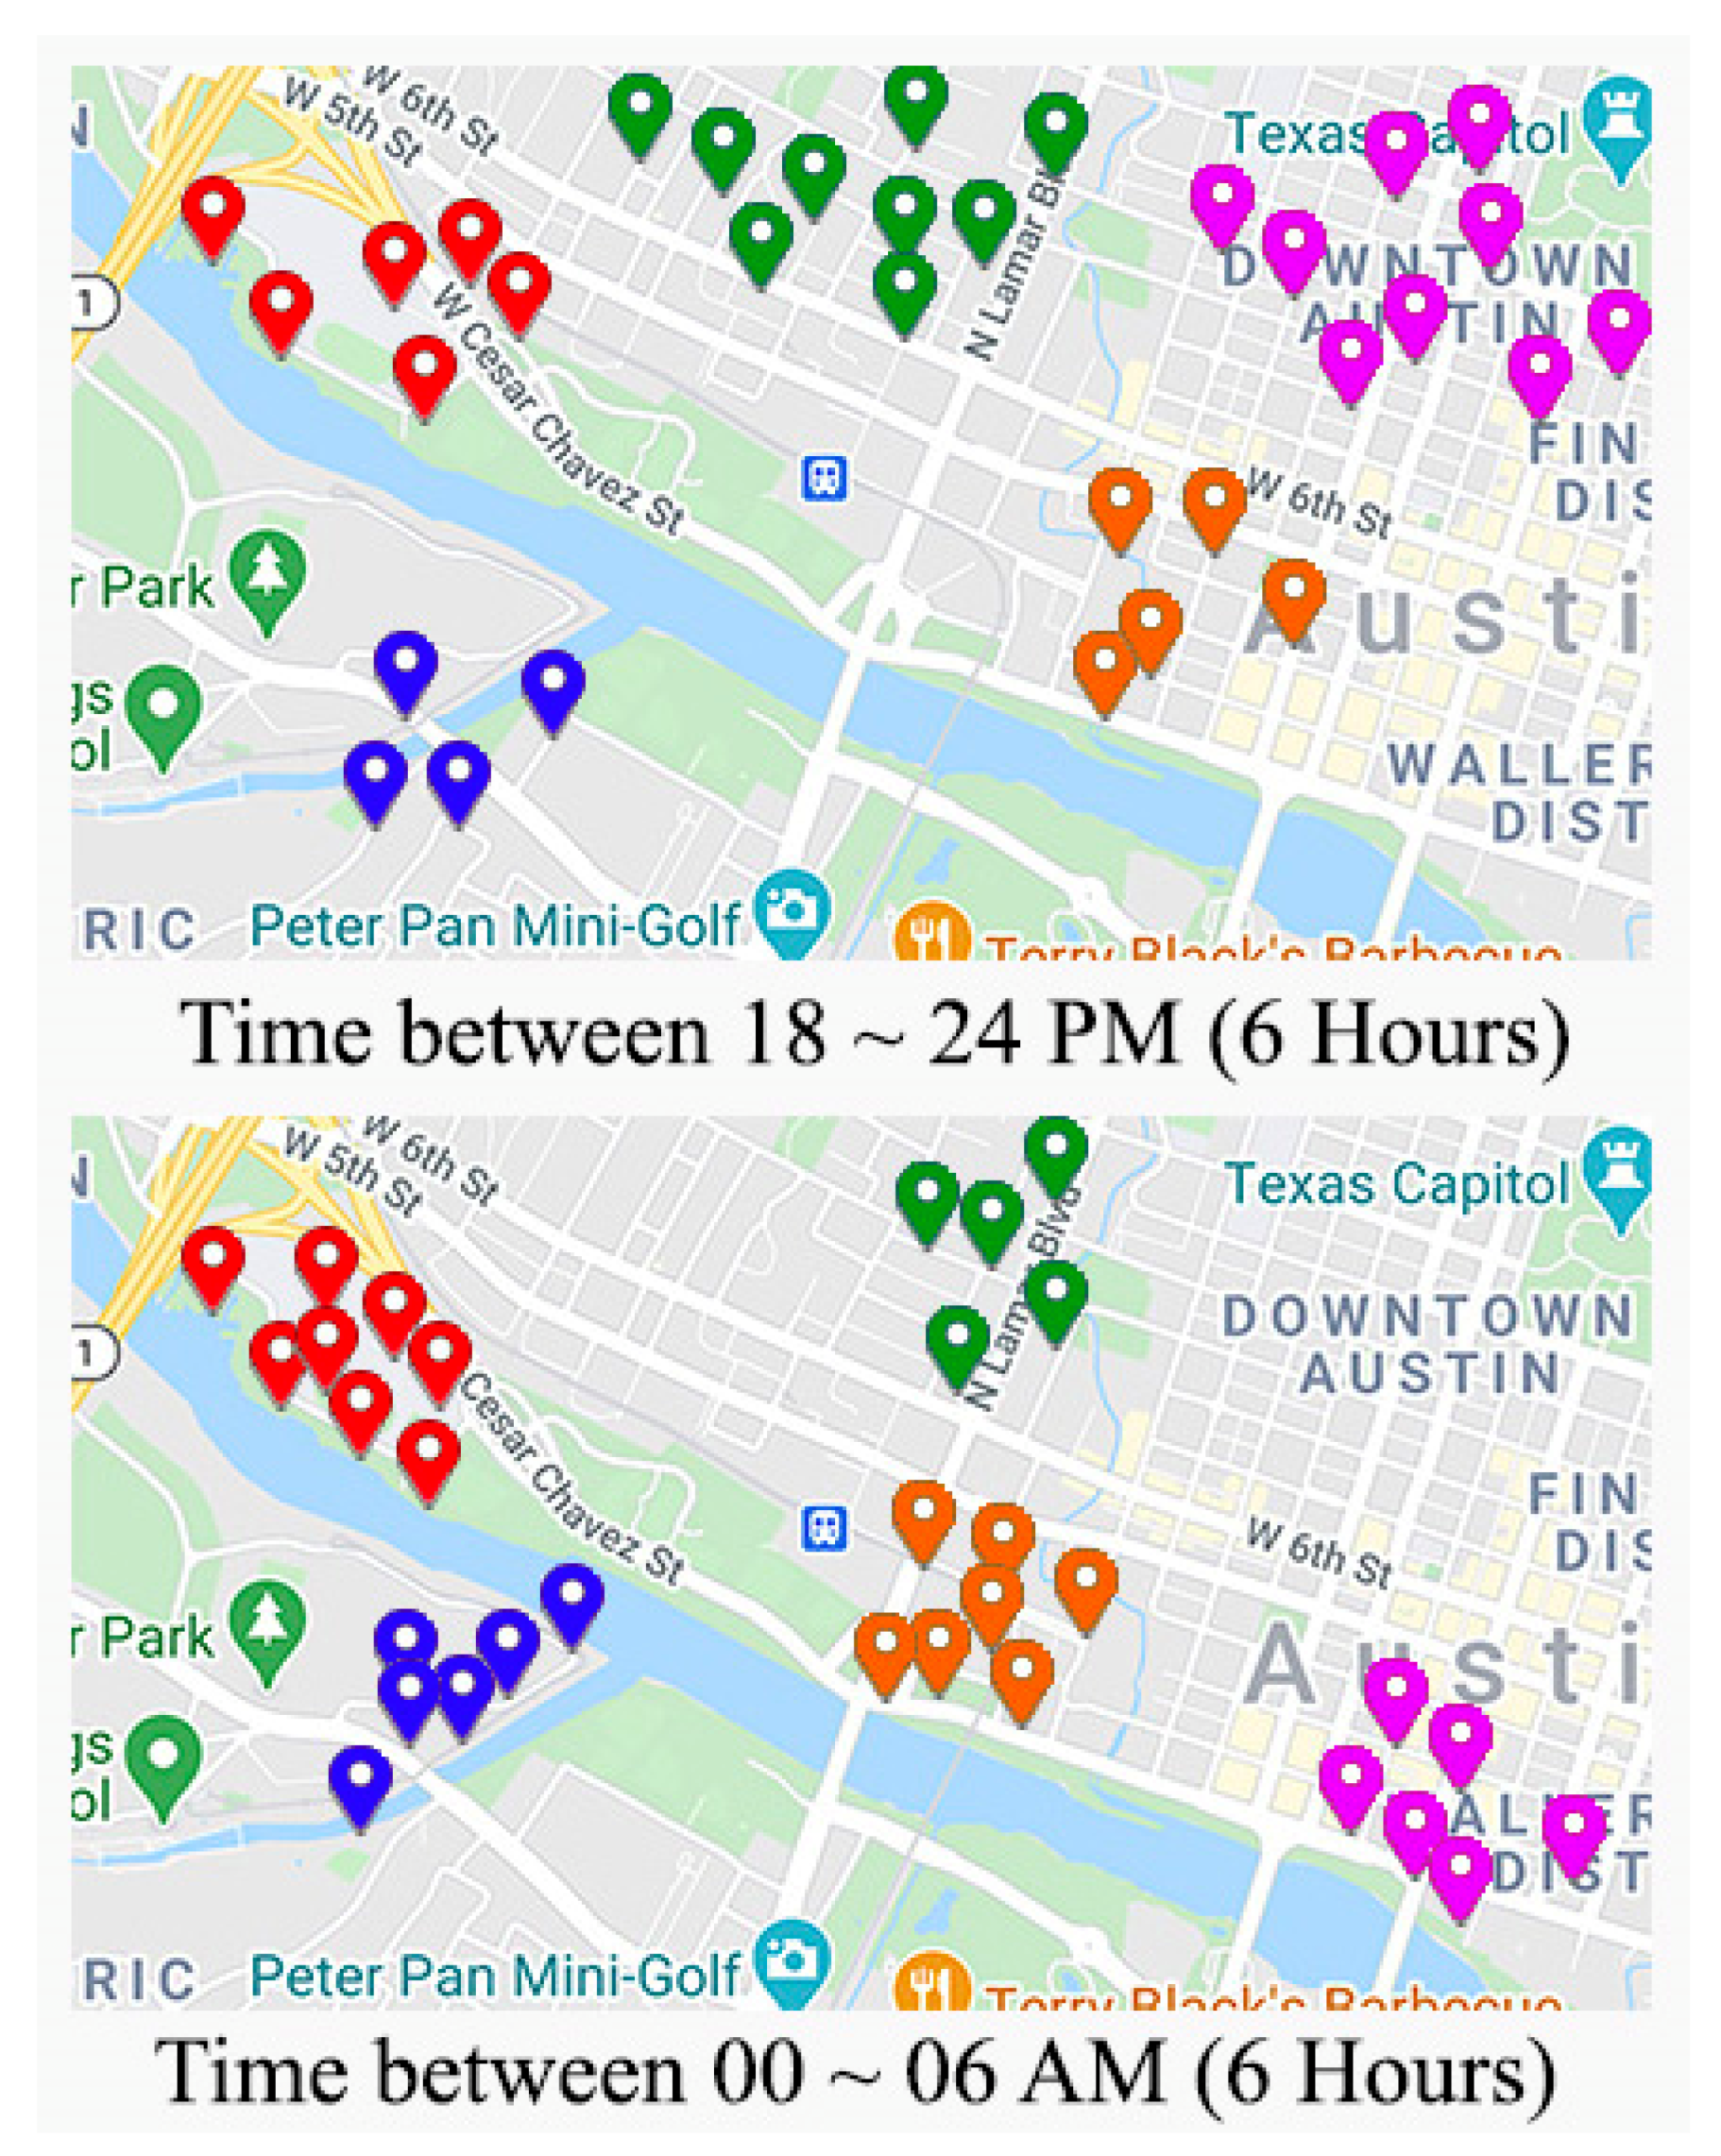
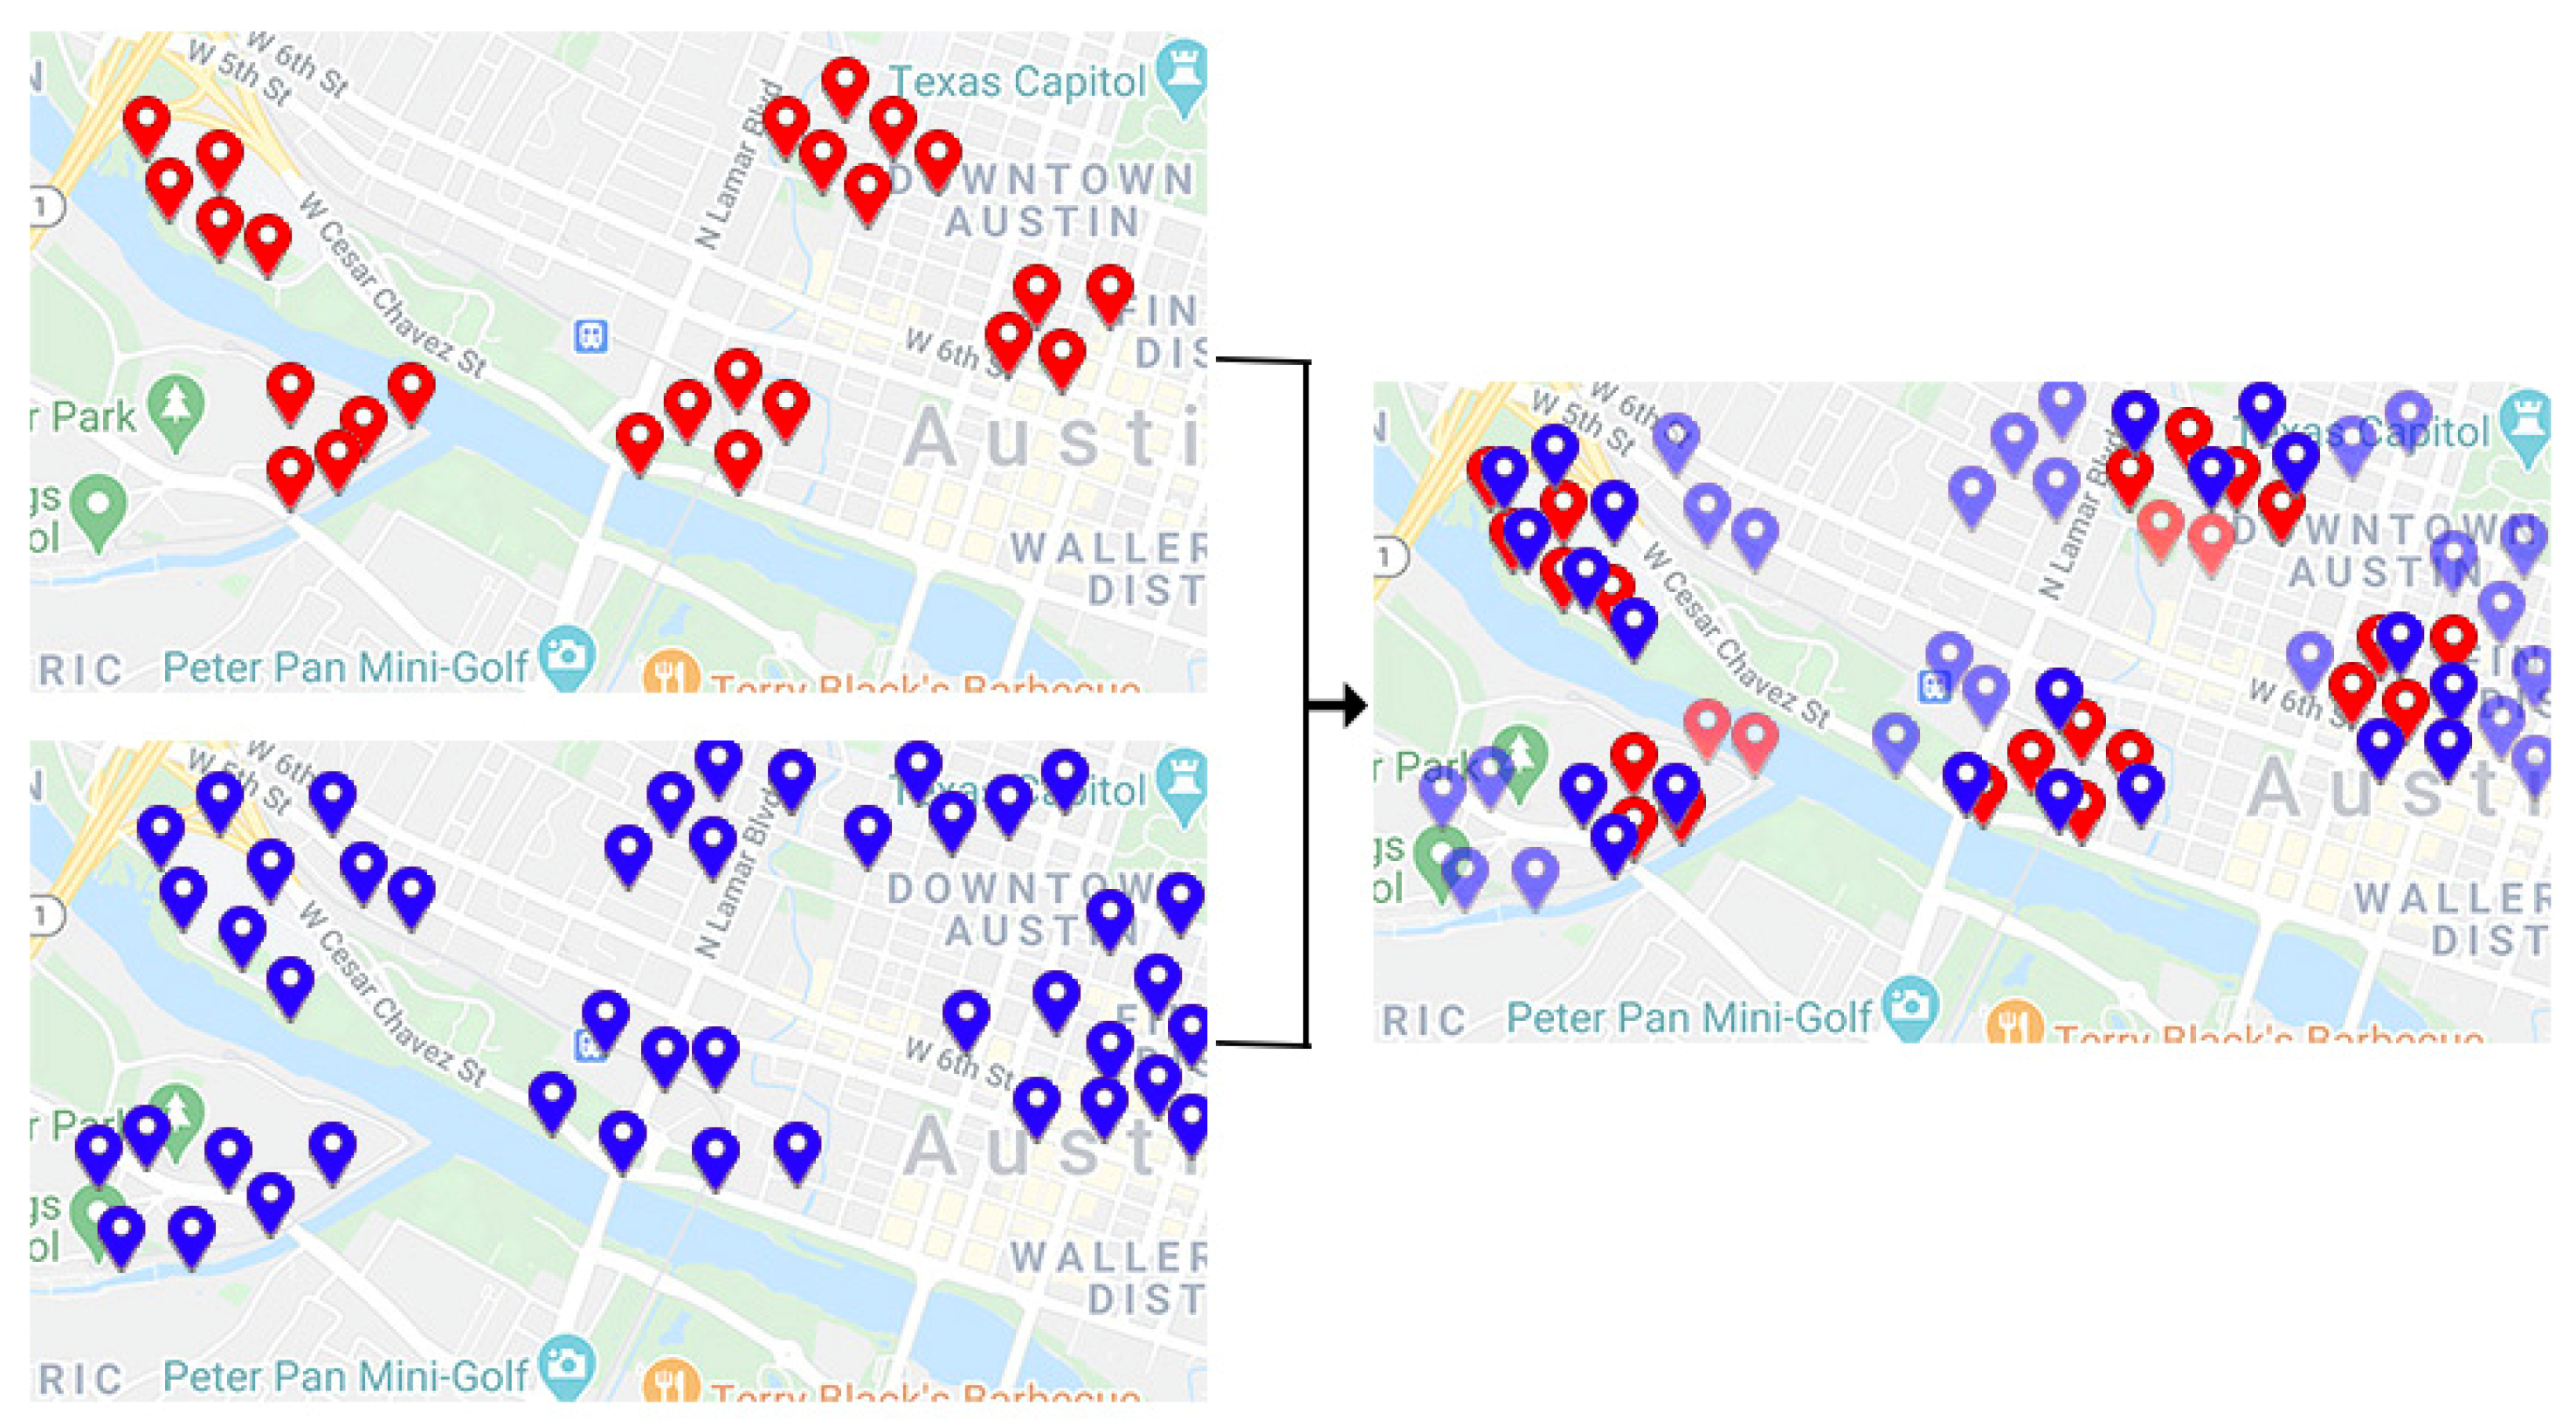
In our proposed article, the time span is divided into 4 spans (00~06, 06:01~12, 12:01~18, 18:01~24), and each user and its corresponding friendship is selected. In other words, all the visited locations are categorized based on the visiting time (Figure 1). Due to applying such discrimination of the visited sites by the time among all the user friendships, an increase in predicting the proper location in the ultimate result can be obtained. Secondly, as is shown in Figure 2, each user’s whole locations in each span are clustered into 5 clusters. We concluded that five clusters could obtain the best results in our datasets based on the trial and error approach.
Next, the percentage of the overlapping between the user’s clusters and friendship’s clusters has been calculated for each user. Lastly, only 10% of the most overlapping clusters are selected. By doing this strategy along with other following algorithms, we are trying to achieve greater precision of the final preference locations.
2.2. Convolutional Neural Network
Pattern recognition means the science of discriminating between different computer patterns and is closely associated with artificial intelligence (AI) machine learning (ML). It is utilized in the issue of computer vision for innumerable applications like data mining, recommendation systems, and biological imaging [25,26].
In today’s pattern recognition techniques and their applications, the convolutional neural network (CNN) models indicate an enormous data analysis breakthrough. The CNN architectures mainly exploit the relation between some features or textural content. They can be found at the core of everything from data mining to predict visiting new places by people [27].
This network, based on neurons, has a grid-like topology that qualifies us to efficiently exploit characteristics and key information from the POIs and friendships by passing through a series of convolution layers with the pre-defined size kernels. This neuron-based model encompasses many trainable weights and biases and is employed for feature extraction, classification, and prediction. These trainable weights and biases can be applied randomly at the start of training. The key and vital part of any convolutional neural network (CNN) are outlined as the convolutional layer that computes dot product among the filters (two-dimensional arrays for image and one-dimensional in our work) and input data (such as POIs and friendships) [28,29,30,31]. Regularly, the first layer of CNN begins with a convolution layer and plays a vital role in extracting input data features [27,32].
Moreover, the convolutional layers can successfully obtain spatial and temporal dependencies. The algebraic operation which performs a dot product between each filter’s values and related input data can be outlined as a convolutional operation [33]. The filter (kernel) with any pre-defined size is a matrix that requires having as depth as input data. For instance, if the size of the input data is 6 × 1 × 3, kernel size has to be ~ × ~ × 3, respectively, where ~ is an odd number [27,28]. It should be noted that the first convolutional layers are responsible for extract the low-level features, whereas the deeper convolutional layer detects the higher-level features [29].
The batch normalization strategy is a useful approach when we are dealing with very deep layers that scaling. It standardizes the output of each layer to an input of the next layer for each mini-batch. Rescaling data accomplish this standardization process to have a standard deviation and a mean of zero of one.
Since the vanishing gradient effect causes the difficulty, an arbitrary activation function is applied based on our input data for each feature map that improves the computational efficiency by diminishing sparsity [34,35]. Usually, the batch normalization or convolution layer’s output is fed to an activation layer [30].
In our proposed study, the ReLU activation function based on the backpropagation of errors has been applied to change the negative numbers to zero values. The Equation (4) outlines the ReLU activation function [34].
where x, y in the ReLU activation function indicates the input and the output of it, respectively.
A Fully-Connected layer (FC) has also been utilized for achieving more robust high-level features in the input data. In this layer, each node, along with its corresponding learnable weight, multiplies to each input vector [28]. Before applying the result of the convolution or activation layer to the fully connected layer, all the features need to be flattened into one vertical vector [36,37].
In contrast to the convolutional layers, fully-connected layers comprise more parameters that lead to them being harder to train [38]. The last layer for prediction in the CNN architecture is the regression layer that makes the relationship between an ideal target and one or more independent features (the input data) [30,39].
Training a CNN means that the model has to be learned the best weights and biases in each layer for minimizing a defined cost function. The procedure of the minimization of a cost function is executed repetitively, utilizing a gradient descent technique that includes the computation of fractional derivatives from the cost function [38].
2.3. Proposed CNN Architecture
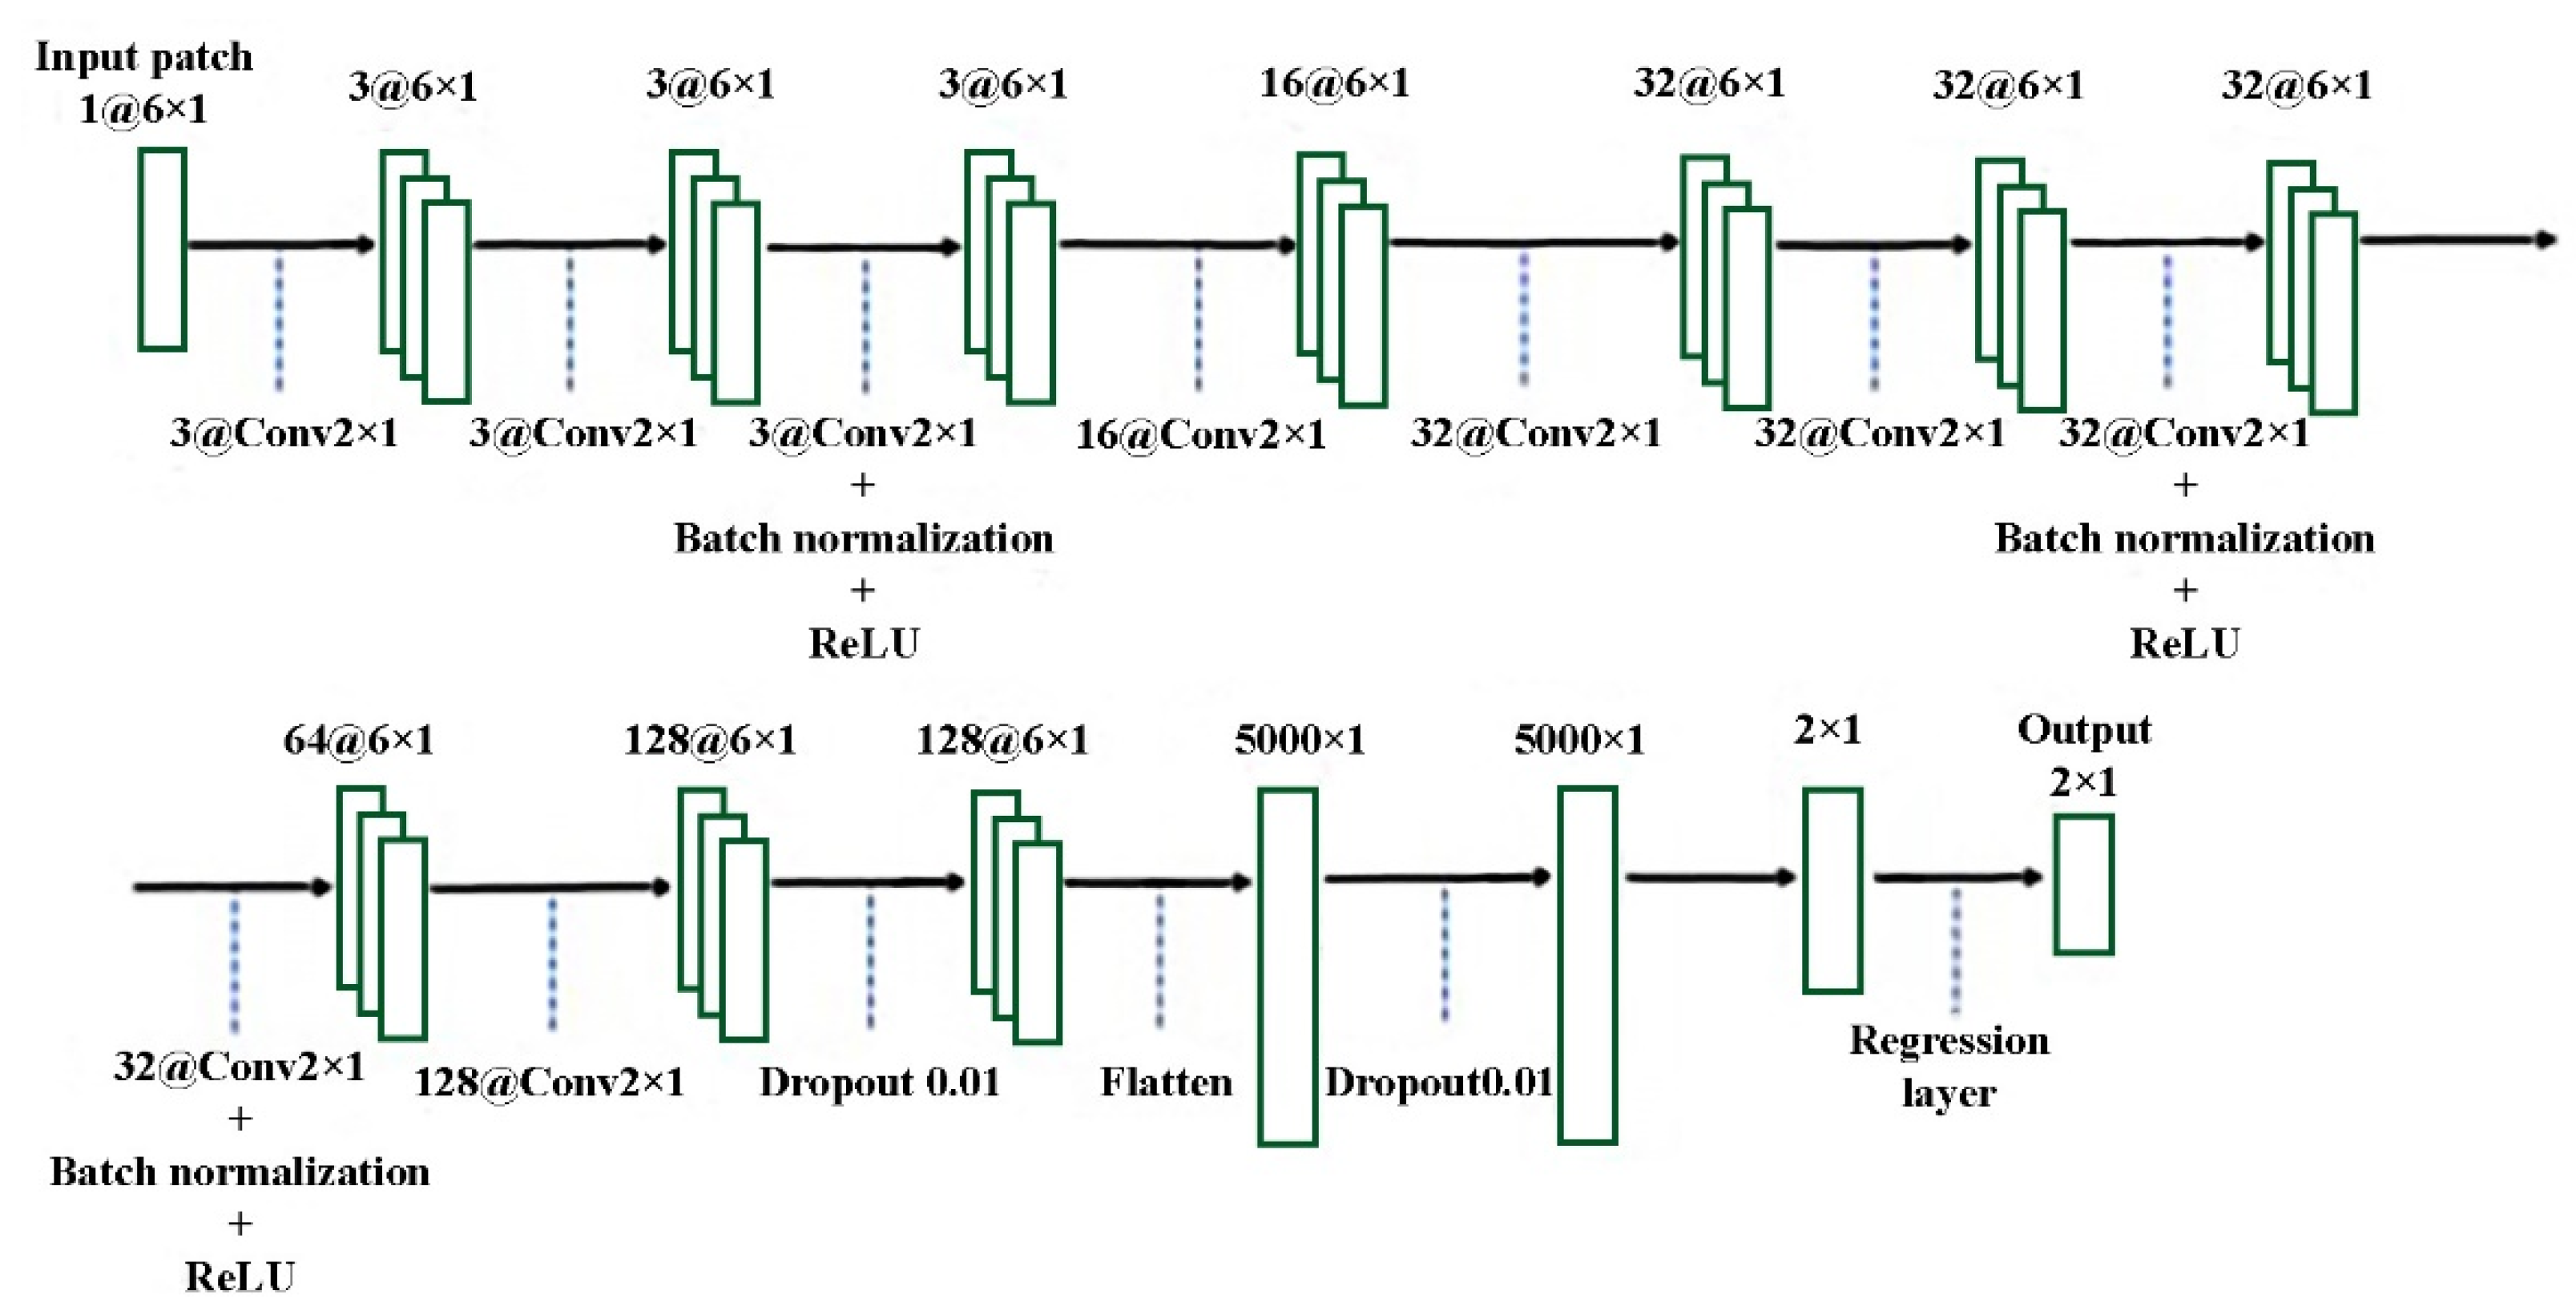
As outlined in the former part, CNN models can exploit key information from an input matrix. So, we proposed a new framework in this study based on all visited sites and related time. The proposed RecPOID framework is illustrated in Figure 3. Our implemented CNN model. Our approach uses six input feature maps including user’s ID, month, day, hour, minute, and second of the visiting moment by each user. As is clearly shown in Figure 4, there are 10 convolutional layers with a different number of the filter. We applied three filters with the size of the 2 × 1 in the three first layers. We use the batch normalization layer to improve the training and normalize the data values. Its output fed to an activation layer, as mentioned in Section 2.2, the ReLU activation function is applied. The next layer has 16 filter banks to extract features, followed by three layers and their corresponding 32 filters. We utilize the Batch normalization layer and the activation layer again. In the next layer, there are 64 filters with the same dimensions. The batch normalization layer and ReLU function are used to keep the output values within the normal range and prevent the overfitting effect. The final convolution layers include two layers of 128 filters that are followed by two flattened layers. Moreover, to decrease the overfitting effect using control of the fitting process, we added two dropout layers [40] with a 0.01% dropout probability into our CNN model to make neurons independently trained and less dependent on other neurons. The value of 0.01 is based on trial-and-error. Two fully connected layers are then applied to achieve robust high-level features. Finally, because the result is continuous, we utilize the regression layer; the regression layer undertakes the responsibility of producing two values that indicate the predicted longitude and location of the recommended locations relying on the training data. The number of epochs for the training process is 800, and the learning rate is 0.01. Algorithm 1 summarizes the detailed steps of the RecPOID algorithm.
| Algorithm 1 RecPOID algorithm |
| Input: user U, social relation G, check-in matrix R, DateTime T (month, day, hour, minute, and second), location L (ID, latitude and longitude) |
| Output: top-K POIs for each user u based on friendship |
| K _cluster = 5 |
| Epochs = 800 |
| Learning rate = 0.01 |
| Dropout probability = 0.01% |
| 1. Identify each user’s friends |
| 2. Divide the time span into 4 spans (00–06, 06:01–12, 12:01–18, 18:01–24) |
| 3. part_time = (0.00–06.00, 6.01–12.00, 12.01,18.00, 18.01–24) |
| 4. for i = 1: size(part_time) |
| 5. clustering users and their friendship based on the fuzzy c-means algorithm |
| 6. selecting 10 percent of the most overlapping between the user’s clusters and friendship clusters |
| 7. end |
| 8. Utilized proposed CNN architecture |
| 9. return predicted locations |
| 10. error = calculate the distance between the predicted location and the user’s friendship locations |
| 11. if error = 0 then |
| 12. return top-k POIs |
| 13. else |
| 14. Measure the shortest time distance with a similar friendship check-in pattern |
| 15. return top-k POIs |
| 16. end |
In our proposed model, due to the network layers and their parameters, there is no need for the data to be in a sequence. The user’s current position is considered, and it is unnecessary to know where he was a few minutes ago. In the training phase, it received the essential training and randomly arranged the data.
These two outputs give us not exactly the proposed location, so in this step, we need to calculate the distance between this predicted location and all possible locations in the vicinity area based on top-related friendship investigated in the 2.1 steps. It means that to calculate the distance, there are only those locations related to the same user and other selected users based on the friendship. The proposed architecture’s key idea is to categorize a bunch of clients with analogous user preferences to this target user with similar past preferences.
Our CNN structure used the RMSE method [41] to minimize the loss in Equation 4, which computes the discrepancy between actual and estimated (predicted) locations.
where specifies the number from predicted or real value (longitude and location).
Our proposed method’s general architecture to recommend appropriate and accurate POIs to users illustrates in Figure 4.
2.4. Datasets
Spatial analysis has been performed on users’ check-ins on public datasets Yelp and Gowalla, encompassing many check-in information about geography. So, the probability of Point-Of-Interest co-occurrence of a user has been explored through investigating the distance among pairs of check-ins. Check-in records have a great relation to user implicit preference regarding a user for a place, which can be considered common interests. We can investigate the correlation from check-ins by geographical proximity. As mentioned in [42], user check-in behaviors demonstrate a phenomenon of geographical clustering that is conducive for recommending POI. Social relations as Social friends are user–user relationships and are expected to share routine choices of interest. It is a significant feature in POI recommendations. Table 1 described more information on these two datasets.
Yelp’s website, established in 2004, is a famous review website of merchants and covers numerous merchants, like hotels, shopping centers, also restaurants. Users on Yelp check-in the varied merchants, write comments, and rate on these viewed places. Yelp dataset challenge round 7 (access date: February 2016) [43], contains of 30,887 users, 860,888 reviews, 265,533 social relations and 18,995 POIs. The Gowalla-related dataset is a location-based system that allows clients to share experiences about what they hear and see from family also friends. Gowalla dataset (access date: February 2009–October 2010), includes of 18,737 users, 1,278,274 reviews, 86,985 social relations and 32,510 POIs.
2.5. Performance Metrics
The following four measures were calculated by matching each predicted location’s result with its corresponding true locations to order top-K POIs of every user accurately. The considerable accuracy from RecPOID was assessed using Precision, and Recall that metrics are outlined as follows [18]:
where outlines the top-K recommended Point-of-Interests in test samples relevant for distinct strategies, demonstrate the POIs examined by the ith user in training samples. K shows the varied number (5 to 50) of recommended Point-Of-Interests to analyze models’ effectiveness. Recall@K means that fraction from surveyed POIs with the intended client is fruitfully recommended, while Precision@K means a fraction from top-K successfully recommended Point-Of-Interests to the intended user.
Additionally, the two criteria to assess the proposed model’s accuracy are sensitivity and specificity [31]. Sensitivity is a measure that indicates the probability that a relevant POI is recommended. It is the ratio of correct and relevant recommended POIs to the total number of relevant locations. Our goal is to have a high model sensitivity to suggest more related POIs to users. Specificity is a fraction of the prediction POIs that the user is not likely to see and is not suggested to the target user by the model. It is calculated as the ratio of locations not properly suggested that are really irrelevant, to the total number of irrelevant POIs. This is the probability that an irrelevant POI is not truly recommended.
3. Result and Discussion
3.1. Experimental Results
We implemented RecPOID in Matlab 2019b and ran the experiments on a computer with Core i7- 3.4 GHz, a GTX 1050 Ti GPU, and 8 Gigabytes of RAM. In this article, three state-of-art algorithms are investigated to validate the performance of the recommended RecPOID.
UFC [18]: UFC is a combination algorithm that integrates user preference, check-in correlation, and friend importance. UFC incorporates three essential items, and with the collaboration filtering technique, user preference is personalized.
LFBCA [19]: LFBCA investigates for each user the influence of social relationships for recommends POIs. To characterize the check-in relation, locations and users are linked in the graph. The likelihood of each client to the place is described on a graph-based method.
LORE [20]: For analyzing the impact of the sequential influence for location recommendations, the dynamic location–location transition graph by additive Markov chain is developed by LORE [20] for incrementally mining sequential patterns from user check-in sequences.
Our research’s main goal is to get an accurate sequence of top-K point-of-interests for each client. We investigate the performance from dissimilar approaches over popular datasets Yelp and Gowalla concerning the K from the suggested point-of-interests by the maximum recommendation value. The outcomes of our prediction structure on the Yelp dataset are evaluated and reported in Figure 5.
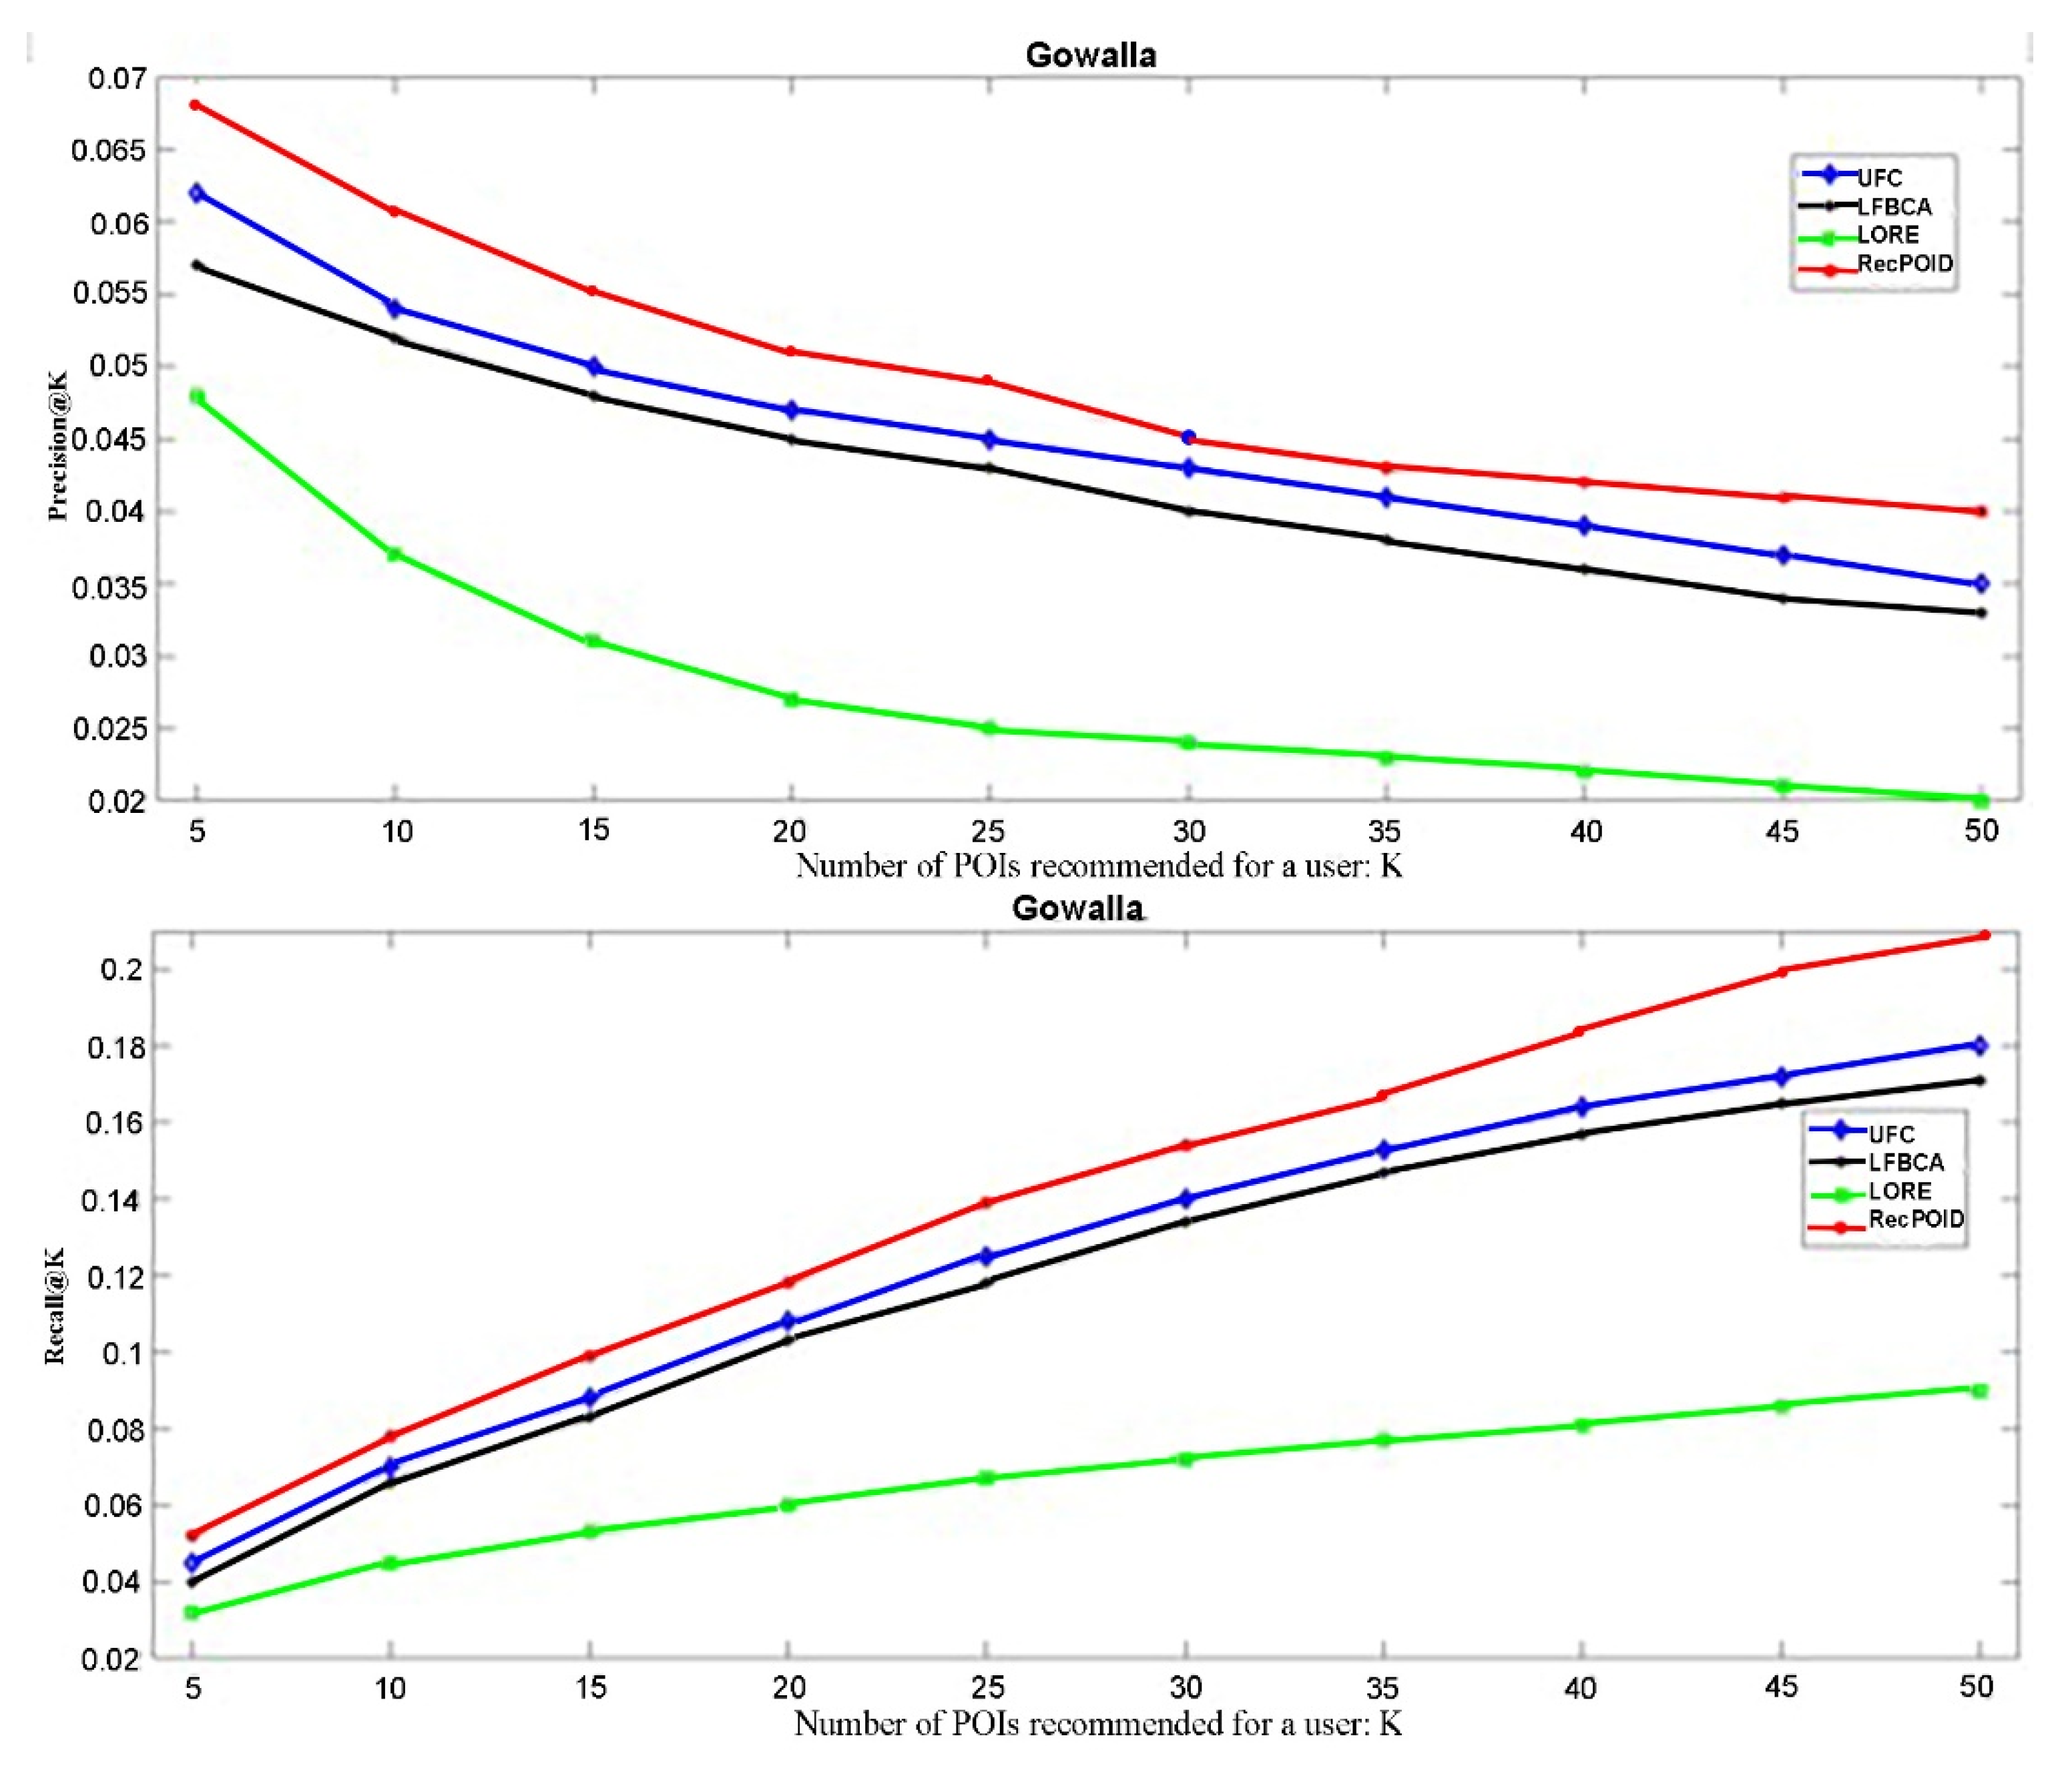
The RecPOID evaluation results with other approaches to the Gowalla dataset are reviewed in Figure 6.
3.2. Discussion on Performance
According to Figure 5 and Figure 6, RecPOID consistently outperforms UFC, LFBCA, and LORE expressively on both popular datasets in terms of two metrics, Recall@K, Precision@K. For instance, in Yelp, ours obtains 0.037 and 0.032 in terms of Precision@5 and Precision@10, respectively. It means our RecPOID method exhibiting 0.01, 0.015, and 0.02 performance improvement compared with UFC, LFBCA, and LORE, respectively. This superiority is perhaps outlined by the fact that the suggested RecPOID completely utilized the combination of the clustering method and friendship relations to recommend point-of-interests. As shown in Figure 5 and Figure 6, it is interesting that even if we have small K, our strategy can attain great recommendation outcomes yet. Particularly, Recall@5 is smaller than Recall@10, verifying the effectiveness of the suggested technique. However, the LFBCA method’s performance does not perform better than our proposed model but outperforms LORE consistently in all assessment metrics. LORE method does not perform well in every evaluation metrics in both datasets. This finding approves that top-relation based on the overlapping in obtained clusters is the POI recommendation’s principal item.
The two evaluated data sets have different data sparsity. The results of the evaluation illustrate that the proposed algorithm works better on the Gowalla dataset than Yelp, and the significance of friends at Gowalla is greater than Yelp. It means there are richer social relations in Gowalla and more under the influence of their friends’ check-ins.
Analyzing the other measures also confirms that the RecPOID model is well fitted for the subject problem. That means the recommender method is very sensitive, i.e., 94.1%, indicating that the technique is highly complete. Thus, the model can effectively and (almost) completely learn users’ preferences according to behavior of similar friendships. Moreover, the specificity of the RecPOID is also significantly high, exceeding 91.8%. Therefore, the module can effectively identify irrelevant POIs. According to the specificity and sensitivity metrics, it is clear that the model is highly capable of correctly identify desirable and undesirable POIs.
To further analyze the outcomes, we conducted a paired t-test to compare the differences between RecPOID and the other techniques. We found that our method’s improvement is statistically significant on all datasets (p-value < 0.01).
In summary, this research’s contributions provide a novel deep learning method to recommend an accurate sequence of top-k POIs to users considering a similar pattern’s friendship. The proposed RecPOID has improved the accuracy of POI recommendations compared to other state-of-the-art methods.
4. Conclusions and Future Work
In this study, a novel framework for POI recommendation named RecPOID has been proposed by incorporating check-in correlation, the significance of the friend, and user preference. A fuzzy clustering approach has been utilized to find the more important friendship to apply a powerful relationship in exploring user preference. The experiment illustrates that compared to algorithms based on the simple location, the proposed CNN structure, which utilizes other people’s experiences, can provide more suitable POI recommendations. We also demonstrate that considering only those user’s experiences with the most similar pattern in visiting location (using clustering method) can be useful for improving predictive performance. The comprehensive experiment has been performed on Gowalla and Yelp’s well-known datasets. Obtained experimental outcomes uncover that the RecPOID structure outperforms other state-of-the-art techniques. This research’s limitations can be the amount of data required for network learning, and also because clustering is used, there may be limitations within clusters. For example, in a region, we want to suggest several restaurants. If the restaurants are too close, the algorithm may mistake and put them all in one cluster. In future work, we plan to work on other datasets as well. We also intend to consider reinforcement learning instead of convolutional networking because it has the advantage of learning with fewer data.
Author Contributions
Conceptualization, S.S. and M.J.; methodology, S.S. and M.J.; formal analysis, S.S. and M.J.; data curation, S.S. and M.J.; writing—original draft preparation, S.S. and M.J.; writing—review and editing, S.S. and M.J. All authors have read and agreed to the published version of the manuscript.
Funding
This research received no external funding.
Institutional Review Board Statement
Not applicable.
Informed Consent Statement
Informed consent was obtained from all subjects involved in the study.
Data Availability Statement
Data is contained whitin the article.
Conflicts of Interest
The authors declare no conflict of interest.
References
- Qian, T.; Liu, B.; Nguyen, Q.V.H.; Yin, H. Spatiotemporal Representation Learning for Translation-Based POI Recommendation. ACM Trans. Inf. Syst. 2019, 37, 1–24. [Google Scholar] [CrossRef]
- Li, X.; Han, D.; He, J.; Liao, L.; Wang, M. Next and Next New POI Recommendation via Latent Behavior Pattern Inference. ACM Trans. Inf. Syst. 2019, 37, 1–28. [Google Scholar] [CrossRef] [Green Version]
- Liu, W.; Lai, H.; Wang, J.; Ke, G.; Yang, W.; Yin, J. Mix geographical information into local collaborative ranking for POI recommendation. World Wide Web 2019, 23, 131–152. [Google Scholar] [CrossRef]
- Wu, Y.; Li, K.; Zhao, G.; Qian, X. Personalized Long- and Short-term Preference Learning for Next POI Recommendation. IEEE Trans. Knowl. Data Eng. 2020, 10, 1. [Google Scholar] [CrossRef]
- Ding, R.; Chen, Z. RecNet: A deep neural network for personalized POI recommendation in location-based social networks. Int. J. Geogr. Inf. Sci. 2018, 32, 1631–1648. [Google Scholar] [CrossRef]
- Doan, T.-N.; Lim, E.-P. Modeling location-based social network data with area attraction and neighborhood competition. Data Min. Knowl. Discov. 2018, 33, 58–95. [Google Scholar] [CrossRef]
- Lian, D.; Zheng, K.; Ge, Y.; Cao, L.; Chen, E.; Xie, X. GeoMF++. ACM Trans. Inf. Syst. 2018, 36, 1–29. [Google Scholar] [CrossRef]
- Ye, M.; Yin, P.; Lee, W.-C.; Lee, D.-L. Exploiting geographical influence for collaborative point-of-interest recommendation. In Proceedings of the 34th international ACM SIGIR conference on Research and development in Information—SIGIR ’11, Beijing, China, 25–29 July 2011; pp. 325–334. [Google Scholar]
- Hao, P.-Y.; Cheang, W.-H.; Chiang, J.-H. Real-time event embedding for POI recommendation. Neurocomputing 2019, 349, 1–11. [Google Scholar] [CrossRef]
- Zhang, Z.; Li, C.; Wu, Z.; Sun, A.; Ye, D.; Luo, X. NEXT: A neural network framework for next POI recommendation. Front. Comput. Sci. 2020, 14, 314–333. [Google Scholar] [CrossRef] [Green Version]
- Gao, Y.; Duan, Z.; Shi, W.; Feng, J.; Chiang, Y.-Y. Personalized Recommendation Method of POI Based on Deep Neural Network. In Proceedings of the 2019 6th International Conference on Behavioral, Economic and Socio-Cultural Computing (BESC), Beijing, China, 28–30 October 2019. [Google Scholar]
- Sit, M.A.; Koylu, C.; Demir, I. Identifying disaster-related tweets and their semantic, spatial and temporal context using deep learning, natural language processing and spatial analysis: A case study of Hurricane Irma. Int. J. Digit. Earth 2019, 12, 1205–1229. [Google Scholar] [CrossRef]
- Zhang, J.; Xie, Y.; Wu, Q.; Xia, Y. Medical image classification using synergic deep learning. Med. Image Anal. 2019, 54, 10–19. [Google Scholar] [CrossRef] [PubMed]
- Huang, L.; Ma, Y.; Wang, S.; Liu, Y. An Attention-based Spatiotemporal LSTM Network for Next POI Recommendation. IEEE Trans. Serv. Comput. 2019, 10, 1. [Google Scholar] [CrossRef]
- Yuan, J.; Hou, X.; Xiao, Y.; Cao, D.; Guan, W.; Nie, L. Multi-criteria active deep learning for image classification. Knowl. -Based Syst. 2019, 172, 86–94. [Google Scholar] [CrossRef]
- Yin, H.; Wang, W.; Wang, H.; Chen, L.; Zhou, X. Spatial-Aware Hierarchical Collaborative Deep Learning for POI Recommendation. IEEE Trans. Knowl. Data Eng. 2017, 29, 2537–2551. [Google Scholar] [CrossRef]
- He, F.; Wei, P. Research on comprehensive point of interest (POI) recommendation based on spark. Clust. Comput. 2018, 22, 9049–9057. [Google Scholar] [CrossRef]
- Zhou, J.; Liu, B.; Chen, Y.; Lin, F. UFC: A Unified POI Recommendation Framework. Arab. J. Sci. Eng. 2019, 44, 9321–9332. [Google Scholar] [CrossRef]
- Wang, H.; Terrovitis, M.; Mamoulis, N. Location recommendation in location-based social networks using user check-in data. In Proceedings of the 21st ACM SIGSPATIAL International Conference on Advances in Geographic Information Systems, Orlando, FL, USA, 5–8 November 2013. [Google Scholar]
- Zhang, J.-D.; Chow, C.-Y.; Li, Y. LORE: Exploiting sequential influence for location recommendations. In Proceedings of the 22nd ACM SIGSPATIAL International Conference on Advances in Geographic Information Systems, Dallas, TX, USA, 4–7 November 2014. [Google Scholar]
- Ranjbarzadeh, R.; Saadi, S.B. Automated liver and tumor segmentation based on concave and convex points using fuzzy c-means and mean shift clustering. Measurement 2020, 150, 107086. [Google Scholar] [CrossRef]
- Tang, Y.; Hu, X.; Pedrycz, W.; Song, X. Possibilistic fuzzy clustering with high-density viewpoint. Neurocomputing 2019, 329, 407–423. [Google Scholar] [CrossRef]
- Ren, T.; Wang, H.; Feng, H.; Xu, C.; Liu, G.; Ding, P. Study on the improved fuzzy clustering algorithm and its application in brain image segmentation. Appl. Soft Comput. 2019, 81, 105503. [Google Scholar] [CrossRef]
- Karimi, N.; Kondrood, R.R.; Alizadeh, T. An intelligent system for quality measurement of Golden Bleached raisins using two comparative machine learning algorithms. Measurement 2017, 107, 68–76. [Google Scholar] [CrossRef]
- Sudharshan, P.; Petitjean, C.; Spanhol, F.; Oliveira, L.E.; Heutte, L.; Honeine, P. Multiple instance learning for histopathological breast cancer image classification. Expert Syst. Appl. 2019, 117, 103–111. [Google Scholar] [CrossRef]
- Ranjbarzadeh, R.; Saadi, S.B.; Amirabadi, A. LNPSS: SAR image despeckling based on local and non-local features using patch shape selection and edges linking. Measurement 2020, 164, 107989. [Google Scholar] [CrossRef]
- Mahmood, A.; Bennamoun, M.; An, S.; Sohel, F.; Boussaid, F.; Hovey, R.; Kendrick, G.; Fisher, R.B. Deep Learning for Coral Classification. In Handbook of Neural Computation; Elsevier: Amsterdam, The Netherlands, 2017; pp. 383–401. [Google Scholar]
- Torres, A.D.; Yan, H.; Aboutalebi, A.H.; Das, A.; Duan, L.; Rad, P. Patient Facial Emotion Recognition and Sentiment Analysis Using Secure Cloud with Hardware Acceleration. In Computational Intelligence for Multimedia Big Data on the Cloud with Engineering Applications; Elsevier BV: Amsterdam, The Netherlands, 2018; pp. 61–89. [Google Scholar]
- Zhong, J.; Liu, Z.; Han, Z.; Han, Y.; Zhang, W. A CNN-Based Defect Inspection Method for Catenary Split Pins in High-Speed Railway. IEEE Trans. Instrum. Meas. 2019, 68, 2849–2860. [Google Scholar] [CrossRef]
- Chen, J.; Liu, Z.; Wang, H.; Nunez, A.; Han, Z. Automatic Defect Detection of Fasteners on the Catenary Support Device Using Deep Convolutional Neural Network. IEEE Trans. Instrum. Meas. 2018, 67, 257–269. [Google Scholar] [CrossRef] [Green Version]
- Özyurt, F.; Tuncer, T.; Avci, E.; Koç, M.; Serhatlioğlu, I. A Novel Liver Image Classification Method Using Perceptual Hash-Based Convolutional Neural Network. Arab. J. Sci. Eng. 2019, 44, 3173–3182. [Google Scholar] [CrossRef]
- Bengio, Y. Practical Recommendations for Gradient-Based Training of Deep Architectures; Springer: Berlin, Heidelberg, 2012. [Google Scholar]
- Dolz, J.; Desrosiers, C.; Ben Ayed, I. 3D fully convolutional networks for subcortical segmentation in MRI: A large-scale study. NeuroImage 2018, 170, 456–470. [Google Scholar] [CrossRef] [PubMed] [Green Version]
- Glorot, X.; Bordes, A.; Bengio, Y. Deep sparse rectifier neural networks. In Proceedings of the fourteenth international conference on artificial intelligence and statistics, Ft. Lauderdale, FL, USA, 11–13 April 2011. [Google Scholar]
- Morabito, F.C.; Campolo, M.; Ieracitano, C.; Mammone, N. Deep Learning Approaches to Electrophysiological Multivariate Time-Series Analysis. In Artificial Intelligence in the Age of Neural Networks and Brain Computing; Elsevier BV: Amsterdam, The Netherlands, 2019; pp. 219–243. [Google Scholar]
- Shang, W.; Sohn, K.; Almeida, D.; Lee, H. Understanding and improving convolutional neural networks via concatenated rectified linear units. In Proceedings of the international conference on machine learning. PMLR, Long Beach, CA, USA, 13–18 July 2019. [Google Scholar]
- Yin, W.; Schütze, H.; Xiang, B.; Zhou, B. ABCNN: Attention-Based Convolutional Neural Network for Modeling Sentence Pairs. Trans. Assoc. Comput. Linguist. 2016, 4, 259–272. [Google Scholar] [CrossRef]
- Husain, F.; Dellen, B.; Torras, C. Scene Understanding Using Deep Learning. In Handbook of Neural Computation; Elsevier BV: Amsterdam, The Netherlands, 2017; pp. 373–382. [Google Scholar]
- Havaei, M.; Davy, A.; Warde-Farley, D.; Biard, A.; Courville, A.; Bengio, Y.; Pal, C.; Jodoin, P.-M.; Larochelle, H. Brain tumor segmentation with Deep Neural Networks. Med. Image Anal. 2017, 35, 18–31. [Google Scholar] [CrossRef] [Green Version]
- Srivastava, N.; Hinton, G.; Krizhevsky, A.; Sutskever, I.; Salakhutdinov, R. Dropout: A simple way to prevent neural networks from overfitting. J. Mach. Learn. Res. 2014, 15, 1929–1958. [Google Scholar]
- Kim, T.-Y.; Cho, S.-B. Predicting residential energy consumption using CNN-LSTM neural networks. Energy 2019, 182, 72–81. [Google Scholar] [CrossRef]
- Cho, E.; Seth, A. Myers, and Jure Leskovec. Friendship and Mobility: User Movement in Location-Based Social Networks. In Proceedings of ACM SIGKDD International Conference on Knowledge Discovery and Data Mining (KDD), London, UK, 14–19 August 2021. [Google Scholar]
- Yelp Dataset. Available online: https://www.yelp.com/dataset (accessed on 17 March 2021).
Figure 1.
An illustration of applying clustering approach to two different time span of one user.

Figure 2.
Schematic of calculation of the overlapping clusters.

Figure 3.
Our implemented convolutional neural network (CNN) model.

Figure 4.
RecPOID framework for recommending points-of-interest (POIs) according to the importance of friendship.
Figure 4.
RecPOID framework for recommending points-of-interest (POIs) according to the importance of friendship.

Figure 5.
Comparison between RecPOID and the other three methods.

Figure 6.
Comparison between RecPOID and the other three methods.


Table 1.
Data information.
| Users | POIs | Records | Social Relations | Sparsity (%) | |
|---|---|---|---|---|---|
| Yelp | 30,887 | 18,995 | 265,533 | 860,888 | 99.860 |
| Gowalla | 18,737 | 32,510 | 86,985 | 1,278,274 | 99.865 |
Publisher’s Note: MDPI stays neutral with regard to jurisdictional claims in published maps and institutional affiliations. |
© 2021 by the authors. Licensee MDPI, Basel, Switzerland. This article is an open access article distributed under the terms and conditions of the Creative Commons Attribution (CC BY) license (http://creativecommons.org/licenses/by/4.0/).
Share and Cite
MDPI and ACS Style
Safavi, S.; Jalali, M. RecPOID: POI Recommendation with Friendship Aware and Deep CNN. Future Internet 2021, 13, 79. https://0-doi-org.brum.beds.ac.uk/10.3390/fi13030079
AMA Style
Safavi S, Jalali M. RecPOID: POI Recommendation with Friendship Aware and Deep CNN. Future Internet. 2021; 13(3):79. https://0-doi-org.brum.beds.ac.uk/10.3390/fi13030079
Chicago/Turabian StyleSafavi, Sadaf, and Mehrdad Jalali. 2021. "RecPOID: POI Recommendation with Friendship Aware and Deep CNN" Future Internet 13, no. 3: 79. https://0-doi-org.brum.beds.ac.uk/10.3390/fi13030079
Note that from the first issue of 2016, this journal uses article numbers instead of page numbers. See further details here.