1. Introduction
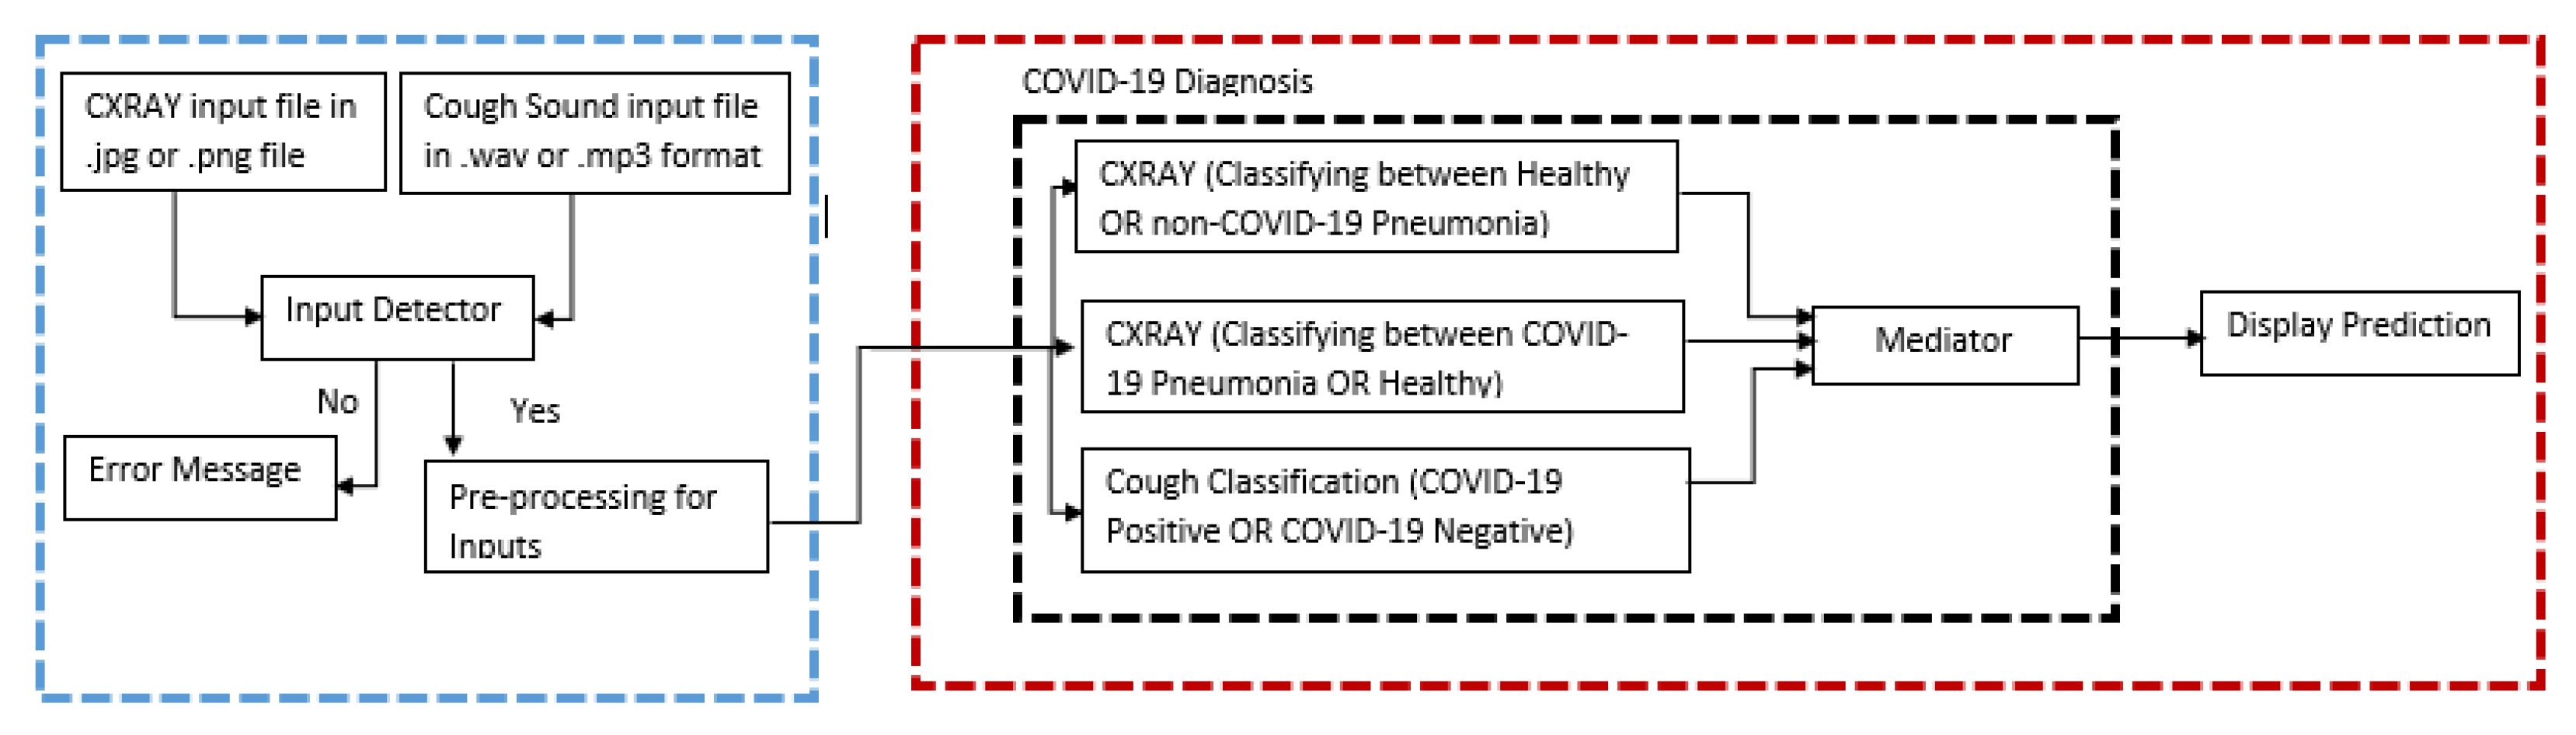
Over the past several decades, research has laid the foundation for a broadly defined new direction of artificial intelligence technology. These parallel architectures on deep learning algorithms have been actively studied because of its unique and fascinating properties as well as complementary applications in computer vision-based medical imageries. Medical imaging is critical for seeing internal organs without causing injury and detecting anomalies in their structure or function throughout the body. MRI, PET, and other medical imaging technologies can be used to obtain medical images. Scanners for X-rays, CT scans, and ultrasounds. This work involved four phases to complete. The first step is to acquire dataset for CXR images with three different classifications (COVID-19 pneumonia, non-COVID-19 pneumonia, and healthy lungs) and cough sound samples with two different classifications (COVID-19 positive and COVID-19 negative). The second step would be performing the pre-processing for the images to remove unnecessary noises (feature extraction) in the image and to make sure all the images are suitable to be parsed to the model for training. Meanwhile for cough sound samples, since they are in .wav file format it is converted to Mel-spectrogram which are then used to train the cough classification model. After pre-processing the datasets, since the medical imaging is limited in size due to privacy issues and annotation cost, data augmentation was performed such as rescaling, zooming, and flipping the images for the CXR dataset, meanwhile for the Cough dataset rescaling, sheer range and zooming were performed. The third step would be to train the two binary CXR model COVID-19 model (healthy lungs and COVID-19 pneumonia) and the non-COVID-19 model (healthy lungs and non-COVID-19 pneumonia) by parsing all the images in the dataset collected to ensure the model learns the pattern such as shapes, curves, and lines of the pneumonia development to be able to grasp the difference between the different classification of lung status. The CXR model is developed by performing transfer learning from the ImageNet VGG16 model. Nonetheless, for the cough model, the spectrograms are passed to the model for the learning process and the model is built from scratch using Keras sequential models. The fourth step would be to test the model by parsing the test dataset and classify those images based on the raw neural network output (RNNO) which is the output given by the model which is a value from zero to one. Since there are two CXR models and both of them are binary, when the CXR image is inputted, it is parsed to both the model and the output and if both the COVID-19 model and non-COVID-19 model returns the RNNO less than 0.5 it is considered as healthy lungs but if either of them returns a value more than 0.5 then the model which has a higher value will be assigned as the predicted category. For instance, if the COVID-19 model returns 0.8 and the non-COVID-19 model returns 0.7 then the predicted category for the model would be COVID-19 positive. The interpretation of the cough model is of the classification on the Mel-spectrogram trained images will classify as positive COVID-19 cough or negative COVID-19 cough types.
The rest of the paper is structured as follows. In
Section 2, we briefly review the related work.
Section 3 introduces the methods and materials used and referred to throughout the paper.
Section 4 evaluates the results obtained and the prototype discusses the performance.
Section 5 presents the conclusions.
2. Related Work
The novel coronavirus 2019 (COVID-2019), which initially appeared in the metropolis city of China in Dec 2019, unfold quickly around the world and has become a pandemic. It has caused a devastating impact on each daily life, public health, and also the international economy. It is crucial to discover positive cases as early as possible, and therefore, forestall the additional spread of this epidemic, in addition to quickly treating affected patients. The requirement for auxiliary diagnostic tools has been raised, as there are not any correct machine-controlled toolkits available. Recent findings by Ozturk et al. [
1] obtained exploitation radiology imaging techniques counsel that such pictures contain salient data concerning the COVID-19 virus. Application of advanced computing (AI) techniques including imaging are often useful for the correct detection of this disease and may even be helpful to beat the matter of an absence of specialized physicians in remote villages. During this work, a novel model for automatic COVID-19 detection exploitation raw chest X-ray pictures is presented (in
Supplementary Materials). Their planned model is developed to produce accurate nosology for binary classification (COVID vs. no-findings) and multi-class classification (COVID vs. no-findings vs. pneumonia). Their model made a classification accuracy of 98.08% for binary categories and 87.02% for multi-class cases. The DarkNet model was utilized in their study as a classifier for you simply look once (YOLO) real-time object detection system. They tended to enforce seventeen convolutional layers and introduced a different filtering on every layer.
Mei et al. [
2] also researched using artificial intelligence to quickly diagnose patients who are positive for COVID-19, artificial intelligence algorithms will combine chest CT images with clinical symptoms, exposure history, and laboratory tests. A total of 419 (46.3 percent) of the 905 patients tested positive for SARS-CoV-2 using a real-time RT–PCR assay and next-generation sequencing RT–PCR. When compared to a senior thoracic radiologist, the AI system had an area under the curve of 0.92 and had identical sensitivity in a test set of 279 cases. The AI approach they applied also enhanced the detection of COVID-19 positive patients with normal CT scans who were positive by RT–PCR, correctly identifying 17 of 25 (68%) patients, whereas radiologists categorized all of these patients as COVID-19 negative.
Imran et al. [
3] also stated in this paper—with the title AI4COVID-19—that a cough is a symptom of approximately thirty medical illnesses that are unrelated to COVID-19. This makes diagnosing a COVID-19 infection just based on cough an extremely difficult interdisciplinary task. The team tackle this issue by comparing the pathomorphological changes in the respiratory system caused by COVID-19 infection to those caused by other respiratory illnesses. They use transfer learning to overcome the lack of COVID-19 cough training data. They use a multi-pronged mediator-focused risk-averse AI architecture to limit the danger of misdiagnosis caused by the problem’s complicated dimensionality. AI4COVID-19 can discriminate between COVID-19 coughs and numerous types of non-COVID-19 coughs, according to the findings. The accuracy is high enough to warrant a large-scale collection of labeled cough data to assess AI4COVID-19’s generalization capacity. AI4COVID-19 is not a diagnostic tool for clinical use. Instead, it provides a screening tool that can be used by anybody, at anytime, anywhere. It can also be used as a clinical decision support tool to direct clinical testing and treatment to people who need it the most, resulting in more lives being saved.
Kermany et.al [
4] has developed the framework makes use of transfer learning, which allowed to train a neural network using a fraction of the data required by traditional methods. The performance comparable to that of human experts in diagnosing age-related macular degeneration and diabetic macular edoema on a collection of optical coherence tomography images. Madani [
5], concerns and the significant cost of collecting annotations, medical imaging databases are limited in size. Augmentation is a common deep learning technique for enriching data in data-limited circumstances and avoiding overfitting. Standard augmentation approaches, which modify lighting, range of view, and spatial rigid transformations to create fresh examples of data, may not capture the biological variance of medical imaging data and may result in artificial images. According to Tang et al. [
6], has selected 497 characteristics from eight domains from data augmentation. The features were then fed into the developed convolutional neural network (CNN), which replaced the fully connected layers that are generally used before the classification layer with a global average pooling layer to acquire global information about the feature maps and avoid overfitting [
7]. This has improved the classification algorithm’s performance, the class weights were set in the loss function during the training process, taking into account the class imbalance. The suggested method’s performance was assessed using stratified five-fold cross-validation. We deemed and applied in CXR, cough data augmentation. Chen G et al. [
8] has conducted a novel improving a neural network’s training efficiency, based on the brilliant concept that whitening neural network inputs can speed up convergence. The added an independent-component (IC) layer before each weight layer. Those inputs are made more independent, due to the well-known notion that independent components must be whitened. Determining independent components, on the other hand, is a computationally costly operation. Batch normalization and dropout, in a new manner that we can rigorously prove that dropout can quadratically reduce the mutual information and linearly reduce the correlation between any pair of neurons with respect to the dropout layer parameters.
3. Materials and Methods
Due to the lack of COVID-19 positive CXR images, a multiple data source was used ensuring there were no duplicates by going through the metadata file using Python when sorting and splitting the dataset into their train and test folders. The sources for our CXR dataset are the University of Montreal [
9], which contained 20 different types of various non-COVID-19 pneumonia, DarwinAI Corporation
Figure 1 [
10] which contained both COVID-19 positive and non-COVID-19 pneumonia, DarwinAI Corporation AcutalMed [
11] which contained COVID-19 positive images, COVID-19 Radiography Database Kaggle [
12] which contributed majorly to the dataset by containing all three classes COVID-19 pneumonia, non-COVID-19 pneumonia, and healthy lungs, and finally—RSNA Pneumonia Detection Challenge Dataset [
13] which contained non-COVID-19 pneumonia and healthy lungs. This brings our dataset count of 20,054 images across three classes. On the other hand, for the cough dataset, the researchers were only able to acquire one dataset which is provided by the Indian Institute of Science under the Project Coswara [
14] which contained a total of 1053 audio files. The audio files are all recorded at a sampling frequency of 48 kHz of the forced cough, and the recordings are four to six seconds long.
For pre-processing the CXR images, all the images were converted into greyscale and resized to 150 × 150 pixels due to the GPU memory limitation. Meanwhile, for the cough audio files were converted from .wav to Mel-spectrogram using the short-time Fourier transform [
15].
Table 1,
Table 2 and
Table 3 shows the dataset split for each model at the final stage of pre-processing.
The novelty of this research has a significant parallel architecture for future practical utilization. A convolution is a sliding kernel (of a defined dimension, usually square) that performs element-wise multiplication on each of the pixels with which it overlaps and then adds the results. Several separate kernels are applied to a single image in a current CNN, and the results are piled in the output. Each kernel traverses the entire image (in specified steps with a specified speed) [
16]. The parameters of these kernels are updated using backpropagation (also called weights). As a result, both forward and backward propagation requires a lot of computing power. The most important findings of this work were that the efficacy of both inputs and sequences was quite high.
Figure 1 has an illustration of the parallel architecture for the implementation.
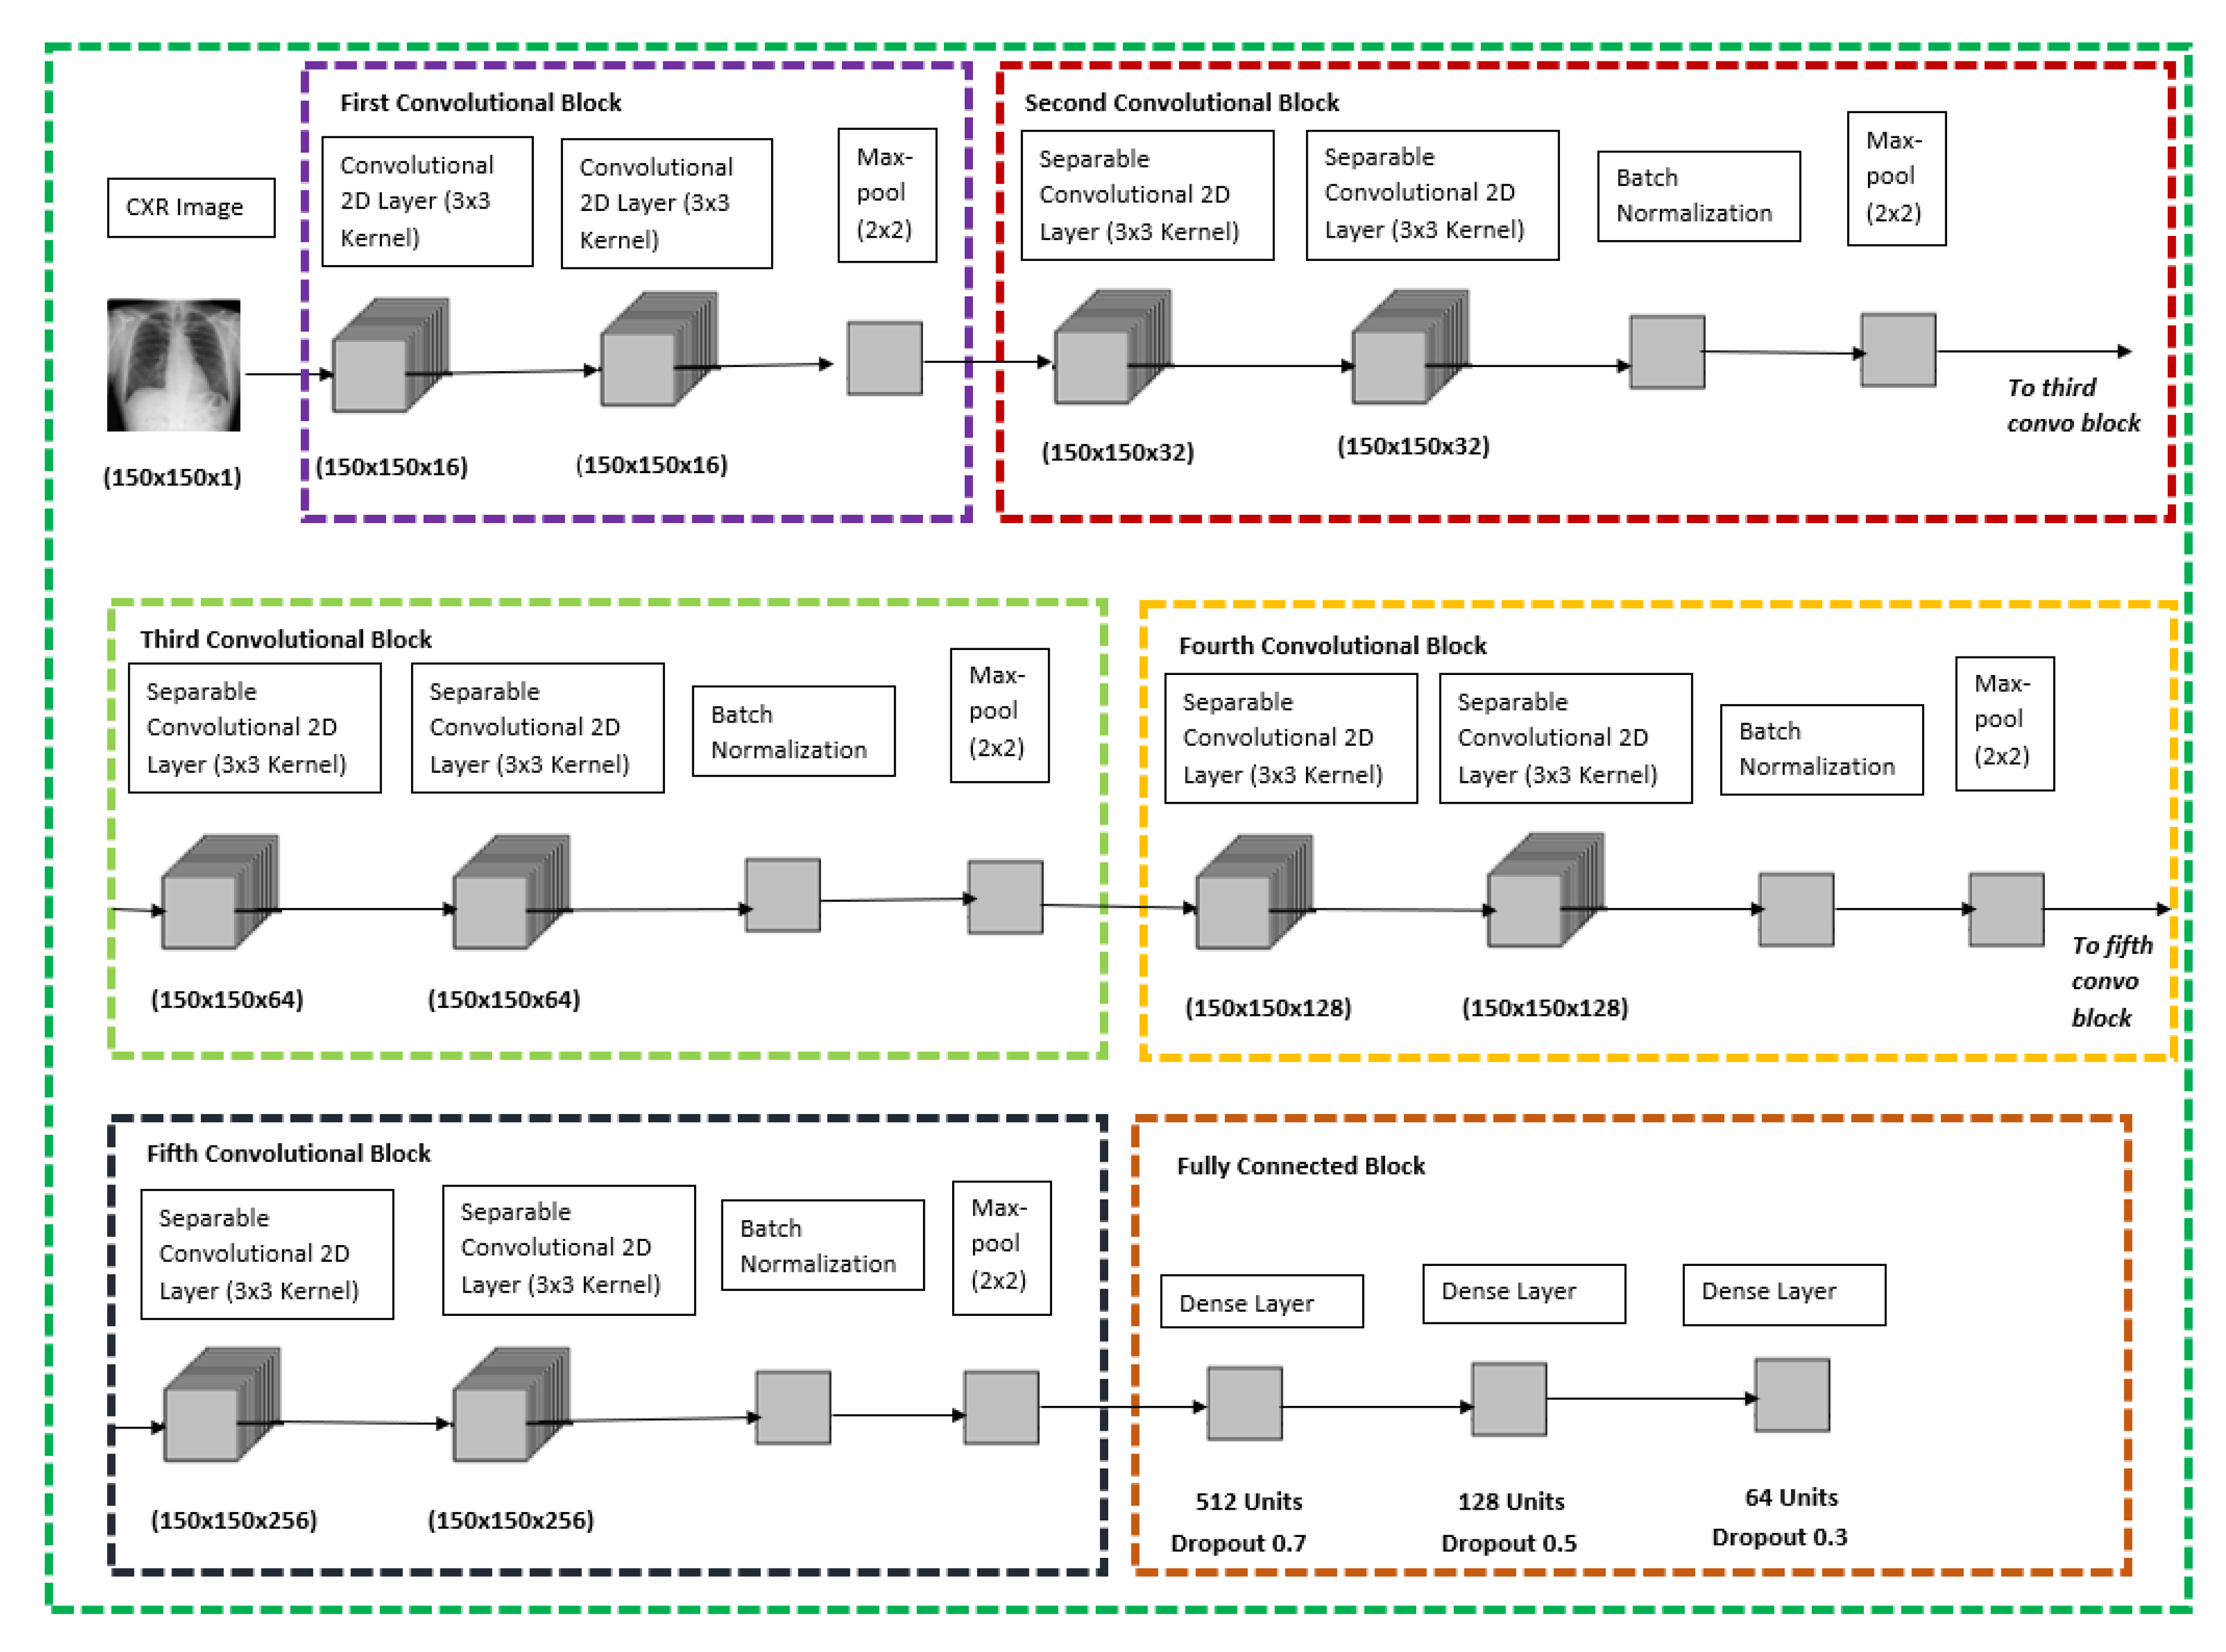
For both the CXR Model, transfer learning was performed with the base of the model being ImageNet VGG-16 model, only the pre-trained weights were extracted and were trained with the new dataset and the new model architecture as shown below in
Figure 2, the CXR image will go through six different blocks whereby the first convolutional block would contain two convolutional 2D layers with 16 filters each and follow by a max-pool layer. The second, third, fourth, and fifth convolutional blocks are all similar with two separable convolutional 2D layers with a kernel size of 3 × 3, which is followed by a batch normalization layer and with a max-pool layer at the end of each block. The difference between the second, third, fourth, and fifth convolutional blocks is that the filter size of the separable convolutional 2D layer increases from 32, 64, 128 and 256, respectively. The final block would be a fully connected block which consists of three different dense layers whereby each of them consists of 512 units and dropout rate of 0.7, 128 units and dropout rate of 0.5, 64 units, and a dropout rate of 0.3, respectively. The model is concluded with a SoftMax activation feature to be used to classify between the respective binary classification for the CXR model stated in
Figure 2 below.
Figure 3 shows the layers used with their respective input and output in detail.
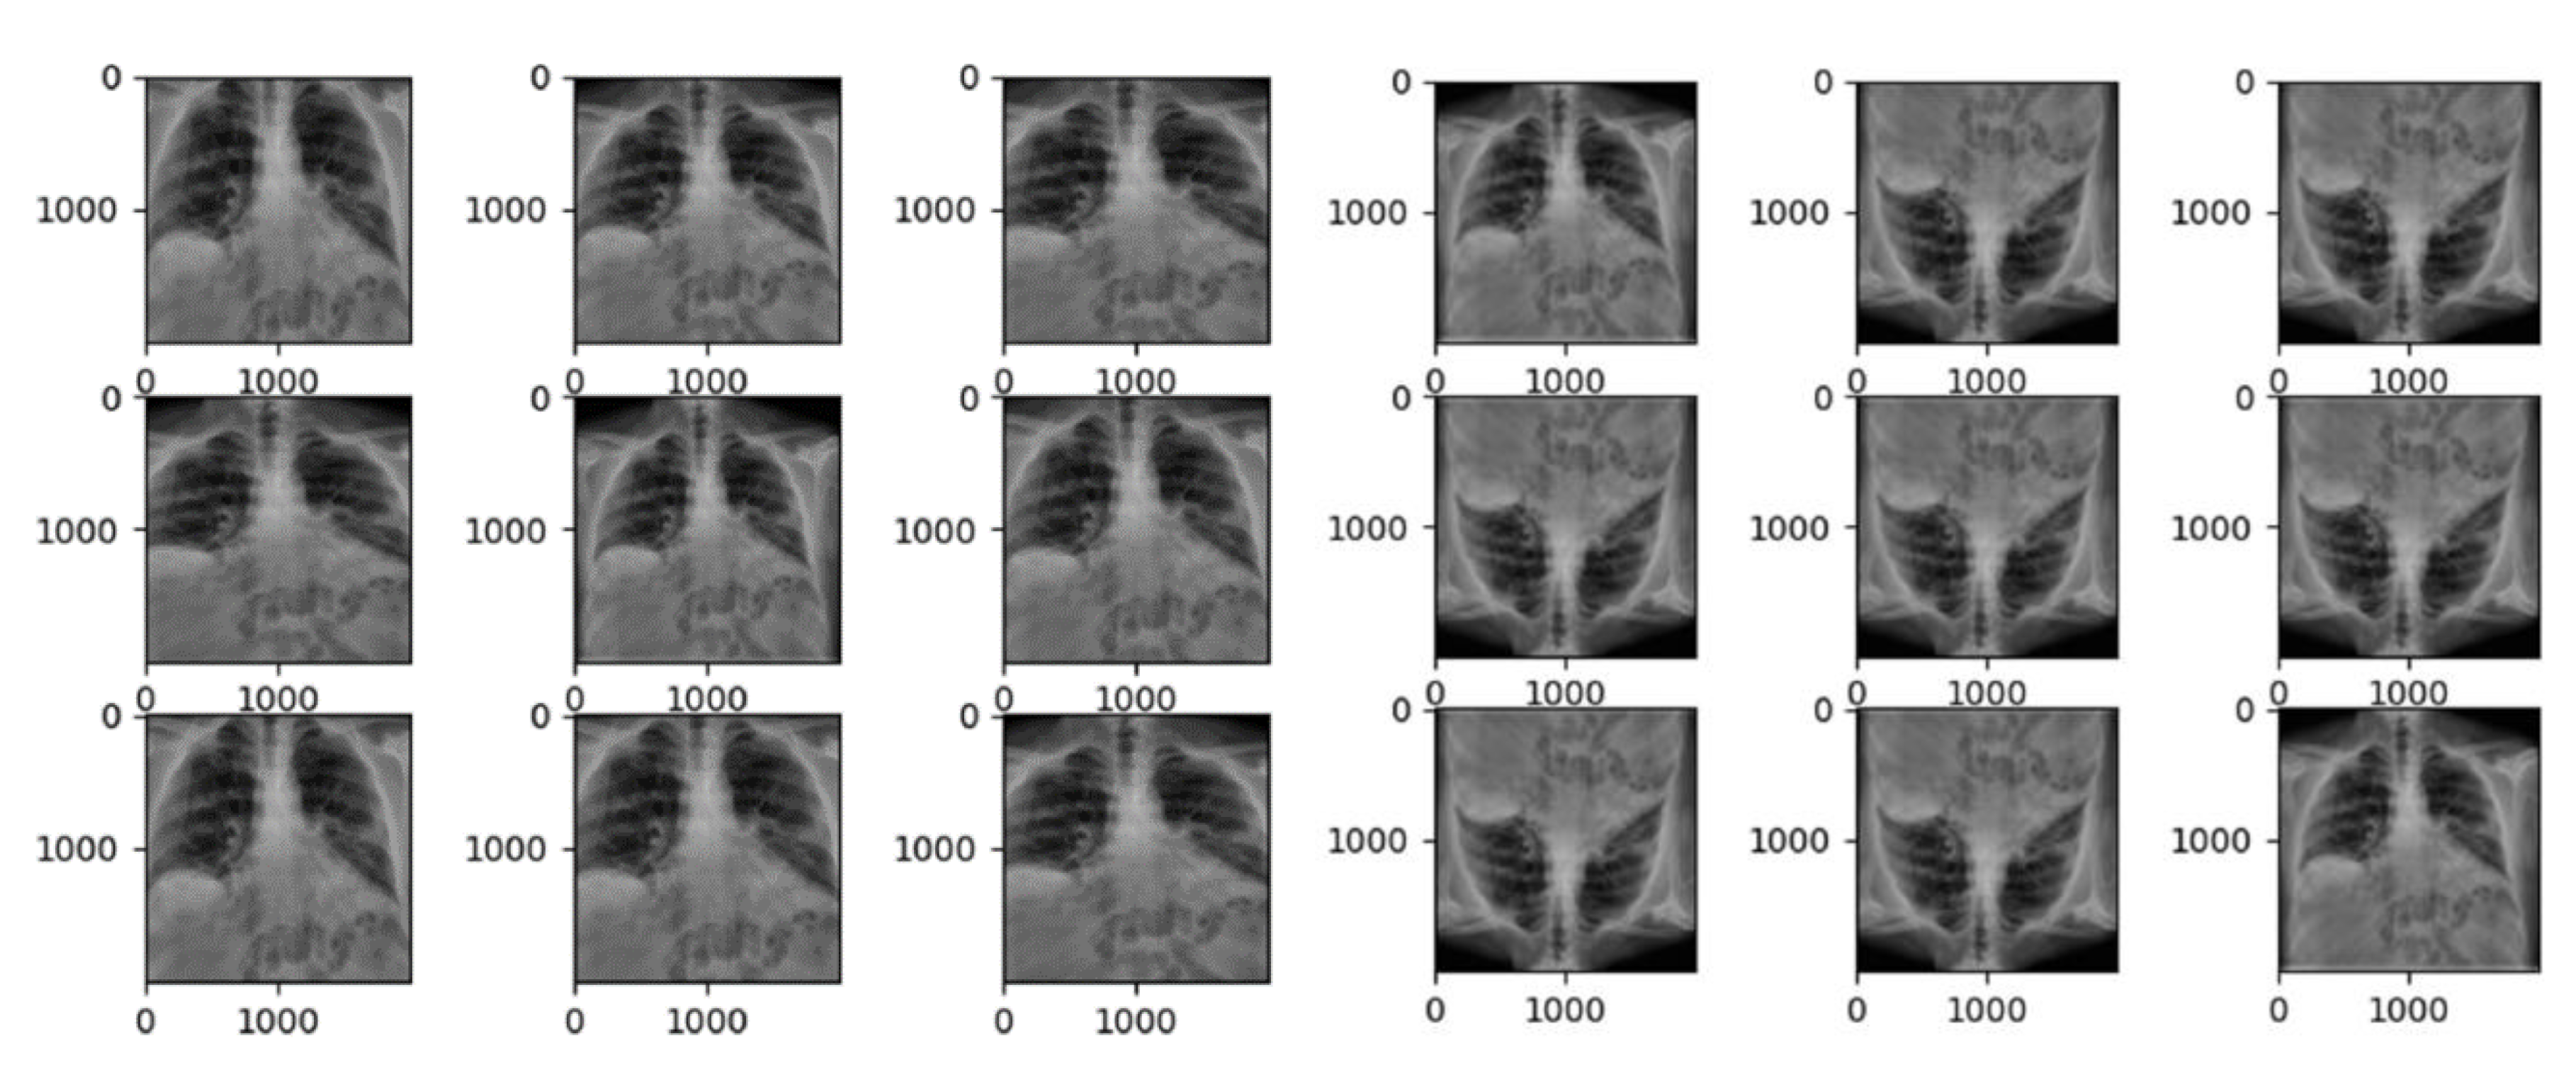
If the condition is less than one, it zooms into the image; if the condition is more than one, it zooms out. When the identical image is fed to the model nine times with the zoom range of 0.3, the model zooms with a range of [0.7, 1.3], implying seventy percent zoom in and one hundred and thirty percent zoom out, as shown in
Figure 3. For the train dataset the data augmentation which are performed are rescale and zoom range, which is same as the CXR Model above, and setting the horizontal flip to false since flipping it in the horizontal scale can change the whole interpretation behind the Mel-spectrogram. Rescale in cough model is slightly different compared to CXR because CXR is in greyscale format but for cough Mel-spectrogram it is in RGB format therefore it contains three maps which are red, green, and blue whereby for each colour it still ranges from 0 to 255.
Figure 4 has illustrated the detailed CXR CNN layer architecture.
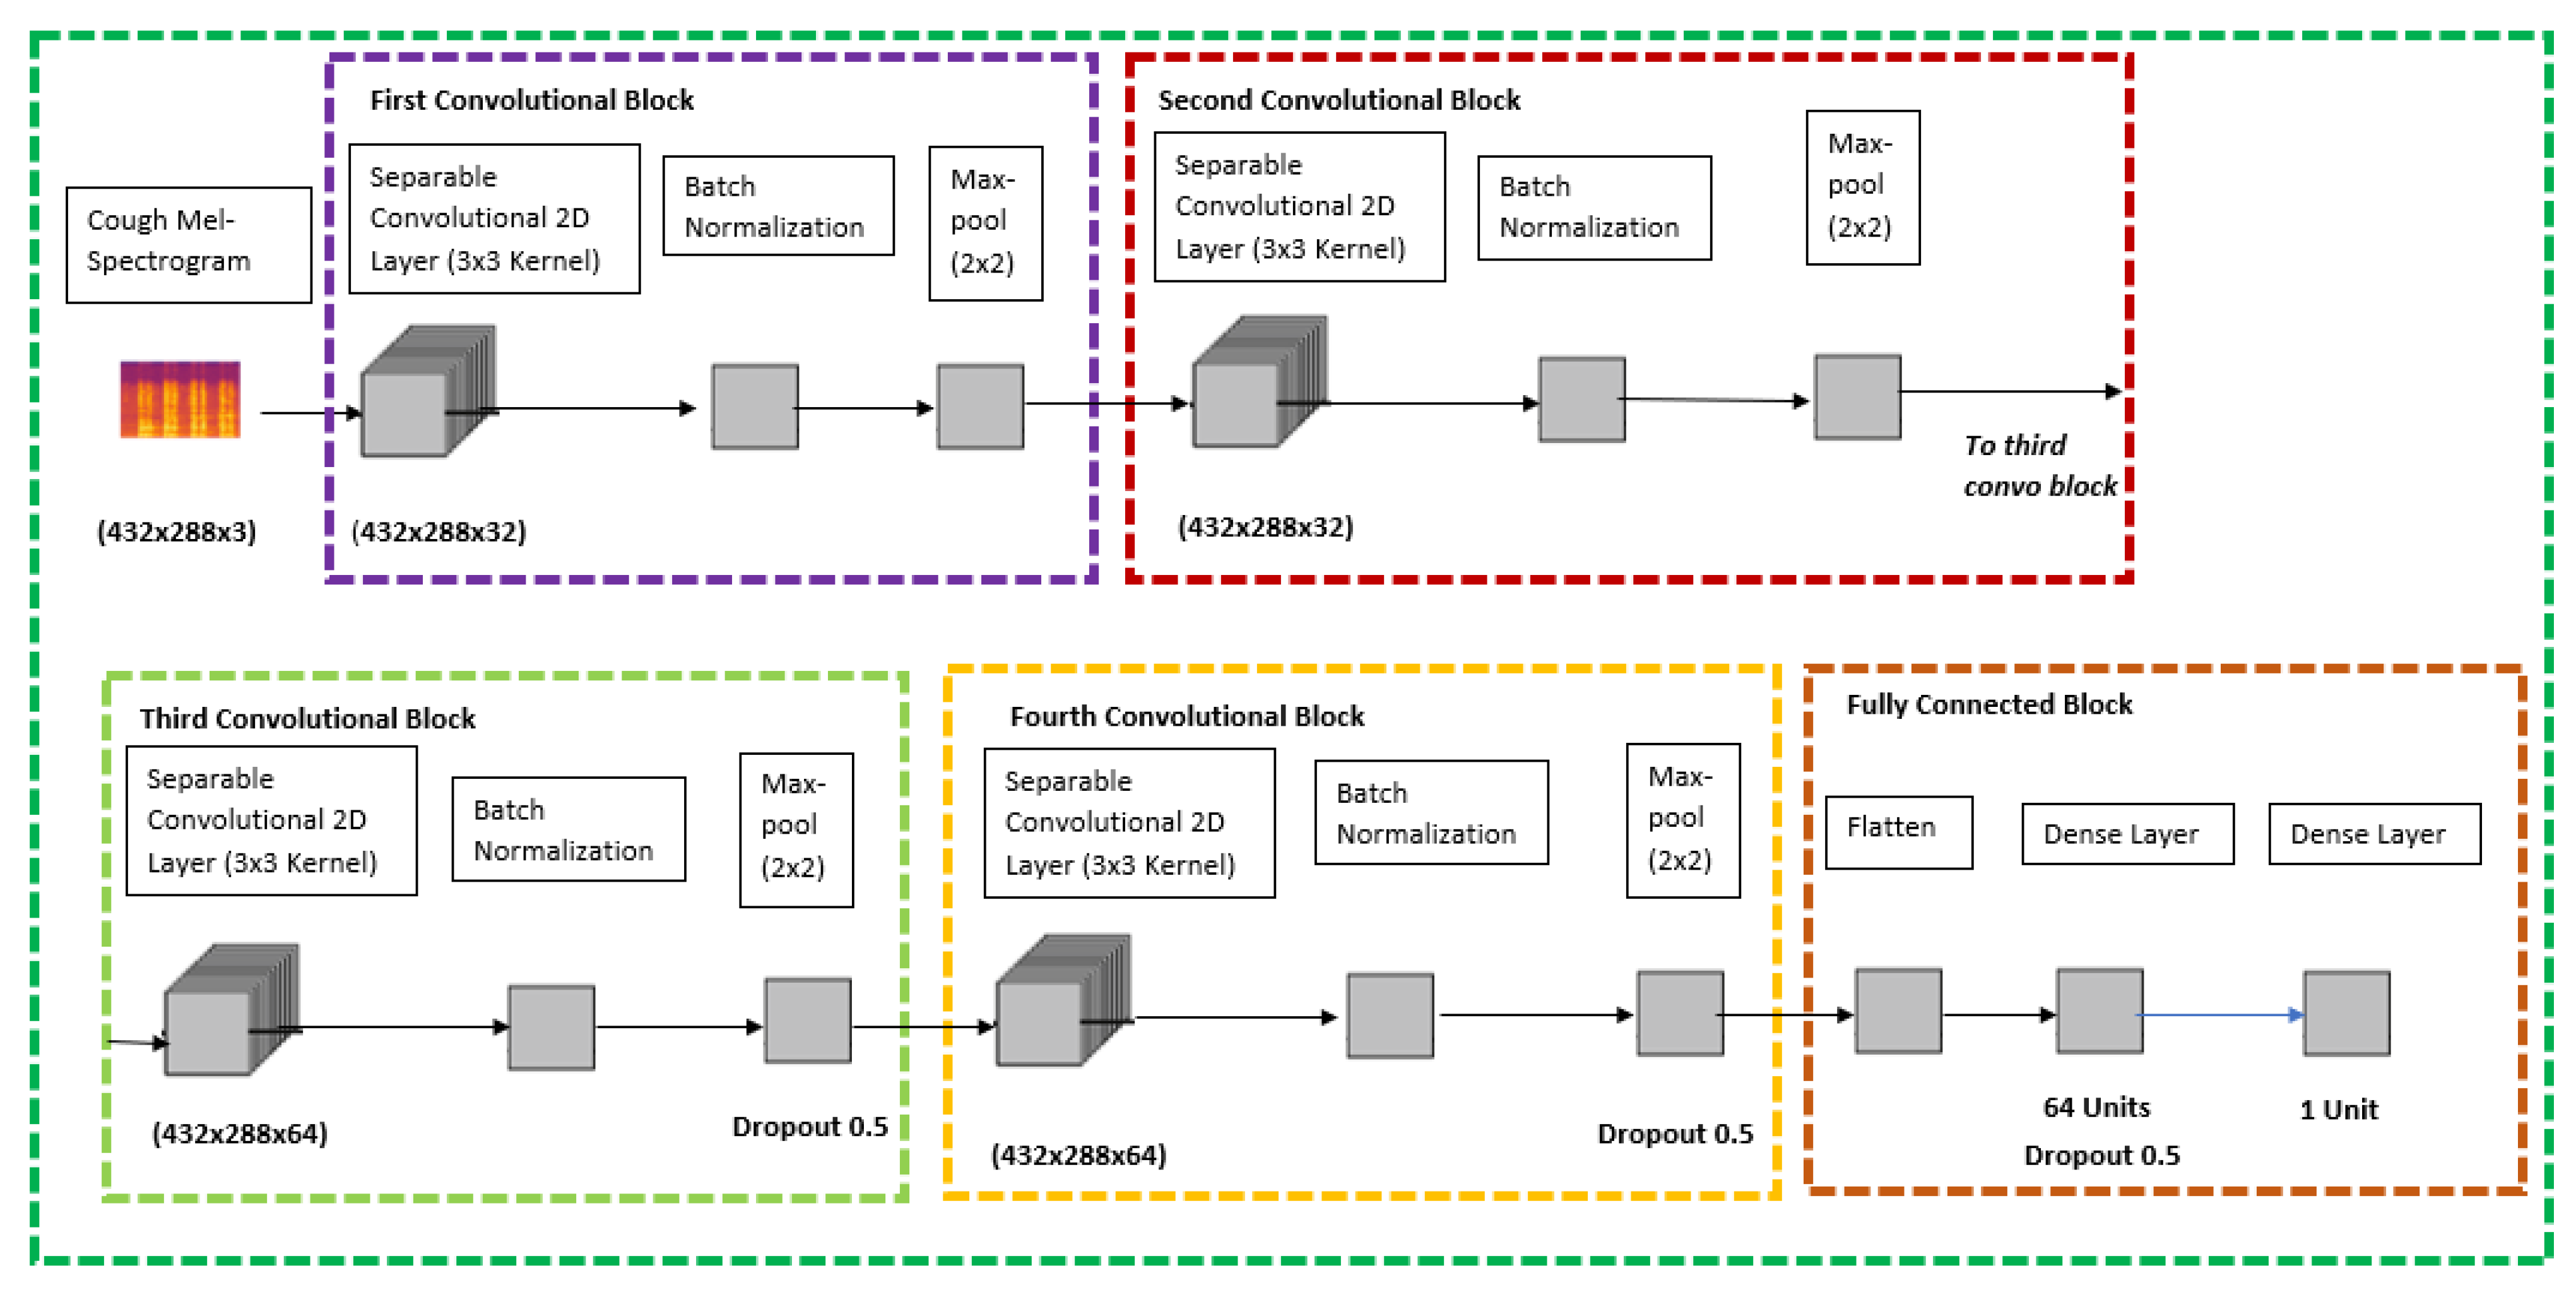
Since there was not any pre-trained model which was readily available to perform transfer learning for cough Mel-spectrograms, this model was built from scratch using the Keras sequential models which is a subset of Keras Functional API for deep learning. The sequential model API is used to create a deep learning model whereby an instance of the sequential class is used, and the layer of the models are created and added on top of it, respectively.
Based on
Figure 4, which is the proposed architecture for the cough model, it contains five various blocks; four convolutional blocks and one fully connected block. The cough Mel-spectrogram image will be passed through four quite identical convolutional blocks which consist of separable convolutional 2D layer, batch normalization layer, and a max pool layer at the end of each block. The difference between the four convolutional blocks is that the separable convolutional 2D layer has a filter size of 32, 32, 64, and 64, respectively. The final and fifth block is a fully connected block that has a flatten layer at the top, followed by a dense layer with 64 units and a dropout rate of 0.5 and it is ended with a dense layer with a 1 unit. The model is concluded with a SoftMax activation and Adam Optimizer feature to classify cough between covid positive or negative.
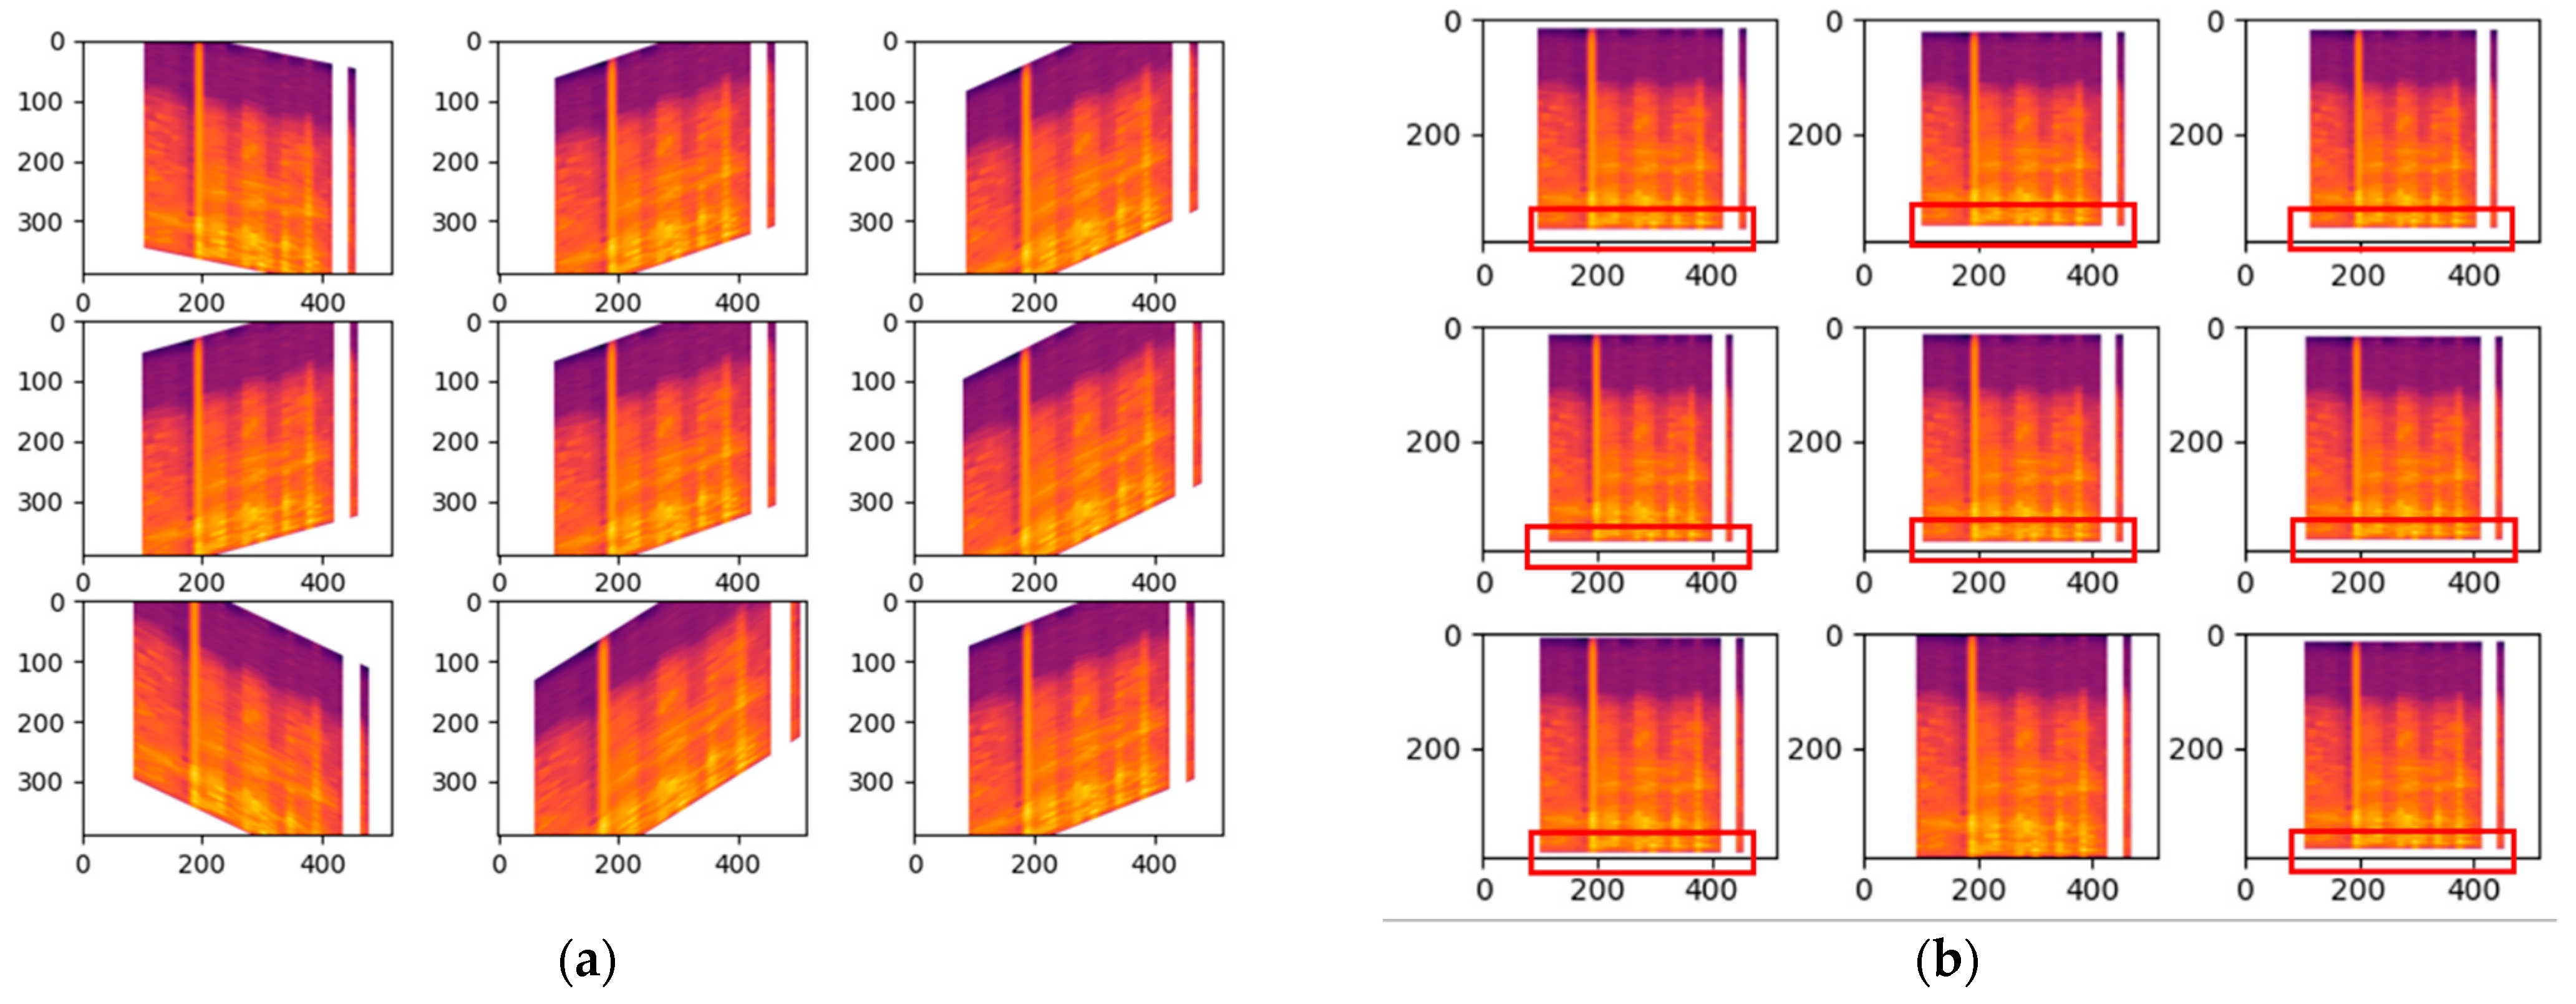
Shear range whereby it will be distorted along the axis thru create a perception angle. In
Figure 5a the shear range is set to 45 which indicates 45 degrees and with such perception it can change the whole meaning behind the Mel-spectrogram, therefore it has only been modified slightly with the value of 0.2 for the shear range. For the zoom range data augmentation in cough, the value is only set to 0.05 so there will not be any major changes which could affect the outcome drastically. Based on
Figure 5b, the changes are highlighted with the red box indicating the zoom in and out.
4. Results and Discussion
To perform convolution for a single kernel, we need to perform a parallel architectural input where the vector is the unrolled form of the kernel. There are multiple kernels used in a single convolution layer. In our case, there are 24 kernels used in the convolution layer and a total of 103 different layers in the model architecture: four convolutional 2D layers, twenty separable Conv2D layers, fourteen max pooling 2D layers, twelve batch normalization layers, eleven dropout layers, three flatten layers, twelve dense layers, twenty-seven ReLu activation layers. As a result, we develop a matriarchy. Many dedicated CNN accelerators have been presented to utilize the high accuracy, intrinsic redundancy, and embarrassingly parallel characteristics of convolutional neural networks (CNN) for intelligent embedded systems.
In COVIDNet, the CXR model is trained by performing transfer leaning using ImageNet VGG16 model and based on the researchers custom model architecture the final model had a total parameters value of 2,341,337 whereby there were 23,213,377 trainable parameters. On the other hand, the cough model is trained using Keras sequential models with the custom model architecture the models had a total parameters value of 1,647,548 total parameters and 1,647,548 of them were trainable. The results discussed in the subsection below.
4.1. COVID-19 CXR Model (COVID-19 and Healthy)
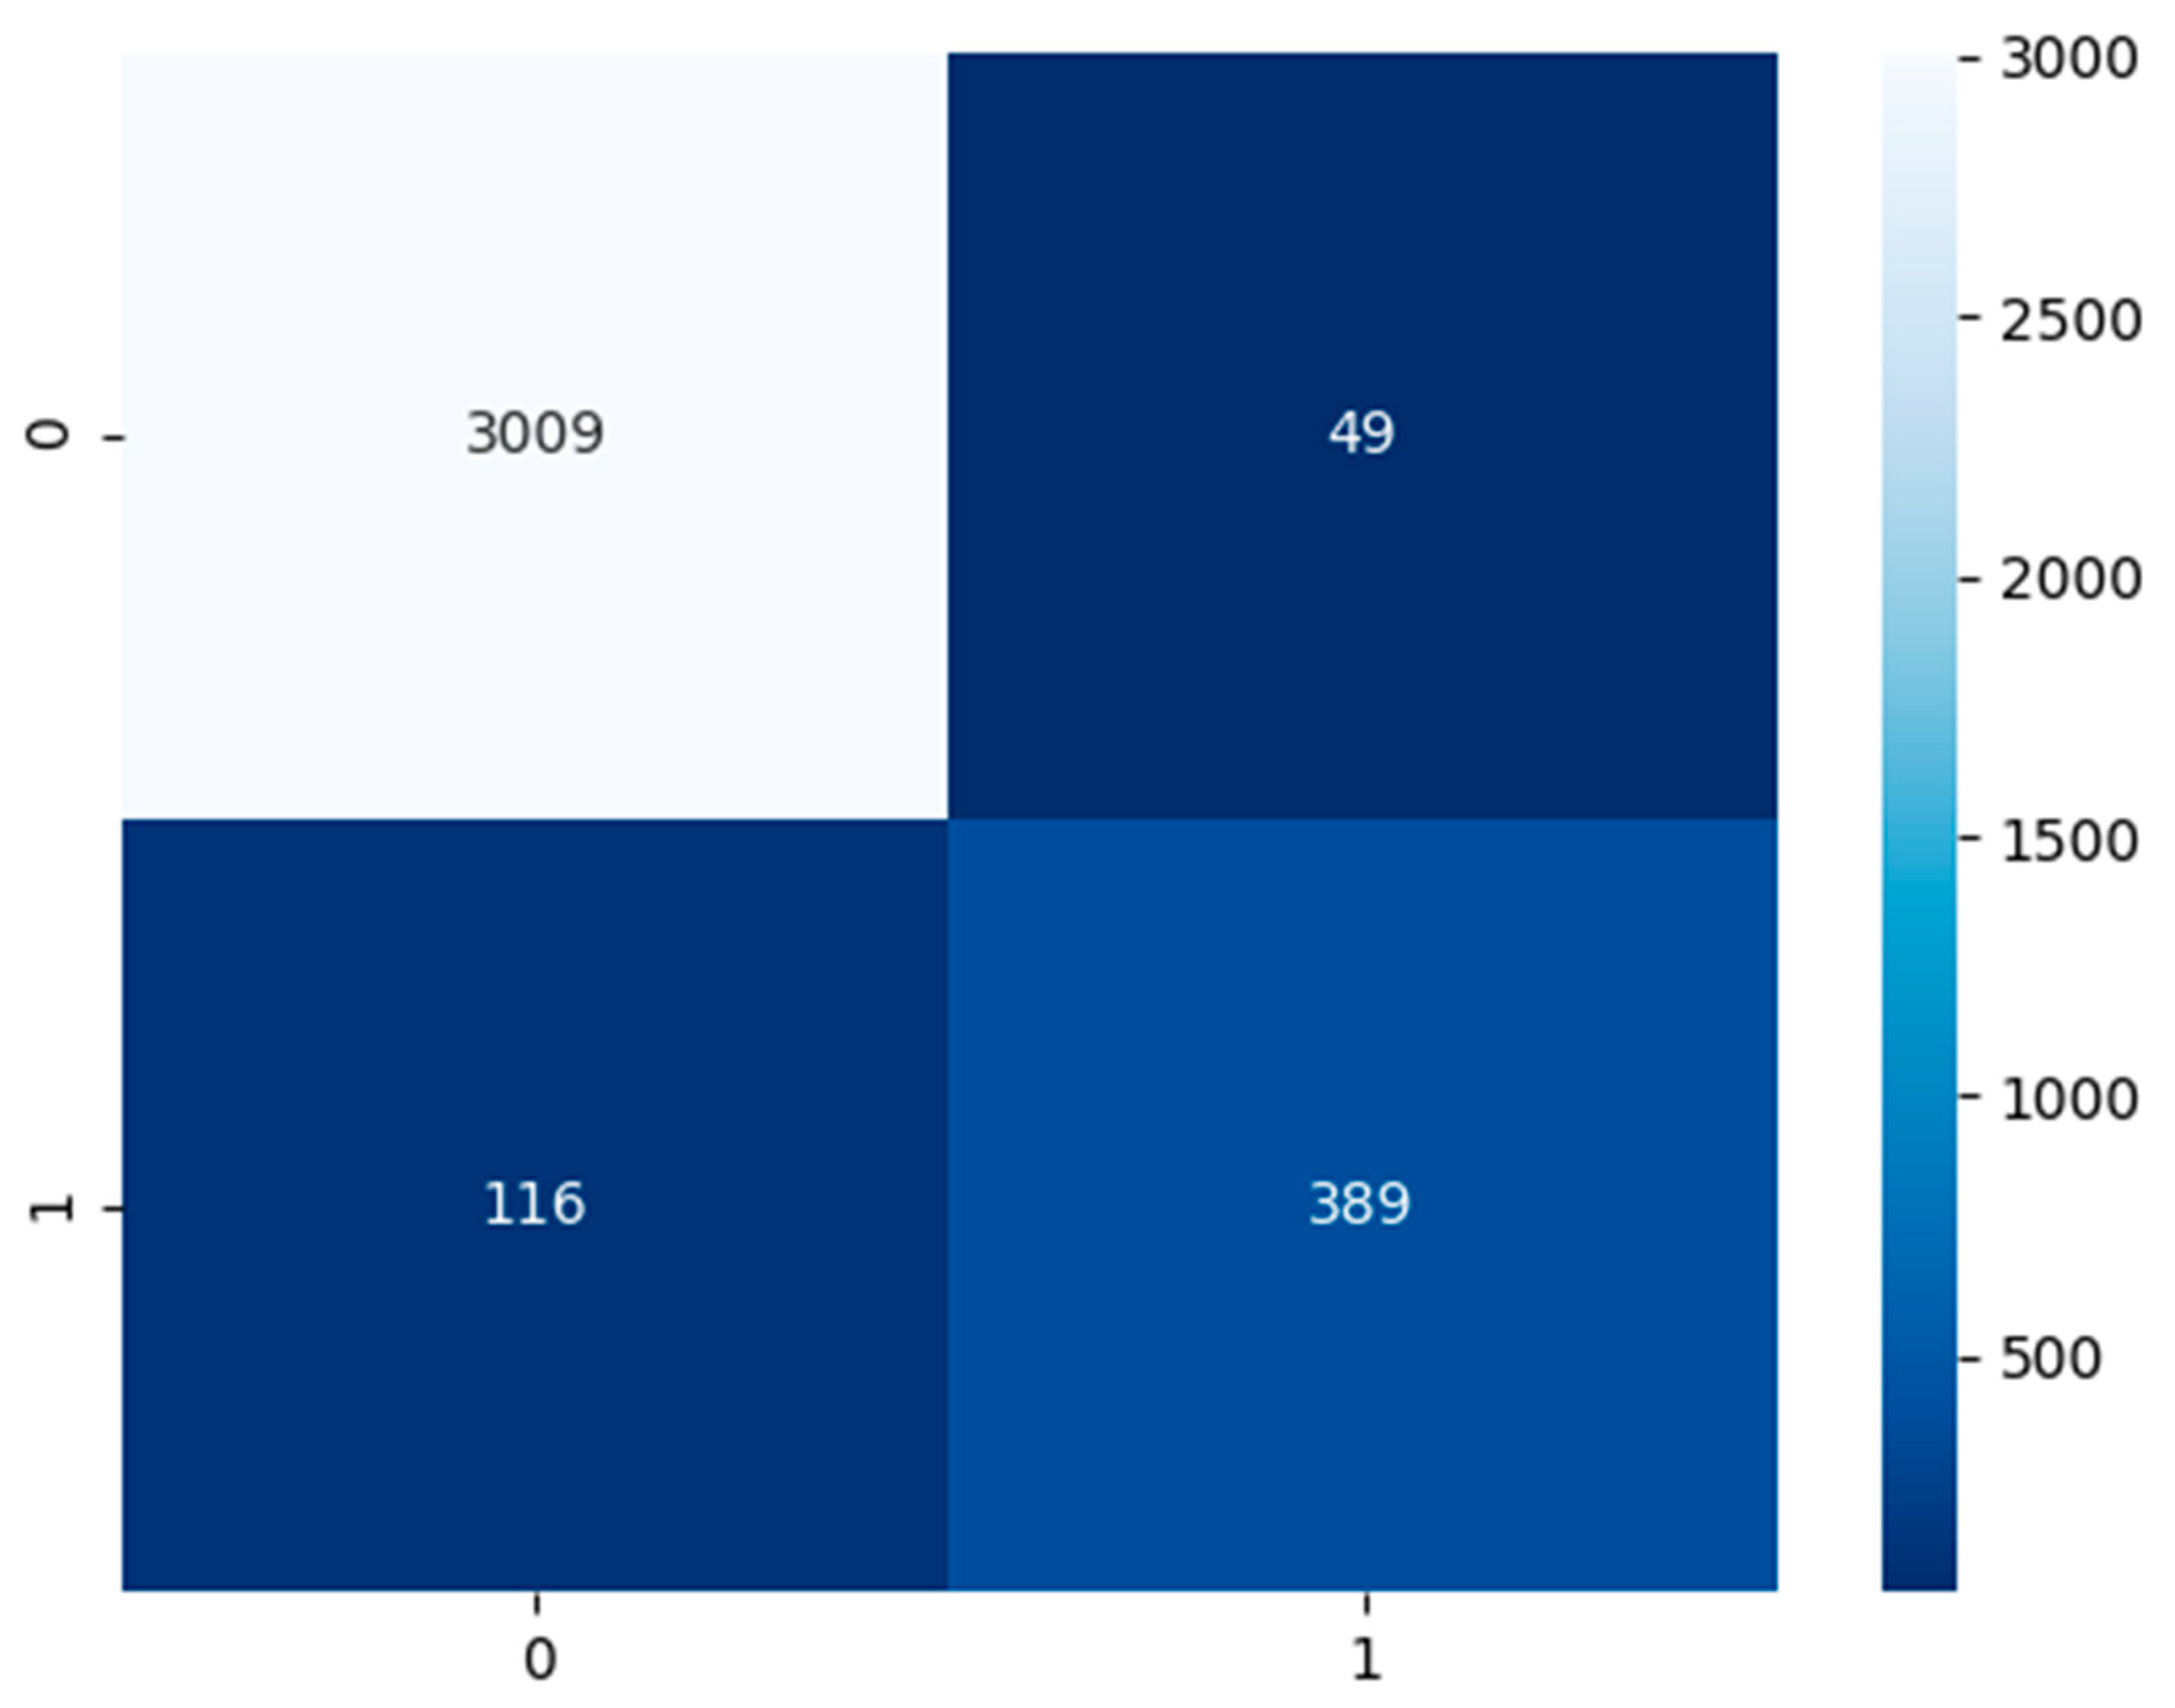
Established in
Figure 6, the COVID-19 CXR model had a test dataset of 3058 false or healthy lungs and 505 true or COVID-19 results. The model has predicted a TP of 3009, TN of 389, FP of 49, and FN of 116.
Based on
Table 4, the performance model in the majority of the area is above 80%. The COVID-19 CXR model has an accuracy of 95%, precision of 89%, recall and sensitivity of 77%, specificity of 98%, and an F1-score of 83%.
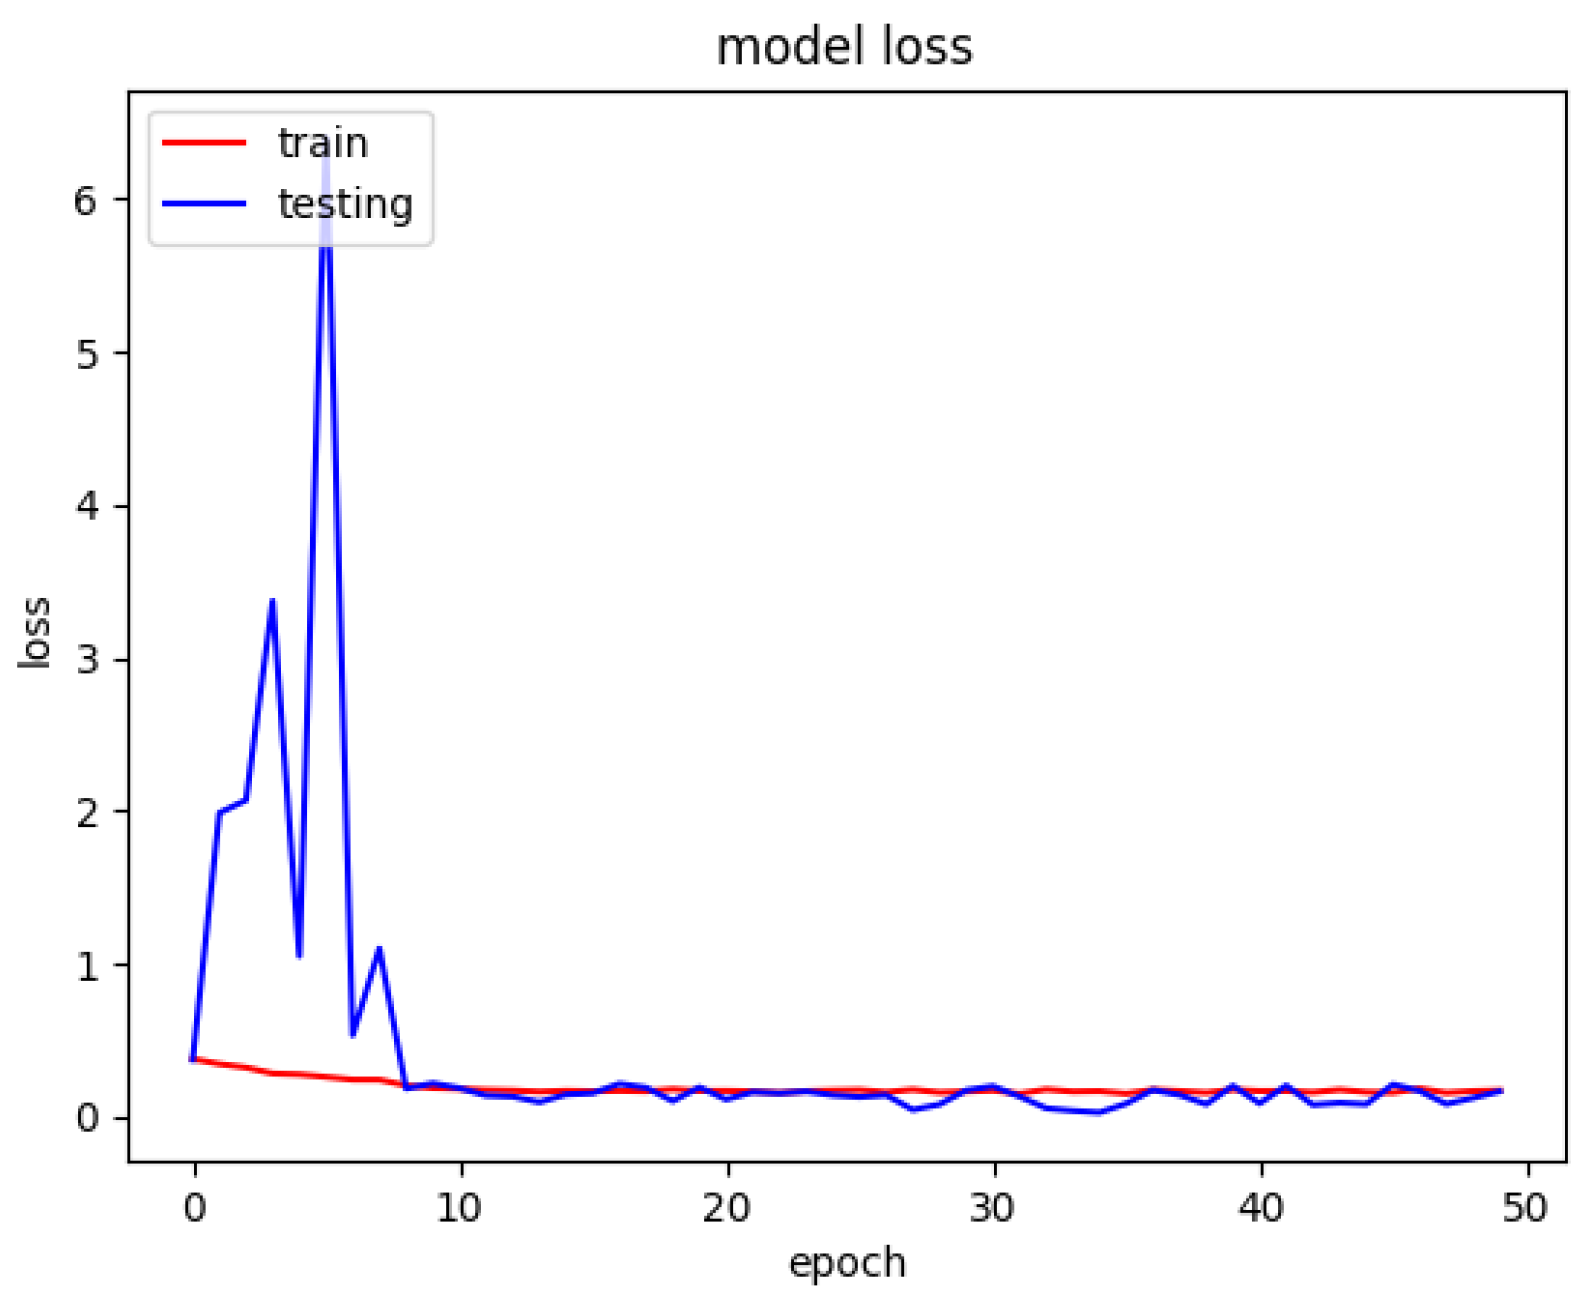
The model loss graph based on
Figure 7, indicates a good fit model with no overfitting and under fitting meaning that the training and testing loss has decreased whereby it is stable with not many fluctuations in between both the lines and there is little to no gap between them.
4.2. Non-COVID-19 CXR Model (Non-COVID-19 Pneumonia and Healthy)
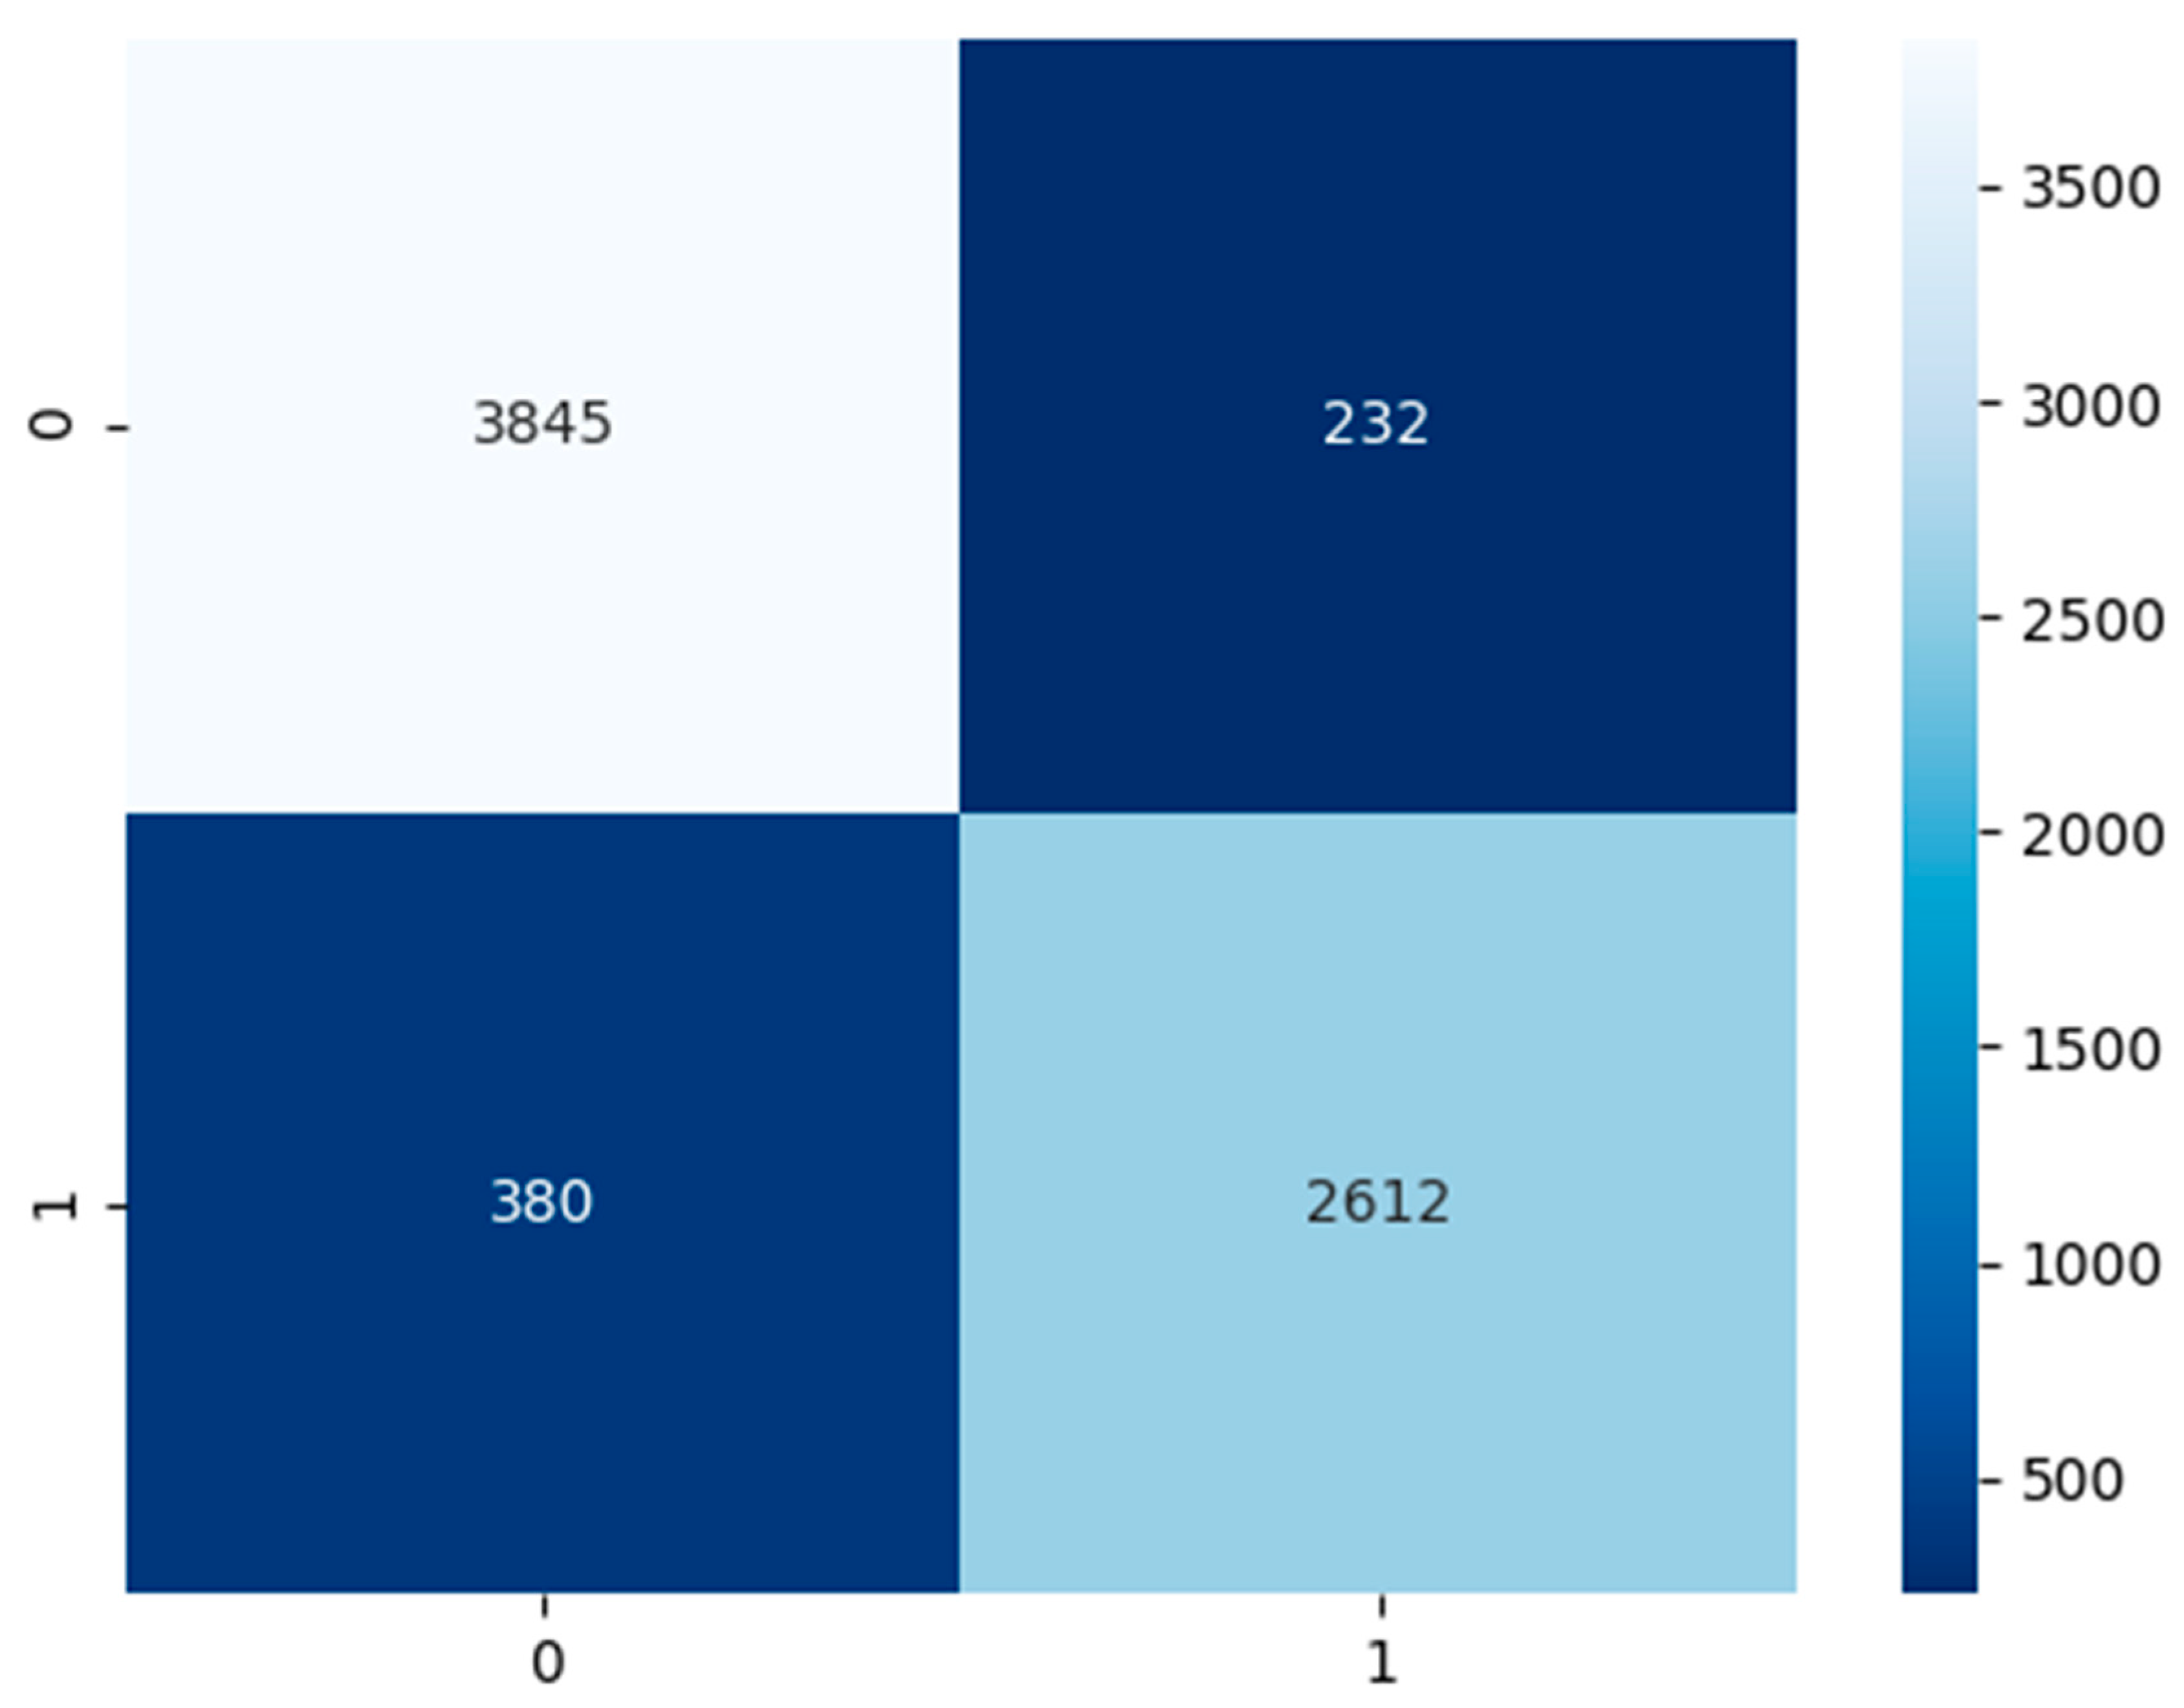
Contingent on
Figure 8 above, the non-COVID-19 pneumonia CXR model had a test dataset of 4077 false or healthy lungs and 2992 true or pneumonia results. The model has predicted a TP of 3845, TN of 2612, FP of 232, and FN of 380.
Based on
Table 5, the performance model in the majority of the area is above 90%. In
Table 5, there are two columns which are performance category which state the category we are evaluating the model for, the result in percentage. The CXR non-COVID-19 pneumonia model has an accuracy of 91%, precision of 92%, recall and sensitivity of 87%, specificity of 94%, and an F1-score of 90%.
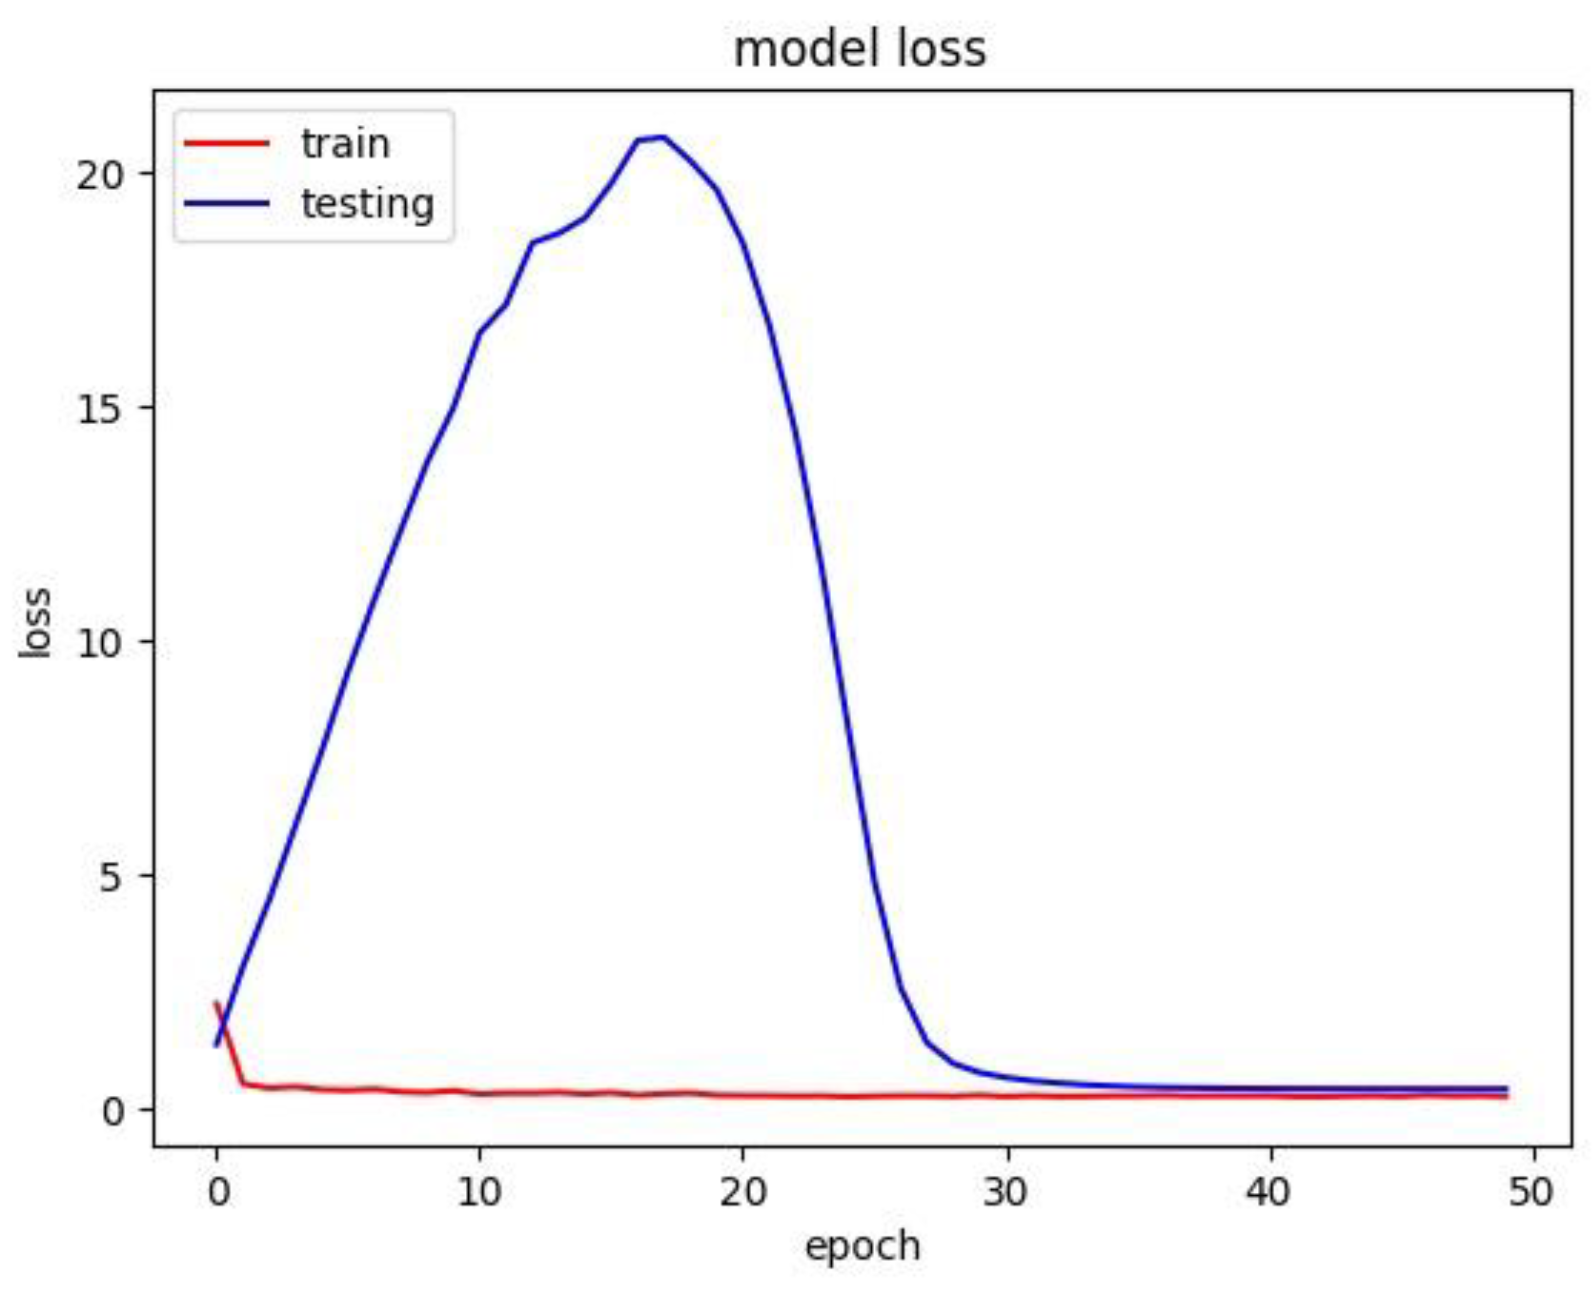
The respective model has trained with a batch size of 32 over 50 epochs. The model loss graph was plotted with the loss against epoch in
Figure 9. The model loss graph is close to a good fit model with less to no overfitting or under fitting.
4.3. COVID-19 Cough Model
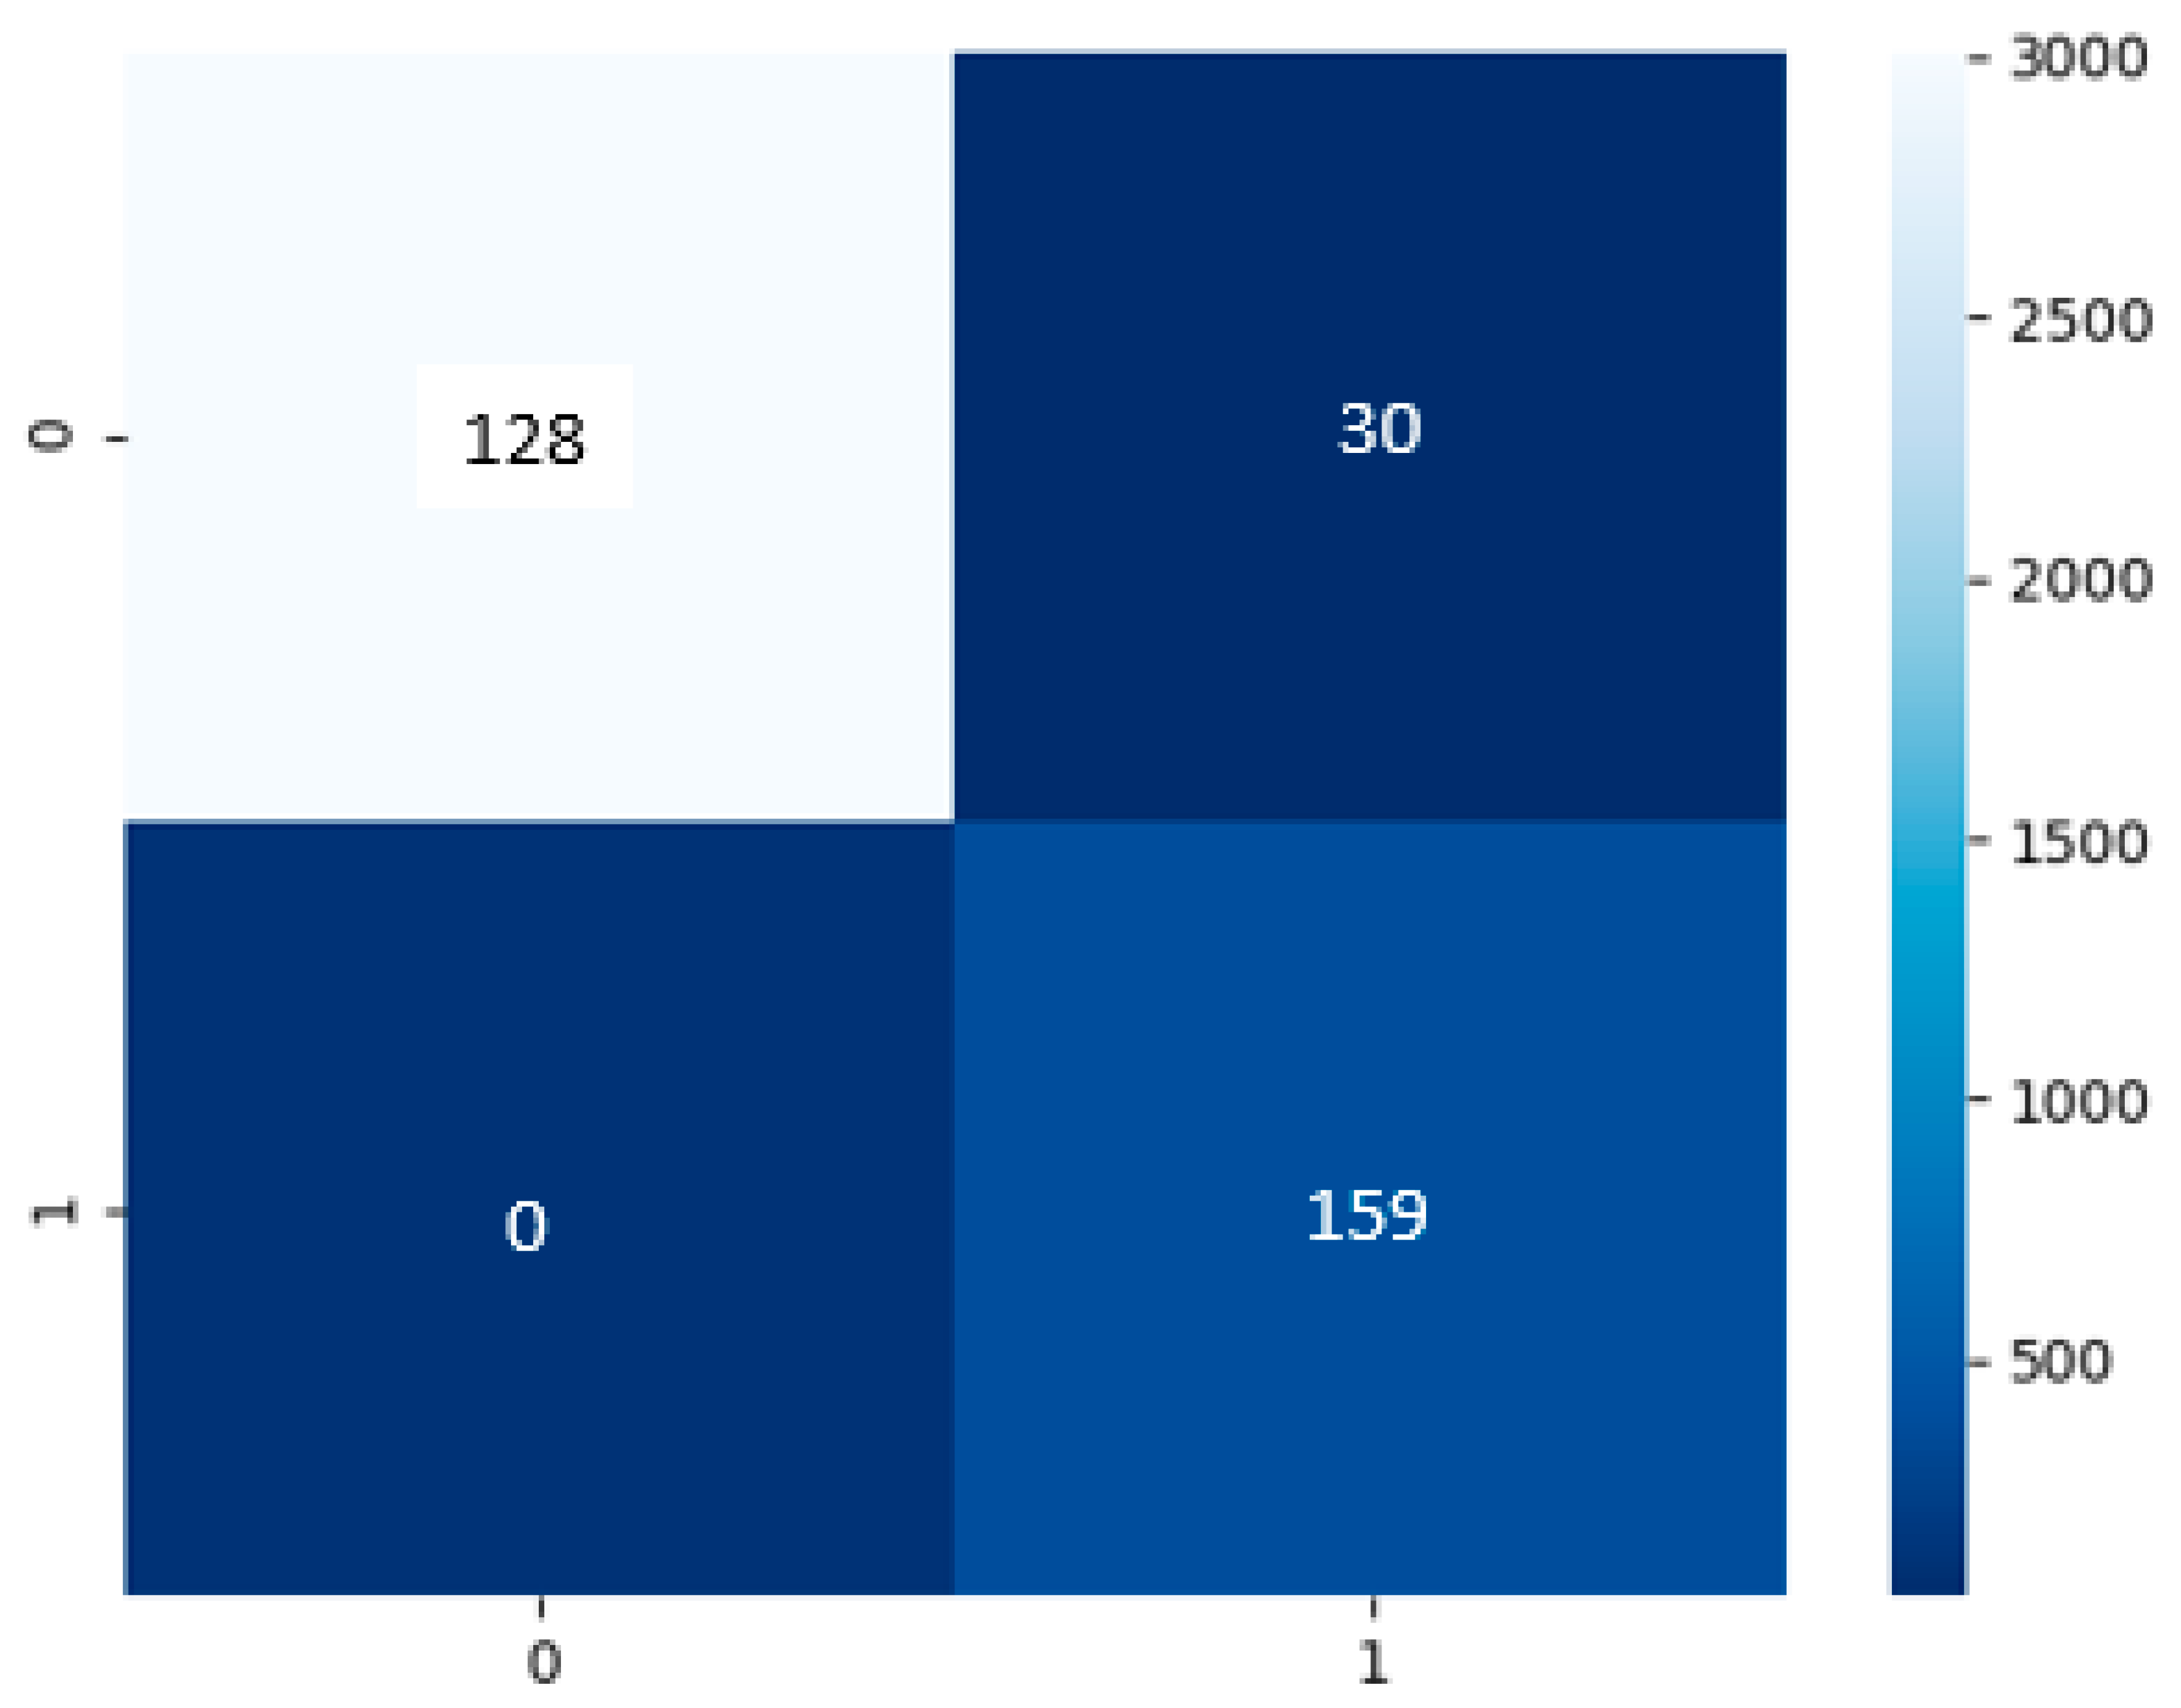
Build on
Figure 10, the cough model had a test dataset of 159 of false or negative COVID-19 results and 158 true or positive COVID-19 results. The model has predicted a TP of 128, TN of 159, FP of 30, and FN of 0.
Based on
Table 6, the performance model in the majority of the area is in the range of 81% to 100%. The cough model has an accuracy of 91%, precision of 84%, recall and sensitivity of 81%, specificity of 100%, and an F1-score of 83%.
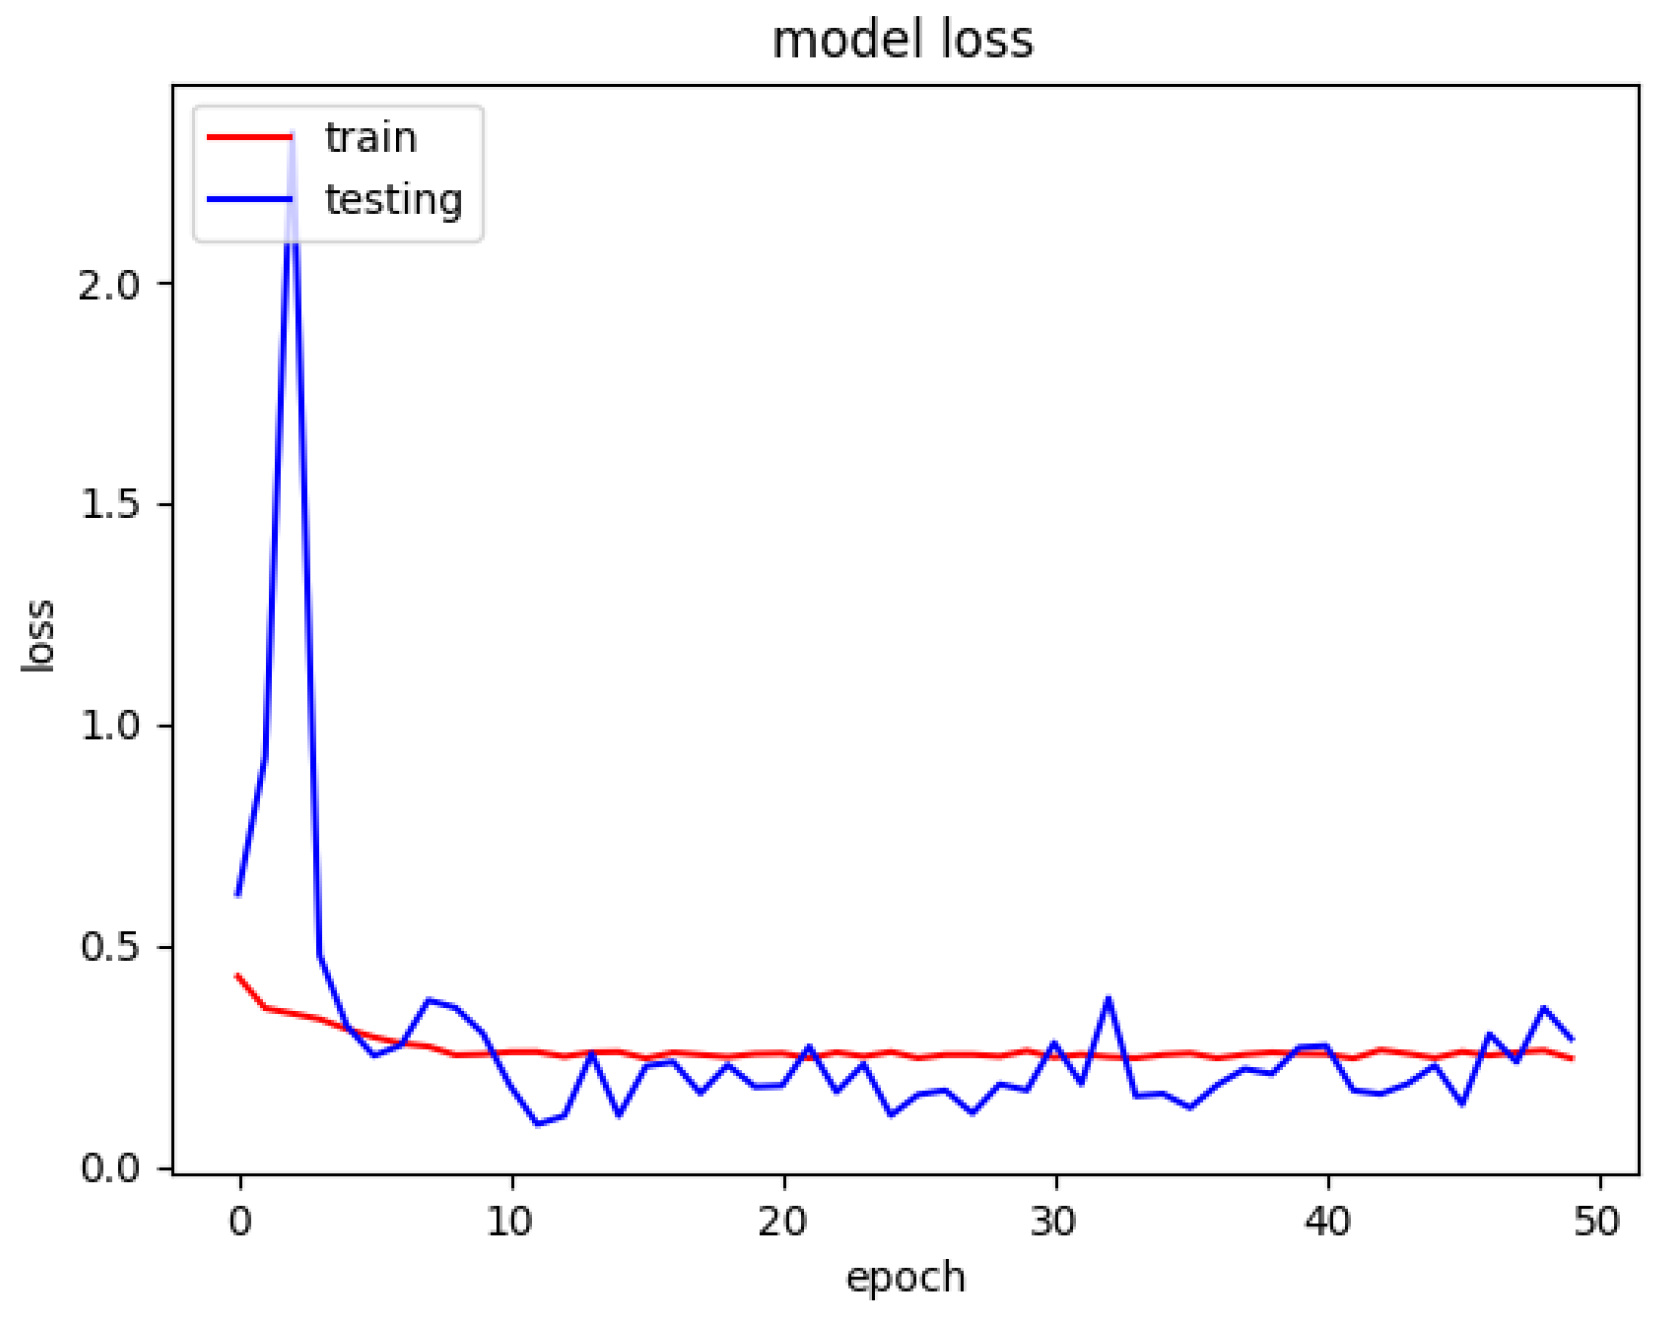
The model loss graph based on
Figure 11, indicates a good fit model with no overfitting and underfitting meaning that the training and testing loss has decreased whereby it is stable with not many fluctuations in between both the lines and there is little to no gap between them. Since the model was trained from scratch and there was not any transfer learning completed, the spike from Epoch Number 1 until Number 20 is on a rise because it was learning from the dataset and Epoch Numbers 20 to 30 that it was downhill because it has learn sufficient information from the data passed to it.
4.4. Diagnosing COVID-19 Using CXR Image and Cough Audio
In an effort to build a reasonable method for less experienced medical personnel to make preliminary diagnoses on both CXR and cough files collected from patients, we developed COVIDNet that allows for less experienced medical personnel to make preliminary diagnoses on both CXR and cough files (datasets). CXR image data and cough Mel-spectrogram images can be used to train the convolutional neural network architecture, which can give rapid diagnosis. The researcher converted the lung sound signals to spectrograms using time-frequency method which is basically the short time Fourier transform (STFT). The researcher believed that using deep learning algorithms would be a better approach whereby the first approach is using a pre-trained deep CNN model for feature extraction and a SVM classifier to classify the lung sounds.
Based on
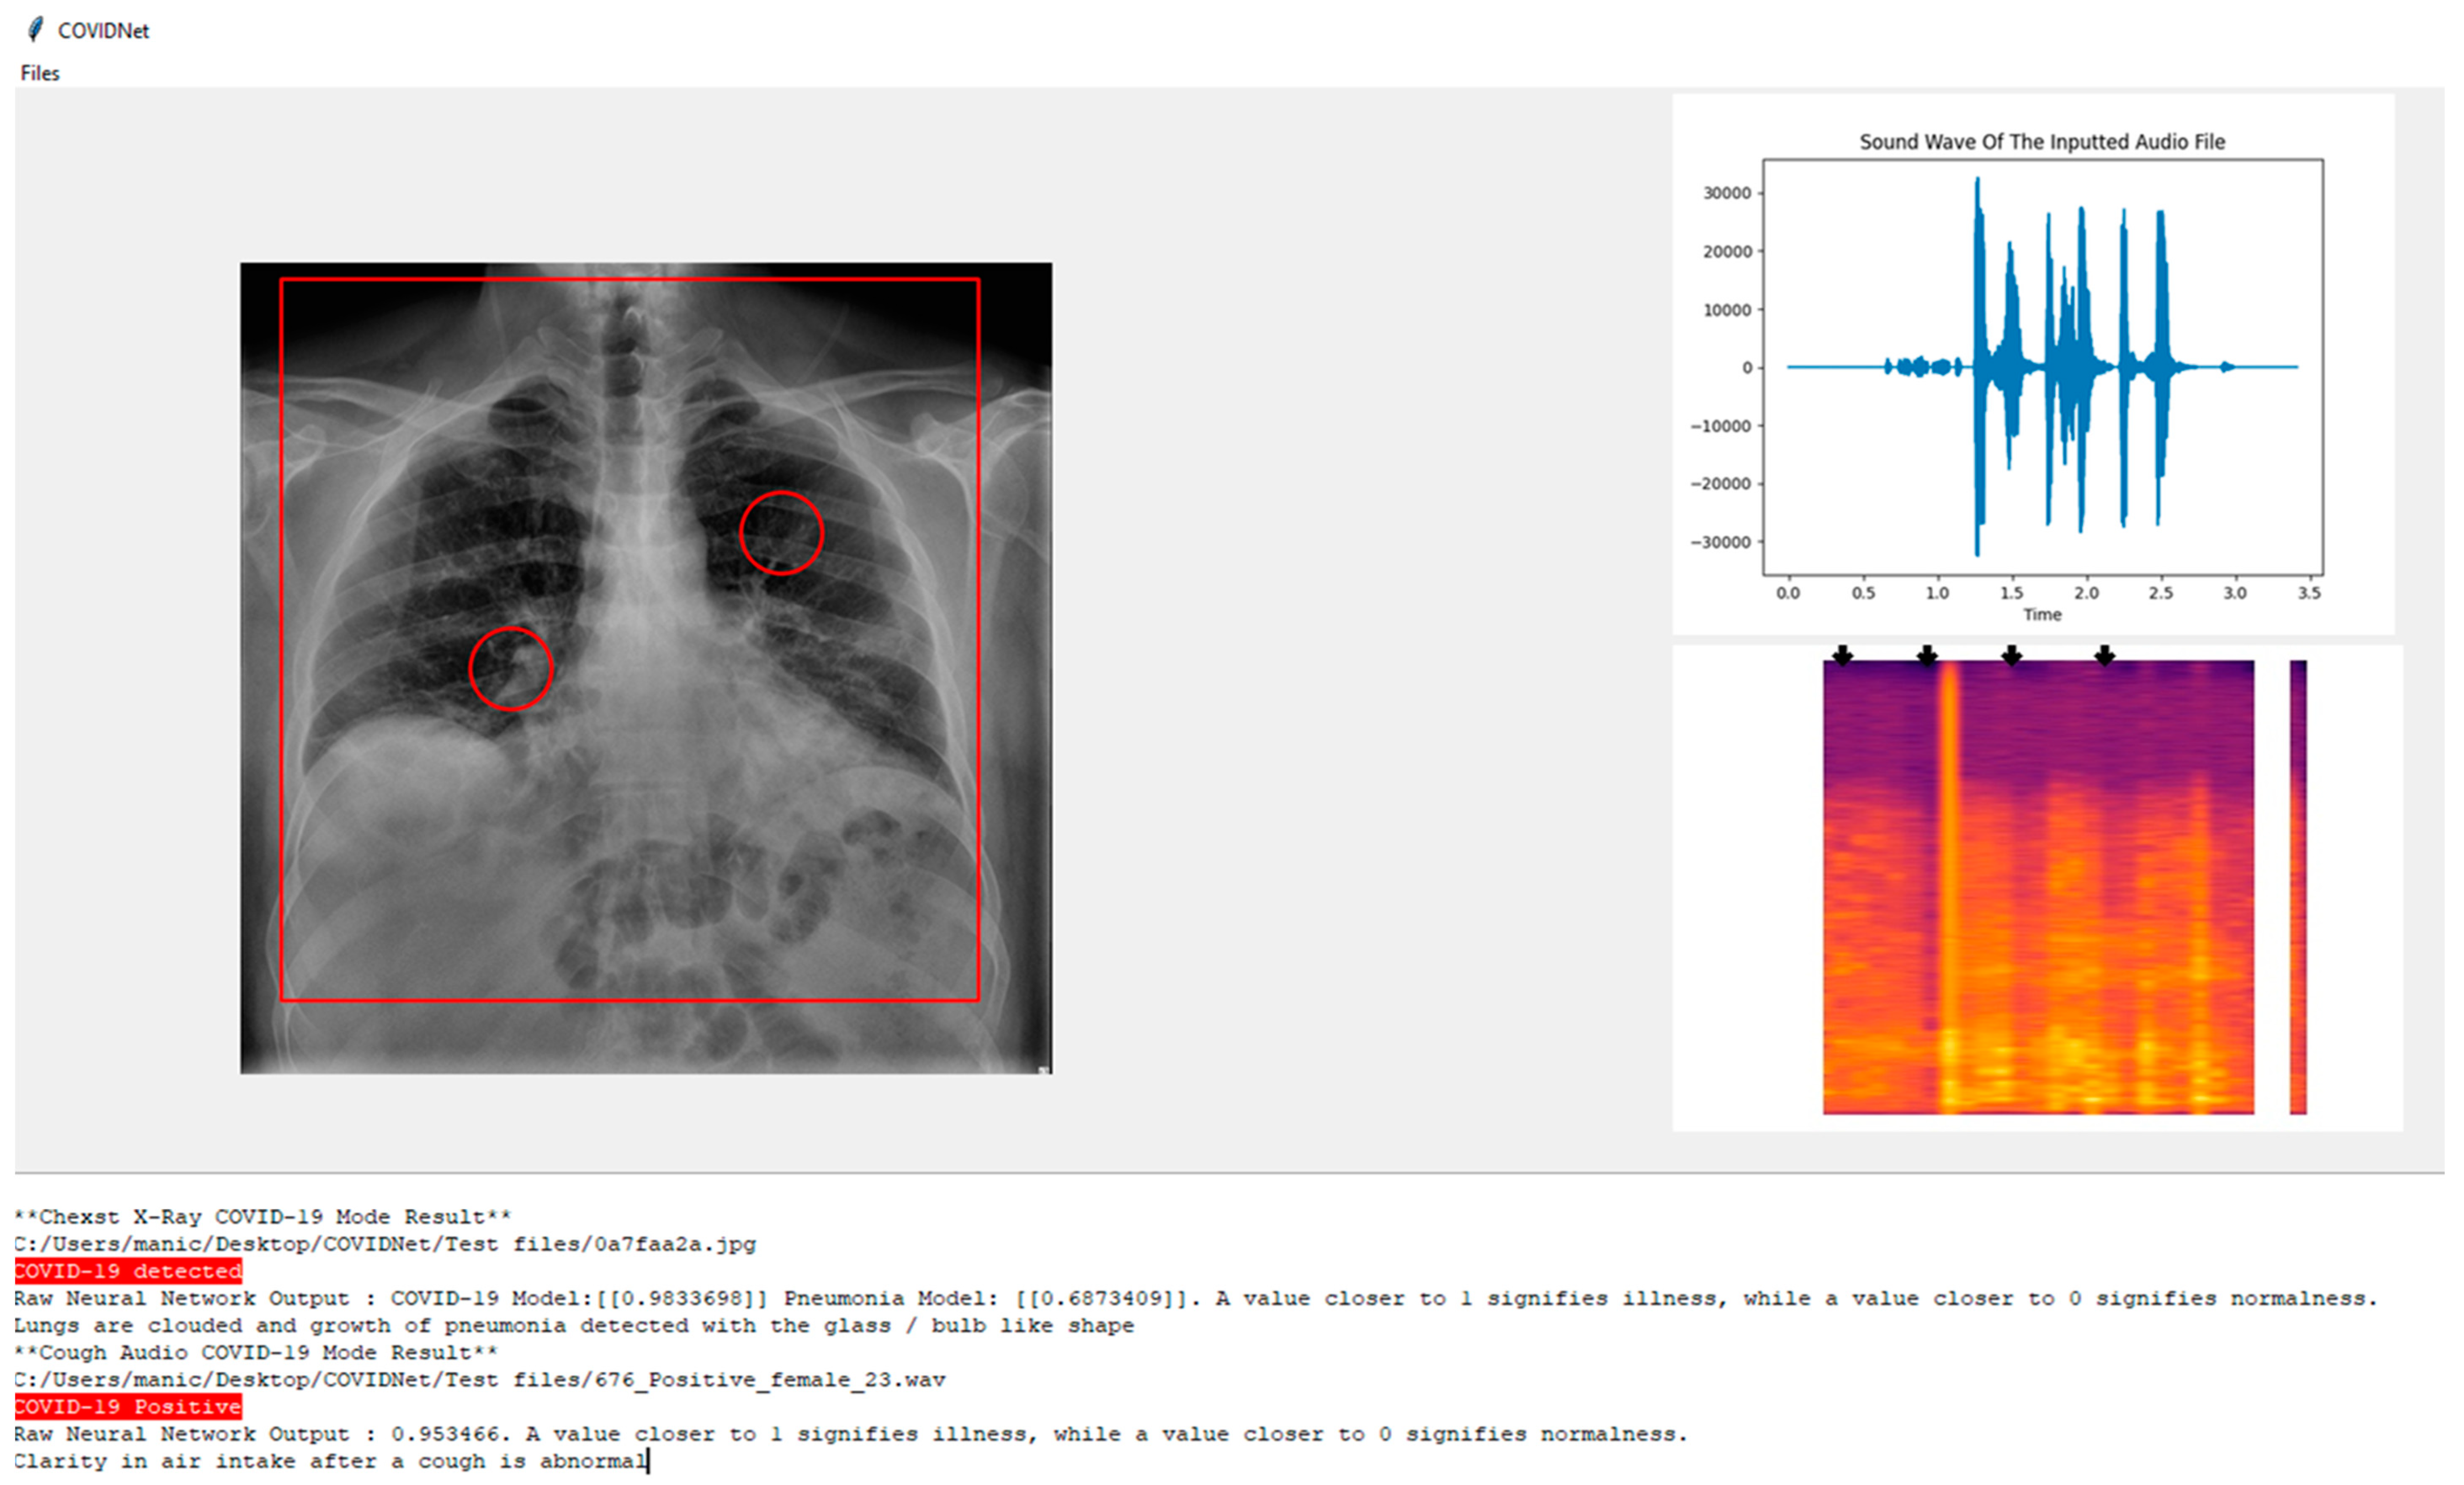
Figure 12, COVIDNet can detect if an individual has COVID-19. In the system below the user has the opportunity to know the area of interest such as the pneumonia growth based on the patient’s CXR image.
In the CXR Image which is displayed it can be seen there is a rectangle shape over the lung highlighting the condition of the lungs and two circles around the bronchus and bronchioles indicating the presence of pneumonia growth if it exists.
On the other hand, for the cough audio file, in the top right, the audio graph is plotted with the soundwave of the input based on the audio file. On the bottom right, the Mel-spectrogram is used and passed to the model to obtain the predicted label and some arrows are used to highlight the parts where the clarity of the air intake after cough is visualized.
At the bottom of the screen in the result section below, the system states whether the CXR image is either COVID-19 positive, non-COVID-19 pneumonia positive, or healthy lungs, and highlights to make it distinctive depending on the predicted label. The inspiration for the design of the UI is obtained from Jordan Micah Bennett Project [
17].


 ,
, 


