Article

Reconstruction of a 3D Human Foot Shape Model Based on a Video Stream Using Photogrammetry and Deep Neural Networks

1
Department of Security, Tomsk State University of Control Systems and Radioelectronics, 634050 Tomsk, Russia
2
Irkutsk Supercomputer Center of SB RAS, 134 Lermontova, 664033 Irkutsk, Russia
*
Author to whom correspondence should be addressed.
Future Internet 2021, 13(12), 315; https://0-doi-org.brum.beds.ac.uk/10.3390/fi13120315
Submission received: 18 November 2021 / Revised: 6 December 2021 / Accepted: 6 December 2021 / Published: 14 December 2021

Abstract

:
Reconstructed 3D foot models can be used for 3D printing and further manufacturing of individual orthopedic shoes, as well as in medical research and for online shoe shopping. This study presents a technique based on the approach and algorithms of photogrammetry. The presented technique was used to reconstruct a 3D model of the foot shape, including the lower arch, using smartphone images. The technique is based on modern computer vision and artificial intelligence algorithms designed for image processing, obtaining sparse and dense point clouds, depth maps, and a final 3D model. For the segmentation of foot images, the Mask R-CNN neural network was used, which was trained on foot data from a set of 40 people. The obtained accuracy was 97.88%. The result of the study was a high-quality reconstructed 3D model. The standard deviation of linear indicators in length and width was 0.95 mm, with an average creation time of 1 min 35 s recorded. Integration of this technique into the business models of orthopedic enterprises, Internet stores, and medical organizations will allow basic manufacturing and shoe-fitting services to be carried out and will help medical research to be performed via the Internet.

1. Introduction

According to statistics [1] from the World Health Organization (WHO), about 80% of people suffer from various diseases of the locomotor system, with 45% having flatfoot. In addition, about 25% of women and 15% of men over 30 years of age suffer from foot diseases associated with wearing uncomfortable shoes.
Many business processes have moved to a remote format in the last two years due to COVID-19. Nowadays, 3D scanning of human body forms is an emerging field, and the results of such studies can significantly improve the quality of virtual fitting, clothing selection, and the detection of medical diseases in a remote format. This paper deals with the reconstruction of the shape of the human foot.
Kulikajev et al. carried out a series of studies [2,3,4] involving 3D reconstruction of the entire human body. These studies were unique due to their consideration of data as objects from an imperfect real-world frame; that is, the original data for reconstruction may include noise, glare, highlights, and low photo quality. Two authors’ datasets were used in the experiments: a dataset containing synthetic data and a dataset containing real-world data. The synthetic dataset included data generated using Blender software, while the real dataset included human poses recorded using two Intel Realsense devices. In the case of the synthetic dataset, the authors specified strict measurement requirements, including the distance from the cameras to the object and to the ground and the tilt angle. When generating the real-world dataset, participants performed specified actions in front of the camera (e.g., raise an arm, touch nose, turn away from the camera). It was noted that in the case of the real dataset, there were no special requirements for the elimination of glare and illumination in the room. The authors’ methodology involved three stages of data processing, including a deep auto-refining adversarial neural network capable of working with real-world depth data of an entire human body. The results were obtained according to EarthMover and Chamfer distance metrics as 0.059 and 0.079, respectively. The processing of noisy real-world data was possible due to the authors’ approach of training the adversarial auto-refiner. The addition of adversarial refinement to the network allowed this approach to work with real-world depth-sensor data. The authors also paid attention to the quality of reconstruction depending on the sex of the subjects and the position of the body, considering the possibility of the network being able to restore the distinctly male or female features. The obtained results significantly improved various processes, including virtual fitting, the selection of clothes, and the detection of diseases in a remote format. The purpose of this work was to create a 3D model of the foot suitable for the individual tailoring of shoes. Since the human foot has some anatomical features that require measurements to the nearest millimeter, attention should be paid to the accurate reconstruction of the foot as a separate object of the human body. In the case of reconstruction of the whole body, an error of a few millimeters is acceptable, but when sewing shoes, this can lead to complications of existing foot diseases due to discomfort from shoes being the wrong size.
Traditional methods of foot reconstruction, such as the use of stationary laser scanners or plaster castings, cannot be completed with only remote participation from the customer. Orthopedic tailoring of individual shoes is a complicated process due to many different factors, such as individuals having swollen feet, various diseases, and missing parts of the foot. Therefore, in order for custom orders to be completed, companies currently need to operate logistics centers or open branch offices in different cities.
This study considers the use of modern computer vision algorithms, photogrammetry, and machine-learning methods to create 3D foot models based on a video stream obtained from a smartphone. Existing analog approaches often focus only on the extraction of foot parameters for size recommendations in online stores, but not on the full reconstruction of the foot shape. Full reconstruction includes the lower arch, which is particularly important because it is impossible to sew shoes without this information. As such, the creation of a methodology and development of a mobile application based on this information will allow orthopedic enterprises to improve the technological process of manufacturing individual shoes and enable them to fulfill custom orders remotely.
The scientific novelty of this work lies in the reconstruction of 3D human foot models, including the lower arch, using photogrammetry and deep NNs. To obtain a high-quality 3D model, a series of RGB images were obtained via processing of a standard video recording. The offered technique can be modified and used in the field of medical diagnostics of orthopedic diseases.
Additionally, 3D models obtained based on the presented methodology can be used in the following areas:
  • Orthopedic tailoring of individual shoes. Enterprises can use 3D models for subsequent printing on industrial 3D printers and for the construction of individual shoes based on the original pads;
  • Medical diagnostics. Medical staff with orthopedic qualifications will be able to diagnose the initial stages of diseases affecting the human locomotor system via a remote format;
  • Online shoe selection. People who actively use online stores often lack necessary information regarding their shoe size or face a discrepancy in the size grid. The methodology allows them to accurately determine their size, according to the dimensional grid, down to the millimeter.
The purpose of this study was to develop a technique that involves using a standard smartphone video camera as a tool for obtaining 3D models of the human foot shape, including the lower arch.
Section 2 analysis of existing technology solutions provides a summary analysis containing information on current products on the market and technologies for 3D scanning. The details about the proposed methodology are subsequently determined in Section 3. This section presents a methodology of reconstructing the 3D foot shape and describes dataset formation, feature extraction and matching, structure from motion, segmentation foot images, the dataset for training, the neural network, estimation and filtering, depth maps, and a complete scheme of the approached methodology. Information about the experiments performed is contained in Section 4. The experiments section also includes information on training the neural network, the effects of various feature-extraction algorithms and resolutions on quality, and standard deviations. Section 5, Discussion, presents the possible limitations of the developed methodology. A summary of the results is provided in Section 6, Conclusions.

2. Analysis of Existing Technology Solutions

2.1. Developed Products and Applications

Today, there are several software products that functionally include the reconstruction of 3D models of human feet.
For instance, 3D Avatar feet [5] is a mobile application developed by Instituto de Biomecanica (IBV), Valencia, Spain. This system enables obtaining a reconstructed 3D foot model based on three images. The system is based on principal component analysis (PCA) [3], and its application on 40 parameters allows the creators to obtain the maximum error of 1.7 mm on length and width rates. At the output, the user receives a summary of more than 20 parameters (length, width, different foot girths) and a 3D model in STL/PLY format. However, a significant disadvantage of the system is the absence of an individual reconstructed lower arch of the 3D model. This fact makes it only applicable for shoe size recommendations and not for orthopedic tailoring.
FITTIN [6] is a piece of software that was developed by a Russian IT enterprise. The authors of the system offer the user two methods for 3D reconstruction with the help of special sensors and on the basis of a series of images obtained from a smartphone. The FITTMScope device [7] consists of a camera and special probes, which it is assumed are to be used when working with special sensors. Information about the position of each probe is collected in real-time by the built-in mini-video camera with illumination. Indicator probes provide information about cross-sections of the inner surface in each shot, and the data obtained are then converted into a non-linear space or three-dimensional coordinate system, and the initial point cloud is formed into a 3D model. In the case of a series of images to calibrate measurements, the authors suggest using a white sheet of A4 paper or other items such as a coin, a bank card, or a ruler. By taking a circular photo, the system converts the series of images into a lower resolution to simplify the calculations. After that, the contour of the foot is highlighted on the A4 sheet. The extracted unique voxels further form a polygonal mesh (3D model). The noted disadvantage of the product is a large linear error (1.3 mm). This method is well suited for virtual shoe fitting or size recommendations but not for reconstructing the shape of the foot.
The authors of the DomeScan/IBV [8] solution suggest using a small universal scanner for home use, which weighs less than 5 kg. The developers state that the scanning time for this product is less than 0.1 s, and the 3D reconstruction time is less than one minute. The mathematical methods for reconstruction are based on PCA. In the study [9], the authors conducted experiments and scanned 16 human feet (8 men and 8 women), which resulted in a linear measurement deviation of less than 0.97 mm.
Volumental [10] is a mobile application for Apple devices. The application is based on the use of a special LiDAR depth sensor, which has been integrated into Apple mobile devices since the iPhone 12 Pro. This solution makes it possible to obtain output information in the form of generated foot size parameters, instep height, foot width, arch height, and a 3D model. The developers state that their solution has already scanned around 22 million feet for more than 2500 online stores. Further, it should be noted that the deviation of the three-dimensional reconstruction method by linear measurements is about 5 mm, which corresponds to half the shoe size, and this is much higher than that of analogs mentioned earlier.
Analysis of the listed products points to the conclusion that the issue of creating a system for reconstructing the 3D shape of the human foot remains relevant today. Therefore, it is necessary to analyze a set of methods and tools to achieve this goal.

2.2. Methods, Tools, and Techniques

Approaches to the 3D reconstruction of the human foot based on computer vision algorithms can be divided into three types: the use of special sensors, classical stereometry algorithms, and machine-learning methods.
The authors of [11] suggest using the Microsoft Kinect device [12,13]. Special construction is used to automate the process. This construction consists of a small table and an engine that rotates the device around the human foot. The scanning angle, in this case, is 270 degrees. To obtain a series of depth images, a point cloud is constructed, which is then filtered using the iterative closest point (ICP) algorithm [14]. Finally, a 3D model of the foot is generated. The authors state that the use of this method makes it possible to achieve a maximum deviation of 0.85 mm in linear measurements while reconstructing the lower arch.
Other works [15,16] use modern portable IntelRealsense depth scanners. Researchers of the method used in [17] assume that for a full-fledged reconstruction, including a lower arch, it is necessary to use four angles with a difference of 90 degrees. These four depth images are used for several transformations involving merging, point cloud building, and smoothing. After this post-processing, the extra reconstructed objects are performed. Thus, the deviation of length and width measurements is 0.355 mm. The authors of the method in [18] suggest using smartphones with integrated depth sensors (LiDAR, Face ID, etc.) to obtain a 3D model. The authors used the PCA method to establish the final 3D model, in addition to the point cloud obtained by a circular foot survey. The main idea of the approach is to create a deformable model based on 63 sets of feet. Applying the PCA method minimizes model shape error. Based on the 12 parameters extracted by the authors, the researchers achieved a coverage of 93% of the manually measured parameters. RANSAC is used as a segmentation algorithm, which works with a point cloud and is known as a stable method for estimating model parameters based on random samples. The experiments showed that the presented method has a deviation of 1.13 mm.
The developers of the Sensock method [19] used their own sensor, which consists of four stretchable sensors made of silk fibrin threads. The authors determined four characteristic girths of the foot based on the available knowledge of anatomy and measured their length using the resistance value of the stretched sensors. Based on these extracted parameters, a 3D model can be constructed. As an experiment, the researchers recruited 15 men and 10 women and used their feet for 10 sessions of reconstruction. The authors used standard deviation to estimate the error on the studied parameters; in the case of linear measurements, the average deviation was 1.01 mm.
The advantages of using special sensors include high accuracy compared to other methods (minimal deviation) and the quickest time creating 3D models. The disadvantages are the high cost of the sensors and smartphones that support laser scanning.
In [20], the approach and methods of photogrammetry [21,22] were used. By performing serial circular photography with a smartphone, the authors used the feature-extraction and -matching algorithm SIFT [23]. The essence of SIFT is to form a set of feature descriptors on the images. Three-dimensional space is formed based on extracted and matched features, which then allows for the construction of a sparse point cloud (Structure-from-Motion). After, the RANSAC algorithm selects points that are connected to each other and removes unconnected points. After these stages, a dense point cloud model is constructed using the PMVS tool [24]. Based on this model, polygons for the 3D shape of the human foot are generated, and textures are constructed. Post-processing of the 3D model includes the removal of unnecessary reconstructed objects and backgrounds. Based on experiments conducted by the authors, the error in linear measurements, such as the length and width of the foot, was found to be 1.09 mm and 1.07 mm, respectively.
The authors of [25] used OpenMVG algorithms for 3D reconstruction of the human body shape [26]. To obtain a 3D model, a circular video recording is used to take a number of 2D images. Camera calibration and sparse point cloud formation are performed in VisualSFM tools software. Additionally, the method includes the extraction and matching of informative features based on the SIFT algorithm. Then, each image in the set is manually segmented to remove noise and extra objects. Depth maps are generated based on the segmented images in the dataset. Based on the generated depth maps, a dense point cloud and a 3D human model are created. Thus, after manual processing, the reconstructed 3D models can be used for printing.
In [27], the author used 50 images of feet obtained with a 48-megapixel smartphone camera to perform 3D reconstruction using Autodesk Recap, Meshroom, and 3DF Zephyr photogrammetric software. The processing of the 3D models was performed using specialized Autodesk Meshmixer software. After, the 3D model was printed on a special printer, and the individual orthopedic insole was made according to the physical model.
The advantages of using classical stereometry algorithms and photogrammetry approaches are their flexibility and high accuracy of 3D reconstruction. In data processing, it is possible to monitor the changes step by step and make adjustments to the algorithms that affect the errors in the 3D model. The disadvantages are the high requirements for the computer and the slow processing of calculations.
Machine-learning-based approaches allow for the automatic extraction of informative features. Using these features, a 3D model can be constructed. One of the steps in the process of obtaining a 3D model is the segmentation or extraction of the foot contour. The quality of segmented images directly affects the accuracy of 3D models. The lack of important segments usually leads to the incorrect extraction of informative features, which worsens the quality of the reconstruction. Models based on machine-learning techniques are usually used as tools for segmentation.
The author of [28] proposed the use of the following convolutional network architectures (CNN): ENet [29], LinkNet [30], MobileSeg [31], and FastLinkNet. The dataset for training was 111 images obtained by manual extraction of the foot contour, as well as the augmentation process, which was applied to the training sample. The following metrics were used to evaluate the results obtained: mean pixel accuracy, mean IoU, and mean dice. The best segmentation accuracy on the validation dataset was achieved using MobileSeg architecture. The scores for each of the proposed metrics were 97.78%, 95.52%, and 97.64%, respectively.
In [32], a CNN U-Net [33] was used for segmentation. The model was trained on 1601 images of foot silhouettes. Using PCA on 10 foot parameters, the authors applied a trained regression model that predicts parameter coefficients, the dimensions of these foot silhouettes, and the corresponding camera coordinates in space at the time of the shooting. The network architecture for building 3D models is a three-stage system consisting of an encoder, combinator, and decoder. The input for the neural network (NN) is the foot-shape silhouette and the predicted camera coordinates in space. The encoder can be replicated as many times as there are input images. All formed vectors are combined into several vectors for all of the obtained features. These vectors are fed to the decoder, which in turn regresses the coefficients of the PCA on 10 parameters. A 3D model of the human foot shape is obtained by applying inverse component analysis to the length and width coefficients. Based on the experiments, the error of the foot length on the real data was found to be 4 mm and 1 mm for the artificially generated data.
In [34], deep NNs were used. These networks are based on the one input image, which is represented as a depth map. As a dataset for the training network, the authors used the 4301 3D human body model CAESAR [35]. The points associated with the left and right foot were selected for each model in the dataset. Thus, after this process, the dataset increased to 8602 3D models. Then, to visualize the images using the Panda3D tool, 128 × 128 pixels foot depth maps were obtained and fed to the CNN input for training. Using only one depth map image as the model input, a 3D point cloud was formed with an error of 2.92 ± 0.72 mm.
The advantages of using machine-learning methods include the efficiency of data processing, the ability to automate the process of recognizing the initial stage of foot disease, and the high accuracy of foot contour extraction (segmentation). The disadvantages include a significant deviation relative to the methods presented earlier. They also lack a universal 3D reconstruction approach, which would allow for the step-by-step tracking of the changes involved in creating a 3D foot shape model.

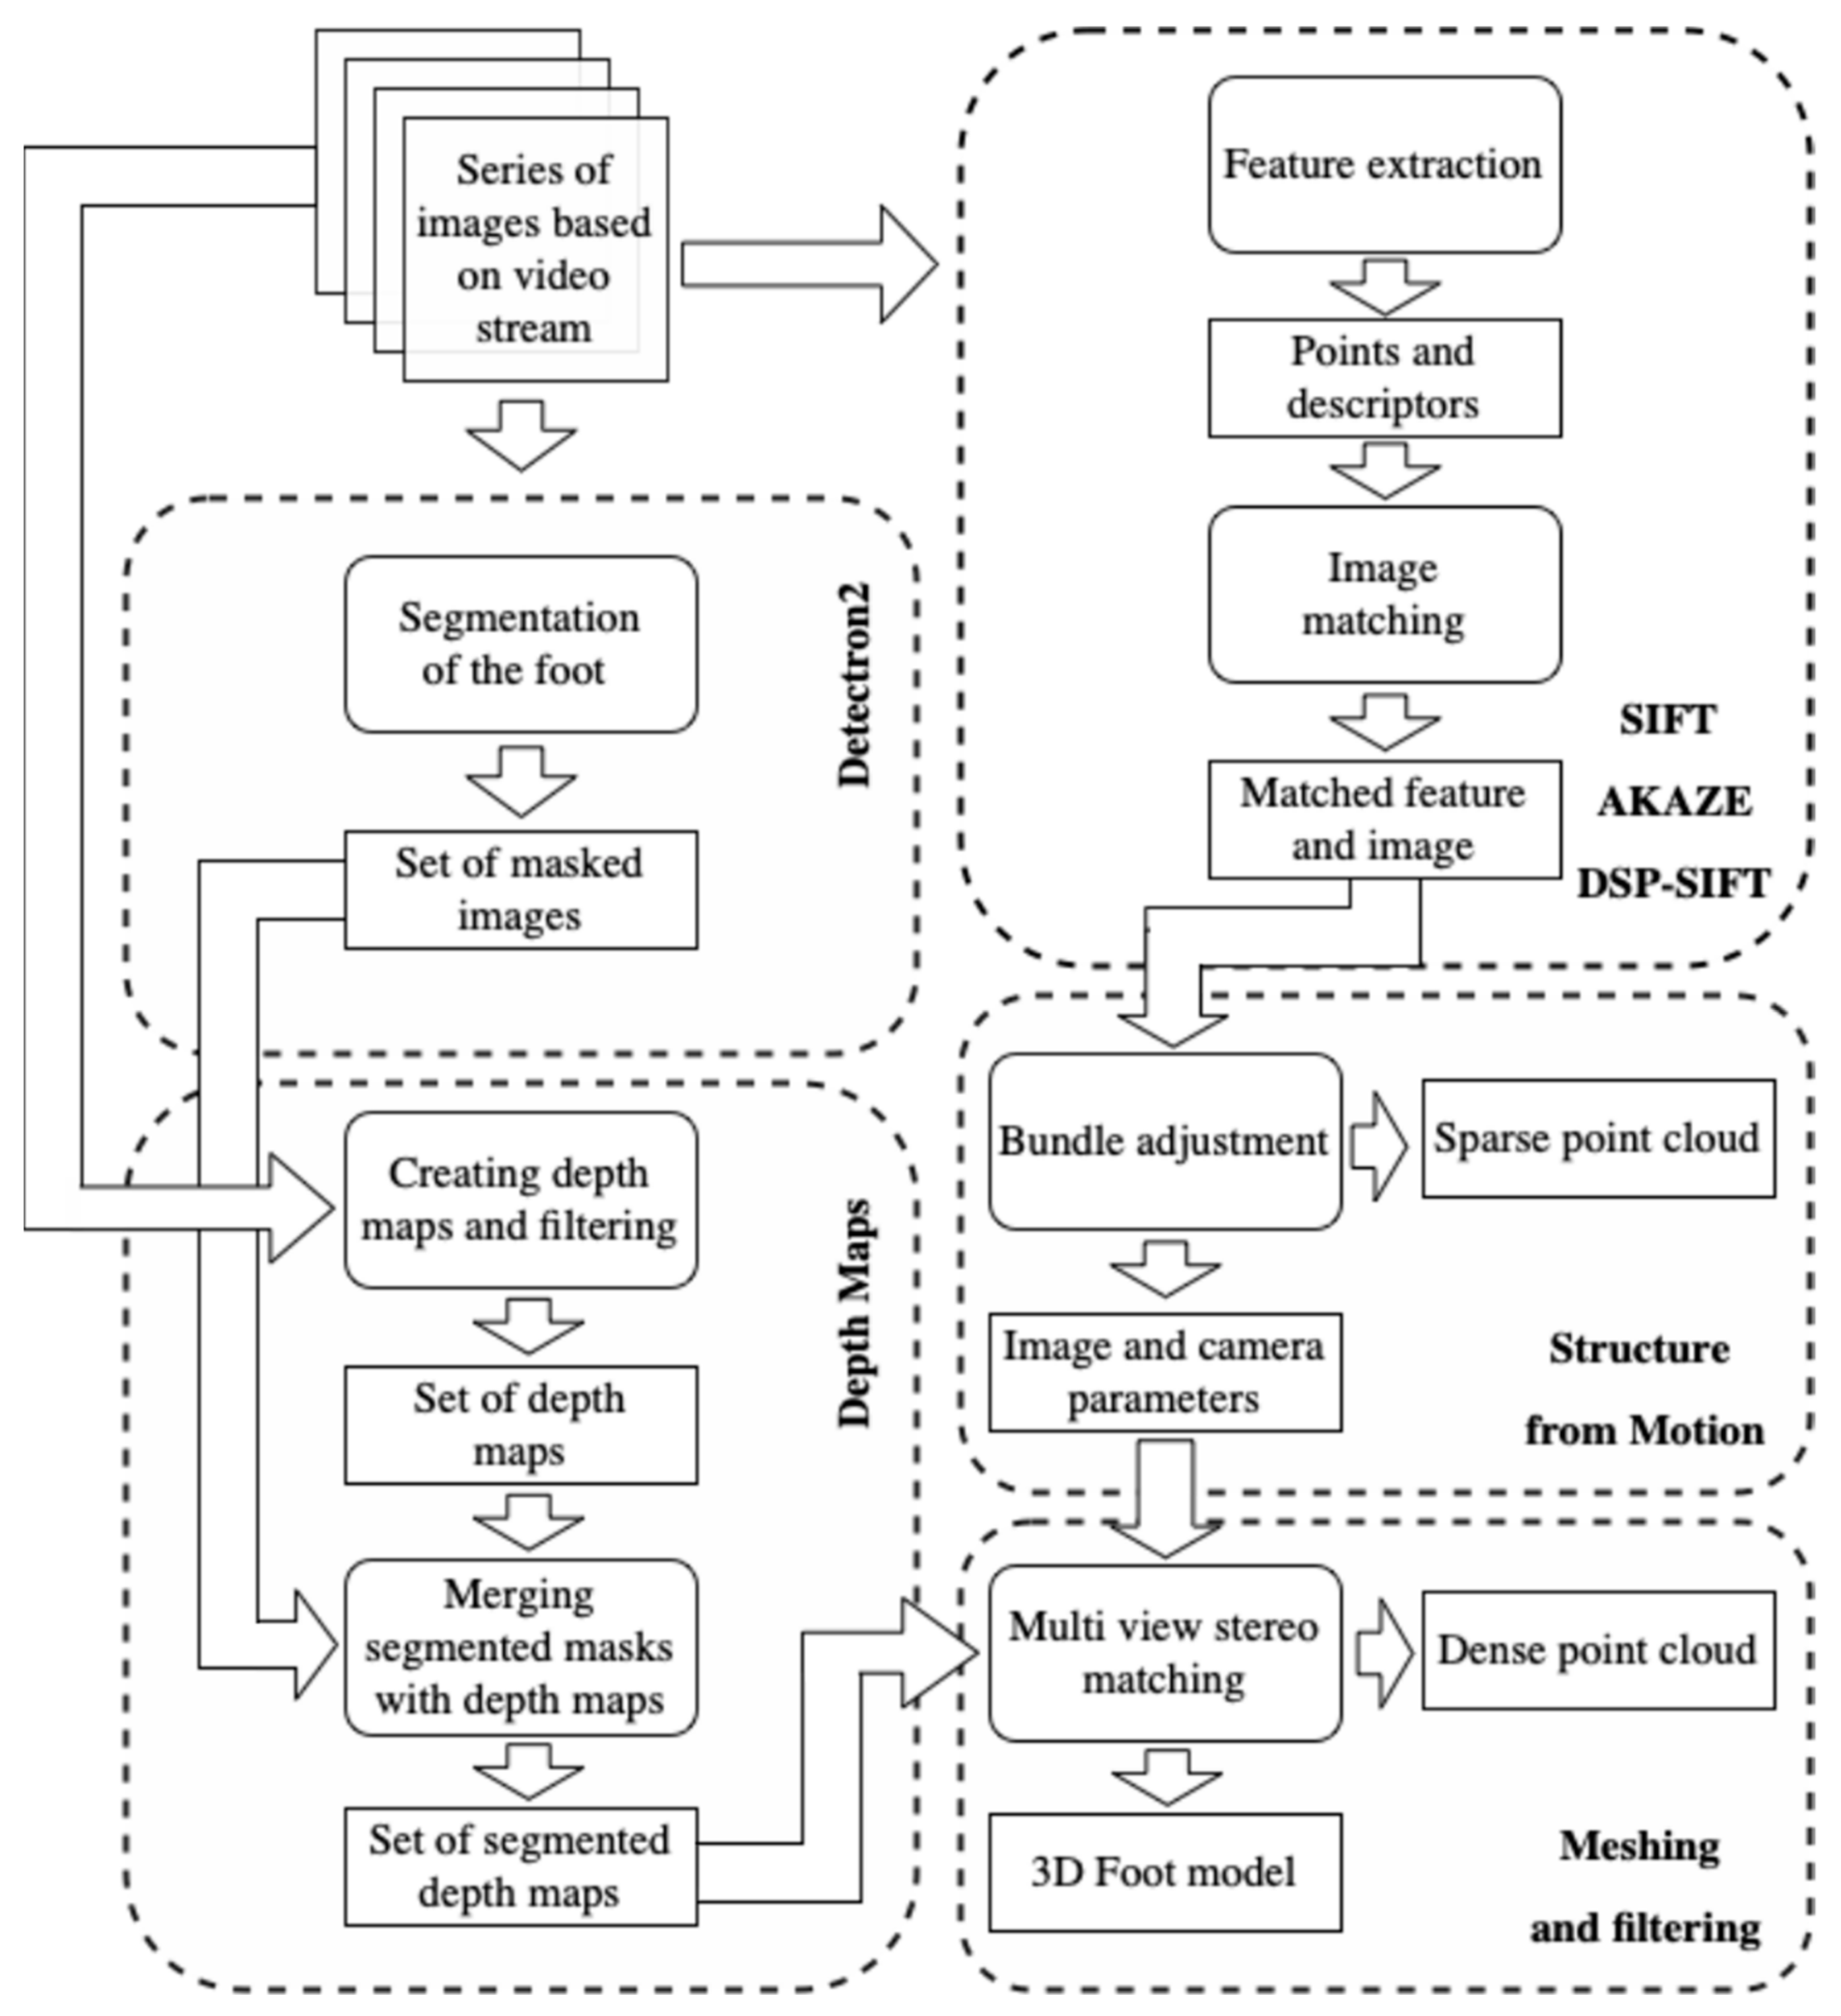
3. Methodology of Reconstructing the 3D Foot Shape

In this study, the approach of photogrammetry was defined as the main method for reconstruction. The application of modern algorithms of photogrammetry and computer vision makes it possible to obtain the qualitative reconstructed lower arch of the foot, which is necessary for individual orthopedic footwear manufacturing. The main feature of the methodology is the use of a series of images obtained from a smartphone at home. Figure 1 shows a schematic representation of the methodology, the interaction of algorithms, and the process of reconstructing 3D models.

3.1. Dataset Formation (Series of Images Based on Video Stream)

The first step to generating a dataset suitable for the requirements of 3D foot reconstruction is to meet the following criteria:
  • To obtain a high-quality reconstruction, it is important to involve an assistant (someone who can help in the process of creating the dataset);
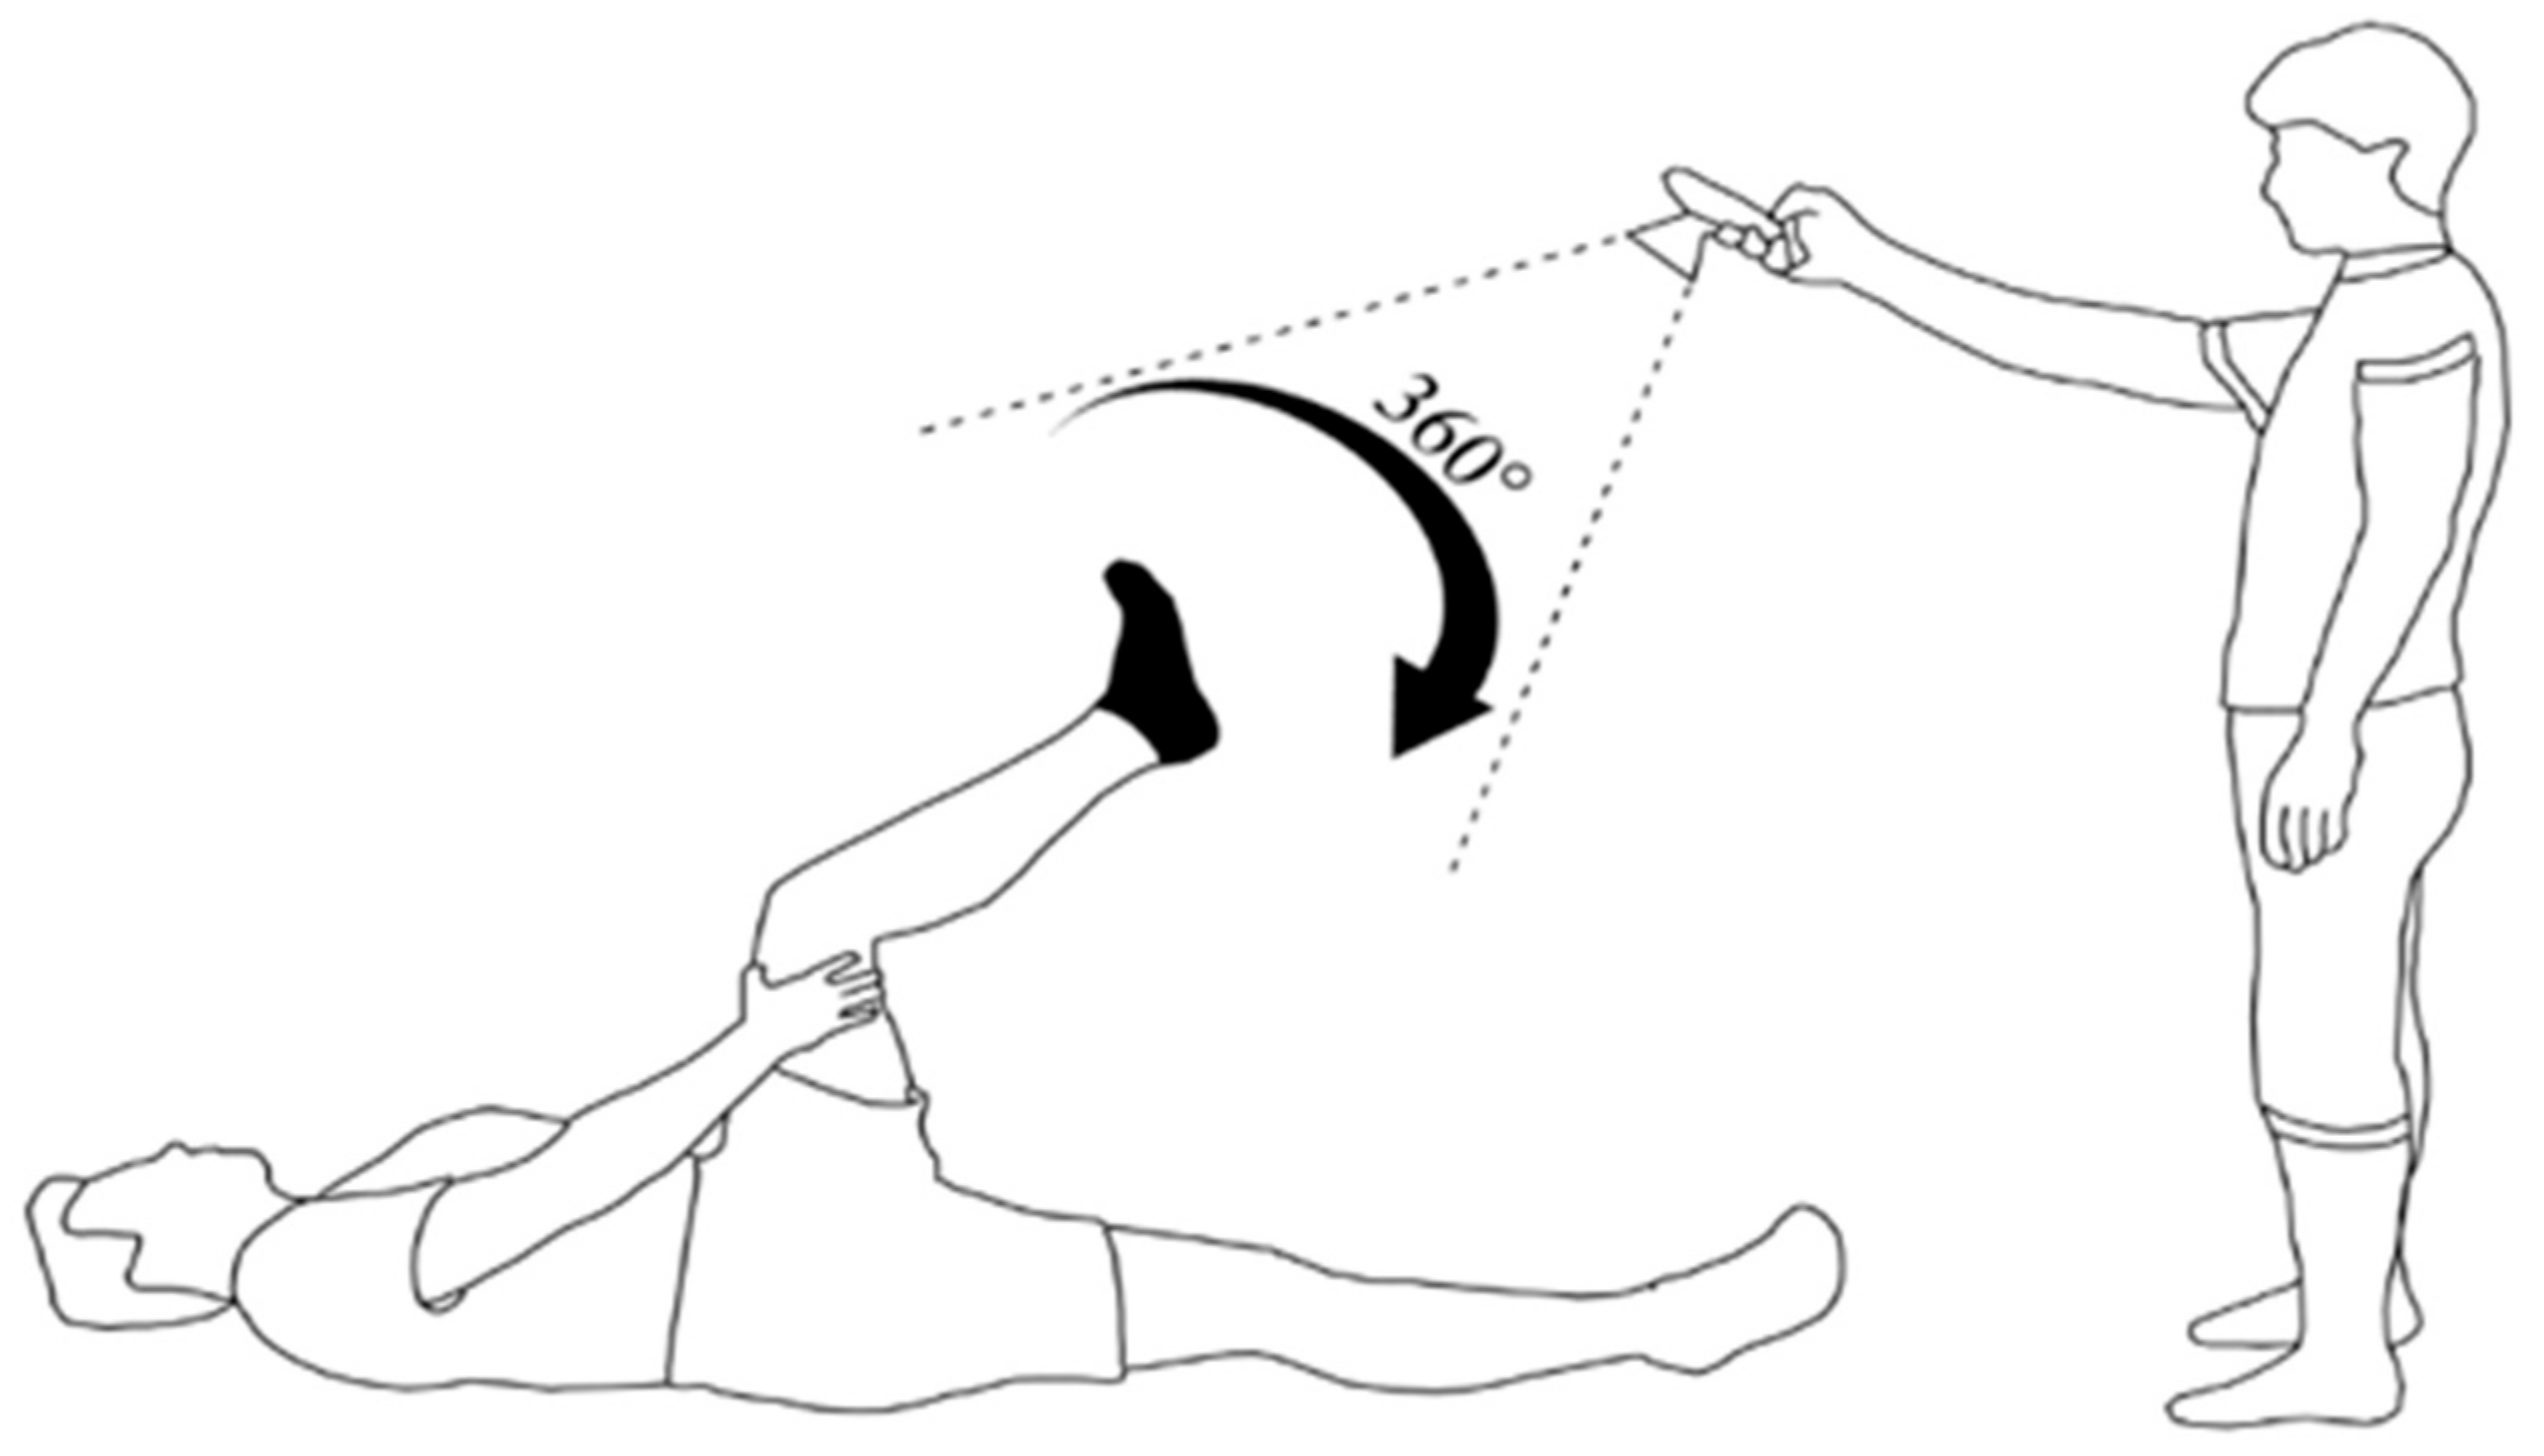
  • The person whose foot is to be reconstructed must be in a horizontal position. The foot should be fixed in space by hands;
  • Using a smartphone that allows for video recording with a resolution of at least 1920 × 1080 (pixels);
  • The video format can be both horizontal and vertical;
  • The duration of the circular video must be 30 s. The foot must be strictly fixed in the center of the stream during the entire video;
  • It is acceptable to vary the distance between the camera lens and the foot from 30 to 70 cm;
  • Avoid glare, flare, and other artifacts during shooting. The person that is recording the video should minimize extra actions during the shooting;
  • The angle of shooting is shown in Figure 2. The angle between the foot and the surface should be between 75 and 90 degrees. The bend angle of the knee should be between 135 and 150 degrees;
  • The resulting video stream must be split into N frames (from 50 to 150).

3.2. Feature Extraction

The next step will be to extract metadata from the images, sensor and device information, and the focal length obtained from the resulting dataset. This is necessary to calibrate the camera in space. Thus, in the process of image creation, the image pixel coordinate system, the camera coordinate system, and the world coordinate system are applied. The process of extracting informative features involves detecting distinctive groups of pixels, which are invariant to changes in camera viewpoints during shooting from different angles. For this purpose, the algorithms use the scale-invariant transformation of features in SIFT and DSP-SIFT. The essence of these algorithms is the extraction of a set of binary descriptors from the image. Binary descriptors describe the area around a key point as a binary string obtained by pairwise comparison of the brightness of pixels in a given area. These algorithms can be divided into four main steps:
  • Definition of extremums of the scale space;
  • Precise localization of key points;
  • Defining the orientation of the camera in space;
  • Calculation of the local image descriptor.
These algorithms are complemented by the AKAZE method [36], which in turn uses the fast explicit diffusion method to form a nonlinear scale space. Thus, the idea of this method is to create a series of intermediate images at different scales (multiscale space) by applying different kinds of filtering to the original image. To detect and extract features in such a space, the determinant of the Hessian matrix is calculated for each of the images in the set. The calculated Hessian determinants for N-matrices, 3 × 3 for each of the N-images, form informative features, which, as a result, form descriptors.
The obtained determinants are normalized by the scale. All descriptors computed by the algorithms are robust in handling various types of image transformations (changes in viewpoint, noise, blur, changes in contrast); all extracted features remain sufficiently distinguishable for further processing and comparison.

3.3. Feature and Image Matching

The purpose of this step is to find and filter images in the obtained dataset. After forming descriptors for previously extracted informative features, the vocabulary tree approach [37] is used for comparison and filtering. Classification and comparison with those descriptors in each node of the tree are performed by passing all extracted feature descriptors to the vocabulary tree. Each descriptor results in a single “leaf”, which can be stored using a simple index of that leaf in the tree. The image descriptor is represented by a collection of these leaves. Finally, the descriptor filters out images that have nothing in common with others in the dataset.
To match all previously obtained informative features between pairs of candidate images, a photometric comparison is performed between the set of descriptors from the two input images. For each extracted informative feature in image A, a list of potential features is extracted from image B; as the area of descriptors is not in a linearly defined space, absolute distance values are not used.

3.4. Structure-from-Motion

The goal of this step is to form a sparse point cloud. To achieve this, it is necessary to merge all feature matches between pairs into a certain sequence. Since it is impossible to obtain a valid point cloud structure at this stage during the merging of all sequences into a single sequence, any unconnected points are removed.
The first step of the incremental algorithm is selecting the pair of images with the greatest number of features previously extracted and matched.
The second step is calculating the fundamental matrix between the best pair of images from step 1. Then, a 3D coordinate system is formed in space from the obtained points.
The third step is the triangulation of appropriate informative features from 2D space into a 3D point cloud based on data of the position of the first two cameras in space (coordinate system).
In the fourth step, it is necessary to determine the position of the camera in space that has the greatest number of extracted and compared features between the images and the already reconstructed 3D point cloud. This is necessary to select the best representations in the available dataset. For each of the cameras, using the perspective-n-point algorithm (PnP) within the RANSAC framework, nonlinear minimization is performed to refine the position of the camera in space.
In the final step, after the full camera parameter information is available, the data are adjusted to refine all points in 3D space. Finally, all observations with a high error value are filtered out. The resulting output of this step forms a sparse point cloud.

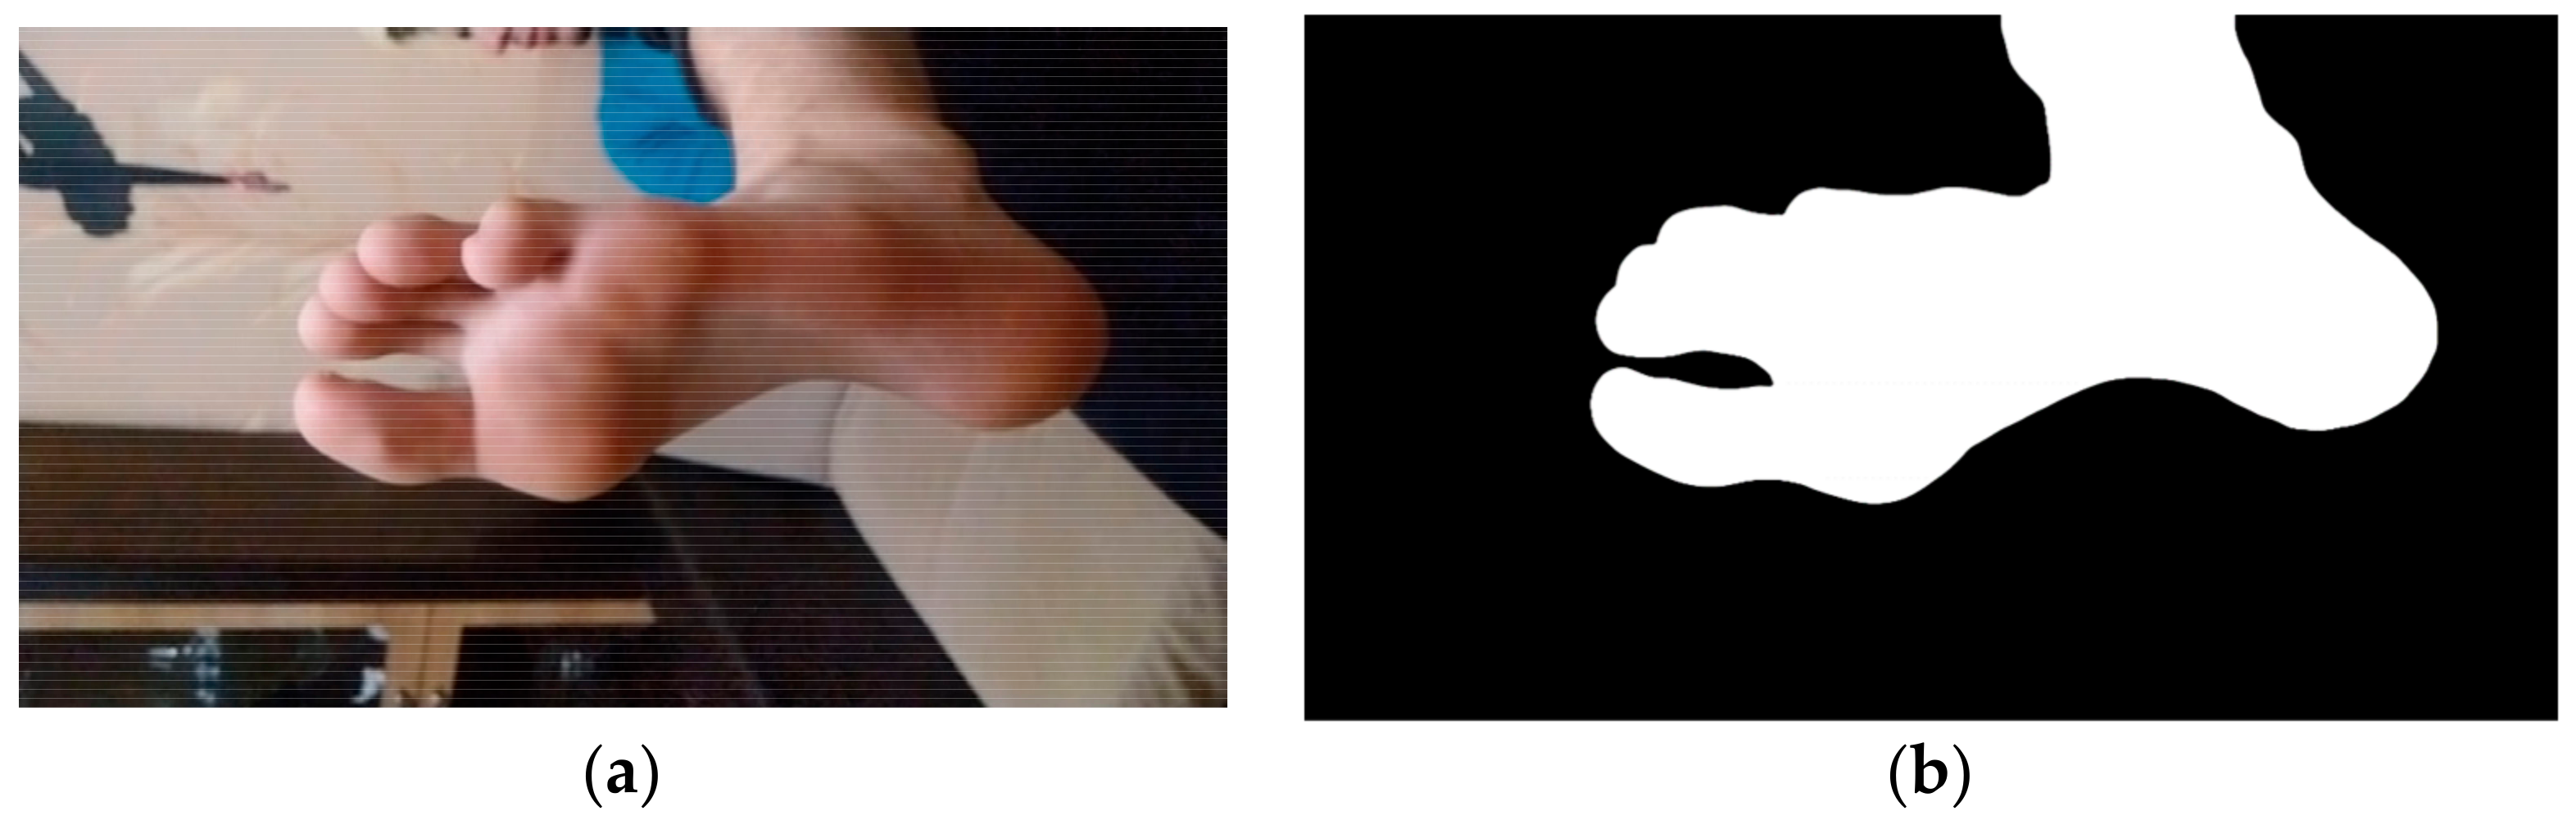
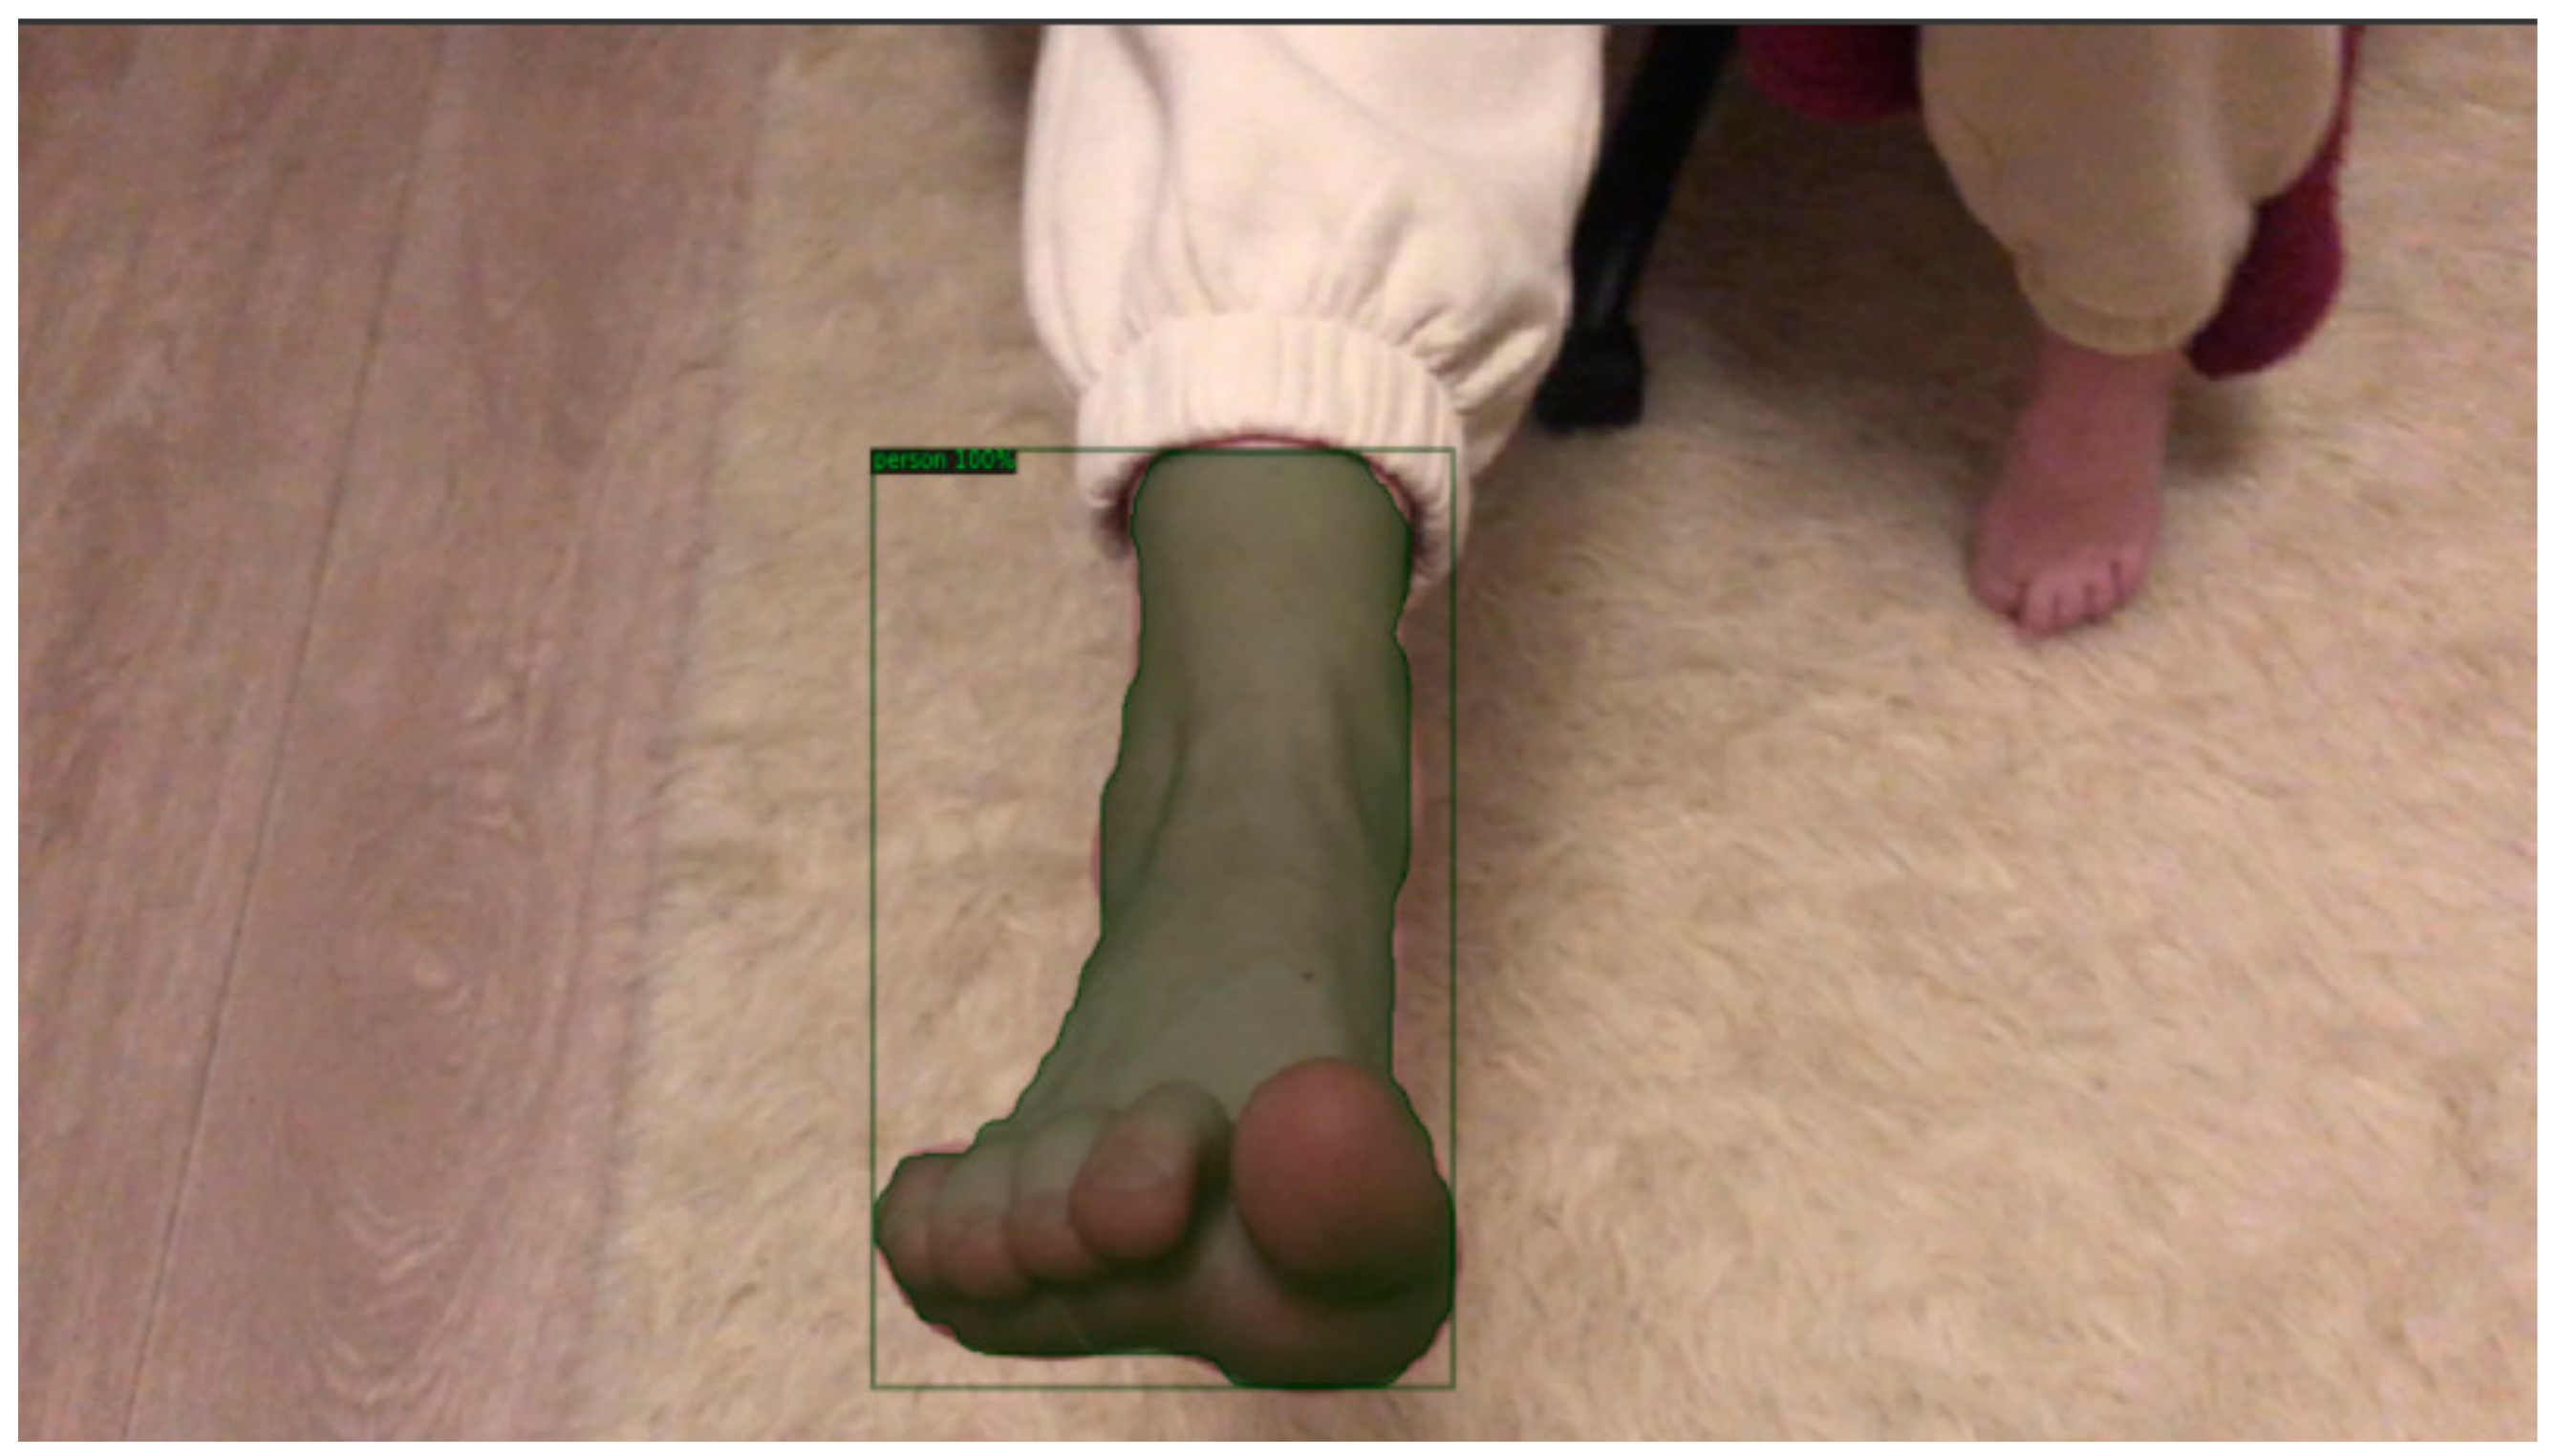
3.5. Segmentation Foot Image

Segmentation of the shape of the human foot in the image is necessary to further clean the depth map data from objects that were in the background of the images. The concept of depth map segmentation consists of two objects: a black-and-white mask of a segmented foot and a depth map. These objects are converted into matrices of the same dimensionality. Then, each element in the depth map receives a value of “−1” if the element in the mask with the same indices has a value of “0”. The value “−1” in the depth map means that this element will not be used in future reconstruction.
For this purpose, it was decided to use the library Detectron2 [38], implemented on the basis of PyTorch. This library has several pretrained models, which are used to solve segmentation problems.

3.5.1. Dataset for Training
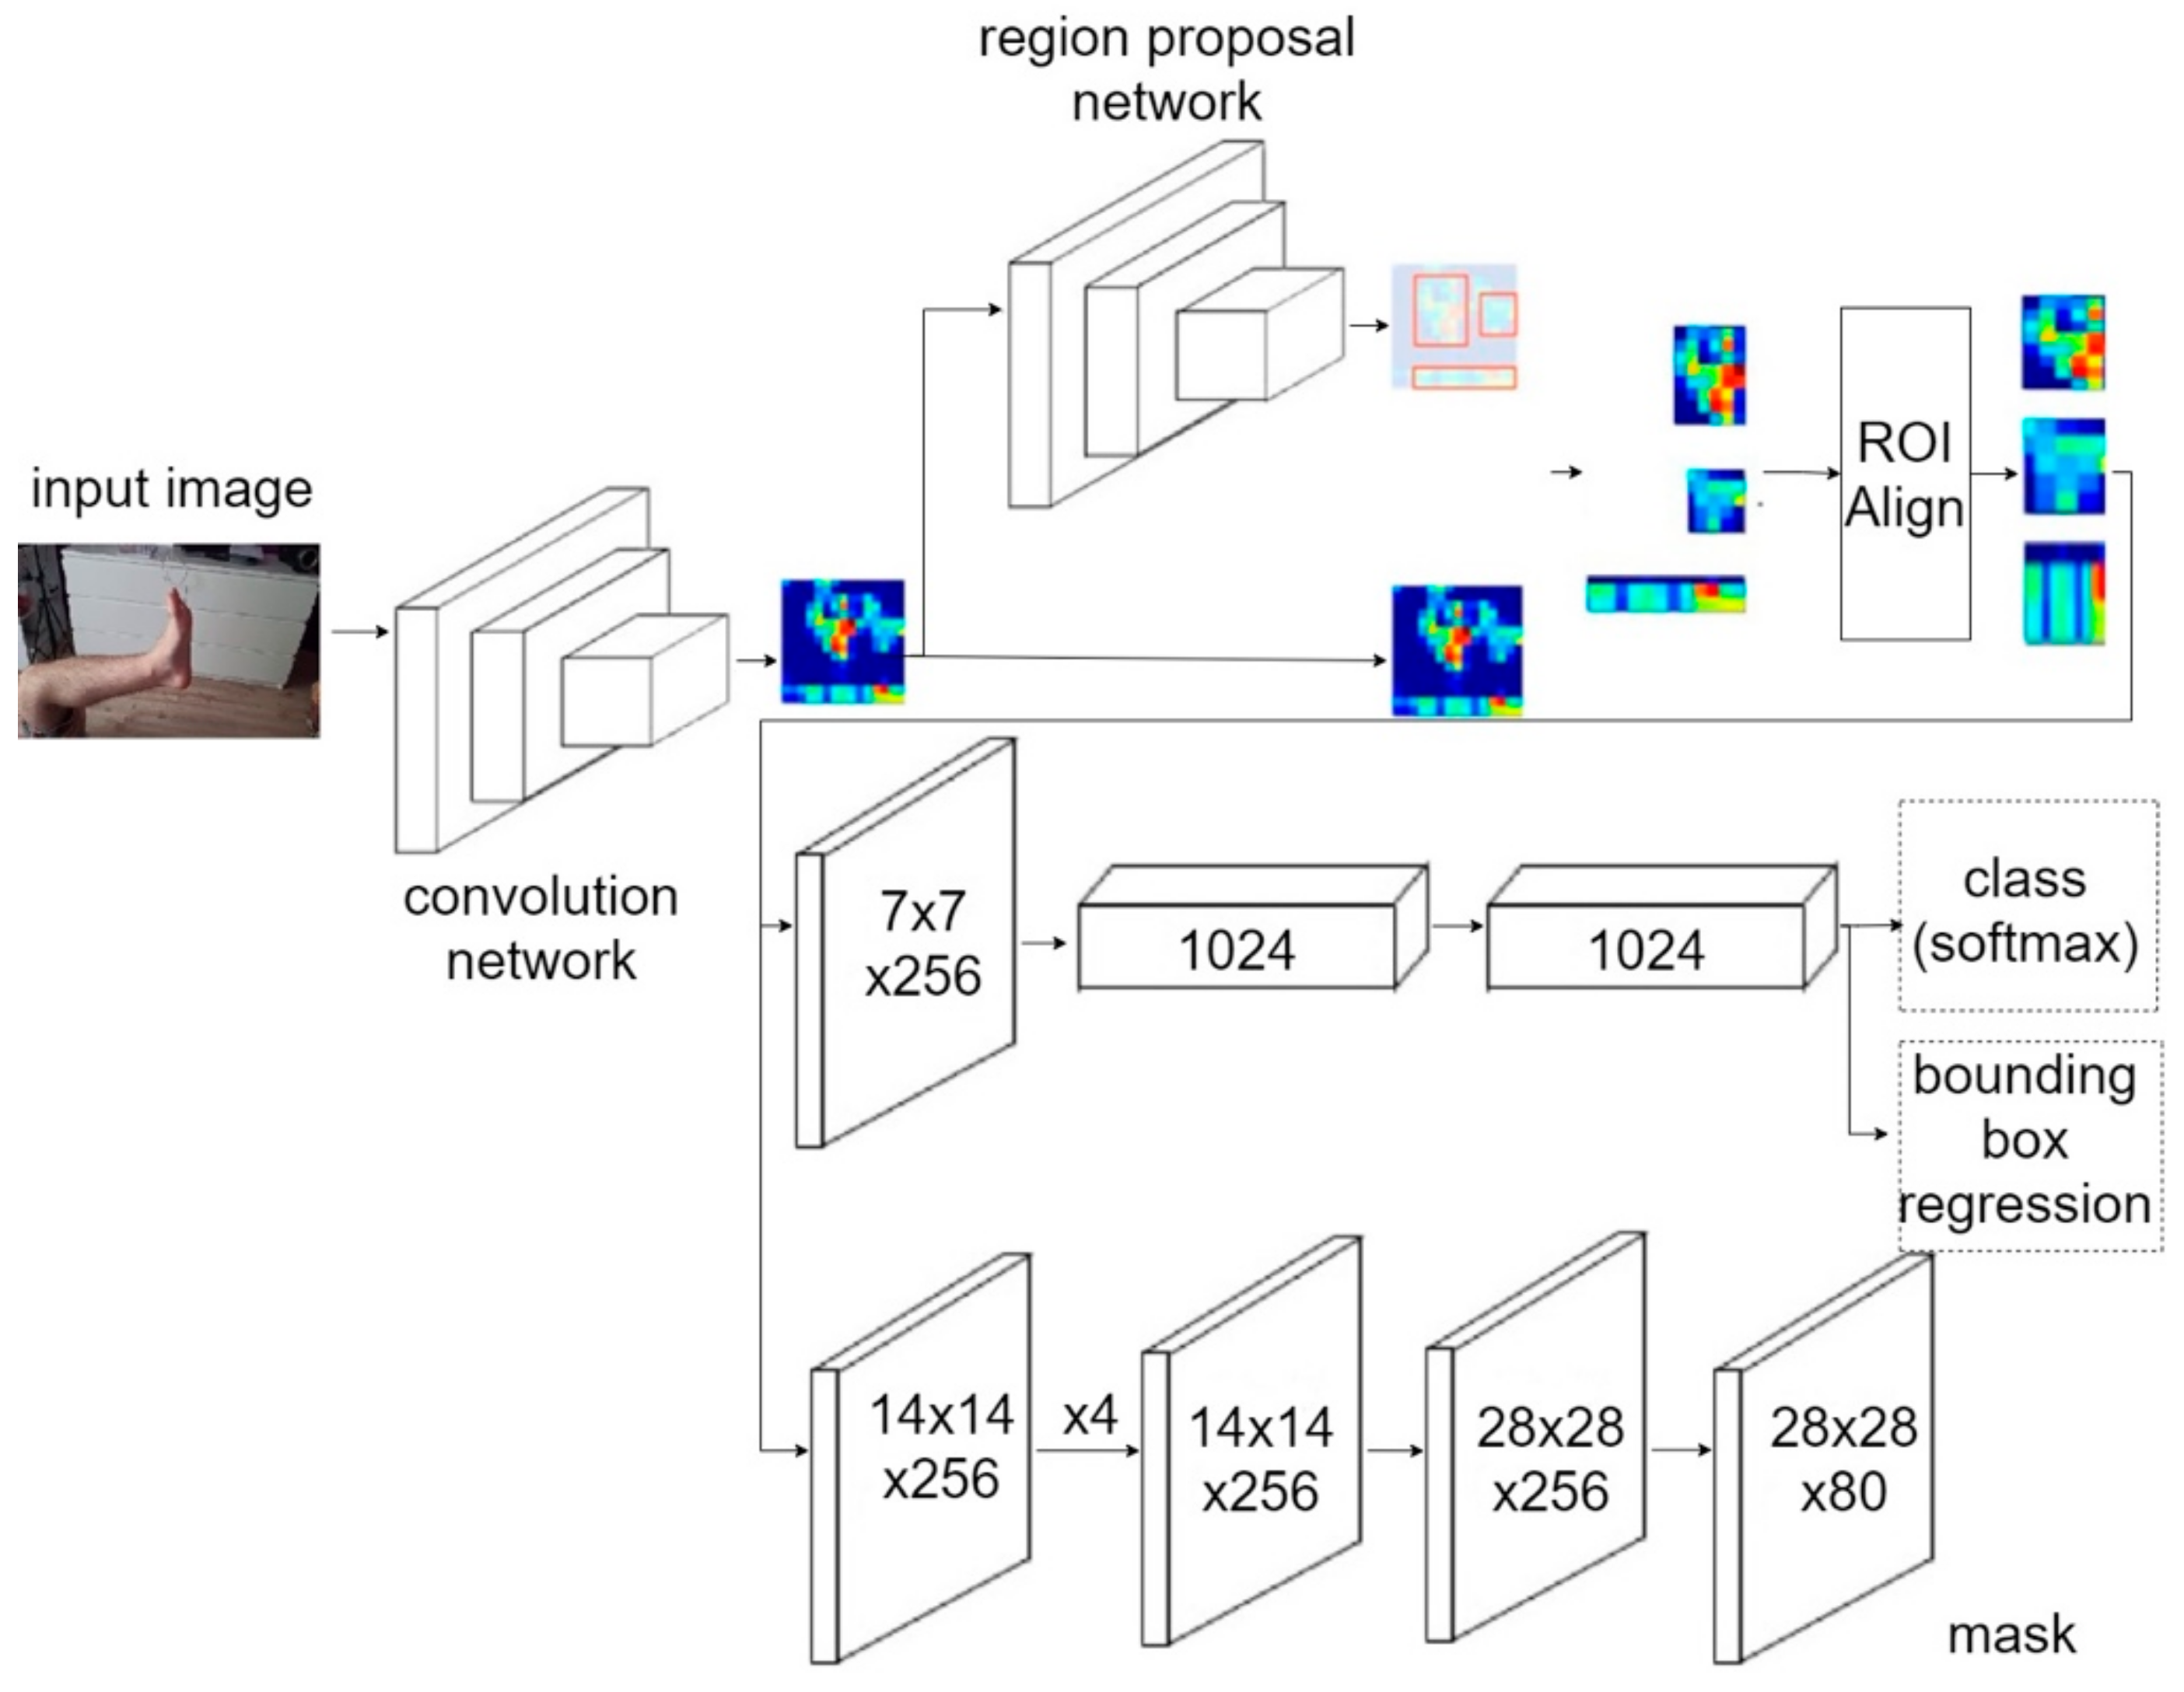
The CAESAR 3D human model dataset [39] presented in the analysis is unsuitable, because its data are artificially generated, missing the necessary measurements, textures, and extraneous objects usually found in actual photographs. This may affect the accuracy of the segmentation model in real conditions. Therefore, it was decided to create our dataset.
As a training dataset, we decided to use 1200 feet images. The resolution of each image was 1920 × 1080 (pixels). The sample contained 50% female and 50% male feet, with a total of 40 people involved. The dataset contained 600 images of female and male feet (300 of left and 300 of right foot). All participants of the experiments signed informed consent. All personal data were anonymized for research.
Table 1 summarizes the information, including the minima (min), maxima (max), means (avg), and standard deviations for both feet for each of the dimensions.
In the process of forming the dataset for NN training, an instruction to follow was given to all volunteers. The instruction is described in “Dataset formation” in Section 3.1. Since the methodology is aimed at practical use, data heterogeneity is one of the key factors that positively affect the quality of reconstruction based on real data. Here, the heterogeneity of the data was derived from the different genders of the volunteers: the length of their feet varied from 228 to 321 mm, and the hair cover of the foot varied for each participant. In addition, due to the home environment of video recording, the background and light for each video were unique.
Each of the participants videotaped their feet at home. This fact allowed us to collect images from different backgrounds. Additionally, it affects the variability of the model under other conditions. Another reason to use video is the condition of the high complexity of determining the optimal number of photos and angles to obtain an acceptable 3D model of the foot.
The dataset was processed using the following algorithm: extract a series of images from a video file (30 from each video), manually mark each extracted image and form masks (Figure 3), divide the resulting set into training and test samples by an 80/20 proportion, and convert the resulting mask set into a COCO-annotation file.

3.5.2. Architecture

Detectron2 includes a set of detection models: Faster R-CNN [40], DensePose [41], Cascade R-CNN [42], and Mask R-CNN [43]. It was decided that Mask R-CNN would be used since it is used to segment objects in an image. Figure 4 shows the architecture of the Mask R-CNN.
The figure shows that the use of MASK R-CNN has three stages. In the first stage, the original image is convolved using CNN. In the second stage, each candidate is bounded by a rectangle (region proposal network). In the third stage, the feature matrices for each of the candidate regions are determined, along with the classification, regression, and bit masking for each of the candidates. The feature matrix is created using the RolAlign function, which generates a matrix with real values. Interpolation by the four nearest integer points is used for this purpose. This allows matching of the feature matrix to the original image.

3.5.3. Loss Function

For each region of interest (ROI), a multi-objective loss function consisting of classification losses (1,2), localization losses (3,4), and mask segmentation (5) is used.
L c l s = 1 N c l s i L c l s p i , p i
L c l s p i , p i = p i l o g p i 1 p i l o g ( 1 p i )
where   L c l s is the classification loss function; N c l s is a normalizing term, which has a value equal to mini-batch (~256); L c l s ( p i , p i * ) is the logarithmic loss function, which is used to convert the multi-class classification into a binary one, which allows one to determine whether an object is a target or not; p i is a label reference value (binary) used to determine if the anchor box is an ith object; and p i is the probability that an ith anchor box is an object.
L b o x = N c l s i p i L 1 s m o o t h t i t i
L 1 s m o o t h t i t i = 0.5 ( t i t i * ) 2       i f | t i t i * | < 1 , | t i t i * | 0 . 5       otherwise
where L b o x is the localization loss function; is the balancing parameter for the importance of the classification and localization loss function; N b o x is the normalizing term associated with the location, and this has a value equal to the anchor location (~2400); L 1 s m o o t h is the loss function, which is used for box regression; t i is the predicted coordinate value; and t i * is the true coordinate value.
L m a s k = 1 m 2 1 i , j m [ y i j log y ^ i j k + ( 1 + y i j ) log ( 1 y ^ i j k ]
where L m a s k is the mask segmentation loss function, y ^ i j k is the label of cell ( i ,   j ) in the true mask, y i j is the predicted value for the cell in the mask, and m is the value of the selection contour dimensionality m m .
Thus, the final formula for the multi-task loss function is represented by the following (6):
L = L c l s + L b o x + L m a s k

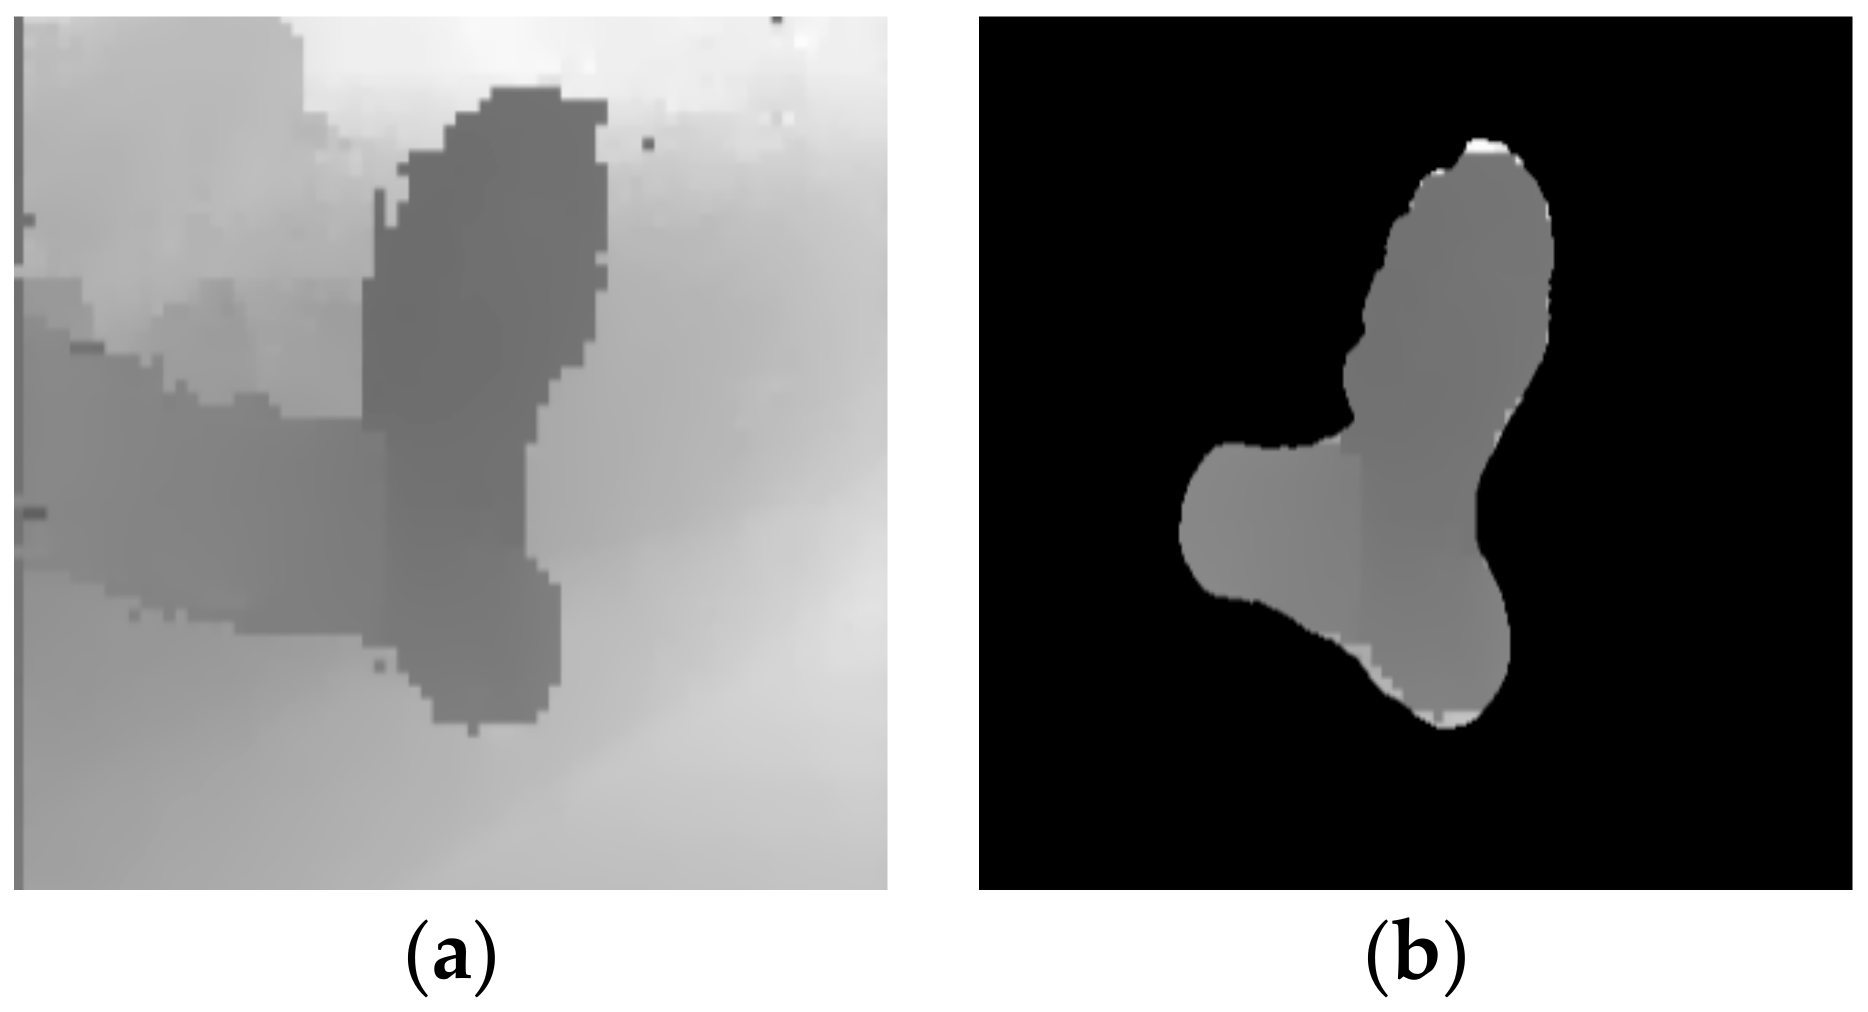
3.6. Estimate and Filtering Depth Maps

The first step is to select the N-best cameras in space. Then, frontal-parallel planes are selected for these cameras. Selection is based on the intersection of the optical axis with the pixels of the selected neighboring cameras by creating a volume for the voxels.
The second step calculates zero-mean normalized cross-correlation (ZNCC) [44] for all candidates. For each neighboring image, the similarity is accumulated, and then the axis filtering is performed and local minima are selected, forming depth maps with subpixel accuracy.
The third step is filtration between all the cameras in the space to ensure coherence.
The fourth step is the segmentation of the depth maps (Figure 5) using the mask obtained earlier with the image segmentation mode.
The process of segmentation of the original depth maps into segmented depth maps is shown in Algorithm 1.
Algorithm 1 Depth map segmentation
1:procedure segmentation_depth_map(dm_dir, mask_dir)
2:    dm_matrix <- {∅}{∅}► Create empty DM matrix
3:    dm_matrix <- read_dm (dm_dir)► Read DM and covert in matrix
4:    mask_matrix <- {∅}{∅}{∅}► Create empty mask matrix
5:    mask_matrix <- read_mask(mask_dir)► Read mask and convert in RGB matrix
6:    for x < dm_matrix {max} do
7:            for y < dm_matrix {max}{max} do
8:                    if mask_matrix {x}{y} = {0,0,0}► Where {0,0,0} means black color in RGB
9:                            dp_matrix {x}{y} <- -1► −1 means that this point
10:            end for► Will not use in reconstruction
11:     end for
12:    return dm_matrix
13:end procedure

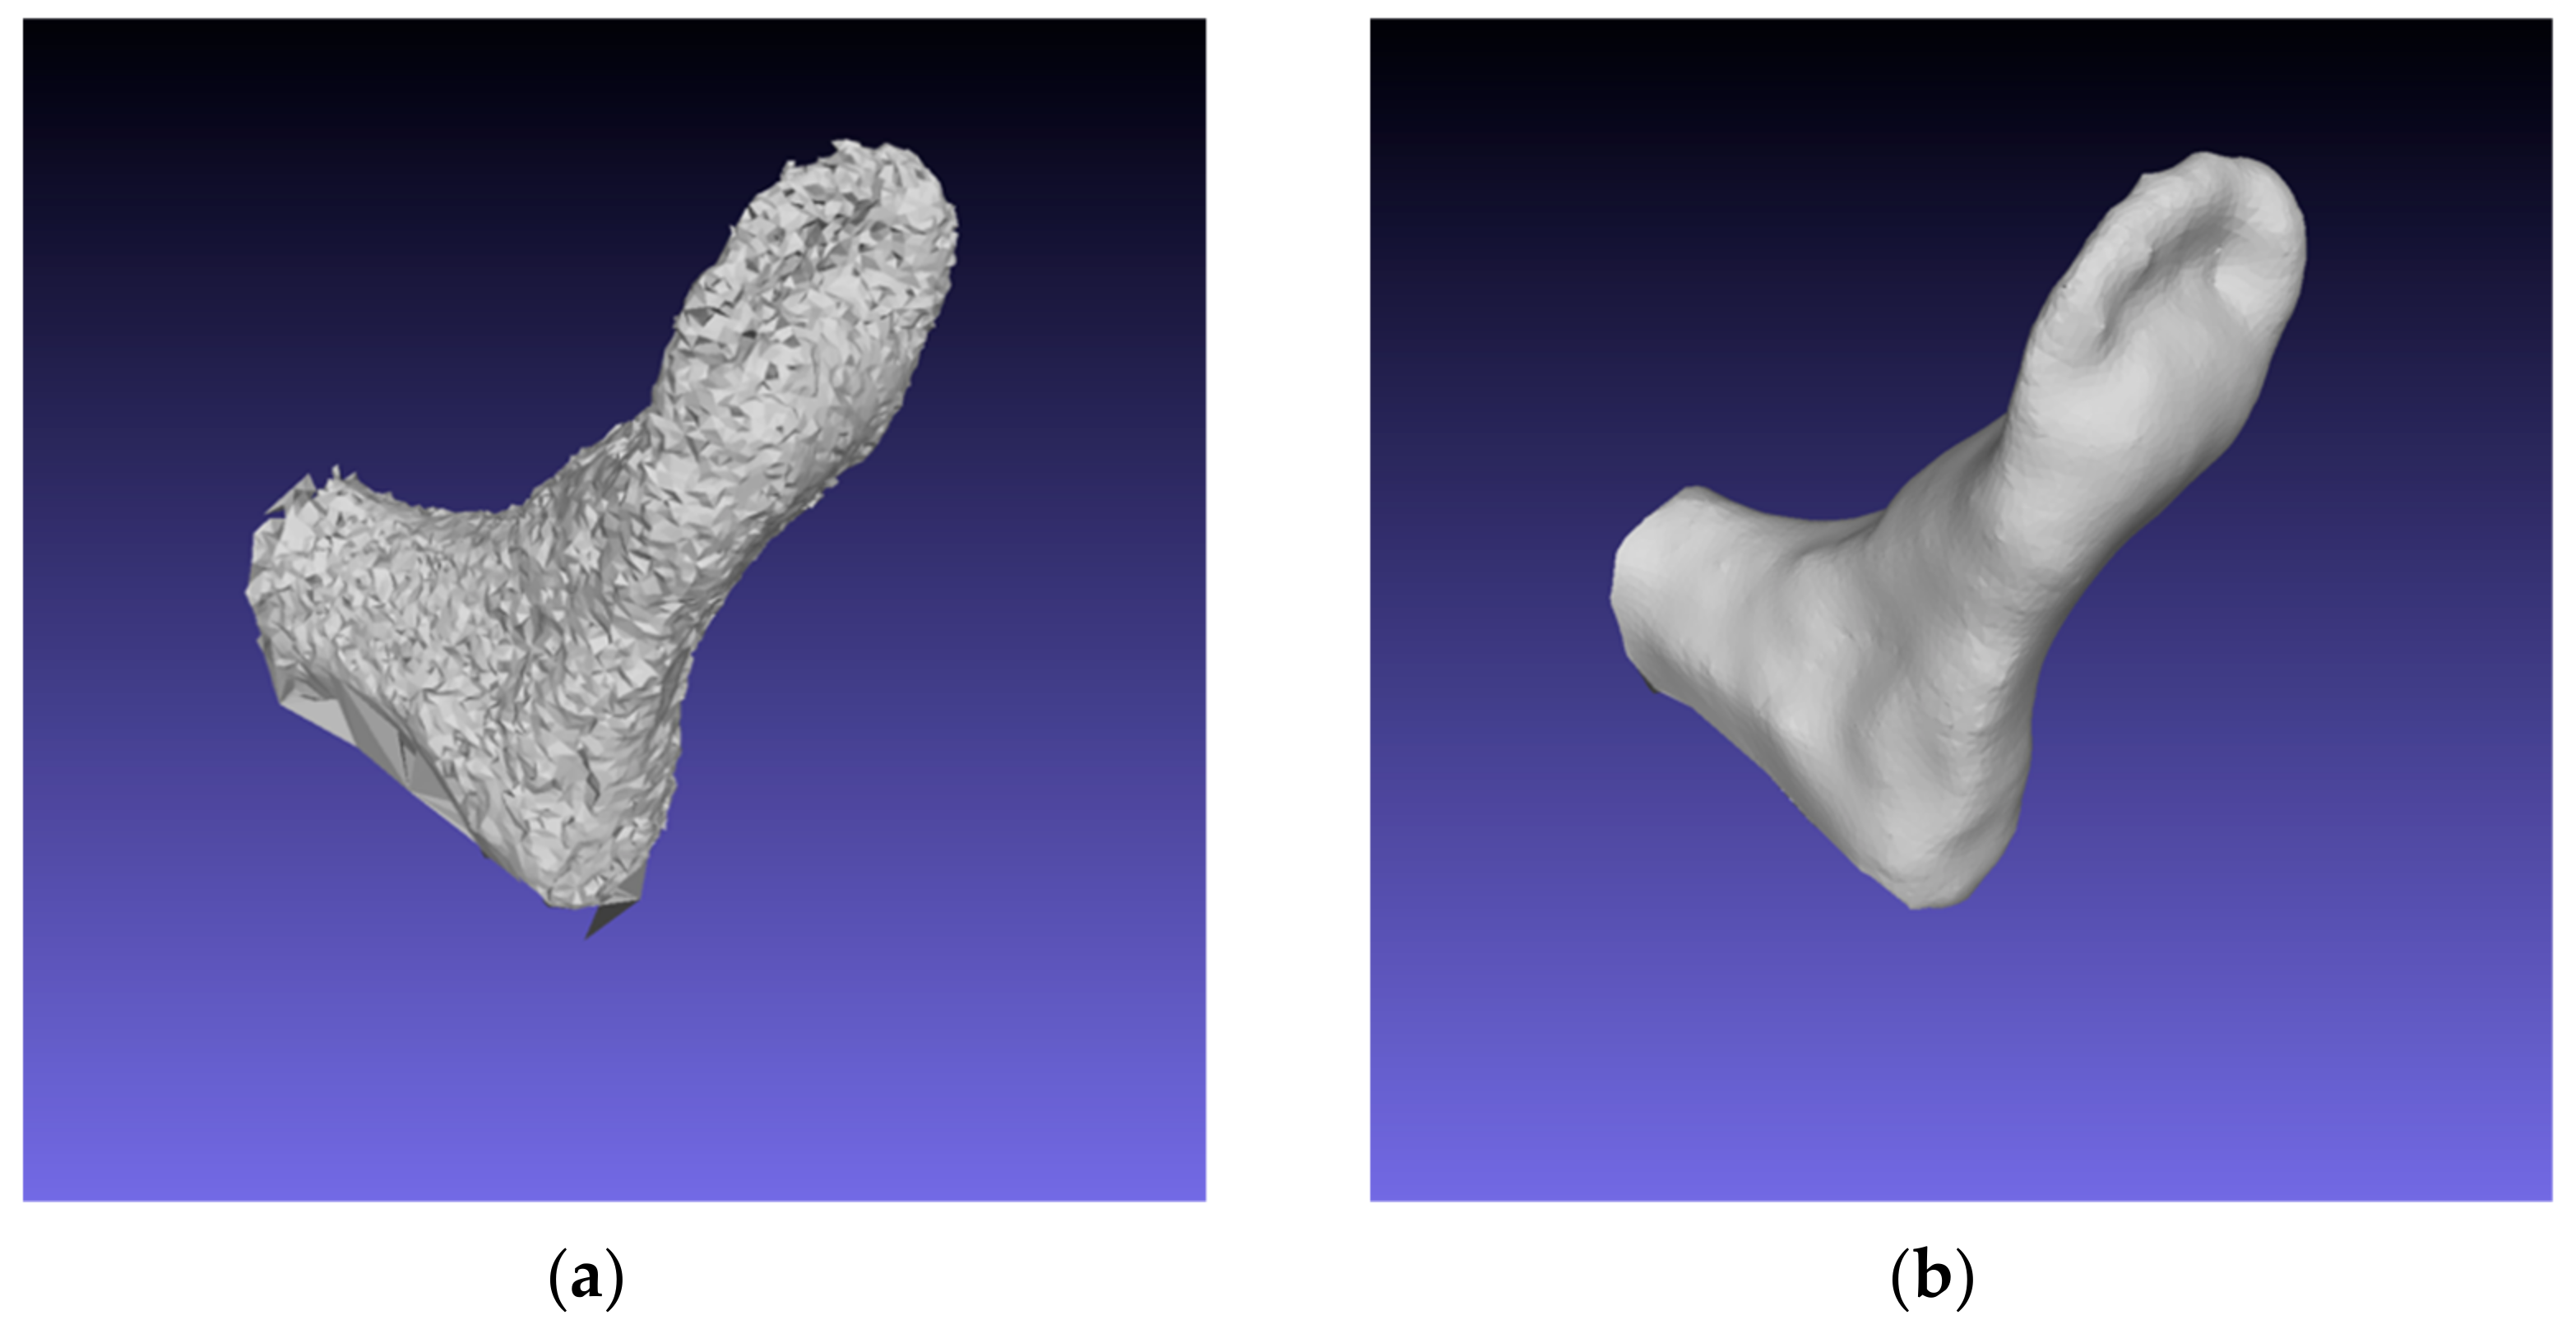
3.7. Meshing and Filtering

The goal of this stage is to create a dense geometric representation of the scene.
The first step is to merge all the resulting depth maps that have passed the segmentation step into a global octree, where compatible depth values form octree cells.
The second step is to perform a 3D Delaunay tetrahedralization and a voting procedure to calculate the weights on the cells and the weights on the borders that form these cells.
The third step is to calculate the optimal mesh volume reduction and Laplacian filtering of the mesh to remove local artifacts. After this step, a 3D model of the foot shape in OBJ format is generated at the output. Figure 6 shows an example of the same model with and without a filtering process. Algorithm 2 shows the process of obtaining a mesh and its subsequent filtering.
Algorithm 2 Meshing and filtering
1:procedure create_filtering_mesh(dm_dir, sfm_data, cameras_dir, lambda, iter)
2:    list_depth <- {∅}
3:    list_depth <- list_of_files_in_dir(dm_dir)► Read all depth_maps
4:    hexah <- {8}{∅}{∅}{∅}► Init start of hexahedron matrix
5:    nb_cameras <- {∅}► Init list of neighbour cameras
6:    for g < count(list_depth) do
7:              nb_cameras <- find_nb_cameras (list_depth[g], sfm_data)
8:              octree <- create_octree(list_of_files_in_dir[g], nb_cameras)
9:     end for
10:     dense_geometric_representation <- {∅}{∅}{∅}
11:     dense_geometric_representation <- create_dense(hexah, octree, sfm_data)
12:    mesh_object <- create_mesh(dense_geometric_representation)
13:    mesh_filtered <- mesh_filtering(lambda, iter, mesh_object)
14:    return mesh_filtered
15:end procedure

4. Experiments

According to the previously presented methodology, circular video shooting of 1920 × 1080 (pixels) was performed using different smartphones under approximately the same lighting conditions. Segmentation model training, data processing, and 3D reconstruction were performed in the Google Colab service using a Tesla K80 GPU. The free Meshroom 2021.1 system was used as photogrammetric software [45]. This choice was due to the system having a large number of integrated modules for working with computer vision, as well as the active development of the system in the 3D modeling community. Since the system is open-source, additional modules for the segmentation and framing of images were implemented. This action allowed us to automate the process of the post-processing of the 3D model.

4.1. Training and Evaluate Model Accuracy

The Mask R-CNN NN model for segmentation was trained with the following modified parameters:
  • Number of iterations—6000;
  • Number of classes—1;
  • Learning rate—0.00025.
A dropout layer with a value of 0.2 was also added to avoid overfitting. This value was chosen empirically. The size of the training and test samples was 800 and 200 images, respectively.
A large number of metrics can be used to compare the predicted segments to the original masks. In this study, it was decided to use metrics that are the same as the considered analogs. DICE [46] and IoU [47] were used as metrics for accuracy estimation. The time taken to process one image by the model was also calculated. For this purpose, a smartphone with the same processor as the one used to estimate MobileSeg speed was used. The authors of the UPD model did not test their model on mobile devices. Formulas for the DICE (7) and IoU (8) metrics are presented below.
D I C E = 1 M i M 2 T P i F P i + 2 T P i + F N i
I o U = 1 M i M T P i F P i + T P i + F N i
where M is the number of images, T P is the true positive pixels, F N is the false negative pixels, and F P is the false positive pixels. To determine the clustering accuracy, 200 photos were used that had not been used before (Table 2).
For the resulting set of estimates, a one-sided Student’s t-test was calculated with a degree of freedom level α = 0.01. The value of the criterion with a degree of freedom of 199 and a t-score of 2.613 was between 0.01 and 0.005, which made it possible to conclude that the accuracy of our model was statistically significant in comparison with analogs.
It can be observed from the tables above that the Mask R-CNN model was found to have the best accuracy performance for the DICE and IoU metrics. Additionally, the value of the t-criterion confirmed the significance of our model.
Figure 7 shows an example of a segmented human foot using the trained Mask R-CNN model.

4.2. Formation of an Experimental Dataset for 3D Modeling

Ten video files (five males, five females) obtained earlier were selected as a dataset to perform a 3D reconstruction of the foot shape. Each volunteer took measures of length and width using a caliper. From the obtained video fragments for further experiments, a series of images consisting of 100 frames were used. Then, each of the series was subjected to a resolution change of two, three, and four times.

4.3. Extracting Foot Parameters

To evaluate the quality of reconstructed 3D models by foot length and width, the Grand control point method was used. This approach allows converting point cloud model coordinates to world coordinates using the actual size. Thus, in the process of generating a dataset for 3D modeling, a coin with known real-world readings was attached to the bottom of the volunteers’ feet. This is necessary to calibrate and establish the ratio between the 3D coordinate system and the world coordinate system. Since it is rather difficult to automate such an evaluation process, special tools in the MeshLab software were used to measure the distance between points.
Equations (9) and (10) were used to calculate the parameters of length (FL) and width (FW) of the foot. The left part of the formulas shows the measurements obtained manually with a caliper, and the right part shows the distances between the points obtained by repeated measurements and averaging.
F L ( w o r l d s i z e ) C L ( w o r l d s i z e ) = F L ( 3 D m o d e l s i z e ) C L ( 3 D m o d e l s i z e )
F W ( w o r l d s i z e ) C W ( w o r l d s i z e ) = F W ( 3 D m o d e l s i z e ) C W ( 3 D m o d e l s i z e )
Based on the presented formulas, with data on the length and width of the coin in the real world, it is possible to express the parameters of the foot. Formulas (11) and (12) demonstrate the calculation of the length and width of the foot, respectively.
F L ( w o r l d s i z e ) = F L ( 3 D m o d e l s i z e ) C L ( 3 D m o d e l s i z e ) C L ( w o r l d s i z e )
F W ( w o r l d s i z e ) = F W ( 3 D m o d e l s i z e ) C W ( 3 D m o d e l s i z e ) C W ( w o r l d s i z e )

4.4. Investigation of the Influence of Different Algorithms for Extracting and Comparing Informative Features on the Quality of 3D Models

The key point that affects the quality of 3D foot models is the correct selection of algorithms for feature extraction and matching. The SIFT, DSP-SIFT, and AKAZE algorithms were proposed earlier in the described methodology. Table 3 demonstrates the effect of combinations of algorithms on length (FL) and width (FW) deviations relative to manual measurements for 10 subjects. The limit for the number of extracted features was set to 2000 per image. The created depth maps were scaled down two times relative to the original image. Additionally presented is the average time to create a 3D model for 100 images in 1920 × 1080 (pixels) format and the standard deviations for the samples. Figure 8 shows an example of a reconstructed 3D model with a resolution of 1920 × 1080 (pixels) of a series of images.
Thus, the range of length measurements on a sample of 10 volunteers was varied from 235 to 285 mm, and that of the width measurements from 91 to 127 mm. The best standard deviation of 0.87 mm was obtained with the combination of the SIFT, AKAZE, and DSP-SIFT feature-extraction algorithms, and the average time to create one model, including series generation and image segmentation, was 11 min 29 s.

4.5. Research on the Effect of Different Image Resolutions on the Processing Efficiency and Quality of 3D Models

To increase the efficiency of data processing, it was decided to use a number of 2D images with reduced resolutions of two, three, and four times relative to the original. Table 4 shows experiments using a combination of the feature-extraction and -matching algorithms SIFT, DSP-SIFT, and AKAZE. The limit on the number of features was set to equal 10,000 per image. The created depth maps were scaled down two times relative to the original image. The average time to create 3D models and the standard deviations of the studied samples were calculated.
The best standard deviation of 0.95 mm was obtained using a combination of the SIFT, AKAZE, and DSP-SIFT feature-extraction algorithms and 2D image series at 480 × 270 (pixels); the average time to create one model, taking into account series generation and the image segmentation process, was 1 min 35 s. Three-dimensional models obtained at this resolution are smoother, but a large part of their features is lost due to a reduction in the number of reconstructed points in the sparse cloud.
Figure 9 and Figure 10 show an example of a reconstructed 3D model with a resolution of 480 × 270 (pixels) of a series of images.

4.6. Evaluation of the Results

Thus, the best linear standard deviation of 0.87 mm was achieved when a combination of the SIFT, AKAZE, and DSP-SIFT feature-extraction algorithms and a series of 2D images at 1920 × 1080 (pixels) resolution was used. The average time to create a 3D model was 11 min and 29 s. However, the most efficient approach was the reconstruction with a series of 2D images with a resolution of 480 × 270, as the processing was faster at 257%. In addition, a linear deviation value of 0.95 mm is acceptable in the case of tailored orthopedic shoes as well as shoe-size recommendations.
Additionally, it should be noted that the deviations for models 4 and 8 were the highest. Length parameters for these models were the minimum and maximum, respectively. Such anomalies of deviations can be explained by the following factors:
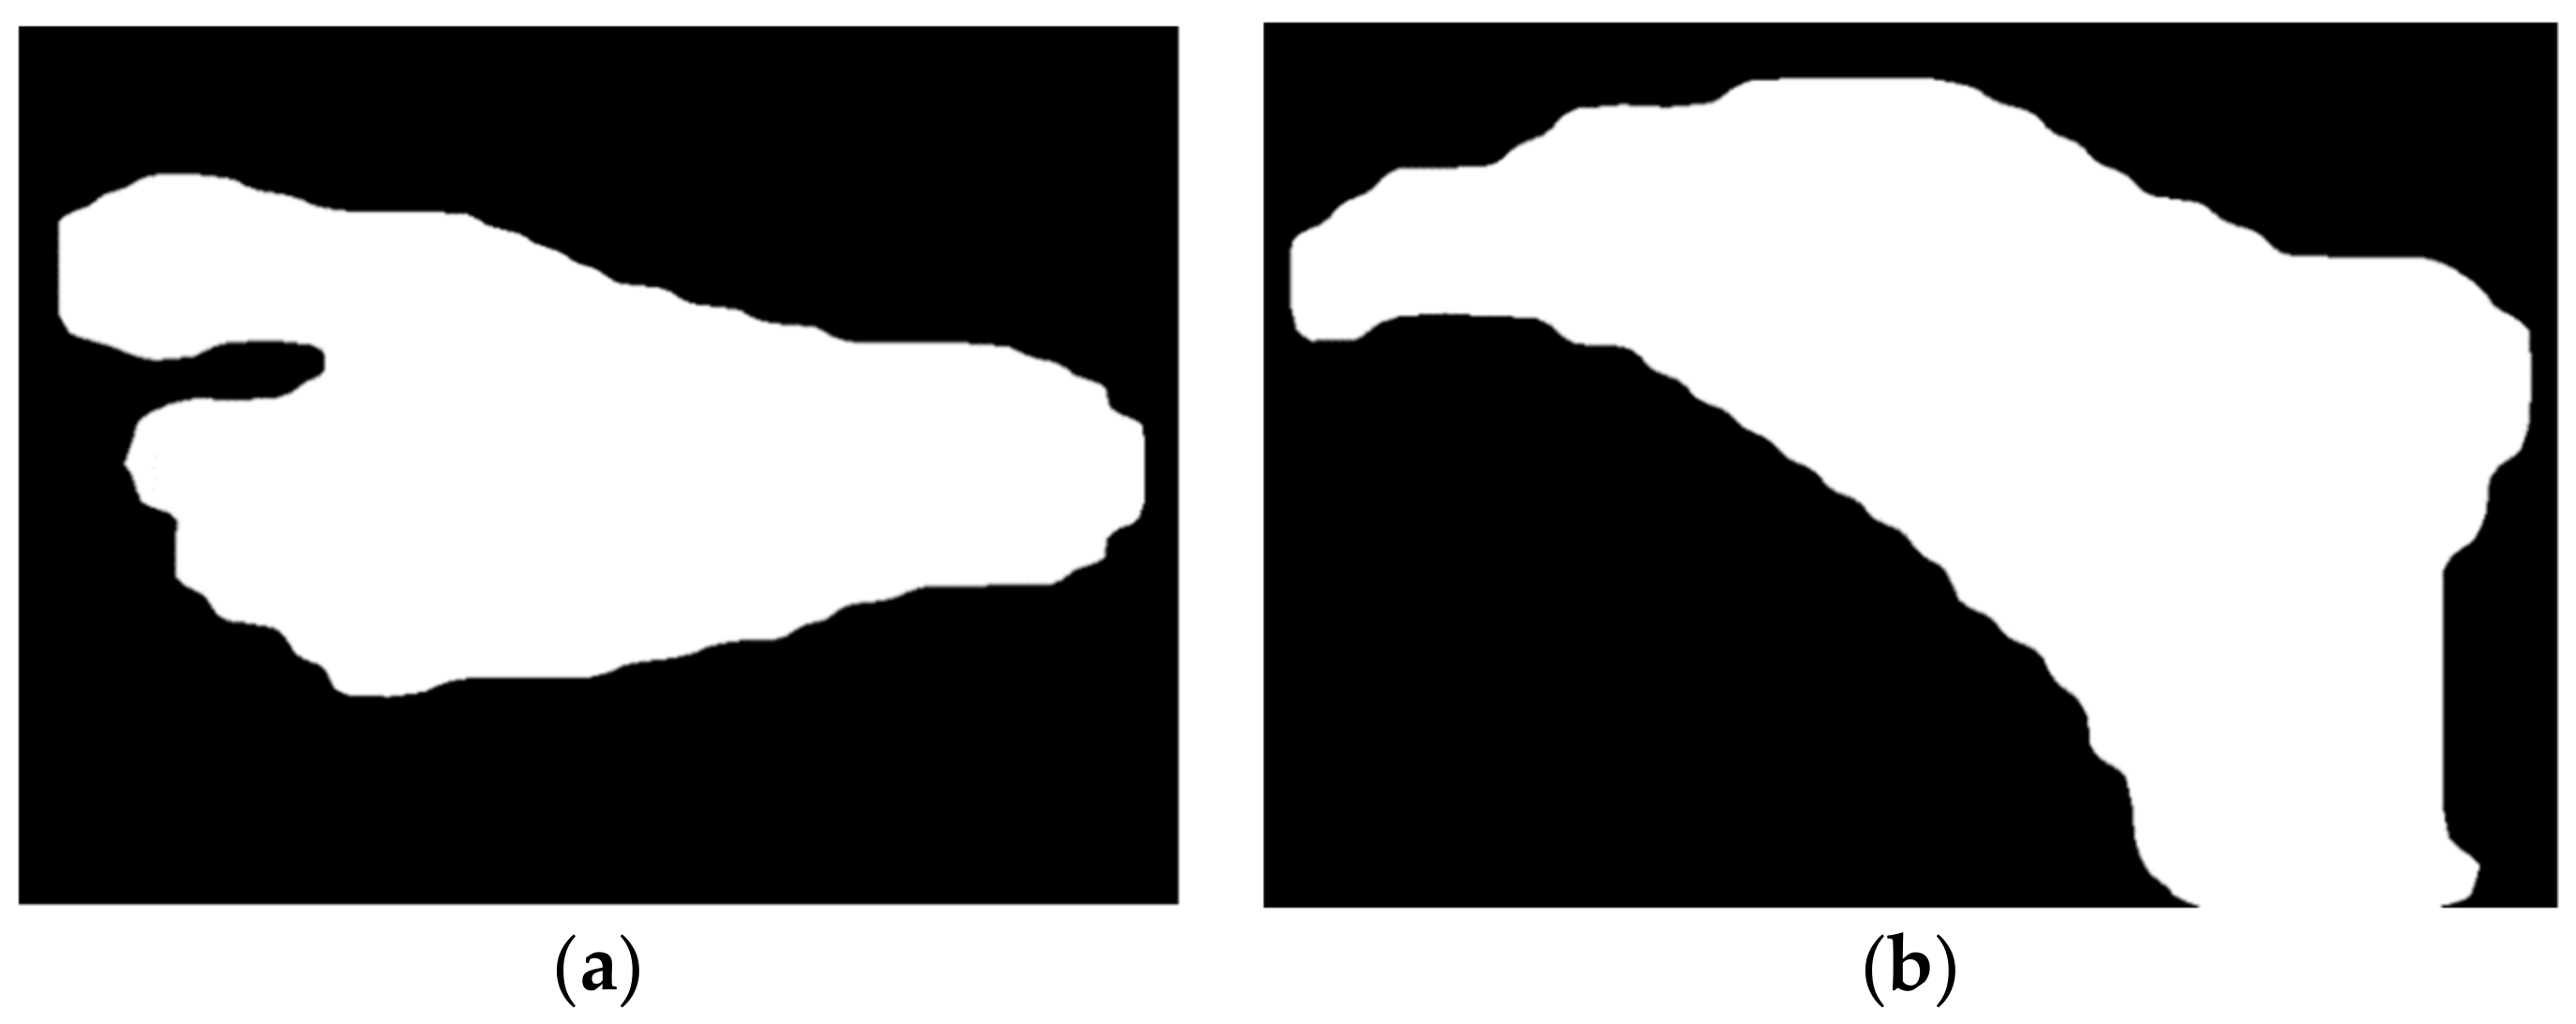
  • The small dataset for training the segmentation model—the average length for the male and female sets for both feet was about 266.71 mm and 255.47 mm, respectively. Important foot segments (parts of the toes) were not captured during mask formation; an example for model 4 is shown in Figure 11. Thus, reconstructed models whose values are close to the mean values are recommended, as they have the smallest deviations;
  • Influence of lighting—the photogrammetry approach is very sensitive to different types of glare, shadows, and the amount of light flux (lumens) hitting the object in the process of shooting;
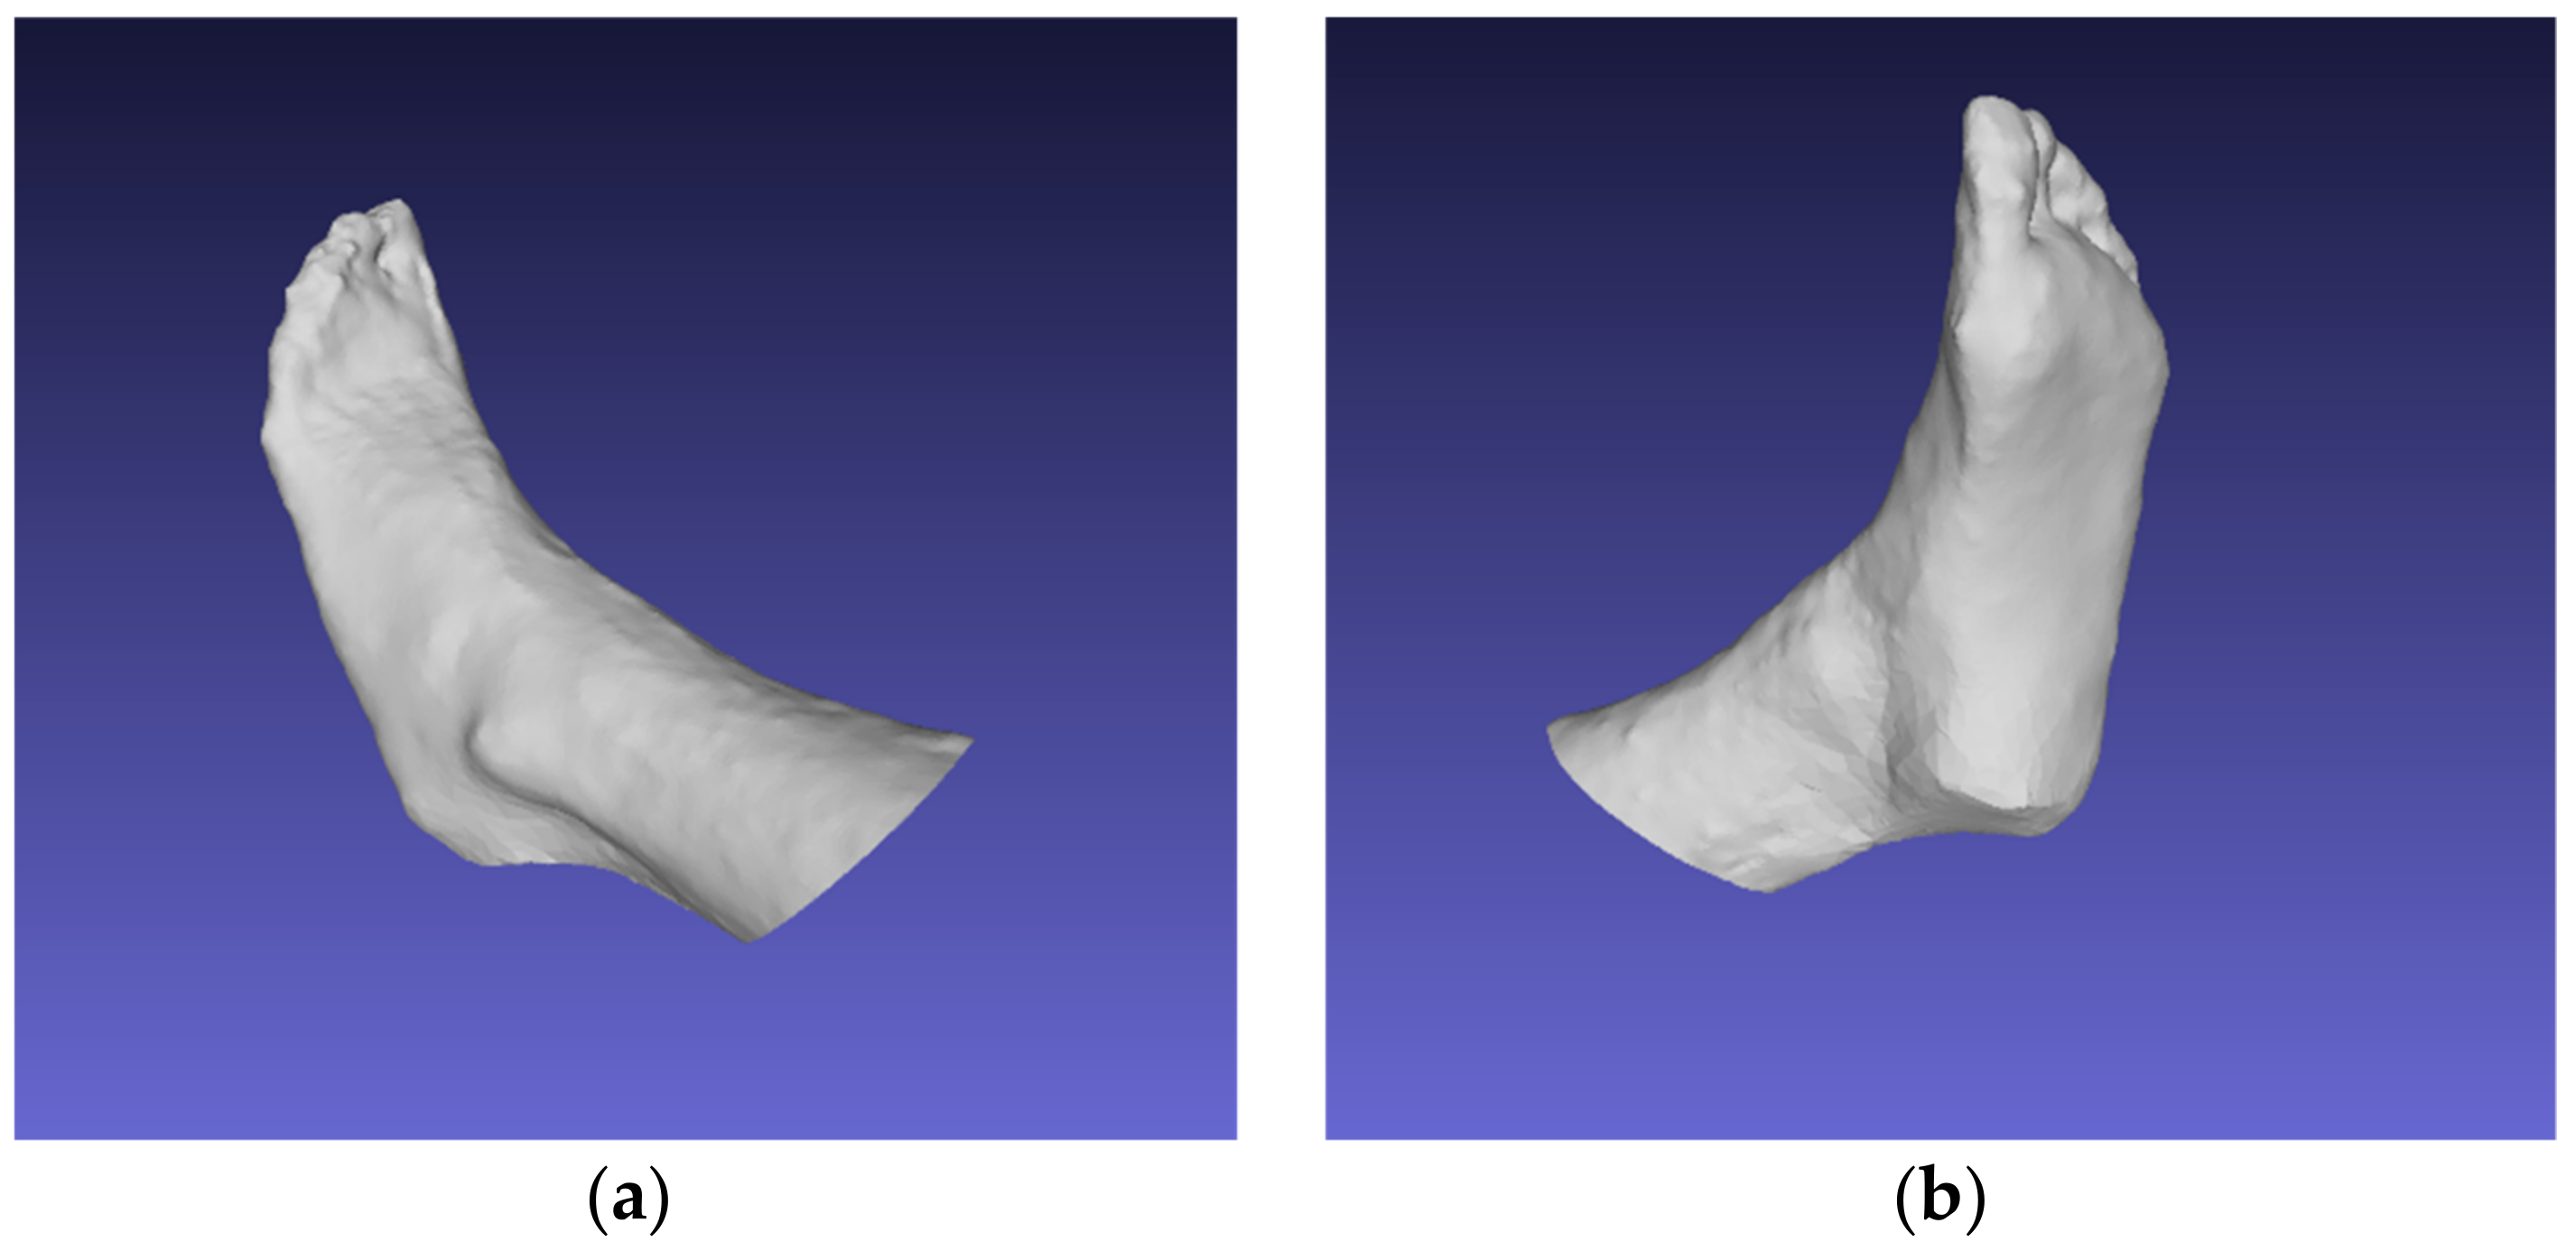
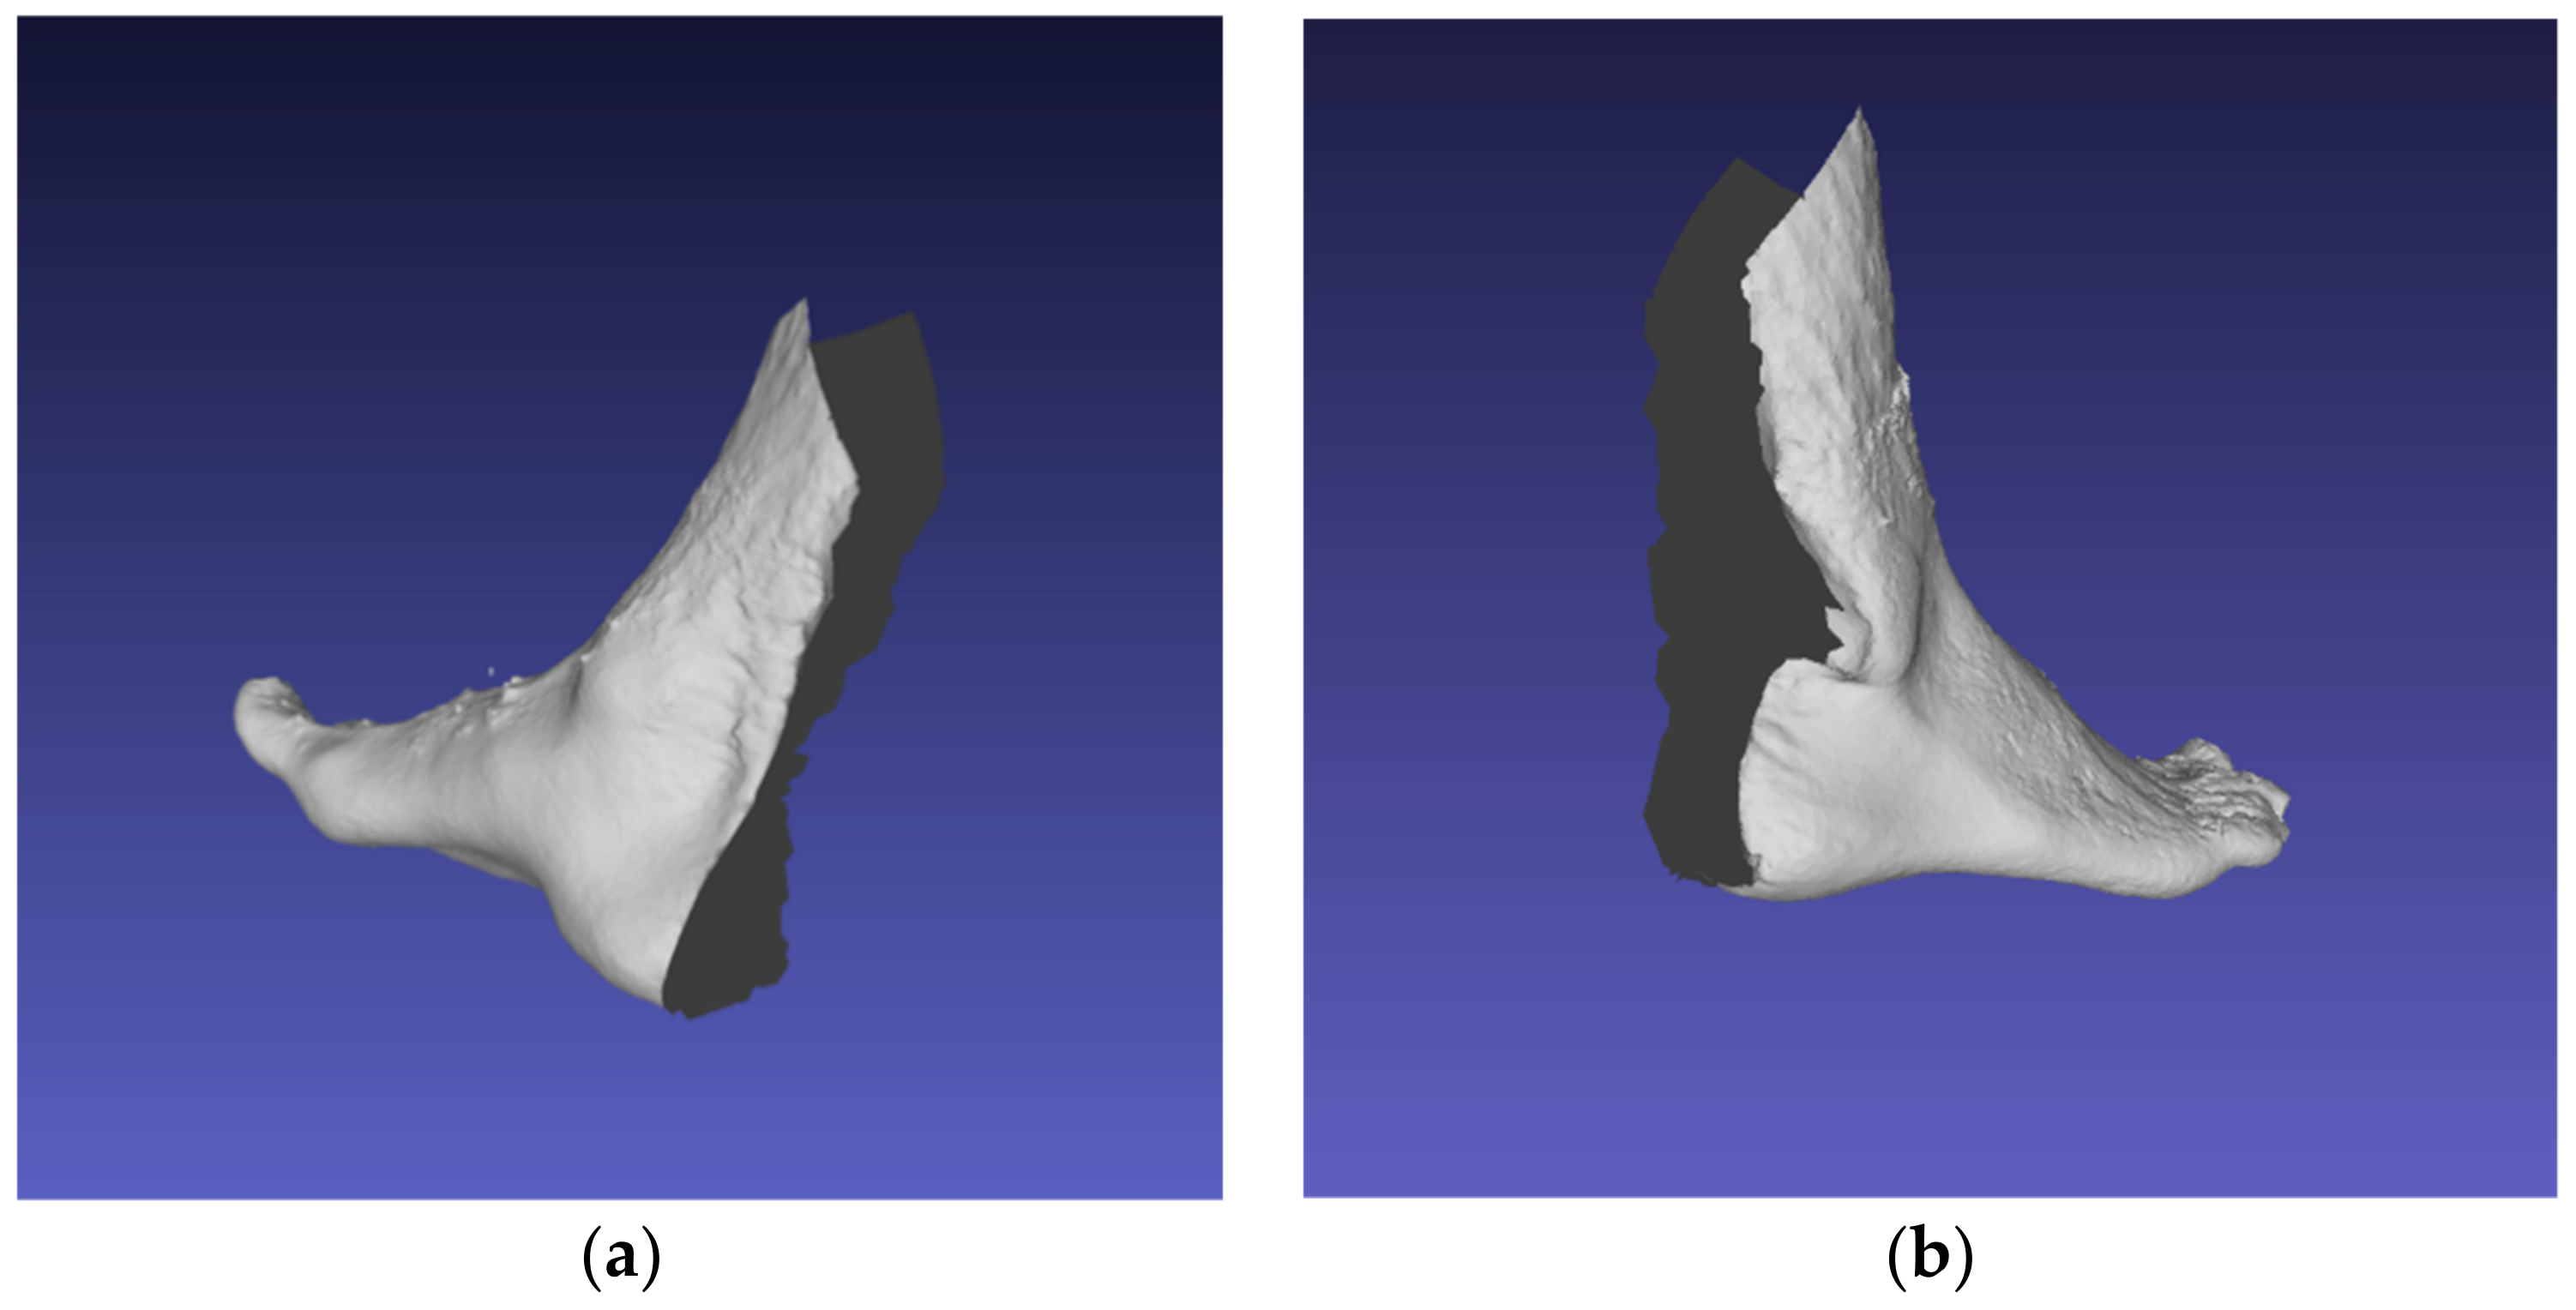
  • The peculiarity of circular video lies in the process of obtaining a video stream: users should consider all parts of the foot from all sides. The foot should remain stationary during the video recording process. An example of an unsuccessful reconstruction for model #4, where the volunteer was unable to capture the heel part of the foot, is shown in Figure 12.
Table 5 presents a comparison of the technique with the performance of analogs that use special depth sensors, machine-learning methods, and classical stereometry algorithms. In order to evaluate the quality of 3D models in general, and with such metrics as IoU or DICE, a benchmark dataset is needed (made on a high-precision scanner). In the absence of such a set, the results obtained were compared with counterparts by the standard deviations (in millimeters) of linear indicators (length and width).

5. Discussion

The proposed methodology has limitations that affect the quality, accuracy, and time of creating a 3D model. The main factors that affect the limitations in the presented methodology and, as a result, the accuracy of the obtained models, are presented below:
1. Software and hardware factors—in order to obtain a high-quality 3D model, the method requires a modern smartphone that supports video recording in 1920 × 1080 (pixels) resolution. The video format can be both vertical and horizontal. It is important to note the method’s and algorithms’ demand of photogrammetry to computing resources. Depending on the specific CPU and GPU model, there are different processing and 3D model creation times. In addition, it is necessary to use video cards (GPUs) that support CUDA technology. The optimal number of frames sufficient to obtain a complete and high-quality 3D model varies from 50 to 150;
2. Human factor—two people should be involved in the reconstruction process. The first person whose foot is to be reconstructed should lie on a flat surface, holding the foot with their hands in space. The foot should be strictly in the center of the frame and remain fixed throughout the video shooting. The second person records the video of the first participant at a certain angle. In this case, limitations may be low stabilization due to camera shake when shooting without using a tripod; the height of the shooter: a tall person will find it uncomfortable to bend down to maintain the correct angle when shooting; reluctance to comply with the requirements due to a lack of time to read the requirements;
3. The conditions of the placement, where the shooting was taken—in order to obtain high-quality data, it is important to avoid glare, highlights, and shadows in the camera lens and to choose a contrasting background. It is also important to provide the necessary free space in the room, because the shooter should move strictly in a circular path and travel around the foot. The distance from the camera lens to the foot can vary from 30 to 70 cm.

6. Conclusions

This work demonstrates the method and algorithms of photogrammetry for manufacturing custom orthopedic shoes, sizing, and medical research.
The main problem of analogs is missing in the specialization of the reconstruction of the foot’s lower arch, although this is important in orthopedic production. The advantage of the proposed technique is the minimal linear deviations in foot length and width indicators of 0.95 mm, which is comparable to the indicators of 3D models obtained with special depth scanners.
The values of such deviations were achieved using the Mask R-CNN trained for segmentation; the clustering accuracy, when estimated using the DICE and IoU metrics, was found to be 97.78% and 98.27%, respectively. The average time to create a 3D foot model based on a combination of the SIFT, AKAZE, and DSP-SIFT informative feature-extraction and -matching algorithms from 100 photos using 480 × 270 (pixels) resolution with the Tesla K80 GPU was found to be 1 min and 35 s.
The technique involves reconstruction of the lower arch, which makes 3D models unique and applicable in different areas. The proposed approach makes it possible to reconstruct the foot using a smartphone at home. This can reduce the time costs in orthopedic industries arising from postal shipments of plaster casts or polymeric materials. Currently, the presented methodology is automated as a final software product and allows the reconstruction of 3D models without manual post-processing.
In the future, we plan to work with machine-learning methods to create high-quality depth maps. Algorithms from AliceVision, presented in the open-source software Meshroom 2021.1, cope with the task of implementing such maps, but the use of NNs can improve their accuracy and efficiency of data processing. It is also necessary to carry out detailed studies aimed at extracting different foot girths and the influence of lighting on the quality of the reconstructed models.

Author Contributions

Supervision, A.R.; writing—original draft, L.S., S.S.; writing—review and editing, A.R., A.K., A.F.; conceptualization, A.K., E.K., A.R.; methodology, A.K., A.R.; software, L.S., S.S.; validation, A.F., A.K.; formal analysis, S.S., A.F.; resources, E.K., I.S.; data curation, I.S., A.R.; project administration, A.R.; funding acquisition, I.S., E.K. All authors have read and agreed to the published version of the manuscript.

Funding

This research was funded by the Ministry of Education and Science of the Russian Federation within the framework of scientific projects carried out by teams of research laboratories of educational institutions of higher education subordinate to the Ministry of Science and Higher Education of the Russian Federation, project number FEWM-2020-0042 (АААА-А20-120111190016-9).

Informed Consent Statement

Informed consent was obtained from all subjects involved in the study.

Data Availability Statement

Not applicable, the study does not report any data.

Acknowledgments

The authors would like to thank the Irkutsk Supercomputer Center of SB RAS for providing access to HPC-cluster Akademik V.M. Matrosov. Available online: http://hpc.icc.ru (accessed on 17 November 2021).

Conflicts of Interest

The authors declare no conflict of interest.

References

  1. Cieza, A.; Causey, K.; Kamenov, K.; Hanson, S.W.; Chatterji, S.; Vos, T. Global estimates of the need for rehabilitation based on the Global Burden of Disease study 2019: A systematic analysis for the Global Burden of Disease Study 2019. Lancet 2021, 396, 2006–2017. [Google Scholar] [CrossRef]
  2. Kulikajevas, A.; Maskeliunas, R.; Damasevicius, R.; Scherer, R. HUMANNET—A Two-Tiered Deep Neural Network Architecture for Self-Occluding Humanoid Pose Reconstruction. Sensors 2021, 21, 3945. [Google Scholar] [CrossRef] [PubMed]
  3. Kulikajevas, A.; Maskeliūnas, R.; Damaševičius, R.; Wlodarczyk-Sielicka, M. Auto-Refining Reconstruction Algorithm for Recreation of Limited Angle Humanoid Depth Data. Sensors 2021, 21, 3702. [Google Scholar] [CrossRef]
  4. Kulikajevas, A.; Maskeliunas, R.; Damasevicius, R. Adversarial 3D Human Pointcloud Completion from Limited Angle Depth Data. IEEE Sens. J. 2021. [Google Scholar] [CrossRef]
  5. Parrilla, E.; Ballester, A.; Solves-Camallonga, C.; Nácher, B.; Antonio Puigcerver, S.; Uriel, J.; Piérola, A.; González, J.C.; Alemany, S. Low-cost 3D foot scanner using a mobile app. Footwear Sci. 2015, 7, S26–S28. [Google Scholar] [CrossRef]
  6. Amstutz, E.; Teshima, T.; Kimura, M.; Mochimaru, M.; Saito, H. Pca-based 3d shape reconstruction of human foot using multiple viewpoint cameras. Int. J. Autom. Comput. 2008, 5, 217–225. [Google Scholar] [CrossRef] [Green Version]
  7. Revkov, A.; Kanin, D. FITTINTM-Online 3D Shoe Try-on. In Proceedings of the 3DBODY.TECH 2020—11th International Conference and Exhibition on 3D Body Scanning and Processing Technologies, Online/Virtual, 17–18 November 2020; Available online: http://www.3dbodyscanning.org/cap/papers/2020/2058revkov.pdf (accessed on 5 December 2021).
  8. Chuyko, G.; Shedrin, I.; Revkov, E.; Grishko, N.; Posmetev, V.; Kanin, D.; Buhtojarov, L. Method and Device for Measuring the Shape, Dimensions and Flexibility of Shoes. United States Patent 10782124, 22 September 2020. [Google Scholar]
  9. DomeScan/IBV. Available online: https://www.ibv.org/en/domescan/ (accessed on 8 November 2021).
  10. Ballester, A.; Piérola, A.; Parrilla, E.; Izquierdo, M.; Uriel, J.; Nácher, B.; Alemany, S. Fast, portable and low-cost 3D foot digitizers: Validity and reliability of measurements. In Proceedings of the 3DBODY, TECH 2017 8th International Conference and Exhibition on 3D Body Scanning and Processing Technologies, Montreal, QC, Canada, 11–12 October 2017; pp. 218–225. [Google Scholar]
  11. Volumental. Fit-Tech. Available online: https://volumental.com (accessed on 9 November 2021).
  12. Wang, M.; Wang, X.; Fan, Z.; Zhang, S.; Peng, C.; Liu, Z. A 3D foot shape feature parameter measurement algorithm based on Kinect. EURASIP J. Image Video Process. 2018, 2018, 119. [Google Scholar] [CrossRef]
  13. Zhao, K.; Luximon, A.; Chan, C.K. Low cost 3D foot scan with Kinect. Int. J. Digit. Hum. 2018, 2, 97–114. [Google Scholar] [CrossRef]
  14. Rogati, G.; Leardini, A.; Ortolani, M.; Caravaggi, P. Validation of a novel Kinect-based device for 3D scanning of the foot plantar surface in weight-bearing. J. Foot Ankle Res. 2019, 12, 46. [Google Scholar] [CrossRef] [PubMed] [Green Version]
  15. Besl, P.J.; McKay, N.D. A method for registration of 3-D shapes. IEEE Trans. Pattern Anal. Mach. Intell. 1992, 14, 239–256. [Google Scholar] [CrossRef]
  16. Yuan, M.; Li, X.; Xu, J.; Jia, C.; Li, X. 3D foot scanning using multiple RealSense cameras. Multimed. Tools Appl. 2021, 80, 22773–22793. [Google Scholar] [CrossRef]
  17. Novel Use of the IntelRealsense SR300 Camera for Foot 3D Reconstruction. Available online: https://0-www-proquest-com.brum.beds.ac.uk/openview/24c68afef1be76b5cb04180006933a52/ (accessed on 10 November 2021).
  18. Pambudi, D.S.; Hidayah, L. Foot 3D Reconstruction and Measurement using Depth Data. J. Inf. Syst. Eng. Bus. Intellegence 2020, 6, 37–45. [Google Scholar] [CrossRef]
  19. Kobayashi, T.; Ienaga, N.; Sugiura, Y.; Saito, H.; Miyata, N.; Tada, M. A simple 3D scanning system of the human foot using a smartphone with depth camera. J. Jpn. Soc. Precis. Eng. 2018, 84, 996–1002. [Google Scholar] [CrossRef]
  20. Zhang, H.; Chen, Z.; Guo, S.; Lin, J.; Shi, Y.; Liu, X. Sensock: 3D Foot Reconstruction with Flexible Sensors. In Proceedings of the 2020 CHI Conference on Human Factors in Computing Systems, Honolulu, HI, USA, 25 April–30 April 2020; pp. 1–13. [Google Scholar]
  21. Niu, L.; Xiong, G.; Shang, X.; Guo, C.; Chen, X.; Wu, H. 3D Foot Reconstruction Based on Mobile Phone Photographing. Appl. Sci. 2021, 11, 4040. [Google Scholar] [CrossRef]
  22. Reljić, I.; Dunđer, I.; Seljan, S. Photogrammetric 3D scanning of physical objects: Tools and workflow. TEM J. 2019, 8, 383. [Google Scholar]
  23. Grazioso, S.; Caporaso, T.; Selvaggio, M.; Panariello, D.; Ruggiero, R.; Di Gironimo, G. Using photogrammetric 3D body reconstruction for the design of patient–tailored assistive devices. In Proceedings of the IEEE 2019 II Workshop on Metrology for Industry 4.0 and IoT (MetroInd4.0 & IoT), Naples, Italy, 4–6 June 2019; pp. 240–242. [Google Scholar]
  24. Rey-Otero, I.; Morel, J.M.; Delbracio, M. An analysis of the factors affecting keypoint stability in scale-space. arXiv 2015, arXiv:1511.08478. [Google Scholar] [CrossRef] [Green Version]
  25. Shan, Q.; Adams, R.; Curless, B.; Furukawa, Y.; Seitz, S.M. The Visual Turing Test for Scene Reconstruction. In Proceedings of the IEEE International Conference on 3D Vision-3DV, Seattle, WA, USA, 29 June–1 July 2013; pp. 25–32. [Google Scholar]
  26. Zhu, H.; Liu, Y.; Fan, J.; Dai, Q.; Cao, X. Video-Based Outdoor Human Reconstruction. IEEE Trans. Circ. Syst. Vid. Tech. 2016, 27, 760–770. [Google Scholar] [CrossRef]
  27. Moulon, P.; Monasse, P.; Perrot, R.; Marlet, R. OpenMVG: Open Multiple View Geometry. In Proceedings of the Workshop on Reproducible Research in Pattern Recognition, Cancún, Mexico, 4 December 2016; pp. 60–74. [Google Scholar]
  28. Ravi, T.; Ranganathan, R.; Ramesh, S.P.; Dandotiya, D.S. 3D Printed Personalized Orthotic Inserts Using Photogrammetry and FDM Technology. In Fused Deposition Modeling Based 3D Printing; Springer: Cham, Switzerland, 2021; pp. 349–361. [Google Scholar]
  29. Real Time Segmentation of Feet on Smartphone. Available online: http://urn.kb.se/resolve?urn=urn:nbn:se:kth:diva-231779 (accessed on 11 November 2021).
  30. Paszke, A.; Chaurasia, A.; Kim, S.; Culurciello, E. ENet: Deep Neural Network Architecture for Real-Time Semantic Segmentation. arXiv 2016, arXiv:1606.02147. [Google Scholar]
  31. Chaurasia, A.; Culurciello, E. LinkNet: Exploiting Encoder Representations for Efficient Semantic Segmentation. arXiv 2017, arXiv:1707.03718. [Google Scholar]
  32. Howard, A.G.; Zhu, M.; Chen, B.; Kalenichenko, D.; Wang, W.; Weyand, T.; Andreetto, M.; Adam, H. MobileNets: Efficient Convolutional Neural Networks for Mobile Vision Applications. arXiv 2017, arXiv:1704.04861. [Google Scholar]
  33. Kok, F.; Charles, J.; Cipolla, R. FootNet: An Efficient Convolutional Network for Multiview 3D Foot Reconstruction. In Proceedings of the Asian Conference on Computer Vision; Springer: New York, NY, USA, 26 February 2021; Available online: https://0-link-springer-com.brum.beds.ac.uk/chapter/10.1007%2F978-3-030-69544-6_3 (accessed on 5 December 2021).
  34. Çiçek, Ö.; Abdulkadir, A.; Lienkamp, S.S.; Brox, T.; Ronneberger, O. 3D U-net: Learning dense volumetric segmentation from sparse annotation. In Lecture Notes in Computer Science (Including Subseries Lecture Notes in Artificial Intelligence and Lecture Notes in Bioinformatics); Springer: Quebec City, QC, Canada, 2016; Volume 9901, pp. 424–432. [Google Scholar]
  35. Zelek, J.; Lunscher, N. Point cloud completion of foot shape from a single depth map for fit matching using deep learning view synthesis. In Proceedings of the 2017 IEEE International Conference on Computer Vision Workshop (ICCVW), Venice, Italy, 22–29 October 2017; pp. 2300–2305. [Google Scholar]
  36. Robinette, K.M.; Daanen, H.; Paquet, E. The CAESAR project: A 3-D surface anthropometry survey. In Proceedings of the Second International Conference on 3-D Digital Imaging and Modeling, Ottawa, ON, Canada, 4–8 October 1999; pp. 380–386. [Google Scholar]
  37. Alcantarilla, P.F.; Solutions, T. Fast explicit diffusion for accelerated features in nonlinear scale spaces. IEEE Trans. Pattern Anal. Mach. Intell. 2011, 34, 1281–1298. [Google Scholar]
  38. Nister, D.; Stewenius, H. Scalable recognition with a vocabulary tree. In Proceedings of the IEEE CVPR 2006, New York, NY, USA, 17–22 June 2006; pp. 2161–2168. [Google Scholar]
  39. Detectron2. Available online: https://github.com/facebookresearch/detectron2 (accessed on 12 November 2021).
  40. Girshick, R. Fast R-CNN. In Proceedings of the International Conference on Computer Vision, Santiago, Chile, 7–13 December 2015; pp. 1440–1448. [Google Scholar]
  41. Gúler, R.A.; Neverova, N.; Kokkinos, I. DensePose: Dense Human Pose Estimation in the Wild. arXiv 2018, arXiv:1802.00434. [Google Scholar]
  42. Cai, Z.; Vasconcelos, N. Cascade R-CNN: Delving Into High Quality Object Detection. In Proceedings of the Computer Vision and Pattern Recognition, Salt Lake City, UT, USA, 18–22 June 2018; pp. 6154–6162. [Google Scholar]
  43. He, K.; Gkioxari, G.; Dollár, P.; Girshick, R. Mask r-cnn. In Proceedings of the 2017 IEEE International Conference on Computer Vision (ICCV), Venice, Italy, 22–29 October 2017; pp. 2980–2988. [Google Scholar]
  44. Di Stefano, L.; Mattoccia, S.; Tombari, F. ZNCC-based template matching using bounded partial correlation. Pattern Recognit. Lett. 2005, 26, 2129–2134. [Google Scholar] [CrossRef]
  45. AliceVision. Photogrammetric Computer Vision Framework. Available online: https://alicevision.org/ (accessed on 15 November 2021).
  46. Dice, L.R. Measures of the amount of ecologic association between species. Ecology 1945, 26, 297–302. [Google Scholar] [CrossRef]
  47. Rezatofighi, S.H.; Tsoi, N.; Gwak, J.; Sadeghian, A.; Reid, I.D.; Savarese, S. Generalized Intersection over Union: A Metric and A Loss for Bounding Box Regression. arXiv 2019, arXiv:1902.09630. [Google Scholar]
  48. Arteaga-Marrero, N.; Hernández, A.; Villa, E.; González-Pérez, S.; Luque, C.; Ruiz-Alzola, J. Segmentation Approaches for Diabetic Foot Disorders. Sensors 2021, 21, 934. [Google Scholar] [CrossRef]
Figure 1. Scheme of the algorithm’s interaction and reconstruction process of 3D foot shape models.
Futureinternet 13 00315 g001
Figure 2. This scene demonstrates the angle that must be used when shooting a person’s foot in a circular manner.
Futureinternet 13 00315 g002
Figure 3. Demonstration of the original image and the image converted into a mask. (a) The original image; (b) A mask, formed based on original image.
Futureinternet 13 00315 g003
Figure 4. Mask R-CNN architecture.
Futureinternet 13 00315 g004
Figure 5. Demonstration of the original and transformed depth map. (a) Original depth map; (b) Transformed depth map.
Futureinternet 13 00315 g005
Figure 6. Demonstration of the original and filtering mesh (a). Original mesh; (b) Filtering mesh.
Futureinternet 13 00315 g006
Figure 7. Segmented foot with the Mask R-CNN model.
Futureinternet 13 00315 g007
Figure 8. Demonstration of a reconstructed 3D model of the foot based on a series of images with resolution of 1920 × 1080 (pixels). (a) Left side of the foot; (b) Right side of the foot.
Futureinternet 13 00315 g008
Figure 9. Demonstration of reconstructed 3D model #1 of the foot based on a series of images with resolution of 480 × 270 (pixels). (a) Left side of the foot; (b) Right side of the foot.
Futureinternet 13 00315 g009
Figure 10. Demonstration of reconstructed 3D model #2 of the foot based on a series of images with resolution of 480 × 270 (pixels). (a) Left side of the foot; (b) Right side of the foot.
Futureinternet 13 00315 g010
Figure 11. Demonstration of failed masks, missing part of the thumb. (a) Front of the foot; (b) Side of the foot.
Futureinternet 13 00315 g011
Figure 12. Demonstration of an unsuccessful reconstruction of the foot for 3D model #4, missing the heel. (a) Left side of the foot; (b) Right side of the foot.
Futureinternet 13 00315 g012
Table 1. Summary information. Values of men’s and women’s feet for each of the measurements.
MeasurementsMenWomen
Left FootRight FootLeft FootRight Foot
MinMaxAvgStdMinMaxAvgStdMinMaxAvgStdMinMaxAvgStd
Length foot (mm)253307266.1513.91252307267.0714.05228319255.9323.0223232125523.07
Width foot (mm)9512811612.569512913.2944.538011194.939.858011196.0710.46
Instep girth (mm)200265247.4319.91204270248.9317.14210270228.7915.33208277229.4317.27
Ball girth (mm)2322702509.27231270249.719.65199282228.1421.63210279229.3619.30
Heel girth (mm)245360322.6431.13243360323.4331.41280360311.5726.51282360309.9325.90
Shin girth (mm)203260226.8616.76201261226.8618.22182280218.8627.50181260217.6422.35
Table 2. Comparison of NN models for foot segmentation.
ModelDICE (%)IoU (%)Inference Time (ms)
Mask R-CNN97.8898.27471
UPD [48]95.3591.11-
MobileSeg [29]97.6495.52552
Table 3. Results of the influence of informative feature extraction/comparison algorithms on foot parameters.
Number of
Models
Manual MeasurementSIFTSIFT, AKAZESIFT, AKAZE, DSP-SIFT
FL
(mm)
FW
(mm)
FL
(mm)
FW
(mm)
FL
(mm)
FW
(mm)
FL
(mm)
FW
(mm)
1265123264.5/(0.5)122.9/(0.1)264.7/(0.3)122.9 (0.1)264.9/(0.1)122.9/(0.1)
224798247.3/(0.3)98.8/(0.8)247.1/(0.1)98.5/(0.5)247.2/(0.2)98.4/(0.4)
324295243.2/(1.2)97.3/(2.3)243.1/(1.1)96.9/(1.9)242.9/(0.9)96.3/(1.3)
4285125288.3/(3.3)127.1/(2.1)287.7/(2.7)126.8/(1.8)286.9/(1.9)126.4/(1.4)
523593235.2/(0.2)93.4/(0.4)235.2/(0.2)93.3/(0.3)235.1/(0.1)93.2/(0.2)
6261119262.5/(1.5)120.9/(1.9)262.1/(1.1)120.5/(1.5)261.5/(0.5)120.3/(1.3)
723891237.5/(0.5)90.7/(0.3)237.7/(0.3)90.8/(0.2)237.8/(0.2)90.9/(0.1)
823592239.5/(4.5)92.9/(0.9)238.7/(3.7)92.7/(0.7)238.4/(3.4)92.5/(0.5)
9269121268.1/(0.9)121.7/(0.7)268.5/(0.5)121.5/(0.5)268.8/(0.2)121.5/(0.5)
10272127274.3/(2.3)127.9/(0.9)274.1/(2.1)127.7/(0.7)273.8/(1.8)127.6/(0.6)
Avg. Time (min)3.319.5811.29
Standard deviation (mm)1.140.990.87
Table 4. Results of the effect of different resolutions on the foot and average time to create a 3D model.
Number of
Models
Manual Measurement960 × 540640 × 360480 × 270
FL
(mm)
FW
(mm)
FL
(mm)
FW
(mm)
FL
(mm)
FW
(mm)
FL
(mm)
FW
(mm)
1265123264.5/(0.5)122.8/(0.2)264.7/(0.3)122.8 (0.2)264.8/(0.2)122.9/(0.1)
224798247.4/(0.4)98.7/(0.7)247.2/(0.2)98.7/(0.7)247.3/(0.3)98.4/(0.4)
324295243.3/(1.3)97.4/(2.4)243.3/(1.3)97/(2.0)243.1/(1.1)96.7/(1.7)
4285125288.5/(3.5)127.3/(2.3)288.3/(3.3)127.1/(2.1)288.2/(3.2)127/(2.0)
523593235.4/(0.4)93.3/(0.3)235.3/(0.3)93.3/(0.3)235.3/(0.3)93.2/(0.2)
6261119262.7/(1.7)121.1/(2.1)262.6/(1.6)120.9/(1.9)262.4/(1.4)120.8/(1.8)
723891237.3/(0.7)90.5/(0.5)237.4/(0.6)90.5/(0.5)237.4/(0.6)90.4/(0.6)
823592238.5/(3.5)92.7/(0.7)238.3/(3.3)92.7/(0.7)238.4/(3.4)92.6/(0.6)
9269121268/(1.0)121.8/(0.8)268.3/(0.7)121.7/(0.7)268.4/(0.6)121.6/(0.6)
10272127274.1/(2.1)127.7/(0.7)273.9/(1.9)127.5/(0.5)273.8/(1.8)127.5/(1.5)
Avg. Time (min)3.222.121.35
Standard deviation (mm)1.030.970.95
Table 5. Methods for 3D reconstruction of human feet based on images and portable depth scanners.
AuthorYearMethodInput DataStandard Deviation (mm)The Lower Arch of the Foot is Included
Parrilla E. et al. [5]2015PCA Multiple RGB images 1.7-
Pambudi D. S., Hidayah L. [18]2018RGB-D—camera, Intel RealsenseDepth image0.355+
Wang M. et al. [12]2018RGB-D—camera, Microsoft KinectDepth Image0.85+
Kobayashi T. et al. [19]2018Smartphone
depth-camera, PCA
Depth image1.13+
Revkov A., Kanin D. [7]2020Multi-stage decision tree is based on NNsMultiple RGB images1.3
Kok F., Charles J., Cipolla R. [33]2020CNN, PCAMultiple RGB images4
Niu L. et al. [21]2021PhotogrammetryMultiple RGB images1.08
Ours2021Photogrammetry, CNNMultiple RGB images0.95+
Publisher’s Note: MDPI stays neutral with regard to jurisdictional claims in published maps and institutional affiliations.

