
Median Absolute Deviation for BGP Anomaly Detection
by
 , , and
Maria Andrea Romo-Chavero
1,
Jose Antonio Cantoral-Ceballos
1,*,
Jesus Arturo Pérez-Díaz
1,* and
and
Carlos Martinez-Cagnazzo
2 1
School of Engineering and Sciences, Tecnologico de Monterrey, Monterrey 64849, Mexico
2
Technology Management, LACNIC, Montevideo 11400, Uruguay
*
Authors to whom correspondence should be addressed.
Future Internet 2024, 16(5), 146; https://0-doi-org.brum.beds.ac.uk/10.3390/fi16050146
Submission received: 20 March 2024
/
Revised: 19 April 2024
/
Accepted: 20 April 2024
/
Published: 25 April 2024
(This article belongs to the Special Issue Information and Future Internet Security, Trust and Privacy II)
Abstract
:The stability and reliability of the global Internet infrastructure heavily rely on the Border Gateway Protocol (BGP), a crucial protocol that facilitates the exchange of routing information among various Autonomous Systems, ensuring seamless connectivity worldwide. However, BGP inherently possesses a susceptibility to abnormal routing behaviors, potentially leading to significant connectivity disruptions. Despite extensive efforts, accurately detecting and effectively mitigating such abnormalities persist as tough challenges. To tackle these, this article proposes a novel statistical approach employing the median absolute deviation under certain constraints to proactively detect anomalies in BGP. By applying advanced analysis techniques, this research offers a robust method for the early detection of anomalies, such as Internet worms, configuration errors, and link failures. This innovative approach has been empirically validated, achieving an accuracy rate of 90% and a precision of 95% in identifying these disruptions. This high level of precision and accuracy not only confirms the effectiveness of the statistical method employed but also marks a significant step forward for enhancing the stability and reliability of the global Internet infrastructure.
1. Introduction
In today’s interconnected world, the internet has emerged as the keystone of contemporary communication and information exchange, serving as the backbone for various sectors such as commerce, education, healthcare, and social interaction. Because of society’s increasing reliance on the internet, the need for robust and secure internet infrastructure becomes indispensable. This scenario underscores the importance of the Border Gateway Protocol (BGP), the principal inter-domain routing protocol [1].
The BGP is a path vector protocol that meticulously manages Network Reachability Information (NRI) between Autonomous Systems (ASes). Its primary function is to ensure the delivery of stable and secure routing paths, while preventing routing loops [2]. The optimal functioning of BGP is crucial for the seamless exchange of the information underlying the stability and security of the entire internet infrastructure.
However, the inherent complexity of BGP, coupled with its need to adapt to varied network environments, renders it susceptible to a spectrum of anomalies. These include Denial of Service (DoS) attacks, routing hijackings, and misconfigurations [1]. The potential severity of these anomalies is illustrated by Shi et al. [3] which reveals that approximately 20% of hijackings and misconfigurations have the potential to disrupt 90% of internet traffic in less than two minutes, even though they typically last less than 10 min.
In recent years, most of the approaches towards addressing this escalating problem are based on machine learning (ML) [4,5,6,7] and deep learning (DL) techniques [8,9,10], and while these methods are effective in identifying the unusual patterns indicative of cyber threats, their implementation requires extensive data preprocessing and accurate data labeling to differentiate between normal and anomalous behaviors effectively. In addition, these techniques require time and resource-intensive training stages. Moreover, there is a continuous need to update and retrain these models to recognize new, unseen anomalies. These data preprocessing and updating requirements becomes even more apparent as recent statistics indicate that these attacks have not only doubled in size over the past two years [11] but also have become increasingly sophisticated [12]. This critical requirement for continuous improvement is the primary motivator for our research into developing a novel detection methodology. Our approach aims to be both adaptable and efficient, particularly suited to address the dynamic nature of cyber threats targeting the Border Gateway Protocol (BGP). The novelty of our method lies in its reliance on statistical techniques, alleviating the complexities and resource demands typically required by machine learning and deep learning models. Our approach has the ability of adapting swiftly to new threats while minimizing the need for extensive data preprocessing and training, making it suitable for proactive threat detection.
This research focuses on the early detection of anomalies linked to major cyber incidents. These include worm attacks like Code Red 1 v2, Slammer, and Nimda, the Moscow blackout due to a link failure, and the misconfiguration incident at Telekom Malaysia. Such cyber threats have historically posed significant challenges to the stability of the internet, highlighting the need for thorough investigation and the development of efficient detection mechanisms. Our study aims to add value to this field by enhancing the understanding and detection of these cyber threats.
The research incorporates the median absolute deviation (MAD), a solid statistical technique, for the analysis of anomalies within BGP update messages. Renowned for its robustness against outliers [13], the MAD measure is also noted for its technical precision and operational simplicity. These attributes make it exceptionally suitable for detecting anomalies at early stages. The effectiveness of the MAD method in this context stems from its capability to correlate observed anomalies with the occurrence of significant cyber-attacks, a vital step in distinguishing between normal and anomalous traffic patterns. This differentiation, inherently challenging due to the complexity of network traffic, is essential for establishing a clear baseline definition of what constitutes an anomaly within cybersecurity. By setting this baseline, it becomes possible to identify network anomalies more clearly and improve our understanding of cyber threat patterns, ultimately leading to the development of more effective detection and mitigation strategies.
Therefore, we believe that the work presented hereby represents a significant contribution to the field of cybersecurity by introducing an innovative proactive anomaly detection approach that utilizes the median absolute deviation (MAD) technique. A key advantage of this approach is the statistical foundation of the MAD method, which substantially lowers the need for extensive training on historical data compared to machine learning and deep learning approaches. This aspect is particularly valuable in the rapidly changing context of cyber threats, as it ensures the technique’s effectiveness in combating new or previously unrecognized anomalies by focusing on data variability instead of relying on patterns from past data. This paper also provides a thorough evaluation and analysis of various anomalies variations, including indirect anomalies, direct unintended anomalies, and link failures; compared to other approaches like those by Dai et al. [10] and Ding et al. [5] which only detected indirect anomalies, our approach demonstrates a broad applicability in detecting a wide spectrum of network disruptions.
Moreover, MAD can potentially complement machine learning (ML) and deep learning models in the cybersecurity field. By demonstrating the ability of MAD to identify a wide range of anomalies with minimal data preprocessing and its potential in detecting unseen attacks, the study suggests that incorporating MAD significantly enhances the accuracy and precision of ML-based cybersecurity measures. This proposal paves the way for developing more flexible and stronger defenses against the constantly changing threats in cyberspace. To summarize, this study makes the following contributions.
- The design and introduction of a resource-efficient median absolute deviation (MAD) method for detecting network anomalies, which significantly lowers computational demands and that could work in tandem with machine learning and deep learning models.
- The implementation of MAD’s statistical approach to reduce reliance on extensive historical data, thereby enhancing the adaptability of cybersecurity systems to new threats.
- The comprehensive analysis of various anomaly types with MAD, demonstrating its broad applicability and versatility in addressing a spectrum of network challenges.
The structure of this paper is organized as follows: Section 2 delves into related work, offering both a background and context essential for this study. It then outlines the theoretical framework, emphasizing the specific attributes for our investigation, followed by an explanation of the dataset processing steps, detailing the preparation and management of data for analysis. Additionally, this section presents the methodology used, outlining the techniques and strategies utilized for detecting and analyzing anomalies. Section 3 presents the results of this research, followed by the performance evaluation and a comparative analysis against deep learning models. Section 4 engages in a discussion, and Section 5 concludes the paper and proposes future research directions.
1.1. Related Work
The field of BGP anomaly detection is marked by an extensive exploration of methodologies aimed at enhancing the stability and security of the global Internet infrastructure. This spectrum ranges from statistical techniques to the application of advanced machine learning (ML) models and Deep Learning (DL) models, among others; each contributing to the ongoing fight against cyber threats.
Chen et al. [14] introduced a statistical method utilizing an updated visibility matrix to effectively identify significant BGP disruptions. This approach used a heuristic algorithm to find a denser and larger submatrix from the original indicating unusual activity. Even though it demonstrated practical relevance, its dependency on heuristic algorithms implies computational complexity that could escalate with the size of the data and require significant computational resources. Additionally, Deshpande et al. [15] introduced the Generalized Likelihood Ratio Test (GLRT) for anomaly detection, analyzing data from a single BGP router. Their focus on BGP update features such as AS path length and edit distance provided valuable insights into the behavior of the internet under stress. However, the detection time, often within an hour, presents limitations for real-time responses, thereby highlighting the imperative for methods that enable more immediate detection. Simultaneously, Testart et al. [16] concentrated on identifying Autonomous Systems (ASes) susceptible to malicious IP block hijacking, creating a classifier for pinpointing similar ASes. Their research highlighted the critical role of intermittent AS presence and fluctuating prefix origination behavior as key classification features. Furthermore, Moriano et al. [17] presented a method for detecting BGP routing anomalies by analyzing burstiness in announcements updates. Their method’s effectiveness relies on discerning patterns of frequent announcements followed by periods of inactivity, which are indicative of potential disruption, and while their method showed effectiveness in identifying anomalous patterns, it found difficulties with differentiating between benign and malicious bursts, in addition to its dependency on manually verified truth metadata introducing uncertainties about its real-world applicability.
Li et al. [9] employed Recurrent Neural Networks (RNNs), specifically Long Short-Term Memory (LSTM) and Gated Recurrent Unit (GRU) models, to detect BGP anomalies. They compared LSTM and GRU performance towards different anomalous events, highlighting deep learning’s potential for anomaly detection. However, the complex nature of deep learning models requiring extensive parameter tuning and relying on accurately labeled datasets, presents challenges for real-world applications due to computational demands and sensitivity to missing data. Moreover, the MAD-MulW framework by Peng et al. [8] presents an advancement in unsupervised anomaly detection within BGP security events through its multi-window serial framework, integrating W-GAT and W-LAT modules for adaptive sample weighting and predictive reconstruction. The approach’s efficiency is evident by its average accuracy score of over 96%. In addition, it demonstrates a higher performance than classical and recent unsupervised models. Despite its effectiveness, the model faces challenges with determining optimal window sizes for varied datasets and managing increased model space and time resources due to sample expansion. Finally, Dai et al. [10] proposed a Support Vector Machine-based BGP anomaly detection method (SVM-BGPAD), employing feature selection algorithms and optimization techniques. Despite its promising results, the method’s reliance on complex feature selection and parameter optimization processes presents challenges for practical deployment, requiring computational resources and machine learning expertise.
In conclusion, while these approaches provide valuable tools for BGP anomaly detection, the most recent and sophisticated models, which are Machine Learning and Deep Learning models, demand considerable computational resources, extensive preprocessing, accurate labeling, reliance on high-quality data, and scalability. In contrast, our statistical approach aims to match or even outperform these models, providing an alternative with quicker performance, lower computational complexity, and adaptable to network infrastructure for its easy implementation. Given the shared objective of enhancing internet security and the similar event anomalies evaluated by our work and the MAD-MulW framework, a direct comparison between these methodologies is proposed. This comparison aims to showcase the strengths of a statistical approach in achieving timely, adaptable, and resource-conscious anomaly detection.
1.2. Theoretical Framework
This section outlines the essential concepts of the Border Gateway Protocol (BGP), which form the foundation of our research and enable a comprehensive understanding of its mechanisms and implications in cybersecurity.
The Internet is segmented into numerous distinct regions of administrative authority, often referred to as Autonomous Systems (ASs) [18]. Each Autonomous System (AS) comprises a collection of routers managed by a single administrative domain, and is uniquely identified by an AS number [19]. These identifiers are allocated from either public or private ranges, ensuring unique identification across the internet [20].
The principal routing protocol for exchanging Network Routing Information (NRI) among these Autonomous Systems (ASes) is BGP. It operates over the Transmission Control Protocol (TCP), specifically utilizing TCP port number 179 [2]. Incorporating TCP as the underlying transport protocol is essential for BGP operations, as it eliminates the need for BGP to autonomously manage the complexities of message delivery and flow control among peers. This setup enables a BGP router to establish direct TCP connections with routers in distinct ASs. Due to the extensive nature of BGP routing tables, these are shared just once upon the initial establishment of the connection between peering routers. Only updates, such as the introduction of new prefixes or the withdrawal of existing ones, are communicated thereafter [7]. This strategic use of TCP not only simplifies the operational mechanics of BGP but also significantly improves its efficiency and the reliability of inter-AS connections.
BGP utilizes a series of message types, each with a specific purpose, to communicate between peers: these include OPEN, UPDATE, NOTIFICATION, and KEEPALIVE messages.
- OPEN Message: This is the first message sent after establishing a TCP connection between two BGP peers. It is used to initiate the BGP session and includes critical information such as the AS number and the BGP version.
- KEEPALIVE Message: Sent periodically to sustain the connection, these messages confirm the active status of the link between BGP peers.
- NOTIFICATION Message: Used to indicate errors or terminate a BGP session, detailing the reasons for session closure or errors encountered.
- UPDATE Message: Perhaps the most significant, these messages perform three key functions: announcing new routes, withdrawing previously advertised routes, and modifying existing routes with updated parameters. Additionally, UPDATE messages can adjust route attributes to adapt to changing network conditions or policies.
Given the focus of this research on update messages, a detailed examination of route advertisements and withdrawals is pertinent.
Route Advertisements: In BGP operations, when a router identifies a preferable route due to changes in network topology or policy decisions, it communicates this update to its peers through a route advertisement within an UPDATE message [9]. These messages contain important information, including the network destination (IP prefix) and the AS-PATH. The primary objective of these advertisements is to ensure that all peer routers are informed of the most current and efficient routing paths, thereby maintaining the overall efficiency and stability of internet routing.
Route Withdrawals: Equally significant are route withdrawals, which play a critical role in upholding the accuracy and efficiency of BGP routing tables. If a previously valid route becomes obsolete or less desirable, perhaps due to changes in network topology, policy alterations, or as a consequence of cyber attacks, routers forward this change to their peers through a route withdrawal message. Such messages specify the IP prefixes that are no longer accessible, leading peer routers to remove these routes from their routing tables [1]. This process is essential for ensuring that internet traffic is not routed through invalid or inefficient paths, thereby safeguarding the integrity and efficiency of network routing.
The continuous and efficient exchange of these BGP messages, particularly UPDATE messages, is vital for maintaining the robustness and reliability of Internet routing. By understanding these core aspects of BGP, we lay a comprehensive groundwork for exploring the protocol’s vulnerabilities and developing effective anomaly detection mechanisms, which are central to this research.
2. Materials and Methods
2.1. Methodology
This section details our methodological approach for identifying and examining unusual activities within the Border Gateway Protocol (BGP) framework. Initially, we establish a clear definition of what constitutes a BGP anomaly, evaluating how this definition encompasses a range of anomalies from inefficient but harmless routing decisions to deliberate and potentially damaging attacks on the network.
Following this definition, our methodology details the tools and criteria utilized in our anomaly detection method. We provide a comprehensive overview of the statistical justification and empirical basis for our approach, aiming to clarify our decision-making process.
2.1.1. BGP Anomaly Definition
In the context of the BGP, defining what constitutes an anomaly is especially challenging due to the protocol’s complexity and the variety of operational behaviors it supports. Essentially, anomalous behavior in this context refers to any operational activity that diverges from, or adversely affects, the principal objective of the protocol. This objective is to facilitate the efficient and seamless exchange of Network Reachability Information (NRI) between various networks, ensuring optimal network interoperability and connectivity. Such deviations from the expected behavior can significantly compromise the protocol’s functionality and network performance [21]. This broad definition includes a range of activities, from less efficient but harmless routing choices to deliberate attacks on the network infrastructure.
Detecting anomalies in BGP is not always straightforward; for example, route flapping might lead to long-term instability, which is a potential sign of an anomaly, while traffic engineering efforts could cause short-term instability. The difficulty lies in determining which actions are harmful or beneficial to BGP’s operational goals.
Expanding on the classification system proposed by Al-Musawi et al., BGP anomalies can be grouped into four main types: indirect, direct intended, direct unintended, and link failure [1]. An indirect anomaly occurs when an external harmful activity, like a worm attack or ransomware, indirectly disrupts BGP stability by overloading routes or causing an increase in BGP messages. Although these attacks do not directly target BGP, they can still lead to significant instability. For instance, a malware attack aimed at internet components such as web servers can generate a traffic overload, thereby impacting the ability of BGP routers to handle regular route updates. On the other hand, direct intended anomalies are those that intentionally take advantage of BGP vulnerabilities for malicious purposes, potentially redirecting traffic from legitimate Autonomous Systems to unauthorized ones. This anomaly includes all of the different types of hijacking. Meanwhile, direct unintended anomalies typically refer to misconfigurations, which can cause problems like route leaks or blackholes. These misconfigurations, usually unintentional, can lead to serious issues, such as disrupting network paths or causing packet loss. Finally, link failure anomalies occur when there is a breakdown in the connections between Autonomous Systems, often due to external events like cable breaks or power outages, leading to widespread instability in the network.
In this research, we focus on specific anomalous events detailed in Table 1. This table offers a concise summary of all the anomalies, organizing them by their classification and the dates of occurrence as documented in the existing literature. For incidents such as Nimda, CodeRed 1 v2, and Slammer, the dates of occurrence are drawn from the research by Li et al. [4], with times recorded in GMT, which is equivalent to UTC for our purposes. The dates for the TMnet incident are sourced from Cisco’s BGPMon, also reported in UTC [22]. The analysis of the Moscow blackout, derived from the research by Fonseca et al. [21] and the study by Besanger et al. [23], presents a detailed hourly narrative of the event. However, the time zone of the reported times is not specified. Given this uncertainty, we have assumed that these times were in MSK and have accordingly adjusted them to UTC to maintain consistency within our research.
In the subsequent subsection, we will provide the data processing steps of our study. Following this, we will present a thorough explanation of the technique employed in our research. This will include an in-depth discussion of the median absolute deviation (MAD) methodology, its application within our anomaly detection framework, and the rationale behind choosing a specific threshold value and time duration. This sequence ensures a logical flow from data preparation to the intricate details of our analytical approach.
2.1.2. Data Processing: Collection and Preprocessing
The data processing phase of the study encompasses the collection and preprocessing of BGP data. The primary source of data for this research comes from the Réseaux IP Européens Network Coordination Centre (RIPE NCC) [24], which offers extensive public Internet routing data through the Routing Information Service (RIS). The data was obtained in the Multi-threaded Routing Toolkit (MRT) binary format [25], a standardized format developed by the Internet Engineering Task Force (IETF) for exporting various BGP protocol information, including messages, state changes, and Routing Information Base (RIB) contents [26]. Specifically, the study extracted routing data from Remote Route Collectors (RRC), focusing on RRC04 located at the CERN Internet Exchange Point (CIXP) in Geneva, Switzerland. For details on the extraction dates, total number of observation, and route collector information for each event, please refer to Table 2. The use of a robust and diverse dataset ensures that our research findings are substantiated with solid empirical evidence, thereby enhancing the reliability and validity of the results.
To construct the dataset for this study, a specialized Python script was developed. This script was specifically designed to parse and extract relevant attributes (see Table 3) from the raw BGP data, utilizing the Python API PyBGPStream, a well known tool for BGP data processing [27].
The extraction phase primarily focuses on the type of UPDATE messages, specifically targeting a critical period during which these anomaly events were prevalent, ranging from 1 to 3 days. During these periods, both normal and anomalous behaviors were expected to be detected through the volume of announcements and withdrawals—these being the primary features extracted. By processing the data in 3-min batches, we calculated the exact number of announcements and withdrawals for each batch, with each batch representing a single row in our dataset, as illustrated in Figure 1.
To enhance the dataset further, we included timestamps and record counts as additional parameters. Timestamps were converted from Unix format to a human-readable form. This conversion was important not only for facilitating the interpretation of the data but also for enabling a detailed analysis of temporal patterns. Furthermore, a record count was implemented to track each entry within the 3-min intervals, thereby organizing and simplifying the analysis of the BGP data’s extensive volume.
To facilitate a comprehensive understanding of the dataset structure and to guide researchers in accurately reproducing the analysis, Table 2 provides details regarding the anomalies event, including the specific extracted dates, the route collector used, and length of dataset per event.
2.1.3. Median Absolute Deviation (MAD)
In our approach to anomaly detection, we employ the median absolute deviation (MAD). This statistical method was selected for its effectiveness in handling outliers and its high breakdown point compared to other statistical measures [28]. Unlike the standard deviation, which can be easily influenced by extreme values, MAD provides a more reliable measure of variability in datasets that may contain anomalies. By focusing on the median of absolute deviations from the dataset’s median, MAD minimizes the impact of extreme values, ensuring that our anomaly detection approach is more resistant to skewed data [28]. Additionally, the simplicity of its calculation makes it an efficient choice for large datasets where computational efficiency is crucial.
The formula for the MAD is given by
where represents each individual data point and X the entire dataset. This formula calculates the median of the absolute deviations from the dataset’s median, providing a measure that is less sensitive to extreme values [29].
Our Anomaly Definition: Having previously explained the concept of anomalies within the BGP context, we now detail our criteria for classifying behavior as anomalous. In our anomaly detection framework, an anomaly is identified when the overlap of announcements and withdrawals surpasses a predetermined threshold and persists for a specified duration. This threshold is established by multiplying the median absolute deviation (MAD) value by a factor n. Given the inherently fluctuating nature of BGP, where variations between announcements and withdrawals are normal, we have incorporated an additional time constraint, denoted as t. This constraint enhances the accuracy of our anomaly detection by filtering out truly significant anomalies from routine fluctuations.
Specifically, the criterion for defining an anomaly within the BGP dataset, denoted as X, is formulated as follows: Let M represent the median of X and MAD denote the median absolute deviation of X. The threshold multiplier is represented by n, and the minimum duration for a data point to be considered a significant anomaly is specified as t minutes.
The anomaly detection criterion is defined by the formula
where is each individual data point in the dataset X. This condition must be sustained for a period exceeding t minutes.
In this formula, calculates the absolute deviation of each data point from the median M of the dataset. A data point is classified as an anomaly if its deviation from the median is greater than n times the MAD, and this deviation continues for more than t minutes.
For instance, in this study, we adopted a threshold value of and a time constraint of min. Consequently, any data point in the dataset X is identified as an anomaly if it deviates from the median by more than three times the MAD value, and this significant deviation persists for a duration exceeding 6 min. This temporal criterion is essential for distinguishing between normal BGP traffic fluctuations and anomalous behavior, thereby minimizing false positives and effectively highlighting significant anomalies that demonstrate continuous and abnormal activity.
The choice of as the threshold multiplier and 6 min as the minimum duration t for anomaly classification in this study is based on a combination of statistical rationale and empirical observations of BGP behavior.
Statistical Justification for the Threshold Multiplier (n = 3): In statistical analysis, a common practice for identifying outliers is to consider values that lie more than three standard deviations from the mean. By analogy, setting in the MAD-based approach aligns with this widely accepted statistical norm. The MAD, being a robust measure of variability, when multiplied by 3, effectively isolates extreme deviations that are unlikely to occur under normal circumstances.
Empirical Basis for the Time Duration (t = 6 min): The selection of 6 min as the duration for sustaining an anomaly is derived from empirical observations of BGP traffic patterns. BGP updates, due to the protocol’s nature, exhibit a certain degree of variability. These fluctuations are often short-term and do not necessarily indicate a significant problem. Our analysis of historical BGP data revealed that true anomalies usually maintain their presence for durations exceeding these brief fluctuations. A time frame of 6 min was identified as an effective threshold to distinguish between these short-term fluctuations and more prolonged, unusual patterns. Consequently, this 6-min criterion serves as a practical filter to reduce false positives, ensuring that only those deviations that demonstrate persistent abnormal behavior are flagged as anomalies.
To ensure consistent analysis of MAD’s effectiveness across diverse BGP events, we have decided to maintain constant parameters throughout our evaluations. However, adjusting these parameters could significantly enhance anomaly detection for specific scenarios, considering MAD’s reliance on traffic fluctuations and BGP data variability. Future research will focus on developing an adaptive dynamic threshold mechanism, capable of self adjusting in response to changes in data variability. Further details can be found in Section 5.1.
Figure 2 provides a detailed flowchart for this methodology. The first step in our anomaly detection process begins with the extraction of data, either directly from a data collector, in our case, we used the RIPE NCC [24], or from an existing dataset. During the preprocessing phase, we organize this data into 3-min batches and compute the number of record counts, announcements, and withdrawals for each batch. Once the dataset is prepared, we compute the median absolute deviation (MAD) and establish the values for each parameter of our model: the factor n and the time duration t. Following this setup, our system examines the data, specifically identifying instances where the overlap of announcements and withdrawals exceeds the defined threshold for the required minimum duration. This process identifies potential anomalies. Subsequently, the output is categorized into two segments: anomalous BGp traffic or normal BGP traffic; this output can be combined with an AI-based model to improve the accuracy of the detection of BGP anomalies. The final step involves a thorough analysis of these results to evaluate the method’s performance, ensuring that our system can effectively differentiate between normal and anomalous BGP traffic. This differentiation is crucial for maintaining network integrity and optimizing performance.
By incorporating the median absolute deviation (MAD), a well-known statistical metric, and providing a detailed explanation and justification of the parameters selected in our anomaly detection method, coupled with utilizing data from the publicly accessible RIPE Network Coordination Centre database [24], including explicit extraction dates and features (refer to Table 2 and Table 3), we facilitate the reproducibility of our study. This approach ensures that others can replicate our results without the need for us to include specific datasets or scripts in our submission.
Finally, it is worth noting that during the revision stage of this work, we used ChatGPT as a tool for proofreading and improving the grammatical correctness of the manuscript. After using this tool, we have reviewed and edited the content as needed and take full responsibility for the originality of the publication.
3. Results
This section presents the findings from our study on a novel approach to detecting anomalies in the Border Gateway Protocol (BGP), illustrated through a series of graphs. These charts incorporate a color-coding scheme designed to facilitate data interpretation: blue for BGP announcements, red for withdrawals, detected anomalies are highlighted in pink, and green to mark the actual times when cyber events occurred. Please note that when there is an overlap between occurrences and detected anomalies, the resulting color combination of pink and green may appear light brown. This indicates that the detected pink anomalies fall within the time range of occurrences, representing an accurate detection. The graphs are plotted with timestamps on the x-axis, showing continuous data within a specified time range (refer to Table 2 for exact extraction dates), and the y-axis representing the volume of announcements and withdrawals.
Next, we provide a brief explanation on interpreting the model’s performance, which will be foundational towards understanding the performance evaluation in terms of accuracy and precision metrics.
- True Positives (TP): When the identified anomalies (highlighted in pink) coincide with the critical periods of each anomaly event (marked in green), visually this represent accurately detected anomalies.
- False Positives (FP): These are the anomalies detected that do not overlap with the green regions, indicating inaccurately detected anomalies.
- True Negatives (TN): Although not explicitly visualized, true negatives can be understood as the portions of the graph not highlighted (the “white” areas), representing normal events correctly identified as normal.
- False Negatives (FN): These are events within the green regions not highlighted in pink, indicating missed anomalies.
This visual representation facilitates a clear understanding of when detected anomalies correspond to actual cyber events, demonstrating our method’s efficacy in responding to real-world incidents. This visual technique, combined with outputs specifying the detection period and its duration (as showcased in Figure 3), provides a clear basis for evaluating the effectiveness of our BGP anomaly detection technique.
The outcomes of our graphical analysis for various anomalies are detailed as follows:
Slammer Worm (Figure 4): The detection method accurately identified all anomalies coinciding with the peak activity of the Slammer worm, demonstrating effective anomaly detection during this specific event.
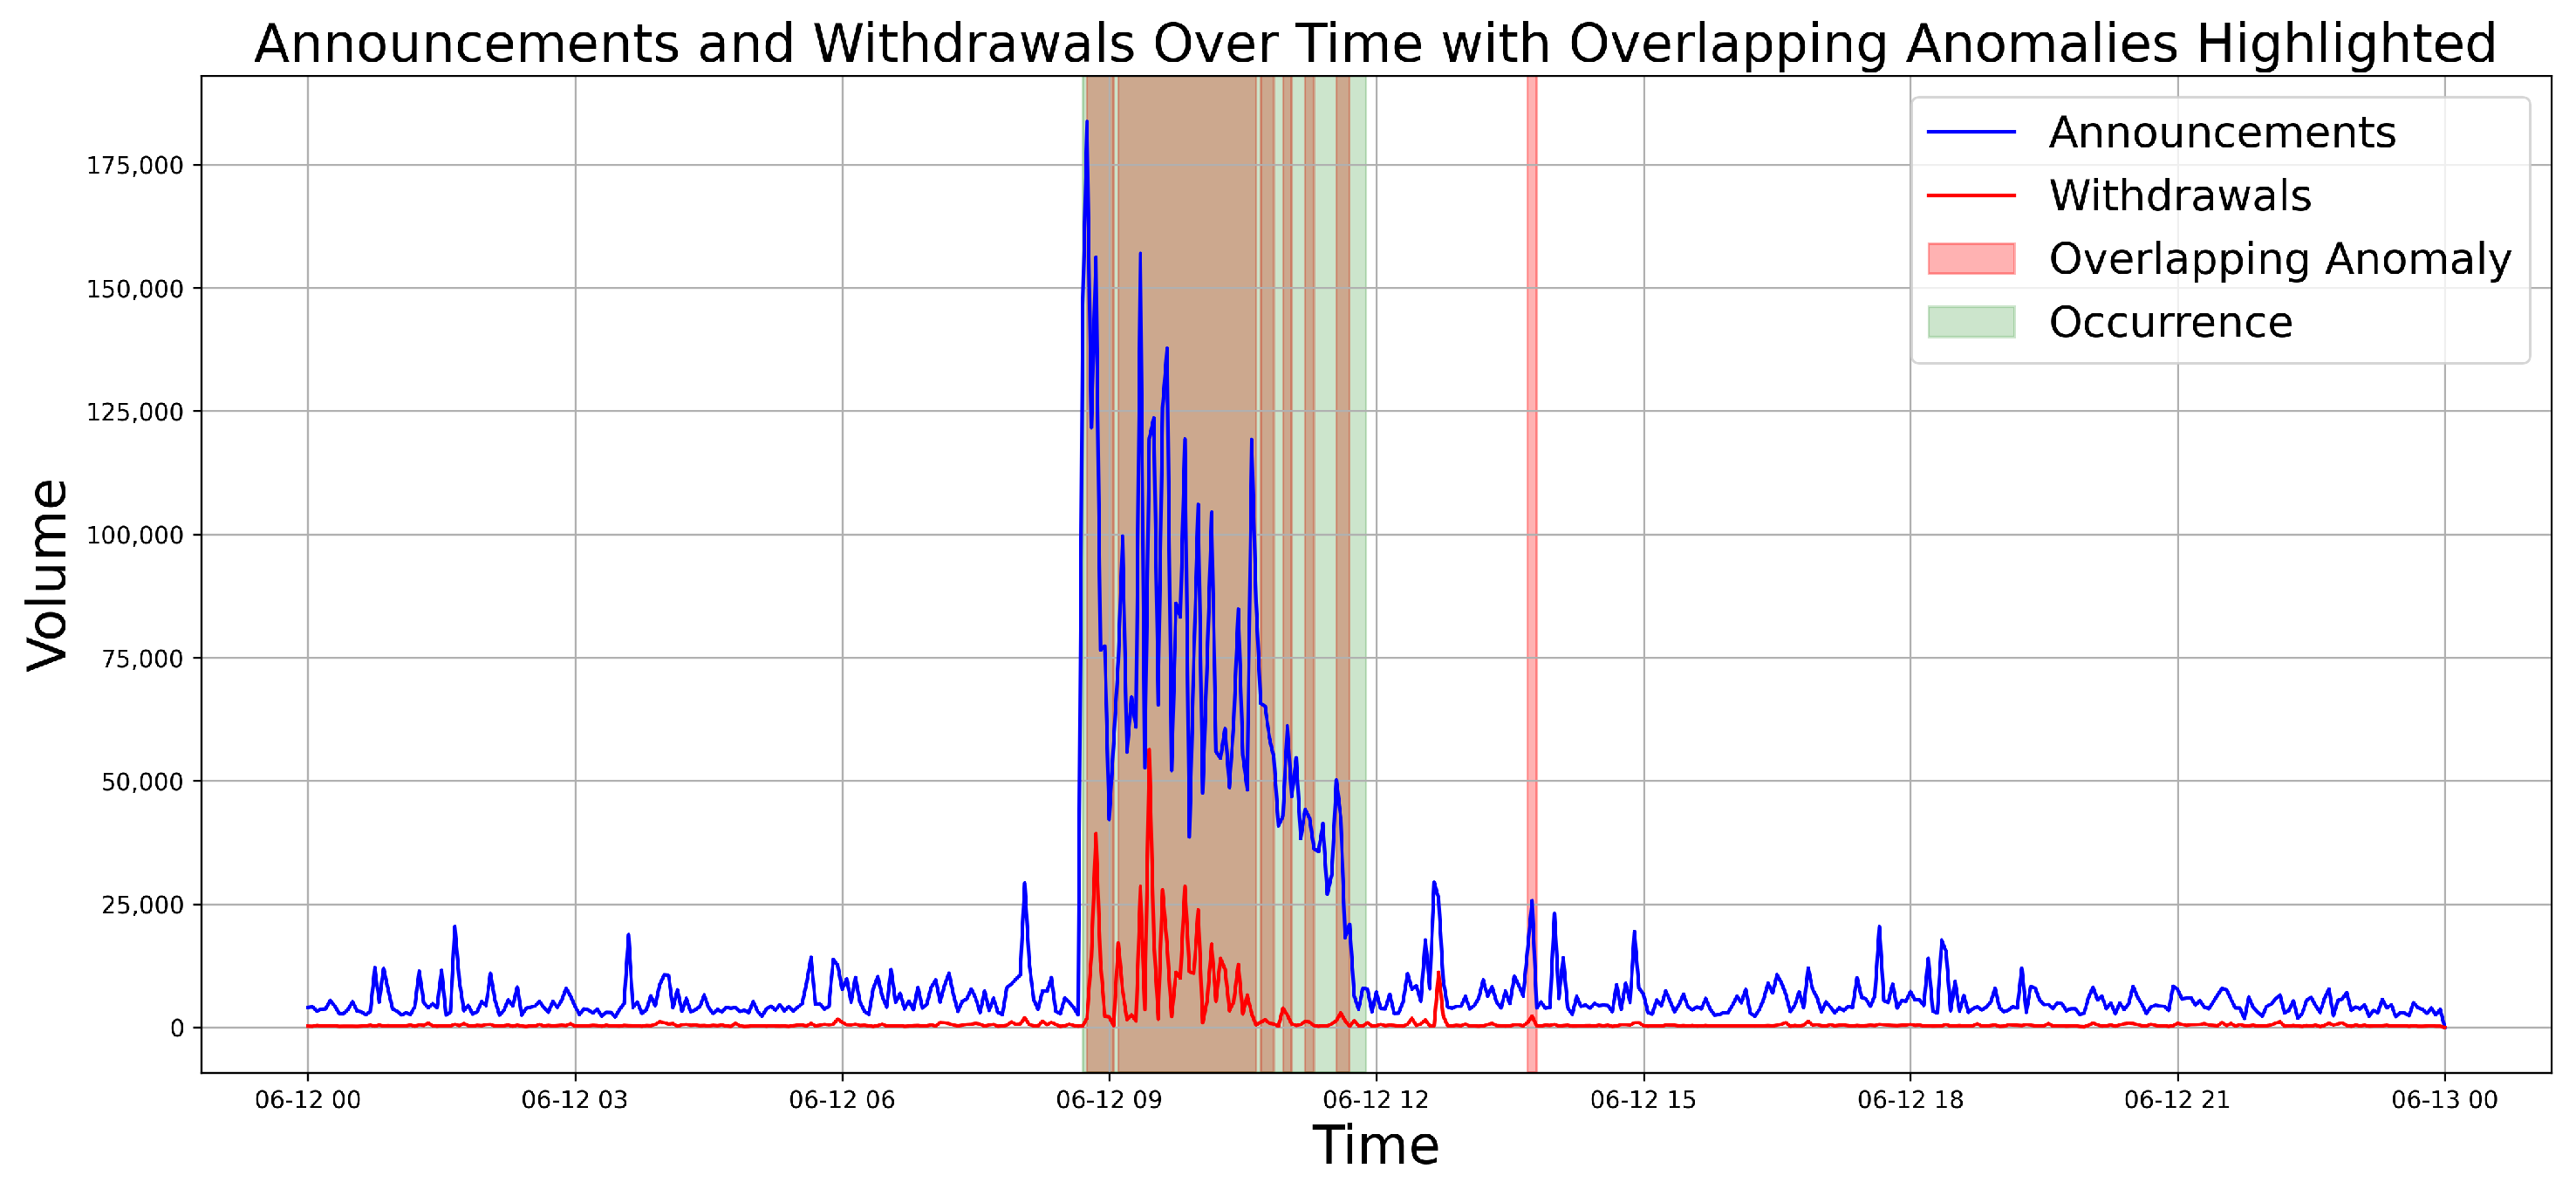
TMnet Misconfiguration (Figure 5): A high level of effectiveness was also observed for TMnet misconfiguration. Visually, our method successfully identified the majority of anomalies, demonstrating reliable detection capabilities for direct unintended category.
CodeRed 1 v2 Worm and Moscow Blackout (Figure 6 and Figure 7): The analyses of these events further validate the model’s effectiveness in identifying anomalies across the direct intended and link failure categories, highlighting the method’s robustness and adaptability.
Nimda (Figure 8): The visual analysis showcases that almost all the anomalies were detected within the occurrence period, showcasing our system’s capability in real-world event detection.
These observations visually demonstrated the method’s reliability and its potential applicability in monitoring and securing network protocols against a range of cyber threats. Detailed performance metrics, including accuracy and precision, which quantify the effectiveness of our anomaly detection technique, will be discussed in the subsequent section.
3.1. Performance Evaluation
To evaluate the performance of our model, we used accuracy and precision as metrics. Accuracy evaluates the overall correctness of a model, measuring the proportion of correct identifications (both true positive and true negative values) over the total number of observations. Precision, on the other hand, measures the ability of a model to identify how many of the detected anomalies were actually true anomalies.
The formula for calculating accuracy is given by
The formula for calculating precision is given by
where the terms (True Positives), (True Negatives), (False Positives), and (False Negatives) have been defined earlier in this document.
The following table gives a summary of the results of each of the anomaly events with their respective accuracy and precision values.
The table below (Table 4) provides a detailed summary of our method’s performance evaluation across the different previously analyzed anomaly events, showcasing the respective accuracy and precision metrics for each.
The performance evaluation analysis across various anomaly events provides important insights into the method’s efficacy. For the TMnet Misconfiguration, both the accuracy and precision metrics stand at almost 96%; similarly, the CodeRed 1 v2 Worm attack, obtained an accuracy of 95% and a precision of 94.9%. For these two events, a strong balance between accuracy and precision is demonstrated, highlighting the method’s consistent reliability in detecting true anomalies while minimizing false alarms.
The Slammer and Nimda Worm events showcases an exceptional precision rate of 100% and 97.8%, respectively, indicating that every anomaly detected during these events was a true anomaly. However, its accuracy stands at 88.5% for Slammer and 80% for Nimda, suggesting that while the detection was highly precise, it might have missed detecting some true anomalies.
In the Moscow Blackout scenario, the method demonstrated robust accuracy at 96.1% and a precision of 87.8%. This demonstrates the model’s ability to detect true anomalies but also indicates that a small proportion of identified anomalies were not true anomalies.
Having observed our model’s performance, it is important to examine its impact, especially regarding false positives (FP)—a critical challenge in cybersecurity. False positives occur when normal, non-anomalous activities are incorrectly flagged as threats, leading to wasted resources, operational inefficiencies, and alert fatigue among security personnel. Minimizing these false alarms is essential for operational efficiency and ensuring real threats are addressed.
Our study emphasizes precision—the ratio of true positives to all positive predictions—to assess how well the model identifies actual anomalies. However, precision alone does not account for the model’s ability to correctly ignore normal events. Here is where specificity is useful. Defined as the ratio of true negatives to the sum of true negatives and false positives, specificity measures the model’s success in identifying non-anomalies, complementing precision in evaluating our system’s effectiveness.
The formula for calculating specificity is given by
The calculated specificity and precision across different scenarios highlight our model’s ability to effectively reduce false alarms. Remarkably, we achieved a specificity of 99.9% across all events, with the Slammer event achieving a perfect specificity of 100%. These values clearly indicate that our model effectively minimizes false alarms, as evidenced by the high levels of specificity across all events. By maintaining high precision and specificity, our model ensures that security teams can focus their efforts on genuine threats, enhancing the overall security posture without the distraction of false positives.
3.2. Comparative Analysis with Deep Learning Techniques
Following the performance evaluation of our method (which we will refer to as MAD for simplicity) across various anomaly events, it is essential to compare these results with existing anomaly approaches. We will compare our model’s results against deep learning models, including the most recent methodology mentioned in our Section 1.1, the MAD-MulW model [8], while it may seem that comparing our statistical approach with more advanced machine learning and deep learning techniques is not entirely fair, we must highlight that our research intention is not to compete directly with these methods. Rather, our objective is to demonstrate how integrating our technique with these models can enhance the overall accuracy of anomaly detection. This approach aims to leverage the strengths of both methodologies to achieve superior results.
This comparison is particularly pertinent as the MAD-MulW framework evaluates its performance against more deep learning models and for the exact anomaly events that we are evaluating (Table 5). Given this context, we extend our comparison to include three of these deep learning models, including RNN [30] which is a well-known deep learning model, and MTAD [31] and DAGMM [32] which, coupled with MAD-MulW, are some of the latest deep learning models toward anomaly detection. This extended comparison is aimed at showcasing the performance of our statistical approach in terms of accuracy and precision.
The comparative analysis against deep learning models provides important insights. Our method outperforms the RNN, MTAD, and DAGMM models in both accuracy and precision for all the indirect anomaly events, which highlights the effectiveness of MAD in detecting anomalies more accurately than these deep learning models.
In the specific scenarios of the Moscow Blackout and TMnet Misconfiguration, the MTAD and DAGMM models demonstrated slightly higher accuracy, exceeding MAD’s results by a narrow margin of 1–2%, making it not substantially significant. On the other hand, MAD showcased superior precision scores for these anomaly events, affirming its reliability and effectiveness in identifying true positives with fewer false alarms.
Finally, for the MAD-MulW comparison, MAD demonstrates a strong and competitive performance, especially considering the Slammer and Nimda Worm events, where it achieved a perfect precision score of 100% and 97%, respectively.
4. Discussion
Our method’s performance across various cyber anomaly events achieved an overall accuracy of 90% and a precision of 95%, demonstrating a balance between accurately identifying true anomalies while minimizing false alarms. For the comparative analysis against deep learning models, our statistical approach demonstrate a strong and competitive performance surpassing three out of four models assessed. Despite the fact that MAD-MulW showcases high accuracy and precision in anomaly detection for most cases, our statistical approach is particularly effective in the detection of the Slammer Worm and Nimda Worm events, highlighting its capacity to avoid false positives effectively. This precision reflects the method’s effectiveness, yet the variability in accuracy across different scenarios points towards the influence of fundamental factors on these outcomes.
A significant factor behind the observed variations is our uniform approach in setting the median absolute deviation (MAD) parameters across all anomaly events. These parameters were kept consistent to explore the wide array of anomaly types that MAD is capable of detecting, allowing for straightforward comparisons of the method’s effectiveness across the diverse anomaly events. Additionally, it lays a strong foundation for presenting our technique to the research community by ensuring that our evaluation method remains consistent. However, it is understood that each event possesses distinct characteristics, and their influence on network behavior can differ significantly. For instance, a cyberattack that encrypts data on infected systems, effectively paralyzes these systems without necessarily generating additional network traffic. This behavior significantly differs with cyber threats where infected nodes initiate continuous DDoS attacks, generating significant traffic volumes as they spread across the network creating clear and detectable BGP anomalies. Adjusting these parameters—either through an auto-adjustable threshold (refer to the ‘Future Work’ section) or by setting specific parameters for each category to align with the distinct characteristics of each cyber anomaly—could significantly improve the method’s overall effectiveness, enhancing the balance between precision and accuracy, which is crucial for maintaining the method’s relevance in cybersecurity.
Another important consideration is our reliance on literature-based timing to identify anomaly events, while this approach is helpful, it poses challenges for accurately assessing performance. The assumption that anomalies occur uniformly throughout ‘green’ periods and that ‘normal’ periods are entirely free of anomalies does not fully capture the sporadic nature of some anomalies. Not every instance within a green-highlighted period may be truly anomalous, nor may every ‘normal’ period be free of anomalies. It is entirely possible that all anomalies detected by MAD accurately represent anomalous behavior, and all identified normal data points are genuinely normal. This realization suggests MAD’s performance may be more accurate than it appears, especially when considering the variable nature of anomaly occurrences. Additionally, the literature often generalizes the duration of worldwide impact events without specifying the affected regions or duration, which may not accurately reflect the actual impact on specific areas. For instance, Switzerland might have been significantly affected in the early hours of an attack, with conditions stabilizing afterwards, unlike in other countries where impacts could have been delayed or extended. In such a scenario, the Swiss BGP traffic volume would likely be affected in the first 3 h, but it is improbable that the same level of traffic would persist for the next 9 h, even though the literature might register the event’s duration as 12 h.
Despite this observation, to ensure analytical consistency, we focused our investigation exclusively on data from the RRC04 router for all analyzed anomaly events. This approach, chosen for its comparative consistency, highlights the challenges of using global evaluations to understand regional impacts and demonstrates the significant variability in BGP anomaly detection methods’ effectiveness based on the behavioral characteristics and specific contexts of cyber threats. This observation underscores the importance of considering the unique context and nature of each cyber threat when evaluating anomaly detection methods.
Overall, the results highlight the potential of our anomaly detection approach as an effective tool in BGP anomaly detection and cybersecurity. By accurately identifying anomalies and aligning them with known cyber incidents, our methodology not only minimizes false positives but also provides crucial insights for understanding and mitigating network security threats.
5. Conclusions and Future Work
In this study, we have rigorously tested and proven the effectiveness and reliability of our anomaly detection method in the Border Gateway Protocol (BGP) environment. By applying our method to various cyber incidents, including internet worm attacks, unintentional configuration errors, and critical infrastructure failures, we have shown the versatility of our statistical approach.
Moreover, evaluating MAD in comparison to deep learning techniques has demonstrated its competitive performance. However, as previously mentioned, our intention is not to compete with these deep learning techniques but to complement their detection methodology. For this reason, we acknowledge that a direct comparison among these different approaches might not fully highlight the unique benefits of our method, especially in scenarios demanding reduced computational complexity and enhanced adaptability.
Key advantages of our approach include the following:
Reduced Computational Demands: Our methodology excels in high-performance detection with significantly lower computational requirements, making it more accessible and adaptable across diverse network settings.
Minimal Preprocessing Needed: Our method necessitates minimal preprocessing, which not only enables a faster anomaly detection process but also lowers the risk of introducing biases at the preprocessing stage.
Suitability for Real-Time Applications: The reduced computational resources and streamlined preprocessing make our approach well suited for real-time applications. In BGP anomaly detection, the ability to quickly identify and address anomalies in real-time or near-real-time is crucial. It enables network administrators to proactively mitigate potential threats, preventing potential harm or disruptions.
Detect zero day attacks: Our model can potentially detect unseen anomalies without requiring training on a specific pattern. This capability can be employed to refine and update the training datasets of machine learning and deep learning models, thereby by complementing these models with MAD, it can improve their ability to recognize and respond to new, unexpected anomaly types.
While we recognize the strengths of both statistical and deep learning (DL)/machine learning (ML) models in anomaly detection, we support combining these methodologies to achieve a more accurate and effective detection framework. This balanced strategy takes advantage of both the quick adaptability and lower computational requirements of our method and the advanced pattern recognition capabilities of DL and ML models to provide a comprehensive solution to the ever-evolving challenges of cyber security.
5.1. Future Work
Building upon the foundations laid by this study, we identify several key areas for future research that promise to further refine and expand the scope of BGP anomaly detection:
Diversification of Data Sources: Incorporating BGP data from a wider array of sources, including different geographic regions and network environments, will enhance the robustness and applicability of the MAD methodology. This diversification will allow for a more comprehensive understanding of global BGP dynamics and anomaly patterns.
Automation through a dynamic threshold: An important aspect of our ongoing research is the development of an algorithm that dynamically calculates the factor n which, when multiplied by MAD, determines the anomaly detection threshold. This innovation seeks to replace the static assumption that a factor of 3 is universally applicable, with a more adaptive threshold that better reflects the specific variability of the data.
Exploration of Real-Time Detection Capabilities: While real-time anomaly detection capabilities have not yet been tested with our methodology, we recognize it as a crucial area for future research. Given the lower computational demands of the MAD method, we strongly encourage further exploration in this direction. Adapting MAD for real-time data processing could potentially enable the immediate identification and mitigation of emerging threats. The efficiency of MAD presents a promising foundation for developing real-time anomaly detection systems that are both scalable and adaptable to the dynamic nature of network traffic and threats. In the medium to long term, once we have a Quic implementation, we consider testing MAD over Quic to assess its performance and compare it to current implementations since MAD will not be affected by using BGP over Quic [33].
Integrating MAD with ML/DL for Enhanced Detection and Prediction: Integrating median absolute deviation (MAD) with machine learning (ML) or deep learning (DL) models represents a promising frontier for future research. This synergy allows for the training of ML/DL models with MAD-processed data, enabling the identification of anomalies through traffic pattern analysis while maintaining the capability for independent detection by either method. This ensures comprehensive coverage, where MAD can catch anomalies that ML/DL models might miss, and vice versa, bolstering the network’s defense mechanism with both predictive and reactive capabilities.
Author Contributions
Conceptualization, M.A.R.-C., J.A.C.-C., J.A.P.-D. and C.M.-C.; Methodology, M.A.R.-C.; Software, M.A.R.-C. and J.A.C.-C.; Validation, J.A.C.-C., J.A.P.-D. and C.M.-C.; Formal analysis, M.A.R.-C. and J.A.P.-D.; Investigation, M.A.R.-C.; Resources, C.M.-C.; Data curation, M.A.R.-C., J.A.C.-C., J.A.P.-D. and C.M.-C.; Writing—original draft, M.A.R.-C.; Writing—review & editing, M.A.R.-C., J.A.C.-C. and J.A.P.-D.; Visualization, M.A.R.-C.; Supervision, J.A.C.-C., J.A.P.-D. and C.M.-C.; Project administration, J.A.C.-C. and J.A.P.-D.; Funding acquisition, J.A.P.-D. All authors have read and agreed to the published version of the manuscript.
Funding
This work was supported in part by the Fondo Regional para la Innovación Digital en America Latina y el Caribe (FRIDA).
Data Availability Statement
The data presented in the study are openly available in the Routing Information Service (RIS) from the Réseaux IP Européens Network Coordination Centre (RIPE NCC) at https://www.ripe.net/analyse/internet-measurements/routing-information-service-ris/ (accessed on 19 April 2024 ).
Acknowledgments
We acknowledge Tecnologico de Monterrey and LACNIC for their support in this research.
Conflicts of Interest
The authors declare no conflicts of interest.
References
- Al-Musawi, B.; Branch, P.; Armitage, G. BGP Anomaly Detection Techniques: A Survey. IEEE Commun. Surv. Tutor. 2017, 19, 377–396. [Google Scholar] [CrossRef]
- Rekhter, Y.; Li, T.; Hares, S. A Border Gateway Protocol 4 (BGP-4). Internet Requests for Comments, 2006. Available online: http://www.rfc-editor.org/rfc/rfc4271.txt (accessed on 10 January 2024).
- Shi, X.; Xiang, Y.; Wang, Z.; Yin, X.; Wu, J. Detecting Prefix Hijackings in the Internet with Argus. In Proceedings of the 2012 ACM Conference on Internet Measurement Conference—IMC ’12, Boston, MA, USA, 14–16 November 2012; pp. 15–28. [Google Scholar] [CrossRef]
- Li, Z.; Rios, A.L.G.; Trajkovic, L. Machine Learning for Detecting Anomalies and Intrusions in Communication Networks. IEEE J. Sel. Areas Commun. 2021, 39, 2254–2264. [Google Scholar] [CrossRef]
- Ding, Q.; Li, Z.; Batta, P.; Trajkovic, L. Detecting BGP Anomalies Using Machine Learning Techniques. In Proceedings of the 2016 IEEE International Conference on Systems, Man, and Cybernetics (SMC), IEEE, Budapest, Hungary, 9–12 October 2016. [Google Scholar] [CrossRef]
- Cosovic, M.; Obradovic, S.; Trajkovic, L. Performance Evaluation of BGP Anomaly Classifiers. In Proceedings of the 2015 Third International Conference on Digital Information, Networking, and Wireless Communications (DINWC), Moscow, Russia, 3–5 February 2015. [Google Scholar] [CrossRef]
- Cosovic, M.; Obradovic, S.; Trajkovic, L. Classifying Anomalous Events in BGP Datasets. In Proceedings of the 2016 IEEE Canadian Conference on Electrical and Computer Engineering (CCECE), IEEE, Vancouver, BC, Canada, 15–18 May 2016. [Google Scholar] [CrossRef]
- Peng, S.; Chen, Y.; Shu, X.; Shuai, W.; Fang, S.; Ruan, Z.; Xuan, Q. MAD-MulW: A Multi-Window Anomaly Detection Framework for BGP Security Events. arXiv 2023, arXiv:2312.11225. [Google Scholar]
- Li, Z.; Rios, A.L.G.; Trajkovic, L. Detecting Internet Worms, Ransomware, and Blackouts Using Recurrent Neural Networks. In Proceedings of the 2020 IEEE International Conference on Systems, Man, and Cybernetics (SMC), Toronto, ON, Canada, 11–14 October 2020. [Google Scholar] [CrossRef]
- Dai, X.; Wang, N.; Wang, W. Application of machine learning in BGP anomaly detection. J. Phys. Conf. Ser. 2019, 1176, 032015. [Google Scholar] [CrossRef]
- HackerOne. The 2021 Hackers Report. 2021. Available online: https://www.hackerone.com/resources/reporting/the-2021-hacker-report (accessed on 8 April 2024).
- Khraisat, A.; Gondal, I.; Vamplew, P.; Kamruzzaman, J. Survey of intrusion detection systems: Techniques, datasets and challenges. Cybersecurity 2019, 2, 20. [Google Scholar] [CrossRef]
- Miller, J.; Miller, J. Statistics and Chemometrics for Analytical Chemistry, 4th ed.; Pearson/Prentice Hall: Harlow, UK, 2000. [Google Scholar]
- Chen, M.; Xu, M.; Li, Q.; Yang, Y. Measurement of large-scale BGP events: Definition, detection, and analysis. Comput. Netw. 2016, 110, 31–45. [Google Scholar] [CrossRef]
- Deshpande, S.; Thottan, M.; Ho, T.K.; Sikdar, B. An Online Mechanism for BGP Instability Detection and Analysis. IEEE Trans. Comput. 2009, 58, 1470–1484. [Google Scholar] [CrossRef]
- Testart, C.; Richter, P.; King, A.; Dainotti, A.; Clark, D. Profiling BGP Serial Hijackers: Capturing Persistent Misbehavior in the Global Routing Table. In Proceedings of the Internet Measurement Conference, New York, NY, USA, 21–23 October 2019; pp. 420–434. [Google Scholar] [CrossRef]
- Moriano, P.; Hill, R.; Camp, L.J. Using bursty announcements for detecting BGP routing anomalies. Comput. Netw. 2021, 188, 107835. [Google Scholar] [CrossRef]
- Labovitz, C.; Malan, G.R.; Jahanian, F. Internet routing instability. IEEE/ACM Trans. Netw. 1998, 6, 515–528. [Google Scholar] [CrossRef]
- Arai, T.; Nakano, K.; Chakraborty, B. Selection of Effective Features for BGP Anomaly Detection. In Proceedings of the 2019 IEEE 10th International Conference on Awareness Science and Technology (iCAST), Morioka, Japan, 23–25 October 2019. [Google Scholar] [CrossRef]
- Mitchell, J. Autonomous System (AS) Reservation for Private Use. RFC 6996, Internet Engineering Task Force, 2013. Available online: https://www.rfc-editor.org/info/rfc6996 (accessed on 19 April 2024).
- Fonseca, P.; Mota, E.S.; Bennesby, R.; Passito, A. BGP Dataset Generation and Feature Extraction for Anomaly Detection. In Proceedings of the 2019 IEEE Symposium on Computers and Communications (ISCC), IEEE, Barcelona, Spain, 29 June–3 July 2019; pp. 1–6. [Google Scholar] [CrossRef]
- BGPmon. Massive Route Leak Cause Internet Slowdown. 2015. Available online: https://www.bgpmon.net/massive-route-leak-cause-internet-slowdown/ (accessed on 15 February 2024).
- Besanger, Y.; Eremia, M.; Voropai, N. Major Grid Blackouts: Analysis, Classification, and Prevention. In Handbook of Electrical Power System Dynamics; John Wiley and Sons, Inc.: Hoboken, NJ, USA, 2013; Chapter 13; pp. 789–863. [Google Scholar] [CrossRef]
- Reseaux IP Europeens Network Coordination Center. RIPE Network Coordination Centre, 2015. Available online: http://www.ripe.net/ (accessed on 8 February 2024).
- Blunk, L.; Karir, M.; Labovitz, C. RFC 6396: Multi-threaded Routing Toolkit (MRT) Routing Information Export Format. Internet Engineering Task Force, 2011. RFC 6396 (Standards Track). Available online: http://tools.ietf.org/html/rfc6396 (accessed on 19 April 2024).
- Internet Engineering Task Force (IETF). Charter of the IETF Secure Inter-Domain Routing Working Group. 2015. Available online: http://tools.ietf.org/wg/sidr/charters (accessed on 6 December 2015).
- Center for Applied Internet Data Analysis (CAIDA). PyBGPStream API Documentation. 2023. Available online: https://bgpstream.caida.org/docs/api/pybgpstream/pybgpstream.html (accessed on 10 April 2023).
- Leys, C.; Ley, C.; Klein, O.; Bernard, P.; Licata, L. Detecting outliers: Do not use standard deviation around the mean, use absolute deviation around the median. J. Exp. Soc. Psychol. 2013, 49, 764–766. [Google Scholar] [CrossRef]
- Howell, D.C. Median Absolute Deviation. In Encyclopedia of Statistics in Behavioral Science; John Wiley & Sons, Ltd.: Hoboken, NJ, USA, 2005. [Google Scholar] [CrossRef]
- Hautamaki, V.; Karkkainen, I.; Franti, P. Outlier detection using k-nearest neighbour graph. In Proceedings of the 17th International Conference on Pattern Recognition, 2004, ICPR 2004, IEEE, Cambridge, UK, 26 August 2004; Volume 3, pp. 430–433. [Google Scholar]
- Zhao, H.; Wang, Y.; Duan, J.; Huang, C.; Cao, D.; Tong, Y.; Xu, B.; Bai, J.; Tong, J.; Zhang, Q. Multivariate time-series anomaly detection via graph attention network. In Proceedings of the 2020 IEEE International Conference on Data Mining (ICDM), IEEE, Sorrento, Italy, 17–20 November 2020; pp. 841–850. [Google Scholar]
- Zong, B.; Song, Q.; Min, M.R.; Cheng, W.; Lumezanu, C.; Cho, D.; Chen, H. Deep Autoencoding Gaussian Mixture Model for Unsupervised Anomaly Detection. In Proceedings of the International Conference on Learning Representations, Vancouver, BC, Canada, 30 April–3 May 2018. [Google Scholar]
- Retana, A. Using BGP over QUIC. Internet-draft, Internet Engineering Task Force. Available online: https://datatracker.ietf.org/doc/draft-retana-idr-bgp-quic/04/ (accessed on 19 April 2024).
Figure 1.
Dataset overview: detailed preview of the first five entries from the CodeRed 1 v2 Dataset.
Figure 1.
Dataset overview: detailed preview of the first five entries from the CodeRed 1 v2 Dataset.

Figure 2.
MAD Anomaly Detection System methodology.

Figure 3.
Sample data preview: first five rows of the TMnet4 detection output.

Figure 4.
Implementing MAD for anomaly detection over Slammer Worm Attack: visual representation of Announcements and Withdrawals volumes over time with anomalies marked in pink and high-activity occurrence periods in green.
Figure 4.
Implementing MAD for anomaly detection over Slammer Worm Attack: visual representation of Announcements and Withdrawals volumes over time with anomalies marked in pink and high-activity occurrence periods in green.

Figure 5.
Implementing MAD for anomaly detection over Telekom Malaysia Misconfiguration: visual representation of Announcements and Withdrawals volumes over time with anomalies marked in pink and high-activity occurrence periods in green.
Figure 5.
Implementing MAD for anomaly detection over Telekom Malaysia Misconfiguration: visual representation of Announcements and Withdrawals volumes over time with anomalies marked in pink and high-activity occurrence periods in green.

Figure 6.
Implementing MAD for anomaly detection over Code Red 1 v2 Attack: visual representation of Announcements and Withdrawals volumes over time with anomalies marked in pink and high-activity occurrence periods in green.
Figure 6.
Implementing MAD for anomaly detection over Code Red 1 v2 Attack: visual representation of Announcements and Withdrawals volumes over time with anomalies marked in pink and high-activity occurrence periods in green.

Figure 7.
Implementing MAD for anomaly detection over Moscow Blackout: visual representation of Announcements and Withdrawals volumes over time with anomalies marked in pink and high-activity occurrence periods in green.
Figure 7.
Implementing MAD for anomaly detection over Moscow Blackout: visual representation of Announcements and Withdrawals volumes over time with anomalies marked in pink and high-activity occurrence periods in green.

Figure 8.
Implementing MAD for anomaly detection over Nimda Attack: visual representation of Announcements and Withdrawals volumes over time with anomalies marked in pink and high-activity occurrence periods in green.
Figure 8.
Implementing MAD for anomaly detection over Nimda Attack: visual representation of Announcements and Withdrawals volumes over time with anomalies marked in pink and high-activity occurrence periods in green.


Table 1.
Summary of anomaly types and occurrence period.
| Anomaly Event | Category | Occurrence (UTC) |
|---|---|---|
| Code Red 1 v2 | Indirect Anomaly | 2001-07-19 13:20:00–2001-07-20 00:00:00 |
| Slammer | Indirect Anomaly | 2003-01-25 05:31:00–2003-01-25 19:59:00 |
| Nimda | Indirect Anomaly | 2001-09-18 13:19:00–2001-09-19 10:59:00 |
| Moscow Blackout | Link Failure | 2005-05-25 04:40:00–2005-05-25 10:33:00 |
| TMnet | Direct Unintended Anomaly | 2015-06-12 08:43:00–2015-06-12 11:53:00 |
Table 2.
Types of anomaly events detected, route collector, total count of observations per dataset, and specific dates of data extraction.
Table 2.
Types of anomaly events detected, route collector, total count of observations per dataset, and specific dates of data extraction.
| Anomaly Event | Route Collector | Total | Extraction Dates (UTC) |
|---|---|---|---|
| Code Red 1 v2 | RRC04 | 1439 | 2001-07-18 19:06:00–2001-07-21 19:00:00 |
| Slammer | RRC04 | 960 | 2003-01-24 19:00:00–2003-01-26 18:57:00 |
| Nimda | RRC04 | 1738 | 2001-09-17 19:00:00–2001-09-21 09:51:00 |
| Moscow Blackout | RRC04 | 1440 | 2005-05-24 19:00:00–2005-05-27 18:57:00 |
| TMnet | RRC04 | 480 | 2015-06-12 00:00:00–2015-06-13 00:00:00 |
Table 3.
Features extracted.
| Feature Name | Category |
|---|---|
| Number of announcements | Volume |
| Number of withdrawals | Volume |
Table 4.
Summary of anomaly events and their respective accuracy and precision.
| Anomaly Event | Accuracy (%) | Precision (%) |
|---|---|---|
| TMnet Misconfiguration | 96.1 | 95.9 |
| CodeRed 1 v2 Worm | 95.04 | 94.9 |
| Moscow Blackout | 96.1 | 87.8 |
| Slammer Worm | 88.5 | 100 |
| Nimda Worm | 80.07 | 97.8 |
Table 5.
Comparison of anomaly detection performance: MAD vs. deep learning models.
| Anomaly Event | RNN (%) | MTAD (%) | DAGMM (%) | MAD-MulW (%) | MAD (%) |
|---|---|---|---|---|---|
| Acc./Pre. | Acc./Pre. | Acc./Pre. | Acc./Pre. | Acc./Pre. | |
| CodeRed 1 v2 Worm | 85.2/51.6 | 88.9/66.1 | 94.9/65.5 | 97.8/96.5 | 95.04/94.9 |
| Nimda Worm | 65.7/58.7 | 69.7/66.2 | 67.4/69.4 | 86.7/86.2 | 80.07/97.8 |
| Slammer Worm | 83.06/65.5 | 83.6/69.5 | 83.1/38.2 | 98.1/98.1 | 88.5/100 |
| Moscow Blackout | 91.9/60.7 | 98.2/80.9 | 97.9/53.8 | 99.3/99.6 | 96.1/87.8 |
| TMnet Misconfiguration | 91.7/60.4 | 97.1/70.7 | 96.9/45.4 | 99.2/99.6 | 96.1/95.9 |
Disclaimer/Publisher’s Note: The statements, opinions and data contained in all publications are solely those of the individual author(s) and contributor(s) and not of MDPI and/or the editor(s). MDPI and/or the editor(s) disclaim responsibility for any injury to people or property resulting from any ideas, methods, instructions or products referred to in the content. |
© 2024 by the authors. Licensee MDPI, Basel, Switzerland. This article is an open access article distributed under the terms and conditions of the Creative Commons Attribution (CC BY) license (https://creativecommons.org/licenses/by/4.0/).
Share and Cite
MDPI and ACS Style
Romo-Chavero, M.A.; Cantoral-Ceballos, J.A.; Pérez-Díaz, J.A.; Martinez-Cagnazzo, C. Median Absolute Deviation for BGP Anomaly Detection. Future Internet 2024, 16, 146. https://0-doi-org.brum.beds.ac.uk/10.3390/fi16050146
AMA Style
Romo-Chavero MA, Cantoral-Ceballos JA, Pérez-Díaz JA, Martinez-Cagnazzo C. Median Absolute Deviation for BGP Anomaly Detection. Future Internet. 2024; 16(5):146. https://0-doi-org.brum.beds.ac.uk/10.3390/fi16050146
Chicago/Turabian StyleRomo-Chavero, Maria Andrea, Jose Antonio Cantoral-Ceballos, Jesus Arturo Pérez-Díaz, and Carlos Martinez-Cagnazzo. 2024. "Median Absolute Deviation for BGP Anomaly Detection" Future Internet 16, no. 5: 146. https://0-doi-org.brum.beds.ac.uk/10.3390/fi16050146
Note that from the first issue of 2016, this journal uses article numbers instead of page numbers. See further details here.