Improvement in Carbonization Efficiency of Cellulosic Fibres Using Silylated Acetylene and Alkoxysilanes

 ,
,
Abstract
:
1. Introduction
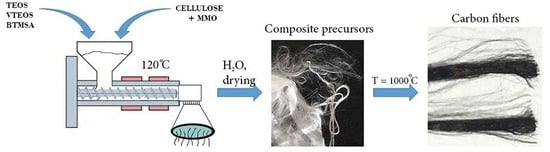
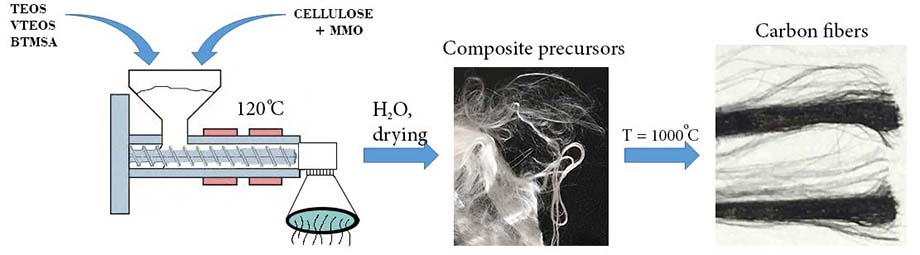
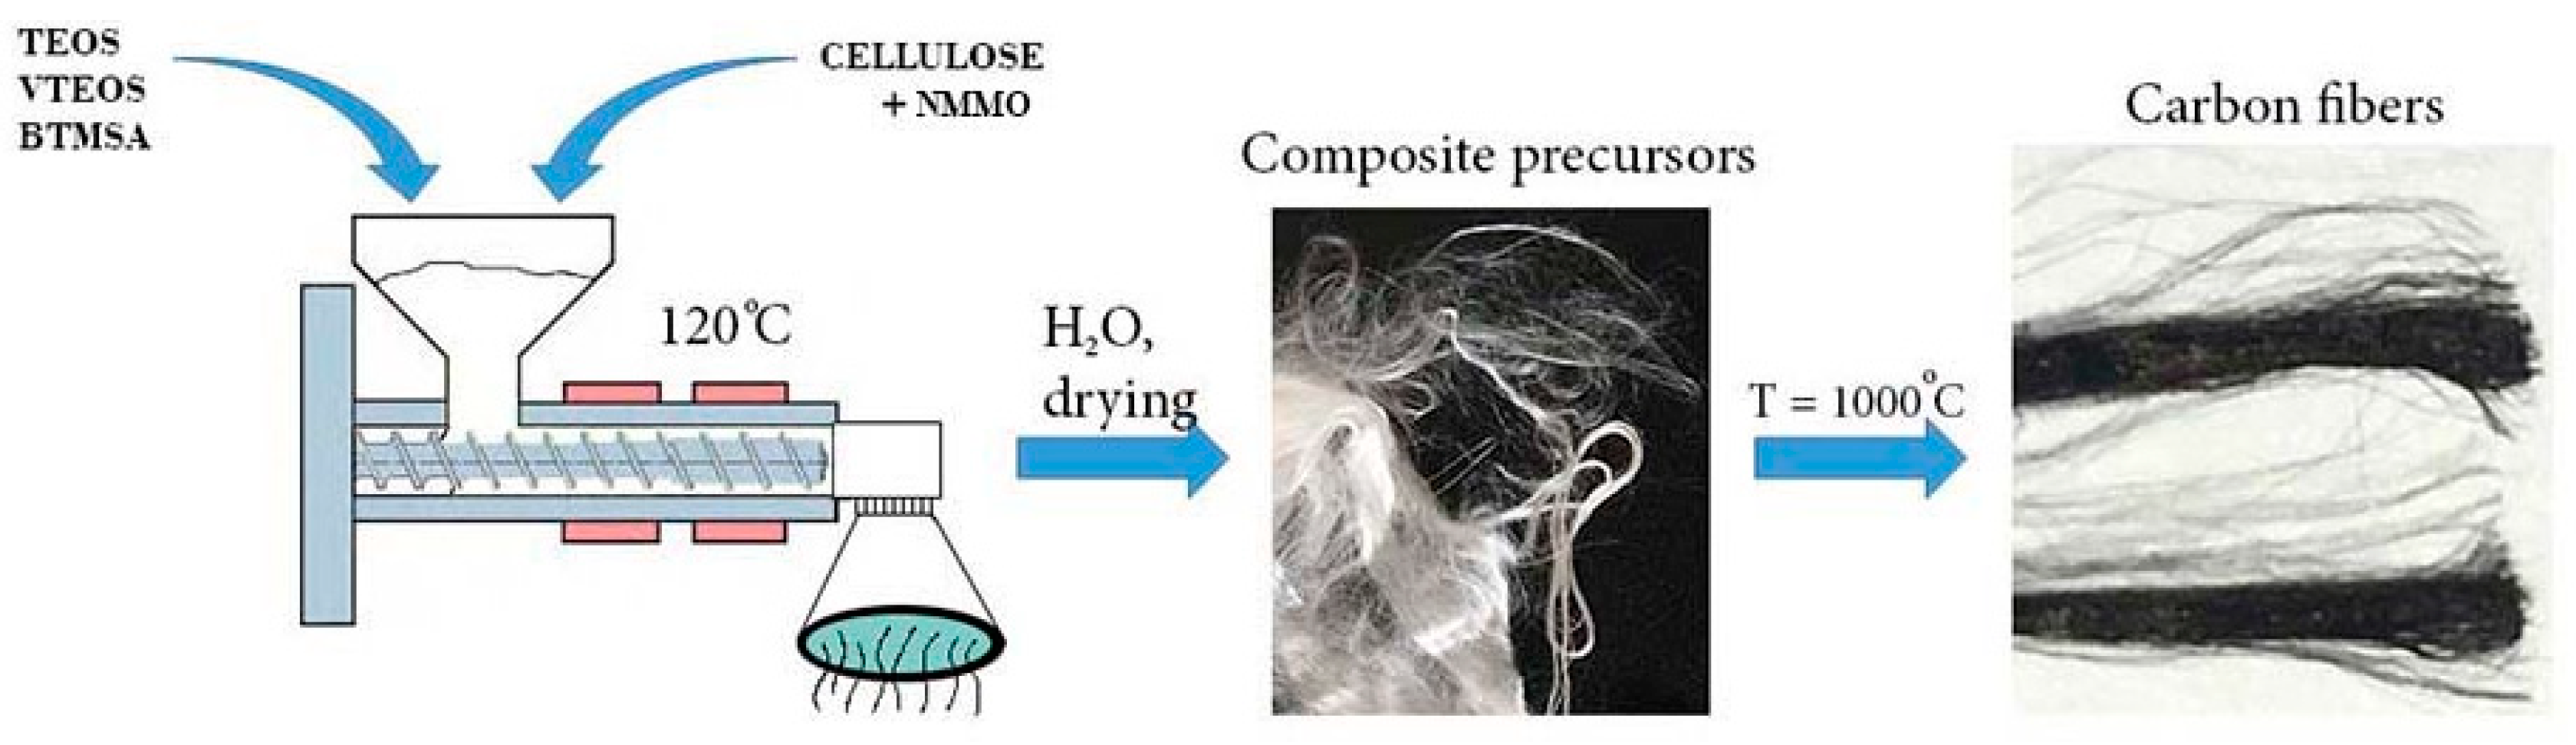
2. Materials and Methods
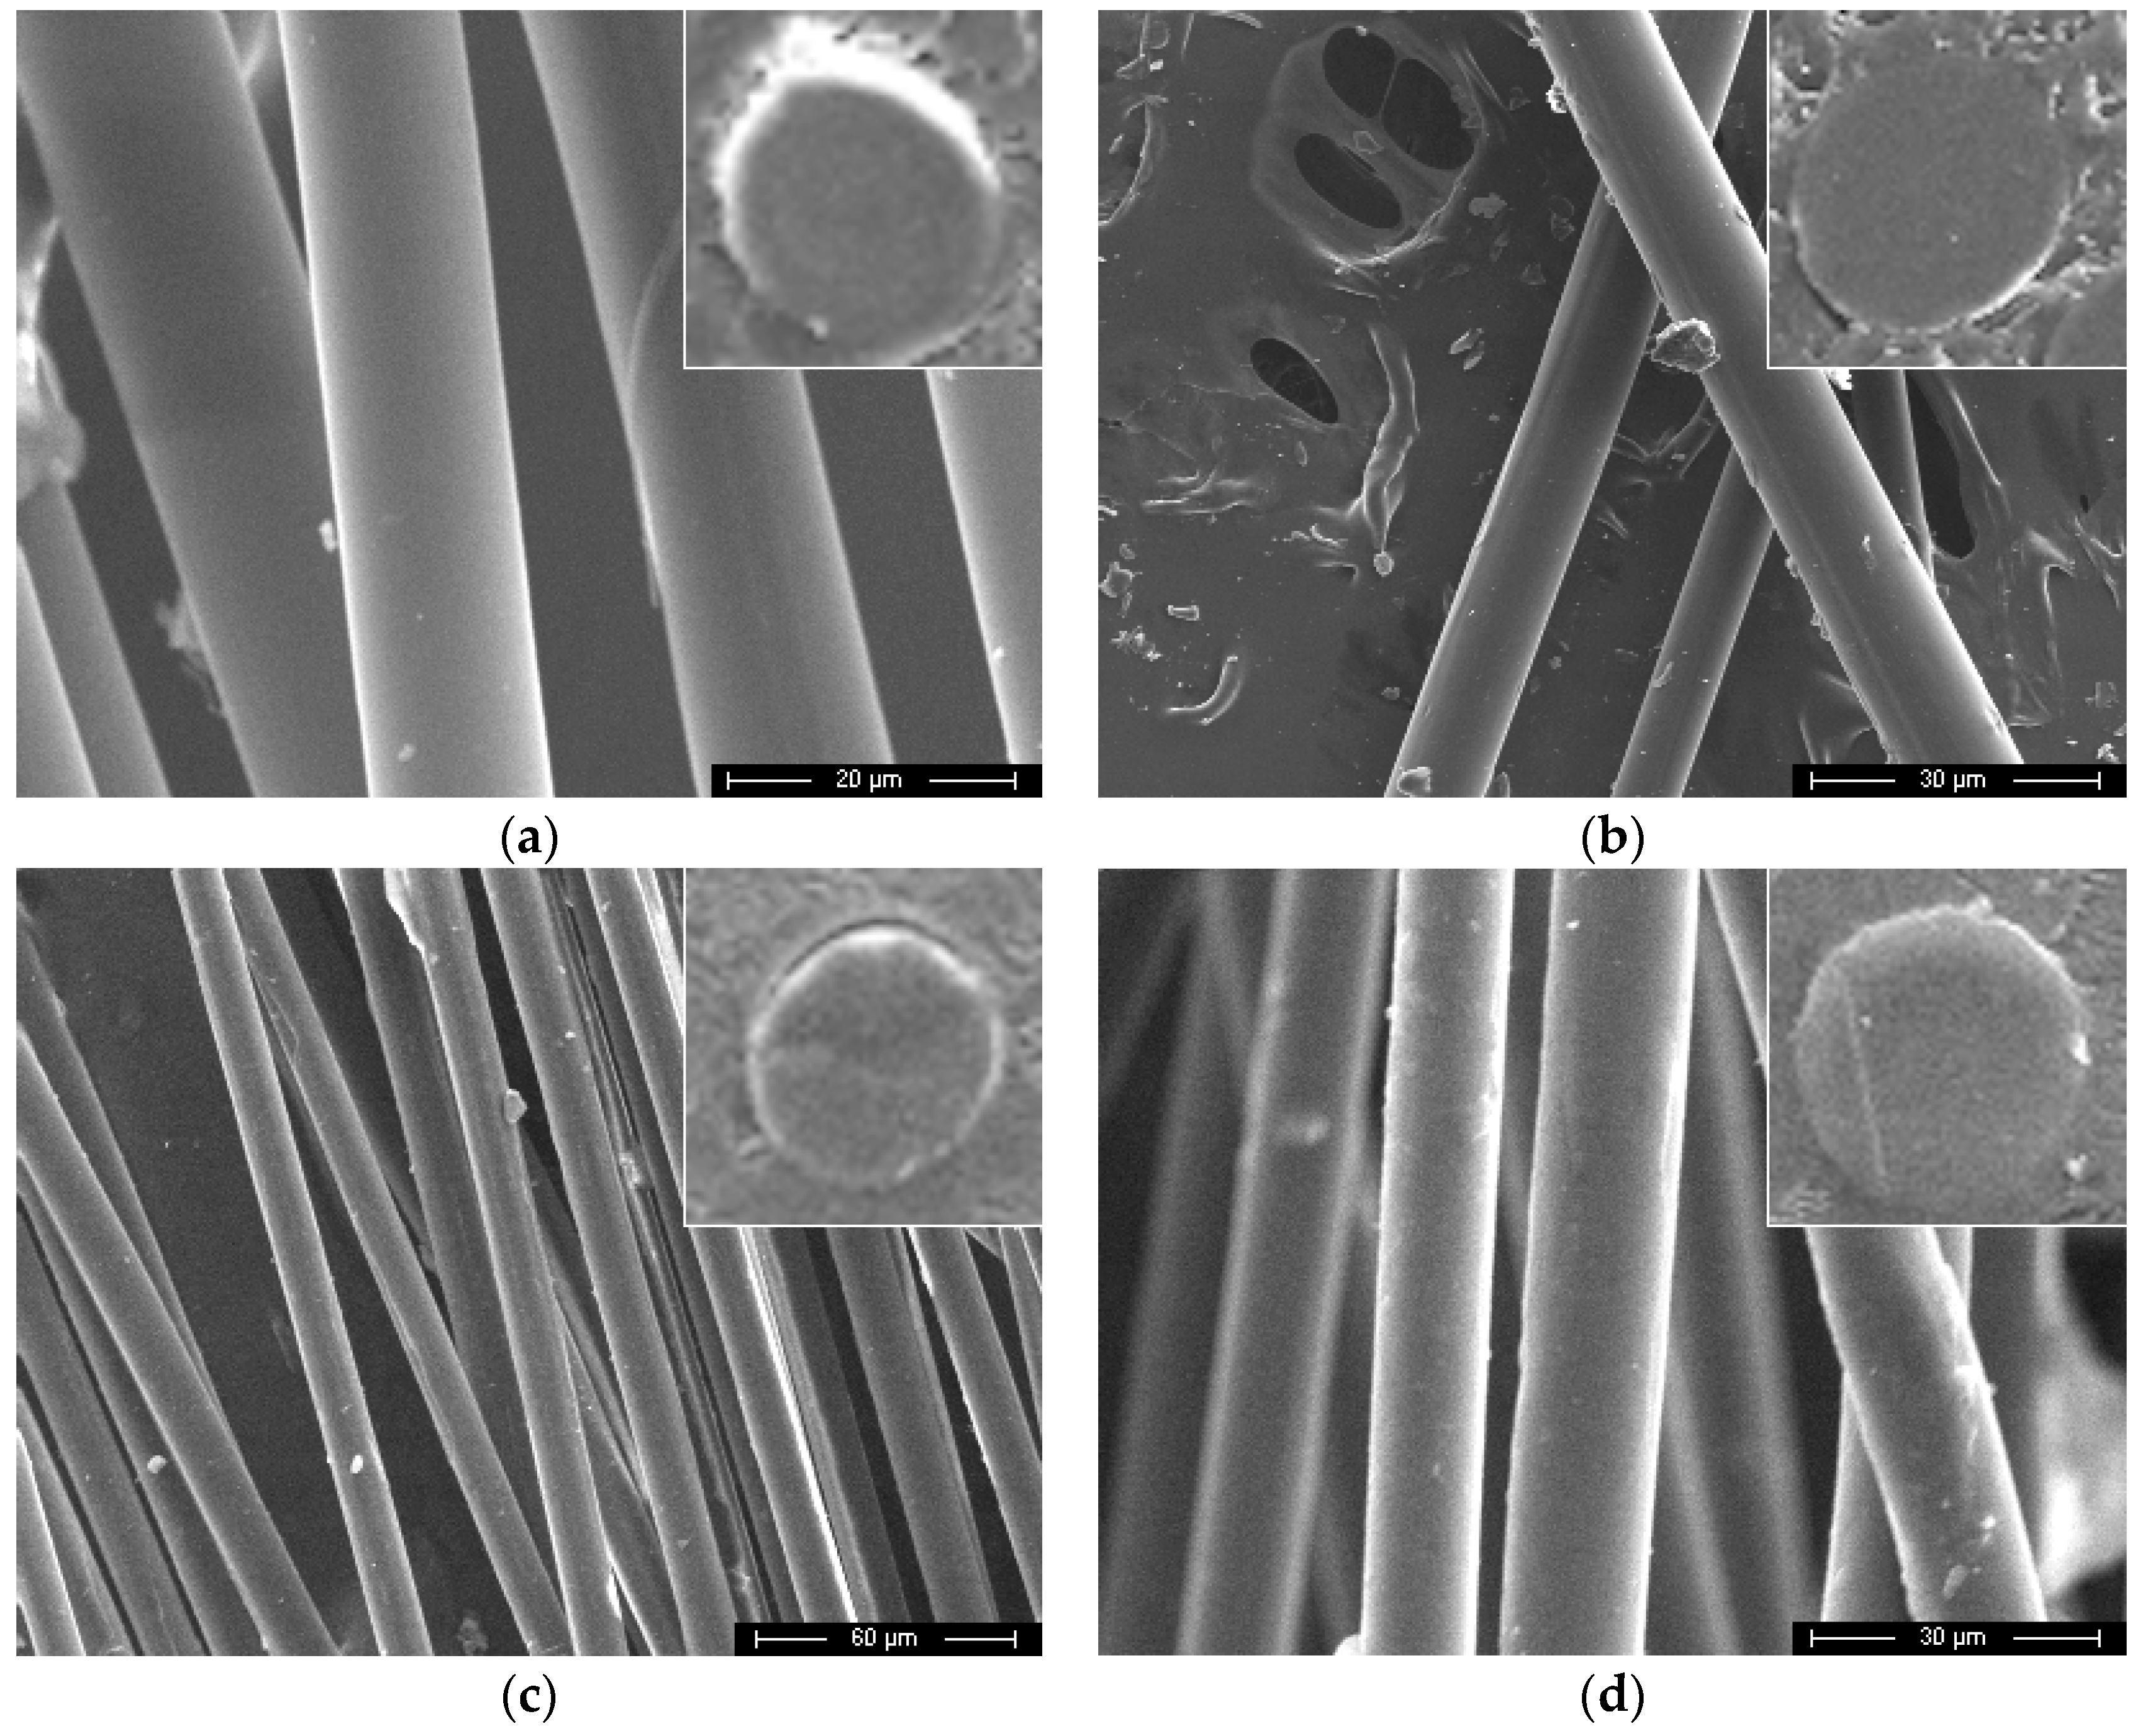
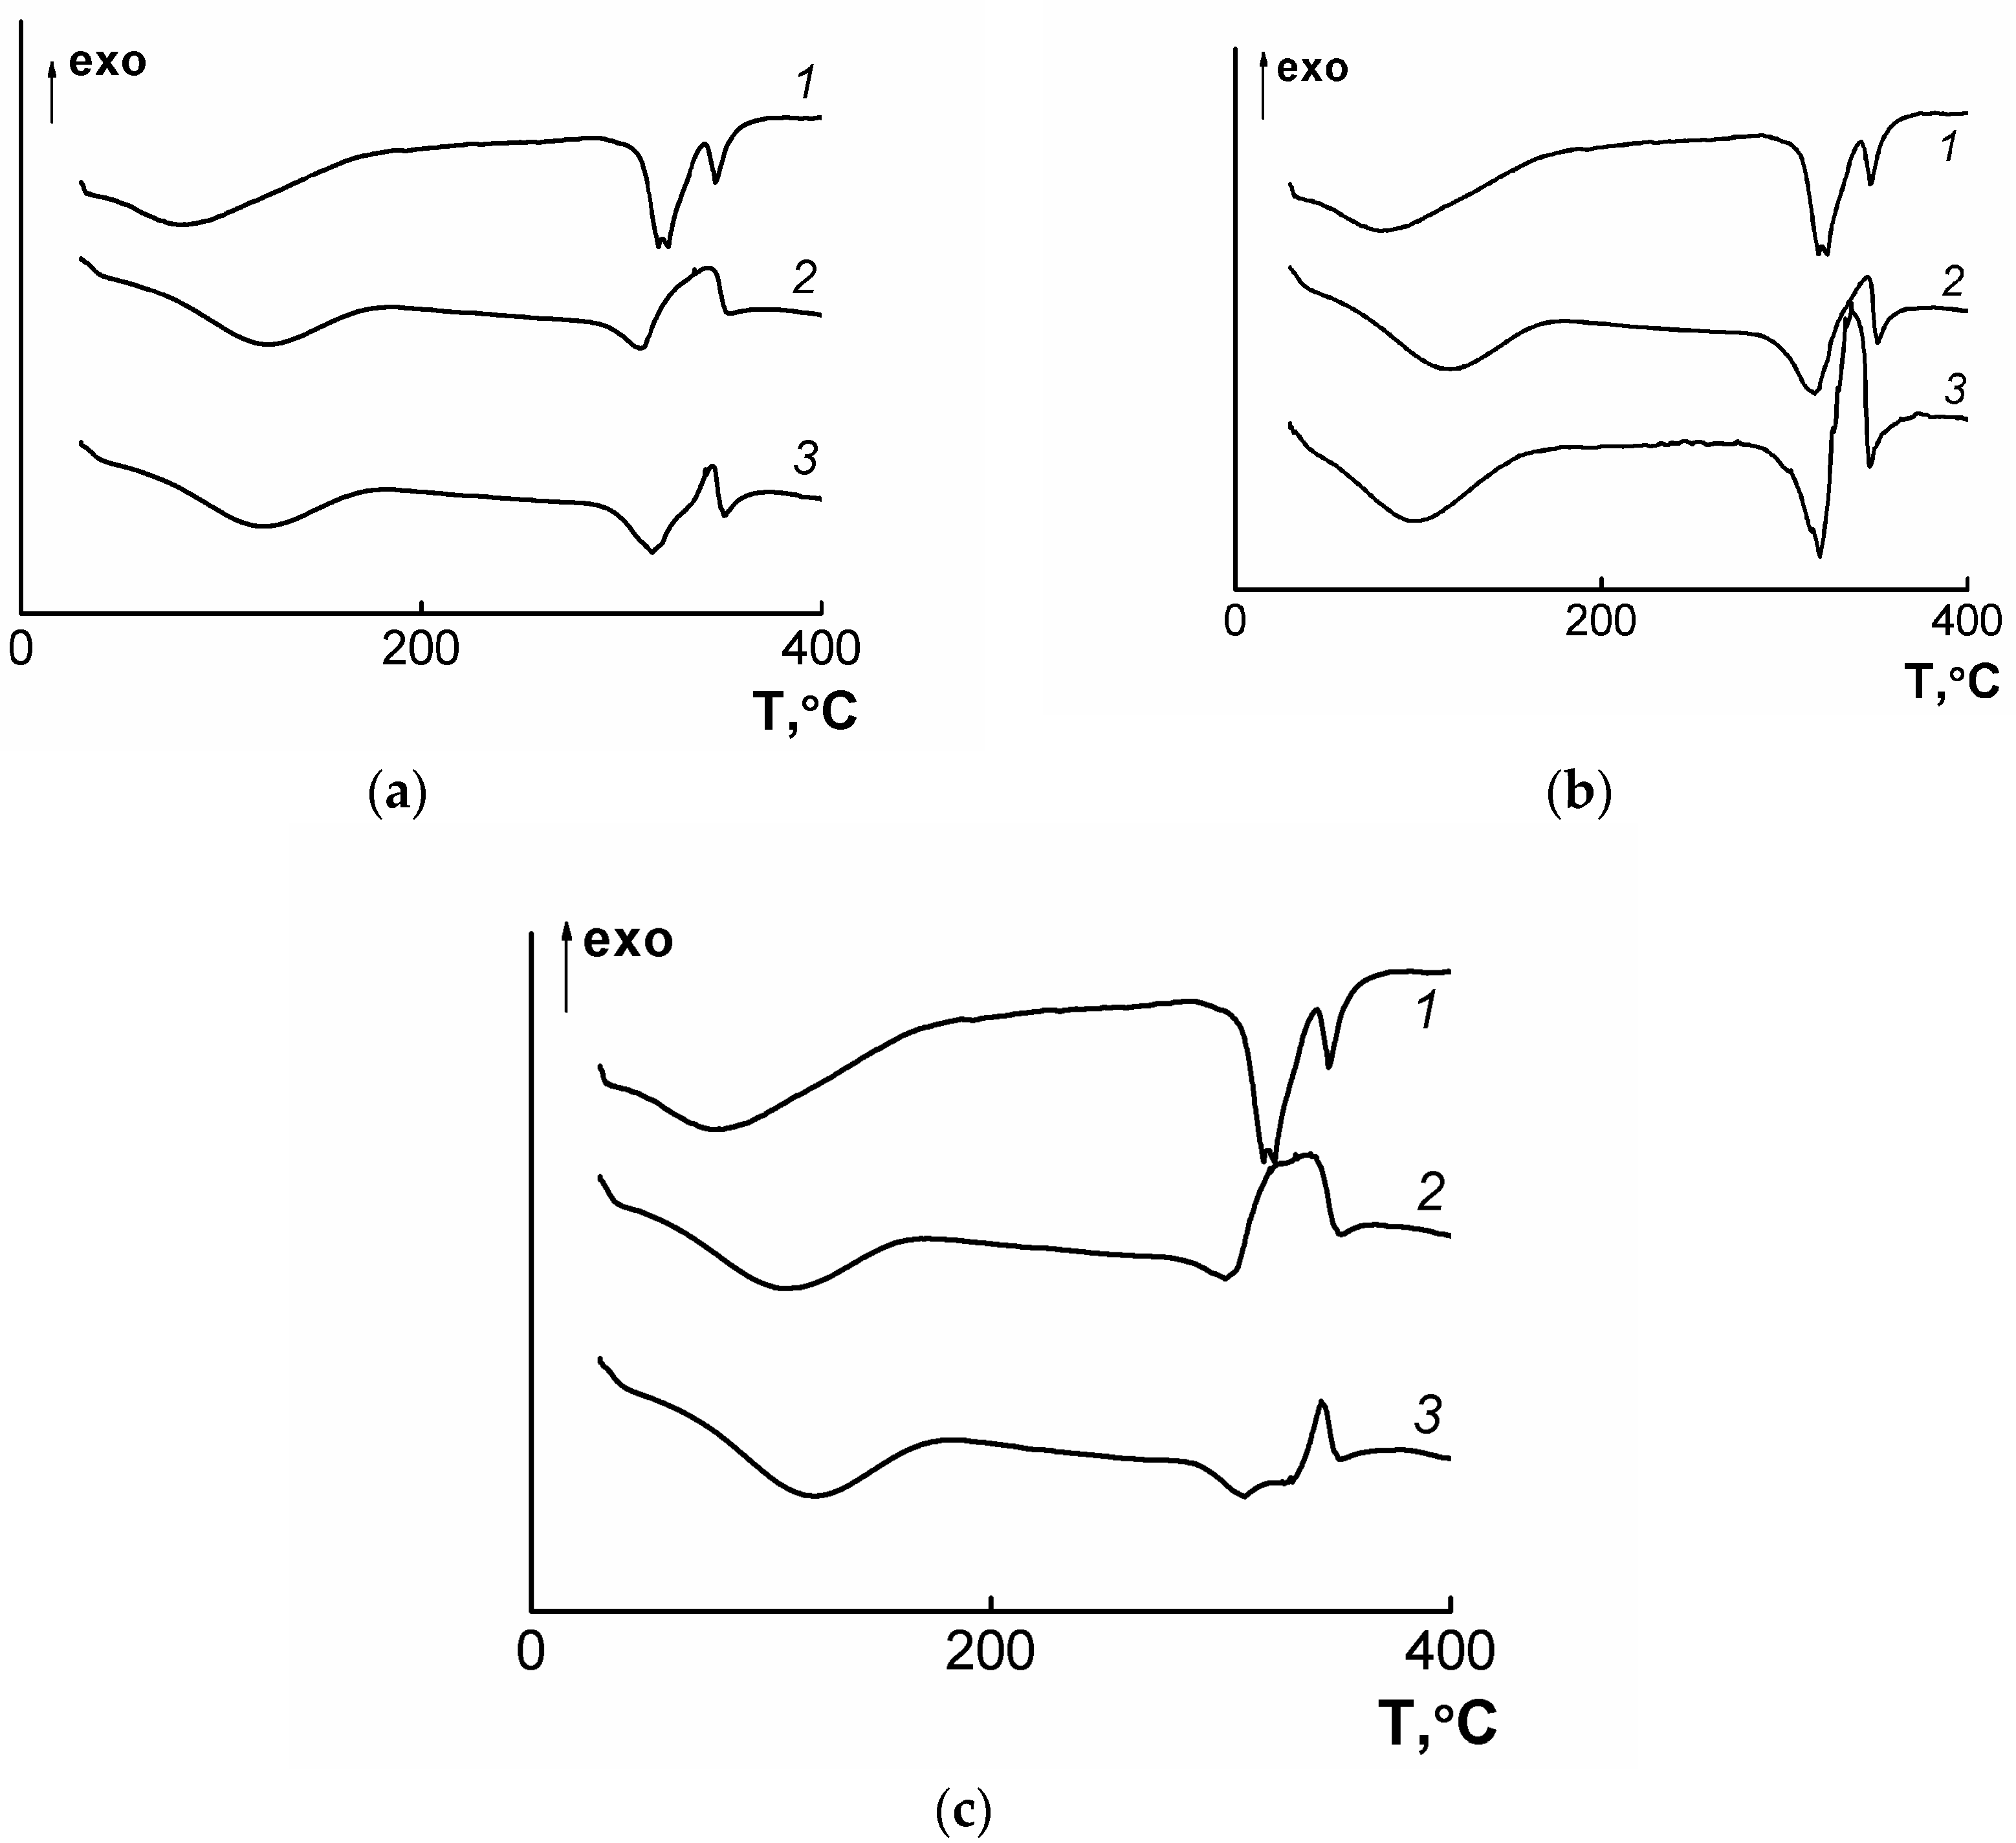
3. Results and Discussion
4. Conclusions
Author Contributions
Funding
Conflicts of Interest
References
- Golova, L.K. Processing of Cellulose via Highly Concentrated “Solid Solutions”. Fibre Chem. 1996, 28, 5–16. [Google Scholar] [CrossRef]
- Goldhalm, G. TENCEL® Carbon Precursor. Lenzinger Berichte 2012, 90, 58–63. [Google Scholar]
- Konkin, A.A. Carbon and Other Heat-Resistant Fibrous Materials; Khimiya: Moscow, Russia, 1974. [Google Scholar]
- Sporl, J.M.; Beyer, R.; Abels, F.; Cwik, T.; Muller, A.; Hermanutz, F.; Buchmeister, M.R. Cellulose-Derived Carbon Fibers with Improved Carbon Yield and Mechanical Properties. Macromol. Mater. Eng. 2017, 302, 1–10. [Google Scholar] [CrossRef]
- Dumanlı, A.G.; Windle, A.H. Carbon Fibres From Cellulosic Precursors: A Review. J. Mater. Sci. 2012, 47, 4236–4250. [Google Scholar] [CrossRef]
- Park, J.K.; Lee, J.Y.; Won, Y.G.; Cho, D.H. Method for Manufacturing Lyocell Based Carbon Fiber and Lyocell Based Carbon Fabric. Patent US 20100285223, 20 April 2010. [Google Scholar]
- Chernenko, D.N. Development and Research of Technological Process of Obtaining Carbon Fabrics from Hydrated Cellulose Fibers. Bachelor’s Thesis, Research Institute of Structural Materials based on graphite “NIIgraphit”, Moscow, Russia, 2015. [Google Scholar]
- Donnet, J.-B.; Bansal, R.C. Carbon Fibers, 3rd ed.; CRC Press: Boca Raton, FL, USA, 1998. [Google Scholar]
- Kazakov, M.E.; Trushnikov, A.M.; Yunitskaya, M.L. The Method of Obtaining Carbon Fiber Material. Patent RF 2045472, 10 October 1995. [Google Scholar]
- Olri, P.; Plezantene, E.; Louison, S.; Paye, R. Carbonization of Cellulosic Fibrous Materials in the Presence of an Organosilicon Compound. Patent RF 2256013, 10 July 2005. [Google Scholar]
- Olri, P.; Louison, S.; Kazakov, M.E.; Trushnikov, A.M. The Method of Obtaining Carbon Fiber Material. Patent RF 2258773, 20 August 2005. [Google Scholar]
- Karasev, J.V.; Lazarev, M.N.; Motorin, S.V.; Ozolin, A.A. Method for Continuous Production of Carbon Fiber from Hydrated Cellulose in the Form of a Unidirectional Tow. Patent RF 2429316, 20 September 2011. [Google Scholar]
- Trushnikov, A.M.; Kazakov, M.E.; Gridina, Yu.F.; Vazheva, L.D.; Borisova, L.K. The Method of Obtaining Carbon Fiber Material. Patent RF 2047674, 10 November 1995. [Google Scholar]
- Kopylov, V.M.; Trushnikov, A.M.; Khazanov, I.I.; Kazakov, M.E.; Nikitin, A.V.; Ratushnyak, M.A. The Method of Producing Carbon Fiber and Materials Based on it. Patent RF 2384657, 20 March 2010. [Google Scholar]
- Makarov, I.S.; Golova, L.K.; Kuznetsova, L.K.; Bondarenko, G.N.; Skvortsov, I.Y.; Mironova, M.V.; Bermeshev, M.V. Composite Fibers Based on Cellulose and Tetraethoxysilane: Preparation, Structure and Properties. Fibre Chem. 2017, 49, 101–107. [Google Scholar] [CrossRef]
- Wizon, I.; Robertson, J.A. Continuous Filament Ceramic Fibers via the Viscose Process. J. Polym. Sci. Part C 1967, 19, 267–281. [Google Scholar] [CrossRef]
- Makarov, I.S.; Golova, L.K.; Bondarenko, G.N.; Skvortsov, I.Y.; Berkovich, A.K.; Bermeshev, M.V.; Mironova, M.V. Carbon-Silicon-Carbide Fibers Prepared from Solid Solutions of Cellulose in N-Methylmorpholine-N-Oxide with Added Tetraethoxysilane. Fibre Chem. 2017, 49, 231–236. [Google Scholar] [CrossRef]
- Kablov, E.N. Materials and Chemical Technologies for Aircraft Engineering. Herald Russ. Academ. Sci. 2012, 82, 158–167. [Google Scholar] [CrossRef]
- Godfrey, L.E.A. Differential Thermal Analysis (DTA) and Thermogravimetric Analysis (TGA) Studies of Flame-Retardant Rayon Fibers. Text. Res. J. 1970, 40, 116–126. [Google Scholar] [CrossRef]
- Broido, A. A Simple, Sensitive Graphical Method of Treating Thermogravimetric Analysis Data. J. Polym. Sci. Part A-2 1969, 7, 1761–1773. [Google Scholar] [CrossRef]
- Vecchio, S.; Luciano, G.; Franceschi, E. Explorative Kinetic Study on the Thermal Degradation of Five Wood Species for Application in the Archaeological Field. Annali di Chimica 2006, 96, 715–725. [Google Scholar] [CrossRef] [PubMed]
- Tian, C.M.; Shi, Z.H.; Zhang, H.Y.; Xu, J.Z.; Shi, J.R.; Guo, H.Z. Thermal Degradation of Cotton Cellulose. J. Therm. Anal. Calorim. 1999, 55, 93–98. [Google Scholar] [CrossRef]
- Loskutov, S.R.; Shapchenkova, O.A.; Aniskina, A.A. Thermal Analysis of Wood of the Main Tree Species of Central Siberia. Sib. J. For. Sci. 2015, 6, 17–30. [Google Scholar]
- Wendlandt, W.W. Thermal Methods of Analysis; Interscience Publishers: New York, NY, USA, 1964. [Google Scholar]
- Golova, L.K.; Vasilyeva, N.V.; Borodina, O.E.; Krylova, T.B.; Kuznetsova, L.K.; Rogovina, S.Z.; Zelenetskiy, S.N. A Method of Obtaining a Cellulose Solution for the Manufacture of Molded Products. Patent RF 1645308, 20 March 1997. [Google Scholar]
- Kulichikhin, V.G.; Skvortsov, I.Yu.; Mironova, M.V.; Ozerin, A.N.; Kurkin, T.S.; Berkovich, A.K.; Frenkin, E.I.; Malkin, A.Y. From Polyacrylonitrile, its Solutions, and Filaments to Carbon Fibers II. Spinning PAN-Precursors and their Thermal Treatment. Adv. Polym. Technol. 2018, 37, 1099–1113. [Google Scholar] [CrossRef]
- Ford, E.N.J.; Mendon, S.K.; Thames, S.F.; Rawlins, J.W. X-ray Diffraction of Cotton Treated with Neutralized Vegetable Oil-based Macromolecular Crosslinkers. J. Eng. Fiber Fabr. 2010, 5, 10–20. [Google Scholar]
- Capart, R.; Khezami, L.; Burnhamb, A.K. Assessment of Various Kinetic Models for the Pyrolysis of a Microgranular Cellulose. Thermochim. Acta 2004, 417, 79–89. [Google Scholar] [CrossRef]
- Milosavljevic, I.; Suuberg, E.M. Cellulose Thermal Decomposition Kinetics: Global Mass Loss Kinetics. Ind. Eng. Chem. Res. 1995, 34, 1081–1091. [Google Scholar] [CrossRef]
- Andrianov, K.A. Organosilicon Compounds; GHI: Moscow, Russia, 1955. [Google Scholar]
- Kazakova, V.V.; Myakushev, V.D.; Strelkova, T.V.; Muzafarov, A.M. Hyperbranched Polyethoxysiloxanes: Synthesis and Properties. Polym. Sci. Ser. A 1999, 41, 283–291. [Google Scholar]
- Ornaghi, H.L.; Poletto, M.; Zattera, A.J.; Amico, S.C. Correlation of the Thermal Stability and the Decomposition Kinetics of Six Different Vegetal Fibers. Cellulose 2014, 21, 177–188. [Google Scholar] [CrossRef]
- Varhegyi, G.; Jakab, E.; Antal, M.J. Is the Broido-Shafizadeh Model for Cellulose Pyrolysis True? Energy Fuels 1994, 8, 1345–1352. [Google Scholar] [CrossRef] [Green Version]
- Lin, T.; Goos, E.; Riedel, U. A Sectional Approach for Biomass: Modelling the Pyrolysis of Cellulose. Fuel Process. Technol. 2013, 115, 246–253. [Google Scholar] [CrossRef]
- Yang, H.; Yan, R.; Chen, H.; Lee, D.H.; Zheng, C. Characteristics of Hemicellulose, Cellulose and Lignin Pyrolysis. Fuel 2007, 86, 1781–1788. [Google Scholar] [CrossRef]


| The Compound | Structural Formula | Тm, °C | Тboil, °C | Density, g/cm3 (T = 25 °C) | Viscosity, η, mPa·s (T = 20 °C) |
|---|---|---|---|---|---|
| Tetraethoxysilane (TEOS) (ID 24848042) |  | −82.5 | 170 | 0.933 | 0.75 |
| Vinyltriethoxysilane (VTEOS) (ID 24850510) |  | <0 | 160 | 0.910 | 0.7 |
| Bistrimethylsilyl acetylene (BTMSA) (ID 24851275) |  | 22 | 136 | 0.752 | - |
| Sample | Ratio of Components | ||
|---|---|---|---|
| 0 | 95/5 | 95/10 | |
| Cellulose/TEOS | L | Т-5 | Т-10 |
| Cellulose/VTEOS | L | VT-5 | VT-10 |
| Cellulose/BTMSA | L | B-5 | B-10 |
| Sample | Tmax, °С | DTGmax, %/min |
|---|---|---|
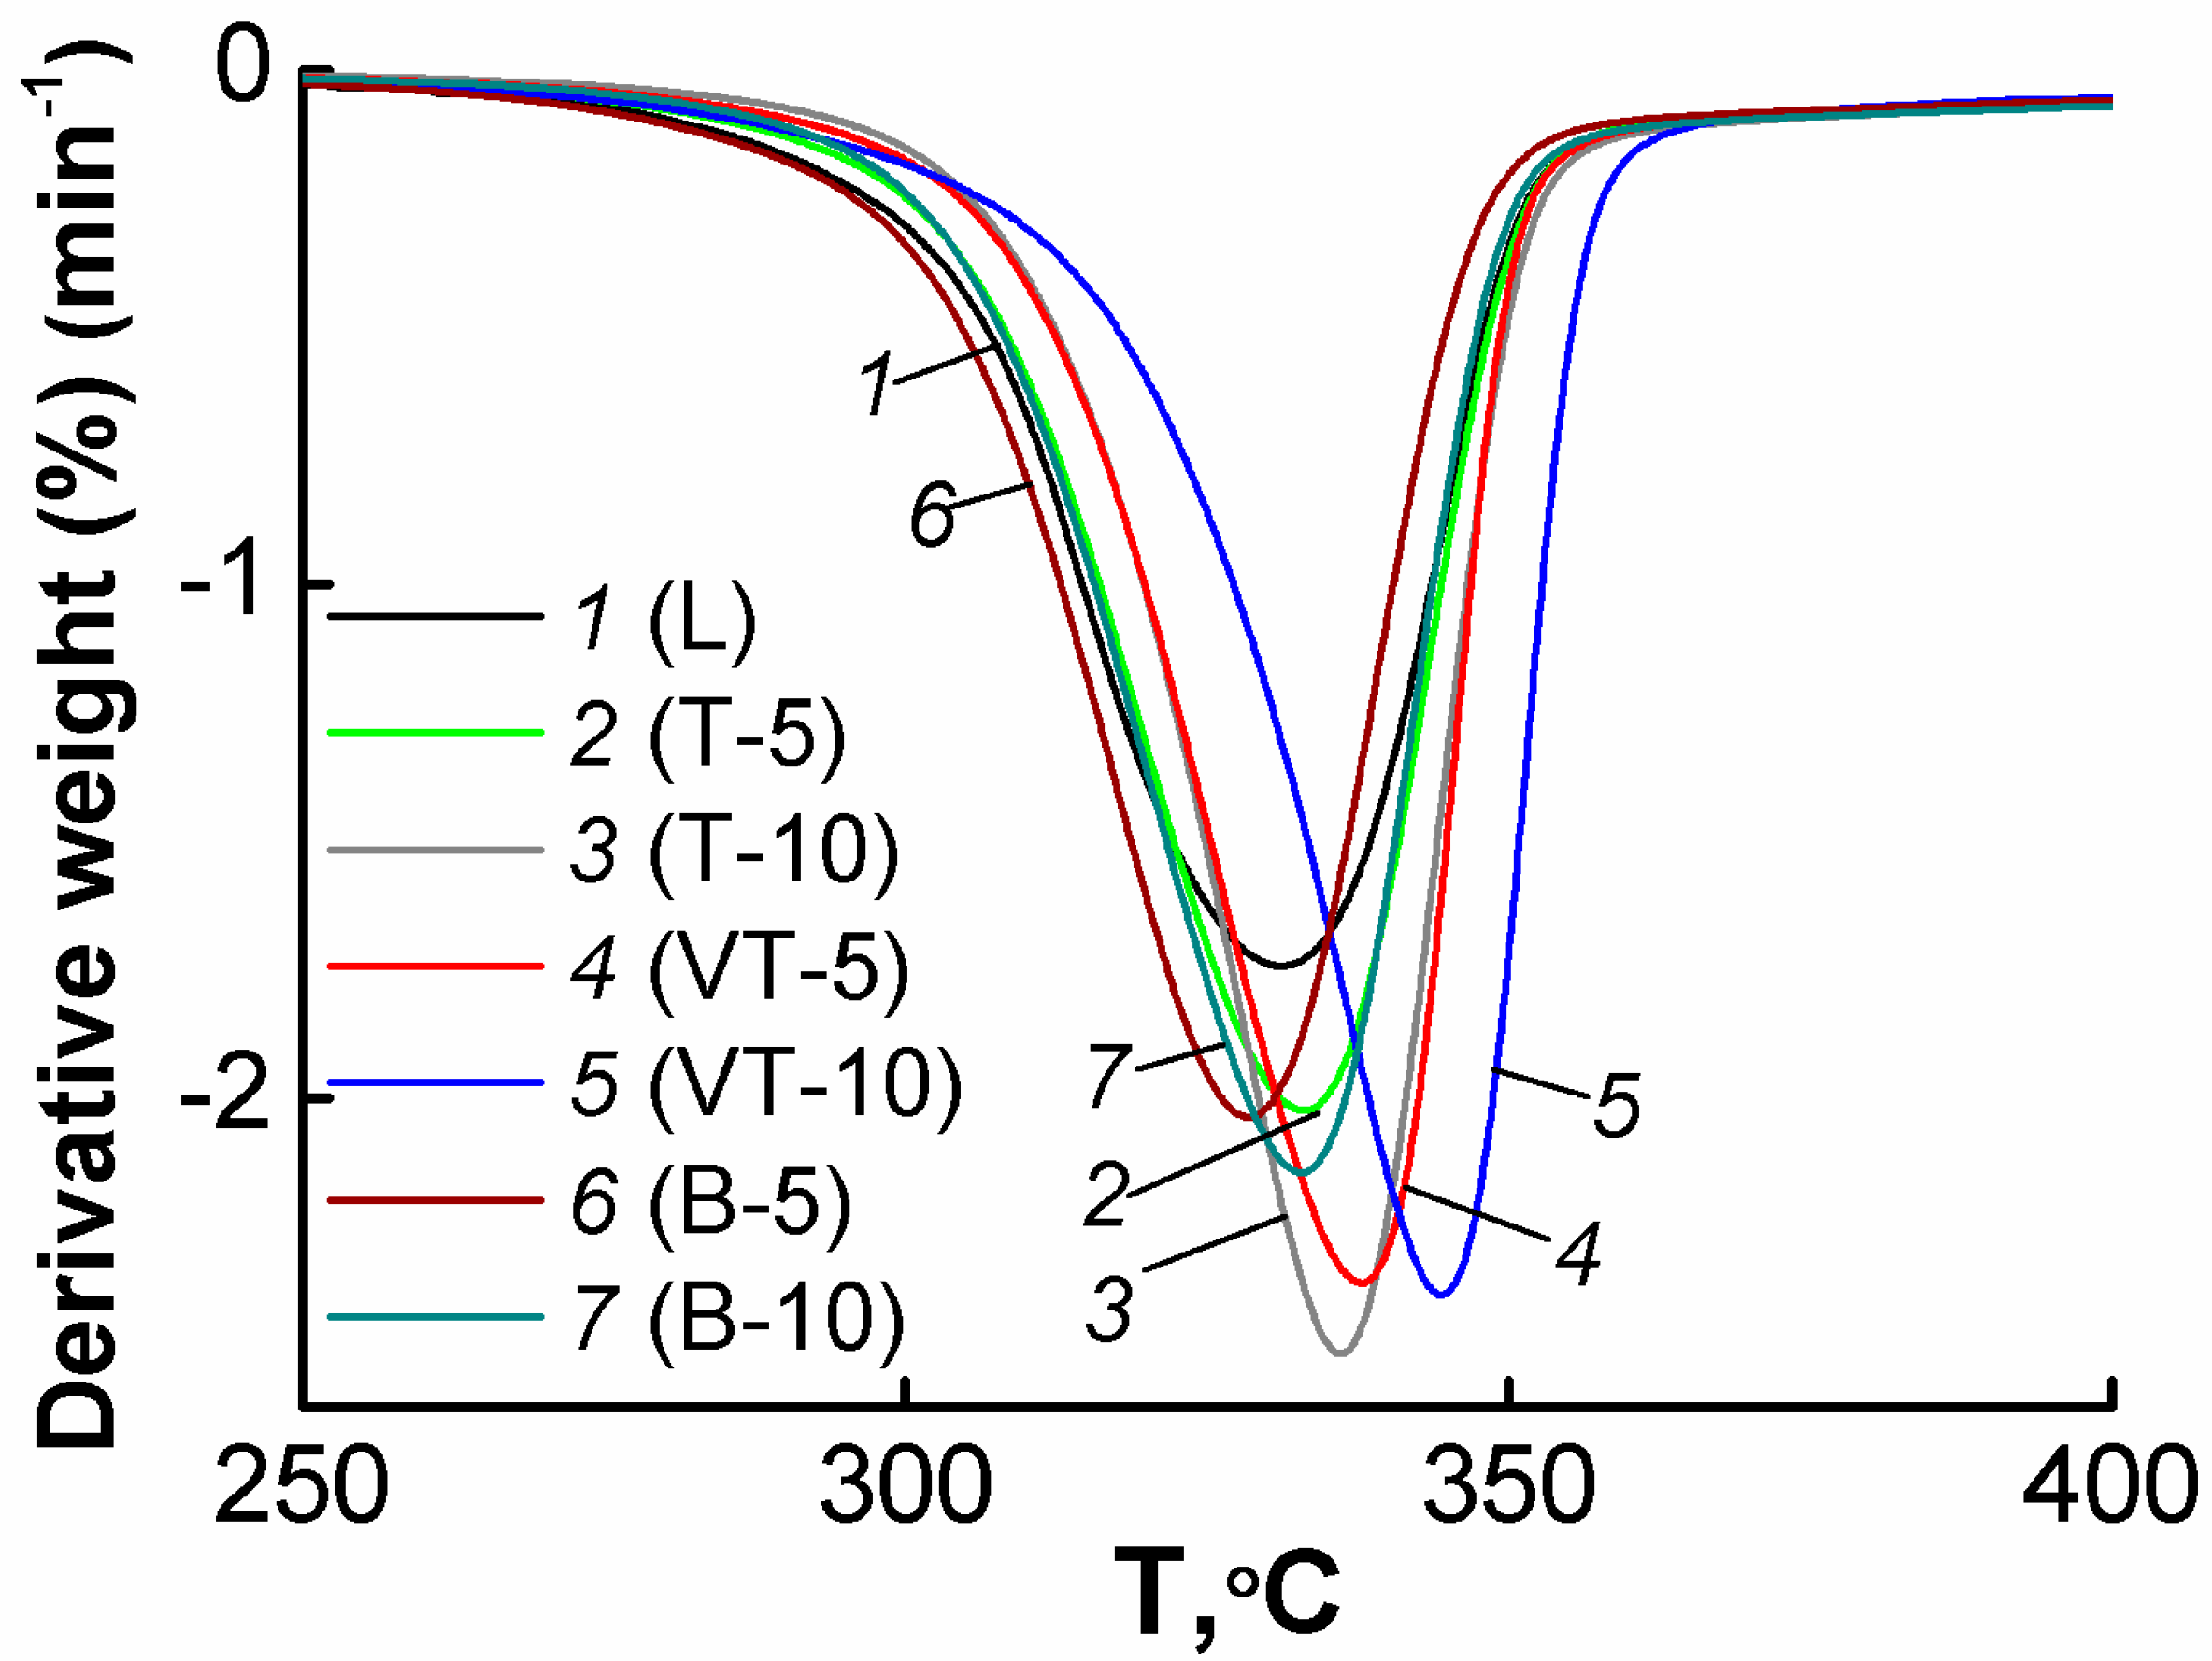
| L | 331 | −1.74 |
| T-5 | 332 | −2.02 |
| T-10 | 335 | −2.49 |
| VТ-5 | 337 | −2.35 |
| VТ-10 | 344 | −2.38 |
| B-5 | 328 | −2.03 |
| B-10 | 332 | −2.14 |
| Sample | L (1) | T-5 (2) | T-10 (3) | B-5 (6) | B-10 (7) | VT-5 (4) | VT-10 (5) |
|---|---|---|---|---|---|---|---|
| Slope | −26.14 | −19.47 | −25.08 | −19.4 | −20.6 | −19.6 | −17.1 |
| Tonset, °C | 281 | 282 | 292 | 279 | 279 | 282 | 287 |
| Trange, °C | 281–306 | 282–307 | 292–317 | 279–304 | 279–304 | 282–307 | 287–312 |
| Ea, kJ/mol | 234 | 162 | 209 | 162 | 172 | 164 | 143 |
| Weight loss, % | 5.6 | 4.7 | 7 | 5.3 | 3.4 | 3.5 | 4.8 |
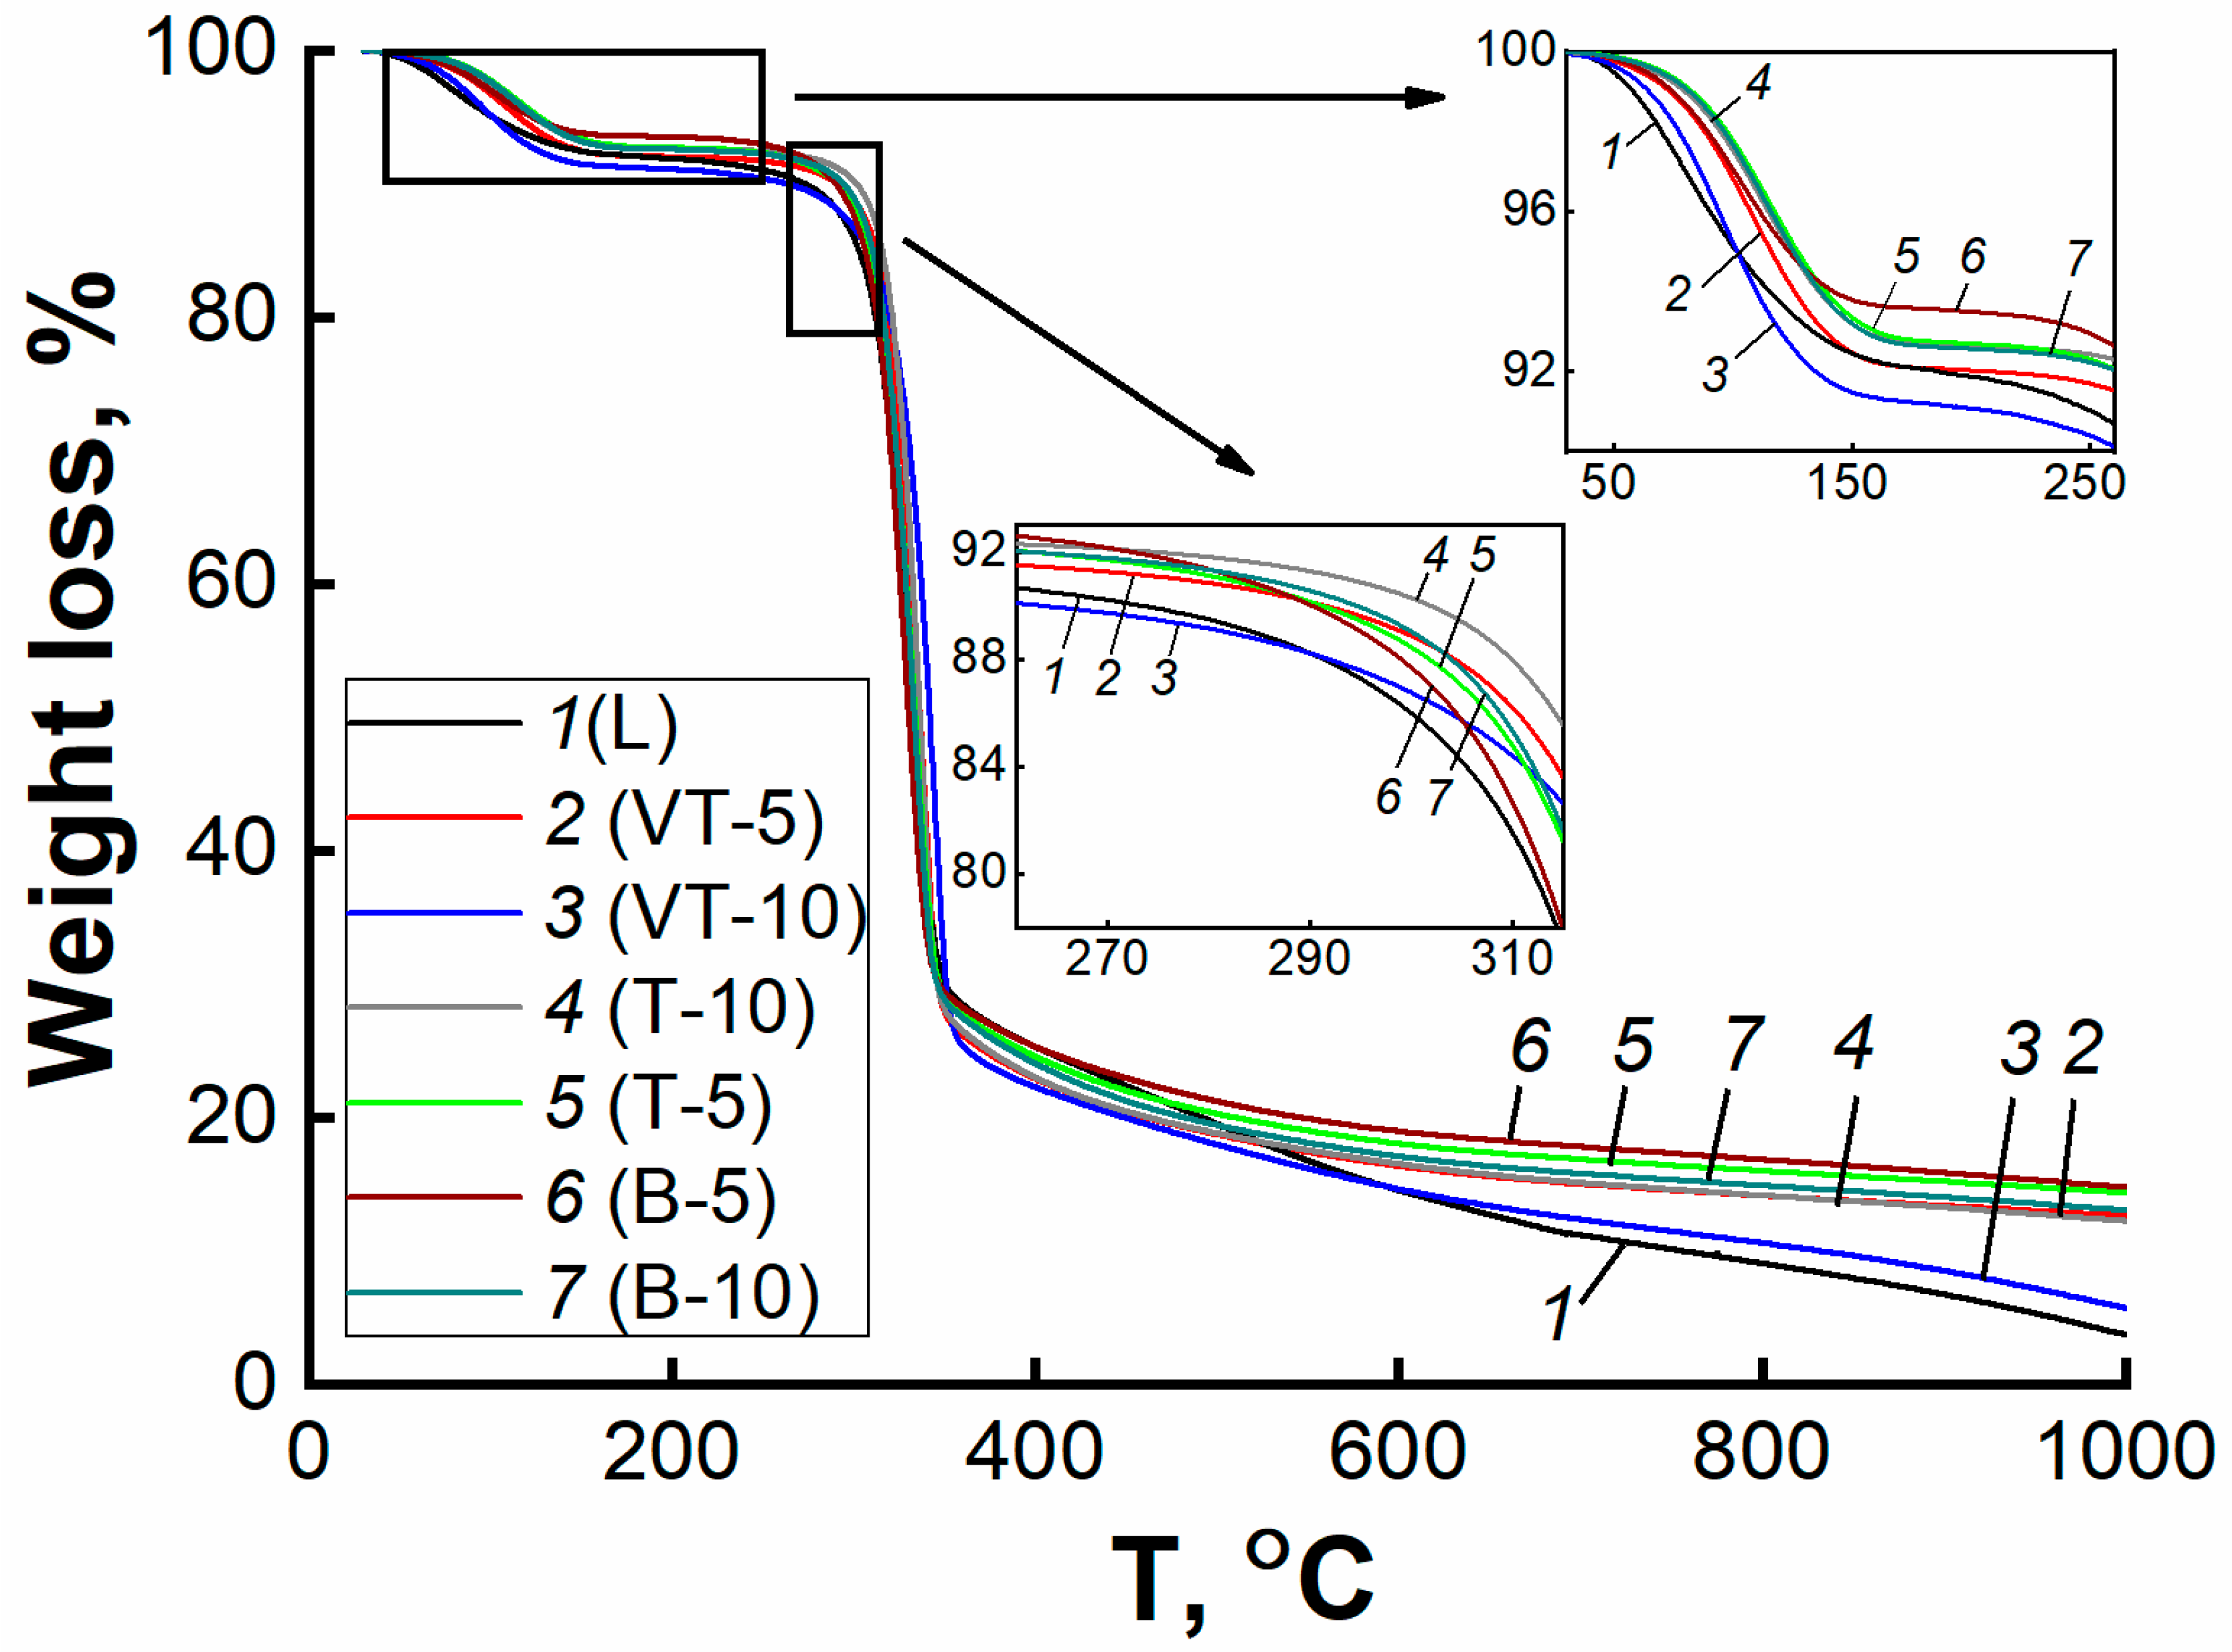
| Carbon yield at 1000 °C, % | 3.5 | 14.4 | 12.3 | 14.8 | 13.1 | 12.6 | 5.7 |
| Sample | Тrange, °С | Тmin Endotherma, °С | Endothermic Effect, J·g−1 | Тrange, °С | Тmin Endotherma, °С | Endothermic Effect, J·g−1 | Тrange, °С | Тmax Exotherma, °С | Exothermic Effect, J·g−1 | Тrange, °С | Тmin Endotherma, °С | Endothermic Effect, J·g−1 |
|---|---|---|---|---|---|---|---|---|---|---|---|---|
| L | 30–172 | 77 | −162 | 288–345 | 326 | −119 | 345–372 | 350 | −25 | |||
| Т-5 | 30–178 | 112 | −155 | 295–319 | 311 | −22 | 319–355 | 347 | 56 | |||
| Т-10 | 30–177 | 111 | −157 | 277–341 | 317 | −66 | 342–351 | 348 | 8 | 351–376 | 354 | −11 |
| VT-5 | 30–174 | 106 | −178 | 286–333 | 318 | −74 | 333–352 | 348 | 18 | 352–370 | 354 | −8 |
| VT-10 | 30–177 | 99 | −224 | 289–326 | 323 | −95 | 326–345 | 341 | 62 | 345–376 | 351 | −14 |
| B-5 | 30–164 | 101 | −139 | 281–312 | 305 | −10 | 312–357 | 337 | 92 | |||
| B-10 | 30–177 | 112 | −166 | 289–325 | 312 | −10 | 339–355 | 347 | 19 |
© 2019 by the authors. Licensee MDPI, Basel, Switzerland. This article is an open access article distributed under the terms and conditions of the Creative Commons Attribution (CC BY) license (http://creativecommons.org/licenses/by/4.0/).
Share and Cite
Mironova, M.; Makarov, I.; Golova, L.; Vinogradov, M.; Shandryuk, G.; Levin, I. Improvement in Carbonization Efficiency of Cellulosic Fibres Using Silylated Acetylene and Alkoxysilanes. Fibers 2019, 7, 84. https://0-doi-org.brum.beds.ac.uk/10.3390/fib7100084
Mironova M, Makarov I, Golova L, Vinogradov M, Shandryuk G, Levin I. Improvement in Carbonization Efficiency of Cellulosic Fibres Using Silylated Acetylene and Alkoxysilanes. Fibers. 2019; 7(10):84. https://0-doi-org.brum.beds.ac.uk/10.3390/fib7100084
Chicago/Turabian StyleMironova, Maria, Igor Makarov, Lyudmila Golova, Markel Vinogradov, Georgy Shandryuk, and Ivan Levin. 2019. "Improvement in Carbonization Efficiency of Cellulosic Fibres Using Silylated Acetylene and Alkoxysilanes" Fibers 7, no. 10: 84. https://0-doi-org.brum.beds.ac.uk/10.3390/fib7100084