Applying Machine Learning to Nanoindentation Data of (Nano-) Enhanced Composites


1
Innovation in Research & Engineering Solutions (IRES), Boulevard Edmond Machtens 79/22, 1080 Brussels, Belgium
2
RNANO Lab—Research Unit of Advanced, Composite, Nano Materials and Nanotechnology, School of Chemical Engineering, National Technical University of Athens, GR-15773 Zographos, Greece
*
Author to whom correspondence should be addressed.
Fibers 2020, 8(1), 3; https://0-doi-org.brum.beds.ac.uk/10.3390/fib8010003
Submission received: 13 November 2019
/
Revised: 16 December 2019
/
Accepted: 18 December 2019
/
Published: 21 December 2019
(This article belongs to the Special Issue Smart Reinforced Composites Using Carbon and Carbon-Based Nanomaterials II)
Abstract
:Carbon fiber reinforced polymers (CFRPs) are continuously gaining attention in aerospace and space applications, and especially their multi-scale reinforcement with nanoadditives. Carbon nanotubes (CNTs), graphene, carbon nanofibers (CNFs), and their functionalized forms are often incorporated into interactive systems to engage specific changes in the environment of application to a smart response. Structural integrity of these nanoscale reinforced composites is assessed with advanced characterization techniques, with the most prominent being nanoindentation testing. Nanoindentation is a well-established technique, which enables quantitative mapping of nanomechanical properties with the μm surficial and nm indentation resolution scale and high precision characterization. This feature enables the characterization of the interface in a statistical and quantitative manner and the correlation of (nano-) reinforcement to interface properties of CFRPs. Identification of reinforcement is performed with k-Nearest Neighbors and Support Vector Machine classification algorithms. Expertise is necessary to describe the physical problem and create representative training/testing datasets. Development of open source Machine Learning algorithms can have an influential impact on uniformity of nanometry data creation and management. The statistical character of nanoindentation is a key factor to supply information on heterogeneity of multiscale reinforced composites. Both the identification of (nano-) reinforcement and quality assessment of composites are provided by involving artificial intelligence.
1. Introduction
The carbon fiber reinforced composites (CFRP) market is progressively growing [1,2]. The increasing needs of CFRPs for construction, automotive, and (aero-) space fields raise the necessity of improving interfacial properties [3]. Techniques with the potential of industrial application such as “green” electroplating technology, thermal spraying, and laser cladding introduce a nanometer’s thin film on carbon fibers (CFs) surface. The subsequent incorporation of functional groups and novel sizing formulations improves the interphase and consequently, the CFRP mechanical properties [4,5,6]. Moreover, reinforcement with nanomaterials, such as CNTs growth on CFs is reported to effectively deal with the brittle fracture mechanism of the epoxy-based CFRPs similarly to aforementioned processes [3,7,8]. These processes are commonly adopted to increase mechanical interlocking unidirectionally in order to fulfil maximum potential of composites according to the law of mixture [3,9]. In this scope, powerful and high-speed characterization through nanoindentation is suitable to describe in a statistically representative manner the impact of (nano-) engineering to the mechanical properties of composites [10,11]. Grid nanoindentation is well-established to characterize the interphase performance [6,12]. The technique sensitivity in the range of several nanometer’s depth enables to gain insight into the reinforcement identity of functionalized CFs. Quantitative raw data generated by nanoindenter instruments provide a wealthy source of information that can be used for identification of matrix, interface, and CF properties [6,10]. The latter two classes demonstrate a measurable scattering, which is useful in order to classify the mechanism of reinforcement through Supervised Machine Learning algorithms [13]. This is an essential step to train machines towards performing automated recognition of reinforcement type.
Existing classification models, such as decision tree (DT), neural network (NN), support vector machine (SVM) and k-Nearest Neighbor (KNN) are usually involved to perform supervised machine learning [14,15]. However, these models require representative and relatively balanced training datasets to establish process–structure–property (PSP) relations [13], as in CFRPs’ case. Despite progress in machine learning, it is still a challenging task to construct efficient algorithms for imbalanced datasets. Re-sampling preprocess has been proven to minimize discrepancy between class samples [14]. Undersampling and oversampling are employed to modified non-uniform distribution in classes of reinforcement to smallest or highest majority class, respectively [16]. However, undersampling contains the risk of losing important information contained in the majority class [15], while oversampling may increase computational cost. Often issues of ethics, confidentiality or lack of data, especially in recently growing scientific fields do not facilitate accessibility [17]. A better strategy to deal with imbalanced data may be a popular oversampling approach renowned as SMOTE (Synthetic Minority Oversampling Techniques), which oversamples the minority class by creating synthetic examples rather than by oversampling with replacement [14]. Thus, synthetic data produced in a representative and repetitive manner can solve this shortcoming and offer balanced datasets by introducing new, no-replicated minority class samples [18]. Consequently, better performance of the aforementioned machine learning models is ensured. In fact, prediction accuracy of an algorithm has been reported to be improved in a variety of datasets by applying these methodologies [19].
The rapidly growing interest in coupling Material Science with Data Science and Machine Learning to support innovation in design and technology transfer [10,11,13] is closely connected to accessibility of data and open source software engagement [17]. In this direction, R language can be proved a useful tool to analyze nanoindentation experimental data using artificial intelligence. R language was developed in the mid-1990s from the more archaic S language (mid-1970s at Bell Labs), which is free, facilitates good visualizations, and over 8700 free third party packages can be attached in the user-friendly interface. Additionally, connectivity is supported by popular software, such as Microsoft Excel, Origin Pro, etc. Moreover, data fit is limited to 50% RAM size, while R can be run in Cloud on the Apache Hadoop ecosystem. In this work, the case of nanoindentation testing of CFRPs specimens is presented by clustering attributes data to obtain quantitative modulus mapping. A methodology is implemented to generate a microstructural colormap by allocating grid nanoindentation output to epoxy matrix, interface, and CFs via R language and k-means unsupervised clustering. Data of pristine and modified CFs in CFRPs were used to create training and testing datasets for Supervised Machine Learning with KNN and SVM classification models. Undersampling, oversampling and SMOTE strategies were used to optimize model performance to identify the mechanism of reinforcement. Finally, the model functionality was demonstrated by efficiently predicting the class of reinforcement for new datasets.
2. Materials and Methods
2.1. Computational Data
Nanoindentation testing data were obtained from specimens received. The matrix phase consisted of Epoxy Araldite LY 556 resin, and reinforcement was performed using HEXCEL CFs. The CFs were pre-treated to facilitate enhanced bonding in the interface prior to manufacturing. Functionalization techniques contain Low Pressure Plasma (LPP) modification, Active Screen Plasma (ASP) modification, electropolymerization with methacrylic acid, and Chemical Vapor Deposition of carbon nanotubes, while unmodified CFs were used for the reference specimen preparation [20,21,22]. This study aims to classify CFRPs with different modifications on CF’s surface. For instance, since LPP and ASP functionalize CFs by developing oxygen species on the surface, both belong to the same ontology and the mechanism of reinforcement is thus considered as one class. The reinforcement mechanism by monomer electrografting and carbon nanotubes growth was independent and belong to separate classes of reinforcement. The data have undergone preprocessing via k-means clustering [13] to identify the phases of CFRPs and retrieve the information derived by interface, reinforcement cluster, and CFs. Epoxy matrix properties tend to mislead classification statistical metrics by increasing false positive predictions due to high similarity of nanomechanical properties, since epoxy properties are not affected by interfacial reinforcement. A total of 649 indentations and data from four different classes (pristine, with oxygen functionalities, monomer sizing, growth of CNTs) were used in this work to construct classification models. This is a useful concept since it is not necessary to test all components of the dataset, but only those that are representative. This can be done in practice by grouping a set, for instance, by similarity in order to handle diversity [23]. Similarly, chemical structure is used as a descriptor to define the class of reinforcement by grouping oxidation functionalities, sizing formulations with monomers, and grown carbon nanostructures on CF’s surface.
2.2. Nanoindentation Testing
In order to determine the nanomechanical properties of CFRP specimens, Hysitron TriboLab® Nanomechanical Test Instrument (Minneapolis, MN, USA) was used. The instrument capabilities enable loading from 1 × 10⁻³ mN to 30 mN and with a high load and displacement resolution of 1 nN and 0.04 nm, respectively. All measurements have been performed by keeping constant the maximum indentation depth 200 nm, in accordance to ISO 14577-1 [24]. A standard three-sided pyramidal Berkovich tip was used, with an average curvature radius of 100 nm [13]. In all measurements, a total of 64 indents were performed by applying a square 8 × 8 grid, with spacing of 5 μm to avoid any indentation-to-indentation interaction [6,25]. The measurement environment was characterized by 45% humidity content, and 23 °C ambient temperature. In order to operate under closed loop control, the feedback control option was selected. A smooth surface was obtained by wet polishing using SiC grinding papers. The used granulometry involved grit papers of 400, 1000, 1200, 2000 and 4000 for 10 min each, by Struers LaboPol-2 grinding, lapping and polishing machine.
2.3. Computational Details
The KNN [26] and SVC [27] algorithms were used to perform classification of nanoindentation data. In order to deal with imbalanced original training sets, undersampling and SMOTE algorithms [18] were involved to balance classification populations. The caret and e1017 packages were used to implement the KNN, SVM, and tuning (accessed date: 1 August 2019) in R 3.6.1. Synthpop, tidyverse, sampling, and partykit (accessed date: 16 August 2019) in R 3.6.1 were used to implement the undersampling and SMOTE computation. The final SVM models were constructed and validated using the same caret package. All statistical calculations were performed using R 3.6.1 on 64-bit Windows 10 Home (Intel® Core™ i5-8250U CPU @ 1.60 GHz, 1801 Mhz, 4 Cores, 8 Logical Processors and 8.00 GB RAM). Computational time did not exceed a few minutes, except from the polynomial SVC kernel, which required 40 min in order to be tuned to optimum prediction accuracy.
2.4. Statistical Metrics
In order to evaluate the performance of the prediction model, commonly adopted statistical metrics were measured. The use of Accuracy, Precision, Recall, F1 was performed in each case [28,29,30], after tuning each model to optimum Accuracy after parameterization.
True positives (TP) represent correct classifications of reinforcement mechanisms (positive sample), true negatives (TN) symbolize correct classifications of negative samples, false positives (FP) signify the incorrect classifications of negative predictions into positive, and false negatives (FN) denote positive samples that were incorrectly identified as negative samples. Recall is the proportion of positive samples that were correctly classified. Precision is the proportion of positive samples out of the sum of positive observations. F1 score is used to evaluate the model ability to classify (best value: 1).
3. Results and Discussion
3.1. Nanoindentation Mapping and Data Clustering
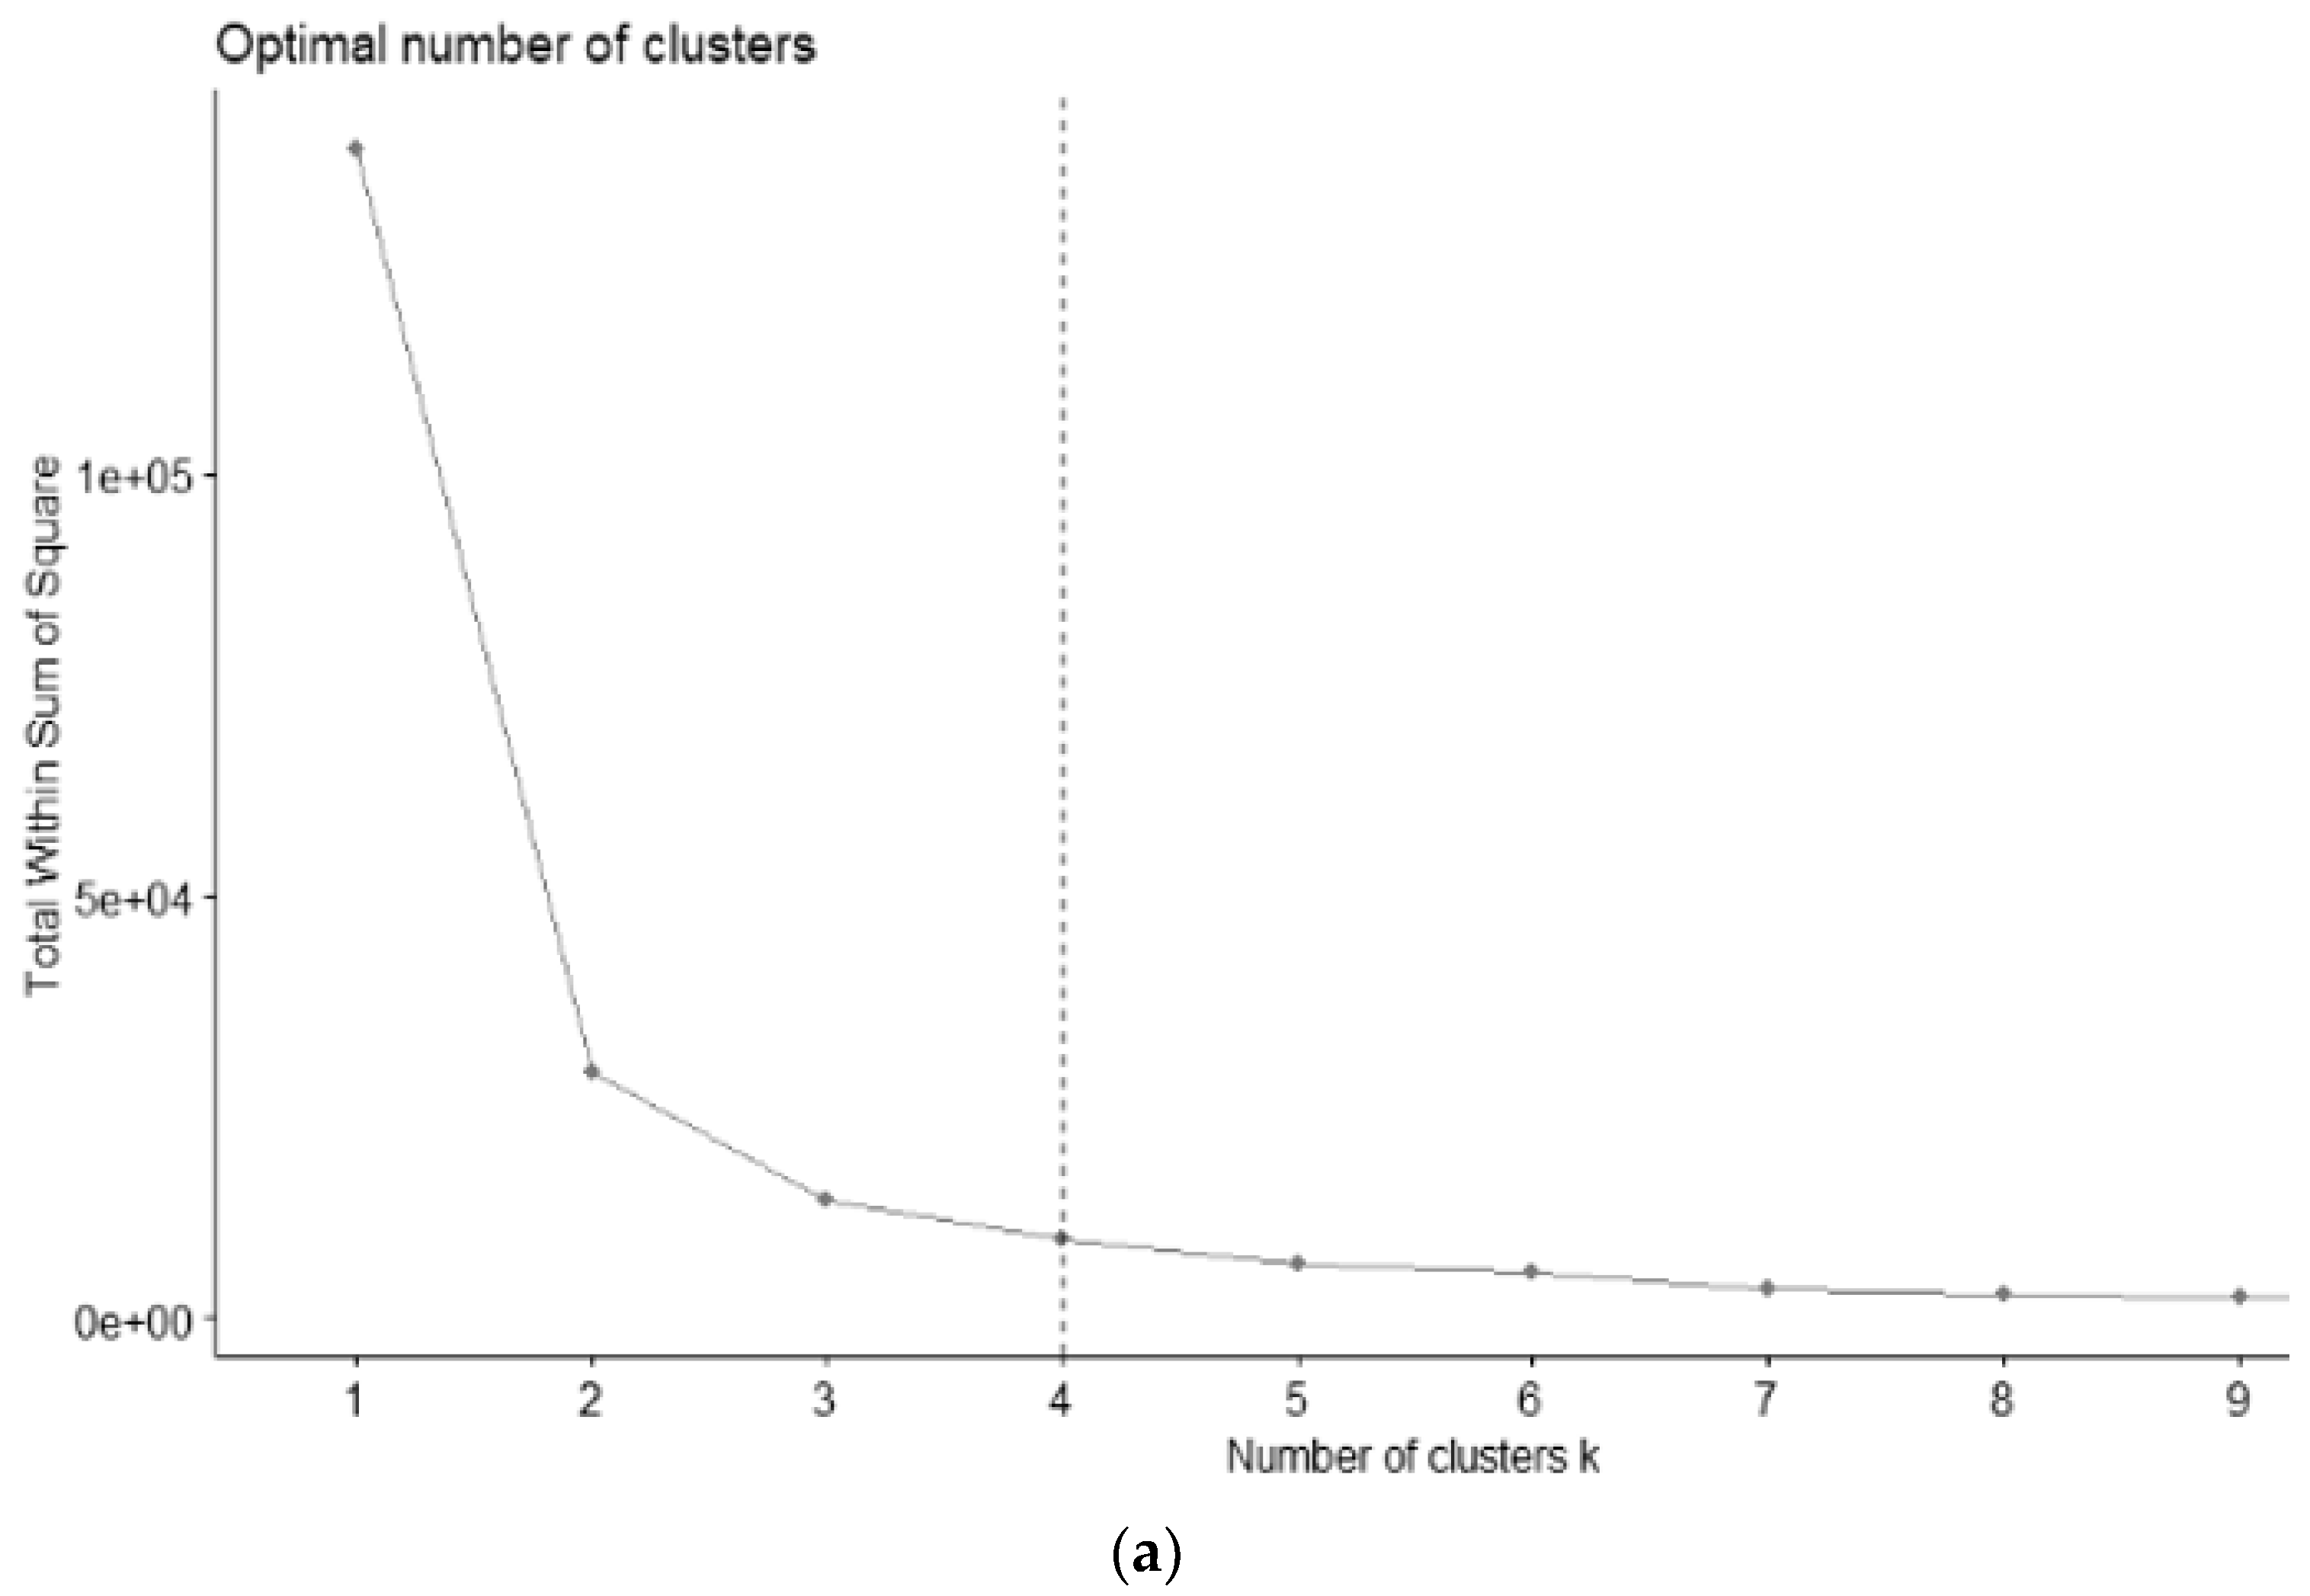
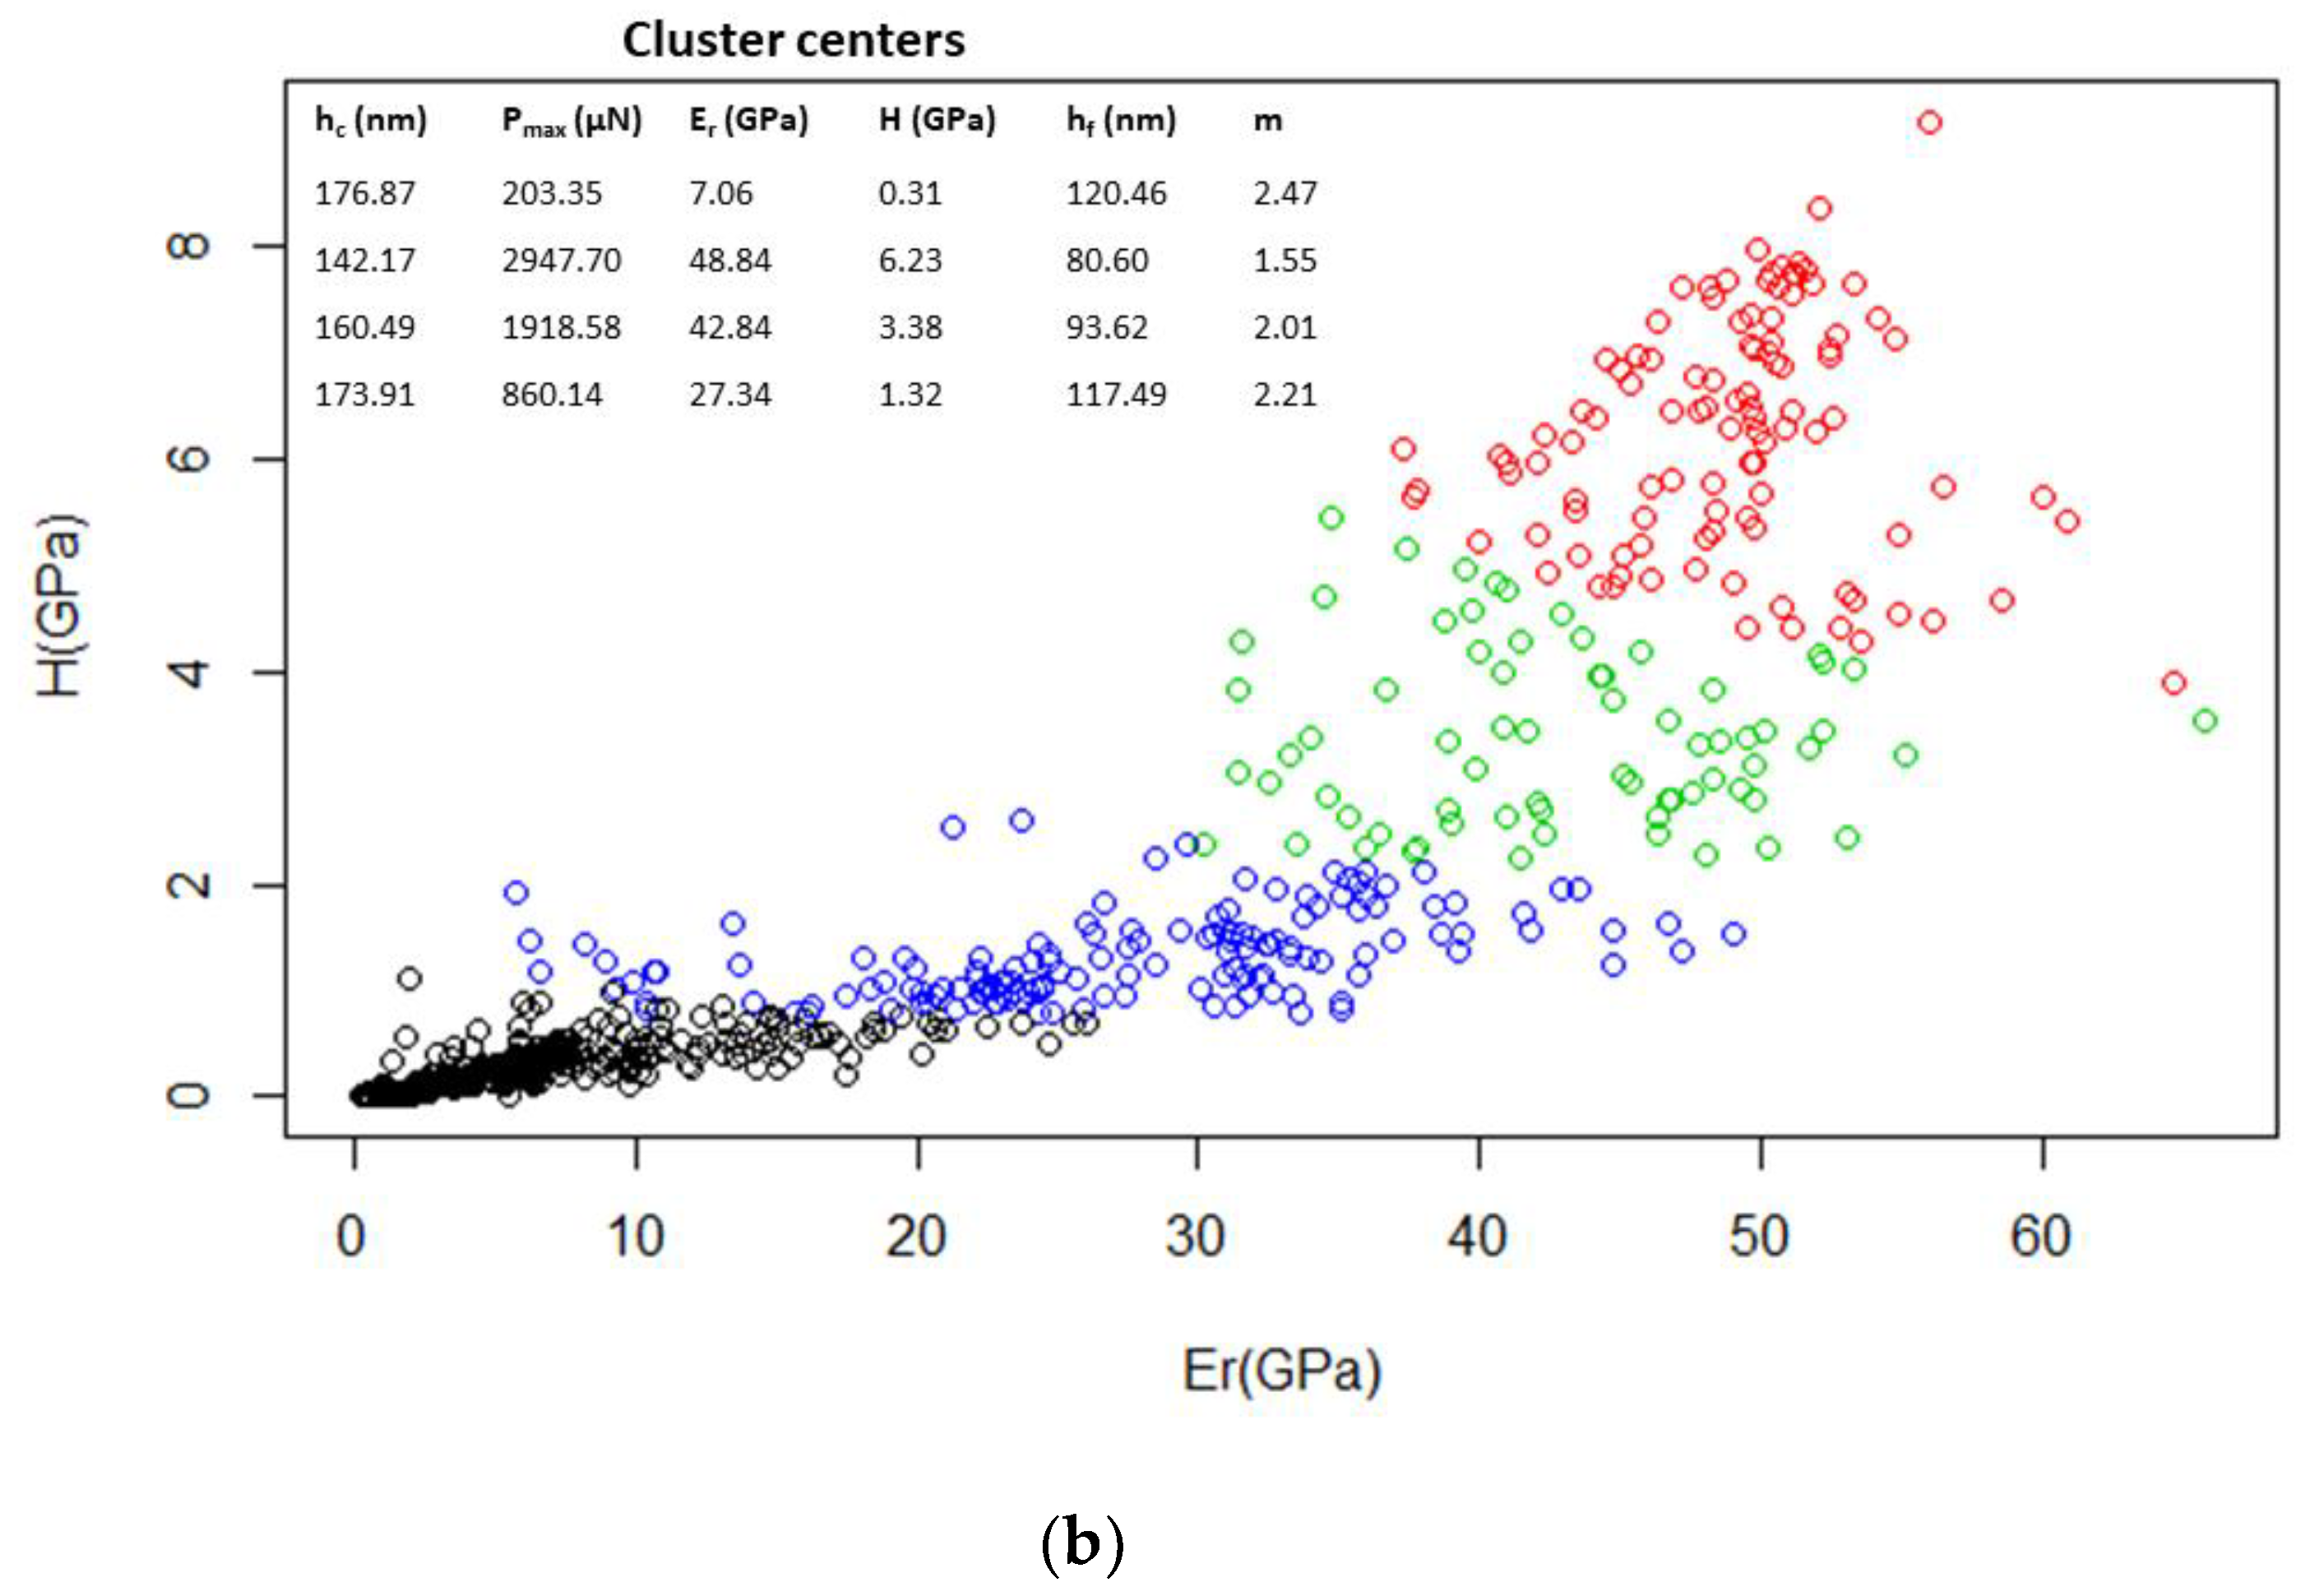
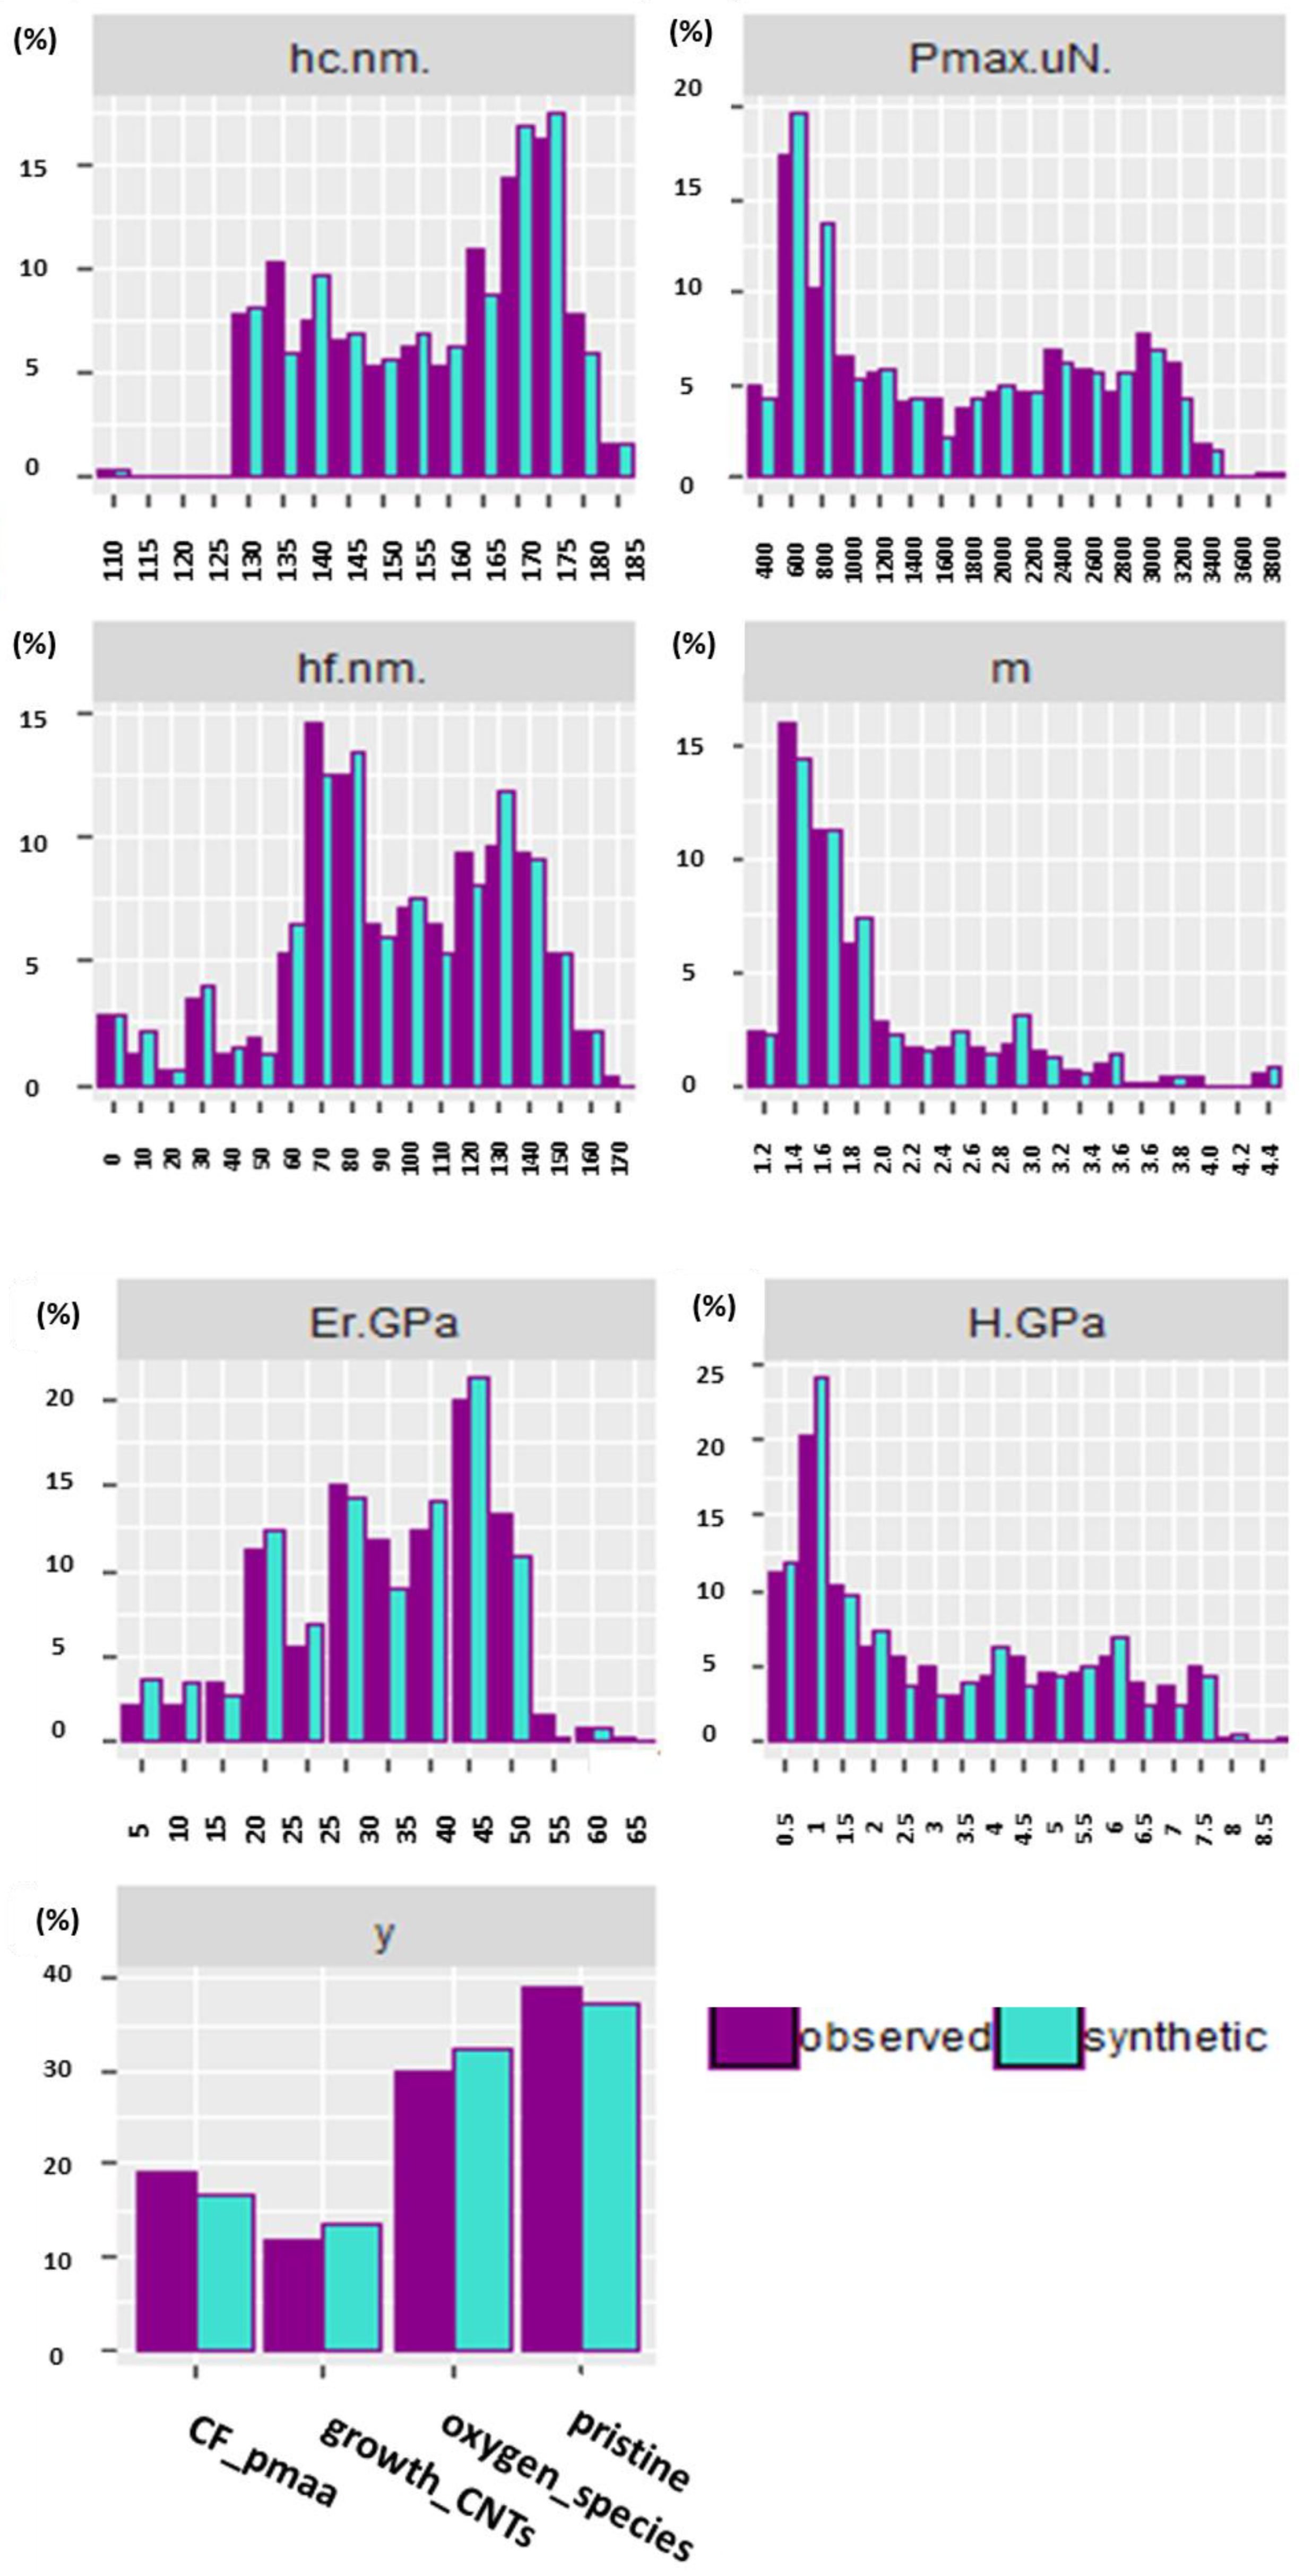
CFRP specimens were tested with nanoindentation and the methodology to perform quantitative mapping of Er is described. As derived by load-displacement curves, which were fitted with the Oliver–Pharr model [31], the Er was measured for each nanoindentation event. A total of 6 attributes generated by nanoindentation testing raw data were used to perform data clustering and establish unsupervised connections of these features to the identity of the CFRP phase. Parameters of contact depth (hc in nm), maximum force (Pmax in μN), Er (in GPa), nanohardness (H in GPa), final depth after fully unloaded (hf in nm), and m is determined by a least square fitting procedure.
The optimum number of clusters was calculated according to using the elbow method [32]. The optimum number was 4 (Figure 1a), but the physical problem suggested that clusters can be more (Table 1). In this case, the data were clustered in four groups using R Studio, namely epoxy matrix, CF interface, CF, and the “reinforcement” cluster (Figure 1b, Table 1).
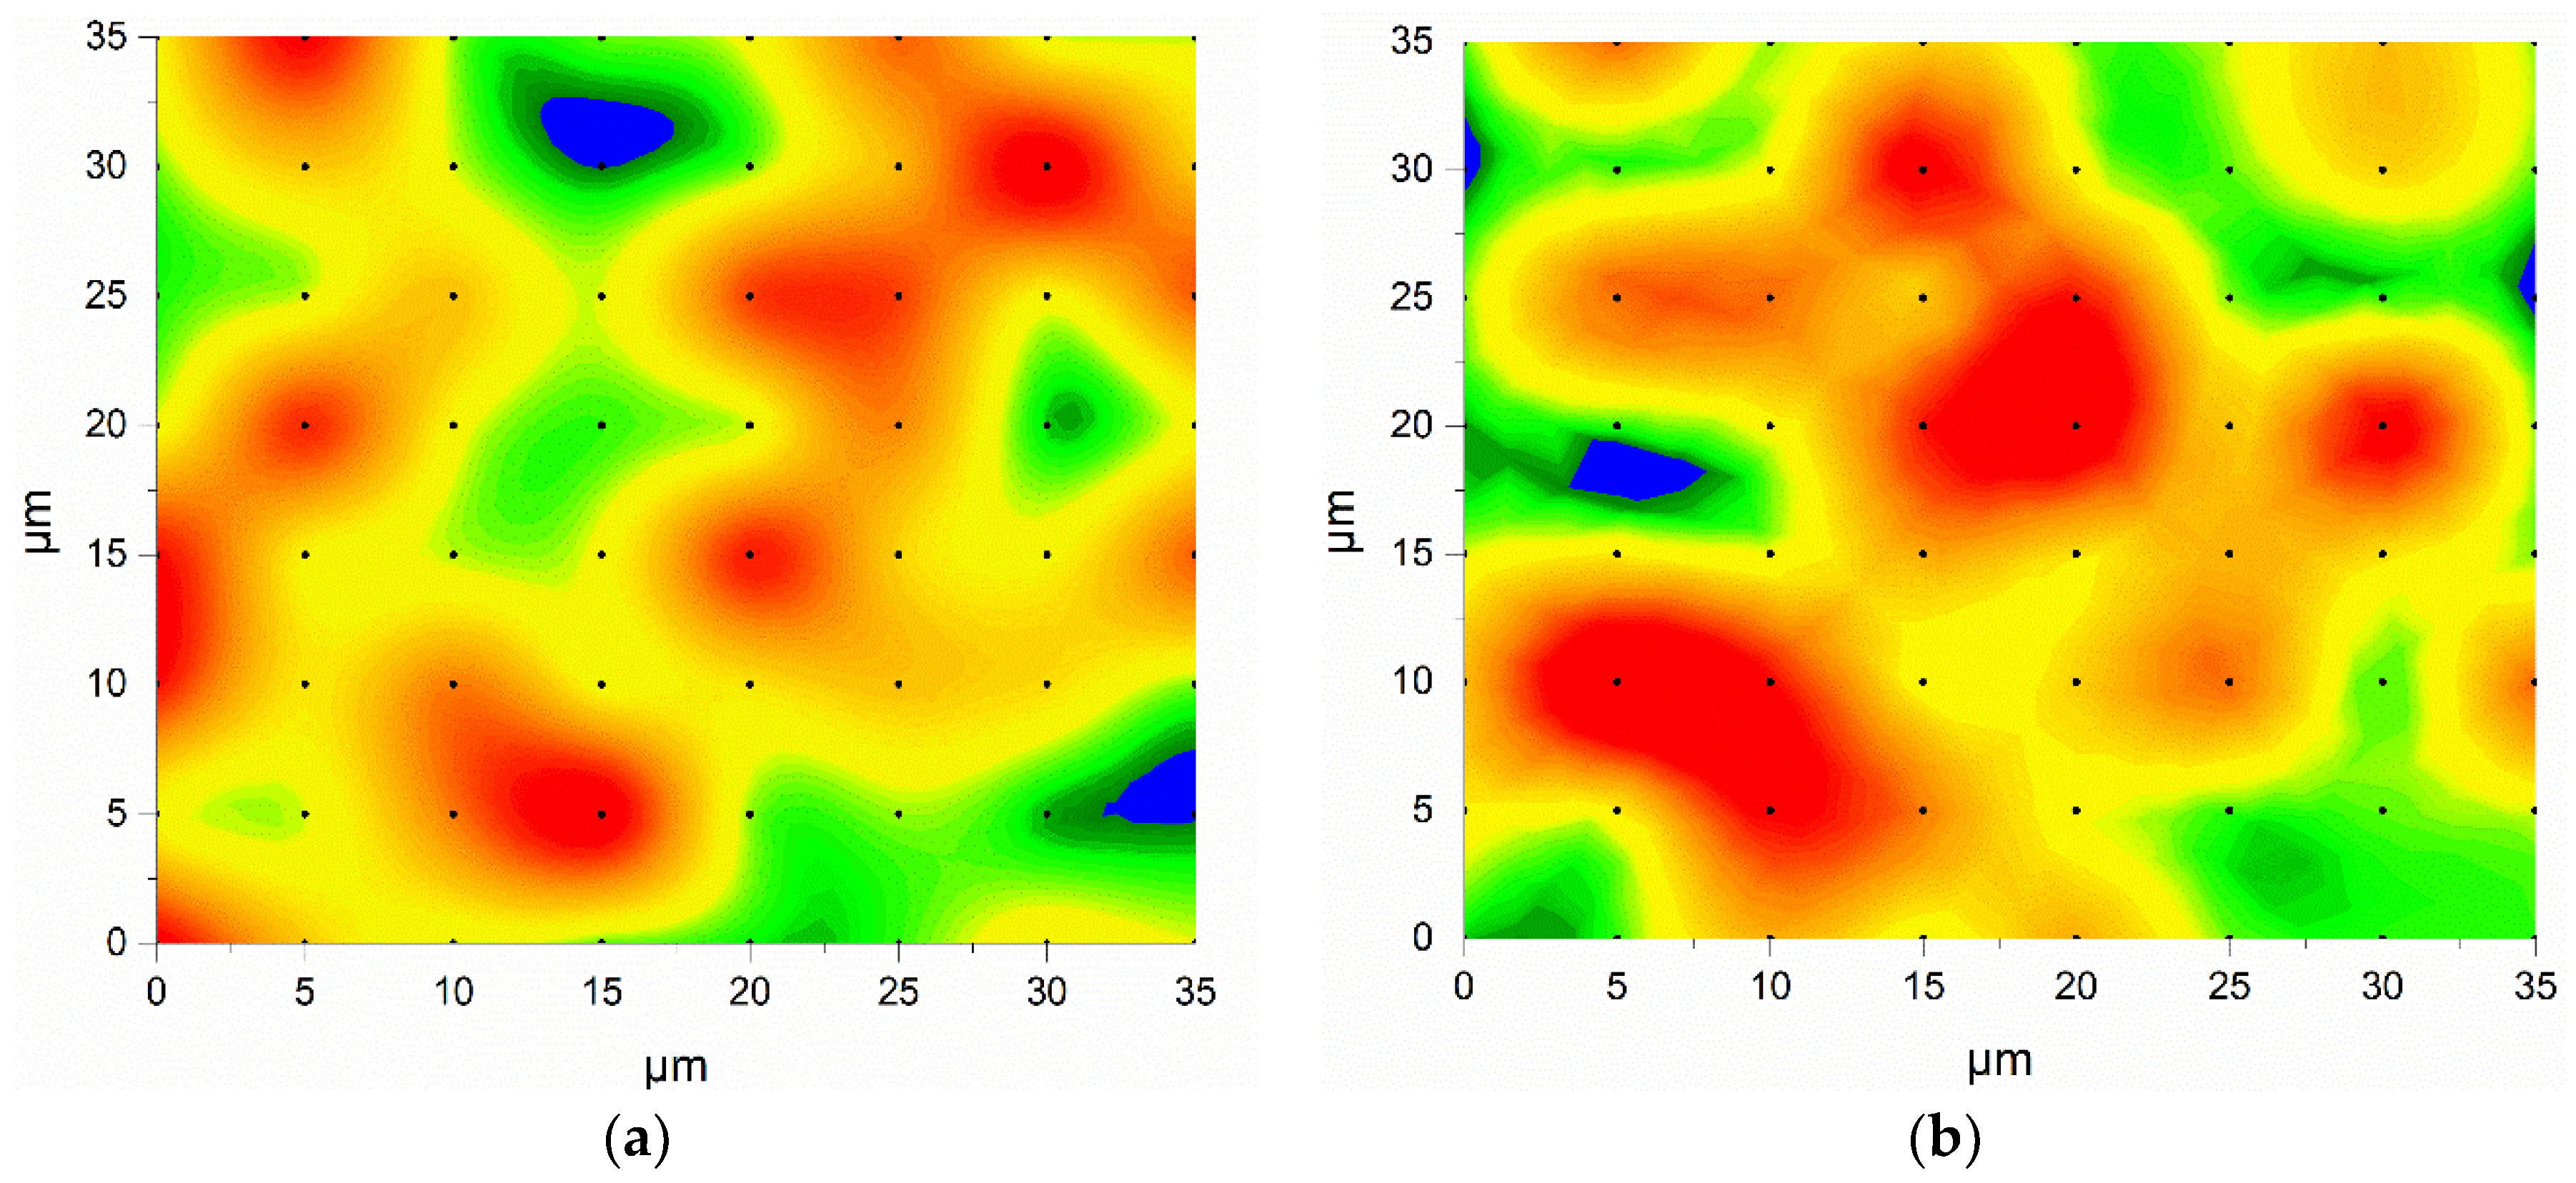
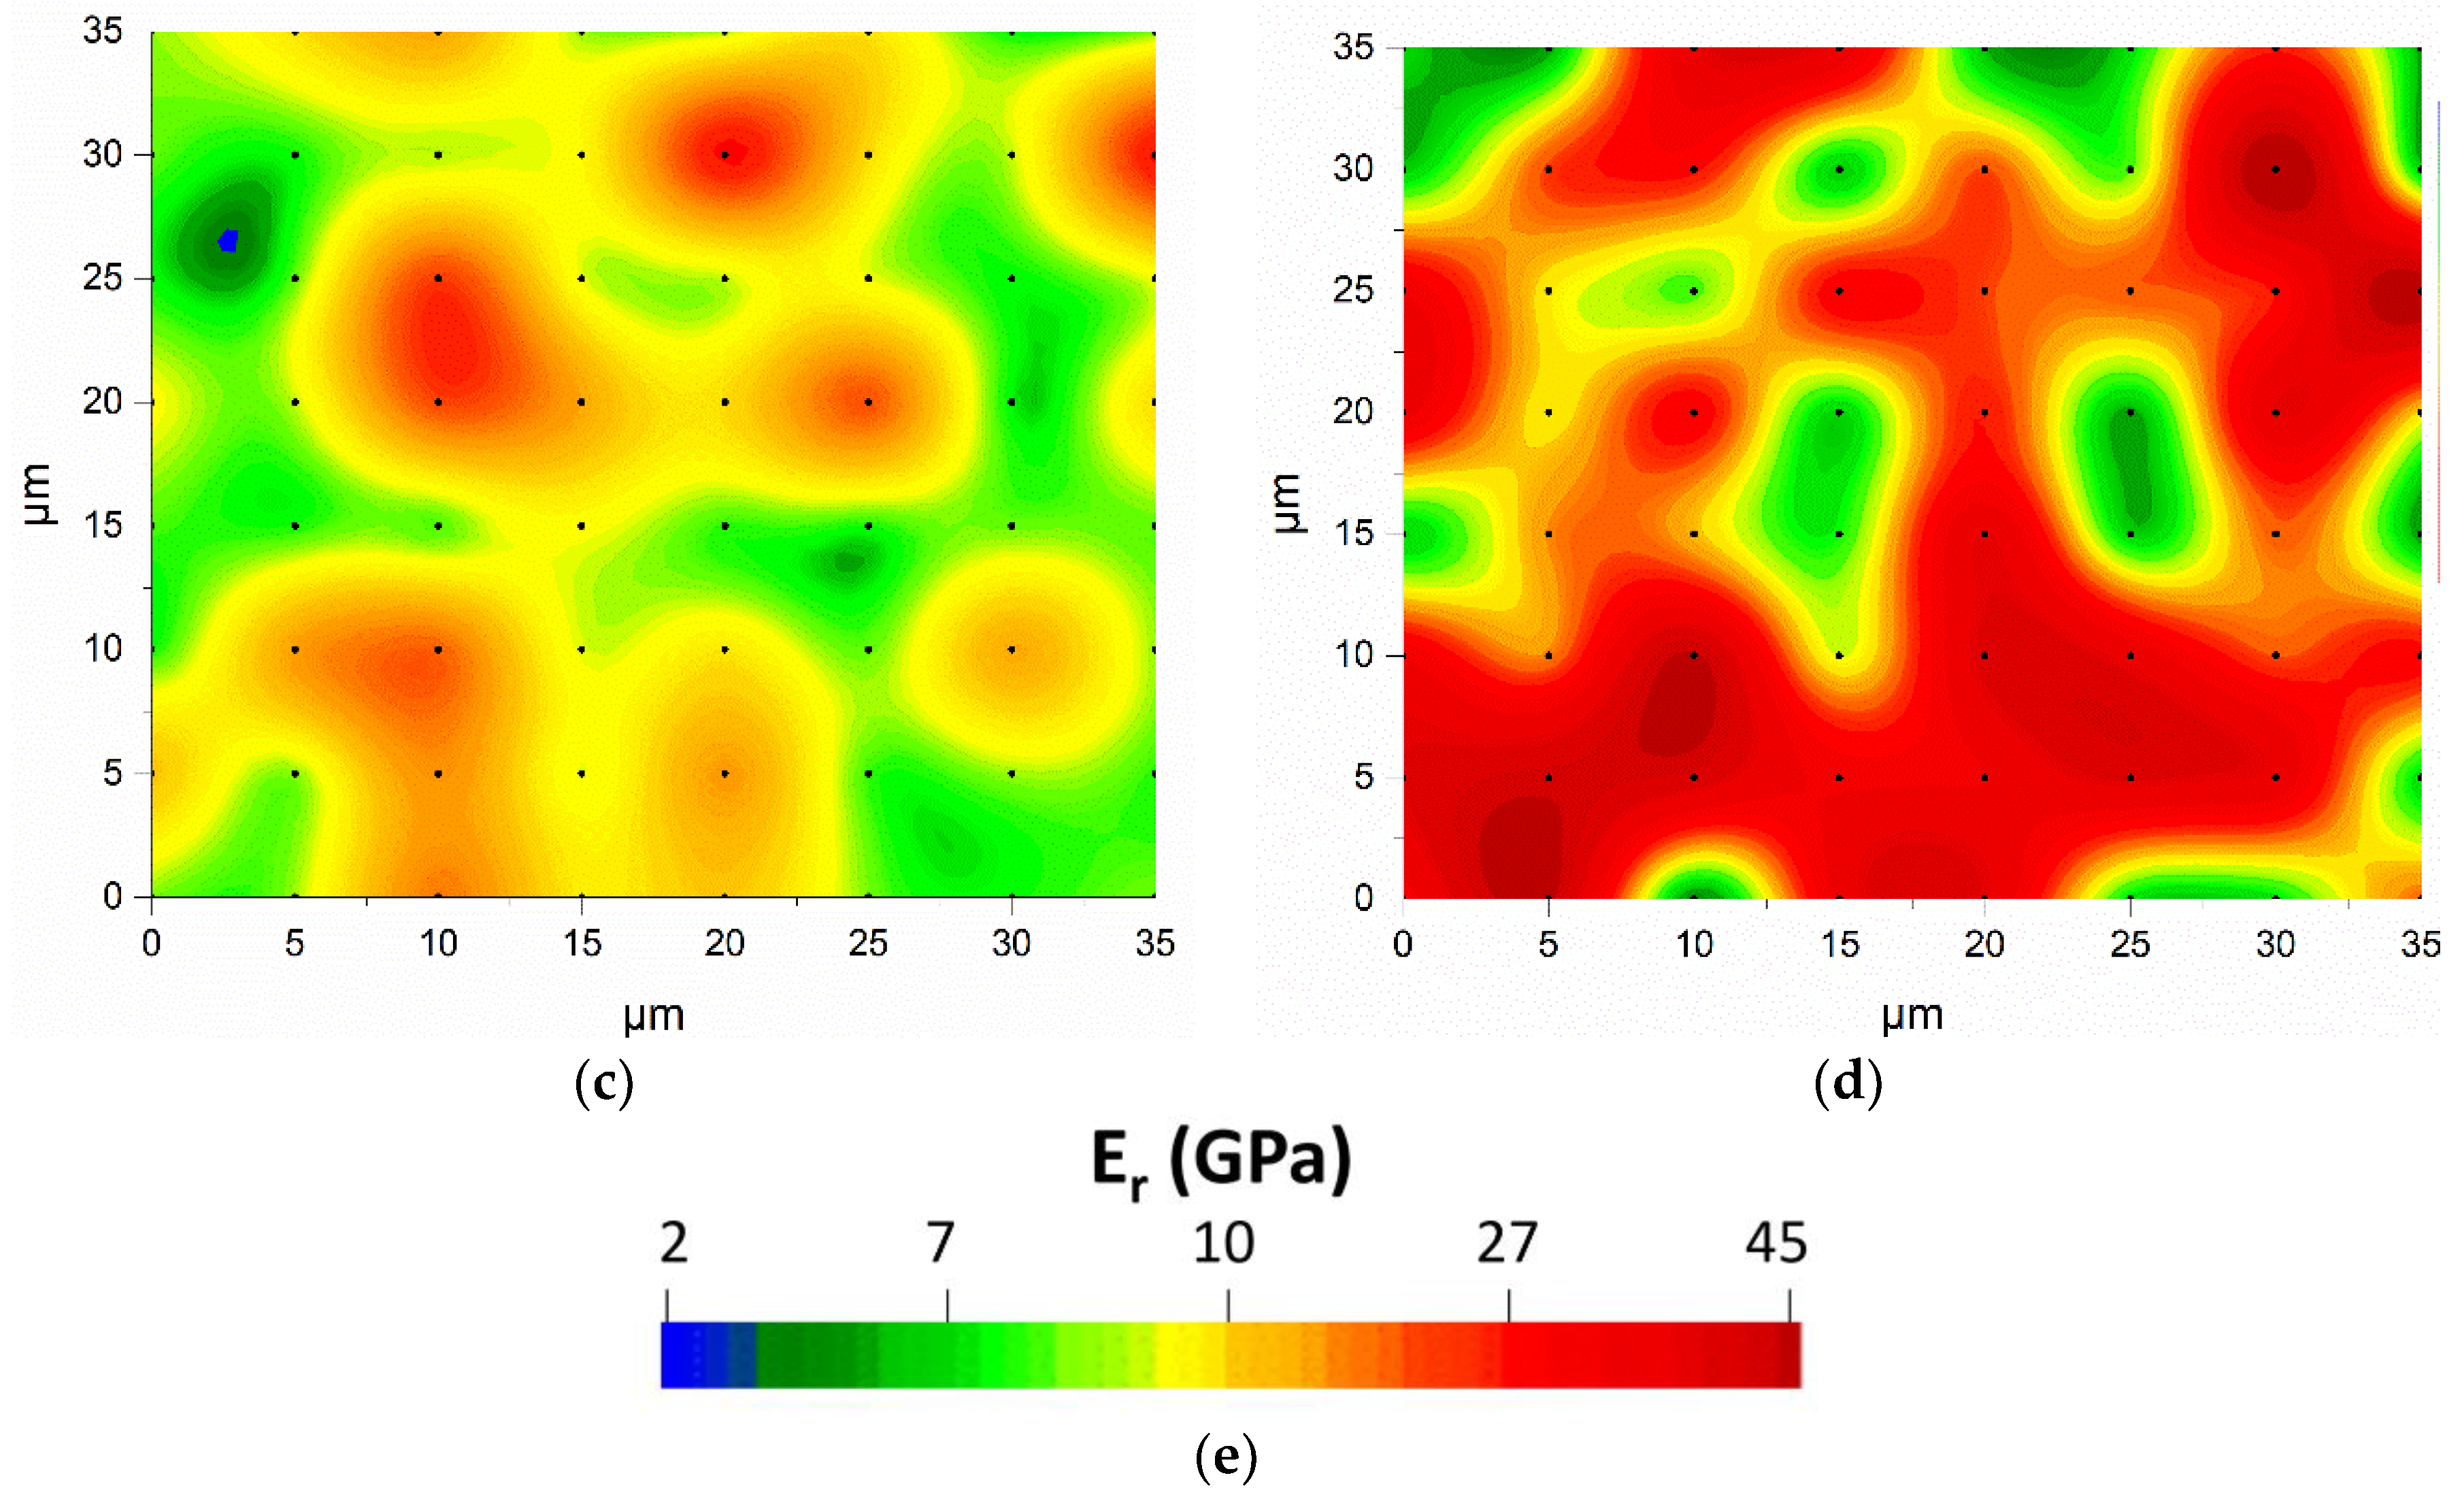
Information obtained by Table 1 was used to correlate colors, increment from blue to red to increment of Er as depicted in Figure 2.
By the observation of the colormap, it is possible to make assumptions over the composite performance upon a different reinforcement mechanism. A robust mechanical response is obtained in the case of PMAA and carbon nanotubes compared to the pristine specimen, while another positive feature is the gradual continuity of interface, which allows uniform load transfer. Additionally, composite attributes attained the properties of CFs in a high extend in the case of carbon nanotube reinforcement (Figure 2d), as determined by k-means microstructure clustering. Low pressure plasma treatment demonstrated slightly deteriorated reduced elastic modulus overall, compared to the pristine specimen.
3.2. Descriptor Preprocessing
Epoxy matrix is not correlated to the mechanism of reinforcement, and these data do not contribute to identification of the reinforcement by surface modification of CFs. As a result, it was reasonable to remove these data using R language. After performing k-means clustering, the epoxy matrix nanoindentation events with a mean value of Er of about 7 GPa were not included by using library “dplyr” in order to obtain a proper descriptor of reinforcement and enhance classification model performance.
3.3. Split of Training and Test Sets
A leave-some-out (LSO) method was used to create a random partition split into a 70% training set used for model construction, and a 30% test set for holdout validation on observations. In detail, datasets of untreated CFRPs were used as reference, while CFRPs with CFs surface modification were included. Surface modification contained the introduction of oxygen species on the fiber surface, the attachment of monomers (sizing formulations), and the growth of CNTs, which are commonly adapted in literature [3,4,5,6,7,8]. Seed of random numbers was called to achieve a statistically unbiased estimation. Then, the statistical metrics were calculated and reported for each case.
3.4. Results and Statistical Performance of Model Grid Tuning, Undersampling and SMOTE Setup
A KNN classification model was initially used, as it is reported to be efficient in small datasets due to the use of Euclidean distance to construct the model [44]. However, as demonstrated in Table 2, the KNN model does not function well in regard to the imbalanced dataset.
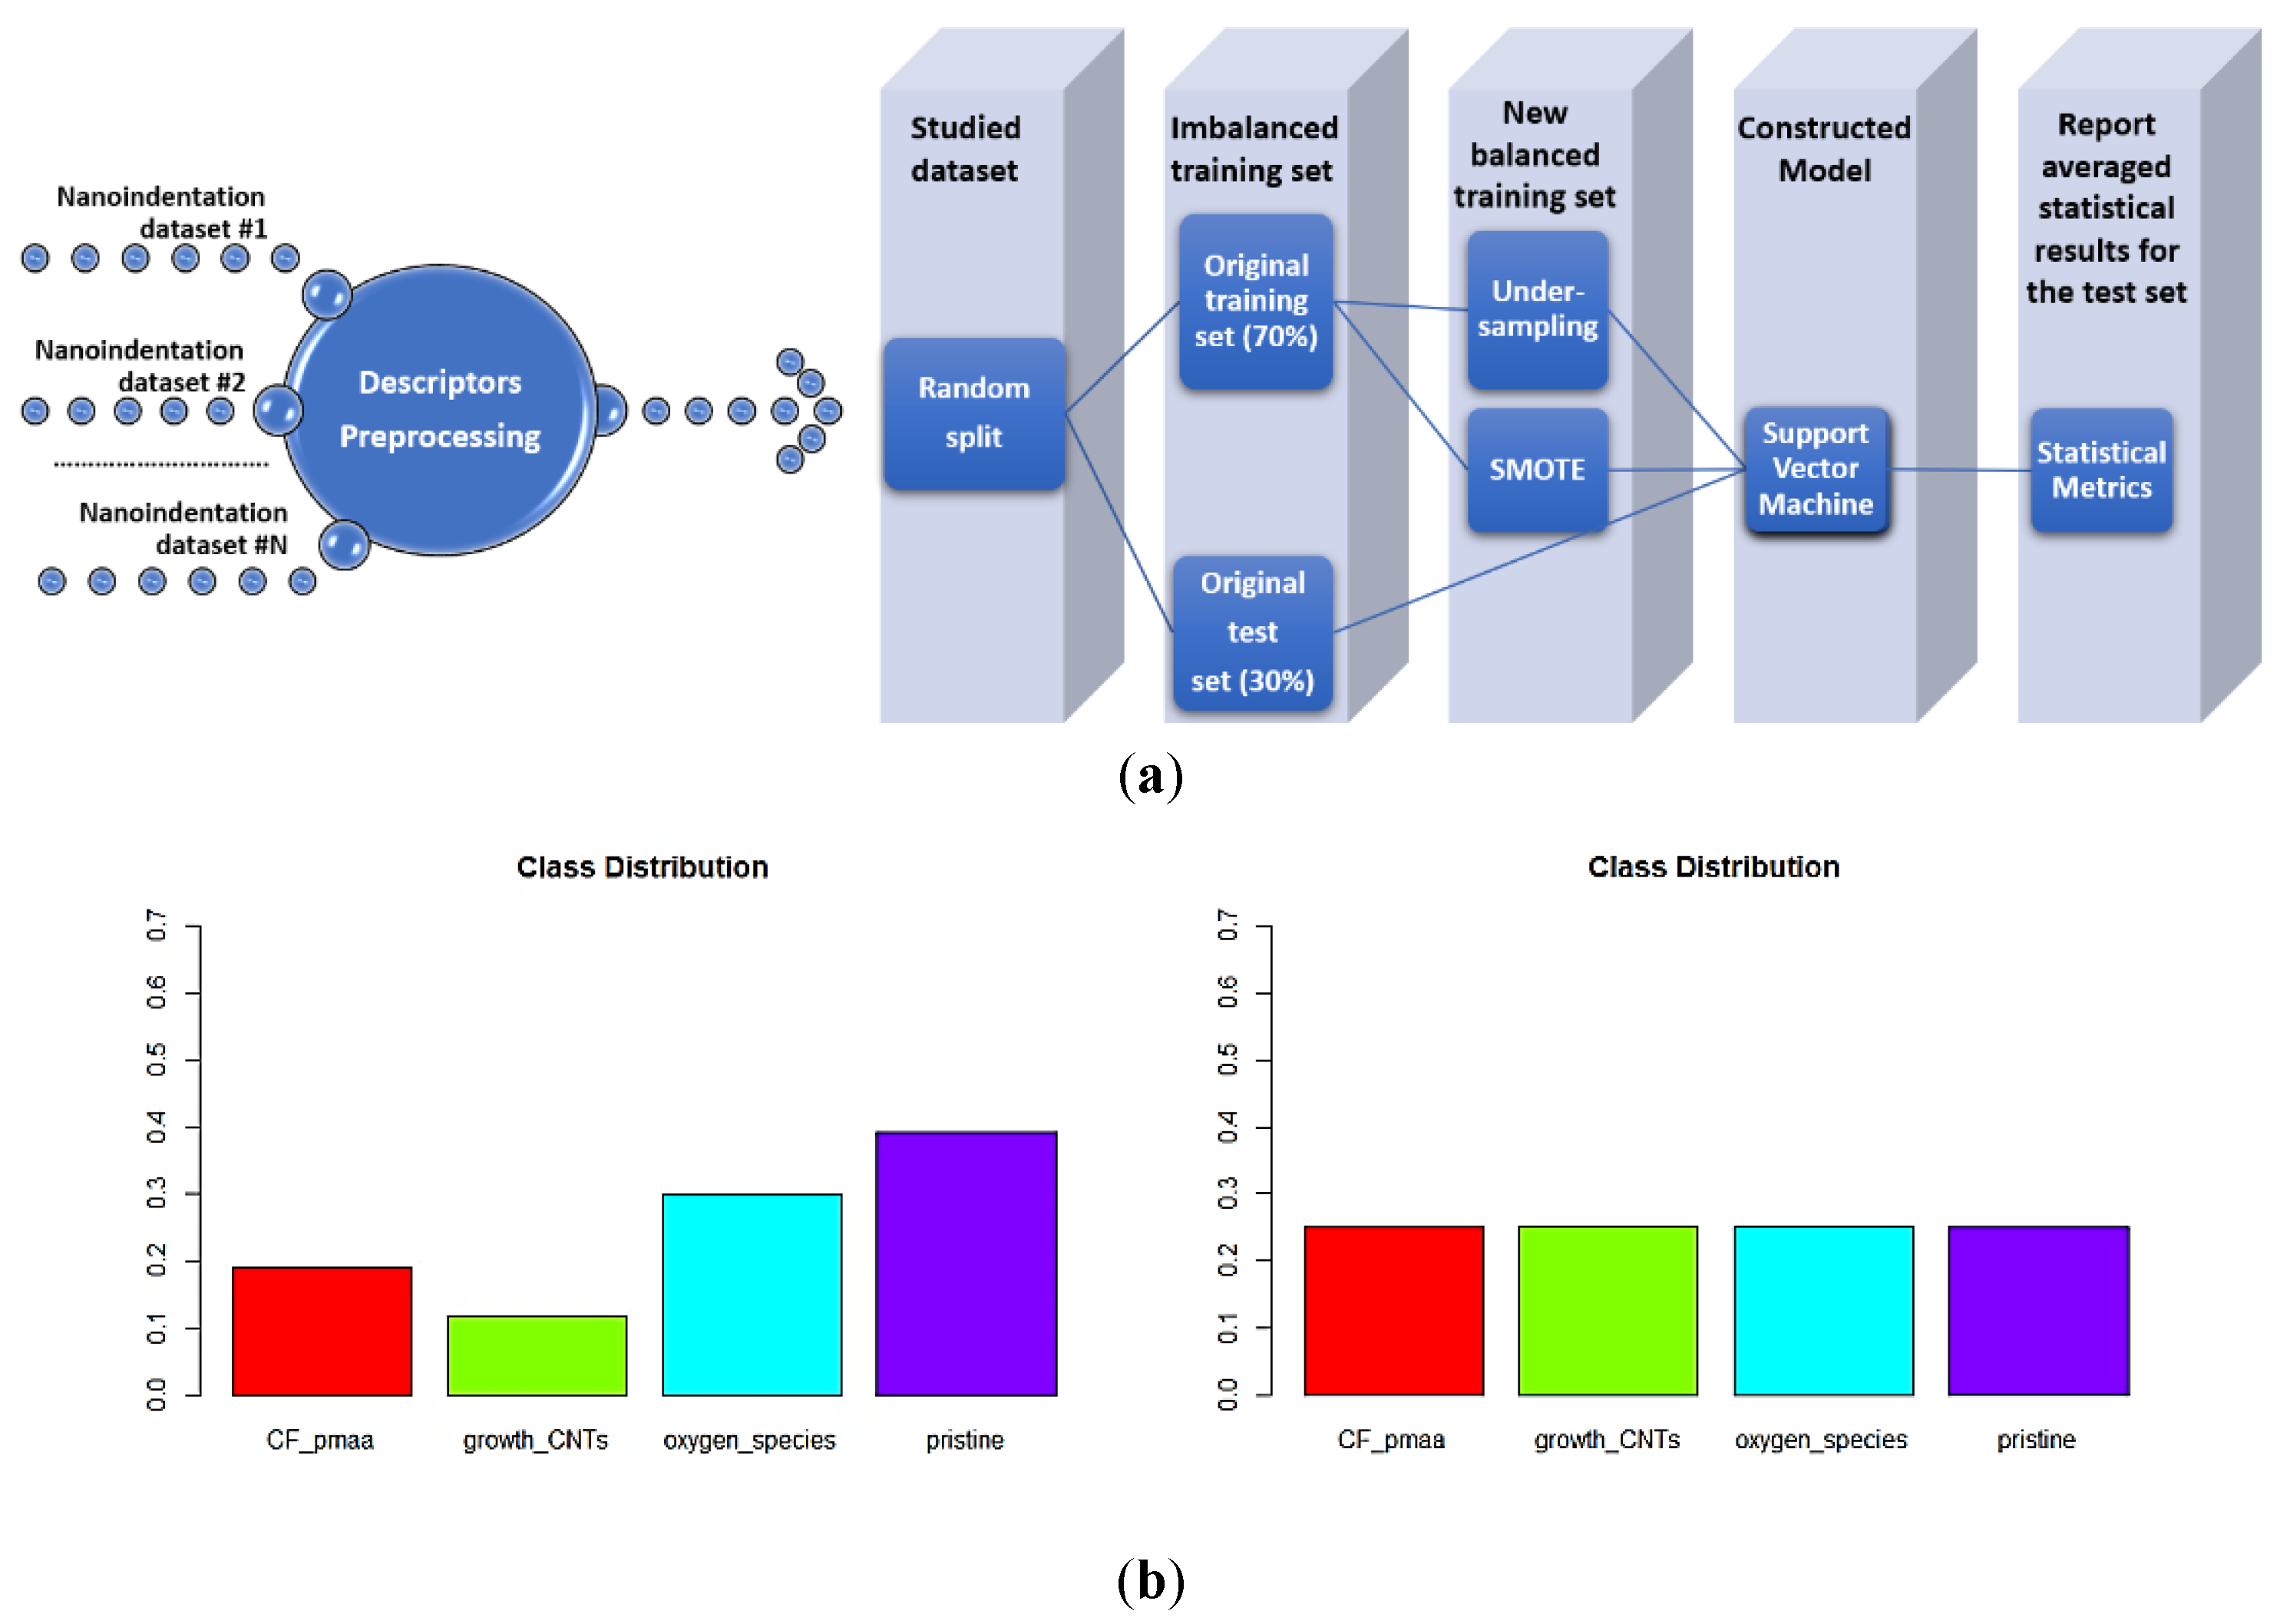
In this direction, SVM classification was employed in order to improve the metrics (Equations (1)–(4)) and resolve the issue of insufficient prediction efficiency of CF modified with PMAA and with oxygen species. Four different kernels were used in the analysis, namely sigmoidal, linear, radial, and polynomial kernel. The last was comparatively more descriptive. In all kernel cases studies, the model was optimized by grid tuning. The model input parameters values are, in the case of gamma, were tuned in-between 0.01, 0.05, 0.1, 0.2, 0.5, 1, 2, 4, 6, 8, and 10; and cost 1, 10, 50, 100, 200, 400, 1000, and 2000 in a total of 88 interactions. Polynomial kernel was tuned in two steps: firstly, optimal degree between 3, 4, 5, 6, 7, and Coef0 between 0.01, 0.1, 0.5, 1, 2, 4, 6, 8, 10, and 12 in a total of 50 interactions were selected. In the next step, gamma was tuned at values 0.01, 0.1, 0.5, 1, 4, while cost was ranging between 1, 10, 50, 100, 400, 1000, 2000 in a total of 30 interactions. The flow chart is summarized in Figure 3.
Optimized SVM model with polynomial kernel was obtained at (degree, Coef0, gamma, cost): (3, 0.5, 0.01, 100) and results are presented in Table 3.
The F1 values of CF_pmaa and oxygen_species are still considered low. Regarding the fact that this result is affected by the imbalanced dataset, undersampling methodology was used. The selected data population was random and representative of each class. The model was tuned at (degree, Coef0, gamma, cost): (4, 2, 0.1, 50) using a polynomial kernel.
The reduction of the data population to 144 observations lead to inability of this model to classify the mechanism of reinforcement in most cases (Table 4). This may be attributed to the undersampling risk of losing important information contained in the majority class [15], especially in small datasets. Consequently, it would be ideal if oversampling is performed and each class population reaches the number of majority class observations. However, lack of data in this case identifies SMOTE (selective oversampling of minority classes) as a more appropriate strategy to handle the imbalanced dataset. Synthetic data were produced by using package “synthpop.” The results are reproducible and representative for each class (Figure 4), in order to create the new training dataset. The model was tuned at (degree, Coef0, gamma, cost): (6, 0.5, 0.1, 1). Afterwards, an original test set was used to evaluate the model functionality.
As it is evidenced by Table 5, SMOTE strategy was more appropriate to deal with the imbalanced dataset and achieve better metrics of SVM model. F1 score is improved regarding the overall performance and could enable the detection of an unknown dataset.
3.5. Model Validation
For each class of reinforcement, a representative sample was obtained in order to validate the classification model. In Table 6, it evidenced that the maximum counts recognize the type of reinforcement in unknown specimens and could be used as a criterion for the effective application of the trained polynomial kernel SVM model.
4. Conclusions
In this work, an effective methodology is presented for constructing the Er mapping of a tested CFRP by using k-means algorithm. The quantitative map and cluster centers are correlated to literature reports, while five more nanoindentation data categories were clustered, which can support nanohardness, maximum load mapping, etc. The most promising prediction of SVM was improved by tackling imbalance issues by using typical undersampling and SMOTE strategies. Undersampling did not work well for the specific dataset, contrary to SMOTE through which an accuracy of 64.1% was reached. Additionally, F1 score, which is generated by the contribution of recall and precision metrics, ranged between 42.1% and 73.3%. As a validation, for the functionality of the classification model, random datasets were tested in order to monitor classification ability. In all cases, the maximum number of classified nanoindentation events leads to the correct detection of mechanism of reinforcement, and consequently, F1 scores were identified as sufficient for the case of classification in the nanoindentation case.
The effect of modification of carbon fibers surface was examined; reinforcement of the interface was correlated to three ontological subclasses of reinforcement type class, namely the growth of fibrous nanotubes (high aspect ratio), the addition of oxygen functional groups on the graphitic crystal lattice of carbon fibers, and the electrodeposition of thin films using acrylic monomers. In this case, the structure-property relations are established using Machine Learning models in order to describe efficiently relevant cases of an interface reinforcement type class.
Author Contributions
Conceptualization, E.K. and G.K.; methodology, E.K. and G.K.; software, G.K.; validation E.K. and G.K.; formal analysis, E.K. and G.K.; investigation, E.K. and G.K.; resources, C.C. and E.K.; data curation, E.K. and G.K.; writing—original draft preparation, C.C., E.K. and G.K.; writing—review & editing, C.C., E.K. and G.K.; visualization, C.C., E.K. and G.K.; supervision, C.C., E.K. and G.K.; project administration, C.C. and E.K.; funding acquisition, C.C. and E.K. All authors have read and agreed to the published version of the manuscript.
Funding
Τhis research was funded by the EU H2020 Project “Modified Cost Effective Fiber Based Structures With Improved Multi-Functionality And Performance” (MODCOMP) Under Grant Agreement No. 685844 And The Eu H2020 Project “Smart By Design And Intelligent By Architecture For Turbine Blade Fan And Structural Components Systems” (SMARTFAN) under Grant Agreement no. 760779.
Conflicts of Interest
The authors declare no conflict of interest.
References
- Newcomb, B.A. Processing, structure and properties of carbon fibers. Compos. Part A Appl. Sci. Manuf. 2016, 91, 262–282. [Google Scholar] [CrossRef]
- Sidorina, A.I.; Gunyaeva, A.G. Market for Carbon Fibres and Composites Based on them. A review. Fibre Chem. 2017, 48, 306–310. [Google Scholar] [CrossRef]
- Xiao, C.; Tan, Y.; Wang, X.; Gao, L.; Wang, L.; Qi, Z. Study on interfacial and mechanical improvement of carbon fiber/epoxy composites by depositing multi-walled carbon nanotubes on fibers. Chem. Phys. Lett. 2018, 703, 8–16. [Google Scholar] [CrossRef]
- Shi, C.; Lei, J.; Zhou, S.; Dai, X.; Zhang, L.-C. Microstructure and mechanical properties of carbon fibers strengthened Ni-based coatings by laser cladding: The effect of carbon fiber contents. J. Alloys Compd. 2018, 744, 146–155. [Google Scholar] [CrossRef]
- Wu, Q.; Zhao, R.; Liu, Q.; Jiao, T.; Zhu, J.; Wang, F. Simultaneous improvement of interfacial strength and toughness between carbon fiber and epoxy by introducing amino functionalized ZrO2 on fiber surface. Mater. Des. 2018, 149, 15–24. [Google Scholar] [CrossRef]
- Koumoulos, E.P.; Kainourios, P.; Charitidis, C.A. Assessing the integrity of CFRPs through nanomechanical mapping: The effect of CF surface modification. MATEC Web Conf. 2018, 188, 01006. [Google Scholar] [CrossRef]
- Reale Batista, M.D.; Drzal, L.T. Carbon fiber/epoxy matrix composite interphases modified with cellulose nanocrystals. Compos. Sci. Technol. 2018, 164, 274–281. [Google Scholar] [CrossRef]
- Hallad, S.A.; Banapurmath, N.R.; Hunashyal, A.M.; Shettar, A.S.; Ayachit, N.H.; Mruthunjaya, A.K.; Lohit, R.B.; Uttur, M. Experimental investigation for graphene and carbon fibre in polymer-based matrix for structural applications. J. Appl. Res. Technol. 2017, 15, 297–302. [Google Scholar] [CrossRef]
- Tam, D.K.Y.; Ruan, S.; Gao, P.; Yu, T. High-performance ballistic protection using polymer nanocomposites. In Advances in Military Textiles and Personal Equipment; Woodhead Publishing: Cambridge, UK, 2012; pp. 213–237. [Google Scholar] [CrossRef]
- Koumoulos, E.P.; Tofail, S.A.M.; Silien, C.; De Felicis, D.; Moscatelli, R.; Dragatogiannis, D.A.; Bemporad, E.; Sebastiani, M.; Charitidis, C.A. Metrology and nano-mechanical tests for nano-manufacturing and nano-bio interface: Challenges & future perspectives. Mater. Des. 2018, 137, 446–462. [Google Scholar] [CrossRef] [Green Version]
- Vignesh, B.; Oliver, W.C.; Kumar, G.S.; Phani, P.S. Critical assessment of high speed nanoindentation mapping technique and data deconvolution on thermal barrier coatings. Mater. Des. 2019, 181, 108084. [Google Scholar] [CrossRef]
- Gibson, R.F. A review of recent research on nanoindentation of polymer composites and their constituents. Compos. Sci. Technol. 2014, 105, 51–65. [Google Scholar] [CrossRef]
- Koumoulos, E.P.; Paraskevoudis, K.; Charitidis, C.A. Constituents Phase Reconstruction through Applied Machine Learning in Nanoindentation Mapping Data of Mortar Surface. J. Compos. Sci. 2019, 3, 63. [Google Scholar] [CrossRef] [Green Version]
- Hao, M.; Wang, Y.; Bryant, S.H. An efficient algorithm coupled with synthetic minority over-sampling technique to classify imbalanced PubChem BioAssay data. Anal. Chim. Acta 2014, 806, 117–127. [Google Scholar] [CrossRef] [PubMed] [Green Version]
- Chang, C.Y.; Hsu, M.T.; Esposito, E.X.; Tseng, Y.J. Oversampling to overcome overfitting: Exploring the relationship between data set composition, molecular descriptors and predictive modeling methods. J. Chem. Inf. Model. 2013, 53, 958–971. [Google Scholar] [CrossRef]
- López, V.; Fernández, A.; Moreno-Torres, J.G.; Herrera, F. Analysis of preprocessing vs. cost-sensitive learning for imbalanced classification. Open problems on intrinsic data characteristics. Expert Syst. Appl. 2012, 39, 6585–6608. [Google Scholar] [CrossRef]
- Romanos, N.; Kalogerini, M.; Koumoulos, E.P.; Morozinis, A.K.; Sebastiani, M.; Charitidis, C. Innovative Data Management in advanced characterization: Implications for materials design. Mater. Today Commun. 2019, 20, 100541. [Google Scholar] [CrossRef]
- Kegelmeyer, W.P.; Hall, L.O.; Bowyer, K.W.; Chawla, N.V. SMOTE: Synthetic Minority Over-sampling Technique. J. Artif. Intell. Res. 2002, 16, 321–357. [Google Scholar] [CrossRef]
- Breiman, L. Using Convex Pseudo-Data to Increase Prediction Accuracy; 513; University of California: Berkeley, CA, USA, 2000; pp. 1–18. [Google Scholar]
- Semitekolos, D.; Kainourgios, P.; Jones, C.; Rana, A.; Koumoulos, E.P.; Charitidis, C.A. Advanced carbon fibre composites via poly methacrylic acid surface treatment; surface analysis and mechanical properties investigation. Compos. Part B Eng. 2018, 155, 237–243. [Google Scholar] [CrossRef]
- Kainourgios, P.; Kartsonakis, I.A.; Dragatogiannis, D.A.; Koumoulos, E.P.; Goulis, P.; Charitidis, C.A. Electrochemical surface functionalization of carbon fibers for chemical affinity improvement with epoxy resins. Appl. Surf. Sci. 2017, 416, 593–604. [Google Scholar] [CrossRef]
- Termine, S.; Trompeta, A.-F.A.; Dragatogiannis, D.A.; Charitidis, C.A. Novel CNTs grafting on carbon fibres through CVD: Investigation of epoxy matrix/fibre interface via nanoindentation. In Proceedings of the 9th EASN International Conference on Innovation in Aviation & Space, Athens, Greece, 3–6 September 2019. [Google Scholar]
- Perez, J.J. Managing molecular diversity. Chem. Soc. Rev. 2005, 34, 143–152. [Google Scholar] [CrossRef]
- Tiwari, A.; Natarajan, S. Applied Nanoindentation in Advanced Materials; JohnWiley & Sons: Chichester, UK; Hoboken, NJ, USA, 2017. [Google Scholar]
- Hintsala, E.D.; Hangen, U.; Stauffer, D.D. High-Throughput Nanoindentation for Statistical and Spatial Property Determination. JOM 2018, 70, 494–503. [Google Scholar] [CrossRef] [Green Version]
- Zhang, S. Cost-Sensitive KNN Classification. Neurocomputing 2019. [Google Scholar] [CrossRef]
- Ben-Hur, A.; Technologies, B.; Horn, D.; Siegelmann, H.; Vapnik, V.; Critianini, N.; Shawe-Taylor, J.; Williamson, B. Support Vector Clustering. J. Mach. Learn. Res. 2002, 2, 125–137. [Google Scholar] [CrossRef]
- Tzimas, M.; Michopoulos, J.; Po, G.; Reid, A.C.E.; Papanikolaou, S. Inference and Prediction of Nanoindentation Response in FCC Crystals: Methods and Discrete Dislocation Simulation Examples. arXiv 2019, arXiv:1910.07587. [Google Scholar]
- Asch, V.V. Macro- and Micro-Averaged Evaluation Measures; Technical Report; CLiPS: Antwerpen, Belgium, 2013. [Google Scholar]
- Bangaru, S.S.; Wang, C.; Hassan, M.; Jeon, H.W.; Ayiluri, T. Estimation of the degree of hydration of concrete through automated machine learning based microstructure analysis—A study on effect of image magnification. Adv. Eng. Inform. 2019, 42, 100975. [Google Scholar] [CrossRef]
- Oliver, W.C.; Pharr, G.M. An improved technique for determining hardness and elastic modulus using load and displacement sensing indentation experiments. J. Mater. Res. 1992, 7, 1564–1583. [Google Scholar] [CrossRef]
- Bholowalia, P.; Kumar, A. EBK-Means: A Clustering Technique based on Elbow Method and K-Means in WSN. Int. J. Comput. Appl. 2014, 105, 17–24. [Google Scholar]
- Miyagawa, H.; Mase, T.; Sato, C.; Drown, E.; Drzal, L.T.; Ikegami, K. Comparison of experimental and theoretical transverse elastic modulus of carbon fibers. Carbon 2006, 44, 2002–2008. [Google Scholar] [CrossRef]
- Hardiman, M.; Vaughan, T.J.; McCarthy, C.T. Fibrous composite matrix characterisation using nanoindentation: The effect of fibre constraint and the evolution from bulk to in-situ matrix properties. Compos. Part A Appl. Sci. Manuf. 2015, 68, 296–303. [Google Scholar] [CrossRef]
- Sun, J.; Zhao, F.; Yao, Y.; Jin, Z.; Liu, X.; Huang, Y. High efficient and continuous surface modification of carbon fibers with improved tensile strength and interfacial adhesion. Appl. Surf. Sci. 2017, 412, 424–435. [Google Scholar] [CrossRef]
- Cole, D.P.; Henry, T.C.; Gardea, F.; Haynes, R.A. Interphase mechanical behavior of carbon fiber reinforced polymer exposed to cyclic loading. Compos. Sci. Technol. 2017, 151, 202–210. [Google Scholar] [CrossRef]
- Li, Y.; Li, M.; Gu, Y.; Zhang, Z.; Guan, P. Investigation of the nanoscale mechanical properties of carbon fiber/epoxy resin interphase. I. analysis of fiber-stiffening effect during the nanoindentation process based on numerical simulation. Polym. Compos. 2012, 33, 1387–1394. [Google Scholar] [CrossRef]
- Hardiman, M.; Vaughan, T.J.; McCarthy, C.T. A review of key developments and pertinent issues in nanoindentation testing of fibre reinforced plastic microstructures. Compos. Struct. 2017, 180, 782–798. [Google Scholar] [CrossRef]
- Díez-Pascual, A.M.; Gómez-Fatou, M.A.; Ania, F.; Flores, A. Nanoindentation Assessment of the Interphase in Carbon Nanotube-Based Hierarchical Composites. J. Phys. Chem. C 2012, 116, 24193–24200. [Google Scholar] [CrossRef]
- Sun, Y.; Zhao, G.; Yang, F. Anisotropic Behavior of the Nanoindentation of Single Carbon Fibers. Nanosci. Nanotechnol. Lett. 2014, 6, 596–600. [Google Scholar] [CrossRef]
- Chevalier, J.; Camanho, P.P.; Lani, F.; Pardoen, T. Multi-scale characterization and modelling of the transverse compression response of unidirectional carbon fiber reinforced epoxy. Compos. Struct. 2019, 209, 160–176. [Google Scholar] [CrossRef]
- Csanádi, T.; Németh, D.; Zhang, C.; Dusza, J. Nanoindentation derived elastic constants of carbon fibres and their nanostructural based predictions. Carbon 2017, 119, 314–325. [Google Scholar] [CrossRef] [Green Version]
- Gu, Y.; Li, M.; Wang, J.; Zhang, Z. Characterization of the interphase in carbon fiber/polymer composites using a nanoscale dynamic mechanical imaging technique. Carbon 2010, 48, 3229–3235. [Google Scholar] [CrossRef]
- Wang, L.; Khan, L.; Thuraisingham, B. An Effective Evidence Theory Based K-Nearest Neighbor (KNN) Classification. In Proceedings of the IEEE/WIC/ACM International Conference on Web Intelligence and Intelligent Agent Technology, Sydney, Australia, 9–12 December 2008; pp. 797–801. [Google Scholar]
Figure 1.
(a) Optimum number of clusters and (b) clustering of data using open source R language.


Figure 2.
Quantitative elastic modulus mapping of tested CFRP specimens: (a) pristine, (b) PMAA electropolymerized, (c) low pressure plasma modifies, and (d) with carbon nanotubes grown on carbon fiber surface; (e) represents the memo of Er.
Figure 2.
Quantitative elastic modulus mapping of tested CFRP specimens: (a) pristine, (b) PMAA electropolymerized, (c) low pressure plasma modifies, and (d) with carbon nanotubes grown on carbon fiber surface; (e) represents the memo of Er.


Figure 3.
(a) Flow chart for the proposed combinatorial algorithm with SVM and implemented methods for dealing with imbalanced datasets; and (b) probability distribution before and after balancing.
Figure 3.
(a) Flow chart for the proposed combinatorial algorithm with SVM and implemented methods for dealing with imbalanced datasets; and (b) probability distribution before and after balancing.

Figure 4.
Synthetic data versus original data.


Table 1.
Reduced elastic modulus of carbon fiber reinforced polymers (CFRPs) phases.
| CFRP Phases | Epoxy Matrix | Matrix (Fiber Constraint Effect) | CF Interface | CF Interphase/Tip in Mere Contact with CF | CF |
|---|---|---|---|---|---|
| Er (GPa) | 2–4 | 4–10 GPa | 10–28 | 28–40 | >40 |
| Reference | [33,34,35,36,37] | [34,37,38,39] | [34,36,40] | [34,36,40,41,42] | [36,40,43] |
| k-means centers (GPa) | 7 | 27 | 43 | 48 | |
Table 2.
Confusion matrix and metrics of k-Nearest Neighbor (KNN) model.
| KNN | CF PMAA | Growth CNTs | Oxygen Species | Pristine |
| CF PMAA | 0 | 0 | 3 | 0 |
| Growth CNTs | 5 | 9 | 5 | 0 |
| Oxygen species | 1 | 2 | 12 | 2 |
| Pristine | 11 | 0 | 13 | 29 |
| Metrics | CF PMAA | Growth CNTs | Oxygen species | Pristine |
| Accuracy | 0.543 | |||
| Precision | 0.000 | 0.818 | 0.364 | 0.935 |
| Recall | 0.000 | 0.474 | 0.706 | 0.547 |
| F1 | NaN | 0.600 | 0.480 | 0.690 |
Table 3.
Confusion matrix and metrics of Support Vector Machine (SVM) model.
| SVM | CF PMAA | Growth CNTs | Oxygen Species | Pristine |
| CF PMAA | 3 | 0 | 0 | 0 |
| Growth CNTs | 3 | 11 | 5 | 0 |
| Oxygen species | 1 | 0 | 7 | 5 |
| Pristine | 10 | 0 | 21 | 26 |
| Metrics | CF PMAA | Growth CNTs | Oxygen species | Pristine |
| Accuracy | 0.511 | |||
| Precision | 0.176 | 1.000 | 0.212 | 0.839 |
| Recall | 1 | 0.579 | 0.538 | 0.456 |
| F1 | 0.300 | 0.733 | 0.304 | 0.591 |
Table 4.
Confusion matrix and metrics of SVM model after undersampling.
| SVM: Undersampling | CF PMAA | Growth CNTs | Oxygen Species | Pristine |
| CF PMAA | 5 | 2 | 5 | 2 |
| Growth CNTs | 1 | 6 | 0 | 0 |
| Oxygen species | 4 | 2 | 1 | 6 |
| Pristine | 4 | 0 | 4 | 3 |
| Metrics | CF PMAA | Growth CNTs | Oxygen species | Pristine |
| Accuracy | 0.333 | |||
| Precision | 0.357 | 0.600 | 0.100 | 0.273 |
| Recall | 0.357 | 0.857 | 0.077 | 0.273 |
| F1 | 0.357 | 0.706 | 0.087 | 0.273 |
Table 5.
Confusion matrix and metrics of SVM model after Synthetic Minority Oversampling Techniques (SMOTE).
Table 5.
Confusion matrix and metrics of SVM model after Synthetic Minority Oversampling Techniques (SMOTE).
| SVM: SMOTE | CF PMAA | Growth CNTs | Oxygen Species | Pristine |
| CF PMAA | 4 | 0 | 2 | 2 |
| Growth CNTs | 4 | 11 | 4 | 0 |
| Oxygen species | 1 | 0 | 4 | 1 |
| Pristine | 2 | 0 | 1 | 8 |
| Metrics | CF PMAA | Growth CNTs | Oxygen species | Pristine |
| Accuracy | 0.614 | |||
| Precision | 0.364 | 1.000 | 0.364 | 0.727 |
| Recall | 0.500 | 0.579 | 0.667 | 0.727 |
| F1 | 0.421 | 0.733 | 0.471 | 0.727 |
Table 6.
Model validation using sample datasets of each class to already trained polynomial SVM.
| SVM Model | CF PMAA Validation Dataset | Growth CNTs Validation Dataset | Oxygen Species Validation Dataset | Pristine Validation Dataset |
|---|---|---|---|---|
| CF PMAA | 15 | 2 | 2 | 18 |
| Growth CNTs | 2 | 36 | 13 | 0 |
| Oxygen species | 10 | 0 | 20 | 3 |
| Pristine | 6 | 0 | 0 | 31 |
© 2019 by the authors. Licensee MDPI, Basel, Switzerland. This article is an open access article distributed under the terms and conditions of the Creative Commons Attribution (CC BY) license (http://creativecommons.org/licenses/by/4.0/).
Share and Cite
MDPI and ACS Style
Koumoulos, E.; Konstantopoulos, G.; Charitidis, C. Applying Machine Learning to Nanoindentation Data of (Nano-) Enhanced Composites. Fibers 2020, 8, 3. https://0-doi-org.brum.beds.ac.uk/10.3390/fib8010003
AMA Style
Koumoulos E, Konstantopoulos G, Charitidis C. Applying Machine Learning to Nanoindentation Data of (Nano-) Enhanced Composites. Fibers. 2020; 8(1):3. https://0-doi-org.brum.beds.ac.uk/10.3390/fib8010003
Chicago/Turabian StyleKoumoulos, Elias, George Konstantopoulos, and Costas Charitidis. 2020. "Applying Machine Learning to Nanoindentation Data of (Nano-) Enhanced Composites" Fibers 8, no. 1: 3. https://0-doi-org.brum.beds.ac.uk/10.3390/fib8010003
Note that from the first issue of 2016, this journal uses article numbers instead of page numbers. See further details here.