The Effect of Ecophysiological Traits on Live Fuel Moisture Content
by
 , , and
Alexandria L. Pivovaroff
1,*,† ,
,
Nathan Emery
2,
M. Rasoul Sharifi
3,
Marti Witter
4,
Jon E. Keeley
5 and
and
Philip W. Rundel
3 1
La Kretz Center for California Conservation Science, University of California, 619 Charles. E. Young Drive East, Los Angeles, CA 90095, USA
2
Department of Plant Biology, Michigan State University, 612 Wilson Road, East Lansing, MI 48824, USA
3
Department of Ecology and Evolutionary Biology, University of California, 612 Charles E. Young Drive South, Los Angeles, CA 90095, USA
4
National Park Service, Santa Monica Mountains National Recreation Area, 401 West Hillcrest Drive, Thousand Oaks, CA 91360, USA
5
United States Geological Survey, Western Ecological Research Center, Sequoia-Kings Canyon Field Station, 47050 Generals Highway, Three Rivers, CA 93271, USA
*
Author to whom correspondence should be addressed.
†
Current Address: Atmospheric Sciences and Global Change Division, Pacific Northwest National Lab, 902 Battelle Blvd, Richland, WA 99354, USA.
Fire 2019, 2(2), 28; https://0-doi-org.brum.beds.ac.uk/10.3390/fire2020028
Submission received: 5 April 2019
/
Revised: 6 May 2019
/
Accepted: 17 May 2019
/
Published: 22 May 2019
Abstract
:Live fuel moisture content (LFMC) is an important metric for fire danger ratings. However, there is limited understanding of the physiological control of LFMC or how it varies among co-occurring species. This is a problem for biodiverse yet fire-prone regions such as southern California. We monitored LFMC and water potential for 11 native woody species, and measured ecophysiological traits related to access to water, plant water status, water use regulation, and drought adaptation to answer: (1) What are the physiological mechanisms associated with changes in LFMC? and (2) How do seasonal patterns of LFMC differ among a variety of shrub species? We found that LFMC varied widely among species during the wet winter months, but converged during the dry summer months. Traits associated with LFMC patterns were those related to access to water, such as predawn and minimum seasonal water potentials (Ψ), and water use regulation, such as transpiration. The relationship between LFMC and Ψ displayed a distinct inflection point. For most species, this inflection point was also associated with the turgor loss point, an important drought-adaptation trait. Other systems will benefit from studies that incorporate physiological mechanisms into determining critical LFMC thresholds to expand the discipline of pyro-ecophysiology.
1. Introduction
Live fuel moisture content (LFMC) is a landscape-level management metric that, along with weather and topography, is incorporated into rate-of-spread models and fire danger ratings [1,2,3,4]. LFMC is expressed as the ratio of water content in fresh plant tissue to the dry weight and represents the amount of moisture that needs to evaporate from a fuel source before ignition can occur. Greater fuel moisture means reduced flammability and lower likelihood of ignition [5], hence LFMC has a major effect on combustion, fire spread, and fire consumption [6,7,8]. Yet, the relationship between LFMC and fire risk is not always linear. Instead, there are thresholds. For example, wildfire risk increases as LFMC decreases until a critical threshold is reached, and then the fire risk is constant and high [9]. However, recent studies suggest that these breakpoints need to be considered with caution as field-based and laboratory-based studies often show differing results related to the magnitude of the effect of LFMC on fire rate-of-spread [2,4,10]. Hence, further LFMC studies are needed to resolve these issues.
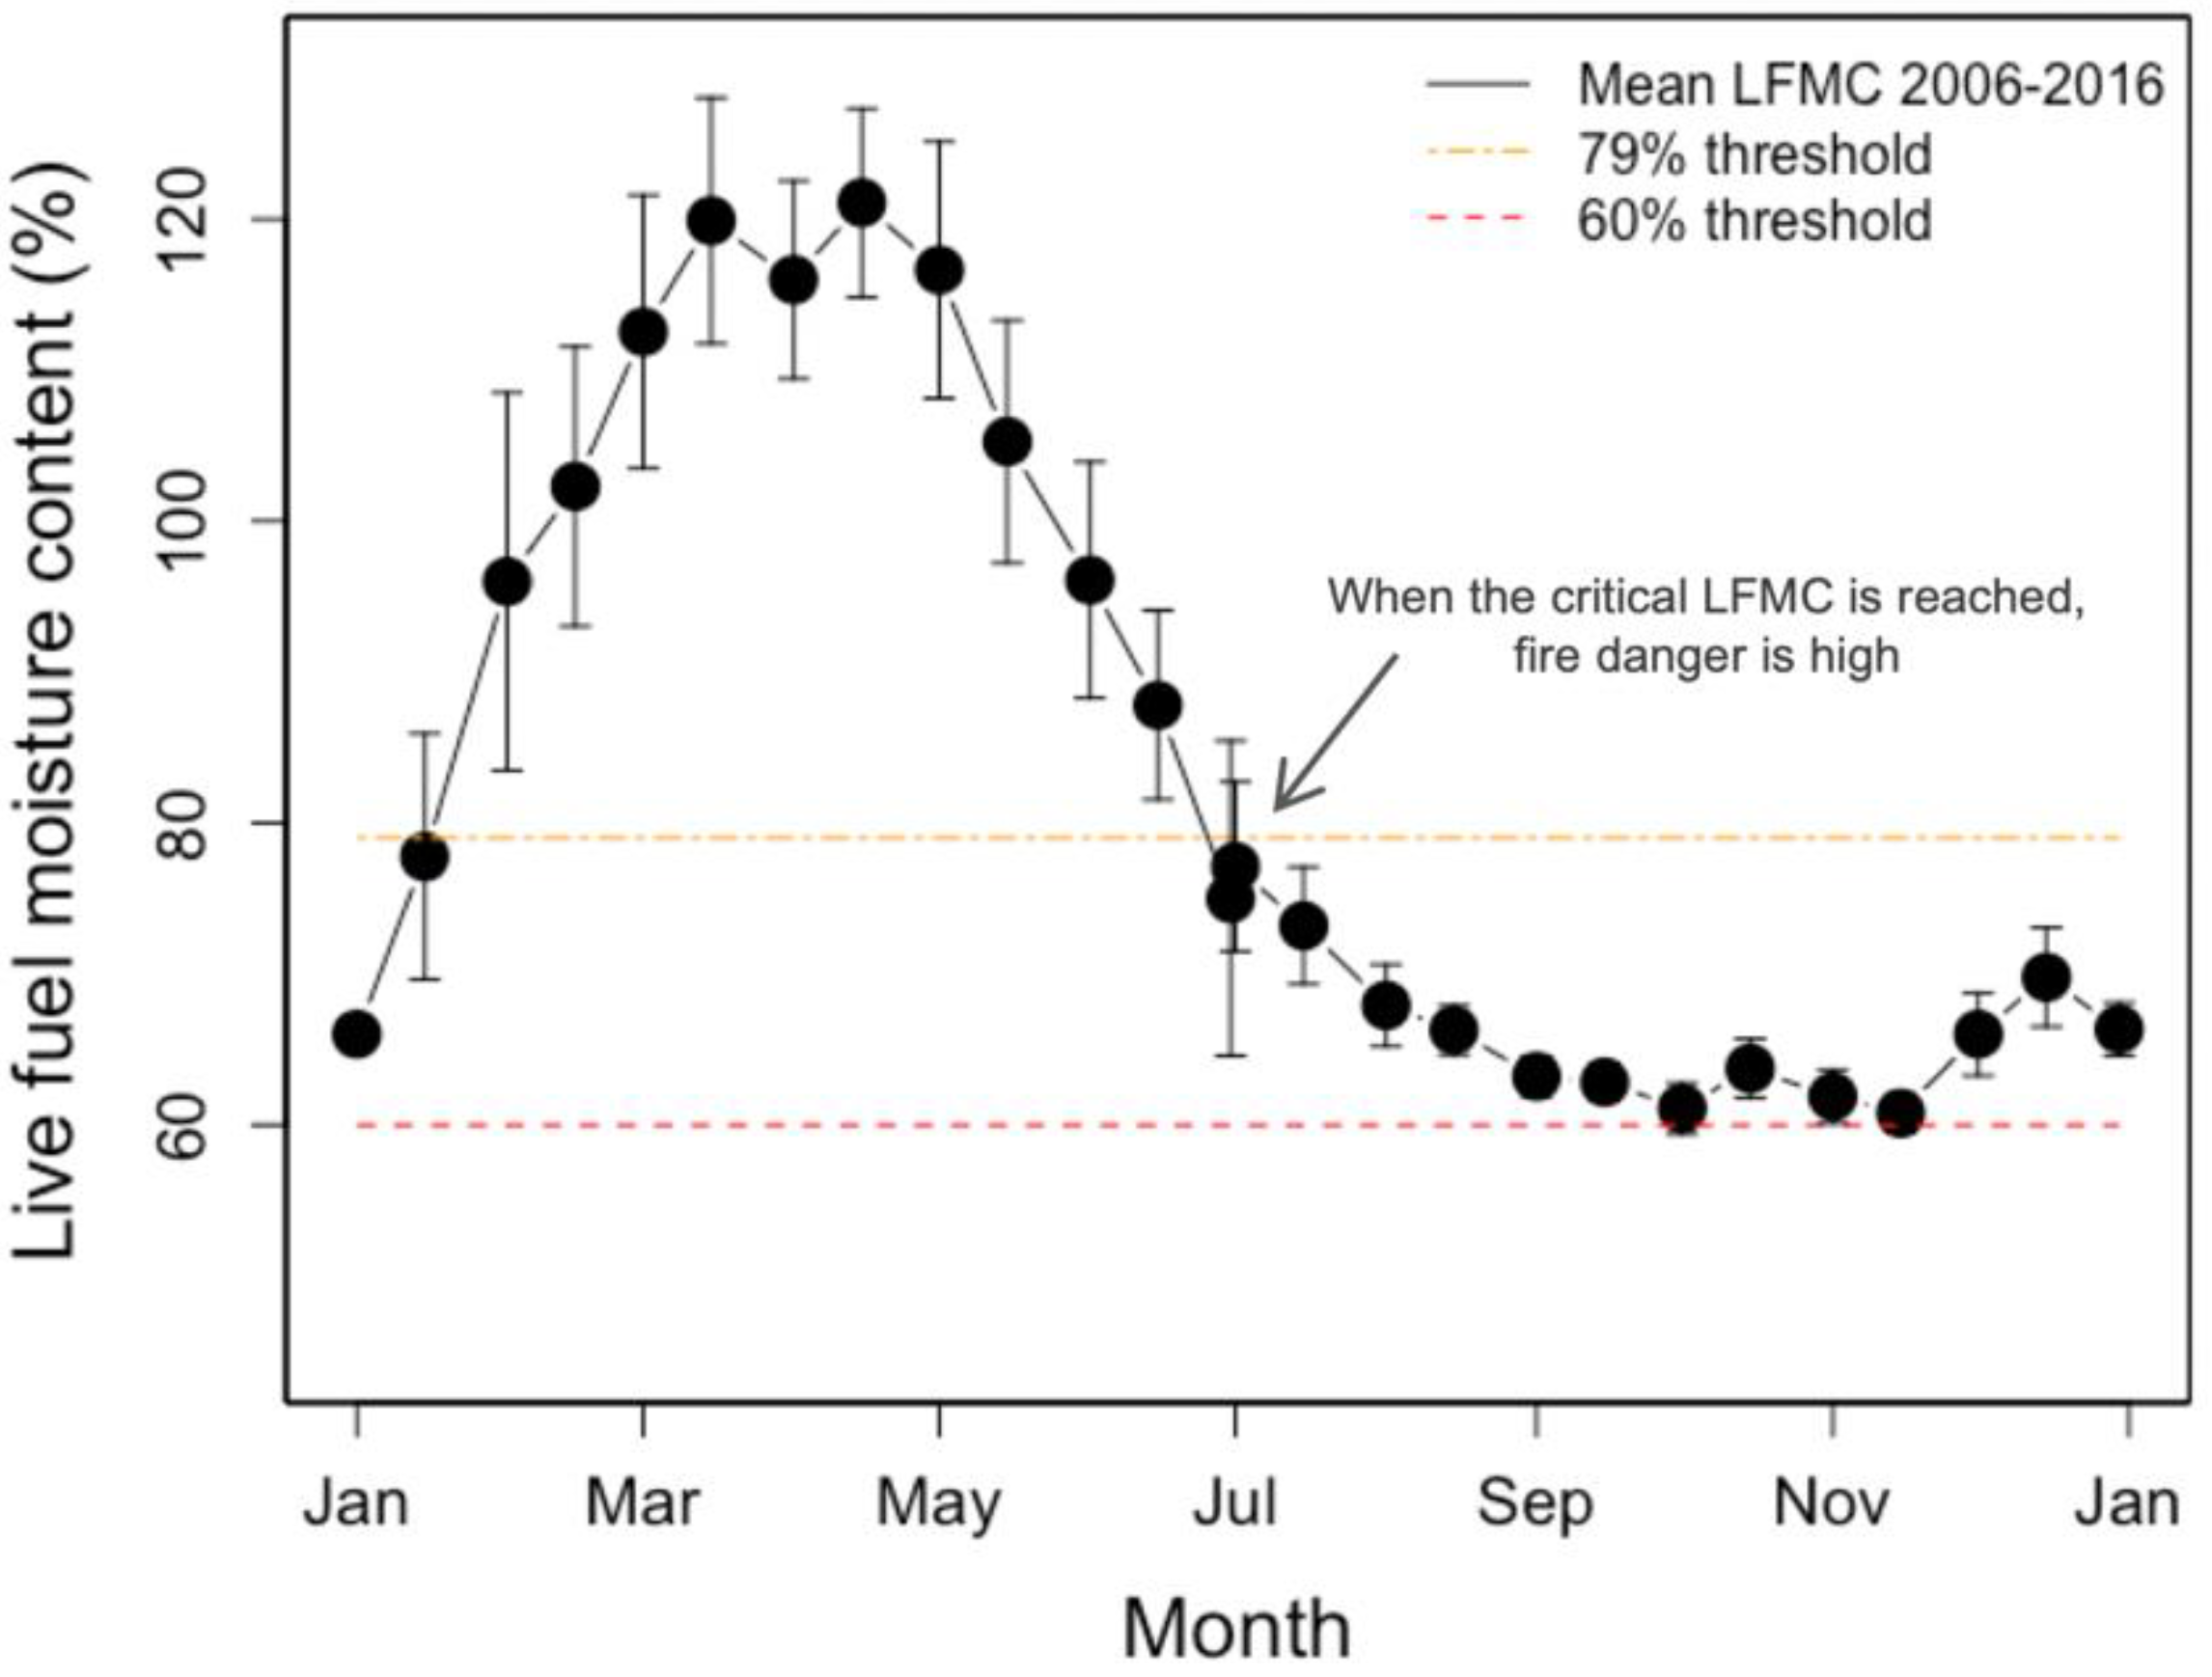
California’s Mediterranean-type climate shrublands are especially prone to wildfires. For example, the natural fire regime in southern California historically included infrequent yet large, high-intensity fires [11]. However, modern fire frequencies are higher than normal, which threaten chaparral diversity [12,13]. For chaparral shrubs in southern California, LFMC is normally high during the winter and spring and then gradually declines with the onset of the characteristic summer drought (Figure 1) of Mediterranean-type climates (Figure 2a). This leads to a typical fire season about six months long (Figure 1). However, severe or extended drought conditions, which are becoming more common with climate change, lead to fuels drying out sooner, more quickly, to a greater extent, or for longer. In these instances, the predicted fire season starts earlier in the year and/or lasts longer. Extended droughts have been associated with high fire activity or anomalous seasonality. For example, five of nine historic “mega fires” (>50,000 ha) in southern California occurred during a period of anomalous drought [14]. Large, wind driven, spring fires can occur when LFMC is at levels that normally occur in the late summer or fall [15].
In some cases, extreme drought can lead to vegetation mortality [16] and hence increased dead fuel loads, which can also exacerbate fire risk. These drought conditions can lead to increased dead fuels, which are largely controlled by weather conditions and fuel thickness [8]. Alternatively, live fuel moisture covaries with environmental conditions, including temperature, precipitation, and soil moisture, as well as the phenological and physiological characteristics of a plant species [9,17,18]. Despite the widespread use of LFMC as a proxy for flammability and fire risk, only recently have quantitative studies emerged of how these data relate to traits of plant water relations components including water potentials, turgor loss point, relative water content, and hydraulic conductivity [19,20]. This represents a significant gap in our understanding of pyro-ecophysiology [21].
Determining the physiological mechanisms that underpin LFMC, especially in a fire-prone landscape such as California, has important implications for fire-risk management practices [22]. The objective of this research was to address: (1) What are the physiological mechanisms associated with changes in LFMC? and (2) How do seasonal patterns of LFMC differ among a variety of species? To address these questions, we measured LFMC and a variety of ecophysiological traits for 11 native woody chaparral and coastal sage scrub species. These traits included water potentials, gas exchange characteristics, and hydraulic traits. We hypothesized that the following traits would control changes in LFMC: (1a) traits associated with access to water, such as predawn water potentials and minimum seasonal water potentials, (1b) water use regulation, such as transpiration, and (1c) traits associated with drought adaptation, as determined from pressure-volume curves. We also hypothesized that: (2) these trait differences would manifest as differing seasonal LFMC patterns among species.
2. Methods and Materials
2.1. Study Site and Species
The study was conducted from July 2015 to March 2016 at the Stunt Ranch Santa Monica Mountains Reserve, located in the Santa Monica Mountains in California (34°5′27′′ N, 118°39′27′′ W). Stunt Ranch is 125 ha field station dominated by coverage of chaparral, with elevation ranging from 392 to 472 m. With a Mediterranean-type climate, average temperature highs are 32 °C and average lows are 4 °C (Figure 2A). Mean annual precipitation is 610 mm, occurring mostly during the winter months with almost no rainfall during the summer; however, there is very high interannual rainfall variability. Stunt Ranch last burned in 1993, 22–23 years before this study. This study measured 11 common woody species in California shrub land ecosystems (Table 1).
2.2. Live Fuel Moisture Content
LFMC (%) was measured approximately every three weeks, concurrently with plant water potentials (see below). During sampling, a terminal shoot was collected from each individual, for at least three individuals per species during midday (11:00 to 13:00), approximating the procedures used by the Los Angeles County Fire Department and the Ventura County Fire Department in their monitoring of LFMC. Each sample was sealed in a separate plastic bag (Whirlpak, Nasco, and Fort Atkinson, WI, USA) and transported in a cooler to the lab.
LFMC is the ratio of water weight to dry weight of living plant tissue [23] and was determined by measuring the sample fresh weight and then placing the sample in a coin envelope and drying in an oven at 70 °C for at least 72 h, after which the dry mass was recorded. LFMC (%) was calculated as:
Minimum seasonal LFMC (LFMCMIN) was determined from the lowest LFMC value a species experienced over the course of a year, and maximum seasonal LFMC (LFMCMAX) was determined from the highest LFMC value a species experienced over the course of a year.
2.3. Plant Water Potential
At the same time, and from the same branch used for LFMC sample collection (see above), an additional terminal shoot was collected for a paired water potential (Ψ; MPa) measurement, for at least three individuals per species during midday (11:00 to 13:00). Each sample was sealed in a separate plastic bag (Whirlpak, Nasco, and Fort Atkinson, WI, USA) and transported in a cooler to the lab. Water potential was determined with a Scholander-type pressure chamber (PMS Instrument Corp., Corvallis, Oregon). In addition to midday water potentials, predawn water potentials (04:00 to 05:00) were sampled during the dry (August 2015; ΨPD;dry) and wet season (March 2016; ΨPD;wet) following the same protocol. Minimum seasonal water potential (ΨMIN) was determined from the most negative water potential a species experienced over the course of a year.
2.4. Gas Exchange
Photosynthetic gas exchange was measured using a portable photosynthesis system (LI-6400, LI-COR Biosciences, Lincoln, NE, USA) with a red-blue light source. Measurements were frequently taken from September 2014 to April 2016, during the morning and midday hours (9:00 to 14:00) on the most recently mature leaf. We determined the light-saturated rate of photosynthetic CO2 assimilation per area (AMAX; µmol·m−2·s−1), stomatal conductance to water vapor (gS; mol·m−2·s−1), transpiration (E; mol·m−2·s−1), and intrinsic water use efficiency (A/gS; µmol·mol−1).
2.5. Pressure-Volume Curves
Pressure-volume curves were determined on six terminal shoots per species using the bench-dehydration method [24,25] during August and September, which are dry summer months. Samples were collected from the field, sealed in plastic bags, and placed inside a cooler for transport back to the lab. In the lab, shoots were recut under water and placed in beakers with the distal cut stem end in water, and the entire sample covered in plastic to rehydrate overnight. The next day, samples were weighed and measured for water potential using a Scholander-type pressure chamber, and then dried on a lab bench. Weighing, measuring water potential, and drying samples were repeated until achieving a water potential of about −4 to −6 MPa, depending on the species. Subsequently, samples were put in a paper bag and dried in an oven at 70 °C for at least 48 h to determine dry mass. We calculated saturated water content (SWC; %), water potential at turgor loss point (ΨTLP; MPa), relative water content at turgor loss point (RWCTLP; %), osmotic potential (πo; MPa), modulus elasticity (ε; MPa), capacitance at full turgor (CFT; MPa−1), capacitance at turgor loss point (CTLP; MPa−1), and leaf dry matter content (LDMC; g·g−1) using the Excel spreadsheet available on PrometheusWiki [26].
2.6. Statistical Analyses
All statistical tests were performed in R Studio (ver 0.99.485) [27]. Piecewise regression using the ‘segmented’ package was used to find the inflection point, standard error, and 95% confidence intervals for the relationship between water potential and LFMC (LFMCIP) for each individual species and for all species combined. We tested for differences in ΨTLP among species using ANOVA with the ‘aov’ function from the ‘stats’ package and a Tukey post-hoc test. Pearson correlation was performed with the ‘rcorr’ function from the ‘Hmisc’ package to produce a correlation matrix and evaluate the relationships among all measured traits [28,29]. Before running correlations, traits were tested for normal distribution using the Shapiro-Wilk test of normality [30] and transformed if necessary. Transformed traits included AMAX, gS, E, SWC, and LFMCMAX. The correlogram was constructed using the ‘corrplot’ function.
3. Results
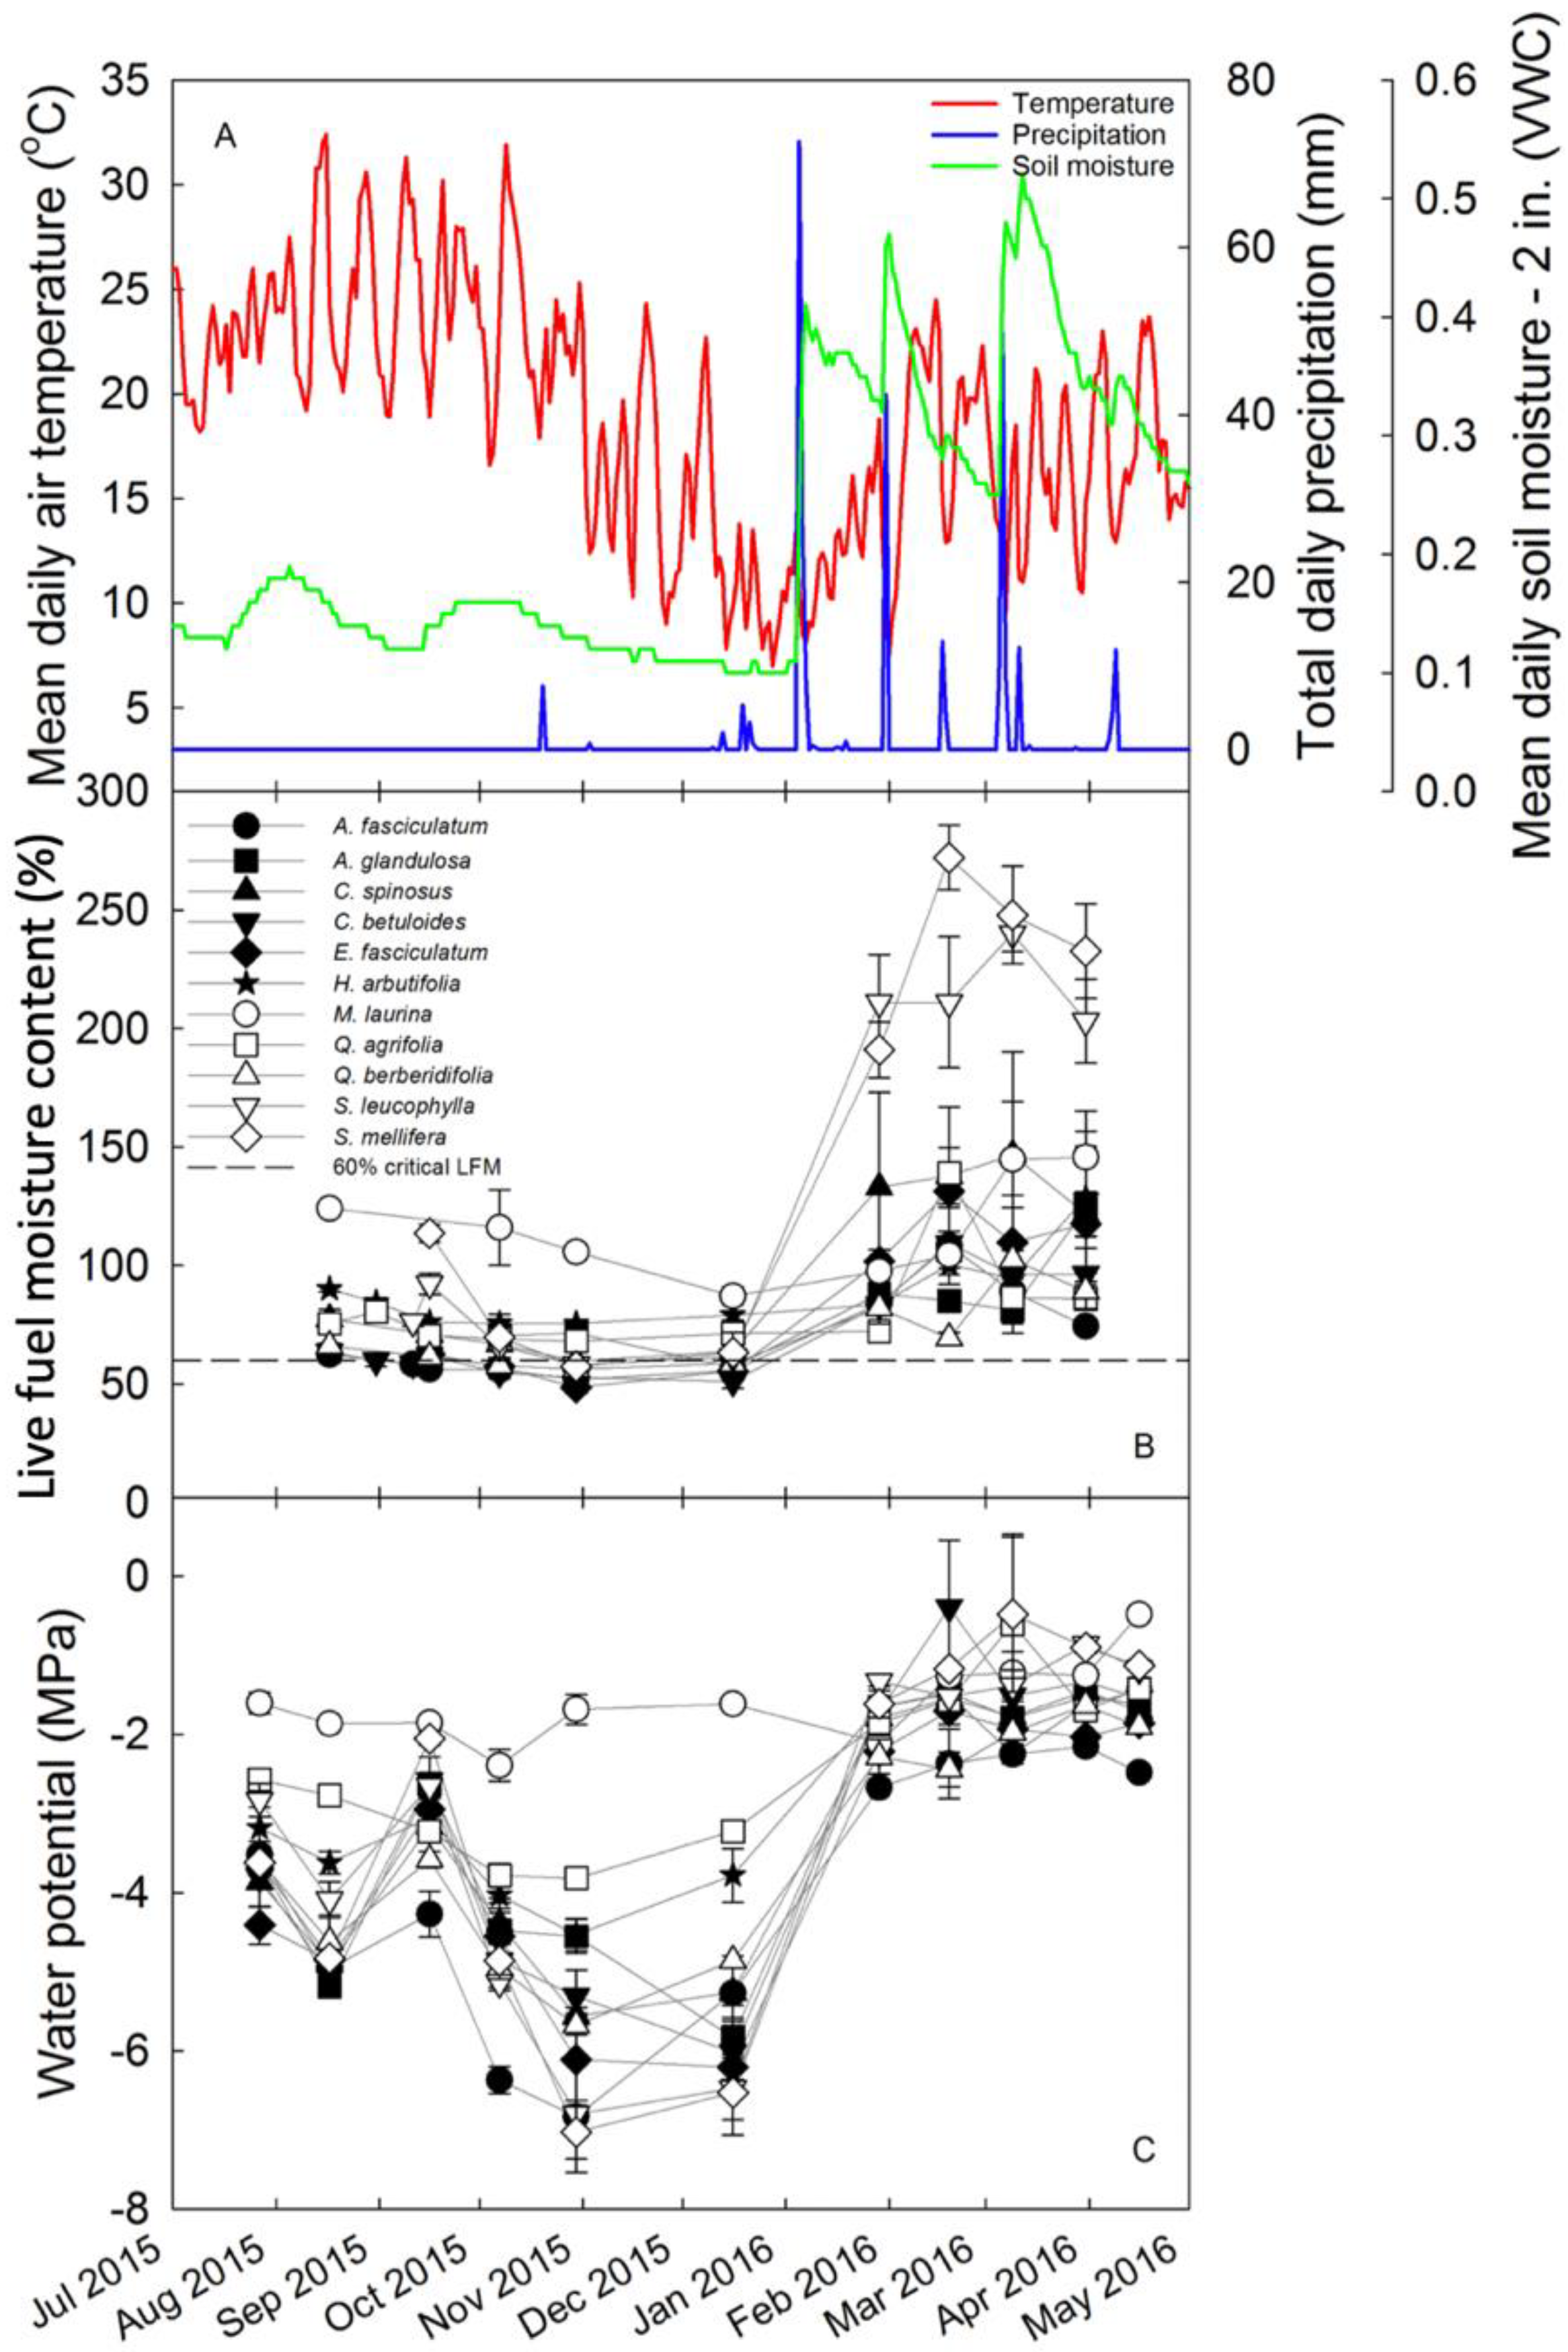
LFMC and water potentials (Ψ) varied among species and seasons (Figure 2B,C). LFMC was highest and most variable among species during the wet months of January through April, while species tended to converge towards low LFMC during the dry season. LFMCMIN occurred in October and November, while LFMCMAX occurred in February and March. Ψ were lowest during the dry season, particularly in October, November, and December, right before winter rains began. Variability in Ψ among species was greatest during the dry season. When winter rains started in January, species converged towards less negative Ψ.
Salvia mellifera had the highest LFMCMAX, while Quercus berberidifolia had the lowest LFMCMAX. Eriogonum fasciculatum had the lowest LFMCMIN, while Malosma laurina had the highest LFMCMIN. Salvia mellifera had the lowest ΨMIN, and Malosma laurina had the highest ΨMIN. In fact, deeply rooted Malosma laurina did not show a substantial seasonal change in Ψ or LFMC.
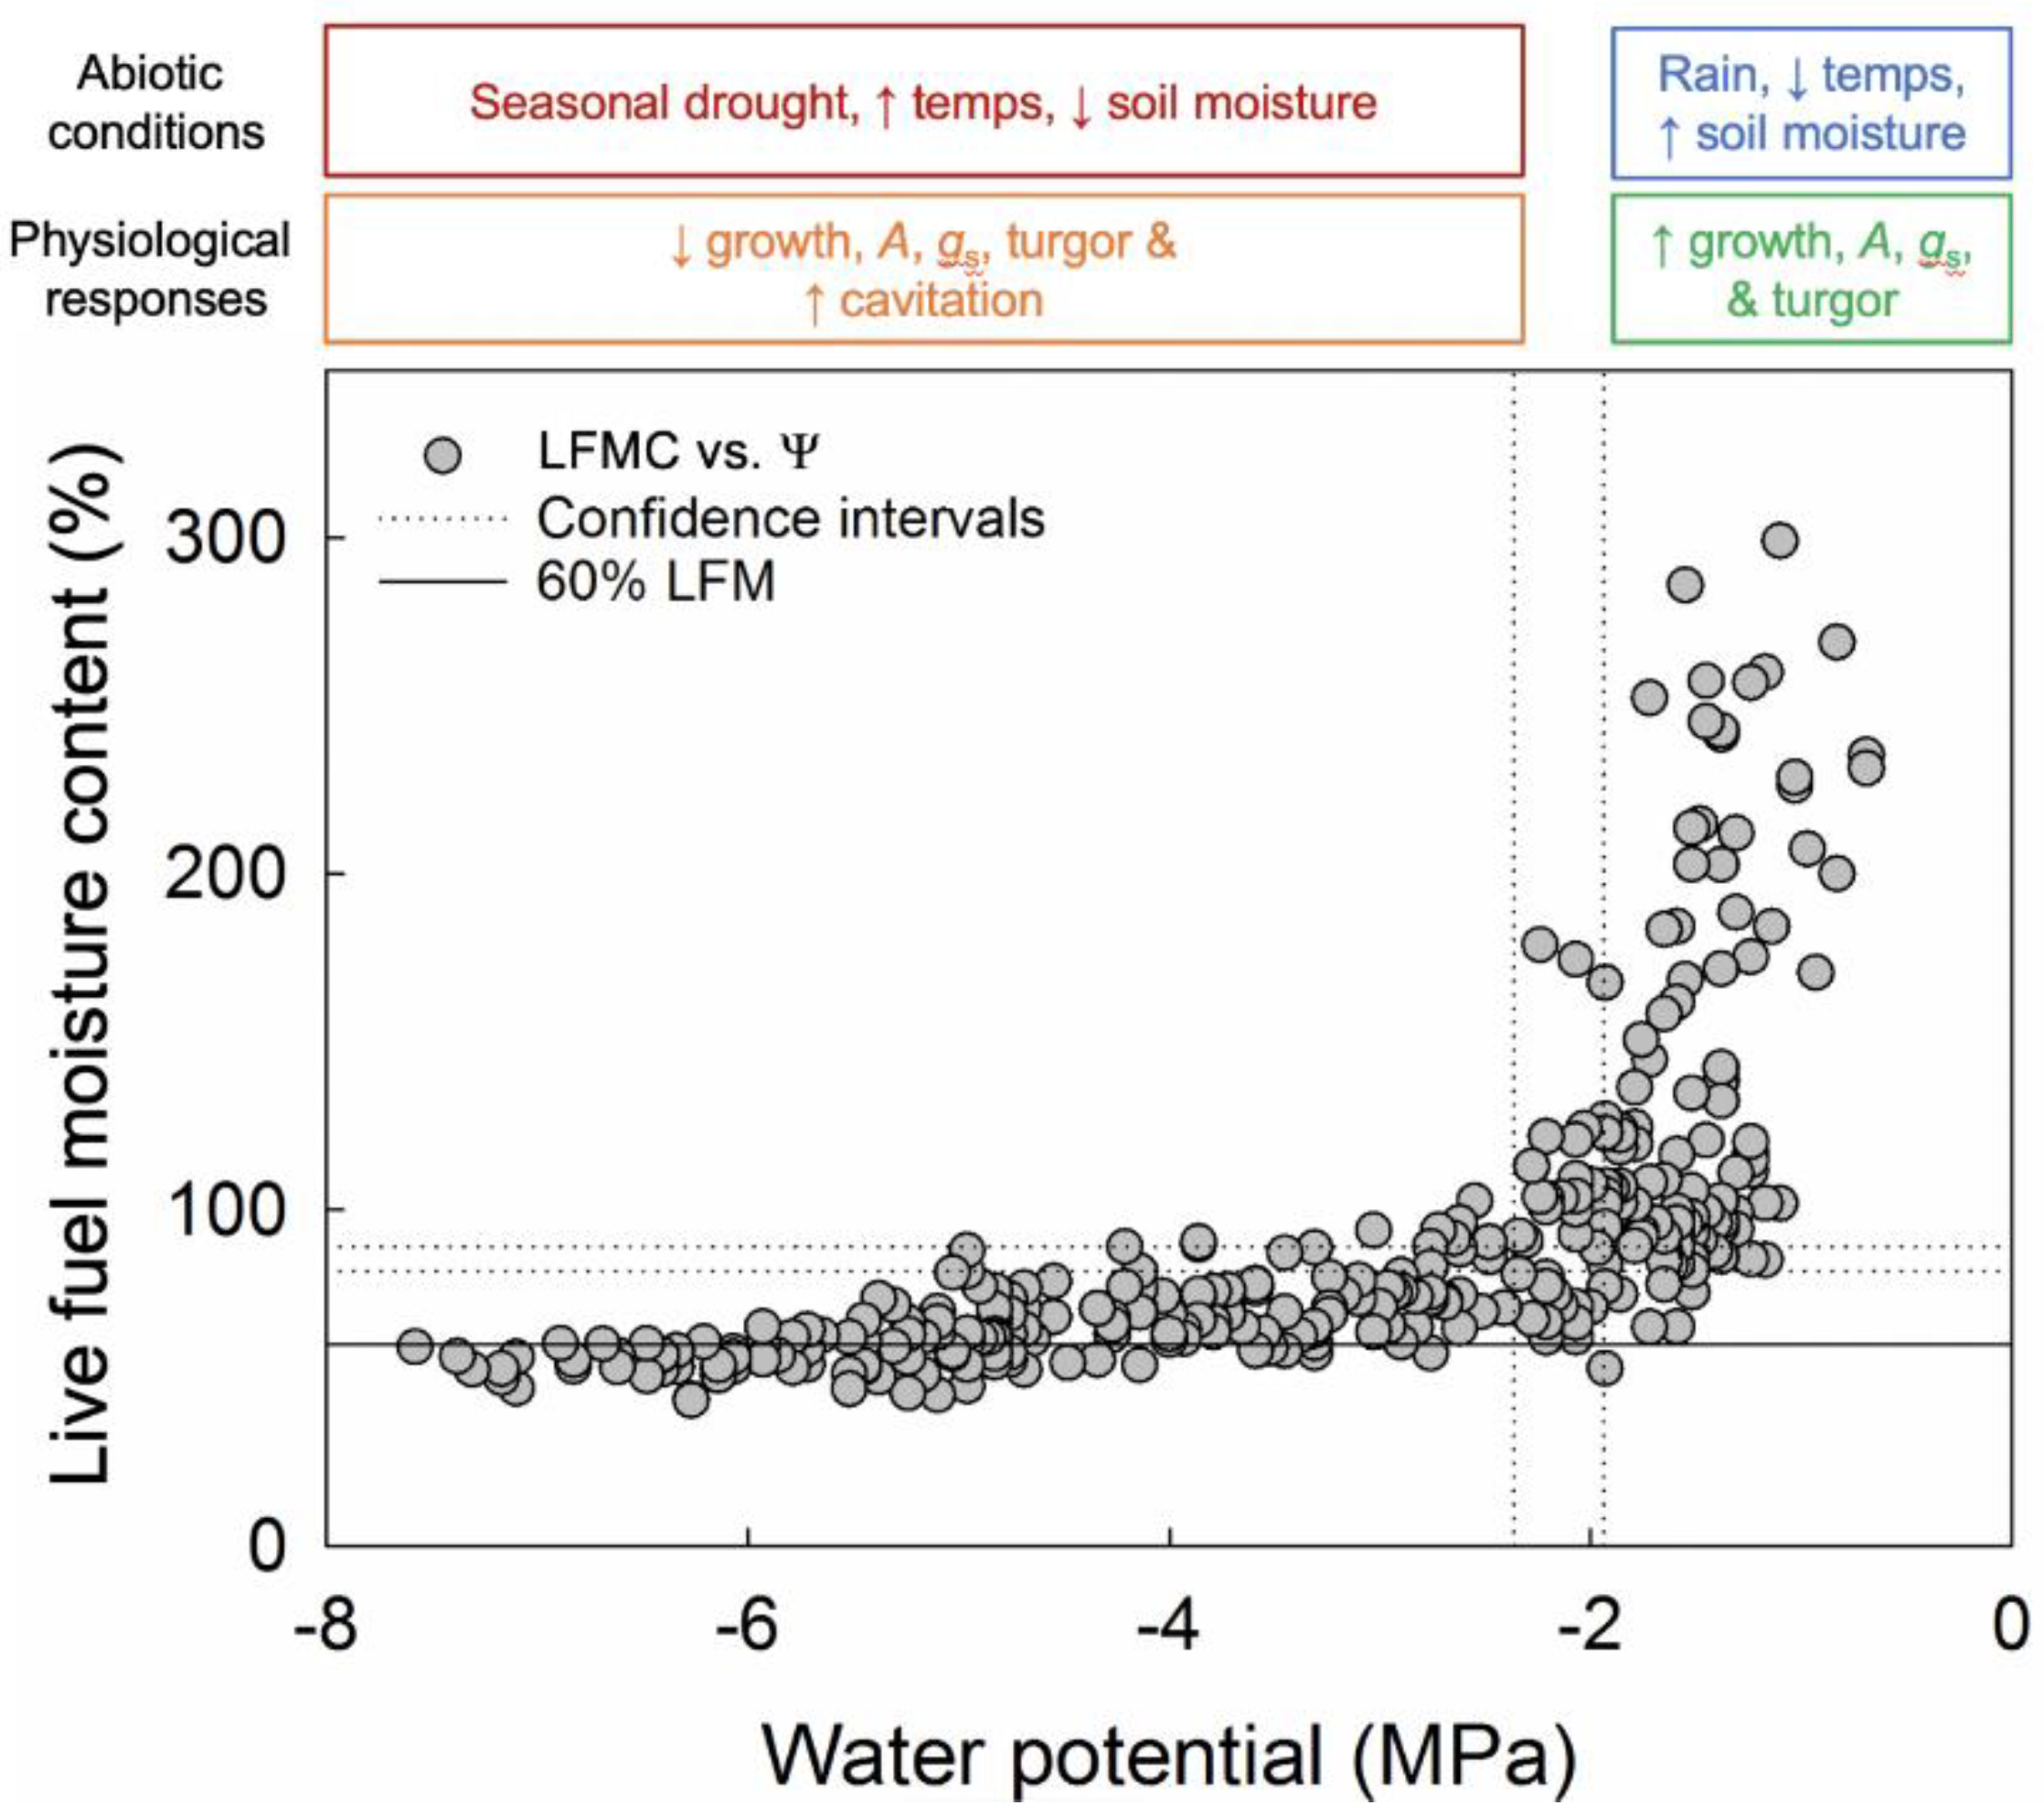
In comparing LFMC to Ψ (Figure 3, Supplemental Figure S1), LFMC initially decreased rapidly with only a small decline in Ψ, before reaching an inflection point (LFMCIP) and leveling off. After LFMCIP, there were large declines in Ψ with only a small decline in LFMC. In addition, the confidence intervals for LFMCIP overlapped with the confidence intervals for ΨTLP for the compiled data set (Figure 3), which included all study species, as well as for individual species, except for A. fasciculatum, Heteromeles arbutifolia, M. laurina, and S. leucophylla (Supplemental Figure S1). For H. arbutifolia and M. laurina, the relationship between LFMC and Ψ was not tightly constrained, which made it difficult for the model to converge on an inflection point. For A. fasciculatum, ΨTLP was more negative than the inflection point, while for S. leucophylla, ΨTLP was less negative than the inflection point. For the remaining species, E. fasciculatum had the lowest LFMCIP at 67%, while C. spinosus had the highest LFMCIP at 121%.
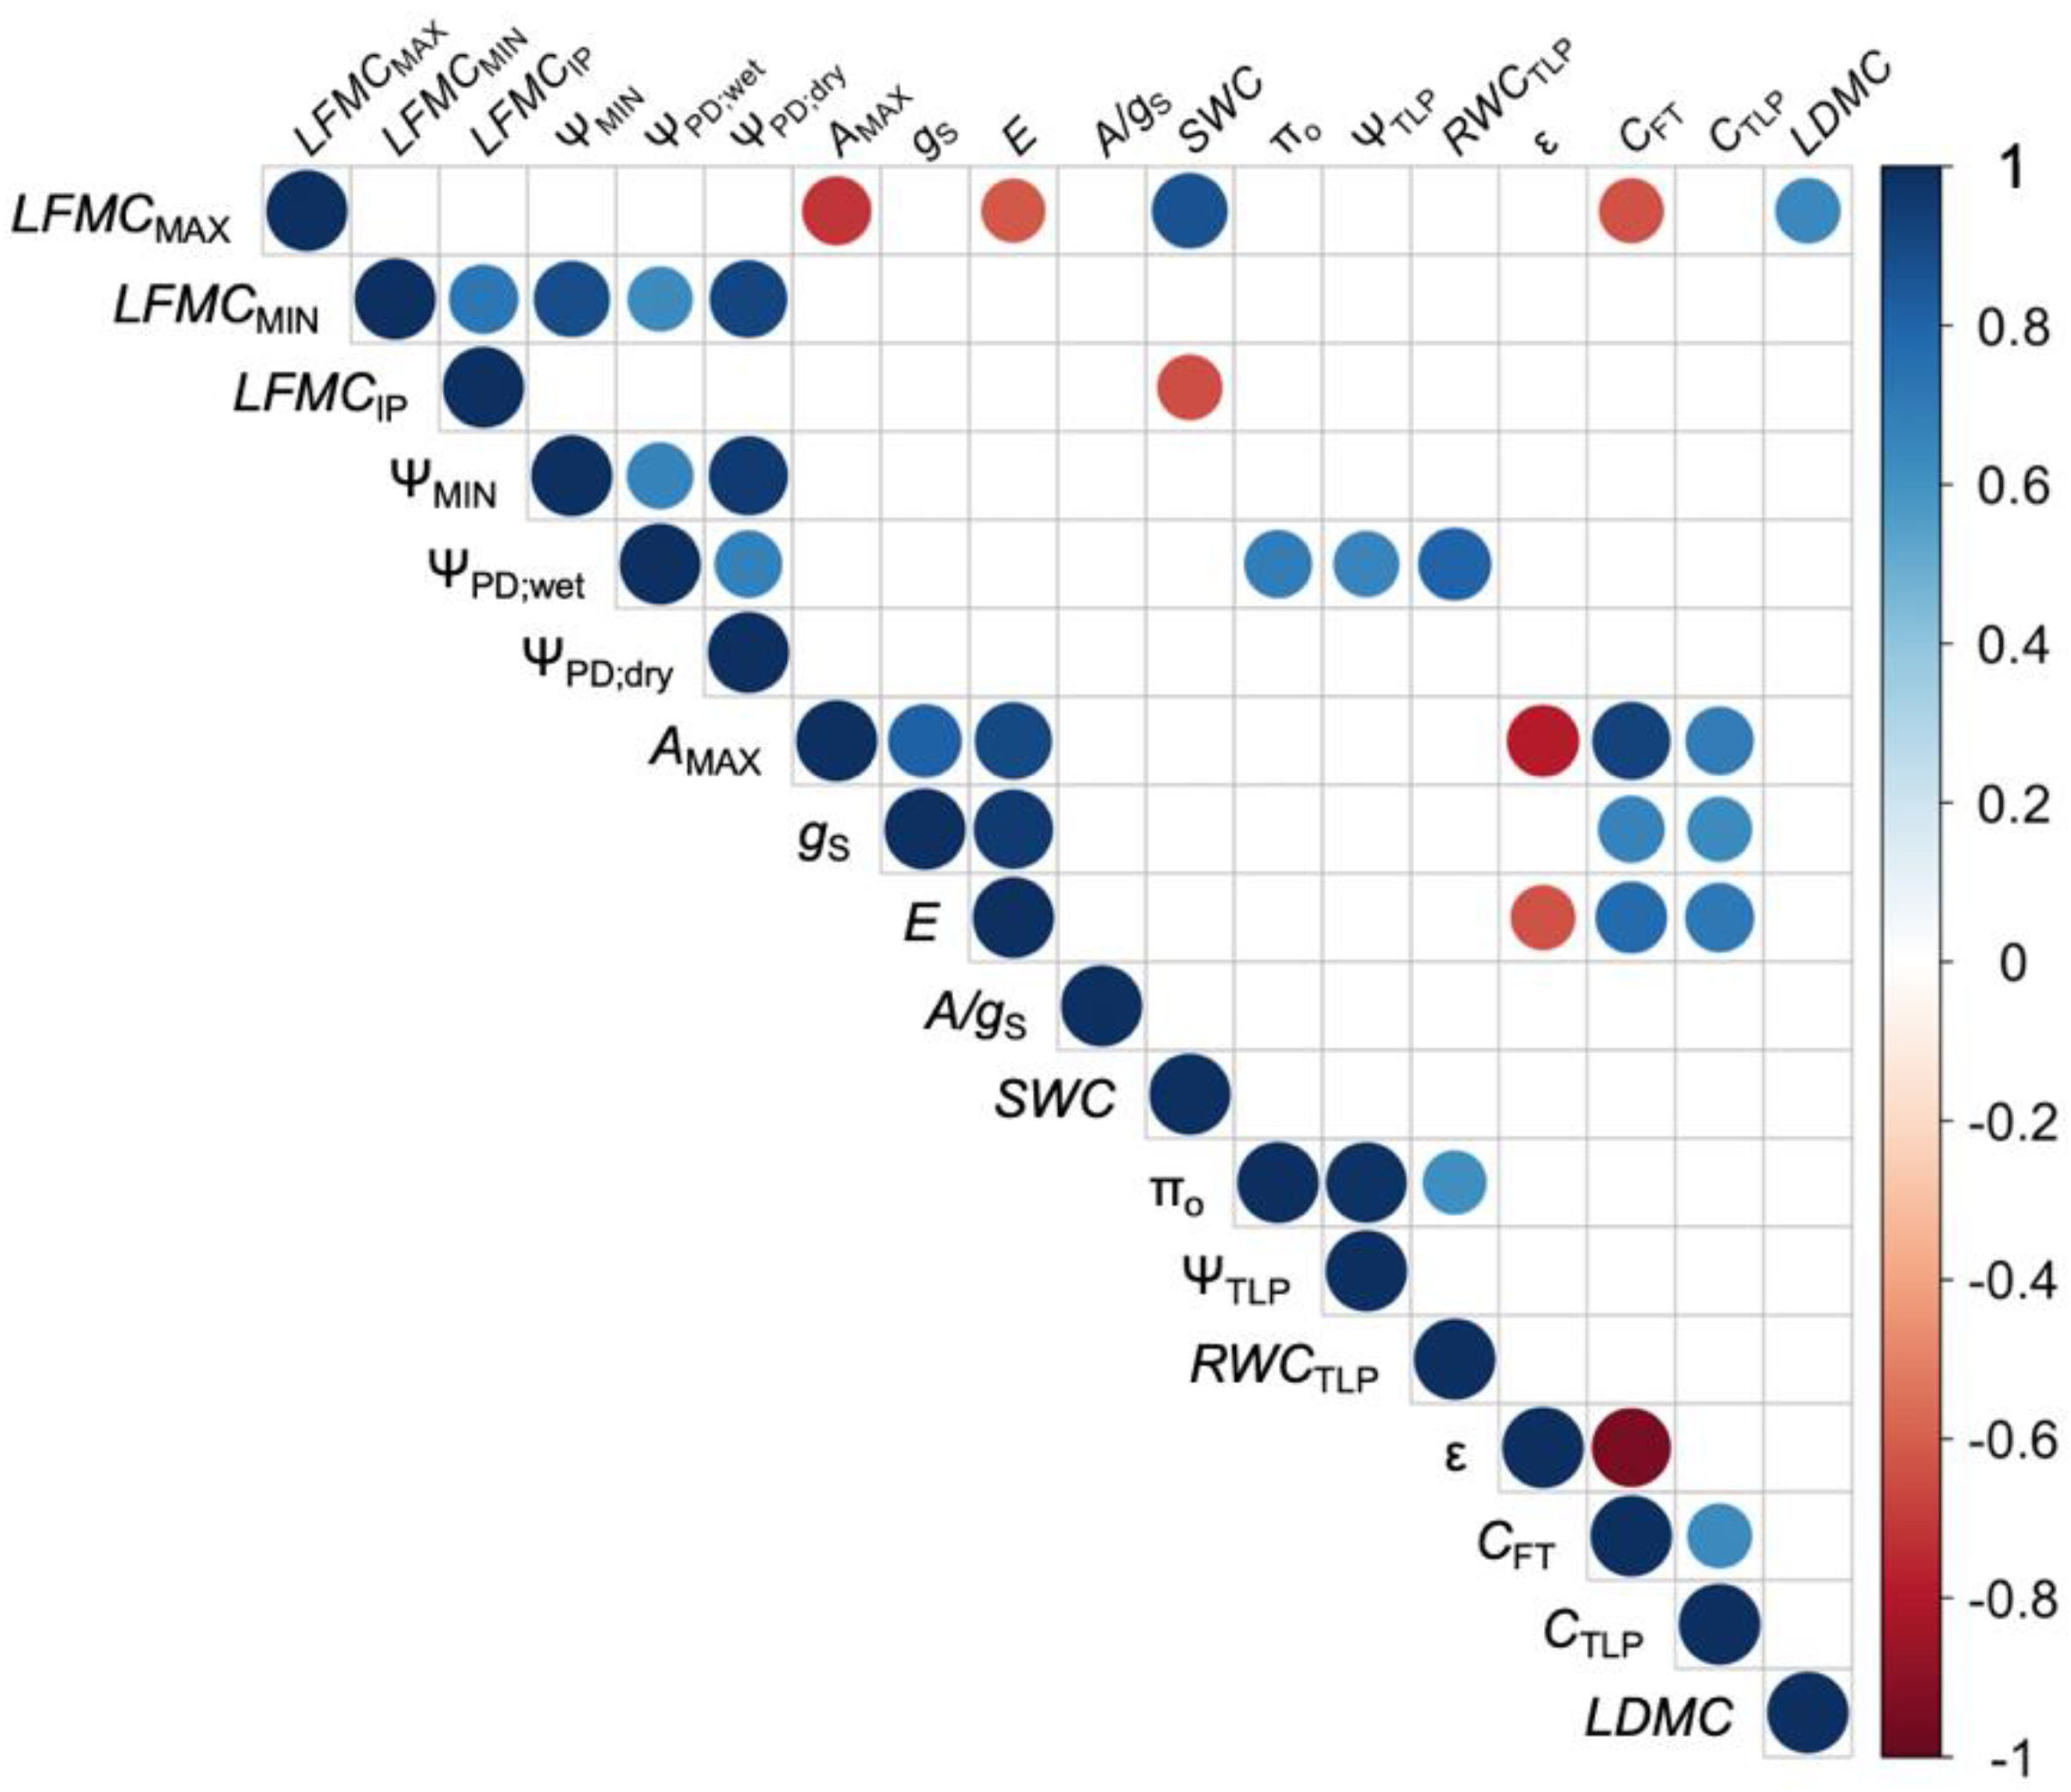
Species with lower LFMCMIN also had lower (more negative) ΨMIN, lower ΨPD;wet, and lower ΨPD;dry (Figure 4). For example, A. fasciculatum had the second lowest ΨMIN and the lowest ΨPD;wet and ΨPD;dry. LFMCMAX was correlated with AMAX, E, SWC, CFT, CTLP, and LDMC. LFMCIP was correlated with SWC.
ΨTLP among species ranged from −1.47 MPa to −3.40 Mpa (Table 1). S. leucophylla had the highest (least negative) ΨTLP and A. fasciculatum had the lowest (most negative) ΨTLP. While S. leucophylla had the lowest ΨTLP, it was not significantly different from Q. berberidifolia, C. betuloides, M. laurina, or S. mellifera. While E. fasciculatum and A. fasciculatum had the two lowest (most negative) ΨTLP and were also significantly different from the five previously mentioned species, they were not significantly different from A. glauca, Q. agrifolia, H. arbutifolia, and C. spinosus.
4. Discussion
4.1. Overview
Our study aimed to answer, (1) What are the physiological mechanisms associated with changes in LFMC? We found that minimum seasonal live fuel moisture content (LFMCMIN) was correlated with water access traits, including wet season predawn water potential (ΨPD;wet), dry season predawn water potential (ΨPD;dry), and minimum seasonal water potential (ΨMIN), confirming hypothesis 1a as well as previous work by [19]. Maximum seasonal live fuel moisture content (LFMCMAX) was correlated with photosynthesis (AMAX) and transpiration (E), confirming hypothesis 1b. LFMCMAX was correlated with drought-adaptation traits, including SWC, relative CFT, and relative capacitance at zero turgor (CTLP), LDMC, supporting hypothesis 1c.
We also asked, (2) How do seasonal patterns of LFMC differ among a variety of species? We found that species trait differences were associated with differing seasonal LFMC patterns among species, confirming hypothesis 2. LFMC varied among species to the greatest extent during the wet winter months, but all species converged on low LFMC values during the dry season. LFMCMAX occurred during the wet season, along with maximum rate of AMAX and E, while LFMCMIN and ΨMIN occurred during the dry season. The coastal sage scrub species S. mellifera and S. leucophylla, which are drought-deciduous and shallow-rooted, had much higher LFMCMAX values compared to any other species during the wet season. However, Salvia species displayed the lowest ΨMIN. Malosma laurina, which is an evergreen chaparral species characterized by deep roots, maintained the highest LFMC during the dry season, never dropping below 87%.
4.2. Physiological Controls of LFMC
Traits associated with water access and water use regulation were critical determinants of LFMC among species. One of the most important traits that controlled LFMC in this semi-arid plant community was water potential. Predawn water potentials and minimum seasonal water potentials, which are indicative of species access to water [34] and regulation of water loss when stomata are closed (i.e., cuticular conductance) [35], were correlated with LFMCMIN (Figure 4). Deeply rooted plants have greater access to soil moisture for longer into the dry season than shallow-rooted plants, supporting either the delay of LFMC decline or keeping minimum LFMC high [36]. In addition to access to water, traits associated with water use regulation played a significant role in controlling LFMC. For example, species with the highest LFMCMAX also had high AMAX and high E, providing evidence that species with high gas exchange rate rates also have high moisture content in their tissue. Overall, this points to a suite of traits that coordinate water access, water use regulation, and plant water status [37].
By plotting concurrently measured LFMC and Ψ together on the same plot, we examined the relationship between a landscape-level management metric used for assaying fire danger (LFMC) and a well-established physiological measurement of plant water status (Ψ). As plants started to dry out, LFMC rapidly declined with only a small change in Ψ, before reaching an inflection point (LFMCIP), after which there were large declines in Ψ with only a small change in LFMC. The confidence intervals for LFMCIP overlapped with turgor loss point (ΨTLP) confidence intervals for the compiled data set. ΨTLP is an important drought-adaptation trait; species with a lower (more negative) ΨTLP can withstand more negative Ψ before losing leaf turgor, or before wilting. At the point that leaves have lost so much water that they lose turgor, they would also be highly flammable as the amount of moisture in the leaves would be low, hence ignition could easily occur. However, this would correspond to a higher critical LFMC threshold than the current 60% used by fire departments in southern California. This finding confirms work by Dennison & Moritz [38], which used a different approach to determine a critical LFMC threshold involving precipitation records, and builds on the recent LFMC versus fire behavior breakpoint work of Pimont [10,39], with our physiological data.
While the LFMCIP corresponded to the ΨTLP for the compiled data set, this was not the case for each individual species (Supplemental Figure S1). There are a few possibilities for this result. One cause could be phenology [40] and, more specifically, growth. Dry matter “accumulates” when plants grow, which would exert a strong seasonal effect on the relationship between LFMCIP and ΨTLP for species with differing phenological patterns [41,42]. Another potential factor is related to water storage and water release dynamics of different plant species, including the release of capillary water versus water released from cavitation events [43,44]. Using a physiologically meaningful LFMC threshold, as supported by flammability and precipitation data, along with an appropriate indicator species is important when monitoring fire-risk conditions.
4.3. Indicator Species Choice Can Impact Fire Danger Rating
As we have shown, LFMC and therefore fire-risk monitoring will vary depending on the indicator species. By comparing 11 dominant species in southern California, a region with high plant biodiversity, we can quantitatively compare LFMC of Adenostoma fasciculatum, the current indicator species, against other co-occurring species. Adenostoma fasciculatum is used as an LFMC indicator species in southern California because of its widespread distribution and abundance. In fact, it is present in 70% of California chaparral communities [45]. In addition, it is viewed as being highly flammable due to its oily leaves (giving rise to its other common name “greasewood”) and multi-stemmed canopy structure that consists of dense clusters of small stems, branches, and flower stalks [46]; about 60% of stems are <1.27 cm in diameter [47]. This makes it a fine fuel with small stems and leaves, especially in comparison to co-occurring large branching or broad-leafed species. Our data show that of the 11 study species examined, A. fasciculatum was one of the first species to reach the 79% critical LFMC threshold proposed by [38] and it stayed below that threshold during the seasonal dry period. In fact, it often also fell below the 60% LFMC threshold used by LACFD when many other species did not. The only other species to consistently do so was C. betuloides. Hence, A. fasciculatum is a good indicator species for measuring LFMC in southern California chaparral mountains. The high seasonal LFMC values of M. laurina, H. arbutifolia, and Q. agrifolia make them less optimal as LFMC indicator species.
5. Conclusions
In their 2018 Perspective paper, Jolly and Johnson [21] argue,
The discipline of ecophysiology is rich and mostly unleveraged in live fuel research, yet it has the potential to link plant flammability traits at both the leaf and plant level to fundamental laws that govern how plants functions.
Our study takes the initial steps to address this and shows that traits associated with water access and water use regulation were critical determinants of seasonal LFMC patterns among species. Other systems would benefit from physiological studies of their chosen indicator species and critical LFMC thresholds. This understanding is crucial as the number and size of large fires in the western United States have increased, especially when coincident with drought [48]. Increasing temperatures and longer, more intense, and/or more frequent droughts will become common with climate change, so accurately forecasting wildfire risk is an immediate issue.
Supplementary Materials
The following are available online at https://0-www-mdpi-com.brum.beds.ac.uk/2571-6255/2/2/28/s1: Figure S1: Water potential versus live fuel moisture content for 11 species, measured at the Stunt Ranch Santa Monica Mountains Reserve, with the piecewise linear regression used to determine the inflection point.
Author Contributions
Conceptualization, A.L.P. with input from M.R.S., M.W., J.E.K., and P.W.R. Methodology, A.L.P. Formal analysis, A.L.P. with input from N.E., M.R.S., M.W., J.E.K., and P.W.R. Writing–Original draft preparation, A.L.P. Writing–Reviewing and editing, A.L.P., N.E., M.R.S., M.W., J.E.K., and P.W.R.
Funding
This work was supported by funding provided by a La Kretz Center for California Conservation Science Postdoctoral Fellowship to A.L.P. and the Bloom-Hays Ecological Research Grant from Sea and Sage Audubon to A.L.P.
Acknowledgments
We thank Kim Riley, Linda Moua, Mindy Phan, and Tai Michaels for help in the field and lab; Aaron Ramirez, the Sork lab, and the Sack lab for useful feedback on the data; Mario Colon and Gary Bucciarelli for logistical support at the Stunt Ranch Santa Monica Mountains Reserve. We acknowledge that this study was conducted on the traditional territory of the Chumash and Tongva people.
Conflicts of Interest
The authors declare no conflict of interest.
Abbreviations
| Trait | Abbreviation | Units |
| Live fuel moisture content | LFMC | % |
| Minimum seasonal live fuel moisture content | LFMCMIN | % |
| Maximum seasonal live fuel moisture content | LFMCMAX | % |
| Live fuel moisture inflection point | LFMCIP | % |
| Water potential | Ψ | MPa |
| Wet season predawn water potential | ΨPD;wet | MPa |
| Dry season predawn water potential | ΨPD;dry | MPa |
| Minimum seasonal water potential | ΨMIN | MPa |
| Maximum seasonal water potential | ΨMAX | MPa |
| Maximum photosynthetic carbon gain | AMAX | µmol·m−2·s−1 |
| Stomatal conductance | gS | mol·m−2·s−2 |
| Transpiration | E | mol·m−2·s−2 |
| Water use efficiency | A/gS | µmol·mol−1 |
| Saturated water content | SWC | % |
| Water potential at turgor loss point | ΨTLP | MPa |
| Relative water content at turgor loss point | RWCTLP | % |
| Osmotic potential | πo | MPa |
| Modulus of elasticity | ε | MPa |
| Capacitance at full turgor | CFT | MPa−1 |
| Capacitance at turgor loss point | CTLP | MPa−1 |
| Leaf dry matter content | LDMC | g·g−1 |
References
- Andrews, P.L.; Bradshaw, L.S. Use of meteorological information for fire management in the United States. In Proceedings of Workshop on Meteorological Information for Forest Fire Management in the Western Mediterranean Region; WMO: Geneva, Switzerland, 1991; pp. 325–332. [Google Scholar]
- Rossa, C.G.; Fernandes, P.M. Short communication: On the effect of live fuel moisture content on fire-spread rate. For. Syst. 2017, 26, eSC08. [Google Scholar] [CrossRef]
- Rossa, C.; Fernandes, P. An Empirical Model for the Effect of Wind on Fire Spread Rate. Fire 2018, 1, 31. [Google Scholar] [CrossRef]
- Rossa, C.; Fernandes, P. Live Fuel Moisture Content: The ‘Pea Under the Mattress’ of Fire Spread Rate Modeling? Fire 2018, 1, 43. [Google Scholar] [CrossRef]
- Dimitrakopoulos, A.P.; Papaioannou, K.K. Flammability assessment of Mediterranean forest fuels. Fire Technol. 2001, 37, 143–152. [Google Scholar] [CrossRef]
- Bilgili, E.; Saglam, B. Fire behavior in maquis fuels in Turkey. For. Ecol. Manag. 2003, 184, 201–207. [Google Scholar] [CrossRef]
- Anderson, S.A.J.; Anderson, W.R. Ignition and fire spread thresholds in gorse (Ulex europaeus). Int. J. Wildl. Fire 2010, 19, 589–598. [Google Scholar] [CrossRef]
- Keeley, J.E.; Bond, W.J.; Bradstock, R.A.; Pausas, J.G.; Rundel, P.W. Fire in Mediterranean Ecosystems: Ecology, Evolution, and Management; Cambridge University Press: New York, NY, USA, 2012. [Google Scholar]
- Schoenberg, F.P.; Peng, R.; Huang, Z.; Rundel, P. Detection of non-linearities in the dependence of burn area on fuel age and climatic variables. Int. J. Wildl. Fire 2003, 12, 1–6. [Google Scholar] [CrossRef]
- Pimont, F.; Ruffault, J.; Martin-StPaul, N.; Dupuy, J.L. Why is the effect of live fuel moisture content on fire rate of spread underestimated in field experiments in shrublands? Int. J. Wildl. Fire 2019. [Google Scholar] [CrossRef]
- Keeley, J.E.; Fotheringham, C.J. Historic fire regime in southern California shrublands. Conserv. Biol. 2001, 15, 1536–1548. [Google Scholar] [CrossRef]
- Keeley, J.E. Future of California Floristics and Systematics: Wildfire Threats to the California Flora. Madrono 1995, 42, 175–179. [Google Scholar]
- Balch, J.K.; Bradley, B.A.; Abatzoglou, J.T.; Nagy, R.C.; Fusco, E.J.; Mahood, A.L. Human-started wildfires expand the fire niche across the United States. Proc. Natl. Acad. Sci. USA 2017, 114, 2946–2951. [Google Scholar] [CrossRef] [Green Version]
- Keeley, J.E.; Zedler, P.H. Large, high-intensity fire events in southern California shrublands: debunking the fine-grain age patch model. Ecol. Appl. 2009, 19, 69–94. [Google Scholar] [CrossRef]
- Santa Monica Mountains National Recreation Area. In Springs Fire Burned Area Emergency Response Plan; National Park Service, United States Department of the Interior: Washington, DC, USA, 2013.
- Allen, C.D.; Breshears, D.D.; McDowell, N.G. ESA CENTENNIAL PAPER On underestimation of global vulnerability to tree mortality and forest die-off from hotter drought in the Anthropocene. Ecosphere 2015, 6, 1–55. [Google Scholar] [CrossRef]
- Pellizzaro, G.; Duce, P.; Ventura, A.; Zara, P. Seasonal variations of live moisture content and ignitability in shrubs of the Mediterranean Basin. Int. J. Wildl. Fire 2007, 16, 633–641. [Google Scholar] [CrossRef]
- Emery, N.C.; D’Antonio, C.M.; Still, C.J. Fog and live fuel moisture in coastal California shrublands. Ecosphere 2018, 9, e02167. [Google Scholar] [CrossRef]
- Nolan, R.H.; Hedo, J.; Arteaga, C.; Sugai, T.; Resco de Dios, V. Physiological drought responses improve predictions of live fuel moisture dynamics in a Mediterranean forest. Agric. For. Meteorol. 2018, 263, 417–427. [Google Scholar] [CrossRef] [Green Version]
- Ruffault, J.; Martin-StPaul, N.; Pimont, F.; Dupuy, J.L. How well do meteorological drought indices predict live fuel moisture content (LFMC)? An assessment for wildfire research and operations in Mediterranean ecosystems. Agric. For. Meteorol. 2018, 262, 391–401. [Google Scholar] [CrossRef]
- Jolly, W.M.; Johnson, D.M. Pyro-Ecophysiology: Shifting the Paradigm of Live Wildland Fuel Research. Fire 2018, 1, 8. [Google Scholar] [CrossRef]
- Weise, D.R.; Hartford, R.A.; Mahaffey, L. Assessing live fuel moisture for fire management applications. In Proceedings of the Fire in Ecosystem Management: Shifting the Paradigm from Suppression to Prescription; Pruden, T.L., Brennan, L.A., Eds.; Tall Timbers Research Station: Tallahassee, FL, USA, 1998; pp. 49–55. [Google Scholar]
- Burgan, R.E. Estimating Live Fuel Moisture for the 1978 National Fire Danger Rating System; Intermountain Forest and Range Experiment Station: Ogden, UT, USA, 1979. [Google Scholar]
- Koide, R.T.; Robichaux, R.H.; Morse, S.R.; Smith, C.M. Plant water status, hydraulic resistance and capacitance. In Plant Physiological Ecology: Field Methods and Instrumentation; Pearcy, R.W., Ehleringer, J.R., Mooney, H., Rundel, P.W., Eds.; Chapman and Hall: New York, NY, USA, 1991; pp. 161–183. [Google Scholar]
- Sack, L.; Cowan, P.D.; Jaikumar, N.; Holbrook, N.M. The “hydrology” of leaves: Co-ordination of structure and function in temperate woody species. Plant. Cell Environ. 2003, 26, 1343–1356. [Google Scholar] [CrossRef]
- Sack, L.; Pasquet-Kok, J.; Contributors. Leaf Pressure-Volume Curve Parameters. Available online: http://prometheuswiki.org/tiki-index.php?page=Leaf+pressure-volume+curve+parameters (accessed on 30 June 2013).
- R Core Team. R: A Language and Environment for Statistical Computing; R Core Team: Vienna, Austria, 2016. [Google Scholar]
- Hollander, M.; Wolfe, D.A. Nonparametric Statistical Methods; Wiley: New York, NY, USA, 1973. [Google Scholar]
- Press, W.; BP, F.; Teukolsky, S.; Vetterling, W. Numerical Recipes in C; Cambridge University Press: Cambridge, UK, 1988. [Google Scholar]
- Royston, J.P. An Extension of Shapiro and Wilk’s W Test for Normality to Large Samples. Appl. Stat. 1982, 31, 115. [Google Scholar] [CrossRef]
- Pratt, R.B.; Jacobsen, A.L.; Mohla, R.; Ewers, F.W.; Davis, S.D. Linkage between water stress tolerance and life history type in seedlings of nine chaparral species (Rhamnaceae). J. Ecol. 2008, 96, 1252–1265. [Google Scholar] [CrossRef]
- Jacobsen, A.L.; Pratt, R.B.; Ewers, F.W.; Davis, S.D. Cavitation resistance among 26 chaparral species of southern California. Ecol. Monogr. 2007, 77, 99–115. [Google Scholar] [CrossRef]
- Malanson, G.P.; O’Leary, J.F. Post-fire regeneration strategies of Californian coastal sage shrubs. Oecologia 1982, 53, 355–358. [Google Scholar] [CrossRef]
- Bhaskar, R.; Ackerly, D.D. Ecological relevance of minimum seasonal water potentials. Physiol. Plant. 2006, 127, 353–359. [Google Scholar] [CrossRef]
- Martin-StPaul, N.; Delzon, S.; Cochard, H. Plant resistance to drought depends on timely stomatal closure. Ecol. Lett. 2017, 20, 1437–1447. [Google Scholar] [CrossRef]
- Green, L.R. Burning by Prescription in Chaparral; General Technical Report PSW-51; United States Department of Agriculture Forest Service: Berkeley, CA, USA, 1981.
- Pivovaroff, A.L.; Pasquini, S.C.; De Guzman, M.E.; Alstad, K.P.; Stemke, J.S.; Santiago, L.S. Multiple strategies for drought survival among woody plant species. Funct. Ecol. 2016, 30, 517–526. [Google Scholar] [CrossRef]
- Dennison, P.E.; Moritz, M.A. Critical live fuel moisture in chaparral ecosystems: a threshold for fire activity and its relationship to antecedent precipitation. Int. J. Wildl. Fire 2009, 18, 1021–1027. [Google Scholar] [CrossRef]
- Pimont, F.; Ruffault, J.; Martin-StPaul, N.; Dupuy, J.L. A cautionary note regarding the use of cumulative burnt areas for the determination of fire danger index breakpoints. Int. J. Wildl. Fire 2019, 254–258. [Google Scholar] [CrossRef]
- Emery, N.; Roth, K.; Pivovaroff, A.L. Flowering phenology associated with plant flammability. 2019; submitted. [Google Scholar]
- Jolly, W.M.; Hadlow, A.M.; Huguet, K. De-coupling seasonal changes in water content and dry matter to predict live conifer foliar moisture content. Int. J. Wildl. Fire 2014, 23, 480–489. [Google Scholar] [CrossRef] [Green Version]
- Qi, Y.; Dennison, P.E.; Jolly, W.M.; Kropp, R.C.; Brewer, S.C. Spectroscopic analysis of seasonal changes in live fuel moisture content and leaf dry mass. Remote Sens. Environ. 2014, 150, 198–206. [Google Scholar] [CrossRef] [Green Version]
- Tyree, M.T.; Yang, S. Water-storage capacity of Thuja, Tsuga and Acer stems measured by dehydration isotherms. Planta 1990, 182, 420–426. [Google Scholar] [CrossRef]
- Pivovaroff, A.L.; Burlett, R.; Lavigne, B.; Cochard, H.; Santiago, L.S.; Delzon, S. Testing the ‘microbubble effect’ using the Cavitron technique to measure xylem water extraction curves. AoB Plants 2016, 8, plw011. [Google Scholar] [CrossRef] [PubMed]
- Hanes, T.L. Succession after fire in the chaparral of southern California. Ecol. Monogr. 1971, 41, 27–52. [Google Scholar] [CrossRef]
- Philpot, C.W. Vegetative Features as Determinants of Fire Frequency and Intensity; United States Department of Agriculture Forest Service: Palo Alto, CA, USA, 1977.
- Countryman, C.M.; Philpot, C.W. Physical Characteristics of Chamise as a Wildland Fuel; Res. Pap. PSW-66; United States Department of Agriculture Forest Service: Berkeley, CA, USA, 1970.
- Dennison, P.E.; Brewer, S.D.; Arnold, J.D.; Moritz, M.A. Geophysical Research Letters. Geophys. Prospect. 2014, 41, 2928–2933. [Google Scholar]
Figure 1.
Mean live fuel moisture content (LFMC) ± standard error, measured for Adenostoma fasciculatum at Stunt Ranch Santa Monica Mountains Research Reserve from 2006–2016, represented by the solid black symbols and line. The red dashed line indicates the 60% critical LFMC threshold used by local fire departments, while the orange dash-dotted line indicates the 79% threshold from Dennison and Moritz (2009).

Figure 2.
(A) Weather data for July 2015 to May 2016, including mean daily air temperature (red line), total daily precipitation (blue line), and mean daily soil moisture (green line), measured from the Stunt Ranch Santa Monica Mountains Research Reserve weather station. (B) Live fuel moisture content including the 60% critical threshold used by Los Angeles County Fire Department and (C) midday water potential measured for 11 species at Stunt Ranch.

Figure 3.
Live fuel moisture content (LMFC) versus water potential (Ψ) for 11 species measured at the Stunt Ranch Santa Monica Mountains Research Reserve from July 2015–May 2016 (grey symbols). Each grey symbol represents a data point. The solid black line represents the 60% critical LFMC threshold used by fire departments in southern California. Dotted lines represent the 95% confidence intervals for Ψ and LFMC; the intersection of the confidence intervals represents the LFMC versus Ψ inflection point (LFMCIP). At the top of the figure, there is a conceptual explanation of abiotic conditions and physiological responses associated with LFMC and Ψ changes.

Figure 4.
Correlogram of all traits measured for 11 species at the Stunt Ranch Santa Monica Mountain Research Reserve from July 2015–May 2016. Blue indicates a positive correlation while red indicates a negative correlation. Blank squares indicate the correlation was not significant at α = 0.05. Abbreviations and units are found under the “Abbreviations” table.


Table 1.
Study species, including family, leaf phenology, post-fire regeneration type, the live fuel moisture content inflection point (LFMCIP) ± standard error, and the turgor loss point (ΨTLP; MPa) ± standard error at the Stunt Ranch Santa Monica Mountains Reserve. Sources of post-fire regeneration type: [31]1, [32]2, [33]3. For ΨTLP, different letter superscripts indicate significant differences (p < 0.05).
| Species | Family | Leaf Phenology | Post-Fire Regeneration Type | LFMCIP | ΨTLP |
|---|---|---|---|---|---|
| Adenostoma fasciculatum | Rosaceae | Evergreen | Facultative sprouter 2 | 77% ± 5 | −3.40 ± 0.17 B |
| Arctostaphylos glandulosa | Ericaceae | Evergreen | Facultative sprouter 2 | 86% ± 4 | −2.51 ± 0.27 B,C |
| Ceanothus spinosus | Rhamnaceae | Evergreen | Facultative sprouter 1 | 121% ± 19 | −2.80 ± 0.29 B,C |
| Cercocarpus betuloides | Rosaceae | Evergreen | Obligate sprouter 2 | 71% ± 5 | −2.02 ± 0.09 A,C |
| Eriogonum fasciculatum | Polygonaceae | Semi-deciduous | Reseeder 3 | 67% ± 5 | −3.23 ± 0.20 B |
| Heteromeles arbutifolia | Rosaceae | Evergreen | Obligate sprouter 2 | 98% ± 14 | −2.70 ± 0.21 B,C |
| Malosma laurina | Anacardiaceae | Evergreen | Facultative sprouter 2 | 92% ± 10 | −2.07 ± 0.14 A,C |
| Quercus agrifolia | Fagaceae | Evergreen | Obligate sprouter 2 | 93% ± 12 | −2.61 ± 0.27 B,C |
| Quercus berberidifolia | Fagaceae | Evergreen | Obligate sprouter 2 | 81% ± 4 | −1.97 ± 0.22 A,C |
| Salvia leucophylla | Lamiaceae | Drought-deciduous | Reseeder 3 | 85% ± 4 | −1.47 ± 0.11 A |
| Salvia mellifera | Lamiaceae | Drought-deciduous | Reseeder 3 | 116% ± 8 | −2.08 ± 0.14 A,C |
© 2019 by the authors. Licensee MDPI, Basel, Switzerland. This article is an open access article distributed under the terms and conditions of the Creative Commons Attribution (CC BY) license (http://creativecommons.org/licenses/by/4.0/).
Share and Cite
MDPI and ACS Style
Pivovaroff, A.L.; Emery, N.; Sharifi, M.R.; Witter, M.; Keeley, J.E.; Rundel, P.W. The Effect of Ecophysiological Traits on Live Fuel Moisture Content. Fire 2019, 2, 28. https://0-doi-org.brum.beds.ac.uk/10.3390/fire2020028
AMA Style
Pivovaroff AL, Emery N, Sharifi MR, Witter M, Keeley JE, Rundel PW. The Effect of Ecophysiological Traits on Live Fuel Moisture Content. Fire. 2019; 2(2):28. https://0-doi-org.brum.beds.ac.uk/10.3390/fire2020028
Chicago/Turabian StylePivovaroff, Alexandria L., Nathan Emery, M. Rasoul Sharifi, Marti Witter, Jon E. Keeley, and Philip W. Rundel. 2019. "The Effect of Ecophysiological Traits on Live Fuel Moisture Content" Fire 2, no. 2: 28. https://0-doi-org.brum.beds.ac.uk/10.3390/fire2020028