
A Combination of Human Activity and Climate Drives Forest Fire Occurrence in Central Europe: The Case of the Czech Republic


Abstract
:1. Introduction
2. Materials and Methods
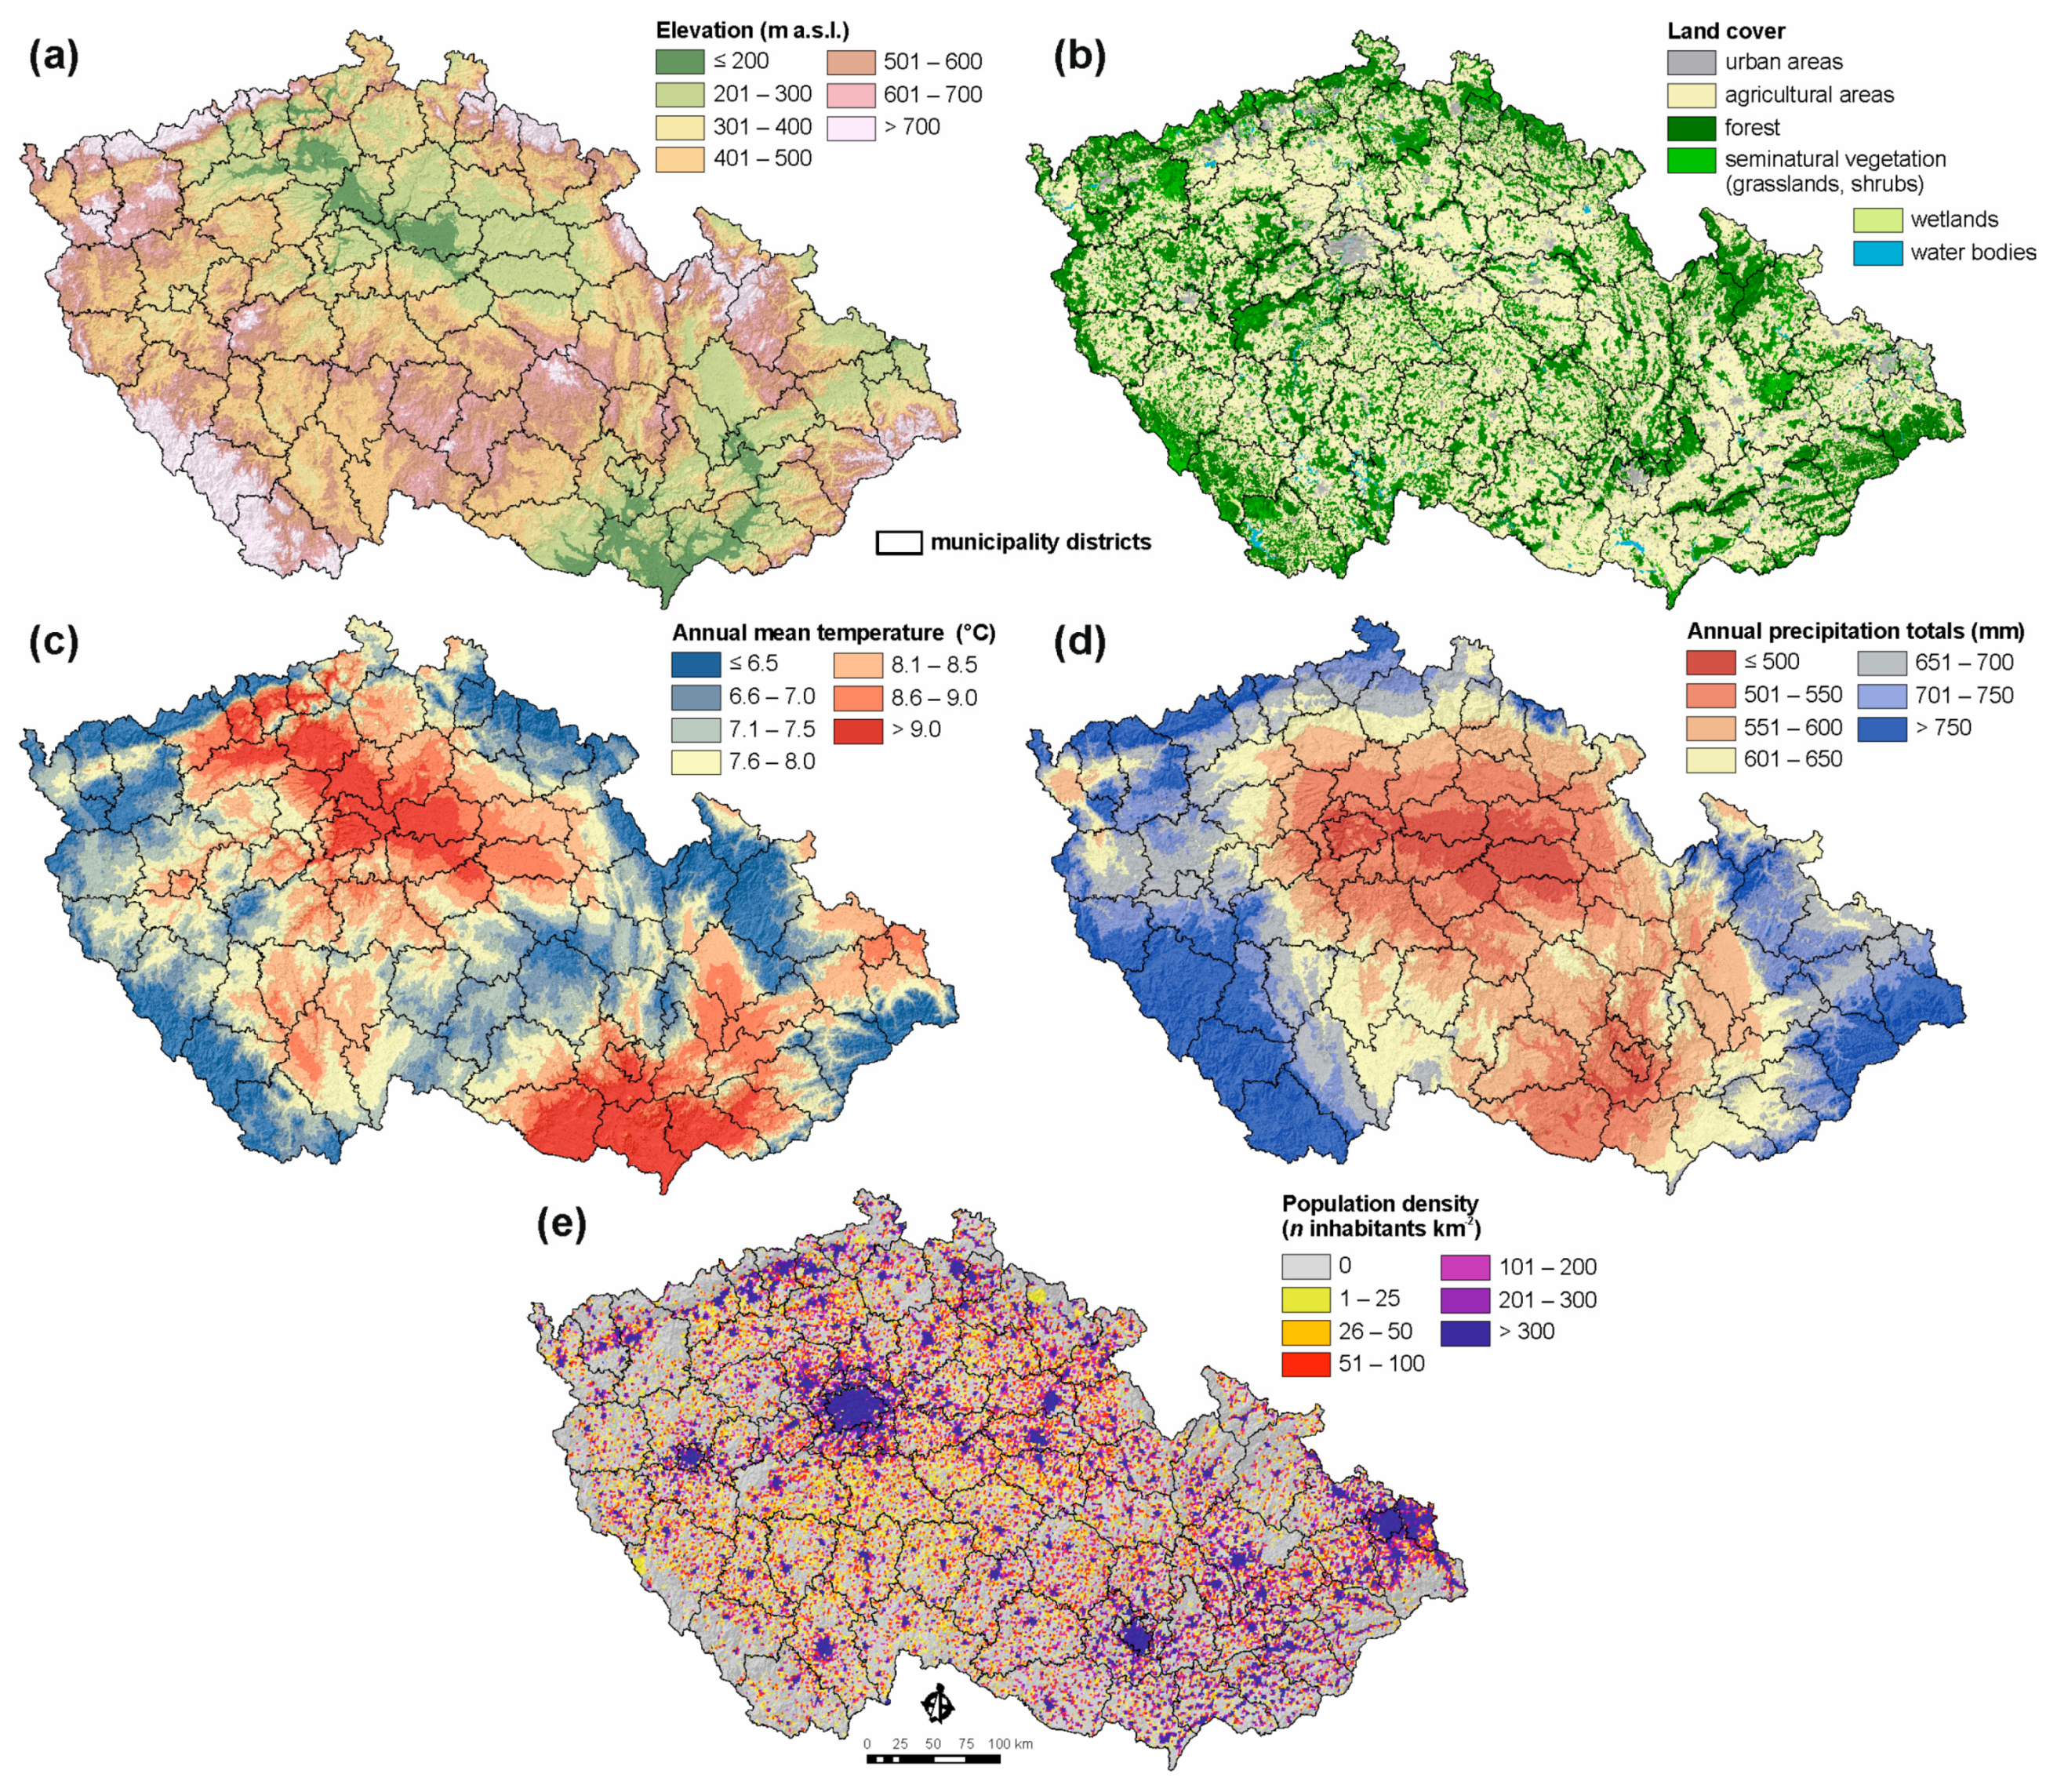
2.1. Study Area and Data
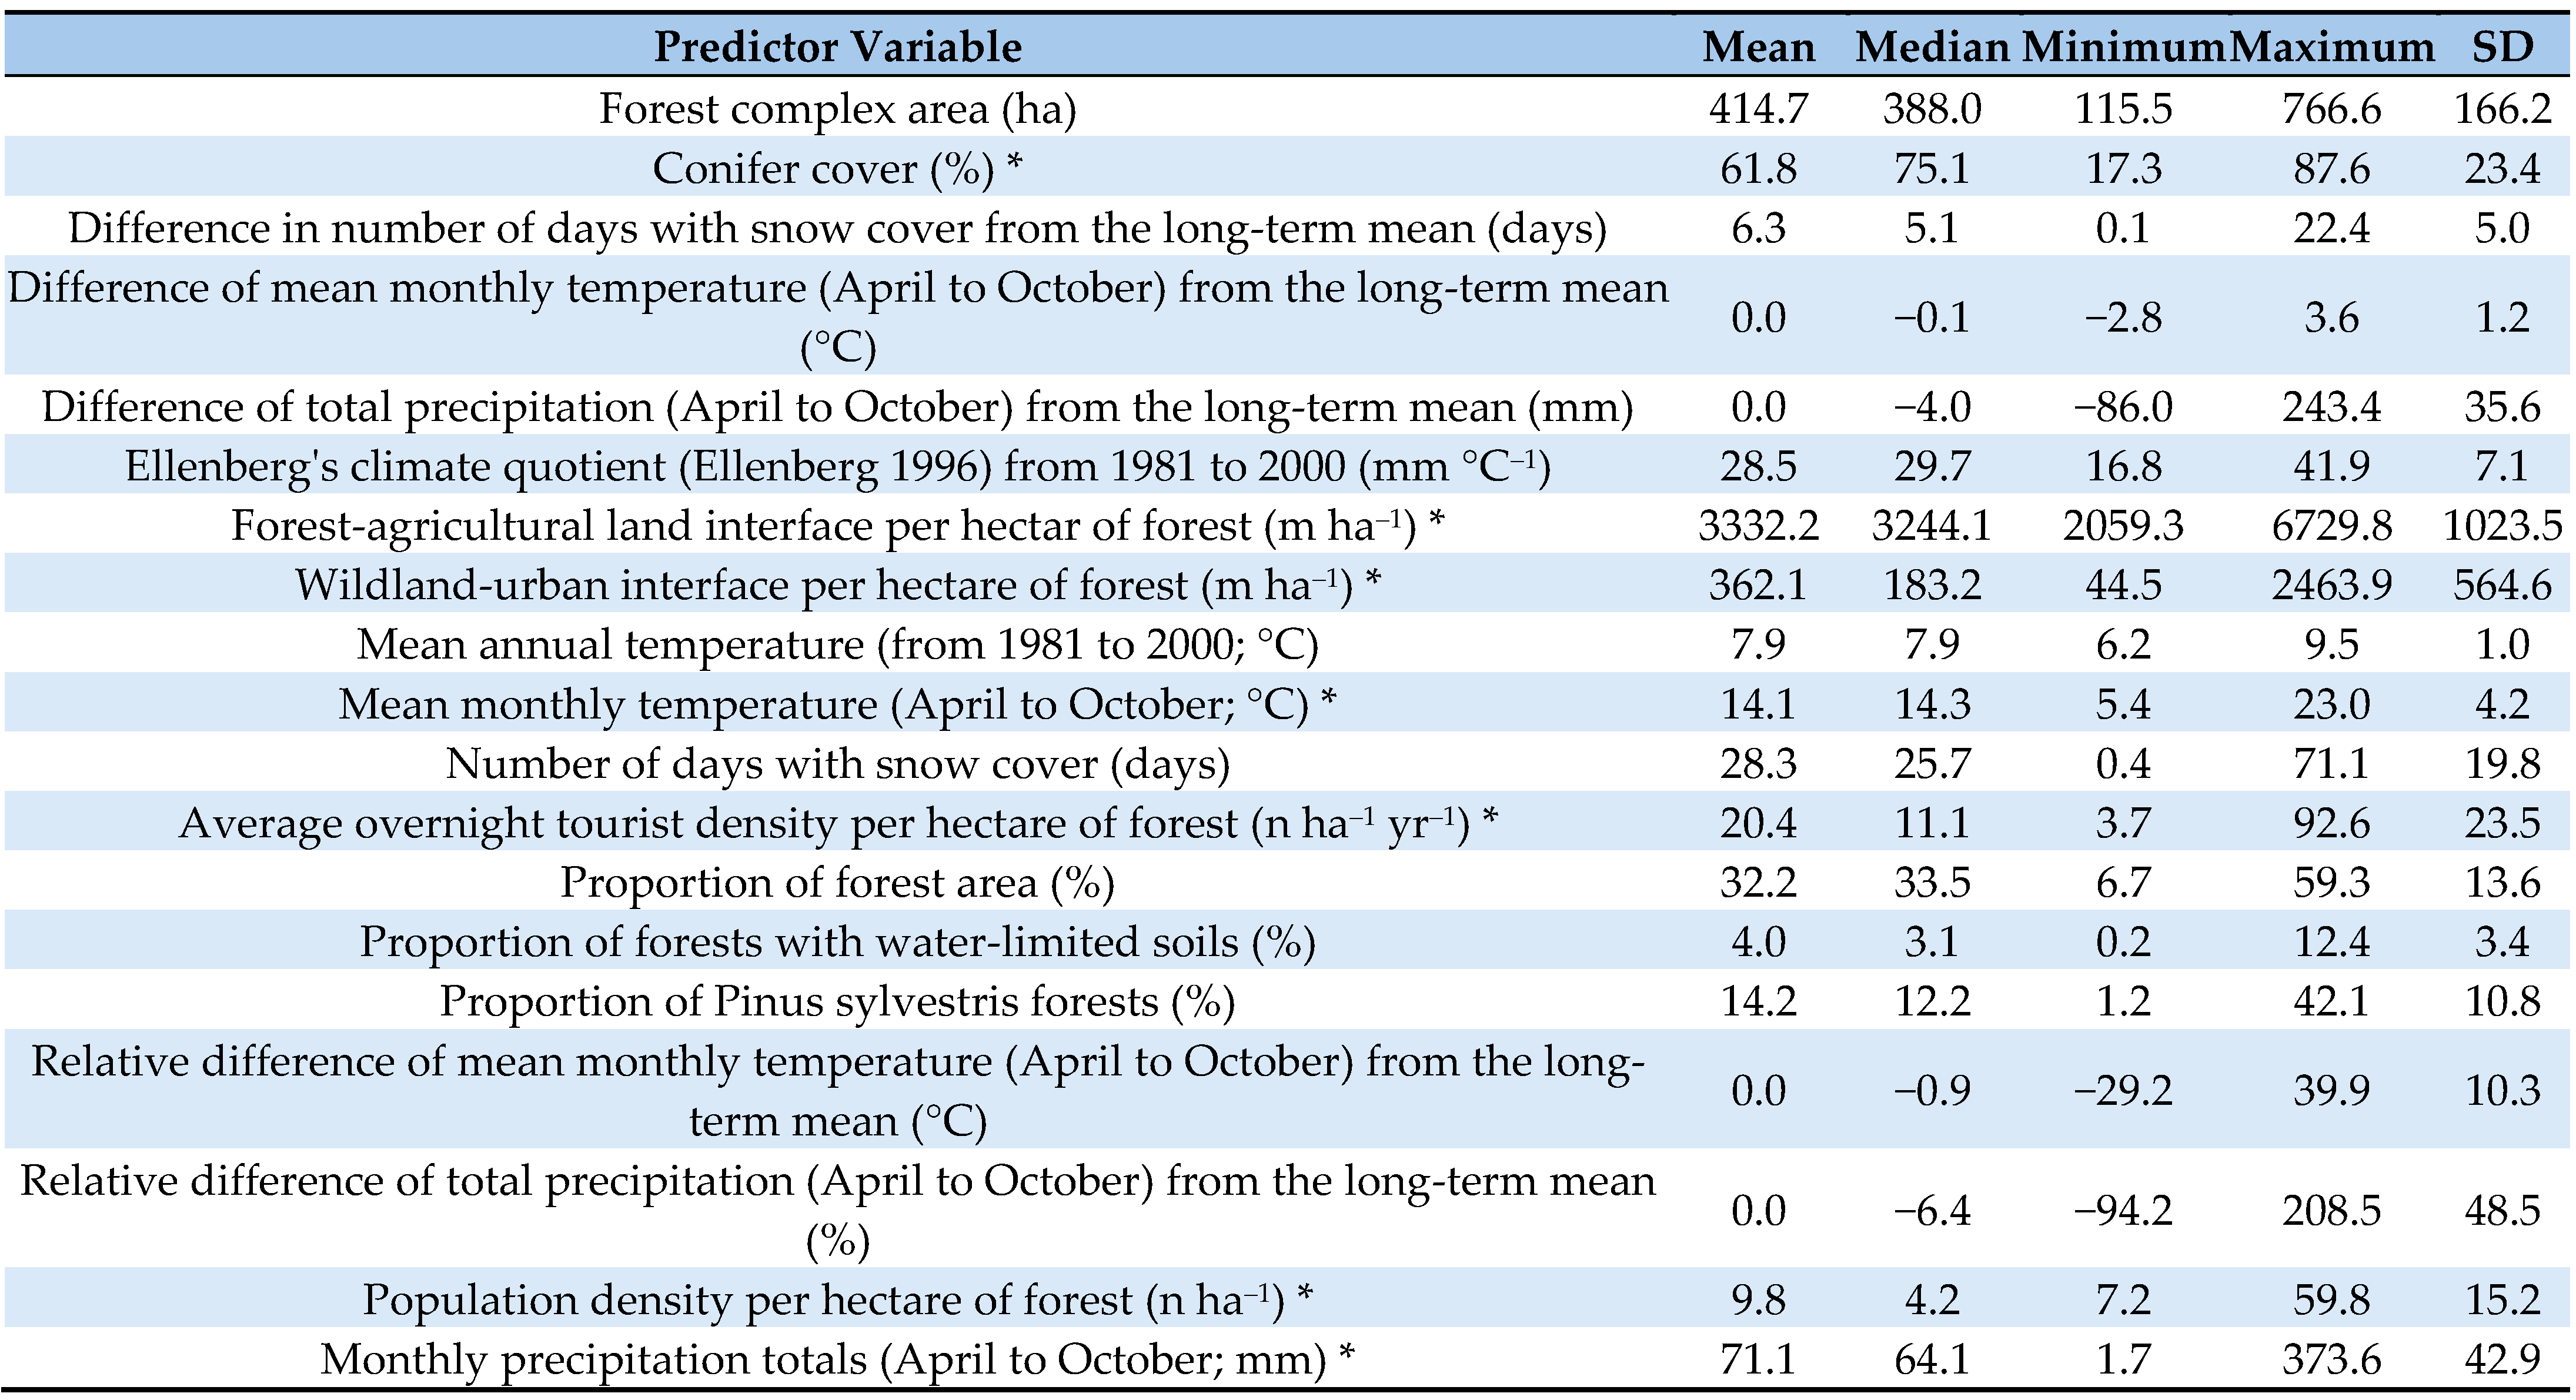
2.2. Predictor Variables
2.3. Analyses
3. Results
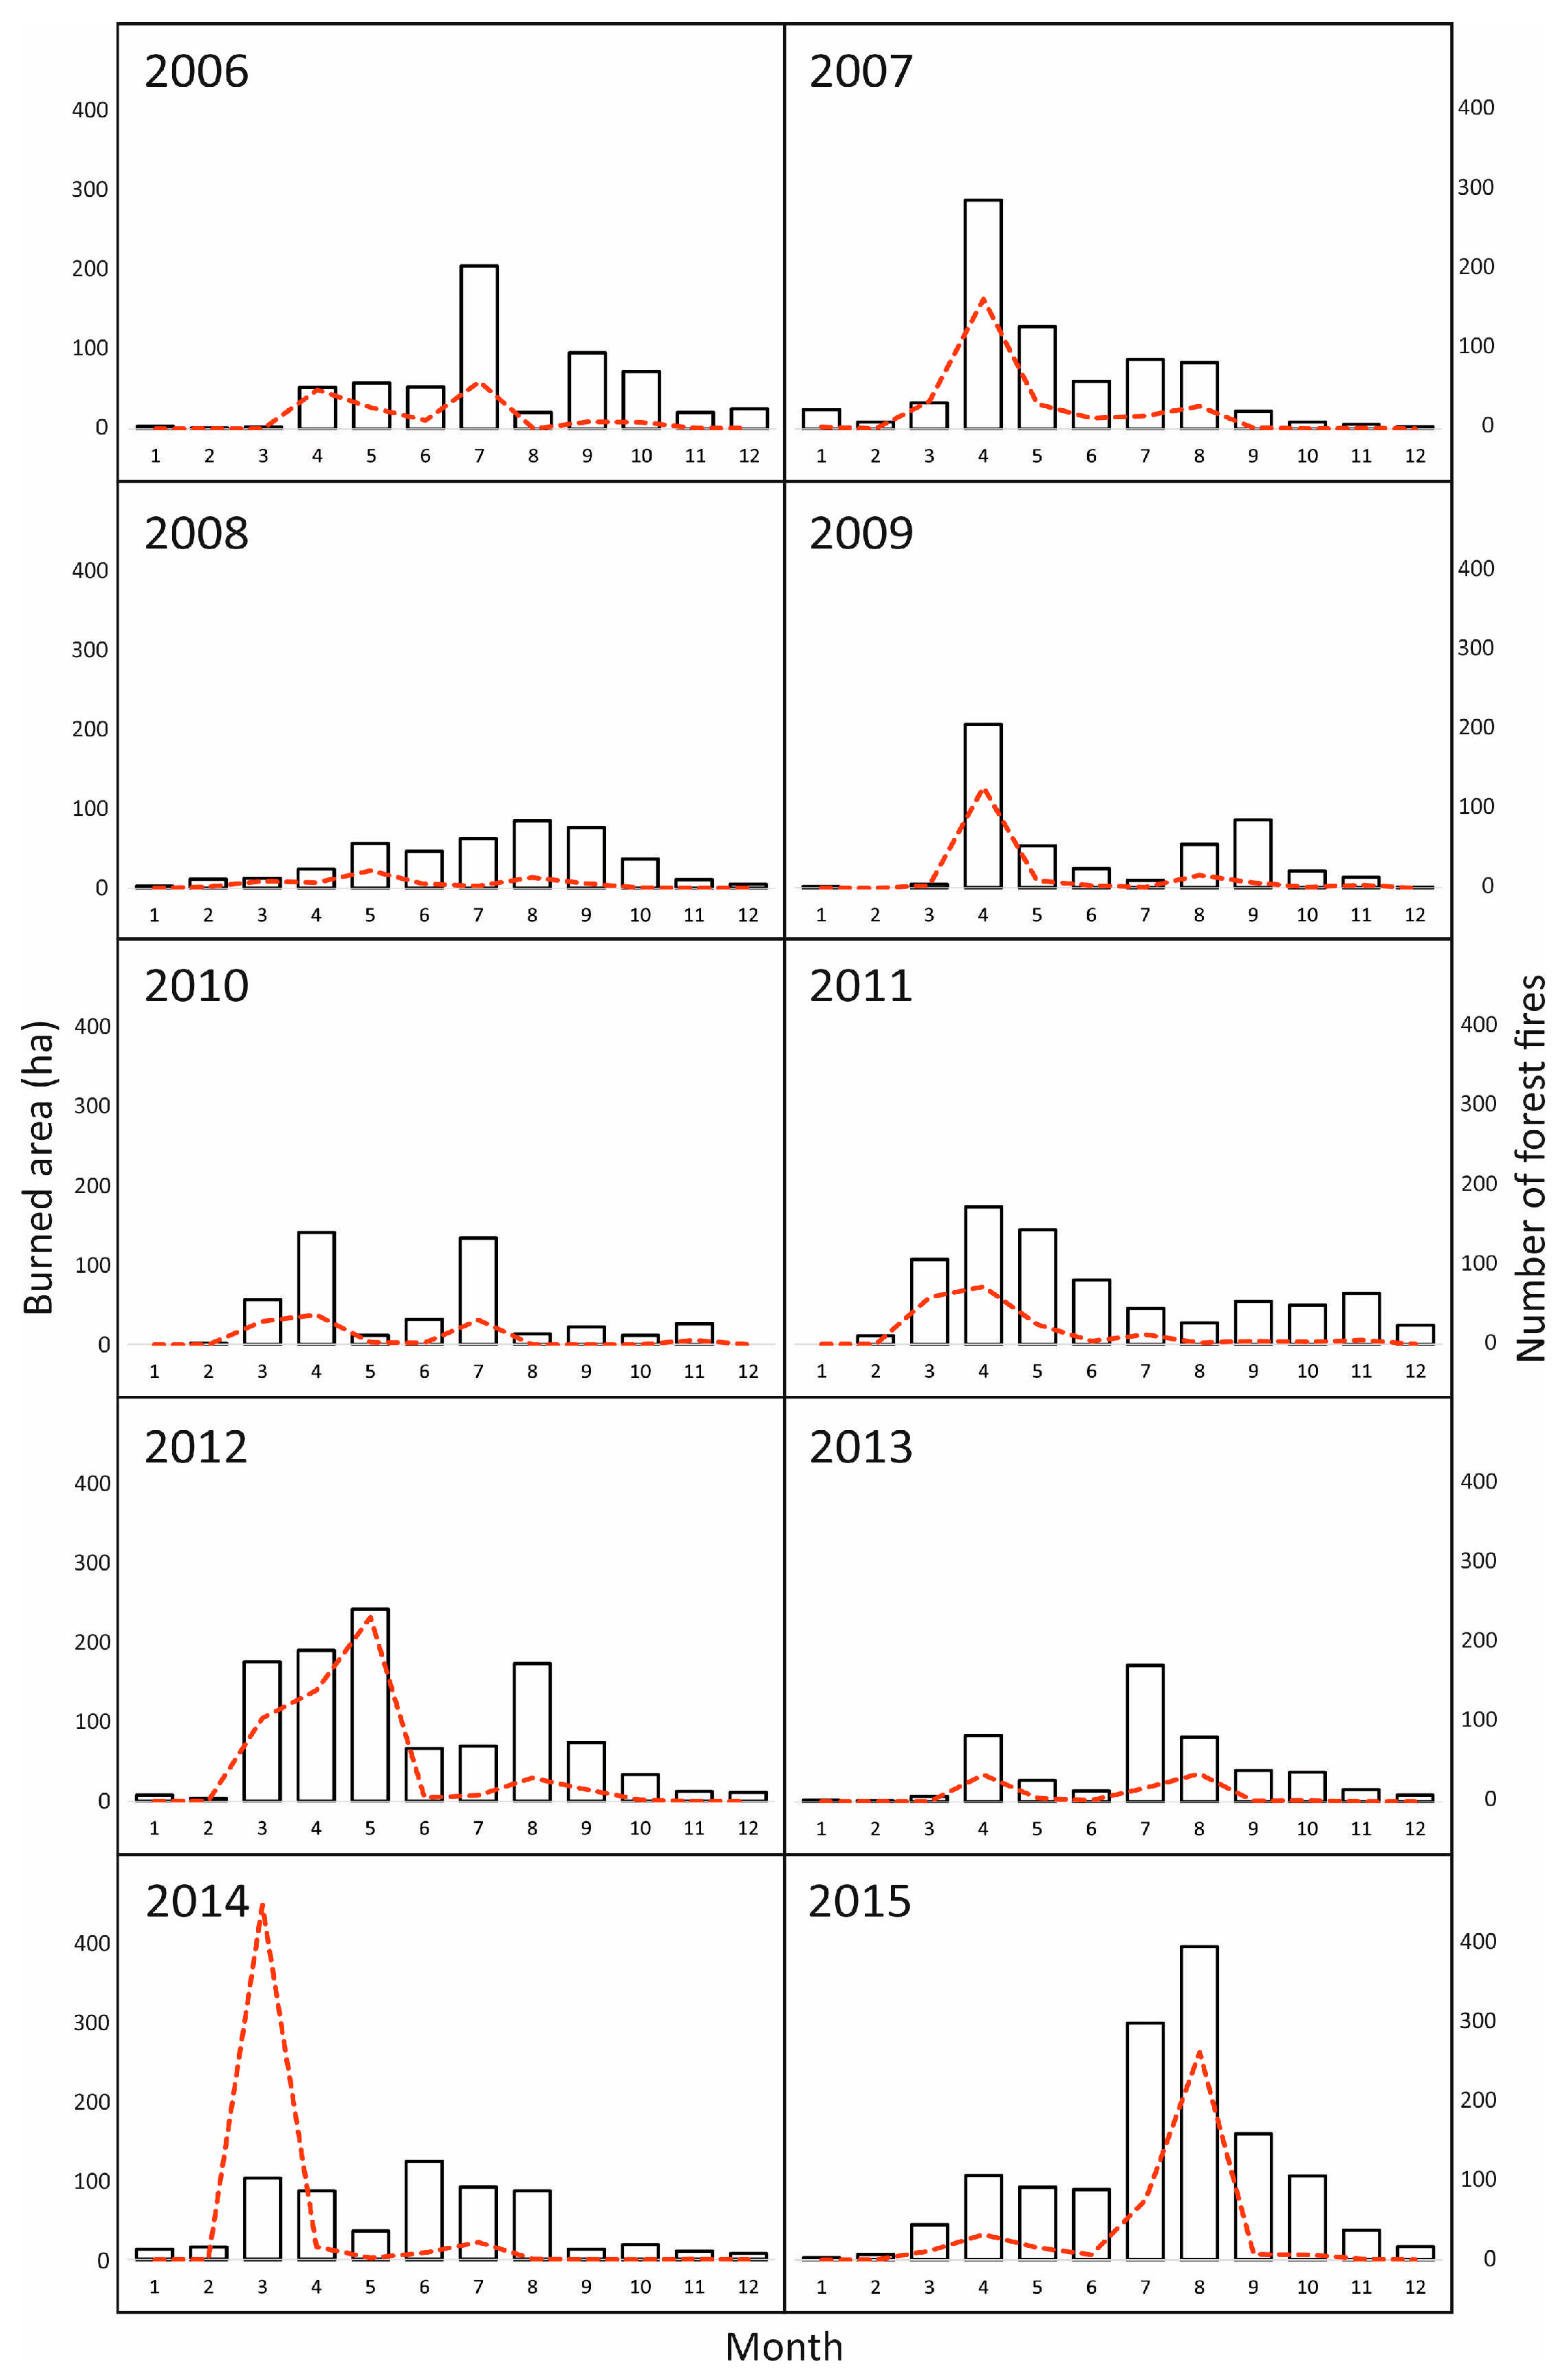
3.1. Temporal Forest Fire Patterns
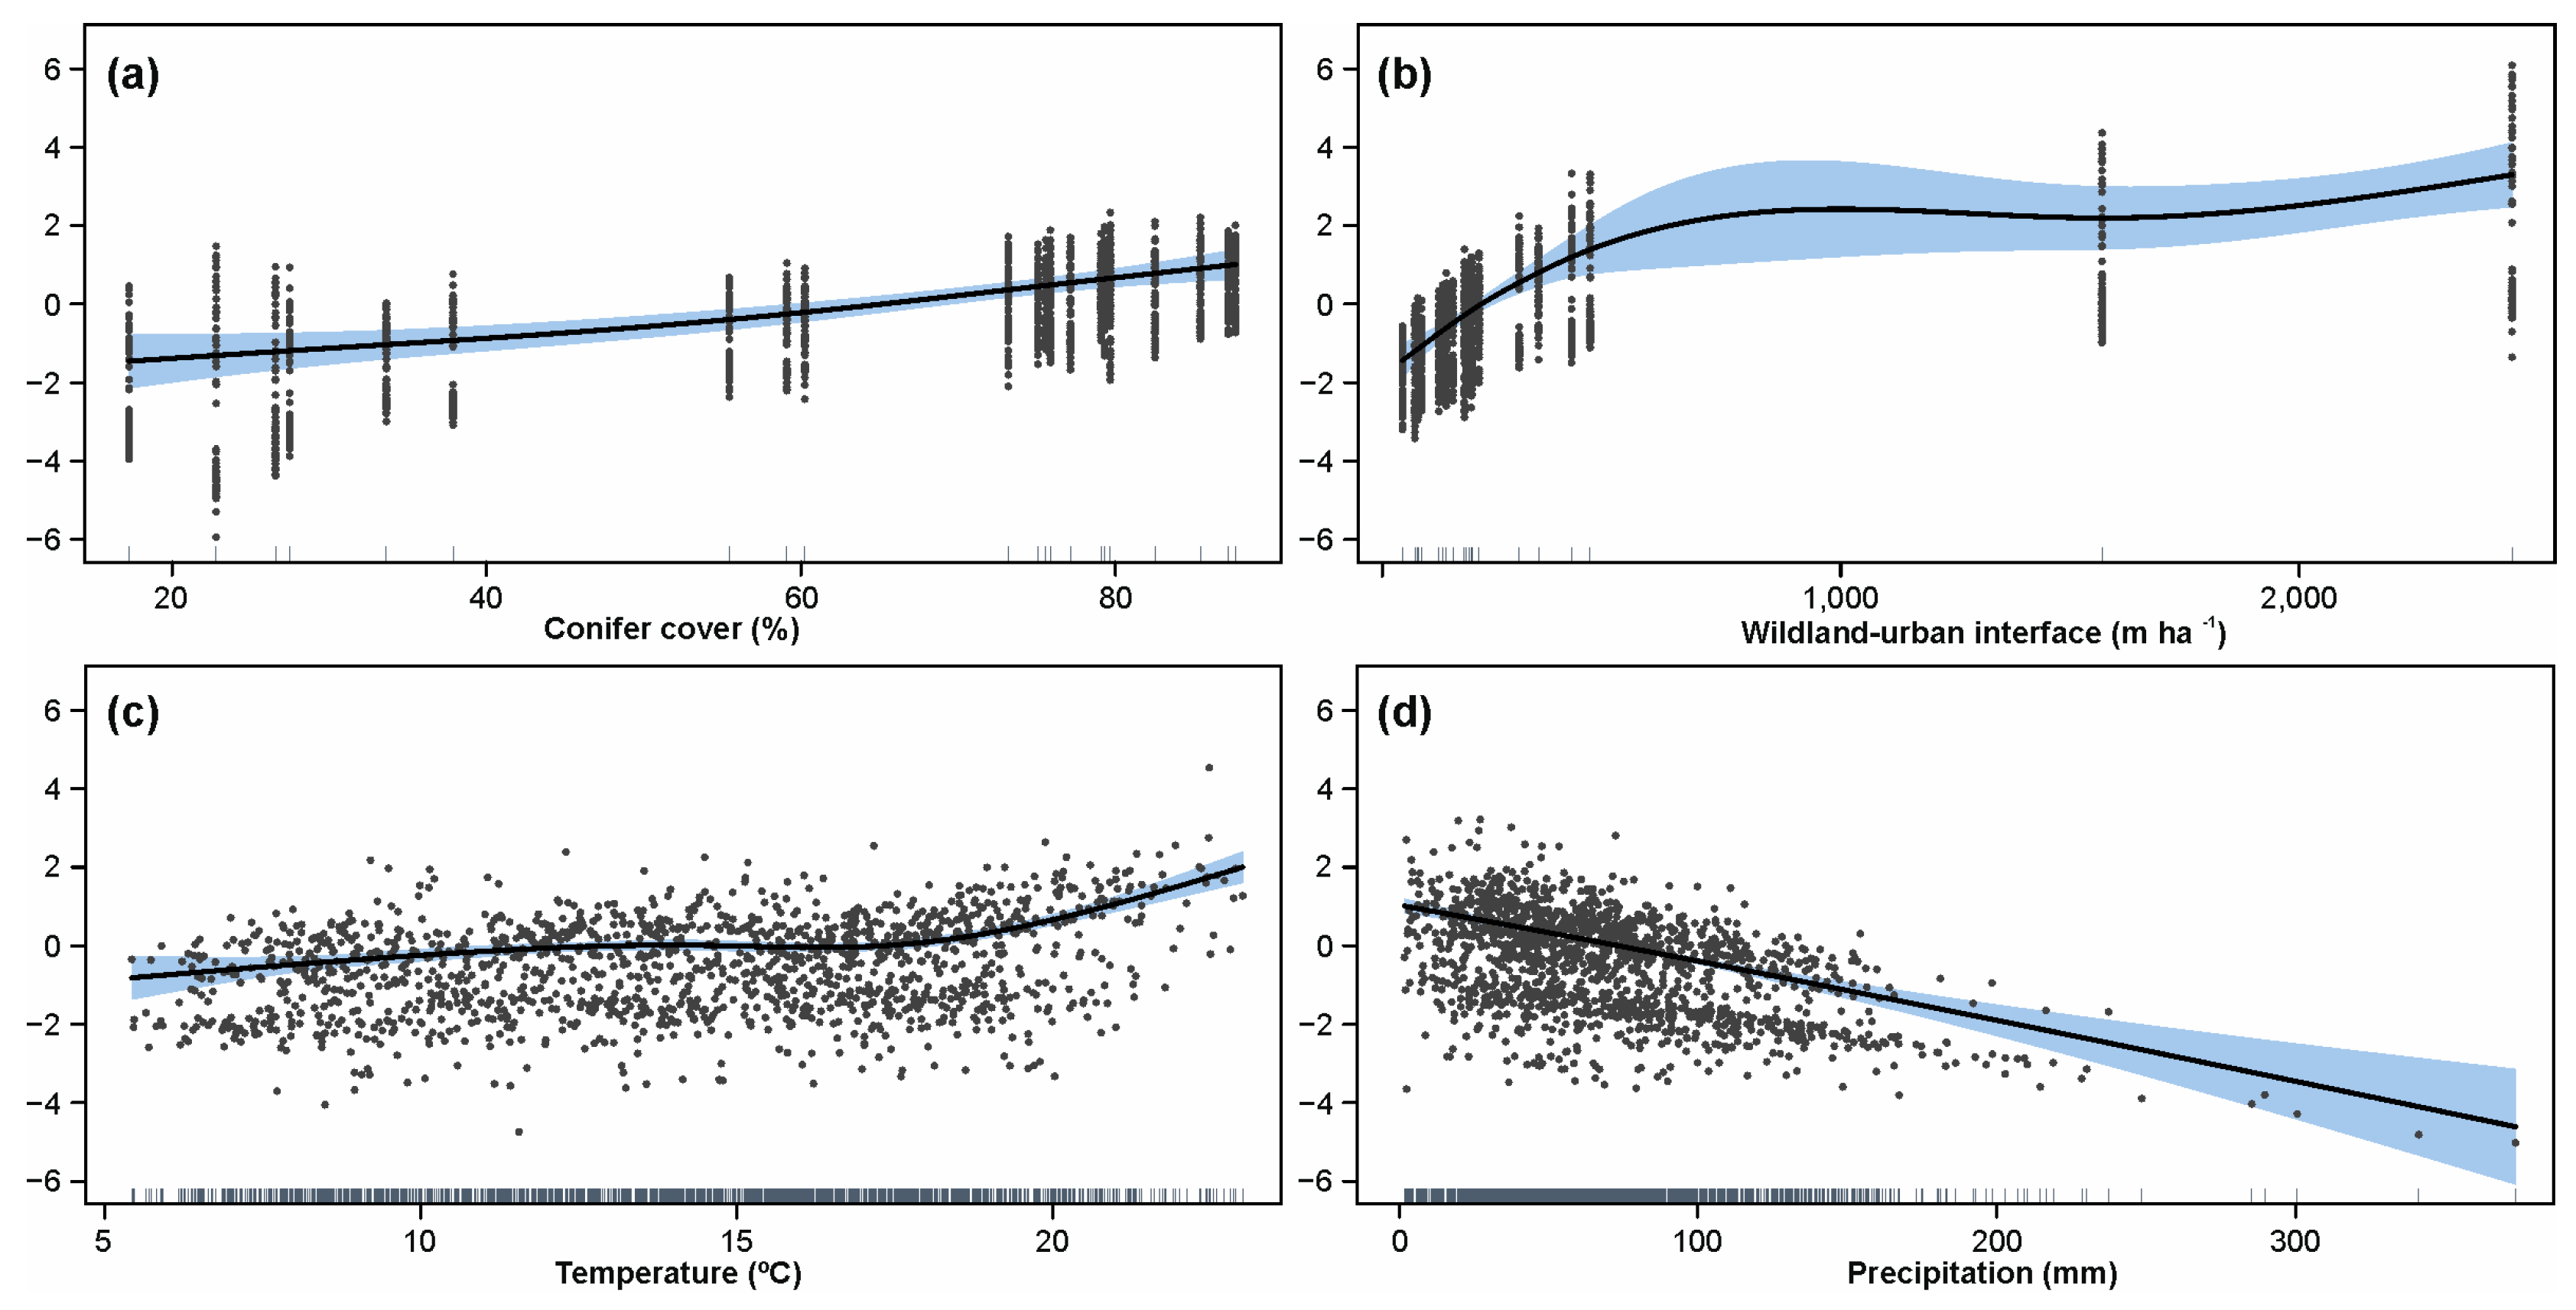
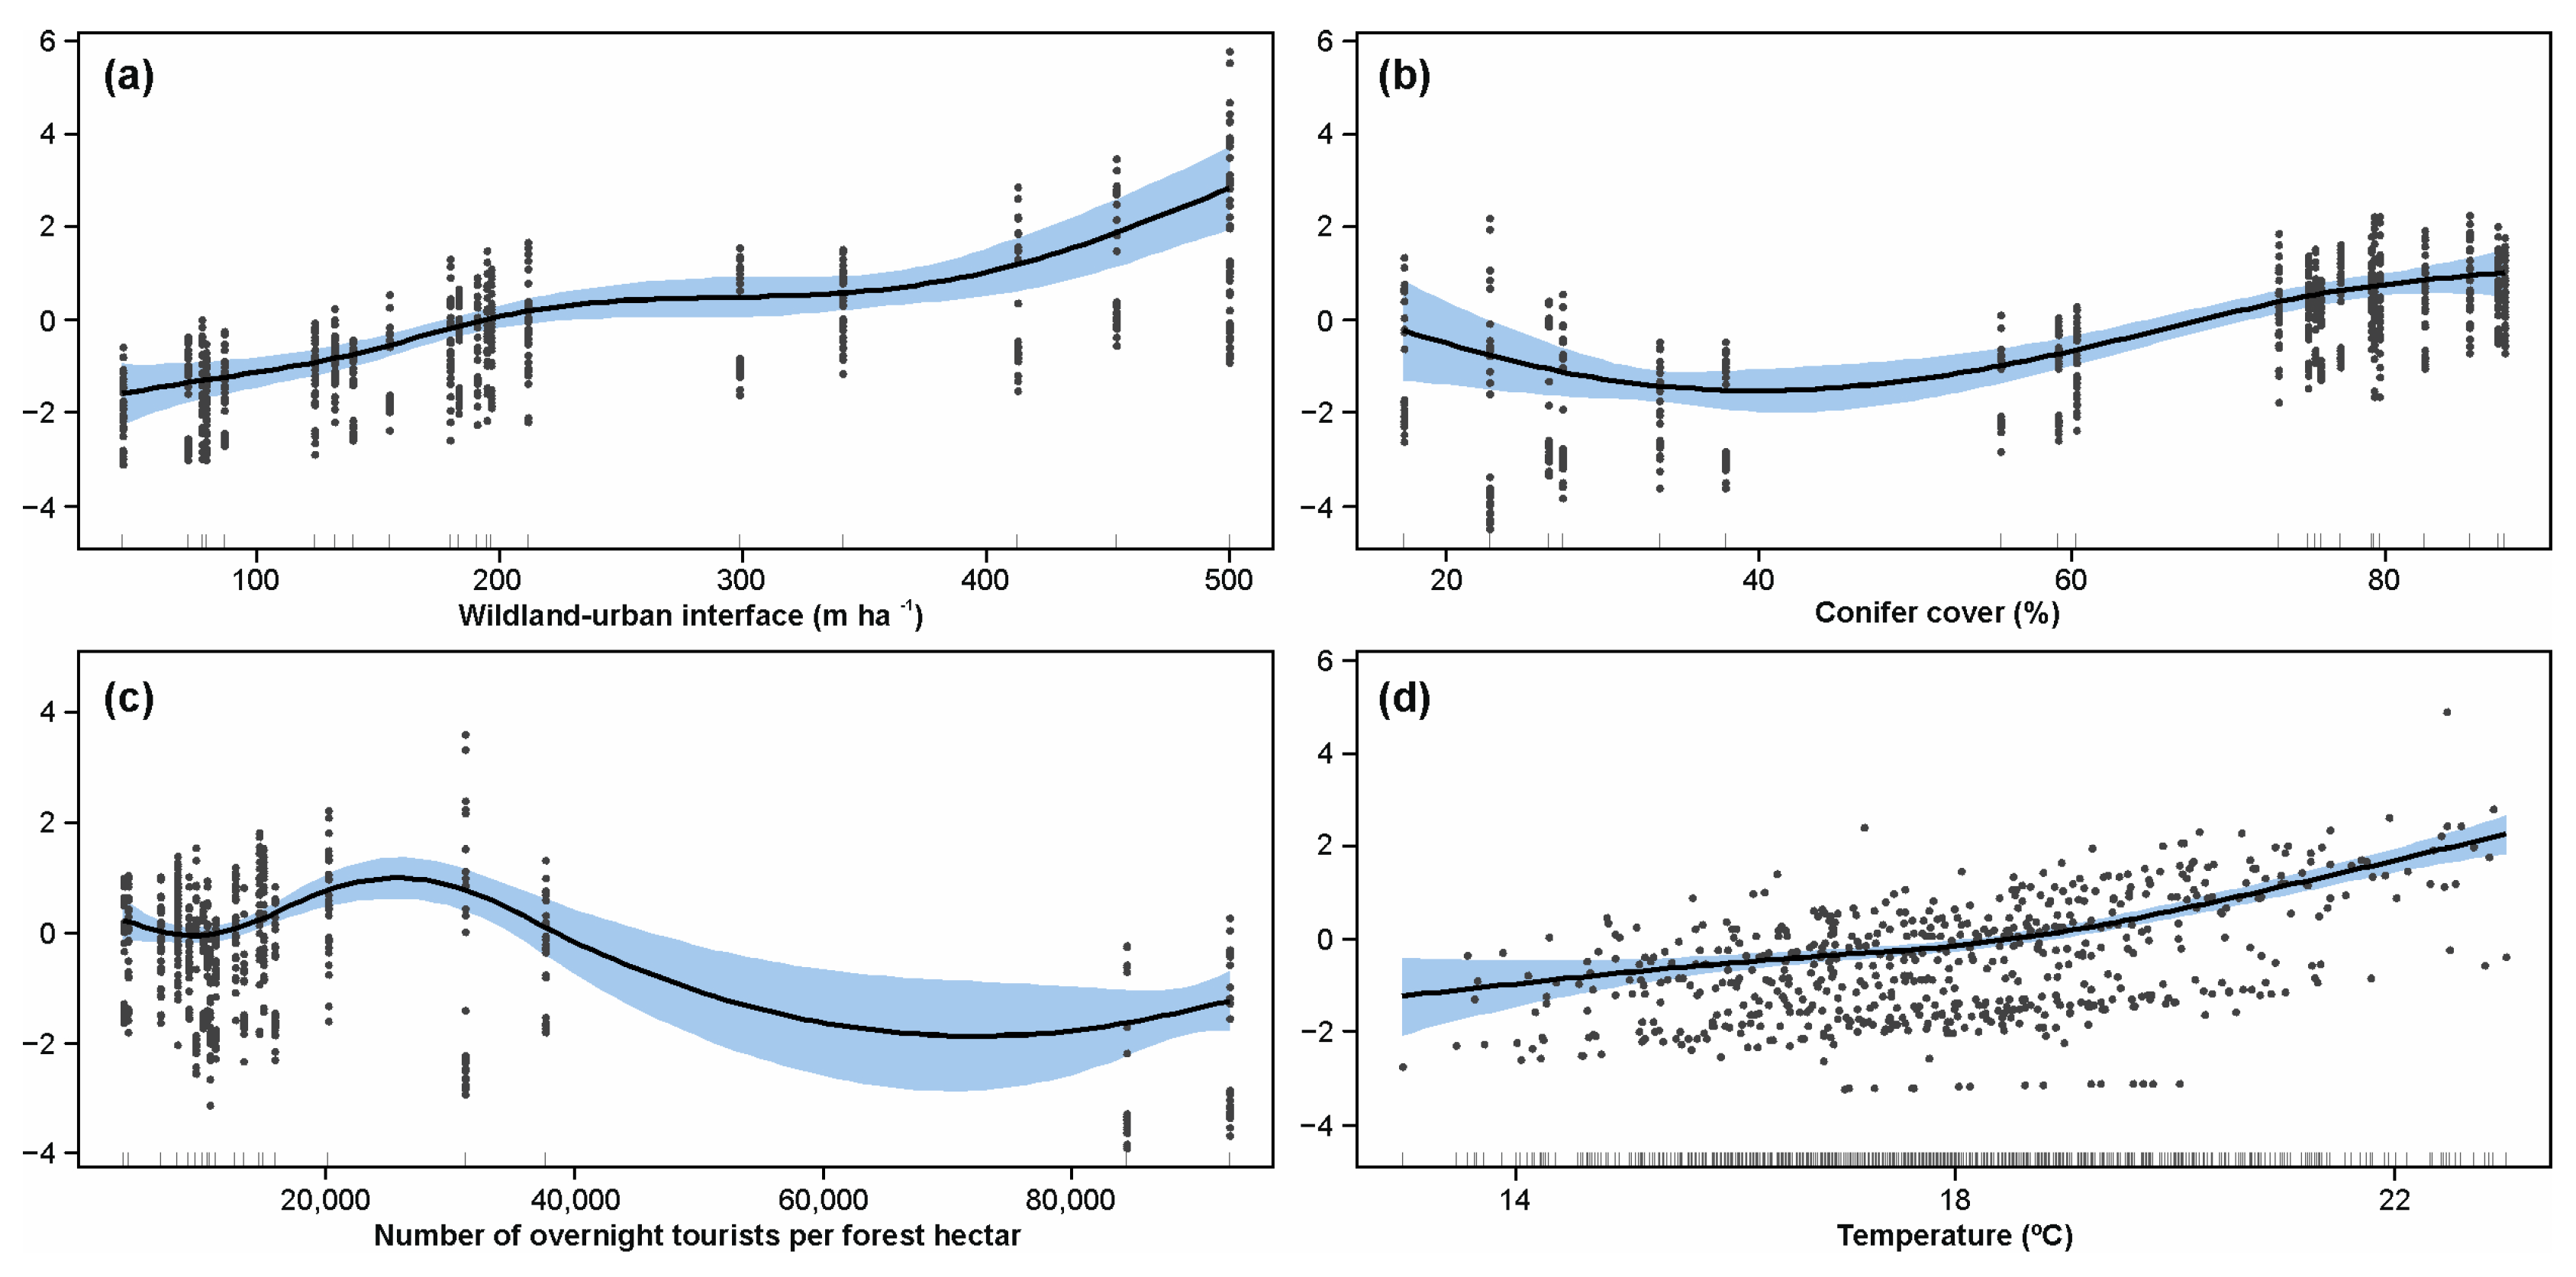
3.2. Fire Ignition Drivers
4. Discussion
4.1. Patterns and Drivers of Forest Fires
4.2. Methodological Considerations
4.3. Practical Implications
5. Conclusions
Author Contributions
Funding
Data Availability Statement
Acknowledgments
Conflicts of Interest
Appendix A

Appendix B

Appendix C

References
- Patacca, M.; Lindner, M.; Lucas-Borja, M.E.; Cordonnier, T.; Fidej, G.; Gardiner, B.; Hauf, Y.; Jasinevičius, G.; Labonne, S.; Linkevičius, E.; et al. Significant increase in natural disturbance impacts on European forests since 1950. Glob. Chang. Biol. 2023, 29, 1359–1376. [Google Scholar] [CrossRef]
- Grünig, M.; Seidl, R.; Senf, C. Increasing aridity causes larger and more severe forest fires across Europe. Glob. Chang. Biol. 2023, 29, 1648–1659. [Google Scholar] [CrossRef] [PubMed]
- Giorgio, L.; Artés, V.T.; Thaïs, L.; Hugo, C.; Jesús, S.-M.-A.; Alfredo, B.; Tracy, D.; Fabio, L.; Daniel, N.; Christofer, A.A.; et al. Forest fires in Europe, Middle East and North Africa 2017; Publications Office of the European Union technical report EUR 29318 EN; Publications Office of the European Union: Luxembourg, 2018. [Google Scholar] [CrossRef]
- Krüger, R.; Blanch Gorriz, X.; Grothum, O.; Eltner, A. Using multi-scale and multi-model datasets for post-event assessment of wildfires. In Proceedings of the Poster Presentation of the European Geosciences Union General Assembly 2023, Vienna, Austria & Online, 23–28 April 2023. EGU23-13008. [Google Scholar] [CrossRef]
- Walker, X.J.; Rogers, B.M.; Veraverbeke, S.; Johnstone, J.F.; Baltzer, J.L.; Barrett, K.; Bourgeau-Chavez, L.; Day, N.J.; de Groot, W.J.; Dieleman, C.M.; et al. Fuel availability not fire weather controls boreal wildfire severity and carbon emissions. Nat. Clim. Chang. 2020, 10, 1130–1136. [Google Scholar] [CrossRef]
- Littell, J.S.; McKenzie, D.; Peterson, D.L.; Westerling, A.L. Climate and wildfire area burned in western U.S. ecoprovinces, 1916–2003. Ecol. Appl. 2009, 19, 1003–1021. [Google Scholar] [CrossRef] [PubMed]
- Forzieri, G.; Girardello, M.; Ceccherini, G.; Spinoni, J.; Feyen, L.; Hartmann, H.; Beck, P.S.A.; Camps-Valls, G.; Chirici, G.; Mauri, A.; et al. Emergent vulnerability to climate-driven disturbances in European forests. Nat. Commun. 2021, 12, 1081. [Google Scholar] [CrossRef]
- Ruffault, J.; Moron, V.; Trigo, R.M.; Curt, T. Objective identification of multiple large fire climatologies: An application to a Mediterranean ecosystem. Environ. Res. Lett. 2016, 11, 75006. [Google Scholar] [CrossRef]
- Bedia, J.; Golding, N.; Casanueva, A.; Iturbide, M.; Buontempo, C.; Gutiérrez, J.M. Seasonal predictions of Fire Weather Index: Paving the way for their operational applicability in Mediterranean Europe. Clim. Serv. 2018, 9, 101–110. [Google Scholar] [CrossRef]
- Kasischke, E.S.; Turetsky, M.R. Recent changes in the fire regime across the North American boreal region—Spatial and temporal patterns of burning across Canada and Alaska. Geophys. Res. Lett. 2006, 33, L09703. [Google Scholar] [CrossRef]
- Turetsky, M.R.; Benscoter, B.; Page, S.; Rein, G.; van der Werf, G.R.; Watts, A. Global vulnerability of peatlands to fire and carbon loss. Nat. Geosci. 2015, 8, 11–14. [Google Scholar] [CrossRef]
- Field, R.D.; van der Werf, G.R.; Fanin, T.; Fetzer, E.J.; Fuller, R.; Jethva, H.; Levy, R.; Livesey, N.J.; Luo, M.; Torres, O.; et al. Indonesian fire activity and smoke pollution in 2015 show persistent nonlinear sensitivity to El Niño-induced drought. Proc. Natl. Acad. Sci. USA 2016, 113, 9204–9209. [Google Scholar] [CrossRef]
- Westerling Anthony LeRoy. Increasing western US forest wildfire activity: Sensitivity to changes in the timing of spring. Phil. Trans. R. Soc. B. 2016, 371, 20150178. [Google Scholar] [CrossRef]
- Abatzoglou, J.T.; Williams, A.P. Impact of anthropogenic climate change on wildfire across western US forests. Proc. Natl. Acad. Sci. USA 2016, 113, 11770–11775. [Google Scholar] [CrossRef] [PubMed]
- Elia, M.; D’Este, M.; Ascoli, D.; Giannico, V.; Spano, G.; Ganga, A.; Colangelo, G.; Lafortezza, R.; Sanesi, G. Estimating the probability of wildfire occurrence in Mediterranean landscapes using Artificial Neural Networks. Environ. Impact Assess. Rev. 2020, 85, 106474. [Google Scholar] [CrossRef]
- Müller, M.M.; Vilà-Vilardell, L.; Vacik, H. Towards an integrated forest fire danger assessment system for the European Alps. Ecol. Inform. 2020, 60, 101151. [Google Scholar] [CrossRef]
- Calheiros, T.; Pereira, M.; Nunes, J. Assessing impacts of future climate change on extreme fire weather and pyro-regions in Iberian Peninsula. Sci. Total. Environ. 2021, 754, 142233. [Google Scholar] [CrossRef]
- Miller, C.; Ager, A.A. A review of recent advances in risk analysis for wildfire management. Int. J. Wildland Fire 2013, 22, 1–14. [Google Scholar] [CrossRef]
- Emmons, H.W. Heat Transfer in Fire. J. Heat Transf. 1973, 95, 145–151. [Google Scholar] [CrossRef]
- Osvald, A. Požiarnotechnické Vlastností Dreva a Materiálov na Báze Dreva; Vedecké štúdie 8/97/A; Technickej univerzity vo Zvolene: Zvolen, Mexico, (In Slovakia). 1997. [Google Scholar]
- Roy, P.S. Forest fire and degradation assessment using satellite remote sensing and Geographic Information System. In Satellite Remote Sensing and GIS Applications in Agricultural Meteorology, Proceedings of a Training Workshop, 7–11 July 2003, Dehra Dun, India; Sivakumar, M.V.K., Roy, P.S., Harmsen, K., Saha, S.K., Eds.; World Meteorological Organisation: Geneva, Switzerland, 2003; pp. 361–400. [Google Scholar]
- Zachar, M. Vplyv Ohrevu na Termickú Degradáciu Vybraných Druhov Dreva. [The Effect of Heating on the Thermal Degradation of Selected Types of Wood.]; Technická univerzita vo Zvolene: Zvolen, Czech Republic, 2009. (In Slovaka) [Google Scholar]
- Thomas, P.A.; McAlpine, R.S.; Hirsch, K.; Hobson, P. Fire in the Forest; Cambridge University Press (CUP): Cambridge, UK, 2010; ISBN 9780511780189. [Google Scholar] [CrossRef]
- Moritz, M.A.; Parisien, M.-A.; Batllori, E.; Krawchuk, M.A.; Van Dorn, J.; Ganz, D.J.; Hayhoe, K. Climate change and disruptions to global fire activity. Ecosphere 2012, 3, 1–22. [Google Scholar] [CrossRef]
- Martínez, J.; Vega-Garcia, C.; Chuvieco, E. Human-caused wildfire risk rating for prevention planning in Spain. J. Environ. Manag. 2009, 90, 1241–1252. [Google Scholar] [CrossRef]
- Grissino-Mayer, H.D.; Romme, W.H.; Floyd, M.L.; Hanna, D.D. Climatic and human influences on fire regimes of the southern san juan mountains, Colorado, USA. Ecology 2004, 85, 1708–1724. [Google Scholar] [CrossRef]
- Mollicone, D.; Eva, H.D.; Achard, F. Human role in Russian wild fires. Nature 2006, 440, 436–437. [Google Scholar] [CrossRef] [PubMed]
- Müller, M.M.; Vacik, H. Characteristics of lightnings igniting forest fires in Austria. Agric. For. Meteorol. 2017, 240–241, 26–34. [Google Scholar] [CrossRef]
- Wotton, B.M.; Martell, D.L.; Logan, K.A. Climate Change and People-Caused Forest Fire Occurrence in Ontario. Clim. Chang. 2003, 60, 275–295. [Google Scholar] [CrossRef]
- Clark, J.S.; Merkt, J.; Muller, H. Post-Glacial Fire, Vegetation, and Human History on the Northern Alpine Forelands, South-Western Germany. J. Ecol. 1989, 77, 897. [Google Scholar] [CrossRef]
- Ellenberg, H. Vegetation Mitteleuropa Smit den Alpen in Okologischer, Dynamischer und Historischer Sicht; Ulmer: Stuttgart, Germany, 1996. (In German) [Google Scholar]
- Tinner, W.; Conedera, M.; Ammann, B.; Lotter, A.F. Fire ecology north and south of the Alps since the last ice age. Holocene 2005, 15, 1214–1226. [Google Scholar] [CrossRef]
- Niklasson, M.; Zin, E.; Zielonka, T.; Feijen, M.; Korczyk, A.F.; Churski, M.; Samojlik, T.; Jędrzejewska, B.; Gutowski, J.M.; Brzeziecki, B. A 350-year tree-ring fire record from Białowieża Primeval Forest, Poland: Implications for Central European lowland fire history. J. Ecol. 2010, 98, 1319–1329. [Google Scholar] [CrossRef]
- Donis, J.; Kitenberga, M.; Snepsts, G.; Matisons, R.; Zarins, J.; Jansons, A. The forest fire regime in Latvia during 1922–2014. Silva Fenn. 2017, 51, 7746. [Google Scholar] [CrossRef]
- Rodrigues, M.; Jiménez-Ruano, A.; de la Riva, J. Fire regime dynamics in mainland Spain. Part 1: Drivers of change. Sci. Total. Environ. 2020, 721, 135841. [Google Scholar] [CrossRef]
- Martell, D.L.; Otukol, S.; Stocks, B.J. A logistic model for predicting daily people-caused forest fire occurrence in Ontario. Can. J. For. Res. 1987, 17, 394–401. [Google Scholar] [CrossRef]
- Garcia, C.; Woodard, P.; Titus, S.; Adamowicz, W.; Lee, B. A Logit Model for Predicting the Daily Occurrence of Human Caused Forest-Fires. Int. J. Wildland Fire 1995, 5, 101–111. [Google Scholar] [CrossRef]
- A Parks, S.; Holsinger, L.M.; Panunto, M.H.; Jolly, W.M.; Dobrowski, S.Z.; Dillon, G.K. High-severity fire: Evaluating its key drivers and mapping its probability across western US forests. Environ. Res. Lett. 2018, 13, 44037. [Google Scholar] [CrossRef]
- Vasilakos, C.; Kalabokidis, K.; Hatzopoulos, J.; Kallos, G.; Matsinos, Y. Integrating new methods and tools in fire danger rating. Int. J. Wildland Fire 2007, 16, 306–316. [Google Scholar] [CrossRef]
- Mozny, M.; Trnka, M.; Brázdil, R. Climate change driven changes of vegetation fires in the Czech Republic. Theor. Appl. Clim. 2021, 143, 691–699. [Google Scholar] [CrossRef]
- Trnka, M.; Možný, M.; Jurečka, F.; Balek, J.; Semerádová, D.; Hlavinka, P.; Štěpánek, P.; Farda, A.; Skalák, P.; Cienciala, E.; et al. Observed and estimated consequences of climate change for the fire weather regime in the moist-temperate climate of the Czech Republic. Agric. For. Meteorol. 2021, 310, 108583. [Google Scholar] [CrossRef]
- Hlásny, T.; Zimová, S.; Merganičová, K.; Štěpánek, P.; Modlinger, R.; Turčáni, M. Devastating outbreak of bark beetles in the Czech Republic: Drivers, impacts, and management implications. For. Ecol. Manag. 2021, 490, 119075. [Google Scholar] [CrossRef]
- Hicke, J.A.; Johnson, M.C.; Hayes, J.L.; Preisler, H.K. Effects of bark beetle-caused tree mortality on wildfire. For. Ecol. Manag. 2012, 271, 81–90. [Google Scholar] [CrossRef]
- Hart, S.J.; Veblen, T.T.; Mietkiewicz, N.; Kulakowski, D. Negative Feedbacks on Bark Beetle Outbreaks: Widespread and Severe Spruce Beetle Infestation Restricts Subsequent Infestation. PLoS ONE 2015, 10, e0127975. [Google Scholar] [CrossRef] [PubMed]
- Sjöström, J.; Plathner, F.V.; Granström, A. Wildfire ignition from forestry machines in boreal Sweden. Int. J. Wildland Fire 2019, 28, 666–677. [Google Scholar] [CrossRef]
- Trnka, M.; Balek, J.; Možný, M.; Cienciala, E.; Čermák, P.; Semerádová, D.; Jurečka, F.; Hlavinka, P.; Štěpánek, P.; Farda, A.; et al. Observed and expected changes in wildfire-conducive weather and fire events in peri-urban zones and key nature reserves of the Czech Republic. Clim. Res. 2020, 82, 33–54. [Google Scholar] [CrossRef]
- Tolasz, R.; Míková, T.; Valeriánová, A.; Voženílek, V. Atlas Podnebí Česka [Climate Atlas of Czechia]; Palacky Univerzity and Czech Hydrometeorogical Institute: Olomouc, Czech, 2007. (In Czech) [Google Scholar]
- Pokorná, A.; Štrombachová, V.; Mužík, J.; Dolanová, D.; Búřilová, P.; Pospíšil, M.; Kučerová, J.; Gregor, J.; Komenda, M.; Dušek, L. Národní Portál Systém Hlášení Nežádoucích Událostí; Ústav Zdravotnických Informací ČR: Praha, Czech, 2016; Available online: https://shnu.uzis.cz/ (accessed on 20 December 2019). (In Czech)
- Chytrý, M. Vegetation of the Czech Republic: Diversity, ecology, history and dynamics. Preslia 2012, 84, 427–504. [Google Scholar]
- Ministry of Agriculture of the Czech Republic. Information on Forests and Forestry in the Czech Republic by 2020; Ministry of Agriculture of the Czech Republic: Prague, Czech, 2021.
- Ministry of Interior of the Czech Republic. Database of Forest Fires 2006–2015; General Directorate of the Fire Rescue Service of the Czech Republic, Ministry of Interior of the Czech Republic: Prague, Czech, 2019.
- Berčák, R.; Holuša, J.; Lukášová, K.; Hanuška, Z.; Agh, P.; Vaněk, J.; Kula, E.; Chromek, I. Forest fires in the Czech Republic—Characteristics, Prevention and Firefighting: Review. Zprávy Lesn. Výzkumu. 2018, 63, 184–194. Available online: https://www.vulhm.cz/files/uploads/2019/02/533.pdf (accessed on 1 July 2018). (In Czech).
- Holuša, J.; Berčák, R.; Lukášová, K.; Hanuška, Z.; Agh, P.; Vaněk, J.; Kula, E.; Chromek, I. Forest fires in the Czech Republic—Definition and classification: Review. Zprávy Lesn. Výzkumu. 2018, 63, 20–27. (In Czech) [Google Scholar]
- State Administration of Land Surveying and Cadastre. Czech Geodetic and Cadastral Office. 2019. Available online: https://www.cuzk.cz/en (accessed on 20 December 2021).
- Flannigan, M.D.; Logan, K.A.; Amiro, B.D.; Skinner, W.R.; Stocks, B.J. Future Area Burned in Canada. Clim. Chang. 2005, 72, 1–16. [Google Scholar] [CrossRef]
- Aldersley, A.; Murray, S.J.; Cornell, S.E. Global and regional analysis of climate and human drivers of wildfire. Sci. Total. Environ. 2011, 409, 3472–3481. [Google Scholar] [CrossRef] [PubMed]
- Zumbrunnen, T.; Menéndez, P.; Bugmann, H.; Conedera, M.; Gimmi, U.; Bürgi, M. Human impacts on fire occurrence: A case study of hundred years of forest fires in a dry alpine valley in Switzerland. Reg. Environ. Chang. 2012, 12, 935–949. [Google Scholar] [CrossRef]
- Vacchiano, G.; Foderi, C.; Berretti, R.; Marchi, E.; Motta, R. Modeling anthropogenic and natural fire ignitions in an inner-alpine valley. Nat. Hazards Earth Syst. Sci. 2018, 18, 935–948. [Google Scholar] [CrossRef]
- Dupire, S.; Curt, T.; Bigot, S.; Fréjaville, T. Vulnerability of forest ecosystems to fire in the French Alps. Eur. J. For. Res. 2019, 138, 813–830. [Google Scholar] [CrossRef]
- Ubysz, B.; Valette, J.-C. Flammability: Influence of fuel on fire. In Towards Integrated Fire Management—Outcomes of the European Project Fire Paradox; Silva, J.S., Rego, F., Fernandes, P., Rigolot, E., Eds.; European Forest Institute: Joensuu, Finland, 2010; pp. 23–34. [Google Scholar]
- Lecomte, N.; Simard, M.; Bergeron, Y.; Larouche, A.; Asnong, H.; Richard, P.J. Effects of fire severity and initial tree composition on understorey vegetation dynamics in a boreal landscape inferred from chronosequence and paleoecological data. J. Veg. Sci. 2005, 16, 665–674. [Google Scholar] [CrossRef]
- Ganteaume, A.; Barbero, R.; Jappiot, M.; Maillé, E. Understanding future changes to fires in southern Europe and their impacts on the wildland-urban interface. J. Saf. Sci. Resil. 2021, 2, 20–29. [Google Scholar] [CrossRef]
- European Environment Agency. Indicator Assessment: Forest Fires. 2018. Available online: https://www.eea.europa.eu/data-and-maps/indicators/forest-fire-danger-2/assessment (accessed on 1 April 2019).
- Wood, S.N. Generalized Additive Models; Chapman and Hall/CRC: Boca Raton, FL, USA, 2017. [Google Scholar] [CrossRef]
- Wood, S.N. Stable and Efficient Multiple Smoothing Parameter Estimation for Generalized Additive Models. J. Am. Stat. Assoc. 2004, 99, 673–686. [Google Scholar] [CrossRef]
- R Core Team. R: A Language and Environment for Statistical Computing; R Foundation for Statistical Computing: Vienna, Austria, 2021; Available online: https://www.R-project.org/ (accessed on 23 May 2022).
- Silva, P.; Carmo, M.; Rio, J.; Novo, I. Changes in the seasonality of fire activity and fire weather in Portugal: Is the wildfire season really longer? Meteorology 2023, 2, 74–86. [Google Scholar] [CrossRef]
- Unal, Y.S.; Tan, E.; Mentes, S.S. Summer heat waves over western Turkey between 1965 and 2006. Theor. Appl. Clim. 2013, 112, 339–350. [Google Scholar] [CrossRef]
- Vasić, M. Wildfires; University of Belgrade, Faculty of Forestry: Belgrade, Serbia, 1992. [Google Scholar]
- Ubysz, B.; Szczygiel, R.; Kwitkowski, M.; Piwnicki, J. Intrukcja Ochrony Przeciwpozarowej Lasu; Panstwowe Gospodarstwo Lesne, Lasy Panstwowe: Warsa, Poland, 2012. (In Polish) [Google Scholar]
- Engelmark, O. Early post-fire tree regeneration in a Picea-Vaccinium forest in northern Sweden. J. Veg. Sci. 1993, 4, 791–794. [Google Scholar] [CrossRef]
- Pew, K.; Larsen, C. GIS analysis of spatial and temporal patterns of human-caused wildfires in the temperate rain forest of Vancouver Island, Canada. For. Ecol. Manag. 2001, 140, 1–18. [Google Scholar] [CrossRef]
- Koutsias, N.; Xanthopoulos, G.; Founda, D.; Xystrakis, F.; Nioti, F.; Pleniou, M.; Mallinis, G.; Arianoutsou, M. On the relationships between forest fires and weather conditions in Greece from long-term national observations (1894–2010). Int. J. Wildland Fire 2013, 22, 493–507. [Google Scholar] [CrossRef]
- Guo, F.; Su, Z.; Wang, G.; Sun, L.; Lin, F.; Liu, A. Wildfire ignition in the forests of southeast China: Identifying drivers and spatial distribution to predict wildfire likelihood. Appl. Geogr. 2016, 66, 12–21. [Google Scholar] [CrossRef]
- Flannigan, M.D.; Harrington, J.B. A Study of the Relation of Meteorological Variables to Monthly Provincial Area Burned by Wildfire in Canada (1953–80). J. Appl. Meteorol. 1988, 27, 441–452. [Google Scholar] [CrossRef]
- Flannigan, M.D.; Wotton, B.M.; Marshall, G.A.; de Groot, W.J.; Johnston, J.; Jurko, N.; Cantin, A.S. Fuel moisture sensitivity to temperature and precipitation: Climate change implications. Clim. Chang. 2016, 134, 59–71. [Google Scholar] [CrossRef]
- Díaz-Delgado, R.; Lloret, F.; Pons, X. Spatial patterns of fire occurrence in Catalonia, NE, Spain. Landsc. Ecol. 2004, 19, 731–745. [Google Scholar] [CrossRef]
- Sturtevant, B.R.; Zollner, P.A.; Gustafson, E.J.; Cleland, D.T. Human influence on the abundance and connectivity of high-risk fuels in mixed forests of northern Wisconsin, USA. Landsc. Ecol. 2004, 19, 235–254. [Google Scholar] [CrossRef]
- Parisien, M.-A.; Parks, S.A.; Krawchuk, M.A.; Flannigan, M.D.; Bowman, L.M.; Moritz, M.A. Scale-dependent controls on the area burned in the boreal forest of Canada, 1980–2005. Ecol. Appl. 2011, 21, 789–805. [Google Scholar] [CrossRef] [PubMed]
- Ganteaume, A.; Camia, A.; Jappiot, M.; San-Miguel-Ayanz, J.; Long-Fournel, M.; Lampin, C. A Review of the Main Driving Factors of Forest Fire Ignition Over Europe. Environ. Manag. 2013, 51, 651–662. [Google Scholar] [CrossRef]
- Cardille, J.; Ventura, S.J. Environmental and social factors influencing wildfires in the upper Midwest, United States. Ecol. Appl. 2001, 11, 111–127. [Google Scholar] [CrossRef]
- Martínez-Fernández, J.; Chuvieco, E.; Koutsias, N. Modelling long-term fire occurrence factors in Spain by accounting for local variations with geographically weighted regression. Nat. Hazards Earth Syst. Sci. 2013, 13, 311–327. [Google Scholar] [CrossRef]
- Adámek, M.; Jankovská, Z.; Hadincová, V.; Kula, E.; Wild, J. Drivers of forest fire occurrence in the cultural landscape of Central Europe. Landsc. Ecol. 2018, 33, 2031–2045. [Google Scholar] [CrossRef]
- Jenerette, G.D.; E Anderson, K.; Cadenasso, M.L.; Fenn, M.; Franklin, J.; Goulden, M.L.; Larios, L.; Pincetl, S.; Regan, H.M.; Rey, S.J.; et al. An expanded framework for wildland–urban interfaces and their management. Front. Ecol. Environ. 2022, 20, 516–523. [Google Scholar] [CrossRef]
- Spyratos, V.; Bourgeron, P.S.; Ghil, M. Development at the wildland–urban interface and the mitigation of forest-fire risk. Proc. Natl. Acad. Sci. USA 2007, 104, 14272–14276. [Google Scholar] [CrossRef] [PubMed]
- Šodková, M.; Purwestri, R.C.; Riedl, M.; Jarský, V.; Hájek, M. Drivers and Frequency of Forest Visits: Results of a National Survey in the Czech Republic. Forests 2020, 11, 414. [Google Scholar] [CrossRef]
- Jarský, V.; Palátová, P.; Riedl, M.; Zahradník, D.; Rinn, R.; Hochmalová, M. Forest Attendance in the Times of COVID-19—A Case Study on the Example of the Czech Republic. Int. J. Environ. Res. Public Health 2022, 19, 2529. [Google Scholar] [CrossRef] [PubMed]
- Gao, L.; Wang, X.; Johnson, B.A.; Tian, Q.; Wang, Y.; Verrelst, J.; Mu, X.; Gu, X. Remote sensing algorithms for estimation of fractional vegetation cover using pure vegetation index values: A review. ISPRS J. Photogramm. Remote Sens. 2020, 159, 364–377. [Google Scholar] [CrossRef]
- Stahl, A.T.; Andrus, R.; Hicke, J.A.; Hudak, A.T.; Bright, B.C.; Meddens, A.J. Automated attribution of forest disturbance types from remote sensing data: A synthesis. Remote Sens. Environ. 2023, 285, 113416. [Google Scholar] [CrossRef]
- Carnicer, J.; Alegria, A.; Giannakopoulos, C.; Di Giuseppe, F.; Karali, A.; Koutsias, N.; Lionello, P.; Parrington, M.; Vitolo, C. Global warming is shifting the relationships between fire weather and realized fire-induced CO2 emissions in Europe. Sci. Rep. 2022, 12, 10365. [Google Scholar] [CrossRef] [PubMed]
- Balch, J.K.; Schoennagel, T.; Williams, A.P.; Abatzoglou, J.T.; Cattau, M.E.; Mietkiewicz, N.P.; Denis, L.A.S. Switching on the Big Burn of 2017. Fire 2018, 1, 17. [Google Scholar] [CrossRef]
- Dunn, C.J.; O’connor, C.D.; Abrams, J.; Thompson, M.P.; E Calkin, D.; Johnston, J.D.; Stratton, R.; Gilbertson-Day, J. Wildfire risk science facilitates adaptation of fire-prone social-ecological systems to the new fire reality. Environ. Res. Lett. 2020, 15, 025001. [Google Scholar] [CrossRef]


| Predictor Variable | Time Scale | ||
|---|---|---|---|
| Monthly | Summer Season | Annual | |
| Wildland–urban interface | 3.39 *** | 4.22 *** | 3.55 *** |
| Overnight tourists | n.s. | 3.03 *** | 1.0 *** |
| Population density | n.s. | n.s. | 2.558 ** |
| Conifer cover | 1.84 *** | 3.60 *** | 2.94 *** |
| Precipitation | 1.272 *** | n.s. | n.s. |
| Temperature | 3.7 *** | 3.202 *** | n.s. |
| Temperature × Precipitation | 11.28 *** | n.s. | n.s. |
| Deviation explained (%) | 48.7 | 53.9 | 71.4 |
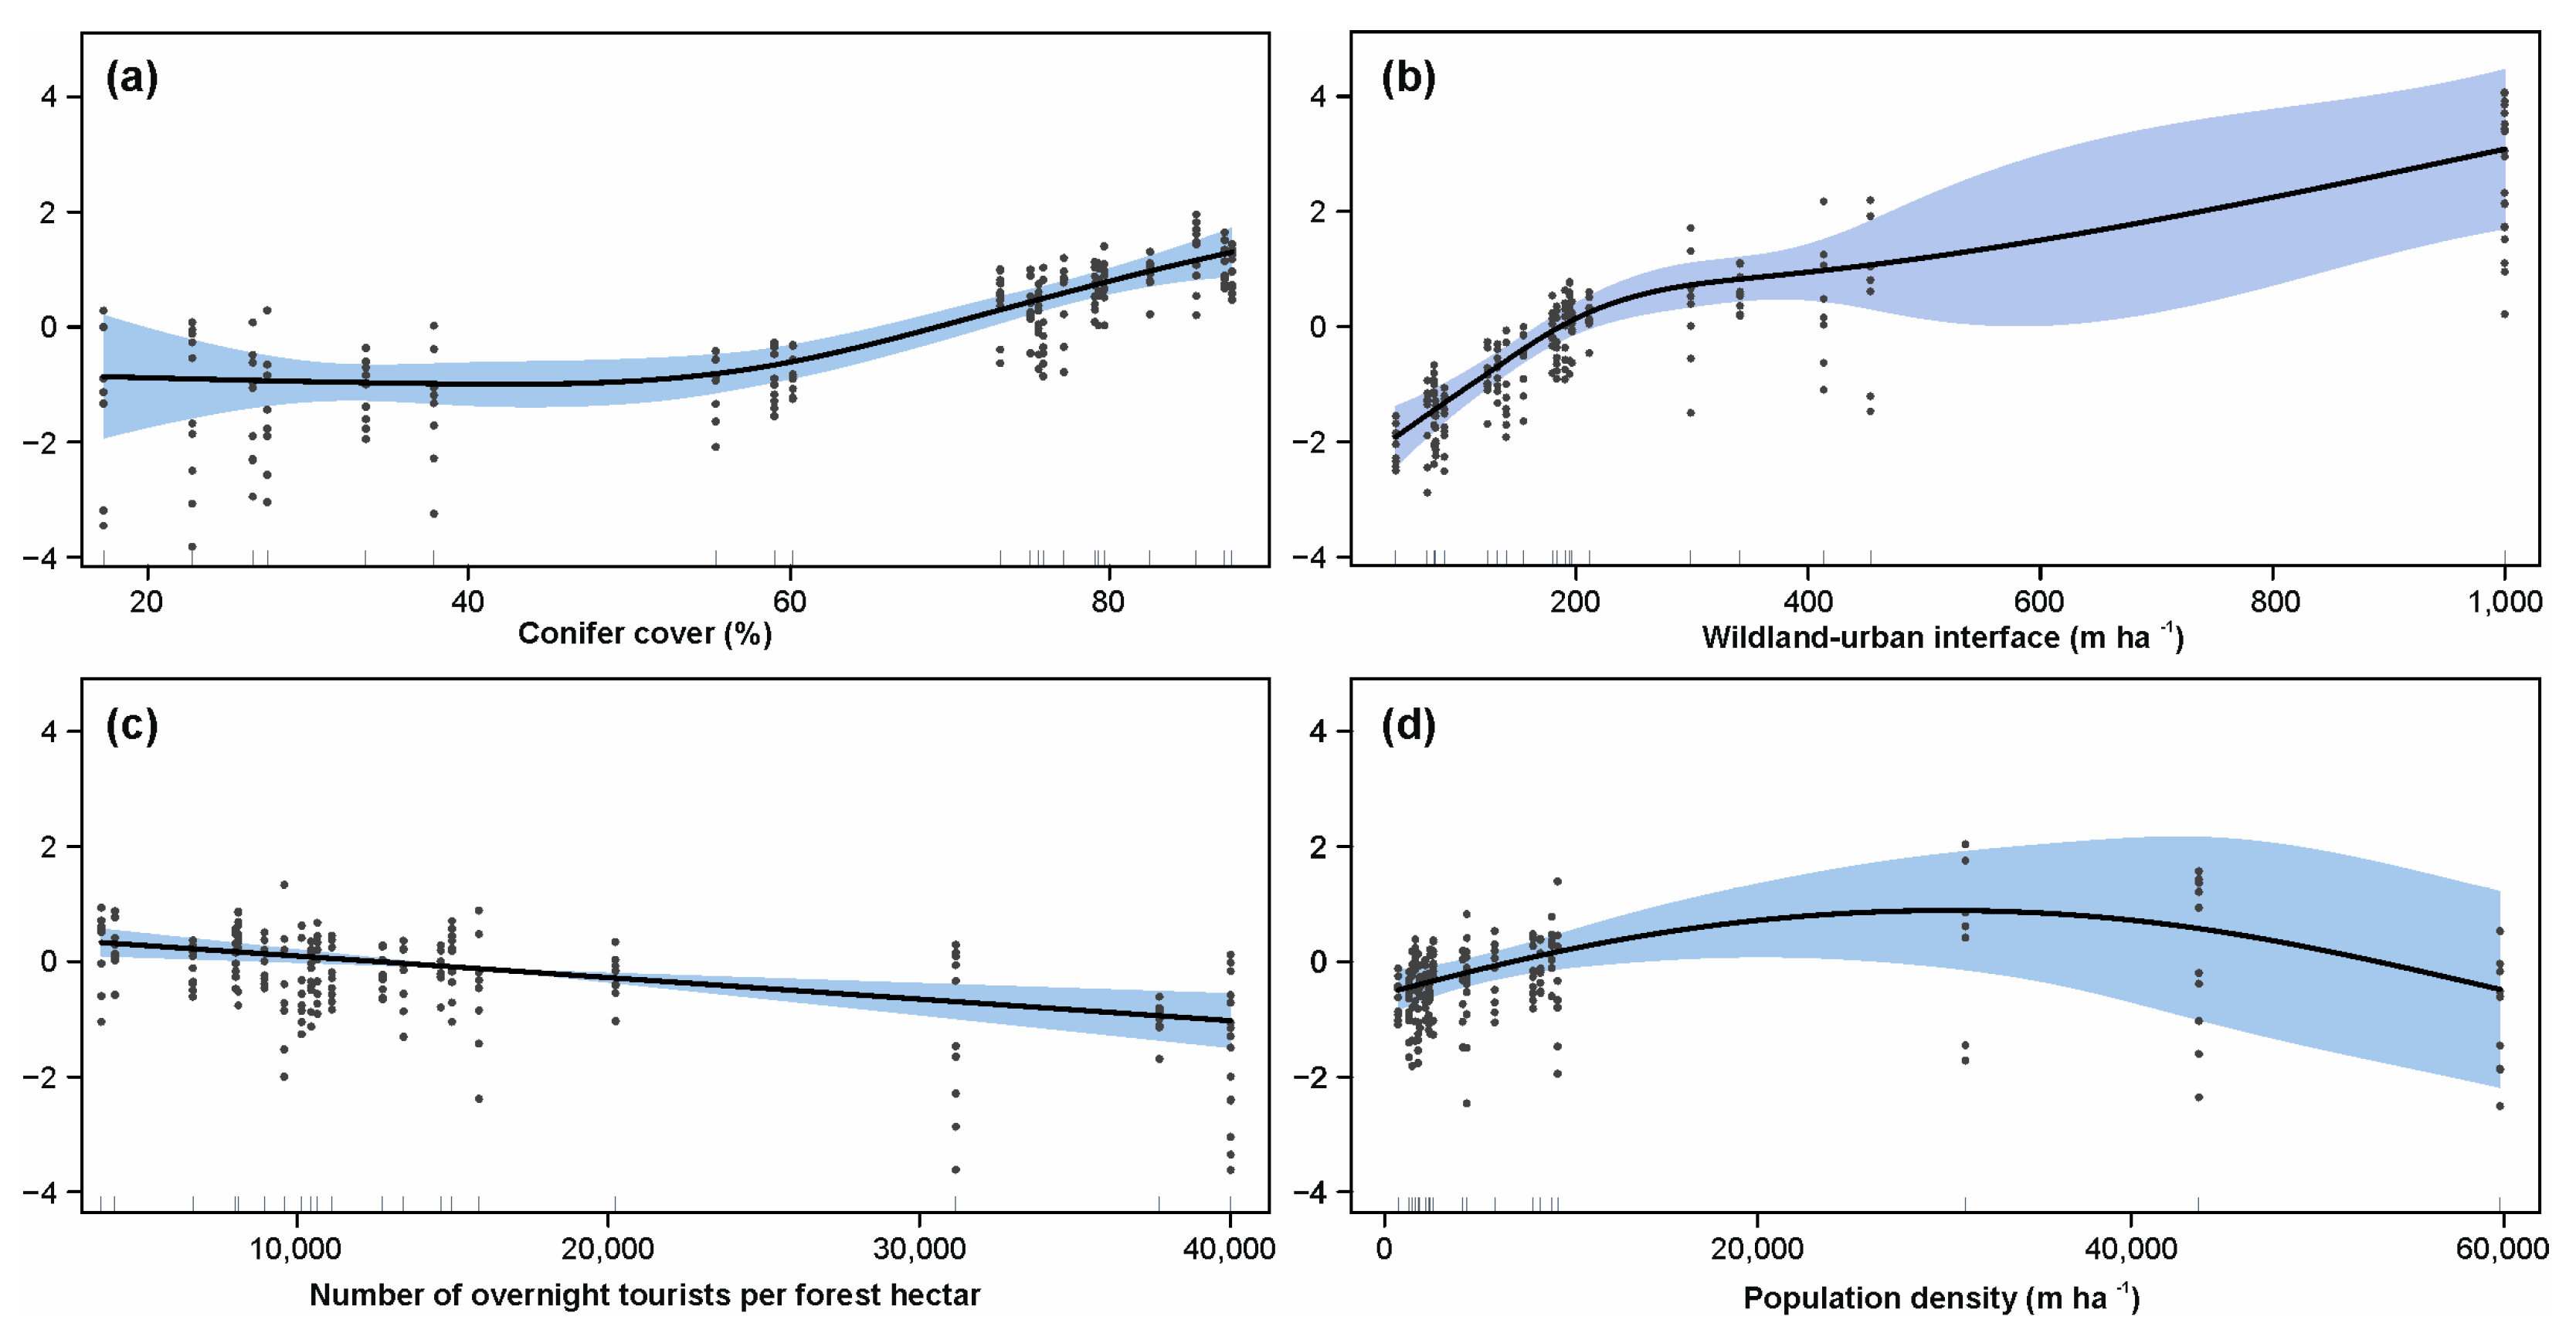
| Predictor Variable | Characteristic Trend per Time Scale | ||
|---|---|---|---|
| Monthly | Summer Season | Annual | |
| Wildland–urban interface (m ha−1) | Increasing, then constant (500) | Increasing | Increasing |
| Overnight tourists (n ha−1) | No trend | Unimodal response (25,000) | Decreasing |
| Population density (n ha−1) | No trend | No trend | Unimodal response (30,000) |
| Conifer cover (%) | Increasing | Constant, then increasing (60) | Constant, then increasing (60) |
| Precipitation (mm) | Decreasing | No trend | No trend |
| Temperature (°C) | Constant, then increasing (18) | Constant, then increasing (18) | No trend |
Disclaimer/Publisher’s Note: The statements, opinions and data contained in all publications are solely those of the individual author(s) and contributor(s) and not of MDPI and/or the editor(s). MDPI and/or the editor(s) disclaim responsibility for any injury to people or property resulting from any ideas, methods, instructions or products referred to in the content. |
© 2024 by the authors. Licensee MDPI, Basel, Switzerland. This article is an open access article distributed under the terms and conditions of the Creative Commons Attribution (CC BY) license (https://creativecommons.org/licenses/by/4.0/).
Share and Cite
Berčák, R.; Holuša, J.; Trombik, J.; Resnerová, K.; Hlásny, T. A Combination of Human Activity and Climate Drives Forest Fire Occurrence in Central Europe: The Case of the Czech Republic. Fire 2024, 7, 109. https://0-doi-org.brum.beds.ac.uk/10.3390/fire7040109
Berčák R, Holuša J, Trombik J, Resnerová K, Hlásny T. A Combination of Human Activity and Climate Drives Forest Fire Occurrence in Central Europe: The Case of the Czech Republic. Fire. 2024; 7(4):109. https://0-doi-org.brum.beds.ac.uk/10.3390/fire7040109
Chicago/Turabian StyleBerčák, Roman, Jaroslav Holuša, Jiří Trombik, Karolina Resnerová, and Tomáš Hlásny. 2024. "A Combination of Human Activity and Climate Drives Forest Fire Occurrence in Central Europe: The Case of the Czech Republic" Fire 7, no. 4: 109. https://0-doi-org.brum.beds.ac.uk/10.3390/fire7040109